abriefhistoryof researchsynthesis -...
TRANSCRIPT
Evaluation & the Health Professions / March 2002Chalmers et al. / A BRIEF HISTORY
Science is supposed to be cumulative, but sci-entists only rarely cumulate evidence scientif-ically. This means that users of research evi-dence have to cope with a plethora of reportsof individual studies with no systematicattempt made to present new results in thecontext of similar studies. Although the needto synthesize research evidence has been rec-ognized for well over two centuries, explicitmethods for this form of research were notdeveloped until the 20th century. The develop-ment of methods to reduce statistical impreci-sion using quantitative synthesis (meta-analy-sis) preceded the development of methods toreduce biases, the latter only beginning toreceive proper attention during the last quar-ter of the 20th century. In this article, theauthors identify some of the trends and high-lights in this history, to which researchers inthe physical, natural, and social sciences haveall contributed, and speculate briefly aboutthe “future history” of research synthesis.
A BRIEF HISTORY OFRESEARCH SYNTHESIS
IAIN CHALMERSU.K. Cochrane Centre
LARRY V. HEDGESUniversity of Chicago
HARRIS COOPERUniversity of Missouri
12
EVALUATION & THE HEALTH PROFESSIONS, Vol. 25 No. 1, March 2002 12-37© 2002 Sage Publications
AUTHORS’NOTE:This article is dedicatedto Frederick Mosteller and Thomas C.Chalmers, whose work has played such a keyrole in the recent history of research synthesis.We are grateful to Doug Altman, Gerd Antes,Bob Boruch, Mike Clarke, Gene Glass, TimHorder, Janneke Horn, Andrew Jull, BruceKupelnick, Steff Lewis, Alison Macfarlane,Harry Marks, Fred Mosteller, George DaveySmith, Mark Petticrew, Peter Sandercock, andthe editors for helpful comments on earlierdrafts of this article. Please address corre-spondence to Iain Chalmers, U.K. CochraneCentre, Summertown Pavilion, Middle Way,Oxford OX2 7LG, UK; telephone: +44 1865516300; fax: +44 1865 516311; e-mail:[email protected].
at Durham University on March 8, 2016ehp.sagepub.comDownloaded from

If, as is sometimes supposed, science consisted in nothing but the labo-rious accumulation of facts, it would soon come to a standstill, crushed,as it were, under its own weight. The suggestion of a new idea, or thedetection of a law, supersedes much that has previously been a burdenon the memory, and by introducing order and coherence facilitates theretention of the remainder in an available form. . . . Two processes arethus at work side by side, the reception of new material and the diges-tion and assimilation of the old; and as both are essential we may spareourselves the discussion of their relative importance. One remark,however, should be made. The work which deserves, but I am afraiddoes not always receive, the most credit is that in which discovery andexplanation go hand in hand, in which not only are new facts presented,but their relation to old ones is pointed out. (Rayleigh, 1885, p. 20)
So said the professor of physics at Cambridge University in hispresidential address to the 54th meeting of the British Association forthe Advancement of Science held in Montreal in 1884. More than acentury later, research funding agencies, research ethics committees,researchers, and journal editors in most fields of scientific investiga-tion have not taken his injunction seriously. It is true that there havebeen some improvements recently in the scientific quality of“stand-alone” reviews. When assessing the relation between “newfacts” and “old facts” in the Discussion sections of reports of newresearch, however, scientists very rarely use methods designed toreduce the likelihood that they and their readers will be misled bybiases and the play of chance (Clarke & Chalmers, 1998).
SOME EARLY EXAMPLES OF RECOGNITIONOF THE NEED FOR RESEARCH SYNTHESIS
Efforts to reduce the likelihood of being misled by biases andchance in research synthesis have quite a long history (Cooper &Hedges, 1994; Hedges, 1987a; Hunt, 1997). In the 18th century, forexample, James Lind, a Scottish naval surgeon, was confronted with aplethora of reports about the prevention and treatment of scurvy. Thetitle page of his famous treatise on the disease declares that it contains“An inquiry into the Nature, Causes, and Cure, of that Disease.Together with a Critical and Chronological View of what has been
Chalmers et al. / A BRIEF HISTORY 13
at Durham University on March 8, 2016ehp.sagepub.comDownloaded from

published on the subject [italics added].” Lind (as cited in Hampton,1998) observed in his text,
As it is no easy matter to root out prejudices . . . it became requisite toexhibit a full and impartial view of what had hitherto been published onthe scurvy, and that in a chronological order, by which the sources ofthese mistakes may be detected. Indeed, before the subject could be setin a clear and proper light, it was necessary to remove a great deal ofrubbish. (p. x).
A couple of decades later, Arthur Young, a gentleman farmer whoplayed a pioneering role in the development of sample surveys, notedthat “it is impossible from single experiments, or from a great number,in different lands, separately considered, to deduce a satisfactoryproof of the superiority of any method” (as cited in Brunt, 2001, p. 181).
In the early 19th century, the French statistician Legendre devel-oped the method of least squares to solve the problem of combiningdata from different astronomical observatories where the errors wereknown to be different (Stigler, 1986), and by the end of the century,some impressive examples of application of the principles of researchsynthesis had begun to appear. In 1891, for instance, Herbert Nicholspublished a 76-page review of theories and experiments on the psy-chology of time.
It was not really until the 20th century, however, that the science ofresearch synthesis as we know it today began to emerge. In 1904, KarlPearson, director of the Biometric Laboratory at University CollegeLondon, published a key paper in theBritishMedical Journal. Havingbeen asked to review evidence on the effects of a vaccine againsttyphoid, Pearson gathered data from 11 relevant studies of immunityand mortality among soldiers serving in various parts of the BritishEmpire. He calculated correlation coefficients for each of the 11 stud-ies (noting that these were very variable and discussing how this varia-tion might be explained) and then synthesized the coefficients withintwo subgroups, thus producing average correlations (Table 1).
Three years later, Joseph Goldberger (as cited in Winkelstein,1998), who was working in the laboratory that later became theNational Institutes of Health, published an analysis of statistics onbacteriuria in typhoid fever in the District of Columbia. WarrenWinkelstein (1998) noted how Goldberger’s analysis addressed manyof the criteria that research syntheses are now expected to satisfy:
14 Evaluation & the Health Professions / March 2002
at Durham University on March 8, 2016ehp.sagepub.comDownloaded from

First, a review of the literature identifies pertinent studies. Goldbergeridentified 44 studies and provided comprehensive references in a bibli-ography. Second, specific criteria are used to select studies for analysis.Goldberger used a newly developed serum agglutination test to sepa-rate reliable studies from those he considered unreliable. Third, datafrom the selected studies are abstracted. Goldberger tabulated the rawdata from 26 selected studies. Fourth, statistical analysis of the ab-stracted data is implemented. Goldberger calculated the mean rate ofbacteriuria from the pooled data. (p. 717)
Goldberger’s attention to each of these steps is an early exemplar ofthe need to distinguish these two distinct methodological challengesin research synthesis—first, to take measures to reduce bias, then toconsider whether meta-analysis can be used to reduce statisticalimprecision.
There are other examples of approaches to research synthesis dur-ing the first half of the 20th century. In 1916, for example, Thorndikeand Ruger derived average results from two experiments comparingthe effects of outside air and recirculated air in classrooms on chil-dren’s ability to add, check numbers and letters, and to find and copyaddresses. In 1933, Peters presented a summary of more than 180experiments on the effects of “character education” on schoolchildrenin Pennsylvania. And during the 1930s, research synthesis also beganin physics (Birge, 1932) and agriculture (Yates & Cochran, 1938).
Chalmers et al. / A BRIEF HISTORY 15
TABLE 1Inoculation Against Enteric Fever
Correlation Between Immunity and Inoculation
I. Hospital staffs +0.373 ±0.021II. Ladysmith garrison +0.445 ±0.017III. Methuen’s column +0.191 ±0.026IV. Single regiments +0.021 ±0.033V. Army in India +0.100 ±0.013
Mean value +0.226
Correlation Between Mortality and Inoculation
VI. Hospital staffs +0.307 ±0.128VII. Ladysmith garrison –0.010 ±0.081VIII. Methuen’s column +0.300 ±0.093IX. Single regiments +0.119 ±0.022X. Various military hospitals +0.194 ±0.022XI. Army in India +0.248 ±0.050
Mean value +0.226
at Durham University on March 8, 2016ehp.sagepub.comDownloaded from
A NOTE ON TERMINOLOGY
A variety of terms have been used to describe all or some of the pro-cesses to which we have alluded—particularly research synthesis,systematic review, and meta-analysis.
Our reason for using the term research synthesis is primarilybecause the term has been used extensively by the social scientistswho led the development of the science and practice of this kind ofresearch over the post–World War II period.
We might have chosen systematic review as an alternative term.There are certainly instances of use of the term systematic review ear-lier than research synthesis (Mandel, 1936), but it is uncertain whetheruse of the former during the pre–World War II period reflected thevery structured process that we understand by the term today.Although it was used in the 1970s (Shaikh, Vayda, & Feldman, 1976),it was not until the late 1990s that the term systematic review becamemore widely used. This probably reflected two factors in particular.First, it was the term used by Cochrane (1989) in his foreword to acompilation of research syntheses relating to many aspects of careduring pregnancy and childbirth published during the late 1980s(I. Chalmers, Enkin, & Keirse, 1989). The term was subsequently pro-moted by people concerned to draw a distinction between a processinvolving measures to control biases in research synthesis and theoptional element of that process involving quantitative, statistical pro-cedures, for which they suggested reserving the term meta-analysis(I. Chalmers & Altman, 1995; Egger, Smith, & Altman, 2001).
Glass introduced the term meta-analysis in 1976 in a presidentialaddress stressing the need for better synthesis of research results.Those who liked neologisms adopted it rapidly, and it was used in thetitles of some of the earliest substantive texts on statistical methods forquantitative synthesis (Hedges & Olkin, 1985). It became graduallyclear, however, that the word was being used in a variety of ways andthat it was intensely antigenic to some people, particularly those whochallenged the use of quantitative synthesis to reduce statistical impre-cision. Thus, Eysenck (1978) referred to “mega-silliness,” Shapiro(1994) to “shmeta-analysis,” and Feinstein (1995) to “statisticalalchemy for the 21st century.” These critics and others showed noappreciation of the need to adopt methods to reduce bias in reviews ofresearch—regardless of whether statistical synthesis could be used to
16 Evaluation & the Health Professions / March 2002
at Durham University on March 8, 2016ehp.sagepub.comDownloaded from

reduce statistical imprecision. Restricting the term meta-analysis tothe process of statistical synthesis seemed a way of helping peopleunderstand that the science of research synthesis comprises a varietyof methods addressing a variety of challenges.
This convention has now been adopted in some quarters. For exam-ple, the second edition of the publication Systematic Reviews is subti-tledMeta-Analysis inContext (Egger, Davey Smith, & Altman, 2001),and the fourth edition of Last’s (2001) Dictionary of Epidemiologygives definitions as follows:
SYSTEMATIC REVIEW The application of strategies that limit biasin the assembly, critical appraisal, and synthesis of all relevant studieson a specific topic. Meta-analysis may be, but is not necessarily, usedas part of this process. (pp. 176-177)
META-ANALYSIS The statistical synthesis of the data from separatebut similar, i.e. comparable studies, leading to a quantitative summaryof the pooled results. (p. 114)
A definition of our chosen term—research synthesis—will have toawait publication of the fifth edition of the dictionary!
REDUCING STATISTICAL IMPRECISION INRESEARCH SYNTHESIS (META-ANALYSIS)
The development of methods for reducing statistical imprecision inresearch synthesis (meta-analysis) antedated the development ofmethods for controlling biases. Most statistical techniques used todayin meta-analysis have their origins in Gauss’s and Laplace’s work(Egger, Smith, & O’Rourke, 2001), which was disseminated in a“textbook” on “meta-analysis” for astronomers published in 1861 bythe British Astronomer Royal (Airy, 1861). Karl Pearson’s (1904) useof statistical methods for research synthesis (see earlier discussion) atthe beginning of the following century is an early example of the useof these techniques in medical research. A statistical paper published afew years later by the physiologists Rietz and Mitchell (1910-1911)considered what kind of information a series of experiments canproduce.
Several statisticians working in agricultural research in Britain inthe 1930s developed and applied these approaches in that field
Chalmers et al. / A BRIEF HISTORY 17
at Durham University on March 8, 2016ehp.sagepub.comDownloaded from

(Cochran, 1937; Fisher, 1932; Pearson, 1933; Tippett, 1931; Yates &Cochran, 1938). In particular, Ronald Fisher (1932), in his classic textStatisticalMethods for ResearchWorkers, noted that “although few or[no statistical tests] can be claimed individually as significant, yet theaggregate gives an impression that the probabilities are lower thanwould have been obtained by chance” (p. 99).
Fisher (1932) then presented a technique for combining the p val-ues that came from independent tests of the same hypothesis. Interestin research synthesis among statisticians continued through the Sec-ond World War, and Fisher’s work was followed by more than a dozenpapers published on the topic prior to 1960 (see, e.g., Cochran, 1954;Jones & Fiske, 1953; Mosteller & Bush, 1954).
These statistical procedures for combining results of independentstudies were not widely used until the 1960s, when social scienceresearch began to experience a period of rapid growth. By themid-1970s, social scientist reviewers in the United States found them-selves having to deal with, for example, 345 studies of the effects ofinterpersonal expectations on behavior (Rosenthal & Rubin, 1978),725 estimates of the relation between class size and academic achieve-ment (G. Glass & Smith, 1979), 833 tests of the effectiveness of psy-chotherapy (M. Smith & Glass, 1977), and 866 comparisons of the dif-ferential validity of employment tests for Black and White workers(Hunter, Schmidt, & Hunter, 1979). Largely independently, theresearch teams addressing these issues rediscovered and reinventedPearson’s and Fisher’s solutions to the problem they faced. In discuss-ing his solution, Gene Glass (1976) coined the term meta-analysis torefer to “the statistical analysis of a large collection of analysis resultsfrom individual studies for purposes of integrating the findings” (p. 3).By the middle of the following decade, Rosenthal (1984) had pre-sented a compendium of meta-analytic methods.
The publication of Statistical Methods for Meta-Analysis byHedges and Olkin in 1985, a key methods paper by Richard Peto andhis colleagues published the same year (Yusuf, Peto, Lewis, Collins,& Sleight, 1985), and the proceedings of a meeting convened by theU.S. National Heart, Lung and Blood Institute and the National Can-cer Institute published as a special issue of Statistics in Medicine in1987 all helped to secure recognition of the practice of quantitativesynthesis of research among statisticians.
18 Evaluation & the Health Professions / March 2002
at Durham University on March 8, 2016ehp.sagepub.comDownloaded from

REDUCING BIASES IN RESEARCH SYNTHESIS
The development and adoption of methods to reduce biases inresearch synthesis has tended to lag behind the development of meth-ods to reduce statistical imprecision. With the massive increase in thescale of scientific research after the Second World War, people work-ing in a wide variety of fields began to recognize a need to organizeand evaluate the accumulating bodies of research evidence (see e.g.,Chase, Sutton, & First, 1959; Greenhouse, 1958; Herring, 1968; Lide,1981; Lide & Rossmassler, 1973; Schoolman, 1982). It soon becameclear that research synthesis threw up a far more complex range ofmethodological issues than simply the choice of methods for statisti-cal synthesis. In many of the physical sciences, for example, researchsynthesis became referred to as “critical evaluation,” with a substan-tial emphasis on discovering biases in the individual experimentsthemselves and developing sets of values of related physical proper-ties that were as consistent and free from bias as possible (seeRosenfeld, 1975; Touloukian, 1975; Zwolinski & Chao, 1972).
The challenge was spelled out well by an American social scientist,David Pillemer (1984), who characterized the usual approach toreviews as
subjective, relying on idiosyncratic judgments about such key issues aswhich studies to include and how to draw overall conclusions. Studiesare considered one at a time, with strengths and weaknesses selectivelyidentified and casually discussed. Since the process is informal, it is notsurprising that different reviewers often draw very different conclu-sions from the same set of studies. (p. 28)
With a growth of acknowledgment that methodological rigor isneeded to secure the validity of research reviews, just as it is for pri-mary research (Cooper, 1982; Jackson, 1980), there was increasedappreciation of the range of methods required to prepare unbiasedsyntheses of research. Social scientists in the United States led theway in this respect. They recognized, for example, that the methodsused to select evidence for inclusion in reviews were potentially majorsources of bias, particularly as methodological research began toreveal that researchers were more likely to report studies that hadyielded “positive” (statistically significant) results. A study of reportspublished in a sample of psychology journals published in the late
Chalmers et al. / A BRIEF HISTORY 19
at Durham University on March 8, 2016ehp.sagepub.comDownloaded from

1950s revealed that a very high proportion reported statistically signif-icant results (Sterling, 1959). Investigations of the magnitude of theresulting publication biases made it clear that efforts to control biasesin research synthesis would need to address these (Hedges, 1984;Rosenthal, 1979).
With some isolated exceptions (Beecher, 1955; Greenhouse,1958), people working in health research were relative latecomers toresearch synthesis. In 1972, Cochrane drew attention to the adverseconsequences for the British National Health Service of collectiveignorance about the effects of many elements of health care, and in anessay published in 1979, he observed that “it is surely a great criticismof our profession that we have not organised a critical summary, byspeciality or subspeciality, adapted periodically, of all relevant ran-domised controlled trials” (p. 8).
Cochrane’s emphasis on randomized controlled trials was relevantto one element of an issue that had emerged among social scientists,namely, which criteria to use for judging when studies could beregarded as sufficiently unbiased for inclusion in research syntheses.
A few “critical summaries of randomized trials” in health care weredone during the 1970s (Andrews, Guitar, & Howie, 1980; “AspirinAfter Myocardial Infarction,” 1980; I. Chalmers, 1979; T. Chalmers,Matta, Smith, & Kunzler, 1977; Stjernsward, Muenz, & von Essen,1976), but it was not until the following decade that research synthesesof health research began to appear in any numbers and that the scien-tific issues that needed to be addressed were articulated clearly forpeople in the health professions. In Kenneth Warren’s (1981) seminalbook on coping with the biomedical literature, Edward Kass (1981)noted that “reviews will need to be evaluated as critically as are pri-mary scientific papers” (p. 82). Cynthia Mulrow began that process ina seminal article published in the Annals of Internal Medicine in 1987that concluded that review articles published in four major medicaljournals had not used scientific methods to identify, assess, and syn-thesize information. Other influential articles addressed to a medicalreadership were published the same year (L’Abbé, Detsky, &O’Rourke, 1987; Peto, 1987; Sacks, Berrier, Reitman, Ancona-Berk,& Chalmers, 1987).
During the late 1980s, global collaboration among investigatorsresponsible for randomized trials in cancer and cardiovascular diseaseresulted in research syntheses based on collaborative reanalyses of
20 Evaluation & the Health Professions / March 2002
at Durham University on March 8, 2016ehp.sagepub.comDownloaded from
individual patient data derived from almost all the randomized trials ofcertain therapies (Advanced Ovarian Cancer Trialists’ Group, 1991;Antiplatelet Trialists’ Collaboration, 1988; Early Breast CancerTrialists’ Collaborative Group, 1988). These endeavors became yard-sticks against which the scientific quality of other research synthesesin the field of health care would be judged. International collaborationduring this time also led to the preparation of hundreds of systematicreviews of controlled trials relevant to the care of women duringpregnancy and childbirth. These were published in a 1,500-page, two-volume book, Effective Care in Pregnancy and Childbirth(I. Chalmers et al., 1989), deemed an important landmark in the his-tory of controlled trials and research synthesis (Cochrane, 1989;Mosteller, 1993). Three years later, the results were published of asimilar project assessing the effects of care of newborn infants(Sinclair & Bracken, 1992).
Within the social sciences, the importance of this phase in the his-tory of research synthesis was reflected in Lipsey and Wilson’s (1993)assessment of more than 300 quantitative research syntheses ofbehavioral and educational intervention studies and Cooper andHedges’s (1994) 570-page Handbook of Research Synthesis.
Within health care, the practical importance of improving the sci-entific quality of reviews was given great impetus by an analysis con-ducted by a group of researchers led by Thomas Chalmers and Freder-ick Mosteller: A comparison of textbook advice on the treatment ofpeople with myocardial infarction with the results of systematic syn-theses of relevant randomized controlled trials showed that validadvice on some lifesaving treatments had been delayed for more thana decade, and other forms of care had been promoted long after theyhad been shown to be harmful (Antman, Lau, Kupelnick, Mosteller, &Chalmers, 1992). This report made it abundantly clear that the failureof researchers to prepare reviews of therapeutic research systemati-cally could have very real human costs.
ACADEMIC RECOGNITION OF RESEARCH SYNTHESIS AS RESEARCH
Over recent decades, research synthesis has been widely seenwithin academia as second-class, scientifically derivative work,unworthy of mention in reports and documents intended to confirmthe scientific credentials of individuals and institutions. Indeed,
Chalmers et al. / A BRIEF HISTORY 21
at Durham University on March 8, 2016ehp.sagepub.comDownloaded from

systematic reviews are sometimes characterized as “parasitic recy-cling” of the work of those engaged in the real business of sci-ence—which is to add yet more data to the atomized output of theoverall scientific enterprise.
As Bentley Glass (1976) noted more than a quarter of a century ago,
The vastness of the scientific literature makes the search for generalcomprehension and perception of new relationships and possibilitiesevery day more arduous. [Yet] the editor of the critical review journalfinds each year a growing reluctance on the part of the best qualifiedscientists to devote the necessary time and energy to this task. (p. 417)
As Glass observed elsewhere in the article,
The man who adds his bits of fact to the total of knowledge has a usefuland necessary function. But who would deny that a role by far thegreater is played by the original thinker and critic who discerns thebroader outlines of the plan, who synthesises from existing knowledgethrough detection of the false and illumination of the true relationshipsof things a theory, a conceptual model, or a hypothesis capable of test.(p. 417)
Horder’s (2001) recently published discussion of the relationshipwithin developmental biological thinking between the organizer con-cept (articulated in the 1920s) and the concept of positional informa-tion (proposed in the 1970s) provides a compelling contemporaryillustration of the kind of review for which B. Glass (1976) was call-ing. Horder concluded his review by noting that “‘science’ must beacknowledged as being a historical edifice: it not only consists of thelatest results, but, more accurately, it is composed of the sum total of amassive accumulation of earlier-acquired data, interpretation andassumptions” (p. 124).
Most people within contemporary academia have not yet recog-nized (let alone come to grips with) the rationale for and methodologi-cal challenges presented by research synthesis. Neither have theygrasped that the rationale applies in all spheres of research, not only inthe areas of applied social and medical research in which it has begunto flourish. Researchers in applied medical research who have begunto apply the methods of rigorous research synthesis to animal experi-ments (Horn, de Haan, Vermeulen, Luiten, & Limburg, 2001; I.
22 Evaluation & the Health Professions / March 2002
at Durham University on March 8, 2016ehp.sagepub.comDownloaded from

Roberts, personal communication, July 2001), for example, havebegun to uncover some unsettling findings. A systematic review of theeffects of a calcium antagonist (nimodipine) in animal model experi-ments of focal cerebral ischaemia has raised questions about whetherit was ever justified to proceed to controlled trials in humans involvingnearly 7,000 patients. A systematic review of the studies in patientsdid not detect any evidence of beneficial effects of this drug (Horn &Limburg, 2001).
As early as 1971, Feldman wrote that systematically reviewing andintegrating research evidence “may be considered a type of research inits own right—one using a characteristic set of research techniquesand methods” (p. 86). In the same year, Light and Smith (1971) notedthat it was impossible to address some hypotheses other than throughanalysis of variations among related studies and that valid informationand insights could not be expected to result from this process if itdepended on the usual, scientifically undisciplined approach toreviews.
In 1977, Eugene Garfield drew attention to the importance of scien-tific review articles to the advancement of original research: Reviewarticles have high citation rates, and review journals have high impactfactors. He proposed a new profession—“scientific reviewer” (Gar-field, 1977)—and his Institute for Scientific Information went on tocosponsor (with Annual Reviews Inc.) an annual award for “Excel-lence in Scientific Reviewing” administered by the National Acad-emy of Sciences (Garfield, 1979).
In the early 1980s, this reviews-as-research perspective was madeexplicit in two papers published in the Review of EducationalResearch. First, after examining the methods used in 36 review arti-cles sampled from prestigious social science periodicals and conclud-ing that “relatively little thought has been given to the methods fordoing integrative reviews,” Jackson (1980) proposed six reviewingtasks “analogous to those performed during primary research.” A cou-ple of years later, one of us (HC) drew the analogy between researchsynthesis and primary research and presented a five-stage model ofresearch synthesis involving problem formulation, data collection(the search for potentially eligible studies), data evaluation (qualityassessment), data analysis and interpretation (meta-analysis whenappropriate), and public presentation (Cooper, 1982). The paper alsoapplied to research synthesis the notion of threats to inferential
Chalmers et al. / A BRIEF HISTORY 23
at Durham University on March 8, 2016ehp.sagepub.comDownloaded from

validity that had been introduced by Campbell and Stanley (1966) forevaluating the design of primary research (also see Cook & Campbell,1979).
The promotion of this perspective was given impetus by the publi-cation of two important books in the early 1980s. The more “schol-arly” of these was a multiauthor issue of Evaluation Studies ReviewAnnual edited by Richard Light (1983) that contained 15 contribu-tions addressing methodological issues and procedures, followed by20 separate articles illustrating how the methodologies had beenapplied in practice. In 1984, Richard Light and David Pillemer pub-lished their highly readable and influential book titled Summing Up:The Science of Reviewing Research. This became a key resource notonly for their fellow social scientists but also for the people who werebeginning to take this agenda seriously in health care. Building on theprinciples and resources developed by social scientists, Oxman andGuyatt (1988), for example, published guidelines for assessing thescientific quality of reviews in health care research.
Academic recognition of the science of research synthesis has beengrowing over recent years. There are examples of its wholeheartedincorporation in the methods used in some areas of basic research(e.g., small particle physics and some areas of psychology) and insome areas of applied research (e.g., education and some aspects ofhealth care). As Mark Petticrew (2001) noted in an article exposingsome myths and misconceptions about research synthesis, there areresearch syntheses in such diverse topics as advertising, agriculture,archaeology, astronomy, biology, chemistry, criminology, ecology,education, entomology, law, manufacturing, parapsychology, psy-chology, public policy, zoology, and even eyewitness accounts of theIndian rope trick.
Even the graphical devices for presenting the results of researchsyntheses show similarities across widely different spheres of investi-gation. A form of presentation now often referred to as a “forest plot”(Lewis & Clarke, 2001) plots point estimates from different experi-ments along with their error bars. This form of presentation is nowwidely used by health researchers but has also been very commonlyused by physicists. For example, Taylor, Parker, and Langenberg(1969) used this method to illustrate the empirical evidence from 12experiments on an atomic constant called the fine structure constant(Hedges, 1987b).
24 Evaluation & the Health Professions / March 2002
at Durham University on March 8, 2016ehp.sagepub.comDownloaded from
Because the eye is drawn to the longer error bars in these forestplots, data from the less informative studies have a relatively greatervisual effect. To compensate for this distorting feature, boxes withsizes reflecting the inverse of the variance of the estimate derived fromeach study have been used to mark the point estimates. This devicewas introduced during the 1980s, principally by medical researchers,and appears to have been inspired by a paper published in 1978 byMcGill, Tukey, and Larsen (S. Lewis, personal communication,August 2001).
Even when no study within a group of related studies is sufficientlylarge to be informative, forest plots may help to reveal a discernablepattern. For example, to test the hypothesis that a widely used form ofresuscitation used in critically ill patients—infusion of human albu-min solution—reduces mortality, the Albumin Reviewers (2001) ana-lyzed mortality data in 18 randomized trials. In 4 of these trials, noneof the participants died, and the number dying in the remaining 14 tri-als ranged from only 1 to 12. Nevertheless, not only did the forest plotof estimates derived from the 64 deaths that did occur provide no evi-dence to support the use of a treatment that has been used widely formore than half a century, it actually suggested that human albuminsolution increases the risk of death in critically ill patients.
Partly because research synthesis sometimes yields unwelcomeresults that challenge strongly held opinions and other vested inter-ests, there is very variable acceptance of the scientific principles onwhich the process is founded. For example, although there is a strongtradition of research synthesis among American social scientists, onlya tiny minority of British social scientists has any experience of thisform of research, and many appear to be actively hostile to it. Withinhealth research too, attitudes to research synthesis can vary dramati-cally. Thus, although theNewEngland Journal ofMedicine publishedsome very important research syntheses during the 1980s, the journalhas been overtly hostile to reports of such studies more recently.
As we discuss next, however, we believe that the future status ofresearch synthesis as research is more likely to be shaped by forcesoutside academia than by those within it. Consumers of research havebegun to point out more forcibly that “atomized,” unsynthesized prod-ucts of the research enterprise are of little help to people who wish touse research to inform their decisions.
Chalmers et al. / A BRIEF HISTORY 25
at Durham University on March 8, 2016ehp.sagepub.comDownloaded from

THE USE OF RESEARCH SYNTHESESTO INFORM POLICY AND PRACTICE
One of the forces shaping perceptions of research synthesis is thegrowing appetite for research evidence among policy makers, practi-tioners, and the public more generally. This appetite started to becomemanifest during the last decade of the 20th century, but earlier exam-ples exist. In a biographical article about the statistician Frank Yates,Michael Healy (1995) noted that
as the war began and it became clear that phosphate and potash fertiliz-ers were going to be extremely scarce, Yates with E. M. Crowther, thehead of the Chemistry Department at Rothampsted, brought togetherand analyzed all the published experiments on fertilizer responses thatthey could lay their hands on (Yates & Crowther, 1941). . . . An exampleof its findings is the statement that the application of 1 cwt/acre of sul-phate of ammonia at a cost of £4m would be expected to yield an extracrop to the value of £11m. As a result of this study, fertilizer rationingin the UK was placed on a rational basis and some of the survival ofwartime Britain can be set to its credit. Other studies of a similar naturewere undertaken at the same time, notably one on the feeding of dairycows (Yates, Boyd, & Pettit, 1942). It was to be some twenty years be-fore other fields of application began to realise that it was absurd not tolook critically from time to time at the collected results of experimentalwork before deciding upon action, whether in the application of the re-search or in deciding upon a programme for further research. (p. 277)
It is indeed “absurd not to look critically from time to time at thecollected results of experimental work before deciding upon action,”but it was not really until the late 1980s that acceptance of the need forresearch synthesis among policy makers and practitioners emerged, ifonly because the volume of primary data they were having to copewith was becoming overwhelming. Eleanor Chelimsky (1994), formerlyAssistant Comptroller General for Program Evaluation and Methodol-ogy at the U.S. General Accounting Office, described the situationthat she and her colleagues faced at the beginning of the 1980s:
I hoped that synthesis could dramatize, for our legislative users, notonly what was, in fact, known, but also what was not known. In thatway, I thought we could then focus attention on what needed to belearned (and how to learn it), in time to answer that policymaker’squestions before, say, the next program reauthorization. Based on the
26 Evaluation & the Health Professions / March 2002
at Durham University on March 8, 2016ehp.sagepub.comDownloaded from

legislative record for some programs, it seemed obvious that, on theone hand, the distinction between well-established knowledge andmere opinion was not always recognized, and on the other, that whatneeded to be research as a next step was sometimes not evenglimpsed. . . . In short, it seemed reasonable to try to develop a system-atic method for using synthesis as a way to channel relevant existing in-formation to answer specific congressional questions. (pp. 3-4)
By 1994, 30 research syntheses had been prepared for Congress bythe U.S. General Accounting Office on topics ranging from access tospecial education to the effectiveness of chemical weapons(Chelimsky, 1994).
Syntheses of the results of controlled trials in cancer, cardiovascu-lar disease, and the various forms of care offered to women duringpregnancy and childbirth became increasingly accepted during the1990s as helpful by those wishing to make more informed decisions inhealth care. Research syntheses were identified for early supportwhen a Research and Development Programme to support the U.K.’sNational Health Service (NHS) was launched in 1991 (Peckham,1991), and this was reflected in the creation of two centers—the NHSCentre for Reviews and Dissemination and the U.K. Cochrane Centre—to help tackle this agenda.
During the 1990s, the importance of research synthesis alsobecame acknowledged among those considering proposals for newresearch. The NHS Health Technology Assessment Programme andthe British and Dutch Medical Research Councils, for example, allbegan to require systematic reviews of existing research as a precondi-tion for considering funding for proposed additional studies. In Den-mark, the national research ethics committee system began to requireapplicants for ethical approval of proposed new research to show byreference to syntheses of existing evidence that proposed new studieswere necessary and that they had been designed to take account of thelessons from previous research (I. Chalmers, 2001). These develop-ments among organizations responsible for the funding and ethicalapproval of research began to force academia to take research synthe-sis more seriously. This trend is likely to be given further impetus bythe widely publicized death of a young volunteer in a physiologicalexperiment, the design of which had been inadequately informed by asystematic review of preexisting evidence about hazards (Clark,Clark, & Djulbegovic, 2001).
Chalmers et al. / A BRIEF HISTORY 27
at Durham University on March 8, 2016ehp.sagepub.comDownloaded from

In a history of research synthesis published in 1997, Morton Huntconcluded that systematic reviews of research evidence appear to behaving an influence on policies and practices in schools, hospitals,state welfare programs, mental health clinics, courts, prisons, andother institutions. Today’s questions about the deployment of limitedresources for the benefit of the public may not be those about phos-phate and potash fertilizers to which answers were sought more thanhalf a century ago, but the potential for research synthesis to informdecisions about policy and practice remains substantial and still inad-equately exploited.
This is not to suggest that there have been no areas in which rigor-ously conducted systematic reviews have been uncontentious, evenwhen the component studies of the review have been controlled exper-iments. Reactions to the Cochrane review of the effects human albu-min solution in critically ill patients (Albumin Reviewers, 2000)provide a celebrated or notorious example, depending on one’s pointof view. Reviews of observational data can be relied on to generateeven more heat, however, particularly if meta-analysis has been usedto synthesize data from nonexperimental studies (Egger, Schneider, &Davey Smith, 1998).
USING ELECTRONIC MEDIA TO KEEP RESEARCHSYNTHESES UP TO DATE AND CORRECT
The growth in appetite for research syntheses among policy mak-ers, practitioners, people using services, and others is a growth inappetite for information that is up to date and correct. This reasonableexpectation has posed additional challenges to the research commu-nity. The potential for meeting these challenges increased dramati-cally with the evolution of electronic publishing. In the late 1980s, theinternational group that had prepared syntheses of research on theeffects of forms of care offered during pregnancy and childbirth pub-lished their findings in various forms, one of which used electronicmedia (I. Chalmers, 1988). This meant that syntheses published onpaper could be updated and corrected as new data or errors wereidentified.
At the end of 1992, the U.K. Cochrane Centre was established todraw on this experience and to facilitate the creation of an interna-tional network to prepare and maintain systematic reviews of the
28 Evaluation & the Health Professions / March 2002
at Durham University on March 8, 2016ehp.sagepub.comDownloaded from

effects of interventions across the whole of health care. At the end ofthe following year, an international network of individuals—theCochrane Collaboration—emerged from this initiative (Antes &Oxman, 2001; Bero & Rennie, 1995; I. Chalmers, 1993; I. Chalmers,Sackett, & Silagy, 1997; Dickersin & Manheimer, 1998; Oxman,2001). Since the launch of The Cochrane Database of SystematicReviews in 1995, the research syntheses that have been published bythis still young organization have been having an encouraging effecton the content of international guidelines and policies in health care.
Others have recognized that considerable scope exists for extend-ing the collaborative, international arrangements developed by theCochrane Collaboration for preparing, maintaining, and disseminat-ing research syntheses. In his presidential address to the Royal Statis-tical Society in 1996, Adrian Smith, professor of statistics at ImperialCollege London, welcomed the creation of the Cochrane Collabora-tion and asked,
But what is so special about medicine? We are, through the media, asordinary citizens, confronted daily with controversy and debate acrossa whole spectrum of public policy issues. But typically, we have no ac-cess to any form of systematic “evidence base”—and therefore nomeans of participating in the debate in a mature and informed manner.Obvious topical examples include education—what does work in theclassroom?—and penal policy—what is effective in preventingreoffending? Perhaps there is an opportunity here for the Society—to-gether with appropriate allies in other learned societies and the media—to launch a campaign, directed at developing analogues to theCochrane Collaboration, to provide suitable evidence bases in other ar-eas besides medicine, with the aim of achieving a quantal shift in thequantitative maturity of public policy debates. (pp. 369-370)
The same principles that have led to the rapid evolution of theCochrane Collaboration were adopted when the Campbell Collabora-tion was inaugurated at the beginning of the 21st century. This siblingorganization, which draws particularly on the wealth of relevant expe-rience among social scientists in the United States, is preparing, main-taining, and disseminating systematic reviews of the effects of socialand educational policies and practices (Boruch, Petrosino, &Chalmers, 1999; Campbell Collaboration Steering Group, 2000).Importantly, the Cochrane and Campbell Collaborations will work
Chalmers et al. / A BRIEF HISTORY 29
at Durham University on March 8, 2016ehp.sagepub.comDownloaded from

together to develop methods to improve the quality of research synthe-ses (Clarke & Cooper, 2000).
THE “FUTURE HISTORY” OF RESEARCH SYNTHESIS
Upon this gifted age, in its darkest hour,Rains from the sky a meteoric shower of facts . . .They lie unquestioned, uncombined.Wisdom enough to leach us of our ill is daily spun;But there exists no loom to weave it into fabric . . .
—Edna St. Vincent Millay (1892-1950)“Huntsman, What Quarry?”
An immense and ever-increasing wealth of knowledge is scatteredabout the world today; knowledge that would probably suffice to solveall the mighty difficulties of our age, but it is dispersed and unorgan-ised. We need a sort of clearing-house for the mind: a depot whereknowledge and ideas are received, sorted, summarised, digested, clari-fied and compared.
—H. G. Wells(quoted in The Sunday Independent, August 30, 1997)
Although it is widely agreed that science is cumulative, people haveonly very recently begun to acknowledge that scientists have a respon-sibility to cumulate scientifically. As this article has shown, there isscattered evidence that this has been acknowledged by some scientistsfor at least a century, but it was really only during the last quarter of the20th century that the need to develop and apply methods to improveresearch synthesis became more widely recognized.
So far, most of the resulting activity has been directed at preparingstand-alone research syntheses. As Lord Rayleigh (1885) noted morethan a century ago, however,
The work which deserves, but I am afraid does not always receive, themost credit is that in which discovery and explanation go hand in hand,in which not only are new facts presented, but their relation to old onesis pointed out. (p. 20)
The digestion and assimilation of old material and the integration ofnew material with existing evidence are both essential elements of
30 Evaluation & the Health Professions / March 2002
at Durham University on March 8, 2016ehp.sagepub.comDownloaded from

scientific endeavors, and this needs to be reflected in the methodologi-cal quality of the Discussion sections of reports of primary research.As the data in Table 2 show, even in papers published in five highlyrespected general medical journals, it remains very rare for the resultsof new controlled trials to be set in the context of systematic reviews ofother, similar studies (Clarke, Alderson, & Chalmers, 2001; Clarke &Chalmers, 1998).
Some years ago, the editor of this journal suggested that a casecould be made for calling for a moratorium on proposals for additionalprimary research until the results of existing research had been incor-porated in scientifically defensible reviews (Bausell, 1993). Althoughhe may have thought this a radical a proposition at the time, there isevidence that funders of research are beginning to take account of suchviews.
The future status of and investment in research synthesis thus seemmore likely to be shaped by external pressures from the users ofresearch information than by traditional attitudes within academia tothis kind of work. Indeed, we predict that we are moving toward a timewhen the public will begin to ask increasingly penetrating questionsabout why it has taken academia so long to begin to practice the kindof scientific self-discipline for which Lord Rayleigh called in 1885.
More radically, the public may also begin to ask why researchersaddressing similar or related questions do not collaborate effectivelyor make their raw data publicly available for others to exploit. Theadvantages of collaborative investigations using pooled raw data havebeen made abundantly clear by the global clinical trialists’ collabora-tions in cancer and heart disease in particular (Advanced Ovarian
Chalmers et al. / A BRIEF HISTORY 31
TABLE 2Classification of Discussion Sections in RandomizedControlled Trial Reports Published in May 1997 andMay 2001 in Five Major General Medical Journals
Classification May 1997 (n = 26) May 2001 (n = 33)
First trial addressing the question 1 3Contained an updated systematic review 2 0
integrating the new resultsDiscussed a previous review but did not 4 3
attempt to integrate the new resultsNo apparent systematic attempt to set the new 19 27
results in the context of other trials
at Durham University on March 8, 2016ehp.sagepub.comDownloaded from
Cancer Trialists’ Group, 1991; Antiplatelet Trialists’ Collaboration,1988; Early Breast Cancer Trialists’ Collaborative Group, 1988).Physicists have led the way in making raw data publicly available inelectronic form (Ginsparg, 1998). As Gene Glass (2001) noted,“Meta-analysis was created out of the need to extract useful informa-tion from the cryptic records of inferential data analyses in the abbre-viated reports of research in journals and other printed sources” (p.12). We agree with him that the future history of research synthesisshould be based increasingly on the creation of publicly accessiblearchives of raw data.
REFERENCES
Advanced Ovarian Cancer Trialists’Group. (1991). Chemotherapy in advanced ovarian cancer:An overview of randomised clinical trials. British Medical Journal, 303, 884-893.
Airy, G. B. (1861). On the algebraical and numerical theory of errors of observations and thecombination of observations. London: Macmillan.
Albumin Reviewers (Alderson, P., Bunn, F., Lefebvre, C., Li Wan Po, A., Li, L., Roberts, I.,et al.). (2000).Human albumin solution for resuscitation and volume expansion in criticallyill patients (Cochrane Review). Retrieved June 2000 from The Cochrane Library (Issue 2)database.
Andrews, G., Guitar, B., & Howie, P. (1980). Meta-analysis of the effects of stuttering treatment.Journal of Speech and Hearing Disorders, 45, 287-307.
Antes, G., & Oxman, A. D. (for the Cochrane Collaboration). (2001). The Cochrane Collabora-tion in the 20th century. In M. Egger, G. Davey Smith, & D. Altman (Eds.), Systematicreviews in health care: Meta-analysis in context (2nd ed., pp. 447-458). London: BMJBooks.
Antiplatelet Trialists’ Collaboration. (1988). Secondary prevention of vascular disease by pro-longed anti-platelet treatment. British Medical Journal, 296, 320-331.
Antman, E. M., Lau, J., Kupelnick, B., Mosteller, F., & Chalmers, T. C. (1992). A comparison ofresults of meta-analyses of randomized control trials and recommendations of clinicalexperts. Journal of the American Medical Association, 268, 240-248.
Aspirin after myocardial infarction [Editorial]. (1980). Lancet, 1, 1172-1173.Bausell, B. B. (1993). After the meta-analytic revolution. Evaluation and the Health Profes-
sions, 16, 3-12.Beecher, H. K. (1955). The powerful placebo. Journal of the American Medical Association,
159, 1602-1606.Bero, L., & Rennie, D. (1995). The Cochrane Collaboration: Preparing, maintaining, and dis-
seminating systematic reviews of the effects of health care. Journal of the AmericanMedicalAssociation, 274, 1935-1938.
Birge, R. T. (1932). The calculation of errors by the method of least squares.Physical Review, 40,207-227.
Boruch, R., Petrosino, A., & Chalmers, I. (1999). The Campbell Collaboration: A proposal forsystematic, multinational, and continuous reviews of evidence. In P. Davies, A. Petrosino, &I. Chalmers (Eds.), The effects of social and educational interventions: Developing an
32 Evaluation & the Health Professions / March 2002
at Durham University on March 8, 2016ehp.sagepub.comDownloaded from

infrastructure for international collaboration to prepare, maintain and promote the accessi-bility of systematic reviews of relevant research (pp. 1-22). London: University College Lon-don School of Public Policy.
Brunt, L. (2001). The advent of the sample survey in the social sciences. The Statistician, 50,179-189.
Campbell Collaboration Steering Group. (2000).Decisions and action plans made at the work-ing inaugural meeting of the Campbell Collaboration. Retrieved October 2001 fromhttp://campbell.gse.upenn.edu/papers/2_decisions.html
Campbell, D. T., & Stanley, J. C. (1966). Experimental and quasi-experimental designs forresearch. Chicago: Rand McNally.
Chalmers, I. (1979). Randomized controlled trials of fetal monitoring 1973-1977. In O.Thalhammer, K. Baumgarten, & A. Pollak (Eds.), Perinatal medicine (pp. 260-265).Stuttgart, Germany: Georg Thieme.
Chalmers, I. (Ed.). (1988). The Oxford database of perinatal trials. Oxford: Oxford UniversityPress.
Chalmers, I. (1993). The Cochrane Collaboration: Preparing, maintaining and disseminatingsystematic reviews of the effects of health care.Annals of theNewYorkAcademy of Sciences,703, 156-163.
Chalmers, I. (2001). Using systematic reviews and registers of ongoing trials for scientific andethical trial design. In M. Egger, G. Davey Smith, & D. Altman (Eds.), Systematic reviews inhealth care: Meta-analysis in context (2nd ed., pp. 429-443). London: BMJ Books.
Chalmers, I., & Altman, D. G. (Eds.). (1995). Systematic reviews. London: BMJ Books.Chalmers, I., Enkin, M., & Keirse, M.J.N.C. (Eds.). (1989). Effective care in pregnancy and
childbirth. Oxford: Oxford University Press.Chalmers, I., Sackett, D., & Silagy, C. (1997). The Cochrane Collaboration. In A. Maynard & I.
Chalmers (Eds.),Non-random reflections on health services research: On the 25th anniver-sary of ArchieCochrane’s effectiveness and efficiency (pp. 231-249). London: BMJ Books.
Chalmers, T. C., Matta, R. J., Smith, H., & Kunzler, A.-M. (1977). Evidence favoring the use ofanticoagulants in the hospital phase of acute myocardial infarction.NewEngland Journal ofMedicine, 297, 1091-1096.
Chase, R. A., Sutton, S., & First, D. (1959). Bibliography: Delayed auditory feedback. Journalof Speech and Hearing Research, 2, 193-200.
Chelimsky, E. (1994, June). Politics, policy, and research synthesis. Keynote address before theNational Conference on Research Synthesis, sponsored by the Russell Sage Foundation,Washington, DC.
Clark, O., Clark, L., & Djulbegovic, B. (2001). Is clinical research still too haphazard? Lancet,358, 1648.
Clarke, M., Alderson, P., & Chalmers, I. (2001).Discussion sections in reports of controlled tri-als published in generalmedical journals:No evidence of progress betweenPrague andBar-celona. Paper presented at the 4th International Congress on Peer Review in BiomedicalPublication. Barcelona, Spain, 14-16, September. Manuscript submitted for publication.
Clarke, M., & Chalmers, I. (1998). Discussion sections in reports of controlled trials published ingeneral medical journals: Islands in search of continents? Journal of the American MedicalAssociation, 280, 280-282.
Clarke, M., & Cooper, H. (2000).Discussion paper onCochrane andCampbellmethods groups.Retrieved October 2001, from http://campbell.gse.upenn.edu/contents.html
Cochran, W. G. (1937). Problems arising in the analysis of a series of similar experiments. Jour-nal of the Royal Statistical Society, 4(Suppl.), 102-118.
Cochran, W. G. (1954). The combination of estimates from different experiments. Biometrics,10, 101-129.
Chalmers et al. / A BRIEF HISTORY 33
at Durham University on March 8, 2016ehp.sagepub.comDownloaded from

Cochrane, A. L. (1972). Effectiveness and efficiency. Random reflections on health services.London: Nuffield Provincial Hospitals Trust.
Cochrane, A. L. (1979). 1931-1971: A critical review, with particular reference to the medicalprofession. InMedicines for the year 2000 (pp. 1-11). London: Office of Health Economics.
Cochrane, A. L. (1989). Foreword. In I. Chalmers, M. Enkin, & M.J.N.C. Keirse (Eds.),Effectivecare in pregnancy and childbirth (pp. vii). Oxford, UK: Oxford University Press.
Cook, T. D., & Campbell, D. T. (1979).Quasi-experimentation: Design and analysis issues forfield setting. Chicago: Rand McNally.
Cooper, H., & Hedges, L. V. (1994). The handbook of research synthesis. New York: RussellSage.
Cooper, H. M. (1982). Scientific principles for conducting integrative research reviews. Reviewof Educational Research, 52, 291-302.
Dickersin, K., & Manheimer, E. (1998). The Cochrane Collaboration: Evaluation of health careand services using systematic reviews of the results of randomized controlled trials.ClinicalObstetrics and Gynecology, 41, 315-331.
Early Breast Cancer Trialists’Collaborative Group. (1988). Effects of adjuvant tamoxifen and ofcytotoxic therapy on mortality in early breast cancer. An overview of 61 randomized trialsamong 28,896 women. New England Journal of Medicine, 319, 1681-1692.
Egger, M., Davey Smith, G., & Altman, D. (Eds.). (2001). Systematic reviews in health care:Meta-analysis in context (2nd ed.). London: BMJ Books.
Egger, M., Davey Smith, G., & O’Rourke, K. (2001). Rationale, potentials, and promise of sys-tematic reviews. In M. Egger, G. Davey Smith, & D. Altman (Eds.), Systematic reviews inhealth care: Meta-analysis in context (2nd ed., pp. 3-19). London: BMJ Books.
Egger, M., Schneider, M., & Davey Smith, G. (1998). Spurious precision? Meta-analysis ofobservational studies. British Medical Journal, 316, 140-144.
Eysenck, H. J. (1978). An exercise in mega-silliness. American Psychology, 33, 517.Feinstein, A. R. (1995). Meta-analysis: Statistical alchemy for the 21st century. Journal of Clini-
cal Epidemiology, 48, 71-79.Feldman, K. A. (1971). Using the work of others: Some observations on reviewing and integrat-
ing. Sociology of Education, 44, 86-102.Fisher, R. A. (1932). Statistical methods for research workers (4th ed.). London: Oliver and
Boyd.Garfield, E. (1977). Proposal for a new profession: Scientific reviewer.Essays of an Information
Scientist, 3, 84-87.Garfield, E. (1979). The NAS James Murray Luck Award for excellence in scientific reviewing.
Essays of an Information Scientist, 4, 127-131.Ginsparg, P. (1998). Electronic research archives for physics. Retrieved December 2001 from
http://tiepac.portlandpress.co.uk/books/online/tiepac/session1/ch7.htmGlass, B. (1976). The critical state of the critical review article. Quarterly Review of Biology,
50th Anniversary Special Issue (1926-76), 415-418.Glass, G. V (1976). Primary, secondary and meta-analysis of research. Educational Researcher,
10, 3-8.Glass, G. V (2001). Meta-analysis at 25. Retrieved December 2001 from http://glass.ed.asu.
edu/gene/papers/meta25.htmlGlass, G. V, & Smith, M. L. (1979). Meta-analysis of the relationship between class size and
achievement. Educational Evaluation and Policy Analysis, 1, 2-16.Greenhouse, S. W. (1958). Some statistical and methodological aspects in the clinical evaluation
of the tranquilizers in mental illness. Biometrics, 14, 135.Hampton, J. R. (1998). The end of medical history? Journal of theRoyalCollege of Physicians of
London, 32, 366-375.
34 Evaluation & the Health Professions / March 2002
at Durham University on March 8, 2016ehp.sagepub.comDownloaded from

Healy, M.J.R. (1995). Frank Yates, 1902-1994—The work of a statistician. International Statis-tical Review, 63, 271-288.
Hedges, L. V. (1984). Estimation of effect size under nonrandom sampling: The effects of cen-soring studies yielding statistically insignificant mean differences. Journal of EducationalStatistics, 9, 61-85.
Hedges, L. V. (1987a). Commentary. Statistics in Medicine, 6, 381-385.Hedges, L. V. (1987b). How hard is hard science, how soft is soft science: The empirical
cumulativeness of research. American Psychologist, 42, 443-455.Hedges, L. V., & Olkin, I. (1985). Statistical methods for meta-analysis. San Diego: Academic
Press.Herring, C. (1968). Distil or drown: The need for reviews. Physics Today, 21, 27-33.Horder, T. J. (2001). The organizer concept and modern embryology: Anglo-American perspec-
tives. International Journal of Developmental Biology, 45, 97-132.Horn, J., & Limburg, M. (2001). Calcium antagonists for acute ischemic stroke (Cochrane
Review). Retrieved December 2001 from the Cochrane Library (Issue 3) database.Horn, J., de Haan, R. J., Vermeulen, M., Luiten, P.G.M., & Limburg, M. (2001). Nimodipine in
animal model experiments of focal cerebral ischaemia. Stroke, 32, 2433-2438.Hunt, M. (1997).Howscience takes stock: The story ofmeta-analysis. New York: Russell Sage.Hunter, J. E., Schmidt, F. L., & Hunter, R. (1979). Differential validity of employment tests by
race: A comprehensive review and analysis. Psychological Bulletin, 86, 721-735.Jackson, G. B. (1980). Methods for integrative reviews. Review of Educational Research, 50,
438-460.Jones, L. V., & Fiske, D. (1953). Models for testing the significance of combined results.Psycho-
logical Bulletin, 50, 375-382.Kass, E. H. (1981). Reviewing reviews. In K. S. Warren (Ed.),Copingwith the biomedical litera-
ture (pp. 79-91). New York: Praeger.L’Abbé, K. A., Detsky, A. S., & O’Rourke, K. (1987). Meta-analysis in clinical research.Annals
of Internal Medicine, 107, 224-232.Last, J. M. (2001). A dictionary of epidemiology. Oxford: Oxford University Press.Lewis, S., & Clarke, M. (2001). Forest plots—Trying to see the wood and the trees.BritishMedi-
cal Journal, 322, 1479-1480.Lide, D. R. (1981). Critical data for critical needs. Science, 212, 1343-1349.Lide, D. R., & Rossmassler, S. A. (1973). Status report on critical compilation of physical chemi-
cal data. Annual Review of Physical Chemistry, 29, 135-158.Light, R. J. (Ed.). (1983). Evaluation studies review annual. Beverly Hills, CA: Sage.Light, R. J., & Pillemer, D. B. (1984). Summing up: The science of reviewing research. Cam-
bridge, MA: Harvard University Press.Light, R. J., & Smith, P. V. (1971). Accumulating evidence: Procedures for resolving contradic-
tions among research studies. Harvard Educational Review, 41, 429-471.Lipsey, M. W., & Wilson, D. B. (1993). The efficacy of psychological, educational and behav-
ioral treatment. American Psychologist, 48, 1181-1209.Mandel, H. (1936). Racial psychic history: A detailed introduction and a systematic review of
investigations. Leipzig, Germany: Heims.McGill, R., Tukey, J. W., & Larsen, W. A. (1978). Variations of box plots.American Statistician,
32, 12-16.Mosteller, F. (1993). The prospect of data-based medicine in the light of ECPC.Milbank Quar-
terly, 71, 523-532.Mosteller, F., & Bush, R. R. (1954). Selected quantitative techniques. In G. Lindsay (Ed.),Hand-
book of social psychology: Vol. 1. Theory and method (pp. 289-334). Reading, MA:Addison-Wesley.
Chalmers et al. / A BRIEF HISTORY 35
at Durham University on March 8, 2016ehp.sagepub.comDownloaded from

Mulrow, C. D. (1987). The medical review article: State of the science.Annals of Internal Medi-cine, 106, 485-488.
Nichols, H. (1891). The psychology of time. American Journal of Psychology, 3, 453-529.Oxman, A. D. (2001). The Cochrane Collaboration in the 21st century: Ten challenges and one
reason why they must be met. In M. Egger, G. Davey Smith, & D. Altman (Eds.), Systematicreviews in health care: Meta-analysis in context (2nd ed., pp. 459-473). London: BMJBooks.
Oxman, A. D., & Guyatt, G. H. (1988). Guidelines for reading literature reviews. CanadianMedical Association Journal, 138, 697-703.
Pearson, K. (1904). Report on certain enteric fever inoculation statistics. British Medical Jour-nal, 3, 1243-1246.
Pearson, K. (1933). On a method of determining whether a sample of given size n supposed tohave been drawn from a parent population having a known probability integral has probablybeen drawn at random. Biometrika, 25, 370-410.
Peckham, M. (1991). Research and development in the National Health Service. Lancet, 338,367-371.
Peters, C. C. (1933). Summary of the Penn State experiments on the influence of instruction incharacter education. Journal of Educational Psychology, 7, 269-272.
Peto, R. (1987). Why do we need systematic overviews of randomized trials? Statistics inMedi-cine, 6, 233-240.
Petticrew, M. (2001). Systematic reviews from astronomy to zoology: Myths and misconcep-tions. British Medical Journal, 322, 98-101.
Pillemer, D. B. (1984). Conceptual issues in research synthesis. Journal of Special Education,18, 27-40.
Rayleigh, The Right Honorable Lord. (1885). Presidential address at the 54th meeting of theBritish Association for the Advancement of Science, Montreal, August/September 1884.London: John Murray.
Rietz, H. L., & Mitchell, H. H. (1910-1911). On the metabolism experiment as a statistical prob-lem. Journal of Biological Chemistry, 8, 297-326.
Rosenfeld, A. H. (1975). The particle data group: Growth and operations. Annual Review ofNuclear Science, 25, 555-599.
Rosenthal, R. (1979). The “file drawer problem” and tolerance for null results. PsychologicalBulletin, 86, 638-641.
Rosenthal, R. (1984). Meta-analytic procedures for social research. Beverly Hills, CA: Sage.Rosenthal, R., & Rubin, D. (1978). Interpersonal expectancy effects: The first 345 studies.
Behavioral and Brain Sciences, 3, 377-415.Sacks, H. S., Berrier, J., Reitman, D., Ancona-Berk, V. A., & Chalmers, T. C. (1987). Meta-
analyses of randomized controlled trials.NewEngland Journal ofMedicine,316, 450-455.Schoolman, H. M. (1982). Anatomy, physiology and pathology of biomedical information.
Western Medical Journal, 137, 460-466.Shaikh, W., Vayda, E., & Feldman, W. (1976). A systematic review of the literature on evaluative
studies of tonsillectomy and adenoidectomy. Pediatrics, 57, 401-407.Shapiro, S. (1994). Meta-analysis/shmeta-analysis. American Journal of Epidemiology, 140,
771-778.Sinclair, J. C., & Bracken, M. B. (Eds.). (1992). Effective care of the newborn infant. Oxford:
Oxford University Press.Smith, A.F.M. (1996). Mad cows and ecstasy: Chance and choice in an evidence-based society.
Journal of the Royal Statistical Society, 159, 367-383.Smith, M. L., & Glass, G. V. (1977). Meta-analysis of psychotherapy outcome studies.American
Psychologist, 32, 752-760.
36 Evaluation & the Health Professions / March 2002
at Durham University on March 8, 2016ehp.sagepub.comDownloaded from

Sterling, T. D. (1959). Publication decisions and their possible effects on inferences drawn fromtests of significance—Or vice versa. Journal of the American Statistical Association, 54,30-34.
Stigler, S. (1986). The history of statistics: The measurement of uncertainty before 1900. Cam-bridge, MA: Harvard University Press.
Stjernsward, J., Muenz, L. R., & von Essen, C. F. (1976). Postoperative radiotherapy and breastcancer. Lancet, 1, 749.
Taylor, B. N., Parker, W. H., & Langenberg, D. N. (1969). Determination of e/h, using macro-scopic quantum phase coherence in superconductors: Implications for quantum electrody-namics and the fundamental physical constants. Reviews of Modern Physics, 41, 375-496.
Thorndike, E. L., & Ruger, G. J. (1916). The effects of outside air and recirculated air upon theintellectual achievement and improvement of school pupils: A second experiment. Schooland Society, 4, 261-264.
Tippett, L.H.C. (1931). The method of statistics. London: Williams and Norgate.Touloukian, Y. S. (1975). Reference data on thermophysics. In H. A. Skinner (Ed.), Interna-
tional review of physical chemistry: Vol. 10. Thermochemistry and thermodynamics (pp.119-146). Newton, MA: Butterworth-Heinemann.
Warren, K. S. (Ed.). (1981). Coping with the biomedical literature. New York: Praeger.Winkelstein, W. (1998). The first use of meta-analysis?American Journal of Epidemiology, 147,
717.Yates, F., Boyd, D. A., & Pettit, G.H.N. (1942). Influence of changes in levels of feeding on milk
production. Journal of Agricultural Science, 32, 428-456.Yates, F., & Cochran, W. G. (1938). The analysis of groups of experiments. Journal of Agricul-
tural Science, 28, 556-580.Yates, F., & Crowther, E. M. (1941). Fertilizer policy in wartime: The fertilizer requirements of
arable crops. Empire Journal of Experimental Agriculture, 9, 77-97.Yusuf, S., Peto, R., Lewis, J., Collins, R., & Sleight, P. (1985). Beta blockade during and after
myocardial infarction: An overview of the randomised trials. Progress in CardiovascularResearch, 27, 336-371.
Yusuf, S., Simon, R., & Ellenberg, S. S. (Guest eds). (1987). Meta-analysis of controlled trials[Special issue]. Statistics in Medicine, 6(3).
Zwolinski, B. J., & Chao, J. (1972). Critically evaluated tables of thermodynamic data. In H. A.Skinner (Ed.), International review of physical chemistry: Vol. 10. Thermochemistry andthermodynamics (pp. 93-120). Newton, MA: Butterworth-Heinemann.
Chalmers et al. / A BRIEF HISTORY 37
at Durham University on March 8, 2016ehp.sagepub.comDownloaded from

Seediscussions,stats,andauthorprofilesforthispublicationat:https://www.researchgate.net/publication/15112203
MulrowCDSystematicreviews:rationaleforsystematicreviews.BMJ309:597-599
ARTICLEinBMJCLINICALRESEARCH·OCTOBER1994
ImpactFactor:14.09·DOI:10.1136/bmj.309.6954.597·Source:PubMed
CITATIONS
652
READS
168
1AUTHOR:
CynthiaDMulrow
UniversityofTexasHealthScienceCentera…
125PUBLICATIONS11,745CITATIONS
SEEPROFILE
Availablefrom:CynthiaDMulrow
Retrievedon:08March2016

Systematic Reviews
Rationale for systematic reviews
Cynthia D Mulrow
This article is thefirst ofaseries on systematic reviews
Divisions ofGeneralMedicine and Geriatrics,University ofTexas HealthScience Center, SanAntonio, Texas 70284,USACynthia D Mulrow, associateprofessor
BMJ 1994;309:597-9
C'a
FletcherDewar
EuropeanEuropean 2
HeikinheimoItalian
AustralianFrankfurt 2
NHLBI SMITFrankValereKlein
UK CollaberationAustrian
Australian 2Lasierra
N German CollabWitchitz
European 3ISAM
GISSI-Olson
BaroffioSchreiber
CribierSainsousDurandWhite
BassandVlay
KennedyISIS-2
Wisenberg
Total
Systematic literature reviews including meta-analyses are invaluable scientific activities. Therationale for such reviews is well established. Healthcare providers, researchers, and policy makers areinundated with unmanageable amounts of informa-tion; they need systematic reviews to efficientlyintegrate existing information and provide data forrational decision making. Systematic reviews estab-lish whether scientific findings are consistent andcan be generalised across populations, settings, andtreatment variations, or whether findings vary signi-ficantly by particular subsets. Meta-analyses inparticular can increase power and precision ofestimates of treatment effects and exposure risks.Finally, explicit methods used in systematic reviewslimit bias and, hopefully, will improve reliability andaccuracy ofconclusions.
Systematic literature review is a fundamental scientificactivity. Its rationale is grounded firmly in severalpremises. Firstly, large quantities of information mustbe reduced into palatable pieces for digestion. Overtwo million articles are published annually in thebiomedical literature in over 20 000 journalsl-literally
IndiMdual analysis andconventional
meta-ahalysis (odds ratio)X 0.1 0.2 0.5 1- z*
1959 231963 42 I _1969 1671971 7301971 426 11971 3211973 5171973 206 1----1974 1071975 1081975 911976 231976 5951977 7281977 2301977 24 le1977 4831977 581979 3151986 7411986 117121986 521986 59 *1986 381986 441986 981987 641987 219 - - - -1987 107 le1988 25 11988 3681988 171871988 66
36974
Favourstreatment
2 5 Ir
_I
*1
-l
*
_-I
I@
--I
-I
Il
_81 P0 0lFavurconro
Cumulative Mantel-Haenszelff method (odds ratio)
0 oO.5 1 2Z
2365
232962 - z = -2.28 P<0.023
1388709
2 2262 432 - z = -2.69 P<0.00712 539 -
2 647 -
2738 -2 7613356 -4 084 -4 314 - z =-3.37 P<0.0014 338 -4821 04 879 05194 -6935 -18647 +1869918758 -+--1879618840 +1893819002 -0--19 221 -+--1932819 353 -19 721 -36 908 -36 974 -@- -8.16 P<0.001
Favours Favourstreatment control
FIG 1-Conventional and cumulative meta-analysis of 33 trials of intravenous streptokinase for acutemyocardial infarction. Odds ratios and 95% confidence intervals for effect of treatment on mortality areshown on a logarithmic scale
a small mountain of information. For example, about4400 pages were devoted to approximately 1100articles in the BMJ and New England Journal ofMedicine, combined, in 1992. In a stack, two millionsuch articles would rise 500 m. Clearly, systematicliterature review is needed to refine these unmanage-able amounts of information. Through critical explora-tion, evaluation, and synthesis the systematic reviewseparates the insignificant, unsound, or redundantdeadwood in the medical literature from the salient andcritical studies that are worthy of reflection.2
Secondly, various decision makers need to integratethe critical pieces of available biomedical information.Systematic reviews are used by more specialisedintegrators, such as economic and decision analysts, toestimate the variables and outcomes that are includedin their evaluations. Both systematic and more special-ised integrations are used by clinicians to keep abreastof the primary literature in a given field as well asto remain literate in broader aspects of medicine.'4Researchers use the review to identify, justify, andrefine hypotheses; recognise and avoid pitfalls ofprevious work; estimate sample sizes; and delineateimportant ancillary or adverse effects and covariatesthat warrant consideration in future studies. Finally,health policy makers use systematic reviews to formu-late guidelines and legislation concerning the use ofcertain diagnostic tests and treatment strategies.
An efficient scientific techniqueThirdly, the systematic review is an efficient scien-
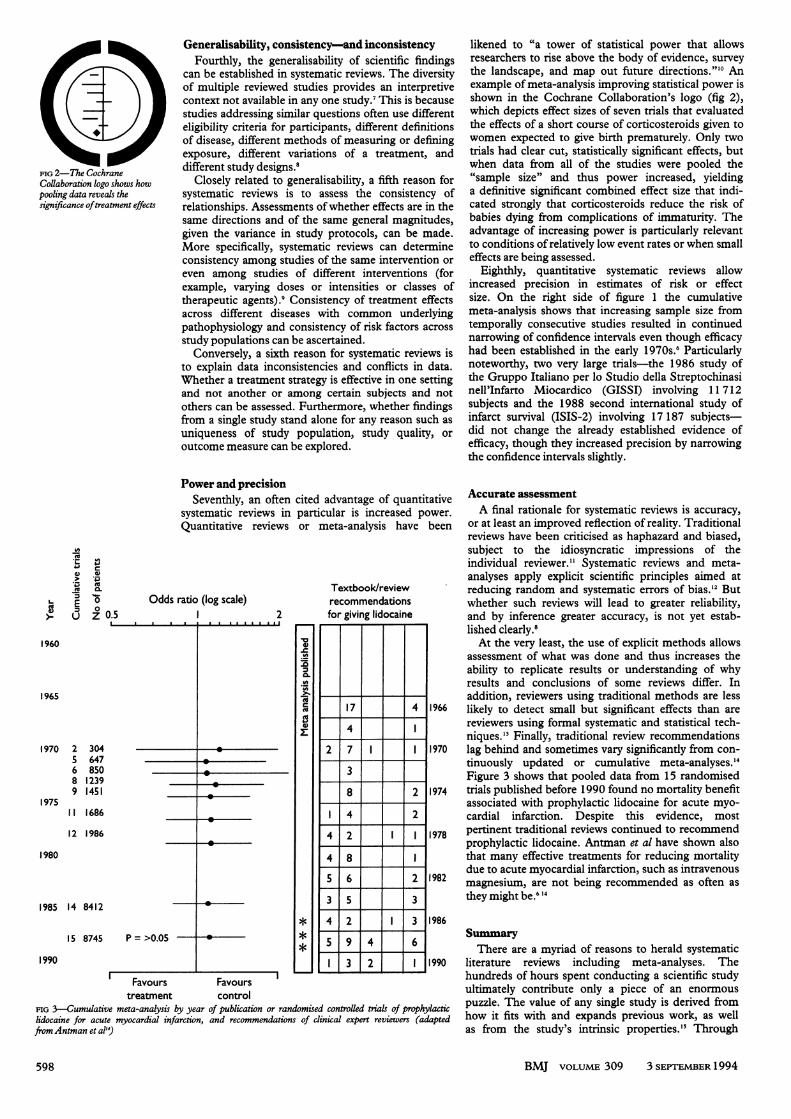
tific technique. Although sometimes arduous and timeconsuming, a review is usually quicker and less costlythan embarking on a new study. Just as important, areview can prevent meandering down an alreadyexplored path. Continuously updated literature review,as exemplified by the Oxford Database of PerinatalTrials, can shorten the time between medical researchdiscoveries and clinical implementation of effectivediagnostic or treatment strategies.5 A landmarkexample of cumulative meta-analyses and its benefits isshown in figure 1, which gives odds ratios and 95%confidence intervals for 33 trials that compared intra-venous streptokinase with a placebo or no therapyin patients who had been hospitalised for acute myo-cardial infarction. The left side of the figure shows thatthe effect of treatment with streptokinase on mortalitywas favourable in 25 of the 33 trials, but in only six wasstatistical significance achieved. The overall pooledestimate of treatment effect given at the bottomsignificantly favoured treatment. The right side of thefigure shows the same data presented as if a new orcumulative meta-analysis was performed each time theresults of a new trial were reported. The years duringwhich the treatment effect became statistically signifi-cant were 1971 for a two sided P value of < 0-05, 1973for a P value of <0-01, and 1977 for a P value of< 0-001. This cumulative type of review indicated thatintravenous streptokinase could have been shown to belife saving almost 20 years ago, long before its submis-sion to and approval by the United States Food andDrug Administration and its general adoption inpractice.
BMJ VOLUME 309 3 SEPTEMBER 1994
2i
597
Generalisability, consistency-and inconsistencyFourthly, the generalisability of scientific findings
can be established in systematic reviews. The diversityof multiple reviewed studies provides an interpretivecontext not available in any one study.7 This is becausestudies addressing similar questions often use differenteligibility criteria for participants, different definitionsof disease, different methods of measuring or definingexposure, different variations of a treatment, anddifferent study designs.8
Closely related to generalisability, a fifth reason forsystematic reviews is to assess the consistency ofrelationships. Assessments of whether effects are in thesame directions and of the same general magnitudes,given the variance in study protocols, can be made.More specifically, systematic reviews can determineconsistency among studies of the same intervention oreven among studies of different interventions (forexample, varying doses or intensities or classes oftherapeutic agents).9 Consistency of treatment effectsacross different diseases with common underlyingpathophysiology and consistency of risk factors acrossstudy populations can be ascertained.
Conversely, a sixth reason for systematic reviews isto explain data inconsistencies and conflicts in data.Whether a treatment strategy is effective in one settingand not another or among certain subjects and notothers can be assessed. Furthermore, whether findingsfrom a single study stand alone for any reason such asuniqueness of study population, study quality, oroutcome measure can be explored.
likened to "a tower of statistical power that allowsresearchers to rise above the body of evidence, surveythe landscape, and map out future directions."'0 Anexample of meta-analysis improving statistical power isshown in the Cochrane Collaboration's logo (fig 2),which depicts effect sizes of seven trials that evaluatedthe effects of a short course of corticosteroids given towomen expected to give birth prematurely. Only twotrials had clear cut, statistically significant effects, butwhen data from all of the studies were pooled the"sample size" and thus power increased, yieldinga definitive significant combined effect size that indi-cated strongly that corticosteroids reduce the risk ofbabies dying from complications of immaturity. Theadvantage of increasing power is particularly relevantto conditions of relatively low event rates or when smalleffects are being assessed.
Eighthly, quantitative systematic reviews allowincreased precision in estimates of risk or effectsize. On the right side of figure 1 the cumulativemeta-analysis shows that increasing sample size fromtemporally consecutive studies resulted in continuednarrowing of confidence intervals even though efficacyhad been established in the early 1970s.6 Particularlynoteworthy, two very large trials-the 1986 study ofthe Gruppo Italiano per lo Studio della Streptochinasinell'Infarto Miocardico (GISSI) involving 11 712subjects and the 1988 second international study ofinfarct survival (ISIS-2) involving 17 187 subjects-did not change the already established evidence ofefficacy, though they increased precision by narrowingthe confidence intervals slightly.
Power and precisionSeventhly, an often cited advantage of quantitative
systematic reviews in particular is increased power.Quantitative reviews or meta-analysis have been
.1 cL
4ic> e z0.0 '*U
m 0
>- u z 0.5
1960
1965
Odds ratio (log scale)2
I
i .
i0
i0
P= >0.05 -F -
.L
#U(UD
._
I***s
Textbook/reviewrecommendationsfor giving lidocaine
2
4
4
4
3
4
5
17
4
7
3
8
4
2
8
6
5
2
9
3
4
2
4
2
2
2
3
3
61
1966
1970
1974
1978
1982
1986
1990
Favours Favourstreatment control
FIG 3-Cumulative meta-analysis by year of publication or randomised controlled trials of prophylacticlidocaine for acute myocardial infarction, and recommendations of clinical expert reviewers (adaptedfrom Antman et al")
Accurate assessmentA final rationale for systematic reviews is accuracy,
or at least an improved reflection of reality. Traditionalreviews have been criticised as haphazard and biased,subject to the idiosyncratic impressions of theindividual reviewer." Systematic reviews and meta-analyses apply explicit scientific principles aimed atreducing random and systematic errors of bias.'2 Butwhether such reviews will lead to greater reliability,and by inference greater accuracy, is not yet estab-lished clearly.8At the very least, the use of explicit methods allows
assessment of what was done and thus increases theability to replicate results or understanding of whyresults and conclusions of some reviews differ. Inaddition, reviewers using traditional methods are lesslikely to detect small but significant effects than arereviewers using formal systematic and statistical tech-niques. '3 Finally, traditional review recommendationslag behind and sometimes vary significantly from con-tinuously updated or cumulative meta-analyses."Figure 3 shows that pooled data from 15 randomisedtrials published before 1990 found no mortality benefitassociated with prophylactic lidocaine for acute myo-cardial infarction. Despite this evidence, mostpertinent traditional reviews continued to recommendprophylactic lidocaine. Antman et al have shown alsothat many effective treatments for reducing mortalitydue to acute myocardial infarction, such as intravenousmagnesium, are not being recommended as often asthey might be.6
SummaryThere are a myriad of reasons to herald systematic
literature reviews including meta-analyses. Thehundreds of hours spent conducting a scientific studyultimately contribute only a piece of an enormouspuzzle. The value of any single study is derived fromhow it fits with and expands previous work, as wellas from the study's intrinsic properties.'5 Through
BMJ voLuMEs 309 3 SEPTEMBER 1994
FIG 2-The CochraneCollaboration logo shows howpooling data reveals thesignificance oftreatment effects
970 25689
1975II
12
30464785012391451
1686
1986
1980
1985 14 8412
15 8745
1990
I I i I 2 I I . . . . . .

systematic review the puzzle's intricacies may bedisentangled.The vast amount of available information under-
scores the value of systematic reviews. As T S Eliotasked in his poem "The Rock," "Where is the know-ledge we have lost in information?" Moreover, decisionmakers of various types are inundated with unmanage-able amounts of information. They have great need forsystematic reviews that separate the known from theunknown and that save them from the position ofknowing less than has been proved.6Advantages of the systematic review are many.
Whether scientific findings are consistent and can begeneralised across populations, settings, and treatmentvariations or whether findings vary significantly byparticular subsets can be gleaned. Unique advantagesof quantitative systematic reviews or meta-analyses areincreased power and precision in estimating effects andrisks. Hopefully, both qualitative and quantitativesystematic reviews, with their explicit methods, willlimit bias and improve the reliability and accuracy ofrecommendations.
I thank Dr Rosalva M Solis for her assistance in thepreparation of this article.
1 Ad Hoc Working Group for Critical Appraisal of the Medical Literature.Academia and clinic: a proposal for more informative abstracts of clinicalarticles. Ann Intern Med 1987;106:598-604.
2 Morgan PP. Review articles. 2. The literature jungle. Can Med Assoc J1986;134:98-9.
3 Garfield E. Reviewing review literature. Part 2. The place of reviews in thescientific literature. Current Contents 1987;30:3-5.
4 LederbergJ. Introduction. Annual Review ofComputer Science 1986;1:5-9.5 Chalmers I, Hetherington J, Newdick M, Mutch L, Adrian G, Enkin M, et al.
The Oxford Database of Perinatal Trials: developing a register of publishedreports of controlled trials. Controlled Clin Trials 1986;7:306-24.
6 Lau J, Antman EM, Jimenez-Silva J, Kupelnick B, Mosteller F, ChalmersTC. Cumulative meta-analysis of therapeutic trials for myocardial infarction.NEnglJMed 1992;327:248-54.
7 light RJ, Pillemer DB. Summing up: the science of reviewing research.Cambridge: MA: Harvard University Press, 1984.
8 Dickersin K, Berlin JA. Meta-analysis: state-of-the-science. Epidemiol Rev1992;14:154-76.
9 Bossel JP, Blanchard J, Panak E, Peyrieux JC, Sacks H. Considerations for themeta-analysis of randomized clinical trials. Controlled Clin Trials 1989;10:254-81.
10 Gelber RD, Goldhirsch A. Meta-analysis: the fashion of summing-upevidence. Ann Oncol 1991;2:461-8.
11 Mulrow CD. The medical review article: state of the science. Ann Intern Med1987;106:485-8.
12 Oxman AD, Guyatt GH. Guidelines for reading literature reviews. Can MedAssocj 1988;138:697-703.
13 Cooper HM, Rosenthal R. Statistical versus traditional procedures forsummarizing research findings. Psychol Bull 1980;87:442-9.
14 Antnan EM, Lau J, Kupelnick B, Mosteller F, Chalmers TC. A comparisonof results of meta-analyses of randomized control trials and recommenda-tions of clinical experts.JAMA 1992;268:240-8.
15 Cooper HM. The integrative research review: a systematic approach. BeverleyHills, CA: Sage Publications, 1984.
16 Glass GV. Primary, secondary, and meta-analysis of research. EducationalResearcher 1976;5:3-8.
Take afull drug histoty,asking particularly aboutrecent treatment withtiaprofenic acid, in anypatient presenting withunexplained chroniccystitis
Correspondence to:Dr Mayall.
BMY 1994;309:599-600
Lesson ofthe Week
Cystitis and ureteric obstruction in patients taking tiaprofenic acidFrederick G Mayall, RobertW Blewitt, William G Staff
Three cases of cystitis associated with tiaprofenic acid,a non-steroidal anti-inflammatory drug, have beenreported.' These patients recovered once the drug hadbeen stopped, and none came to any permanent harm.We have encountered eight additional cases. Severalof these patients had severe disease, which in one casewas life threatening.
Case reportsCASE 1
A 69 year old woman presented with intolerablypainful frequency and sterile haematuria. She had along history of arthritis and had taken tiaprofenic acidfor about two years. Intravenous urography showednormal upper tracts but she had a small contractedbladder with reddened friable mucosa on cystoscopy.Two months later she developed renal failure (bloodurea 39 mmol/l, creatinine 236 ,umol/l). An ultrasound
... .. .... ............i ...X; . e ; ...............zi .~~~~~~~~~~~~~~~~~~~~~~~~~~............. " .....
........... $ g|. .-X.>. .~~~~~~~~~~~~~~~~~~~~~~~~~~~~~~~~~~~~~~~~~~~~~~~~~~~~~~....... ...
~~~~~~~~~~~~~~~~~~~~~~~~. .: R........ x<w. ........: : ........ ..... ....... ..._
. e ,,- . ..... ..... .. ................' t .. .................................................... .....".
*~~~~~~~~~~~~~~~~~~~~~~~~~~~~~~~~~~~~~~~~~~~~~~~~~. .. .. ... .. ......: . . .+ ... .......,i.RU -:W ................................................. :R................... ....... ......
:'' .' .e .. . ' ';....._;',-; ':qW' ........................ ..................
49L . . e ........ - 5
Left: offcut ofureterfrom case 1 showing chronic inflammation reducing the lumen (arrowed) to a slit (haema-toxylin and eosin stain). Right: bladder mucosafrom case 1 showing chronic inflammation, epithelial spongi-osis, and (arrowed) intraepithelial eosinophils recognised by theirbilobar nuclei (haematoxylin and eosin stain).
examination showed bilateral ureteric obstruction andsevere hydronephrosis. At surgery both ureters werethickened over their entire length and she had acystectomy and ureteric diversion into an ileal conduit.The resected bladder was contracted and had athickened wall. Much of the epithelial surface wasulcerated and replaced by granulation tissue.
Histological examination showed a dense chronicinflammatory infiltrate in the lamina propria withprominent eosinophils. This extended into theepithelium with associated spongiosis and into themuscle of the bladder wall with associated fibrosis.Similar changes were seen in the ureteric off cuts,causing marked luminal stenosis (figure).
After the operation she stopped taking tiaprofenicacid and her renal function rapidly returned to normal.Several months later she developed haematuria and herrenal function deteriorated. She had started takingtiaprofenic acid again. She stopped the drug and herimpaired renal function and haematuria resolved.
CASE 2
A 65 year old woman presented with frequency andnocturia which had become increasingly severe over ayear. She had been taking tiaprofenic acid for morethan two years for arthritis. Intravenous urographyshowed dilated upper tracts. Cystoscopy showed asmall bladder with a friable "cobblestone" mucosa. Abladder biopsy showed prominent mucosal oedemaand a moderate chronic inflammatory infiltrate inthe lamina propria with frequent eosinophils. Theepithelium showed glandular metaplasia. Hersymptoms continued despite stopping the tiaprofenicacid, and a month later a cystectomy and a uretericdiversion into an ileal conduit were performed.Virtually all of the epithelium showed glandularmetaplasia, and eosinophils were abundant. There wasalso extension of the inflammation and fibrosis into themuscle of the bladder wall and into both ureterscausing severe luminal stenosis.
BMJ VOLUME 309 3 SEPTEMBER 1994 599

A Systematic Review of the ResearchLiterature on the Use of Phonics in theTeaching of Reading and Spelling
Carole J. Torgerson *Greg Brooks **Jill Hall *
* University of York** University of Sheffield
Research Report RR711
RESEARCH
Research Report No 711
A Systematic Review of the Research Literature on the Use of Phonics in the
Teaching of Reading and Spelling
Carole J. Torgerson *
Greg Brooks **
Jill Hall *
* University of York
** University of Sheffield
The views expressed in this report are the authors’ and do not necessarily reflect those of the Department for Education and Skills. © The University of Sheffield 2006 ISBN 1 84478 659 5

1
Contents
Page
List of Tables 3
List of Figures 3
The review team 4
Steering Group 4
Acknowledgements 4
Glossary 5
Executive summary 8
1. Introduction 12
2. Objectives: the review questions 12
3. Definitions 13
4. Previous research (1): narrative reviews 15
5. Previous research (2): The Ehri et al. (2001) systematic review and the Camilli et al. (2003) replication
16
6. The British context 19
7. The use of randomized controlled trials in effectiveness research 23
8. Methods 24
9. Results 27
10. Discussion 45
11. Conclusions 47
12. Recommendations 49
References 51
Appendix A: Extended definitions of synthetic phonics 54
Appendix B: Phonics �first, fast and only� 55

2
Appendix C: More details on the systematic review methods used 57
Appendix D: Search strategies for each database 62
Appendix E: Results of the searching and screening at first and second stages
63
Appendix F: Method of retrieval of the 20 included RCTs 63
Appendix G: Details of the 20 included RCTs 64
Appendix H: Abbreviations for Table 1 66
Appendix J: Data extraction tables for all studies included in the meta-analyses
67
Appendix K: Raw data 81

3
List of Tables
Page
Table 1: Characteristics of the included RCTs 30
Table 2: Quality assessment of the included RCTs
33
Table 3: Details of intervention instructional time
38
Table 4: Summary of findings, by research question, answer, quality of evidence, strength of effect, statistical significance, and implications for teaching
43
List of Figures
Page
Figure 1: Meta-analysis of 12 individually randomized trials
35
Figure 2: Main meta-analysis subdivided by learner characteristics 40
Figure 3: Main meta-analysis subdivided by ITT or no-ITT 41
Figure 4: Funnel plot of randomized trials from the systematic review of systematic phonics instruction, showing possible presence of publication bias
59
Figure 5: Funnel plot of updated review 60
Figure 6: Normal quantile plot of updated review 61

4
The review team
Director: Professor Greg Brooks, University of Sheffield
Principal Investigator: Carole Torgerson, Senior Research Fellow, University of York
Consultant Research Fellow: Jill Hall, University of York
Research Assistant: Allison Freeman, University of York
Independent Information Consultant: Kath Wright, York
Information Officer: Alison Robinson, University of York
Steering Group
Elif Aksit (DfES) (to June 2005)
Simon Brown (DfES)
Jenny Buckland (DfES) (from June 2005)
Liz Ison (DfES) (to June 2005)
Wendy Pemberton (National Strategies)
Katy Robinson (DfES)
Michele Weatherburn (DfES) (from June 2005)
Acknowledgements
The authors are very grateful to the other members of the review team: Kath Wright (who undertook the searches), Allison Freeman (who undertook data extraction and quality appraisal of some of the studies), and Alison Robinson (for proof-reading the report). We are also grateful to the members of the Steering Group who supported and advised us at each stage of the review with helpful comments and suggestions. The review was funded by the Department for Education and Skills.

5
Glossary Analytic phonics: A form of phonics teaching in which sounding-out is not used. Instead, teachers show children how to deduce the common letter and sound in a set of words which all begin (or, later, end) with the same letter and sound, e.g. pet, park, push, pen. *Attrition: Often participants are lost during a trial and cannot be included in the analysis. This is termed attrition or is sometimes known as mortality. *Bias: A term denoting that a known or unknown variable (rather than the intervention) is, or may be, responsible for an observed effect. Cluster randomized trial: In trials using this form of design the unit of allocation includes more than one individual, e.g. class, school. *Concealed allocation: This is where the researchers, participants and teachers are prevented from knowing in advance the allocation of an individual, i.e. the allocation has been concealed from them. *Confidence intervals: These indicate the level of uncertainty surrounding an effect size. The point estimate of effect of any intervention will always be imprecise. The level of the imprecision is dependent upon the sample size and event rate in the treatment groups. The use of confidence intervals (usually 95%, but sometimes 99% or 90%) reflects this imprecision in the study results. *CONSORT: Consolidated Standards for Reporting Trials is the methodological standard adopted by many medical journals for publication of randomized controlled trials. *Controlled trial (CT): This usually means a study with a control group that has been formed by means other than randomization. Consequently the validity of the study using this design is potentially threatened by selection bias. *Co-variates or confounders: These are variables that are associated with outcome. Randomization is the only method that ensures that both known and unknown co-variates are equally distributed among treatment groups. *Effect size: When an outcome variable is measured on a continuous scale (e.g. changes in a test score) the improvement or decrement is described in standard deviation units, which is termed the effect size. *Funnel plot: A method of assessing whether there is any publication bias. The effect size of each study is plotted against its sample size. Small studies will have large random variations in their effect sizes, which will be scattered along the x-axis close to the bottom of the y-axis. Larger studies will be higher up on the y-axis and less scattered along the x-axis. A review with no publication bias will show a plot in the shape of an inverted funnel. Heterogeneity: When studies have different characteristics, e.g. different populations or different outcome measures.

6
*ITT analysis: Intention to teach analysis: This is where all participants are analysed in their original randomized groups; it is the most robust analytical method. Once participants have been allocated to their respective groups it is important that they remain in those groups for analysis, to avoid bias. A common, but incorrect, method is to exclude some participants after randomization for a variety of reasons. One approach is to do what is termed �an on-treatment analysis� � this is where only those participants who demonstrate treatment fidelity are included in the analysis. Unfortunately, this can lead to bias, as those participants who complete treatment are likely to be different from those who do not. Intervention-received analysis can therefore produce a biased result. Intra-cluster correlation (ICC): The statistical correlation between members of the same group (e.g., pupils in the same class). Meta-analysis: A meta-analysis is a method of combining the results of two or more RCTs statistically. Meta-analysis: fixed effects model: The fixed effects model of meta-analysis assumes that the variability is exclusively because of random sampling variation around a fixed effect. Meta-analysis: random effects model: The random effects model of meta-analysis assumes a different underlying effect for each study, and takes this into consideration. Normal quantile plot: A graphical method of assessing possible publication bias (as well as assessing whether the observed data fall within a normal distribution and whether or not the studies come from a single population). The observed effect sizes are plotted against the effect sizes in a normal distribution. If there is an indication of publication bias there will be a gap in the curve around zero. Onset-rime: A form of phonics teaching in which sounding-out is not applied (at least not in the early stages) to every letter but just to the initial consonant, and then the remainder of the word as a unit, for example �kuh � at� � �cat�. Phonics instruction: A set of approaches to the initial teaching of reading and writing which focus on the relationships between letters and sounds. *Publication bias: Not all RCTs are published. There is a well-established tendency for trials that produce negative or null effects to be less likely to be published than positive trials. Unless a systematic review includes these negative trials it can give a misleading optimistic assessment of the intervention. Existence of publication bias can be detected by using funnel plots. *Randomized Controlled Trial (RCT): This is where two or more groups have been formed through random allocation (or a similar method). This is the only method that ensures that selection bias is eliminated at baseline. *Regression to the mean: This statistical phenomenon occurs when test results are, by chance, some distance away from the mean. Consequently at post-testing the �extreme� results will tend to regress to the mean. When selecting participants on extreme test results (e.g. very poor pre-tests) there will be an apparent dramatic improvement on post-test because of this effect (irrespective of the teaching method). Randomization automatically controls for

7
regression to the mean effects. Nevertheless, it can still have an influence if the groups are unbalanced at baseline on pre-test scores. This imbalance can be adjusted for by a multivariate analysis. *Sample size calculations: Trials in educational research commonly exhibit a Type II error. This is where the sample size is insufficient to show, as statistically significant, a difference that is educationally important. Reviews of educational interventions have shown that most interventions will, at best, only lead to an improvement in the region of half a standard deviation and quite often somewhat less. Statistical theory shows that to reliably detect (with 80% power) half a standard deviation difference as statistically significant (p = 0.05) for a normally distributed variable requires a minimum sample size of 126 participants between the two arms. Studies that are smaller than this risk erroneously concluding that there was not a significant difference when actually there was. Therefore, a good quality study ought to describe the reasoning behind the choice of sample size. *Standard deviation: is a measure of spread or dispersion of continuous data. A high standard deviation implies that the values are widely scattered relative to the mean value, whilst a small value implies the converse. Synthetic phonics: A form of phonics teaching in which sounding-out is used. For reading, this is based on the letters in printed words and is followed by blending their sounds to produce a spoken word which the learner should recognise. The classic example is �kuh � a � tuh� � �cat�. For writing, sounding-out is based on a spoken word which the learner knows and is followed by writing the corresponding letter for each sound. Systematic review: A review where explicit methods have been used to identify, select and include studies fitting pre-specified criteria. * Definitions reproduced from Torgerson (2003, pp.vii-x)

8
EXECUTIVE SUMMARY Introduction The Department for Education and Skills (DfES) commissioned the Universities of York and Sheffield to conduct a systematic review of experimental research on the use of phonics instruction in the teaching of reading and spelling. This review is based on evidence from randomised controlled trials (RCTs). Key findings The effect of phonics on reading: • Systematic phonics instruction within a broad literacy curriculum was found to have a
statistically significant positive effect on reading accuracy. • There was no statistically significant difference between the effectiveness of systematic
phonics instruction for reading accuracy for normally-developing children and for children at risk of reading failure.
• The weight of evidence for both these findings was moderate (there were 12 randomized controlled trials included in the analysis).
• Both of these findings provided some support for those of a systematic review published in the United States in 2001 (Ehri et al., 2001).
• An analysis of the effect of systematic phonics instruction on reading comprehension was based on weak weight of evidence (only four randomized controlled trials were found) and failed to find the statistically significant positive difference which was found in the previous review.
The effect of synthetic and analytic phonics (see definitions below): • The weight of evidence on this question was weak (only three randomized controlled trials
were found). No statistically significant difference in effectiveness was found between synthetic phonics instruction and analytic phonics instruction.
The effect of phonics on spelling: • The weight of evidence on this question was weak (only three randomized controlled trials
were found). No effect of systematic phonics instruction on spelling was found. Definitions Phonics instruction: Literacy teaching approaches which focus on the relationships between letters and sounds. Synthetic phonics: The defining characteristics of synthetic phonics for reading are sounding-out and blending. Analytic phonics: The defining characteristics of analytic phonics are avoiding sounding-out, and inferring sound-symbol relationships from sets of words which share a letter and sound, e.g. pet, park, push, pen. Systematic phonics: Teaching of letter-sound relationships in an explicit, organised and sequenced fashion, as opposed to incidentally or on a �when-needed� basis. May refer to systematic synthetic or systematic analytic phonics.

9
Aims of the review The review investigated how effective different approaches to the initial teaching of reading and spelling are in comparison to each other. The review questions were: How effective are different approaches to phonics teaching in comparison to each other (including the specific area of analytic versus synthetic phonics)? How do different approaches impact on the application of phonics in reading and writing, including beyond the early years? Is there a need to differentiate by phonics for reading and phonics for spelling? What proportion of literacy teaching should be based on the use of phonics? Background Phonics teaching is a much debated area of literacy teaching. The National Literacy Strategy (NLS) (DfEE, 1998) recommended a mixed approach that included an element of phonics instruction, but it has been argued that such an approach might lead to confusion among young children, and that phonics should be the predominant method of word identification they are taught. However, there is disagreement as to which method of phonics teaching is most effective. A method of resolving uncertainty between different approaches to teaching is to conduct a randomized controlled trial (RCT). An RCT is where two or more groups of children are formed randomly and each group receives a different form of instruction. If one group makes significantly better progress it can be inferred that the form of teaching they received was more effective, because all other factors which might influence the outcome are controlled for (with the exception of chance). Methods Systematic review methods were used throughout this review. That is, as far as possible all relevant RCTs were identified and included. Non-systematic reviews may give misleading results if it is not clear why some studies were included and others were not, and may be subject to reviewer bias. The only two previous systematic reviews in this field were published in the United States (Ehri et al., 2001; Camilli et al., 2003). The present review updated the previous reviews, broadened the sources of information which were searched, and adopted more rigorous criteria for identifying relevant studies. The studies included were RCTs which focused on the use of phonics instruction in English, in order to ensure a fair comparison between the effectiveness of systematic phonics and of alternative approaches to reading instruction. Data were extracted from each included RCT and put into a meta-analysis1.
1 A meta-analysis is a method of combining the results of two or more RCTs statistically. In educational research the method is particularly helpful as many educational RCTs are too small to identify possibly

10
Findings The review identified a total of 20 RCTs, of which only one was UK-based (Johnston and Watson, 2004, experiment 2). All were concerned with the initial teaching of reading (and, in a few cases, spelling); the children studied were mostly between five and seven years of age, but four of the trials included children up to age 11. The current review found that systematic phonics teaching was associated with better progress in reading accuracy. This effect was seen across all ability levels. However, the weight of evidence (from RCTs) on reading comprehension was weak, and no significant effect was found for reading comprehension. The review found no evidence for the superiority of either synthetic or analytic phonics instruction over the other � but there were only three small RCTs on which to base this comparison. Similarly, phonics instruction did not appear to affect progress in spelling, but again there were only three relevant RCTs. Therefore, this does not provide strong evidence for or against the use of phonics in the teaching of spelling. It was not possible to analyse how different approaches impacted on the application of phonics in reading and writing beyond the early years because only three RCTs used follow-up measures. Conclusions Systematic phonics instruction within a broad literacy curriculum appears to have a greater effect on children�s progress in reading than whole language or whole word approaches. The effect size is moderate but still important. However, there is still uncertainty in the RCT evidence as to which phonics approach (synthetic or analytic) is most effective. Recommendations For teaching • Systematic phonics instruction should be part of every literacy teacher�s repertoire and a
routine part of literacy teaching. • Teachers who already use systematic phonics in their teaching should continue to do so. • Teachers who do not use systematic phonics in their teaching should add it to their routine
practices. • Systematic phonics should be used with both normally developing children and those at
risk of failure. However, • There is currently no strong RCT evidence that any one form of systematic phonics is
more effective than any other. • There is also currently no strong RCT evidence on how much systematic phonics is
needed.
significant differences between groups. By combining several small studies it is possible to identify moderate but important effects.

11
• Two other areas on which the existing research base is insufficient are whether or not phonics teaching boosts comprehension, and whether phonics should be used to teach spelling as well as reading.
For teacher training • The evidence that systematic phonics teaching benefits children�s reading accuracy further
implies that learning to use systematic phonics in a judicious balance with other elements should form part of every literacy teacher�s training.
For research • A large UK-based cluster-randomized controlled trial would enable further investigation
of the relative effectiveness of systematic synthetic versus systematic analytic phonics instruction with children with different learning characteristics.
12
1. Introduction
How best can children be enabled to learn to read and write? Views on this perennial and
important question differ, and disagreements are sometimes passionate, especially over the
place in the reading curriculum of phonics, that is, approaches which focus on the
relationships between letters and sounds.
In early 2005, the Department for Education and Skills (DfES) commissioned the Universities
of York and Sheffield to conduct a systematic review of experimental research on the use of
phonics instruction in the teaching of reading and spelling. It builds on a systematic review
conducted in the United States by the National Reading Panel�s phonics subgroup (Ehri et al.,
2001), which concluded (p.393) that �systematic phonics instruction helped children learn to
read better than all forms of control group instruction�. An updating of that review was
especially relevant in 2005 because of the publication of the first relevant British experiment
(Johnston and Watson, 2004, experiment 2). This review is based on evidence from
randomised controlled trials (RCTs).
2. Objectives: The review questions
The main research question for the review was:
How effective are different approaches to phonics teaching in comparison to each
other (including the specific area of analytic versus synthetic phonics)?
Supplementary questions were:
How do different approaches impact on the application of phonics in reading and
writing, including beyond the early years?
What proportion of literacy teaching should be based on the use of phonics?
Is there a need to differentiate by phonics for reading and phonics for spelling?

13
3. Definitions
An overall definition of phonics as �approaches which focus on the relationships between
letters and sounds� appears to be generally accepted. However, definitions of synthetic and
analytic phonics are varied and contested. Therefore, the authors of this review adopted the
rigorous definitions outlined by Brooks (2003). Since these incorporate two technical terms,
those terms are defined first:
Phoneme: A distinctive speech sound, that is, one which makes a difference to the
meaning of a word. For example, the initial phonemes in bat, pat are /b, p/.
Grapheme: A letter or combination of letters used to spell a phoneme, for example the
letters <p, sh> spelling the phonemes /p, ∫/ in push.
Brooks� definitions (Brooks, 2003, pp.11-12), which were in turn based on those of Strickland
(1998, p.31), were as follows:
Synthetic phonics refers to an approach to the teaching of reading in which the
phonemes associated with particular graphemes are pronounced in isolation and
blended together (synthesized). For example, children are taught to take a single-
syllable word such as cat apart into its three letters, pronounce a phoneme for each
letter in turn /k, æ, t/, and blend the phonemes together to form a word. Synthetic
phonics for writing reverses the sequence: children are taught to say the word they
wish to write, segment it into its phonemes and say them in turn, for example /d, ɒ, g/,
and write a grapheme for each phoneme in turn to produce the written word, dog.
Analytic phonics refers to an approach to the teaching of reading in which the
phonemes associated with particular graphemes are not pronounced in isolation.
Children identify (analyse) the common phoneme in a set of words in which each
word contains the phoneme under study. For example, teacher and pupils discuss how
the following words are alike: pat, park, push and pen. Analytic phonics for writing
similarly relies on inferential learning: realising that the initial phoneme in /pɪg/ is the
same as that in /pæt, pɑːk, pʊ∫/ and /pen/, children deduce that they must write that
phoneme with grapheme <p>.
14
The definitions of synthetic and analytic phonics for reading used by the US National
Reading Panel (see Ehri et al., 2001, p.395) were essentially equivalent to the relevant parts of
those just given:
Synthetic phonics programs use a part-to-whole approach that teaches children to
convert letters into phonemes (e.g., to pronounce each letter in stop, /s/-/t/-/ɑ/-/p/)
[N.B. The correspondence of letter <o> to phoneme /ɑ/ is correct for many US
accents] and then to blend the phonemes into a recognizable word. Analytic phonics
uses a whole-to-part approach that avoids having children pronounce sounds in
isolation to figure out words. Rather children are taught to analyze letter-sound
relations once the word is identified. For example, a teacher might write the letter P
followed by several words, put, pig, play, pet. She would help students read the words
and recognize that they all begin with the same sound that is associated with the letter
P.
Brooks� definitions have been adopted here because they focus on the defining and distinctive
characteristics of each approach. They were applied to all the studies included in the analyses
in this review. Other definitions of synthetic phonics in particular incorporate several other
features; see Appendix A for a discussion of these, including why they were not adopted.
15
4. Previous research (1): Narrative reviews
The first significant research-based contribution on the role of phonics in initial instruction
was Jeanne Chall�s Learning to Read: The Great Debate (1967). The existing research
literature was reviewed comprehensively, and a series of observations were conducted in
classrooms, including some in Britain. The research concluded that, across many studies and
learners:
• phonics enables children to make faster progress than no phonics;
• code-emphasis approaches (i.e. phonics and onset-rime2) enable children to make faster
progress than meaning-emphasis approaches (i.e. whole-word and whole-language
approaches, including look-and-say);
• phonics plus an emphasis on the meaningfulness of the texts being read enables children
to make faster progress than phonics alone; and
• synthetic phonics enables children to make faster progress than analytic phonics.
Similar conclusions were reached by Bond and Dykstra (1967) and Pflaum, Walberg,
Karegianes and Rasher (1980). During an update, Chall (1989) saw no reason to alter her
conclusions, and indeed considered them strengthened by additional evidence that had
accumulated. Chall�s work and the other reviews mentioned above were cited by Marilyn
Jager Adams (1990) in the second significant book on the question, which reached the same
conclusions.
However, all the studies mentioned above were narrative reviews. Narrative reviews rely
very heavily on the reviewers� judgments and are liable to be influenced by their
preconceived ideas. One of the strong motives for the growing interest in and popularity of
systematic reviews is precisely that they offer a less subjective and more methodical way of
arriving at conclusions. A systematic review is a review where explicit methods have been
used to identify, select and include studies fitting pre-specified criteria, in order to minimise
bias in the review.
2 For a definition of onset-rime, see the Glossary

16
5. Previous research (2): The Ehri et al. (2001) systematic review and
the Camilli et al. (2003) replication
Ehri et al. (2001) was one of two systematic reviews of this field undertaken prior to this
review (the second was the Camilli et al., 2003 replication, discussed below). The aim of the
Ehri et al. (2001) review was to search for, retrieve and synthesize the experimental research
base since 1970 for evidence of the relative effectiveness of systematic phonics instruction,
unsystematic phonics instruction, and reading instruction without a phonics element. Another
aim was to assess the evidence for differential effects depending on different characteristics of
learners, for example age or grade level, and attainment level (normally-attaining children or
those experiencing difficulties or disabilities in learning). Ehri et al. (2001) found 38 studies
which met their inclusion criteria, and used the results of those studies in a meta-analysis3.
The meta-analysis found an overall statistically significant positive effect size for phonics
instruction on reading of 0.414. This effect size was reasonably strong, and would mean 16
more children out of 100 would succeed on a standardized reading accuracy test with a mean
of 50% than children who did not receive systematic phonics � see Torgerson, 2003, p.86.)
Ehri et al. concluded:
Systematic phonics instruction helped children learn to read better than all forms of
control group instruction, including whole language. In sum, systematic phonics
instruction proved effective and should be implemented as part of literacy programs to
teach beginning reading as well as to prevent and remediate reading difficulties. (Ehri
et al., 2001, p.393).
Of Chall�s four conclusions mentioned above, Ehri et al. (2001) provided renewed support
only for one, which can be restated as:
• systematic phonics instruction (of whatever variety) enables children to make faster
progress than unsystematic or no phonics
3 This is a statistical method for combining the results of several studies so that any finding is based on a larger sample and should be more robust than if derived from just a few studies. 4 Effect sizes are a way of indicating the impact of an intervention that is independent of the particular test or other measure used, and they can therefore be used to compare different interventions.

17
where �systematic� implies an organised and structured teaching programme rather than an
approach where phonics is introduced incidentally and occasionally. Their analyses yielded
no significant evidence to support Chall�s other conclusions.
More recently, however, the original meta-analysis was replicated (Camilli et al., 2003) using
the same 38 studies as in the original analysis, plus an additional three with phonemic
awareness outcomes, and minus one that did not have a �no treatment� control group. In the
re-analysis, data were extracted from the 40 studies with specific regard to the treatment
characteristics, namely the �degree� of phonics or �mixture� of phonics with other literacy
activities, and whether the different conditions received �equal study� time (Camilli et al.,
2003, pp.8, 23). The researchers compared systematic phonics instruction with the full range
of treatment controls.
They reported a reduced effect size of 0.24 (i.e. approximately 10 extra children out of 100
would succeed on a relevant test) for the comparison between �systematic� and �less
systematic� phonics instruction, and concluded that �the advantage of systematic phonics
instruction over some phonics instruction is significant but cannot be clearly prioritized over
other influences on reading skills� (Camilli et al., 2003, p.30). Using a statistical model called
regression analysis they also showed that tutoring and whole language-based reading
activities had similar effect sizes to systematic phonics instruction (effect sizes of 0.39 and
0.29 respectively; approximately 16 and 12 extra children respectively out of 100 succeeding
on a relevant test). This re-analysis suggested that phonics instruction had value, but so did
other teaching approaches, and that the research findings would not justify exclusive use of
any one approach; indeed, a judicious balance incorporating phonics and other approaches
might be justified.
Methodological limitations of the Ehri et al. (2001) review
In terms of standard, rigorous systematic review procedure (see Torgerson, 2003, and
references given there), the Ehri et al. (2001) review had several limitations which the present
review aimed to avoid:
• Its results may have suffered from the effects of publication bias because only trials
published in peer-reviewed academic journals were included, and trials not so published
were not. There is evidence (Torgerson, 2003, chapter 6) that experiments with negative

18
or null results are more likely to be rejected by the editors of academic journals. In the
Ehri et al. (2001) review this may have resulted in an over-estimate of effect if any
relevant �unpublished� trials had such results. This is because if null or negative studies
exist but remain unpublished, locating them and including them in a meta-analysis may
reduce the overall effect. In this context, �published� has the special meaning �published
in a peer-reviewed academic journal�, so �unpublished� trials in the corresponding sense
are not necessarily inaccessible � they may exist as conference papers or dissertations, for
example, and therefore appear in databases � and should be searched for and included if
relevant and of sufficient quality; the present reviewers did this. For further detail on
publication bias see Appendix C.
• The Ehri et al. (2001) review included both randomized and non-randomized controlled
trials. The problem with this approach, and the reasons for using only randomized trials in
this review, are given in section 7.
• In the Ehri et al. review a total of 66 comparisons from the 38 trials were included. Given
that each trial had only one control group, this means that the children in many of the
control groups were counted more than once. Double- (and in one case quadruple-)
counting of the control groups in comparisons to calculate effect sizes would therefore
have had the effect of artificially increasing the sample size by counting the control group
sample twice and, in turn, spuriously increasing the precision of the estimated effect. Ehri
et al. (2001, p.340) acknowledged that their effect sizes were �not completely independent
across comparisons�. This means that their findings may be an overestimate of the �true�
effect. In the current review each control group was counted only once.
• In Ehri et al.�s review (2001), there was some indication of heterogeneity (dissimilarity in
samples and/or teaching approaches) between studies. In the current review this issue is
explored in the analysis section.
• Although Ehri et al. (2001) examined the methodological quality of the included trials,
they did not investigate this in a systematic way. The current review includes an appraisal
of the quality of individual trials.
• Finally, Ehri et al. (2001) only included trials comparing a phonics intervention with a no-
phonics or unsystematic intervention, and in particular did not compare synthetic and
analytic phonics approaches. They excluded five controlled and randomized controlled
trials which evaluated the relative effectiveness of synthetic versus analytic phonics
instruction. The current review includes an analysis of this topic.
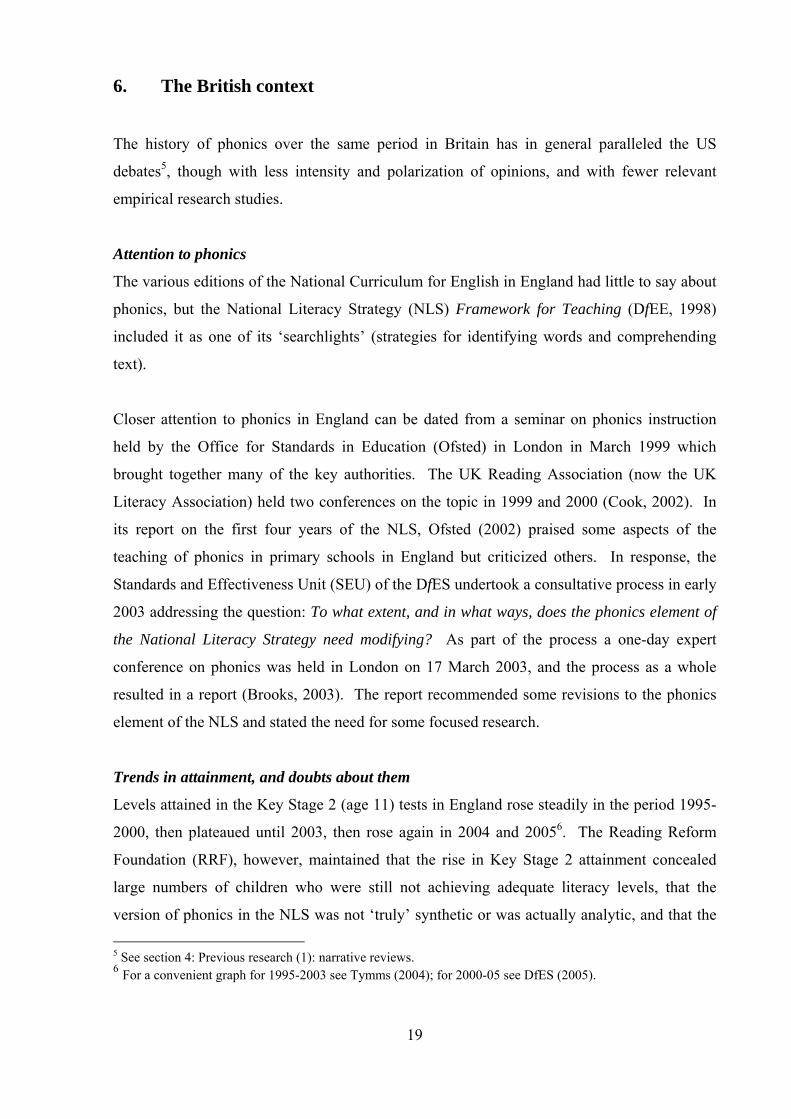
19
6. The British context
The history of phonics over the same period in Britain has in general paralleled the US
debates5, though with less intensity and polarization of opinions, and with fewer relevant
empirical research studies.
Attention to phonics
The various editions of the National Curriculum for English in England had little to say about
phonics, but the National Literacy Strategy (NLS) Framework for Teaching (DfEE, 1998)
included it as one of its �searchlights� (strategies for identifying words and comprehending
text).
Closer attention to phonics in England can be dated from a seminar on phonics instruction
held by the Office for Standards in Education (Ofsted) in London in March 1999 which
brought together many of the key authorities. The UK Reading Association (now the UK
Literacy Association) held two conferences on the topic in 1999 and 2000 (Cook, 2002). In
its report on the first four years of the NLS, Ofsted (2002) praised some aspects of the
teaching of phonics in primary schools in England but criticized others. In response, the
Standards and Effectiveness Unit (SEU) of the DfES undertook a consultative process in early
2003 addressing the question: To what extent, and in what ways, does the phonics element of
the National Literacy Strategy need modifying? As part of the process a one-day expert
conference on phonics was held in London on 17 March 2003, and the process as a whole
resulted in a report (Brooks, 2003). The report recommended some revisions to the phonics
element of the NLS and stated the need for some focused research.
Trends in attainment, and doubts about them
Levels attained in the Key Stage 2 (age 11) tests in England rose steadily in the period 1995-
2000, then plateaued until 2003, then rose again in 2004 and 20056. The Reading Reform
Foundation (RRF), however, maintained that the rise in Key Stage 2 attainment concealed
large numbers of children who were still not achieving adequate literacy levels, that the
version of phonics in the NLS was not �truly� synthetic or was actually analytic, and that the 5 See section 4: Previous research (1): narrative reviews. 6 For a convenient graph for 1995-2003 see Tymms (2004); for 2000-05 see DfES (2005).

20
searchlights model continued to legitimize lack of attention to phonics relative to, for
example, working words out from context or illustrations (see Chew, 2005 and the RRF
Newsletter, passim). The RRF advocates �synthetic phonics first, fast and only�, and this
review was partly designed to investigate whether research supports exclusive use of synthetic
phonics (or any other variety) at a rapid pace from children�s entry into school. The RRF�s
policy and (largely) the dearth of research supporting it are discussed in detail in Appendix B.
Recent British research
In 2004, two British studies were published which used experimental methods to investigate
the relative effectiveness of different varieties of systematic phonics instruction (Johnston and
Watson, 2004; Hatcher et al., 2004).
The Clackmannanshire research (Johnston and Watson, 2004) contained two studies.
Experiment 1 was conducted in 1997-2004, but only the first four years were reported in the
article cited. The study compared a synthetic phonics group with two analytic phonics groups
(one of which also received phonemic awareness training designed to help children
distinguish phonemes7 in spoken words), and found an advantage for the synthetic phonics
group � but this group had received teaching at a faster pace than the others, which meant the
comparison was not entirely valid. Experiment 2 (conducted in 1995-96) equalized this
variable by teaching all classes at the same pace; here the three groups were synthetic
phonics, analytic phonics and no phonics. An advantage was found for the synthetic phonics
group in this study too.
In Experiment 1 the groups (whole classes) were allocated to conditions by the researchers on
the basis of indices of deprivation: they allocated the classes which were, on average, most
�deprived� to the synthetic phonics condition, in order to make it more difficult for any
advantage this group showed to be attributed to their having had a head start. However, this
may imply that part of the greater progress of the synthetic phonics group was due to
regression to the mean. This is a statistical artefact whereby the lowest or highest scorers in a
group on a first test occasion are likely to be nearer the overall mean of the group on the
second testing, due to error of measurement effects. In the relevant Clackmannanshire study
7 See Section 3: Definitions.

21
this was a design fault, since it means that part of the synthetic phonics group�s greater
progress was probably illusory.
The fact that in Experiment 1 the classes were allocated to conditions by the researchers also
means that it was a controlled trial, not a randomized trial. As this review only included
studies using the more robust design using randomization, Experiment 1 was excluded.
However, in Experiment 2 children were allocated to conditions at random (Rhona Johnston,
personal communication, April 2005), and that study was therefore an RCT and was included
in the analyses in this review.
In the latest of their ongoing series of studies in Cumbria, Hatcher et al. (2004) investigated
whether adding various extra phonic activities to a teaching sequence which already included
synthetic phonics would benefit children relative to that teaching sequence alone. The
teaching began when the children were aged four and a half on average, and lasted for five
terms. The children were assessed with a battery of tests at the outset and at three points
during the experiment. The study began with 524 children in 20 classes, one in each of 20
schools. The classes were allocated to one of four groups matched on pre-test scores, five
classes per group, and the groups were then randomly allocated to one of three interventions
or to the control. A total of 114 children were lost to the study for various reasons, so that
data at the four time points were available for 410. Hatcher et al. reported some analyses for
the whole of this sample, but mainly on two sub-samples: normally developing children (n =
273), and children at risk of reading failure (n = 137). The latter sub-sample was defined as
�the poorest third of children based upon the[ir] average [pre-test] scores p.340). The authors
concluded:
�There were no selective effects of the different experimental teaching programmes for
normally developing children. However, for those children identified as being at risk
of reading failure, training in phoneme skills resulted in selective gains in phoneme
awareness and in reading skills� A reading programme that contains a highly
structured phonic component is sufficient for most 4.5-year-old children to master the
alphabetic principle and to learn to read effectively, without additional explicit
phonological training. In contrast, for young children at risk of reading delay,
additional training in phoneme awareness and linking phonemes with letters is
beneficial.� (p.338)

22
The Hatcher et al. (2004) study was not included in the analyses in this review because it
compared different versions of synthetic phonics; hence it could not validly be analysed
together with studies comparing systematic phonics (of whatever variety) with unsystematic
or no phonics instruction.
Political attention
Recently the teaching of reading, and especially phonics, has attracted political attention. The
House of Commons Select Committee on Education and Skills held an enquiry into teaching
children to read in late 2004-early 2005; its report appeared in the Spring of 2005.
Subsequently, the British Government announced (3 June 2005) the setting up of the Rose
Review, which would concentrate on good practice in the teaching of reading, including good
practice in the use of phonics, and report in early 2006; and (26 July 2005) a large set of
phonics pilot projects to begin in the Autumn term of 2005.
The history of this area in the last few years has therefore been one in which phonics has
become a topic of lively educational debate in Britain; hence the need for an independent and
objective review of the research literature.

23
7. The use of randomized controlled trials in effectiveness research
The most robust method of assessing whether an intervention is effective or not is the
randomized controlled trial (RCT). This is because, if participants are allocated on any other
basis, one cannot be sure whether (except for chance differences) the experimental and
control groups were similar before receiving or not receiving the intervention, and it therefore
becomes impossible to disentangle the effects of the intervention from the characteristics of
the people allocated to it. Techniques can be used to attempt to control for potential
confounding from known variables, but they cannot adjust for unknown variables.
The two main reasons for using random allocation are to avoid regression to the mean effects8
and to avoid selection bias. Forming comparison groups using random allocation deals with
regression to the mean as it affects both groups equally and the effect is cancelled out.
Selection bias occurs when the groups formed for comparison have not been created through
random allocation and when the two groups formed are different in some way that can affect
outcomes.
The Ehri et al. (2001) meta-analysis included 38 studies, of which only 13 were randomized
controlled trials, and the other 25 were non-randomized controlled trials. The problem with
including both types of trial in a meta-analysis is that pooling two study types can lead to a
biased result, because non-randomized trials by definition cannot control for unknown sources
of difference between groups. Whilst the apparent precision of the estimate may increase (i.e.
small confidence intervals around the effect size), the estimate itself may be incorrect. For
this reason, in the current review only randomized trials were included.
8 For definition see Glossary

24
8. Methods
Systematic review methods as outlined in Torgerson (2003) were used throughout the conduct
of the current review.
(This section includes only the details essential to understanding the way in which the results
in the next section were obtained. For other technical matters, namely screening, quality
assurance, data extraction, calculation of effect sizes, estimation of publication bias, and
statistical evidence of study heterogeneity, see Appendix C.)
Locating the trials
The starting point in identifying trials for potential inclusion in this review was the 13 RCTs
included in Ehri et al. (2001). Of these, nine compared systematic synthetic phonics
instruction with unsystematic or no phonics teaching, two compared systematic analytic
phonics instruction with no-phonics controls, and two compared other phonics interventions
with no-phonics controls.
In order to locate any further potentially relevant published or unpublished randomized
controlled trials a number of searches were undertaken. The original searches carried out by
Ehri et al. (2001), covering the Education Resources and Information Center (ERIC) and
PsycINFO (psychological literature) databases of research studies, were replicated, updated to
2005, and extended to capture unpublished trials. Three extra databases were searched:
SIGLE, ASSIA and BEI (see Appendix D for details of these, and for the search strategies for
each database).
The reviewers also wrote to Linnea Ehri to request bibliographic details of (a) the five
published studies excluded from the original review because they compared instruction in
synthetic phonics and instruction in analytic phonics; (b) the studies they identified but
excluded because they were unpublished; and (c) any studies the reviewers knew of that
should be included in the update (the last request was also sent to Camilli).
Inclusion criteria
Trials with the following characteristics were included:

25
• randomized controlled trials focusing on the teaching of phonics in English, and
comparing either:
(a) the effectiveness of instruction using systematic phonics with that of
instruction providing unsystematic phonics instruction, or no phonics
instruction (but where the control condition included some alternative reading
instruction9); or
(b) the effectiveness of synthetic phonics instruction compared with analytic
phonics instruction.
and
• trials that measured reading as an outcome, reported statistics permitting the
calculation or estimation of effect sizes, and involved interventions that might be
found in schools.
Exclusion criteria
Trials were excluded if they:
• were not randomized controlled trials;
• did not evaluate either the relative effectiveness of systematic synthetic or analytic
phonics instruction or some other form of systematic phonics instruction versus no
phonics instruction (but an alternative reading instruction);
• were �short-term laboratory studies with a limited focus� (Ehri et al., 2001), e.g. a study in
a psychology laboratory lasting for a few hours;
• lacked reading as an outcome;
• lacked statistics allowing calculation or estimation of effect sizes;
• primarily investigated phonemic awareness instruction or phonological awareness
instruction (such studies were also excluded in Ehri et al., 2001); or
• compared two or more kinds of synthetic phonics instruction.
Calculation of effect sizes
For all the trials included in this review, effect sizes were calculated based on a mean of
reading accuracy, a mean of reading comprehension (where applicable) and a mean of
spelling (where applicable). Where possible standardized test results were used;
experimenter-devised tests were used only where there was no alternative standardized test.
9 This was not always the case in the Ehri et al. (2001) review, as described by Camilli et al. (2003).

26
In a few cases test results could not be included because both groups were at floor in the
outcomes measured (had scores close to or at zero) or because the standard deviation was
larger than the mean which indicated the data were extremely skewed (this applied to Lovett
et al. (1990) third and fourth reading accuracy tests, and to Skailand (1971) second post-test).
Too few studies used vocabulary measures to usefully pool the data. In addition, too few
studies included follow-up assessments to usefully pool the data.
Meta-analyses
Two principal meta-analyses were undertaken:
• Systematic phonics instruction versus alternative reading interventions: whole
language/whole word (‘look-and-say’)
• Synthetic phonics instruction versus analytic phonics instruction.
For the first of these meta-analyses, the comparators for the calculation of effect sizes were
interventions using systematic phonics instruction (of any kind) compared with control groups
using unsystematic or no phonics instruction, but using some kind of systematic reading
instruction (e.g. whole word or whole language). For the second of these meta-analyses, the
comparators for the calculation of effect sizes were interventions using systematic synthetic
phonics instruction compared with interventions using systematic analytic phonics instruction.

27
9. Results
Searching and screening
The results of the searches and the first and second stages of screening are presented in
Appendix E. De-duplication of the results from the electronic searches was done
hierarchically in this order: Ehri et al., PsycINFO, ERIC, ASSIA, BEI, SIGLE.
A total of 6114 potentially relevant studies were identified through the searching of the five
electronic databases, through contact with the author, and through searching the Ehri et al.
review. After the first screening, 101 potentially relevant papers were identified. One paper
was unobtainable. The other 100 papers were then re-screened according to the pre-
established inclusion criteria and definitions of synthetic and analytic phonics instruction.
Included studies
A total of 20 RCTs (in 19 papers) were included at the second stage. Despite searching
exhaustively in the grey literature databases only one unpublished RCT (Skailand, 1971) was
found. Details of the method of retrieval of the included studies are given in Appendix F, and
details of the interventions and control treatments of all the included studies, and the
comparisons relevant to the review, are given in Appendix G.
Excluded studies
One of the trials included in the Ehri et al. (2001) meta-analysis (Gittelman and Feingold,
1983) was excluded from this review because it did not contain a phonics instruction
intervention group. Although this paper stated that one of the interventions was �motivated
reading remediation�following the principles of the phonics method� (Gittelman and
Feingold, 1983, p.170), it also stated that �wherever possible, whole word recognition was
introduced to enable the development of smooth, efficient, rapid reading and to avoid over-
reliance on phonetic word analysis.� Clearly this intervention was not systematic phonics
instruction. Indeed it closely resembled some of the unsystematic phonics instruction or no
phonics instruction conditions used in the Ehri et al. analysis as comparators to systematic
phonics instruction.
A second trial from the Ehri et al. (2001) review was excluded (Mantzicopoulos et al., 1992)

28
because the control condition was not an appropriate comparison as the children did not
receive a reading intervention: �TEACH does not provide direct reading instruction to
vulnerable readers� (p.574). In addition, this trial suffered from huge attrition. A total of 437
�at risk� kindergarten children were randomized (p.575), but �only 168 children with complete
scores were still in the intervention study at the end of second grade� (p.576), an attrition rate
of 269 or 62%. However, the authors claimed an attrition rate of 280 (p.582) and in the
results table (Table 4, p.582) the total n = 87. Clearly this study should have been excluded
on two grounds: lack of an appropriate control group, and huge attrition leading to likely
attrition bias. The authors discussed these problems at length in the paper (p.582).
The other 79 papers were excluded because they were not RCTs or because they did not
include a systematic phonics instruction treatment group and an appropriate control group
(where pupils were given reading instruction involving non-systematic or no phonics
instruction).
Publication bias
On the basis of the included trials, some evidence of publication bias was detected (see
Appendix C). If trials with null or negative results exist but were not accessible even through
the grey literature, this would imply that the estimated effect sizes derived in all the meta-
analyses reported below may be too large. This should reinforce the need for caution in
interpreting them.
Main analysis
Of the 20 trials included at the second stage, six were excluded from the main meta-analysis
(systematic phonics v. unsystematic or no phonics) because the experimental treatments were
different varieties of systematic phonics instruction (e.g. synthetic phonics instruction versus
onset-rime phonics instruction), and the control groups did not receive any comparable
reading instruction (Fayne and Bryant, 1981; Lovett and Steinbach, 1997; Lovett et al., 2000;
Sullivan, 1971; Walton et al., 2001, Exp. 1; Walton et al., 2001, Exp. 2).
In addition, two studies were excluded from the meta-analyses because they were cluster trials
(Berninger et al., 2003; Brown and Felton, 1990); however, details of these are given here for
comparative purposes and because some information from them is used qualitatively later in
this section.

29
Two studies included in the Ehri et al. review (Lovett et al., 1989, 1990) did not report
numbers in the intervention and control groups separately (only total numbers). Although
both Ehri et al. (2001) and Camilli et al. (2003) used estimates in their analyses, the present
reviewers were able to obtain the actual numbers from the authors, and therefore include
calculations based on them in the meta-analysis.
This left 12 RCTs in the main meta-analysis comparing systematic phonics instruction with an
alternative reading intervention.
Table 1 contains information about each of the 12 RCTs included in the main analysis and the
two cluster trials. The table includes information about study design, participants,
intervention and control treatments, and the outcome measures used in the calculation of
effect sizes. It also reports the effect sizes for word reading accuracy, comprehension and
spelling as calculated for this review.
Table 1 and Appendix G show that all 14 trials reported outcome measures for reading
accuracy; also that, of the 12 individually randomized trials, four reported outcome measures
for reading comprehension, and three for spelling at first post-test.
Table 2 contains the quality assessments of the 14 trials. This table is based on the modified
CONSORT guidelines for quality assessment of RCTs. (The Consolidated Standards for
Reporting Trials are the methodological standard adopted by many medical journals for
publication of randomized controlled trials; see Altman, 1996 and Altman et al., 2001.)
These guidelines include assessment of whether the individual trials reported method of
random allocation and sample size justification, and whether or not assessment of outcomes
was �blind� (conducted by people who did not know which condition individuals belonged
to). (See Appendix G for details about the synthetic phonics interventions, the other phonics
interventions, the control interventions and the comparisons relevant to the review. See
Appendix J for details of the data extracted from each included study, and Appendix K for the
raw data extracted from each study for the calculations of effect sizes.)
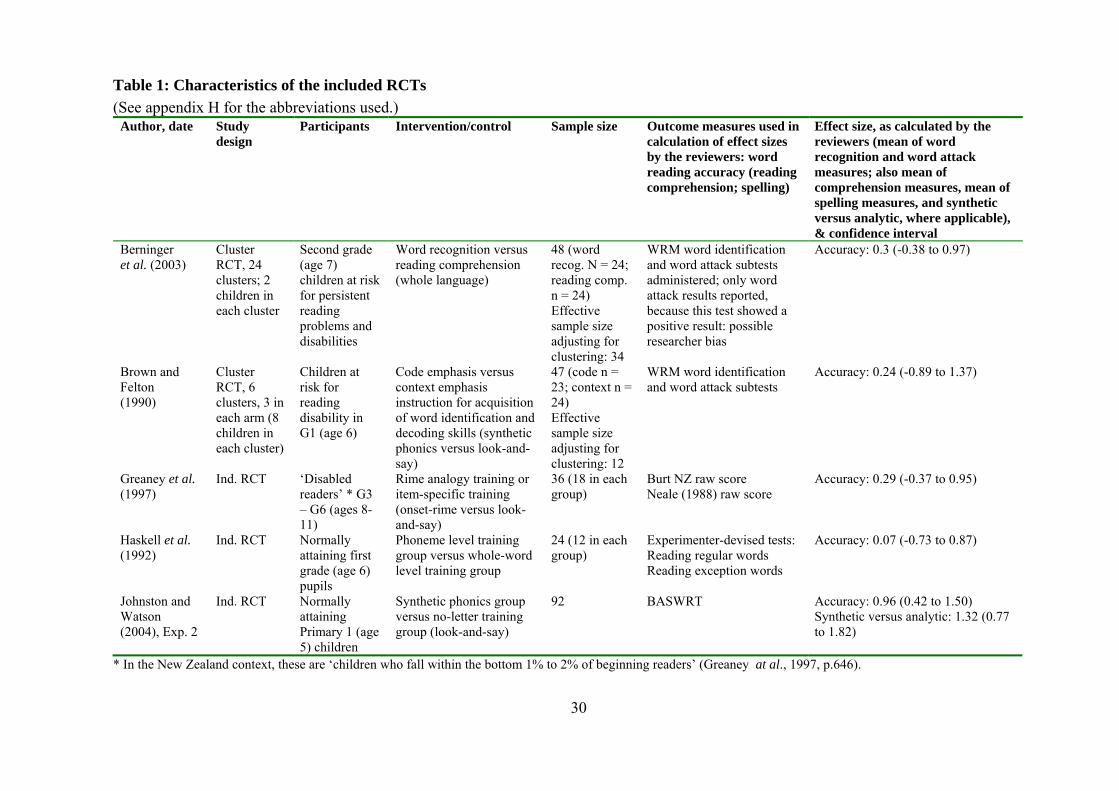
30
Table 1: Characteristics of the included RCTs (See appendix H for the abbreviations used.)
Author, date Study design
Participants Intervention/control Sample size Outcome measures used in calculation of effect sizes by the reviewers: word reading accuracy (reading comprehension; spelling)
Effect size, as calculated by the reviewers (mean of word recognition and word attack measures; also mean of comprehension measures, mean of spelling measures, and synthetic versus analytic, where applicable), & confidence interval
Berninger et al. (2003)
Cluster RCT, 24 clusters; 2 children in each cluster
Second grade (age 7) children at risk for persistent reading problems and disabilities
Word recognition versus reading comprehension (whole language)
48 (word recog. N = 24; reading comp. n = 24) Effective sample size adjusting for clustering: 34
WRM word identification and word attack subtests administered; only word attack results reported, because this test showed a positive result: possible researcher bias
Accuracy: 0.3 (-0.38 to 0.97)
Brown and Felton (1990)
Cluster RCT, 6 clusters, 3 in each arm (8 children in each cluster)
Children at risk for reading disability in G1 (age 6)
Code emphasis versus context emphasis instruction for acquisition of word identification and decoding skills (synthetic phonics versus look-and-say)
47 (code n = 23; context n = 24) Effective sample size adjusting for clustering: 12
WRM word identification and word attack subtests
Accuracy: 0.24 (-0.89 to 1.37)
Greaney et al. (1997)
Ind. RCT �Disabled readers� * G3 � G6 (ages 8-11)
Rime analogy training or item-specific training (onset-rime versus look-and-say)
36 (18 in each group)
Burt NZ raw score Neale (1988) raw score
Accuracy: 0.29 (-0.37 to 0.95)
Haskell et al. (1992)
Ind. RCT Normally attaining first grade (age 6) pupils
Phoneme level training group versus whole-word level training group
24 (12 in each group)
Experimenter-devised tests: Reading regular words Reading exception words
Accuracy: 0.07 (-0.73 to 0.87)
Johnston and Watson (2004), Exp. 2
Ind. RCT Normally attaining Primary 1 (age 5) children
Synthetic phonics group versus no-letter training group (look-and-say)
92 BASWRT
Accuracy: 0.96 (0.42 to 1.50) Synthetic versus analytic: 1.32 (0.77 to 1.82)
* In the New Zealand context, these are �children who fall within the bottom 1% to 2% of beginning readers� (Greaney at al., 1997, p.646).

31
Table 1: Characteristics of the included RCTs, cont. Author, date Study
design Participants Intervention/control Sample size Outcome measures used in
calculation of effect sizes by the reviewers: word reading accuracy (reading comprehension; spelling)
Effect size, as calculated by the reviewers (mean of word recognition and word attack measures; also mean of comprehension measures, mean of spelling measures, and synthetic versus analytic, where applicable), & confidence interval
Leach and Siddall (1990)
Ind. RCT Normally attaining first grade (age 6) pupils
Direct instruction versus paired reading (look-and-say)
20 (10 in each group)
Neale (1988) accuracy (Comprehension: Neale comprehension)
Accuracy: 0.80 (-0.11 to 1.71) Comprehension: 0.56 (-0.33 to 1.45)
Lovett et al. (1989)
Ind. RCT �Disabled readers� *, mean age 10.8 years
Decoding skills programme group (DS) versus oral and written language stimulation group (OWLS, whole language)
121 (DS n = 60, OWLS n = 61)
WRAT-R reading subtest PIAT reading recognition SORT GORT connected text (GORT comprehension; spelling: WRAT-R spelling subtest, PIAT spelling)
Accuracy: 0.22 (-0.14 to 0.57) Comprehension: 0.08 (-0.28 to 0.44) Spelling: 0.07 (-0.29 to 0.42)
Lovett et al. (1990)
Ind. RCT �Disabled readers� *, mean age 8.4 years
REG ≠ EXC versus REG = EXC (look-and-say)
36 (18 in each group)
WRAT-R reading subtest GORT accuracy Experimenter-devised tests; results given only for experimenter-devised tests: possible researcher bias
Accuracy: -0.19 (-0.85 to 0.46)
Martinussen and Kirby (1998)
Ind. RCT Kindergarten (age 5) pupils assessed as low performers on phonological processing measures
Successive phonological group versus meaning group (whole language)
28 (13 in phonics group; 15 in meaning group). Attrition n = 2 from phonics group
WRM word attack; word identification; word reading (Ball and Blachman); results at floor for meaning group in word attack test, therefore not calculated (spelling: �invented spelling�)
Accuracy: 0.44 (-0.31 to 1.19) Spelling: 0.30 (-0.44 to 1.05)
* Children referred to the Learning Disabilities Research Program at the Hospital for Sick Children in Toronto, Canada who scored at least 1.5 years below expectation on EITHER word recognition accuracy OR reading speed (see Lovett et al., 1989, pp.97-98).

32
Table 1: Characteristics of the included RCTs, cont. Author, date Study
design Participants Intervention/control Sample size Outcome measures used in
calculation of effect sizes by the reviewers: word reading accuracy (reading comprehension; spelling)
Effect size, as calculated by the reviewers (mean of word recognition and word attack measures; also mean of comprehension measures, mean of spelling measures, and synthetic versus analytic, where applicable), & confidence interval
O�Connor and Padeliadu (2000)
Ind. RCT G1 (age 6) children nominated as �very poor readers�
Blending versus whole word conditions
12 (6 in each group)
Experimenter-devised tests � total words read (taught and transfer words) (spelling: experimenter-devised tests � taught and transfer words)
Accuracy: 0.53 (-0.62 to 1.68) Spelling: -0.15 (-1.28 to 0.99)
Skailand (1971)
Ind. RCT Normally-attaining kindergarten (age 5) children
Grapheme/phoneme group versus whole word (look-and-say) group
42 Experimenter-devised tests � recall of words; transfer to similar words and syllables
Accuracy: -0.17 (-0.78 to 0.44) Synthetic versus analytic: -1.03 (-1.64 to �0.41)
Torgesen et al. (1999)
Ind. RCT Kindergarten (age 5) children with weak phono-logical skills
PASP versus RCS 90 (45 in each group)
WRM-R Word attack Word identification
Accuracy: 0.07 (-0.34 to 0.48)
Torgesen et al. (2001)
Ind. RCT Children between the ages of 8 and 10 identified as �learning disabled� (= having learning difficulties)
Embedded phonics versus Auditory Discrimination in Depth Program
50 WRM-R Word identification GORT-III accuracy TOWRE/SWE (comprehension: WRMPCT-R; GORT-III comprehension)
Accuracy: -0.31 (-0.87 to 0.45) Comprehension: 0.05 (-0.50 to 0.60) Synthetic versus analytic: -0.25 (-0.66 to 0.17)
Umbach et al. (1989)
Ind. RCT First grade (age 6) students having difficulty with reading
Reading mastery (direct instruction) versus Houghton-Mifflin (look-and-say)
31 (15 in direct instruction, 16 in basal programme)
WRM Word identification Total reading (comprehension: WRMPCT)
Accuracy: 2.69 (1.72 to 3.67) Comprehension: 1.08 (0.33 to 1.84)

33
Table 2: Quality assessment of the included RCTs Author, date Reporting of
method of allocation
Sample size justi-fication
Intention to teach analysis
Blinded assessment of outcome
Comments
Berninger et al. (2003)
N/S N/S N/S N/S Attrition N/S
Brown and Felton (1990)
N/S N/S N N/S 48 children randomized, yet only 47 mentioned in results section (1 lost from code group)
Greaney et al. (1997)
N/S N/S Y Y No attrition
Haskell et al. (1992)
N/S N/S Y N/S
Johnston and Watson (2004), Exp. 2
N/S N/S N N/S Attrition n = 7. Random allocation only confirmed through contact with author
Leach and Siddall (1990)
N/S N/S Y N/S
Lovett et al. (1989)
N/S N/S Y (for first
battery of tests)
N/S Numbers in each of the treatment groups requested and received from authors. Numbers only available for first battery of tests
Lovett et al. (1990)
N/S N/S Y N/S Numbers in each of the treatment groups requested and received from authors
Martinussen and Kirby (1998)
N/S N/S N N/S Attrition n = 2 in phonics group. Results at floor for word attack test (meaning group)
O�Connor and Padeliadu (2000)
N/S N/S Y N/S
Skailand (1971) N/S N/S Y N/S
Torgesen et al. (1999)
N/S N/S Y Y
Torgesen et al. (2001)
N/S N/S N/S N/S Attrition n = 10 for two-year follow-up test
Umbach et al. (1989)
N/S N/S Y N/S
N/S = not stated
As can be seen from Table 2, none of the 14 trials reported method of random allocation or
sample size justification, and only two reported blinded assessment of outcome. Nine of the
14 trials used intention to teach (ITT) analysis10 (this could be explained by the fact that some
educational researchers do not routinely report attrition, and imply that there were no drop-
outs, which may not in fact be the case). The trials were, therefore, variable in quality but all
were lacking in their reporting of some issues that are important for methodological rigour.
Quality of reporting is a good but not perfect indicator of design quality. Therefore due to the
limitations in the quality of reporting the overall quality of the trials was judged to be
10 For definition, see Glossary.
34
�variable� but limited. Combined with the small number of included trials (12 in the main
analysis) and the relatively small sample sizes (the largest was 121) the overall quality of the
evidence base for the main analysis (systematic phonics v. unsystematic or no phonics) was
judged to be �moderate�. The overall quality of the evidence base for the other three analyses
(comprehension, spelling, synthetic versus analytic) was judged to be �weak�. This was
because the trials again had limitations in their reporting and there were only three or four
trials in each of these meta-analyses.
Systematic phonics instruction versus whole language or whole word intervention (1):
Word accuracy
For measures of word accuracy and word identification, in 11 of the included trials the effect
size for word accuracy was positive, and ranged from extremely small (Haskell et al., 1992;
Torgesen et al., 1999), through moderate (Berninger et al., 2003; Brown and Felton, 1990;
Lovett et al., 1989; Martinussen and Kirby, 1998; O�Connor and Padeliadu, 2000), to large
(Leach and Siddall, 1990) or extremely large (Johnston and Watson, 2004, Exp.2; Umbach et
al., 1989). Only the two extremely large effect sizes were statistically significant. In three of
the included studies the effect size was negative and small (Lovett et al., 1990; Skailand,
1971; Torgesen et al., 2001), but in no case was it statistically significant.
Of the 14 RCTs, 12 were individually randomized studies. These were pooled in a meta-
analysis (Figure 1). The �fixed effects� model of meta-analysis assumes that the estimate of
effect holds for all the studies in the meta-analysis. The �random effects� model assumes that
the studies in the meta-analysis are a random sample of all the studies in that field.
Figure 1 shows that, using the fixed effects model, there was a statistically significant effect
of phonics instruction on reading accuracy of 0.27 11. Using the random effects model there
was a statistically significant effect of 0.38 12. This finding gave some support to the main
finding of the Ehri et al. review.
Sensitivity analysis
A sensitivity analysis was undertaken, by re-running the meta-analysis after the removal of
the outlier (Umbach and Halpin, 1989). Using the fixed effects model the effect size was
11 (p=0.002), d=0.27 (0.10 to 0.45). 12 (p=0.002), d=0.38 (0.02 to 0.73).

35
reduced to 0.20 (statistically significant, CI 0.02 to 0.37, p=0.03). Using the random effects
model the effect size was reduced to 0.21 (not statistically significant, -0.03 to 0.44, p=0.09).
The results of the sensitivity analysis mean that caution is required in any interpretation of the
meta-analysis because the removal of one small trial reduced the overall effect size and using
one model of meta-analysis made it not statistically significant.
Figure 1: Meta-analysis of the 12 individually randomized trials
Systematic phonics instruction versus whole language or whole word intervention (2):
Comprehension
Four of the 12 RCTs included in the main analysis used comprehension as an outcome
measure at immediate post-test (Leach and Siddall, 1990; Lovett et al., 1989; Torgesen et al.,
2001; Umbach et al., 1989). The pooled estimate of effect size for these four trials using
the fixed effects model was 0.24 but this was not statistically significant13. Using the
13 Approximate 95% CI = -0.03 to 0.51, not statistically significant p=0.08.

36
random effects model the pooled effect size was 0.35 and again this was not statistically
significant14.
Systematic phonics instruction versus whole language or whole word intervention (3):
Spelling
In addition, three of the 12 studies included in the main analysis used spelling as an outcome
measure at immediate post-test (Lovett et al., 1989; Martinussen and Kirby, 1998; O�Connor
and Padeliadu, 2000). The pooled estimate of effect size for these three trials using the
fixed effects model was 0.09 but this was not statistically significant15. Using the random
effects model the pooled effect size and confidence intervals were identical.
Systematic synthetic phonics instruction versus systematic analytic phonics instruction
Three studies directly compared systematic synthetic phonics instruction with systematic
analytic phonics instruction (Johnston and Watson, 2004; Skailand, 1971; Torgesen et al.,
1999). The pooled estimate of effect size using the fixed effects model was 0.02 but this
was not statistically significant16. Using the random effects model the pooled effect size
was also 0.02 and not statistically significant17.
Proportion of literacy teaching devoted to phonics instruction
In order to address the questions �What proportion of literacy teaching should be based on
systematic phonics instruction?� and �Should phonics instruction focus on phonics for reading
and phonics for spelling?� data were extracted from the 14 included studies on the amount of
instructional time in each of the experiments, and on what other literacy instruction
participants were receiving, including whether or not the interventions included spelling
instruction (see Table 3).
Regarding the question about proportion, phonics may be taught exclusively, non-exclusively
(as part of a wider literacy curriculum), or not at all. As can be seen from Table 3, in nine of
the trials the reading intervention comprised phonics instruction within the context of a broad
literacy curriculum (i.e. non-exclusive phonics teaching). Only one trial (Brown and Felton,
1990) compared exclusive phonics instruction for reading (and spelling) with no phonics 14 Approximate 95% CI = -0.09 to 0.79. 15 Approximate 95% CI = -0.22 to 0.40, not statistically significant p=0.56. 16 Approximate 95% CI = -0.27 to 0.31, not statistically significant p=0.87. 17 Approximate 95% CI = -1.23 to 1.26.

37
instruction. (In the other four trials the relevant information was not stated.) There was
therefore insufficient RCT evidence on which to compare exclusive with non-exclusive use of
phonics. Data from the nine trials of non-exclusive use of phonics was then investigated to see
whether progress in literacy correlated with amount of systematic phonics instruction
received within the broader curriculum.
As cross-referencing Tables 3 and 1 shows, the amount of instructional time varied from less
than 2 to about 160 hours, and the trial which detected the largest effect for reading accuracy
(Umbach et al., 1989) was the trial with the longest length of intervention. However,
• that trial had one of the smallest sample sizes;
• the trial which detected the second largest effect size for reading accuracy (Johnston and
Watson, 2004, Exp. 2) had one of the shortest lengths of intervention (and an average
sample size for this group of trials); and
• although, as previously demonstrated in the main meta-analysis, the pooled effect size was
positive and statistically significant, and in 11 out of the 14 trials a positive effect was
found for systematic phonics instruction compared with whole language/whole word
instruction, this was statistically significant in only two individual trials.
Again, this means that there was insufficient RCT evidence on which to recommend an
amount of phonics instruction.
Phonics for reading and phonics for spelling
With regard to the question about phonics for reading and phonics for spelling, though there
was moderate evidence of the benefits of teaching reading through systematic phonics, the
evidence on teaching spelling through systematic phonics was not yet conclusive because of
the small number of relevant trials (3). Therefore the RCT evidence cannot yet be used to
determine whether phonics should, or should not, be used to teach spelling as well as reading.
Phonics for reading and spelling beyond the early years
It was not possible to analyse how different approaches impacted on the application of
phonics in reading and writing beyond the early years because only three RCTs used follow-
up measures.

38
Table 3: Details of instructional time and of instruction received by the intervention groups
Author, date Amount of instructional time in experiment Information about what other literacy instruction participants were receiving, including whether or not the interventions included spelling instruction
Berninger et al. (2003)
2 x weekly sessions of 20 minutes each for a total of 24 lessons. Total instructional time = 8 hours.
Supplemental reading instruction � children �did not miss any work for the regular reading program� (p.105). �Overall, in the regular reading program, the children appeared to receive background reading instruction that included both word recognition and reading comprehension� (p.108) � �balance reading instruction�. Reading and spelling: �During the last ten minutes of the word recognition training, children engaged in reflective activities such as classifying a spelling unit according to different pronunciations associated with it or generating words to illustrate different phonemes associated with the spelling unit� (p.105).
Brown and Felton (1990)
Total instructional time = Not known. �All reading instruction was provided for these children by research teachers� (p.226). Reading and spelling: �Spelling was taught as one component of the reading lesson with spelling lists developed from the words introduced in each unit of reading instruction� (230).
Greaney et al. (1997)
30 mins of individual instruction 3 or 4 times per week for 11 weeks. Total instructional time = 16.5 hours to 22 hours.
The instruction provided was in addition to the regular classroom reading program. �The method of classroom reading instruction to which all the children were exposed adhered to the �whole language� philosophy of teaching reading� (p.646). Reading and spelling.
Haskell et al. (1992)
15 x 20 minute sessions over a six-week period during language arts instruction time in school. Total instructional time = 5 hours.
Interventions replaced part of the language arts time. Spelling not mentioned.
Johnston and Watson (2004), Exp. 2
Seen twice a week for 15 mins on 2 separate days, with two non-intervention days in between. Continued for 10 weeks, 19 sessions per child in total. Total instructional time = 4.75 hours.
The children were extracted from class for extra tuition in addition to their normal reading programmes (p.344). Spelling not mentioned.
Leach and Siddall (1990)
10-15 minutes per day, each weekday for 10 weeks. Total instructional time = 8.3 to 12.5 hours.
Additional support: �All reading sessions were conducted by parents in their own homes� (p.351). Spelling not mentioned.
Lovett et al. (1989)
All groups: 40 treatment sessions. Seen in pairs. Each session 50 to 60 mins, 4 times per week for 10-week period. Total instructional time = 33 hours to 40 hours.
Additional treatment programme – children were seen in special laboratory classrooms; no attempt was made to control for the other literacy experiences of the children (p.96). Reading and spelling – �The Decoding skills Program is an instructional program in which attention is focused exclusively on the acquisition of word recognition and spelling skills� (p. 95).

39
Table 3: Details of instructional time and of instruction received by the intervention groups, cont.
Author, date Amount of instructional time in experiment Information about what other literacy instruction participants were receiving, including whether or not the interventions included spelling instruction
Lovett et al. (1990)
A total of 35 sessions was conducted in each program. All sessions lasted 60 minutes and were conducted four times a week. Total instructional time = 35 hours.
Additional treatment programme – children were seen in special laboratory classrooms; no attempt was made to control for the other literacy experiences of the children (p771). Reading and spelling – �Training in word recognition and spelling was addressed.� (p.771).
Martinussen and Kirby (1998)
The length of the intervention was eight weeks, with two or three 20-min sessions per week. Due to occasional absences the number of sessions received by individual children ranged from 17-20 sessions. Total instructional time = 5.6 hours to 6.6 hours.
N/S – whether supplementary or additional or part replacement etc. Spelling not mentioned.
O�Connor and Padeliadu (2000)
Ten training sessions of 10-13 mins each. Total instructional time = 1.6 hours to 2.1 hours.
The treatments were conducted in addition to regular reading instructional time, which consisted of large group discussion and choral reading of Big Books, writing in journals, and independent silent reading in all classes (p. 168). Reading and spelling (p.165).
Skailand (1971)
Two 15-min periods for ten weeks. Total instructional time = 5 hours.
N/S – whether supplementary or additional or part replacement etc. Spelling not mentioned
Torgesen et al. (1999)
Total instructional time = specific data not available (reviewer estimate = approx. 34 hours)
�As a rule, we tried to schedule children for our instructional interventions at a time in their school day that did not interfere with their regular classroom reading instruction�regular classroom instruction was primarily literature based and guided by a whole-language philosophy, with phonics being taught on an as-needed basis rather than systematically� (p. 583). Spelling not mentioned
Torgesen et al. (2001)
Total instructional time = 67.5 hours. N/S – whether supplementary or additional or part replacement etc. �This training substituted for the time the children would normally have spent in their learning disabilities resource room� (p. 37) Reading and spelling
Umbach et al. (1989)
Total instructional time = specific data not available (reviewer estimate = approx. 160 hours)
N/S – whether supplementary or additional or part replacement etc. Spelling not mentioned
N/S = not stated

40
Study heterogeneity
Table 3 also suggests that there was significant heterogeneity among the 14 RCTs (and this
was confirmed statistically � see Appendix C). Some studies were undertaken with children
with reading difficulties or disabilities, and others with normally attaining children
(educational heterogeneity). To explore whether this could be a cause of the observed
heterogeneity, a meta-analysis was undertaken to assess whether or not there was a statistical
interaction between the effect of phonics instruction and learner characteristics (Figure 2).
Figure 2: Main meta-analysis subdivided by learner characteristics
Standardised mean difference
Favours Control Favours Phonics
-3.7709 0 3.77098
Study Standardised mean difference (95% CI) % Weight
Ability==0 Greaney 0.30 (-0.36, 0.95) 6.8 Lovett89 0.22 (-0.14, 0.57) 23.1 Lovett90 -0.20 (-0.85, 0.46) 6.9 Martinussen 0.46 (-0.30, 1.21) 5.2 O'Connor 0.57 (-0.59, 1.73) 2.2 Torgesen99 0.07 (-0.34, 0.48) 17.3 Torgesen01 -0.31 (-0.87, 0.24) 9.5 Umbach 2.77 ( 1.77, 3.77) 2.9
Subtotal 0.21 ( 0.01, 0.41) 73.9
Ability==1 Haskell 0.07 (-0.73, 0.87) 4.6 Johnston 0.97 ( 0.43, 1.51) 10.1 Leach 0.84 (-0.08, 1.75) 3.5 Skailand -0.17 (-0.78, 0.44) 8.0
Subtotal 0.45 ( 0.11, 0.78) 26.1
Overall 0.27 ( 0.10, 0.45) 100.0
As Figure 2 shows, phonics instruction tended to produce a larger effect size (0.45) for
normally attaining children (studies from Haskell downwards) than for children with reading
disabilities and difficulties (0.21). However, the test for interaction was not statistically
significant (p=0.24). Therefore, there was no statistical evidence to support the belief that the
effectiveness of phonics instruction was different for learners with different characteristics.
Th finding that the effect size for systematic phonics instruction was similar for children with
all learner characteristics supports one of those reported by Ehri et al. (2001).
The studies also differed in whether or not they used intention to teach analysis (procedural
heterogeneity). (Intention to teach analysis means that all participants are analysed in their

41
original randomized groups; it is the most robust analytical method. Also see Glossary.) In
Figure 3 an analysis is shown of whether or not studies differed in their results by the use of
intention to teach analysis
Figure 3: Main meta-analysis subdivided by ITT or no-ITT
Standardised mean difference
Favours Control Favours Phonics
-3.7709 0 3.77098
Study Standardised mean difference (95% CI) % Weight
ITT==0 Martinussen 0.46 (-0.30, 1.21) 5.2 Torgesen01 -0.31 (-0.87, 0.24) 9.5 Johnston 0.97 ( 0.43, 1.51) 10.1
Subtotal 0.37 ( 0.03, 0.72) 24.7
ITT==1 Greaney 0.30 (-0.36, 0.95) 6.8 Lovett89 0.22 (-0.14, 0.57) 23.1 Lovett90 -0.20 (-0.85, 0.46) 6.9 O'Connor 0.57 (-0.59, 1.73) 2.2 Torgesen99 0.07 (-0.34, 0.48) 17.3 Umbach 2.77 ( 1.77, 3.77) 2.9 Haskell 0.07 (-0.73, 0.87) 4.6 Leach 0.84 (-0.08, 1.75) 3.5 Skailand -0.17 (-0.78, 0.44) 8.0
Subtotal 0.24 ( 0.04, 0.44) 75.3
Overall 0.27 ( 0.10, 0.45) 100.0
ITT = Intention To Teach
As Figure 3 shows, studies that used ITT analysis tended to have smaller effect sizes (0.24
compared with 0.37); however, this apparent interaction was not statistically significant
(p=0.72). Therefore, there is no evidence that the use of ITT analysis affected the results of
the studies.
Judgement of evidence
When considering the findings reported above it is important to express them in an overall
judgement of the evidence based on three things: the strength of the effect, the statistical
significance of the effect, and the quality of evidence on which these are based.
In general, the strength of an effect can range from small (effect size around 0.2) through
medium (effect size around 0.5) to large (effect size around 0.8). An effect can be statistically
significant at the level of p <0.05 (which means that there is a 95% probability of the effect

42
not having occurred by chance) or it can be non-significant (which means that there are no
statistically significant differences between the groups). The confidence intervals are also
instructive here and indicate the level of uncertainty around an effect. If the confidence
intervals are wide this indicates a high level of uncertainty, and if they cross through zero this
indicates that the effect is not statistically significant. The quality of evidence relates to the
sample size of the individual trials, the methodological rigour of the individual trials and the
number of trials included in the analysis.
The reviewers concluded that:
• none of the findings of the current review were based on strong evidence because there
simply were not enough trials (regardless of quality or size);
• some findings were based on moderate evidence (because there were a few trials of
variable quality with small sample sizes);
• some findings were based on weak evidence (because there were very few trials with
small sample sizes and variable quality); and
• in a few cases there was insufficient evidence to support any finding.
The quality of the evidence for a finding and its effect and/or statistical significance may be
independent of each other. It would be desirable to base recommendations for changes in
teaching on highly statistically significant medium to large effects based on good quality of
evidence (either several moderately sized, good quality trials or on one well-designed very
large trial in a normal school setting). But since there are no such findings at present, it is
necessary to proceed on the basis of the evidence that is available.
Summary of findings
Heeding the cautions expressed in the previous subsection, the current review�s findings can
be found in Table 4.

43
Table 4: Summary of findings, by research question, answer, quality of evidence, strength of effect, statistical significance, and implications for teaching
Research question Answer Quality of
evidence Strength of effect Statistical significance Implications for teaching
Does systematic phonics instruction enable children to make better progress in reading accuracy than unsystematic or no phonics?
Yes * Moderate Small (effect size = 0.27)
Highly statistically significant (p=0.002)
No warrant for NOT using phonics � it should be a routine part of literacy teaching
Did the evidence for the finding above differ according to whether or not researchers had used intention to teach analysis?
No Moderate Small (effect sizes = 0.24 and 0.37 respectively)
Not statistically significant (p>0.05) N.B. The non-significant value implies no difference between the groups.
(n/a � methodological question)
Does systematic phonics instruction enable both normally-developing children and those at risk of failure to make better progress in reading accuracy than unsystematic or no phonics?
Yes * Moderate Medium and small (effect sizes = 0.45 and 0.21 respectively)
Not statistically significant (p>0.05) N.B. The non-significant value implies no difference between groups.
No warrant for NOT using phonics with either group � both normally-developing children and those at risk of failure can benefit
Does systematic phonics instruction enable children to make better progress in reading comprehension than unsystematic or no phonics?
Not clear Weak Small (effect size = 0.24)
Not statistically significant (p=0.08)
No clear finding from research on whether or not phonics boosts progress in comprehension
Does systematic phonics instruction enable children to make better progress in spelling than unsystematic or no phonics?
Not clear Weak Very small (effect size = 0.09)
Not statistically significant (p=0.56)
No warrant from research for either using or not using phonics to teach spelling
Does systematic synthetic phonics instruction enable children to make better progress in reading accuracy than systematic analytic phonics?
Not clear Weak Very small (effect size = 0.02)
Not statistically significant (p=0.87)
No warrant from research for choosing between these varieties of systematic phonics
44
Table 4: Summary of findings, by research question, answer, quality of evidence, strength of effect, statistical significance, and implications for teaching, cont.
Research question Answer Quality of evidence
Strength of effect Statistical significance Implications for teaching
What proportion of literacy teaching should be devoted to phonics?
(Insufficient evidence) No warrant from research for any change to existing practice
What amount of literacy teaching should be devoted to phonics?
(Insufficient evidence) No warrant from research for any change to existing practice
Should phonics be used in the teaching of spelling as well as reading?
(Insufficient evidence) No warrant from research for any change to existing practice
Should phonics be used beyond the early years? (Insufficient evidence) No warrant from research for either using or not using phonics beyond the early years
n/a = not applicable n/s = not stated
* Finding supports one reported by Ehri et al. (2001), but with a reduced effect size.

45
10. Discussion
Two of the main findings of the current review supported those of Ehri et al. (2001), namely
that systematic phonics instruction enables children to make better progress in reading
accuracy than unsystematic or no phonics, and that this is true for both normally-developing
children and those at risk of failure. However, there were some important differences. The
overall effect size of 0.27 was substantially lower than Ehri et al.�s estimate of 0.41 (implying
that approximately 12 extra children out of 100 rather than approximately 16 extra children
would succeed on a relevant test). This reduction in the effect size may have been due to the
inclusion of new trials from the updated searches, and/or to some features of the Ehri et al.
review, namely:
• the fact that they included non-randomized as well as randomized trials;
• their use of estimated rather than actual numbers in the different groups in two studies;
• their use of what was essentially an untaught control group as the counterfactual in some
comparisons (this is likely to have exaggerated the effects of phonics teaching); and
• not adjusting for clustering effects in the calculation of the mean effect size in the cluster
trial (Brown and Felton, 1990) which Ehri et al. included but which was excluded from
the main analysis in the current review.
Quality issues
None of the 14 included trials reported method of random allocation or sample size
justification, and only two reported blinded assessment of outcome. Nine of the 14 trials used
intention to teach (ITT) analysis. These are all limitations on the quality of the evidence. The
main meta-analysis included only 12 relatively small individually randomised controlled
trials, with the largest trial having 121 participants and the smallest only 12 (across
intervention and control groups in both cases). Although all these trials used random
allocation to create comparison groups and therefore the most appropriate design for
investigating the question of relative effectiveness of different methods for delivering reading
support or instruction, there were rather few trials, all relatively small, and of varying
methodological quality. This means that the quality of evidence in the main analysis was
judged to be �moderate� for reading accuracy outcomes. For comprehension and spelling
outcomes the quality of evidence was judged to be �weak�. This was due to the very small
number of relevant trials and their sample sizes. For the secondary analysis looking at the

46
relative effectiveness of synthetic versus analytic phonics instruction the evidence base was
again judged to be �weak�, mainly due to the tiny number of trials included in the analysis (3),
and the fact that all these trials were relatively small.

47
11. Conclusions
This section is organised largely around the four original research questions. 1. How effective are different approaches to phonics teaching in comparison to each other (including the specific area of analytic versus synthetic phonics)?
The current review has confirmed that systematic phonics instruction is associated with an
increased improvement in reading accuracy. The effect size is 0.27, which translates into a
12% absolute improvement in a reading accuracy test that is standardised to have a score with
a mean of 50% for children not receiving systematic phonics (see Torgerson, 2003, p.86). In
other words, of 100 children not receiving systematic phonics instruction, in a test 50 would
score 50% or more, compared with 62 children who would score 50% or more if they did
receive systematic phonics instruction. The current review has also confirmed that this is true
for both normally-developing children and those at risk of failure.
However, there was little RCT evidence on which to compare analytic and synthetic phonics,
or on the effect of systematic phonics on reading comprehension or spelling, so that it was not
possible to reach firm conclusions on these issues.
2. How do different approaches impact on the application of phonics in reading and writing, including beyond the early years?
It was not possible to analyse how different approaches impacted on the application of
phonics in reading and writing beyond the early years because only three RCTs used follow-
up measures.
3. Is there a need to differentiate by phonics for reading and phonics for spelling?
This question could not be tackled directly because none of the RCTs had addressed it.
However, there was a difference in the findings, in that systematic phonics instruction was
found to benefit children�s reading accuracy, but there was insufficient evidence to reach firm
conclusions about impact on reading comprehension or spelling.
4. What proportion of literacy teaching should be based on the use of phonics?
Again, there was insufficient RCT evidence on which to base a firm conclusion.

48
Limitations
Even where the RCT evidence was considered strong enough to draw conclusions the findings
need to be treated with caution. There was significant heterogeneity within the meta-analysis,
which could not be explained by the reported design characteristics of the included trials or
by the educational characteristics of the children included in the studies. This could be
explained by the difference in the lengths of the intervention or by the interventions differing
between trials. It is also unclear whether systematic phonics teaching was beneficial to all
children with different learner characteristics, as for example very few trials included English
speakers of other languages or a design capable of comparing the relative effectiveness of the
interventions for girls and boys.
Only one of the included trials was undertaken in Britain, which raises concerns about the
applicability to the British context of results based largely on research elsewhere. In addition,
the strong possibility of publication bias affecting the results cannot be excluded. This is
based on results of the funnel plot (see Appendix C). It seems clear that a cautious approach
is justified.
Generally the trials were small and few in number, and the quality of reporting of their
methods was variable, but all trials only included small sample sizes. In addition, there was
huge variation in the amount of phonics teaching, ranging from just a few hours to well over
100. The evidence in this review did not provide any warrant for exclusive teaching of
reading using a phonics approach, but rather provided moderate evidence for using a
systematic phonics approach within a broad literacy curriculum.
It was not possible to draw any firm conclusions with regard to the proportion of time that
should be devoted to phonics instruction. Basing recommendations for a particular proportion
of time to be spent on phonics on such slender evidence base would not be wise. Therefore,
at least one large RCT, if not more, should be undertaken to confirm or refute the overall
promising effect of systematic phonics and also to explore the amount of phonics instruction
children should receive.

49
12. Recommendations
For teaching
• Since there is evidence that systematic phonics teaching benefits children’s reading
accuracy, it should be part of every literacy teacher’s repertoire and a routine part
of literacy teaching, in a judicious balance with other elements.
• Teachers who already use systematic phonics in their teaching should continue to do so;
teachers who do not should add systematic phonics to their routine practices.
Moreover, there is no RCT evidence for one common objection to the use of phonics:
• There is no justification for withholding phonics from either normally-developing children
or those at risk of reading failure � both may benefit and it should be used with both.
However, otherwise there is little warrant in these findings for changes to existing
practice. In particular,
• There is currently no strong RCT evidence that any one form of systematic phonics is
more effective than any other.
• There is also currently no strong RCT evidence on how much systematic phonics is
needed.
• Two other areas on which the existing research base is insufficient are whether or not
phonics teaching boosts comprehension, and whether phonics should be used to teach
spelling as well as reading.
For teacher training
• The evidence that systematic phonics teaching benefits children�s reading accuracy further
implies that learning to use systematic phonics in a judicious balance with other elements
should form part of every literacy teacher�s training.

50
For research
• The point was made in section 10 that none of the findings of this review have strong
evidence in their support, so what is needed is a well-designed RCT to shed clearer light
on the key findings. The current review therefore recommends a large UK-based cluster-
randomized controlled trial to confirm the findings of this review and to investigate
further the relative effectiveness of systematic synthetic versus systematic analytic
phonics instruction with children with different learning characteristics.

51
References Adams, M.J. (1990) Beginning to Read: Thinking and Learning about Print. Cambridge, MA:
MIT Press. Altman, D.G. (1996) Better reporting of randomised controlled trials: The CONSORT
statement, British Medical Journal, 313: 570-1. Altman, D.G., Schulz, K.F., Moher, D., Egger, M., Davidoff, F., Elbourne, D., Gotzsche, P.C.
and Lang, T. (2001) The revised CONSORT statement for reporting randomized trials: Explanation and elaboration, Annals of Internal Medicine, 134(8): 663-94.
Berninger, V.W., Vermeulen, K., Abbott, R.D., McCutchen, D., Cotton, S., Cude, J., Dorn, S. and Sharon, T. (2003) Comparison of three approaches to supplementary reading instruction for low-achieving 2nd grade readers, Language, Speech and Hearing Services in Schools, 34(2): 101-116.
Bond, G. L. and Dykstra, R. (1967) The Cooperative Research Program in First-grade Reading Instruction, Reading Research Quarterly, 2(4): 5-142.
Brooks, G. (2002) �Phonemic awareness is a key factor in learning to be literate: how best should it be taught?� In Cook, M. (Ed.) Perspectives on the Teaching and Learning of Phonics. Royston, Herts: UK Reading Association, 61-83.
Brooks, G. (2003) Sound Sense: the phonics element of the National Literacy Strategy. A report to the Department for Education and Skills, DfES website, 20/8/03: http://www.standards.dfes.gov.uk/pdf/literacy/gbrooks_phonics.pdf
Brooks, G., Miles, J.N.V., Torgerson, C.J. and Torgerson, D.J. (2005) A randomised trial of computer software in education, using CONSORT guidelines, oral presentation at the 9th Social and Health Sciences Methodology Conference, Granada, Spain, September 2005.
Brooks, G., Miles, J.N.V., Torgerson, C.J. and Torgerson, D.J. (2006, in press) Is an intervention using computer software effective in literacy learning? A randomised controlled trial, Educational Studies, 32(1).
Brown, I.S. and Felton, R.H. (1990) Effects of instruction on beginning reading skills in children at risk for reading disability, Reading and Writing: An Interdisciplinary Journal, 2(3): 223-41.
Camilli, G., Vargas, S. and Yurecko, M. (2003) Teaching Children to Read: the fragile link between science and federal education policy, Education Policy Analysis Archives, 11, no.15, retrieved 8 June 2005 http://epaa.asu.edu/epaa/v11n15/
Chall, J.S. (1967) Learning to Read: The Great Debate. New York, NY: McGraw-Hill. Second edn, 1989.
Chew, J. (2005) Editorial. Reading Reform Foundation Newsletter, no.55 (Summer), 1. Cook, M. (ed.) (2002) Perspectives on the Teaching and Learning of Phonics. Royston, Herts:
UK Reading Association. Department for Education and Employment (1998) National Literacy Strategy Framework for
Teaching. London: DfEE. Department for Education and Skills (2005) Trends in Education and Skills: Percentage of
pupils achieving level 4 or above in the Key Stage 2 tests, 2000 to 2005. Available at: http://www.dfes.gov.uk/trends/index.cfm?fuseaction=home.showChart&cid=5&iid=30&chid=117 [accessed 23.11.05]
Egger, M., Davey Smith, G., Schneider, M. and Minder, C. (1997) Bias in meta-analysis detected by a simple graphical test, British Medical Journal, 315: 629-34 (13 September).
Ehri, L.C., Nunes, S.R., Stahl, S.A. and Willows, D.M. (2001) Systematic phonics instruction helps students learn to read: Evidence from the National Reading Panel's meta-

52
analysis, Review of Educational Research, 71(3): 393-447. Elley, W.B. (1992) How in the World do Students Read? Hamburg: International Association
for the Evaluation of Educational Achievement. Ellis, N.C., Natsume, M., Stavropoulou, K., Hoxhallari, L., van Daal, V.H.P., Polyzoe, N.,
Tsipa, M-L. and Petalas, M. (2004) The effects of orthographic depth on learning to read alphabetic, syllabic and logographic scripts, Reading Research Quarterly, 39(4): 438-68.
Fayne, H.R. and Bryant, N.D. (1981) Relative effects of various word synthesis strategies on the phonics achievement of learning disabled youngsters, Journal of Educational Psychology, 73(5): 616-623.
Gittelman, R. and Feingold, I. (1983) Children with reading disorders �1. Efficacy of reading remediation, Journal of Child Psychology and Psychiatry, 24(2): 167-91.
Greaney, K.T., Tunmer, W.E. and Chapman, J.W. (1997) Effects of rime-based orthographic analogy training on the word recognition skills of children with reading disability, Journal of Educational Psychology, 89(4): 645-51.
Haskell, D.W., Foorman, B.R. and Swank, P. (1992) Effects of three orthographic/ phonological units on first-grade reading, Remedial and Special Education, 13(2): 40-49.
Hatcher, P.J., Hulme, C. and Snowling, M.J. (2004) Explicit phoneme training combined with phonic reading instruction helps young children at risk of reading failure, Journal of Child Psychology and Psychiatry, 45(2): 338-58.
Johnston, R.S. and Watson, J.E. (2004) Accelerating the development of reading, spelling and phonemic awareness skills in initial readers, Reading and Writing: An Interdisciplinary Journal, 17(4): 327-57.
Leach, D.J. and Siddall, S.W. (1990) Parental involvement in the teaching of reading: A comparison of hearing reading, paired reading, pause, prompt, praise and direct instruction methods, British Journal of Educational Psychology, 60(3): 349-55.
Lovett, M.W., Ransby, M.R., Hardwick, N., Johns, M.S. and Donaldson, S.A. (1989) Can dyslexia be treated? Treatment-specific and generalized treatment effects in dyslexic children�s response to remediation, Brain and Language, 37(1): 90-121.
Lovett, M.W., Warren-Chaplin, P.M., Ransby, M.J. and Borden, S.L. (1990) Training the word recognition skills of reading disabled children: Treatment and transfer effects, Journal of Educational Psychology, 82(4): 769-80.
Lovett, M.W. and Steinbach, K.A. (1997) The effectiveness of remedial programs for reading disabled children of different ages: Does the benefit decrease for older children?, Learning Disability Quarterly, 20(3): 189-210.
Lovett, M.W., Lacerenza, L., Borden, S.L., Frijters, J.C., Steinbach, K.A. and De Palma, M. (2000) Components of effective remediation for developmental reading disabilities: Combining phonological and strategy-based instruction to improve outcomes, Journal of Educational Psychology, 92(2): 263-83.
Manzticopoulos, P., Morrison, D., Stone, E. and Setrakian, W. (1992) Use of the SEARCH/TEACH tutoring approach with middle-class students at risk for reading failure, The Elementary School Journal, 92(5): 573-86.
Martinussen, R.L. and Kirby, J.R. (1998) Instruction in successive phonological processing to improve the reading acquisition skills of at-risk kindergarten children, Developmental Disabilities Bulletin, 26(2): 19-39.
Massey, A., Green, S., Dexter, T. and Hamnett, L. (2003). Comparability of National Tests over time: Key Stage test standards between 1996 and 2001. London: Qualifications and Curriculum Authority.
53
National Reading Panel (2000) Report of the National Reading Panel: Reports of the sub-groups. Washington DC: National Institute for Child Health and Human Development Clearinghouse.
O�Connor, R.E. and Padeliadu, S. (2000) Blending versus whole word approaches in first grade remedial reading: Short-term and delayed effects on reading and spelling words, Reading and Writing: An Interdisciplinary Journal, 13(1-2): 159-82.
Ofsted (2002) The National Literacy Strategy: the first four years 1998-2002. London: Office for Standards in Education.
Pflaum, S.W., Walberg, H.J., Karegianes, M.L. and Rasher, S.P. (1980) Reading instruction: a quantitative analysis, Educational Researcher, 9(7): 12-18.
Reading Reform Foundation (various dates) Newsletter. Egham: Reading Reform Foundation. Skailand, D.B. (1971) A comparison of four language units in teaching beginning reading,
Paper presented at the meeting of the American Educational Research Association, New York, USA, 4-7 February 1971.
Seymour, P.H.K., Aro, M. and Erskine, J.M. (2003) Foundation literacy acquisition in European orthographies, British Journal of Psychology, 94(2): 143-74.
Statistics Commission (2005). Measuring Standards in English Primary Schools. London: Statistics Commission.
Strickland, D.S. (1998) Teaching Phonics Today: A Primer for Educators. Newark, DE: International Reading Association.
Sullivan, H.J, Okada, M. and Niedermeyer, F.C. (1971) Learning and transfer under two methods of word-attack instruction, American Educational Research Journal, 8(2): 227-39.
Torgerson, C.J. (2003) Systematic Reviews. London: Continuum Books. Torgesen, J.K., Wagner, R.K., Lindamood, P., Rose, E., Conway, T. and Gravan, C. (1999)
Preventing reading failure in young children with phonological processing disabilities: Group and individual responses to instruction, Journal of Educational Psychology, 91(4): 579-93.
Torgesen, J.K., Alexander, A.W., Wagner, R.K., Rashotte, C.A., Voeller, K.K.S. and Conway, T. (2001) Intensive remedial instruction for children with severe reading disabilities: Immediate and long-term outcomes from two instructional approaches, Journal of Learning Disabilities, 34(1): 33-58.
Tymms, P. (2004). �Are standards rising in English primary schools?’ British Educational Research Journal, 30, 4, 477-94.
Umbach, B., Darch, C. and Halpin, G. (1989) Teaching reading to low performing first graders in rural schools: A comparison of two instructional approaches, Journal of Instructional Psychology, 16(3): 112-21.
Walton, P.D., Walton, L.M. and Felton, K. (2001) Teaching rime analogy or letter recoding reading strategies to pre-readers: Effects on pre-reading skill and word reading, Journal of Educational Psychology, 93(1): 160-80.

54
Appendices
APPENDIX A: Extended definitions of synthetic phonics
Some authors would wish to add several features to the definition of synthetic phonics given in the
main text, namely:
• The words on which children exercise their phonic skills must be unknown to them in their
written form.
• Fast pace.
• There should be an initial phase in which children exercise their phonic skills only on letters,
then single words, before attempting to apply them to words in text (including books).
• At each stage, phonics for reading must precede phonics for spelling.
These extensions were not adopted in this review because each of them could, in theory, be a feature
of analytic phonics instruction or some other initial teaching approaches, and therefore is not
necessarily only part of the definition of synthetic phonics instruction.

55
APPENDIX B: Phonics ‘first, fast and only’
Some synthetic phonics advocates (see the Reading Reform Foundation Newsletter, passim) insist that
the technique should be used �first, fast, and only�. This section examines whether any research
evidence was found to support this.
‘First’: This part of the approach appears to mean that children should receive phonics teaching as
soon as they enter school and before they are taught other decoding strategies. With home support,
some children have already made a start on reading (and possibly writing) before they start school, so
that with them the �first, fast and only� approach is impractical. On the other hand, although many
other children seem to learn to read without much phonics at all, especially if the literacy environment
at home and at school is rich and broad, the main findings in this review do support the view that any
children who have not yet started to read at school entry should immediately receive systematic
phonics teaching.
However, teaching of some aspects of phonics, some of it not wholly informal, now occurs routinely
in Foundation stage settings in England, that is, with 4 and 5 year-olds. In some other countries,
especially in Scandinavia, literacy teaching is explicitly the task of the first years after school entry,
and forbidden in earlier stages, and children�s progress does not appear to be hampered by this (Elley,
1992). However, many of the languages involved have less complicated orthographies than English,
and there is now substantial evidence that the complicated orthography of written English (plus the
complex syllable structure of spoken English) is a factor in the slower rate of literacy learning of
English-speaking children (Seymour et al., 2003; Ellis et al., 2004). Is this a reason for starting
literacy teaching so early, or for adopting methods that will increase the rate of learning once children
are of statutory school age? No direct research evidence on this was found. There are practical
examples (the Reading Reform Foundation (RRF) has several) of successful teaching of phonics to 4-
year-olds, and the THRASS (Teaching Handwriting, Reading and Spelling Simultaneously) system
has also demonstrated this capacity. But these only show that this can be done, not whether it should.
This would require strong research evidence that a start before age 5 enables children to make better
initial progress, and sustain it. No such evidence was found in this review.
�Fast�: On this factor it would be easy to be misled by the Clackmannanshire experiments (Johnston
and Watson, 2004). Experiment 1 compared fast synthetic phonics with slow analytic phonics, thus
confounding two variables. Experiment 2 compared fast synthetic phonics with fast analytic phonics,
but this implies nothing about the effect of the fast pace. To check that would require an experiment
comparing, for example, fast synthetic phonics with slow synthetic phonics, and no such experiment is
known to have been carried out. Instead there are assertions that a fast pace is crucial, and practical
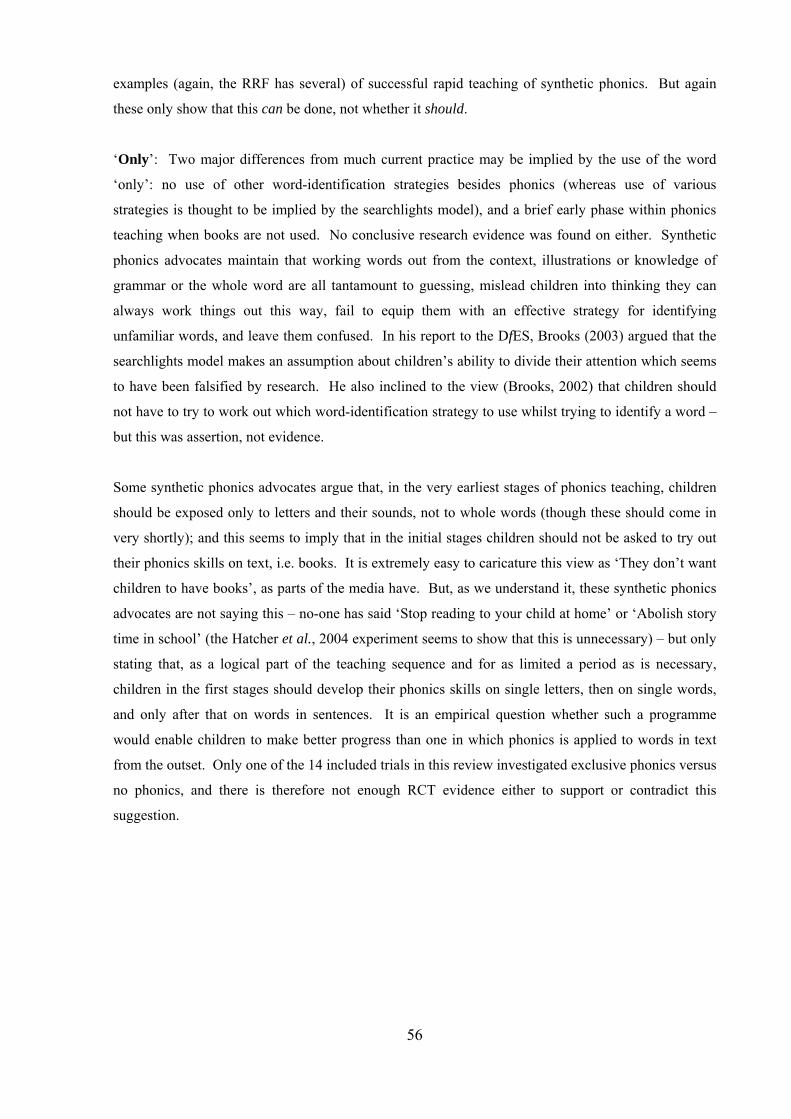
56
examples (again, the RRF has several) of successful rapid teaching of synthetic phonics. But again
these only show that this can be done, not whether it should.
�Only�: Two major differences from much current practice may be implied by the use of the word
�only�: no use of other word-identification strategies besides phonics (whereas use of various
strategies is thought to be implied by the searchlights model), and a brief early phase within phonics
teaching when books are not used. No conclusive research evidence was found on either. Synthetic
phonics advocates maintain that working words out from the context, illustrations or knowledge of
grammar or the whole word are all tantamount to guessing, mislead children into thinking they can
always work things out this way, fail to equip them with an effective strategy for identifying
unfamiliar words, and leave them confused. In his report to the DfES, Brooks (2003) argued that the
searchlights model makes an assumption about children�s ability to divide their attention which seems
to have been falsified by research. He also inclined to the view (Brooks, 2002) that children should
not have to try to work out which word-identification strategy to use whilst trying to identify a word �
but this was assertion, not evidence.
Some synthetic phonics advocates argue that, in the very earliest stages of phonics teaching, children
should be exposed only to letters and their sounds, not to whole words (though these should come in
very shortly); and this seems to imply that in the initial stages children should not be asked to try out
their phonics skills on text, i.e. books. It is extremely easy to caricature this view as �They don�t want
children to have books�, as parts of the media have. But, as we understand it, these synthetic phonics
advocates are not saying this � no-one has said �Stop reading to your child at home� or �Abolish story
time in school� (the Hatcher et al., 2004 experiment seems to show that this is unnecessary) � but only
stating that, as a logical part of the teaching sequence and for as limited a period as is necessary,
children in the first stages should develop their phonics skills on single letters, then on single words,
and only after that on words in sentences. It is an empirical question whether such a programme
would enable children to make better progress than one in which phonics is applied to words in text
from the outset. Only one of the 14 included trials in this review investigated exclusive phonics versus
no phonics, and there is therefore not enough RCT evidence either to support or contradict this
suggestion.

57
APPENDIX C: More details on the systematic review methods used
Screening and quality assurance: procedures
All the located studies were double screened using titles and abstracts, where available, and on the
basis of criteria adapted from the original criteria (Ehri et al., 2001, p.400). Screening was undertaken
by two reviewers (including for all databases by the Principal Investigator or the Director) working
independently and then meeting to discuss any differences in decisions to include or exclude articles,
with the exception of the records retrieved through the re-run of the original search on ERIC � 1970-
2000. This database was screened by the Principal Investigator, and a random sample of 10% was
generated and double screened by a second reviewer. A Cohen�s Kappa statistic was calculated to
assess the inter-rater reliability of the screening.
Screening and quality assurance: results
For databases where two reviewers screened the entire database, the agreement between reviewers was
high. Disagreements occurred only on whether or not the trials should be included according to the
intervention criterion. One reviewer was consistently more inclusive (JH), and included in some cases
trials that evaluated phonemic awareness instruction or phonological awareness instruction. In all
cases agreement to include or exclude was secured after discussion to resolve any differences. For the
screening of the 10% random sample of the ERIC database of unpublished literature, the Cohen�s
Kappa measure of agreement was 1 (perfect agreement). Therefore it was not considered necessary
for any further double screening to be undertaken.
Full agreement was established on whether or not to include papers at the second stage of screening
(screening of full papers), and on the appropriate comparison and outcome measures to be used in the
calculation of effect sizes.
Data extraction
The consistency with which Ehri et al. applied the definitions of synthetic and analytic phonics to the
trials in their analysis was checked; and Brooks�s definitions (see the main text) were applied to all the
RCTs included in this review. Data were extracted by two team members independently from each
included RCT in the following categories: bibliographic details; study design; participants (including
specific learner characteristics); details of the interventions and control group treatments; outcome
measures (including all the raw data necessary for re-calculation of effect sizes); sample size; and
reported effect size. Initial agreement between the two independent extractions and calculations was
high; full agreement was established through discussion.

58
In order to address the questions �What proportion of the literacy teaching should be based on
systematic phonics instruction?� and �Should phonics instruction focus on phonics for reading and
phonics for spelling?� data were extracted from all the studies in the main analysis on the amount of
instructional time in each of the experiments, and on what other literacy instruction participants were
receiving, including whether or not the interventions included spelling instruction.
Calculation of effect sizes
The main meta-analysis pooled the effect sizes of individually randomized trials that compared
systematic phonics instruction with a reading intervention for three outcomes (word accuracy,
comprehension and spelling), using the computer software package �Arcus Quickstat�. The fixed
effects model was used for the standardised mean differences in the meta-analyses as this was the
model adopted by Ehri et al. (2001), but the random effects model was also calculated and both sets of
statistics are reported for the two principal meta-analyses. To investigate possible sources of
heterogeneity, sub-group analyses were performed according to learner characteristics and
methodological variation in the trials, using the computer software package �STATA�. The secondary
meta-analysis pooled the effect sizes of individually randomized trials that compared systematic
synthetic phonics instruction with systematic analytic phonics instruction, using the computer software
package �Arcus Quickstat�.
Two of the included RCTs were cluster RCTs (Berninger et al., 2003; Brown and Felton, 1993).
When participants are allocated in a cluster or class randomized RCT the correlation between pupils
needs to be taken into account when estimating the confidence intervals. To do this an adjusted
sample size after adjusting for the effects of clustering was calculated. The formula applied was:
1+(m-1) x ICC, where m is the average size of the cluster and ICC is the intra-cluster correlation. The
ICC used was from a recent RCT of information and communication technology and spelling/reading
undertaken with colleagues from York and Sheffield (Brooks et al., 2005; 2006, in press). This ICC
was 0.45.
The formula s.d. = √n x SE was applied to calculate the standard deviation for the one paper where the
s.d. was not available, but where the standard error (SE) was available (Lovett et al., 1989).
Estimation of publication bias
One of the inclusion criteria in the Ehri et al. (2001) review was that the trials had to be journal
articles that had been peer-refereed. Including this criterion could have potentially increased the risk
of overestimating the effect size of the intervention, as it is more likely that negative studies will have
been excluded. Figure 4 (reproduced from Torgerson, 2003, p.68) is a funnel plot of the effect sizes of
the 13 RCTs included in the Ehri et al. review.

59
Figure 4 shows that there were no studies in that set reporting a negative effect of systematic phonics
instruction compared with all forms of control, despite the small sample sizes of the included studies.
This is prima facie evidence for publication bias, since it seems highly unlikely that no RCT has ever
returned a null or negative result in this field (and the present review did find some negative results).
Although the Ehri et al. results suggested that systematic phonics teaching is probably an effective
strategy, this conclusion might have been modified if notice had been taken of this evidence of
publication bias.
Figure 4 Funnel plot of randomized trials from the systematic review of systematic phonics instruction, showing possible presence of publication bias
0
125
-2.5 -1.5 -0.5 0.5 1.5 2.5
Effect Size
Sam
ple
Size
Another way of estimating the likelihood that publication bias has occurred is to calculate the fail-safe
n, that is, the number of unlocated or excluded (or yet-to-be-conducted) studies with contradictory
findings that would need to exist to reduce the estimated effect size to statistical non-significance.
Ehri et al. (2001, p.431) did calculate a fail-safe n (860). This high figure suggests that, at the current
rate of appearance of relevant RCTs, it would be many decades before their main finding was
overturned, even if all further RCTs had contradictory results; thus it gives the impression that the
finding is highly secure. However, Ehri et al.�s method of calculating the fail-safe n was not the
standard version as just summarized, but: how many studies of effect sizes below 0.2 (rather than zero
or negative estimates) would be required to indicate that their 43 comparisons of 0.2 and above were

60
�statistical exceptions�? The number required with null or negative effects would be smaller, though
probably still large enough to sustain confidence in their finding.
The current review found only one unpublished study, with an effect size of -0.17 (a negative result).
Publication bias may still have been present, however. The average effect size of the revised meta-
analysis was 0.27 (95% CI 0.10 to 0.45). For a study to have 80% power to observe this estimate with
a 5% significance would require a sample size of approximately 400. All the studies in the review
were insufficiently powered to show this difference. Indeed, the average size of the studies included
in the review would only have 80% power to observe an effect size of 0.85. This suggests, therefore,
that there are similarly powered studies that have smaller, not statistically significant, effect sizes that
remain unpublished even within the grey literature.
To test informally for potential publication bias in the updated review a funnel plot was drawn and the
Egger statistical test for asymmetry was calculated (Egger et al., 1997). The resulting funnel plot
(Figure 5) does suggest asymmetry, but the Egger test for asymmetry was 0.17, which is not
statistically significant. Although there is no statistical evidence for publication bias, it cannot be ruled
out due to the small number of studies in the analysis.
Figure 5: Funnel plot of effect sizes of the 12 individual RCTs in the current review
Begg's funnel plot with pseudo 95% confidence limits
SM
D
s.e. of: SMD0 .2 .4 .6
-1
0
1
2
3

61
Statistical evidence for study heterogeneity
There was significant heterogeneity in the pooled data used for the main meta-analysis (�Q� statistic
46.30, p<0.001). In addition, the normal quantile plot (Figure 6) was also suggestive of at least two
study populations because the studies did not uniformly fall on the diagonal and tended to form an �S�
shape.
Figure 6: Normal quantile plot of the 12 individual RCTs in the current review
-10
12
3S
MD
-.5 0 .5 1 1.5Inverse Normal

62
APPENDIX D: Search strategies for each database
PsycInfo
For PsycInfo a search strategy was created using the three sets of search terms in the Ehri et al. paper
(p. 399) combined using �AND�. This strategy was run for the period 1970-2005. This retrieved 1079
records for the period 1970-2000 and 398 records for the period 2001-5. These records were then
checked to see if they included any of the included studies. Of the 38 papers in the Ehri review 26
were retrieved by this search. The researchers therefore decided to use this search strategy for
PsycInfo. For the period 1970-2000 the database was sorted by publication type and then included
only unpublished records (103).
ERIC
The three sets of terms in the Ehri et al. review (p. 399) were combined: �set 1 AND (set 2 OR set 3)�.
The reviewers ran this for the period 1970-2000 and retrieved 22 papers from the original review.
Therefore they decided to use this strategy for ERIC. For the period 1970-2000 the database was
sorted by publication type and then included only unpublished records (4462).
ASSIA, BEI and SIGLE
For each of these three databases the three groups of search terms in the Ehri et al. (2001) review were
combined: �set 1 and (set 2 OR set 3)� for the period 1970-present for BEI and SIGLE and for the
period 1987 � present for ASSIA.

63
APPENDIX E: Results of the searching and screening at first and second stages
Electronic database or method of retrieval
Initial ‘hits’ after de-duplication
No. included at first stage
Unobtainable or not received
No. of RCTs included at second stage
Ehri et al. (2001) 13 11 0 11 Contact 6 4 0 4 PsycInfo 1970-2000 103 4 0 0 PsycInfo 2000-2005 398 19 0 3 (in 2 papers) ERIC 1970-2000 4462 37 1 1 ERIC 2000-2005 652 14 0 1 ASSIA 143 4 0 0 BEI 277 0 0 0 SIGLE 61 0 0 0 Total 6114 101 1 20 (in 19 papers)
APPENDIX F: Method of retrieval of the 20 included RCTs
Method of retrieval Included Ehri et al. (2001) meta-analysis
11 RCTs: Brown and Felton (1993); Greaney et al. (1997); Haskell et al. (1992); Leach and Siddall (1990); Lovett et al. (1989); Lovett et al. (1990); Lovett et al. (1997); Martinussen and Kirby (1998); Torgesen et al. (1999); Umbach et al. (1989)
Contact 4 RCTs: Fayne and Bryant (1981); Johnston and Watson (2004), Exp 2; Sullivan et al. (1971); Torgesen et al. (2001)
ERIC search 1970-2000
1 RCT: Skailand (1971)
ERIC search 2000-2005
1 RCT: Berninger et al. (2003)
PsycINFO 2000-2005 3 RCTs: O�Connor and Padeliadu (2000); Walton et al. (2001), Exp 1; Walton et al. (2001), Exp 2

64
APPENDIX G: Details of the 20 included RCTs
Author(s) & date
Synthetic phonics intervention group Other interventions Comparisons
Berninger et al. (2003)
Word recognition group. Segmentation and teacher modelling blending are mentioned, but children blending is not explicitly mentioned (pp.105-7)
1) Reading comprehension = whole language (p.107); 2) Word recognition and reading comprehension = phonics plus whole language (p.107)
Synthetic/ whole language
Brown & Felton (1990)
Lippincott Basic Reading programme group (pp.229-30)
Houghton Mifflin programme = look-and-say (p.229)
Synthetic/ look-and-say
Fayne & Bryant (1981)
Treatment 3, Letter-by-letter training (pp.618-9)
Other 4 groups were onset-rime &/or body-coda (pp.618-9)
Synthetic/ onset-rime using Treatment 2 (Final-final) as onset-rime
Greaney et al. (1997)
1) Rime analogy = onset-rime (p.647); 2) Item-specific training = look-and-say (p.648)
Onset-rime/ look-and-say
Haskell et al. (1992)
Phoneme group (pp.40, 42-3) 1) Onset-rime (pp.40, 43); 2) Whole word = look-and-say (pp.40, 43)
Synthetic/ onset-rime & synthetic/ look-and-say
Johnston & Watson (2004), exp.2
Synthetic (pp.344, 347-8) 1) No-letter training group = look-and-say (pp.344, 346); 2) Accelerated letter learning group = analytic (pp.344, 346-7)
Synthetic/ analytic; also synthetic/ look-and-say
Leach & Siddall (1990)
Direct Instruction (pp.349-50) 1) Hearing Reading = look-and-say (p.351); 2) Paired Reading = look-and-say (p.351); 3) Pause, Prompt and Praise = look-and-say (p.351)
Synthetic/ look-and-say
Lovett et al. (1989)
Decoding Skills Program group (p.95) Oral and Written Language Stimulation Program = whole language (pp.95-6)
Synthetic/ whole-language & systematic vs no phonics
Lovett et al. (1990)
REG ≠ EXC group (pp.771-2) REG = EXC group = look-and-say (pp.772) Synthetic/ look-and-say
Lovett & Steinbach (1997)
Phonological analysis and blending/Direct Instruction group (pp.193-4)
Word identification strategy training program group = onset-rime (pp.194-5)
Synthetic/onset-rime
Lovett et al. (2000)
Double phonological analysis and blending/direct Instruction (PHAB/DI) group (pp.266-7, 269)
1) Double Word identification strategy training program (WIST) group = onset-rime (pp.267-8); 2) PHAB/DI + WIST (p.269); 3) WIST + PHAB/DI (p.269)
Synthetic/ onset-rime, using double WIST as onset-rime

65
Appendix G: Details of the 20 included RCTs, cont.
Author(s) & date
Synthetic phonics intervention group Other interventions Comparisons
Martinussen et al. (1998)
Successive-phonological group (pp.28-30) Meaning group = whole language (p.30) Synthetic/ whole-language
O�Connor & Padeliadu (2000)
Synthetic group (pp.165-7) Whole word = look-and-say (p.167) Synthetic/ look-and-say
Skailand (1971) Grapheme/ phoneme group (p.5) 1) Whole word = look-and-say (p.5); 2) Similar spelling = analytic with rime families (p.5); 3) Contrastive spelling = analytic with onset families (p.5)
Synthetic/ analytic, using �similar spelling� as analytic; also synthetic/ look-and-say
Sullivan et al. (1971)
Single-letter group (pp.228-32) Letter-combination group = onset-rime (pp.228-32)
Synthetic/ onset-rime
Torgesen et al. (1999)
Phonological awareness plus synthetic phonics group (p.582), even though blending not explicitly mentioned
Embedded phonics = analytic (p.582) Synthetic/ analytic
Torgesen et al. (2001)
Embedded Phonics (pp.39-40) Auditory Discrimination in Depth = whole-word + phonemic awareness (pp.38-9)
Synthetic/ whole-word + phonemic awareness, = approx. whole language
Umbach et al. (1989)
Reading Mastery Series group (p.115) Houghton Mifflin programme = look-and-say (p.116)
Synthetic/ look-and-say
Walton et al. (2001), exp. 1
Letter recoding group (pp.164-5)
Rime analogy = onset-rime (p.165) Synthetic/ onset-rime
Walton et al. (2001), exp. 2
Letter recoding group (pp.164-5)
Rime analogy = onset-rime (p.165) Synthetic/ onset-rime

66
Appendix H: Abbreviations for Table 1
BASWRT = British Ability Scales Word Reading Test
Burt NZ = Burt Word Reading Test, New Zealand Revision
GORT = Gray Oral Reading Test
GORT-III = Gray Oral Reading Test, 3rd edition
Neale = Neale Analysis of Reading Ability
PIAT = Peabody Individual Achievement Tests
SORT = Slosson Oral Reading Test
TOWRE/SWE = Test of Word Reading Efficiency, Sight Word Efficiency subtest
WRAT-R = Wide Range Achievement Tests, Revised
WRM = Woodcock Reading Mastery
WRM-R = Woodcock Reading Mastery, revised
WRMPCT = Woodcock Reading Mastery passage comprehension test
WRMPCT-R � Woodcock Reading Mastery passage comprehension test, revised

67
APPENDIX J: Data extraction tables for all studies included in the meta-analyses
Berninger, V.W. et al. (2003) Comparison of three approaches to supplementary reading instruction for low-achieving 2nd grade readers, Language, Speech and Hearing Services in Schools, 34(2): 101-16. Country of origin USA Setting Second grade classrooms. Objective To evaluate the relative effectiveness of three instructional approaches to
supplementing the regular reading program for second graders with low word reading and/or pseudo-word reading skills.
Study design Cluster trial. �48 pairs of children were randomly assigned to the 4 experimental conditions in the following way. At each of the 8 schools, dyads were created based on number of children who met inclusion criteria at that school. Then, these child pairs were randomly assigned to each of 48 slots in the overall design (12 dyads in each of 4 conditions) (p.105)�. Some control for teacher effects. Supplemental reading instruction – children ‘did not miss any work for the regular reading program’ (p.105). ‘Overall, in the regular reading program, the children appeared to receive background reading instruction that included both word recognition and reading comprehension’ (p.108) – balanced reading instruction. Raw data reported for only one out of three outcome measures.
Participants Referred by teachers as ‘poorest’ students (p.103). Inclusion criteria � scaled score of 6 or higher on WISC-III vocabulary subset and a score at or below 85 on WRM-R word identification or word attack. The other WRM-R had to be below population mean of 100. Number randomized = 96 (56 girls, 40 boys; 8% African American, 8% Asian American, 61.5% European American, 8% Hispanic, 1% Native American, 13.5% other/not reported). Age: Average age 7 yrs (girls), 8yrs 7 months (boys).
Intervention 1. Word recognition training only, n = 24. Explicit instruction in alphabetic principle in and out of word context and reflective activities such as classifying a spelling unit according to different pronunciations associated with it or generating words to illustrate different phonemes associated with the spelling unit. 2. Reading comprehension training only, n = 24. Engaged in reflective discussion using Connects, Organize, Reflect and Extend model to develop situational component of comprehension plus explicit language cueing at the word, sentence and text levels. 3. Combined word recognition/reading comprehension, n = 24. Explicit instruction in alphabetic principle plus explicit language cueing at word, sentence and text level.
Control N = 24. Word play with oral language and repeated readings at their instructional level. Practised aural comprehension and word reading skills but did not receive explicit instruction in reading comprehension or word reading skills. All groups – 2 x weekly sessions of 20 minutes each for a total of 24 lessons.

68
APPENDIX J: Data extraction tables for all studies included in the meta-analyses, cont.
Brown, I.S. and Felton, R.H. (1990) Effects of instruction on beginning reading skills in children at risk for reading disability, Reading and Writing: An Interdisciplinary Journal, 2(3): 223-41. Country of origin USA Setting Five schools in USA, kindergarten grades 1 and 2. Objective To investigate the impact of code-emphasis versus context-emphasis instruction on
the acquisition of word identification and decoding skills in children identified as at risk for reading disability.
Study design Cluster trial � although methods not very clear. �Six groups of eight at risk children were placed into regular first grade classrooms in the five schools, and were randomly assigned to one of two instructional methods� (p.227). No further details provided. Cluster trial � only 6 clusters with 8 in each. 48 randomized but only 47 included in baseline characteristics. Also, very little information about randomization process.
Participants Included ‘at risk’ children. ‘At risk’ status required child to obtain, on at least three of the research measures, scores of one or more Standard Deviations below the group mean, or to be in the bottom 16th percentile for the sample. 48 children randomized, however baseline characteristics based on n = 47. (48th child (in code approach group) no info given but is included in counting of 6 drop-outs during the study). Age/Grade: Mean (SD), range for context group 6.2 (0.53), 5.6-7.3 and for code group 6.1 (0.35), 5.5-6.8
Intervention Code Approach: n = 23 at Grade 1 results and n = 19 at Grade 2 results. Lippincott Basic Reading Program (1981) used. Direct code method (synthetic phonics). Length of follow-up 2 years in total.
Control Context Approach: n = 24 at Grade 1 results and n = 23 at Grade 2 results. Houghton Mifflin (1986) programme used for general reading instruction in local school system. Children taught to first attempt words by using context plus also employs phonics cues but no attempt is made to teach blending of phonics elements. Length of follow-up 2 years in total.

69
APPENDIX J: Data extraction tables for all studies included in the meta-analyses, cont.
Greaney, K.T., Tunmer, W.E. and Chapman, J.W. (1997) Effects of rime-based orthographic analogy training on the word recognition skills of children with reading disability, Journal of Educational Psychology, 89(4): 645-51. Country of origin New Zealand Setting Pupils were drawn from 36 primary schools in North Island, New Zealand. Objective The aim of this study was to determine whether meta-cognitive strategy training in
the use of rime spelling units would be an effective intervention strategy for children with reading disability.
Study design Individual RCT. Thirty-six disabled readers were randomly assigned to 1 of 2 training groups, a rime analogy training group or an item-specific training group (p.645) No further details provided.
Participants Initial sample contained 57 disabled children. Children were from Years 3-6. All were native English speakers. No children were included who were receiving special education assistance in school or who were known to have a hearing, visual, language or intellectual impairment. Mean age of intervention group 8.23 years and control group 8.16 years. 36 of the disabled readers were randomly assigned to one of two treatment groups, the rime analogy treatment group or the item specific treatment group. One year after treatment follow-up data were obtained from the two treatment groups.
Intervention Subjects received 30 minutes of individual instruction three or four times per week for 11 weeks. The study was carried out during the middle term of a three-term school year. The children were tested individually in a quiet withdrawal room in their school. Rime analogy treatment � the rime analogy training group received systematic training in the use of rime spelling units to identify words. Received 30 minutes of individual instruction 3 to 4 times per week for 11 weeks. Systematic training in the use of rime spelling units to identify words was incorporated in the thirty-minute lesson format. Rime analogy training did not generally exceed 5 minutes in duration in each 30-minute session.
Control Item-specific training � systematic training in the use of context cues to identify unfamiliar words. Received 30 minutes of individual instruction 3 to 4 times per week for 11 weeks. Systematic training in the use of context cues to identify unfamiliar words was incorporated into the lesson and did not exceed 5 minutes in duration in each 30-minute session.

70
APPENDIX J: Data extraction tables for all studies included in the meta-analyses, cont.
Haskell, D.W., Foorman, B.R. and Swank, P. (1992) Effects of three orthographic/phonological units on first-grade reading, Remedial and Special Education, 13(2): 40-49. Country of origin USA Setting Within school during language arts instruction, suburban middle school in South
Western United States. Objective To examine whether instruction at the onset-rime level facilitates first graders�
accuracy in the word reading more than instruction at the whole word level or phoneme level. (p.40) Hypotheses: training at the onset-rime level will facilitate first graders� word reading more than training at the phoneme level. Either the phoneme level or onset-rime level training will be more facilitative than the whole-word level training or no training. (p.42)
Study design Individual RCT with stratified randomization. Pupils scoring at the 98th percentile on the Gates-MacGintie Reading Test, Level A, Form 1 were excluded from the study. Students above and below the median raw score of 48 formed two pools from which students were alternately randomly selected for equal distribution into one of the four treatment groups: phoneme level training, onset-rime level training, whole word level training and untrained controls.
Participants 48 first graders from 4 of the 7 first grade classes in a suburban, predominantly middle class school in south west United States. No pupils had English as a second language and only one had learning disabilities. Attrition � one student from the untrained control group left during the study and was replaced by a spare subject. No gender figures are given.
Intervention 12 students in each intervention group were divided randomly into groups of 6 and received 15 x 20 minute sessions over a six-week period during language arts instruction time in school. Intervention received was either phoneme or onset-rime.
Control 12 students in the whole word control group were divided randomly into groups of 6 and received 15x 20-minute sessions over a six week period during language arts instruction time in school. The untrained control group received no extra intervention.

71
APPENDIX J: Data extraction tables for all studies included in the meta-analyses, cont.
Johnston, R.S. and Watson, J.E. (2004) Accelerating the development of reading, spelling and phonemic awareness skills in initial readers, Reading and Writing: An Interdisciplinary Journal, 17(4): 327-57. Country of origin UK (Scotland) Setting Extracted from usual classroom to form instructional groups. Objective To establish whether synthetic phonics is more effective than analytic phonics
merely because letter sounds are taught at an accelerated pace. Study design Individual. �Participants matched into 3 groups on chronological age, sex,
vocabulary knowledge, letter knowledge, emergent reading, phoneme segmentation and rhyme generation ability�. (p344) Participants were then randomized into 3 groups � this is not stated in paper (personal communication to Carole Torgerson).
Participants Drawn from 4 Primary 1 classes in two schools one week after school entry in early September. No child had English as 2nd language. N = 99, 7 dropouts therefore n = 92. 46 boys, 46 girls. Age/Grade: mean age 5.0 (SD 0.3)
Intervention 1. Synthetic phonics, n = 30. Accelerated learning and blending of the letter sounds in initial, middle and final positions of words. The letter making the sound for the day was shown, the children hearing the sound and repeating it. 2. Accelerated letter training group, n = 33. Accelerated learning of letters in the initial position of words. Letter sounds were specifically taught. Two letter sounds a week were introduced.
Control No letter training group, n = 29. Received no additional letter training beyond their classroom teaching. Children were shown pictures and words in a book designed to teach a particular letter sound, although the letter sound was not taught explicitly. Therefore exposed to print vocabulary but a �look-and-say� whole word approach adopted, and no teaching of the letter sound. Various games then played, involving matching pictures to words to reinforce teaching of these words. Work carried out individually, in pairs or in small groups.
All groups � Treatment groups started 6 weeks after entering school. Seen in groups of 4 to 5. Seen twice a week for 15 mins on 2 separate days, with two non-intervention days in between. Continued for 10 weeks, 19 sessions per child in total. Same printed words used in all 3 conditions. All children continued in their normal class reading programmes. Two weeks after the start of the trial teachers began teaching the classroom analytic phonics programme, following the educational authorities guidelines. Continued for 26 weeks then children shown importance of letter sounds in all positions of words, using CVC words. None taught letter names. By time of last post-test all the children had learnt letter sounds in all positions of words in their classroom programmes. Follow-up � at end of intervention (10 weeks), 3 months after end of intervention and 9 months after end of intervention.

72
APPENDIX J: Data extraction tables for all studies included in the meta-analyses, cont.
Leach, D.J. and Siddall, S.W. (1990) Parental involvement in the teaching of reading: A comparison of hearing reading, paired reading, pause, prompt, praise and direct instruction methods, British Journal of Educational Psychology, 60(3): 349-55. Country of origin Australia Setting Parent training was carried out at school. All reading sessions were conducted by
parents, in their own homes � 10-15 minutes per day, each weekday for 10 weeks.
Objective To compare the relative effectiveness of Paired Reading, Pause, Prompt, and Praise, Hearing Reading and Direct Instruction methods. It was hypothesized that Direct Instruction would increase beginning reading skills to a greater extent than the other methods. Hearing reading, it was hypothesized, would be the least effective.
Study design Individual RCT. N = 40. Forty parents were randomly drawn, then randomly assigned to receive one of four tutoring methods already listed above. (p.350)
Participants N = 40. Final sample was composed of 26 boys and 14 girls with chronological ages ranging from 5 yrs 3 mths to 6 yrs 4 mths (M = 5 yrs 7 mths). No child was considered to have learning difficulties. 1 had mild speech impediment, 1 ESL pupil. Children were all beginning readers in the middle of their first term at school. Each had made more than 16 errors on the first story of Neale Analysis of Reading Ability. They continued to receive instruction in reading according to the school�s normal reading practices during the intervention period. Tutors = 3 fathers, 1 older sister, 36 mothers.
Intervention 10-15 minutes per weekday for 10 weeks. Direct Instruction: phonics programme � parents received 4 and half hours of training and all programme materials to use at home. Paired Reading � simultaneous parent/child reading of texts � parents received one and a half hours training and children took a reader home from school each day. Pause, Prompt, and Praise � method to teach self-correction responses to errors in reading using syntactic and semantic clues � parents received one and a half hours training and pupils took home a reader every day.
Control Hearing Reading �minimally guided hearing reading group�. Parents received no training, simply a sheet of guidelines. Pupils took home a reader every day.

73
APPENDIX J: Data extraction tables for all studies included in the meta-analyses, cont.
Lovett, M.W. et al. (1989) Can dyslexia be treated? Treatment specific and generalised treatment effects in dyslexic children’s response to remediation, Brain and Language, 37(1): 90-121. Country of origin Canada Setting Special laboratory classrooms in a paediatric teaching hospital. Objective To compare the effects on reading levels of disabled readers, of a decoding skills
programme versus an oral and written language stimulation programme, compared to control group.
Study design Individual. �178 disabled readers were randomly assigned to one of the three experimental treatment conditions�. (p.94). No further details.
Participants Children referred for remedial reading instruction, aged 8 to 13 years. Inclusion criteria: evidence of specific underachievement in reading in context of at least low average intelligence. Exclusion criteria: English 2nd language, hyperactivity, hearing impairment, brain damage, chronic medical condition or serious emotional disturbance. Sample consisted of 178 disabled readers. 137 males/41 females. Average intelligence with underachievement in written language. 60% were accuracy disabled and also had problems in decoding accuracy. Scored at least 1.5 years below instructional level expectations on at least 4 different measures of word recognition accuracy. 71% from families in middle SES ranges. No mention of race. Age/Grade: mean age 10.8 years (SD 1.5)
Intervention 1. DS (decoding skills programme). Training in word recognition and spelling skills. Regular and exception words instructed upon; regular words in context of a word family and exception by sight methods alone. Training in phonetic analysis and blending, rapid word recognition, morphological analysis, written spelling. No explicit training in reading comprehension, listening comprehension or appreciation of sentence structure. 2. OWLS (oral and written language stimulation programme). Developed to remediate oral and written language simultaneously. Intensive work on oral language comprehension, reading and reading comprehension implemented over 4 day instructional cycles. Weekly topic themes. Parallel instruction concentrated in vocabulary, structural analysis and grammar and discourse comprehension. The programme was presented in the context of language structures larger than the single word.
Control 3. CSS (classroom survival skills programme). Received training in areas of social skills, classroom etiquette, life skills, organisational strategies, academic problem solving and self-help techniques. No direct instruction and no exposure to print were offered. All groups: 40 treatment sessions. Seen in pairs. Each session 50 to 60 mins, 4 times per week for 10-week period. Administered by special education teachers with each teacher implementing each treatment programme with approx one third of assigned cases. No attempt to control for other educational experiences of the children.

74
APPENDIX J: Data extraction tables for all studies included in the meta-analyses, cont.
Lovett, M.W. et al. (1990) Training the word recognition skills of reading disabled children: Treatment and transfer effects, Journal of Educational Psychology, 82(4): 769-80. Country of origin Canada Setting Special laboratory classrooms in a paediatric teaching hospital. Objective To compare the effectiveness of two experimental word recognition training
programmes with a control programme, in disabled readers (instructed words and uninstructed words).
Study design Individual. �Children were randomly assigned to a treatment condition and to a particular teacher� (p.771). �Subjects were randomly assigned to a treatment condition and to instructed word lists� (p.773). No further details provided.
Participants 54 disabled readers. Inclusion criteria � aged 7-13 years, evidence of specific underachievement in reading (had to score below 25th percentile, replicable on 4 of the 5 different measures). Exclusion criteria � English as a 2nd language, history of extreme hyperactivity, hearing impairment, brain damage, a chronic medical condition, serious emotional disturbance. 38 boys, 16 girls. Average intelligence in middle socio-economic ranges according to Blishen scales. Age/Grade: mean age 8.4 yrs (SD 1.6)
Intervention 1. REG ≠ EXC. Intensive systematic instruction in word recognition and spelling skills. Regular words taught by training the constituent letter-sound mappings. Exception words were introduced and rehearsed by whole-word methods alone. 35 sessions x 60 minutes, 4 times per week. 2. REG = EXC. Intensive systematic instruction in word recognition and spelling skills. Both regular and exception words were taught the �exception word� way. 35 sessions x 60 minutes, 4 times per week.
Control CSS (Classroom survival skills programme, revised version). Received training in areas of classroom etiquette, life skills, organisational strategies, academic problem solving and self-help techniques. No direct instruction and no exposure to print were offered.

75
APPENDIX J: Data extraction tables for all studies included in the meta-analyses, cont.
Martinussen, R.L. and Kirby, J.R.. (1998) Instruction in successive and phonological processing to improve the reading acquisition skills of at-risk kindergarten children, Developmental Disabilities Bulletin, 26(2): 19-39. Country of origin Canada Setting Separate lessons for intervention groups (in groups of 2 to 3). Controls stayed in
usual classroom. Objective To examine the effects of instruction in successive and phonological processing
upon the phonological and early reading skills of kindergarten children judged to be at-risk for later reading failure.
Study design Individual. �The 43 subjects with parental consent to participate in the study were randomly assigned, by stratified randomization to three conditions� (p.24)
Participants 161 kindergarteners assessed on successive and phonological processing. Low performers selected. N = 43 subjects with parental consent. Two dropouts and mean age/gender is based on n = 41. 24 boys. Same number of males/females in each group. No child in any group able to read any words on word attack/word identification at pre-test. Age/Grade: Mean age 69 months.
Intervention 1. Successive phonological group, n = 15. Oriented to blending phonemes, rhyming words and sounds. Five main tasks: linear and non-linear matrices, joining shapes, window sequencing and sequential analysis.
2. Meaning oriented group, n = 15. Designed to be similar to regular activities in classroom. Focused on the meaning of the story and words within the stories. Words were not analyzed phonetically and no special attention was given to individual letters in words.
Both groups had 8 week intervention. 2 to 3, 20 minute sessions per week (number of sessions varied from 17 to 20). Both received letter-identity and letter-sound instruction for nine letters and both read to by the instructors.
Control Remained in class and received regular classroom instruction, n = 13.

76
APPENDIX J: Data extraction tables for all studies included in the meta-analyses, cont.
O’Connor, R.E. and Padeliadu, S. (2000) Blending versus whole word approaches in first grade remedial reading: Short-term and delayed effects on reading and spelling words, Reading and Writing: An Interdisciplinary Journal, 13(1-2): 159-82. Country of origin USA Setting 1:1 tutoring � taken out of class Objective Selected children with significant deficits in reading words in phonological
awareness skills and in spelling toward end of 1st grade to test whether specific instruction in phonological decoding and blending or whole word reading, each combined with letter-sound instruction and spelling, could have an immediate and delayed effect on their learning a small core of words and transferring their learning to novel words.
Study design Individual. �Lowest skilled children randomly assigned to the blending or whole word condition� (p.168).
Participants 12 children in four 1st grade classes in urban elementary school were selected. 2 girls, 10 boys. 4 African American, 8 European American. All read 5 or fewer words correctly on letter-word identification test of WRMT of Achievement, scored one or more SDs below the 1st grade mean score on the blending test, had full scale IQ scores >59, nominated by teachers as very poor readers. Included 4 children receiving special education services for mild disabilities (2 with serious emotional disturbance and 2 with learning disabilities). Age/Grade: 1st grade.
Intervention Blending, n = 6. Phonological decoding and blending. Shown words one at a time and taught how to blend the first two letter sounds and then to add the final consonant.
Control Whole word approach, n = 6. Cumulative introduction of whole words. Shown each word one at a time. Instructors read the word, then child read it. Both groups � 10 1:1 training sessions of 10 to 13 minutes each. Follow-up after last session and 8 days later.
77
APPENDIX J: Data extraction tables for all studies included in the meta-analyses, cont.
Skailand, D.B. (1971) A comparison of four language units in teaching beginning reading, Paper presented at Annual Meeting American Educational Research Association, New York, 7 February 1971 Country of origin USA Setting Four kindergarten classes at an elementary school in Oakland, California. Objective To compare the effectiveness of four language units and beginning reading
approaches: the grapheme phoneme (synthetic), the morpheme (similar spelling pattern), the morphophone morphographeme (contrastive spelling pattern) and the whole word (sight) approach. To teach kindergarten children to read a limited number of words and syllables.
Study design Individual RCT. The research design was a modified experimental treatment/control group design. Placement in one of the four treatments was by random assignment after ranking within each of the four kindergarten classes according to pre-treatment scores on the Pintner-Cunningham Primary Test. (p.4)
Participants 86 kindergarten children in four classes at an elementary school in Oakland, California. Race stats given as: 76% Negro, 13% Spanish surname(?), 10% Other Caucasian, and 1% Oriental. Socio-economic level is given as �breadwinners� employment� categories: approx two-fifths blue-collar, one-fourth each white collar and unemployed, and the remainder service or tradesmen. Four treatments were repeated four times on each teaching day, so that there were sixteen groups of approximately six children each receiving instruction for periods of fifteen minutes � twice weekly for ten weeks, commencing January 1970. All instruction was by the experimenter. Claims made that �either spelling pattern treatment favoured girls� but no gender stats given.
Intervention Grapheme/phoneme treatment involved the production of the sounds represented by each letter and then the blending or synthesis of the letters into the word or syllable. Morpheme - presented the words in pairs according to similarity of spelling patterns. Morphophone morphographeme� utilized contrastive predictable spelling patterns.
Control Whole word treatment � graphic form was presented simultaneously with its oral counterparts.

78
APPENDIX J: Data extraction tables for all studies included in the meta-analyses, cont.
Torgesen, J.K. et al. (1999) Preventing reading failure in young children with phonological processing disabilities: group and individual responses to instruction, Journal of Educational Psychology, 91(4): 579-93. Country of origin USA Setting Within school � 13 elementary schools. Objective To examine the effectiveness of several instructional procedures for a specific
subset of children who are at risk of reading difficulty � delayed development of phonological skill on entering school. 4 conditions: no treatment control, regular classroom support, embedded phonics phonological awareness plus synthetic phonics.
Study design Individual RCT. Children were randomly assigned within school to one of four conditions.
Participants 180 children who obtained lowest combined scores on letter naming task and phoneme elision task (screening battery) and who had an estimated verbal intelligence score above 75. NTC RCS PASP EP M (SD) M (SD) M (SD) M (SD) Age (months) 66.0 (3.6) 64.9 (3.3) 65.8 (3.8) 65.2 (3.2) Gender 22M, 22F 26M, 19F 24M, 21F 23M, 22F Race 24AF, 21W 23AF, 21W 22AF, 22W 25AF, 20W
Intervention Subjects in treatment conditions received four 20-minute sessions of one-to-one instruction per week for two and a half years, beginning second semester of kindergarten until end of 2nd grade. RCS � regular classroom support. EP � embedded phonics. PASP � phonological awareness plus synthetic phonics � explicit instruction in phonemic awareness.
Control Received no treatment (NTC).

79
APPENDIX J: Data extraction tables for all studies included in the meta-analyses, cont.
Torgesen, J.K. et al. (2001) Intensive remedial instruction for children with severe reading disabilities: Immediate and long-term outcomes from two instructional approaches, Journal of Learning Disabilities, 34(1): 33-58. Country of origin USA Setting Room provided on school grounds. Objective To determine whether two approaches that both contain explicit instruction in
word level skills but vary systematically in their depth of instruction in phonemic awareness and extent of practice in decontextualized phonemic decoding skills would affect specific reading skills in different ways.
Study design Individual. �Children identified as eligible for the study were randomly assigned to one of two groups�. (p.37)
Participants 60 children, aged 8-10 previously identified as learning disabled. Each year for 3 years 20 children were selected from LD classes in three elementary schools in the state of Florida Inclusion criteria: • Identified by teachers as having serious difficulty acquiring word level reading
skills. • Average standard score on two measures of word-level reading was at least 1.5
SDs below age average. • Established verbal intelligence above 75. Performed below minimum required levels for their grade on a measure of phonological awareness. Exclusion criteria: • Adopted. • Evidence of acquired neurologic disease. • Experienced perinatal encephalopathic event. • Sensory deficits. • Evidence of chronic medical illness. • Showed some form of severe psychopathology. • English was second language. ADD group 22 male:8 female, 18 white:12 black. EP group 21 male:9 female, 21 white:9 black. Age/Grade: ADD 117.6 months (10.5), EP 117.6 months (12.6).
Intervention Embedded Phonics (EP) n = 30. Stimulated phonemic awareness through writing and spelling activities, taught phonemic decoding strategies directly and spent a much greater percentage of instructional time in reading and writing connected text. Phonemic awareness was stimulated during spelling and writing activities, and word identification strategies were practised extensively while participants read the text.
Control Auditory Discrimination in Depth Program (ADD) n = 30. Now called/revised to The Lindamood Phoneme Sequencing Program for Reading, Spelling and Speech. Stimulated phonemic awareness via articulatory cues and spent almost all the instructional time building phonemic/articulatory awareness and individual word-reading skills. Both groups: 1:1 basis in two 50-minute sessions each day of the week. Training provided over period of 8 to 9 weeks until 67.5 hours of instruction completed. Followed up 2 to 3 weeks immediately following end of intensive training period plus 1 and 2 year intervals.

80
APPENDIX J: Data extraction tables for all studies included in the meta-analyses, cont.
Umbach, B., Darch, C. and Halpin, G. (1989) Teaching reading to low performing first graders in rural schools: A comparison of two instructional approaches, Journal of Instructional Psychology, 16(3): 112-21 Country of origin USA Setting Usual classrooms, two 1st grade classrooms. Objective To determine if there was a difference between the reading performance of low-
performing students taught by a traditional basal approach and a more structured direct instruction approach.
Study design Individual. �These students were randomly assigned to either the experimental group or the comparison group�. (p.114)
Outcome measures WRMT: letter identification, word identification, word attack, word comprehension and passage comprehension. WRAT (post-test only)
Participants 31 students from two 1st grade classrooms in a rural community in the Southeast United States. Low income area. Students nominated by regular teachers as students having difficulty with reading and needed extra help. Direct instruction Basal Male 10 9 Female 5 7 Black 15 15 White 0 1 Age/Grade: 1st grade.
Intervention Direct Instruction (n = 15). From the Reading Mastery Series (1986). Structured scripted teacher presentation manuals. Students taught every required academic skill. Uses synthetic phonics approach � all skills broken down into small steps and opportunity for repeated practice provided. Students taught to blend sounds together before required to sound out simple words. Taught by 4 masters degree students.
Control Basal Program (n = 16). Used Houghton-Mifflin reading series 1983. Was used in school system. Groups of 8 with regular teacher and university practica student. Teachers closely followed teachers guide and students presented with variety of activities in ever changing organizational structures. Correction procedures used in much less explicit manner. Both groups had approx 50 mins each day (8.30am to 9.20am) for entire school year.

81
Appendix K: Raw data (means, standard deviations and numbers): studies included in main analysis and secondary analysis Mean accuracy scores Study IntN IntM IntSD CntN CntM CntSDBerninger 17 91.29 6.2 17 89.71 3.82Brown 6 23.24 19.6 6 19.06 11.54Greaney 18 24.25 6.89 18 22.25 6.56Haskell 12 11.62 8.53 12 10.92 10.83Johnston 30 5.4 0.3 29 5 0.5Leach 10 7.11 0.47 10 6.76 0.36Lovett89 60 61.3 6.96 61 59.75 7.35Lovett90 18 43.2 30.33 18 49.55 33.52Martinussen 13 1.4 3.83 15 0.2 0.54O'Connor 6 17.5 4.9 6 14.5 5.6Skailand 23 5.3 3.94 19 6.26 7.23Torgesen99 45 0.98 1.65 45 0.87 1.46Torgesen01 24 86.1 10.6 26 89.4 10.46Umbach 15 63.96 9.93 16 32.28 12.69 Accuracy 1 scores Study IntN IntM IntSD CntN CntM CntSDBerninger 17 91.29 6.2 17 89.71 3.82Brown 6 33.52 25.23 6 33.08 15.49Greaney 18 29.11 6.69 18 26.5 6.48Haskell 12 18.5 11.7 12 17.25 14.83Johnston 30 5.4 0.3 29 5 0.5Leach 10 7.11 0.47 10 6.76 0.36Lovett89 60 81.9 6.2 61 80.8 6.25Lovett90 18 49.5 35.2 18 58.4 38.4Martinussen 13 1.8 4.9 15 0.1 0.3O'Connor 6 17.5 4.9 6 14.5 5.6Skailand 23 5.3 3.94 19 6.26 7.23Torgesen99 45 0.76 1.7 45 0.14 0.53Torgesen01 26 90.3 8.3 24 96.4 7Umbach 15 30.43 9.75 16 17 10.36 Comprehension scores Study IntN IntM IntSD CntN CntM CntSDLeach 10 7.06 0.47 10 6.84 0.25Lovett89 60 27.4 6.2 61 26.9 6.25Torgesen01 26 92 19.8 24 91 9Umbach 15 9.46 5.3 16 3.83 4.82 Spelling 1 scores Study IntN IntM IntSD CntN CntM CntSDBrown G1 6 5.61 4.57 6 2.83 2Lovett89 60 78.8 6.2 61 78.8 6.25Martinussen 13 4.5 3.9 15 3.5 2.4O'Connor 6 4.7 1.5 6 5 2.2

82
Synthetic vs analytic scores IntN IntM IntSD CntN CntM CntSDJohnston 30 5.4 0.3 33 5 0.3Skailand 23 5.3 3.94 23 12.13 8.37Torgesen average 45 0.98 1.65 45 1.49 2.38Torgesen99 45 0.76 1.7 45 0.28 1.3Torgesen 99 45 1.2 1.6 45 2.7 3.1 KEY: IntN = Intervention number IntM = Intervention mean IntSD = Intervention standard deviation CntN = Control number CntM = Control mean CntSD = Control standard deviation

Copies of this publication can be obtained from:
DfES PublicationsP.O. Box 5050Sherwood ParkAnnesleyNottinghamNG15 0DJ
Tel: 0845 60 222 60Fax: 0845 60 333 60Minicom: 0845 60 555 60Oneline: www.dfespublications.gov.uk
© The University of Sheffield 2006
Produced by the Department for Education and Skills
ISBN 1 84478 659 5Ref No: RR711www.dfes.go.uk/research