about the foundation for alcohol...
TRANSCRIPT

ANNUAL ALCOHOL POLL 2018 1

FOUNDATION FOR ALCOHOL RESEARCH & EDUCATION2
ABOUT THE FOUNDATION FOR ALCOHOL RESEARCH AND EDUCATION
The Foundation for Alcohol Research and Education (FARE) is an independent, not-for-profit organisation working to stop the harm caused by alcohol.
Alcohol harm in Australia is significant. More than 5,500 lives are lost every year and more than 157,000 people are hospitalised making alcohol one of our nation’s greatest preventive health challenges.
For more than 15 years, FARE has been working with communities, governments, health professionals and police across the country to stop alcohol harm by supporting world-leading research, raising public awareness and advocating for changes to alcohol policy.
FARE is guided by the World Health Organization’s (2010) Global Strategy to Reduce the Harmful Use of Alcohol for stopping alcohol harm through population-based strategies, problem directed policies, and direct interventions.
If you would like to contribute to FARE’s important work, call us on (02) 6122 8600 or email [email protected].
ANNUAL ALCOHOL POLL 2018 3
CONTENTS
OVERVIEW........................................................................................ 4
THE APPROACH..............................................................................6
THE FINDINGS
Attitudes towards alcohol in Australia...............................8
Alcohol consumption behaviours........................................16
Awareness and experiences of alcohol harm.................25
Perspectives on alcohol-related policies..........................34
SUMMARY TABLES BY DEMOGRAPHICS
State and territory..............................................................39
Gender..........................................................................41
Age..................................................................................43
Consumption.................................................................45
Voting intentions..................................................................47

FOUNDATION FOR ALCOHOL RESEARCH & EDUCATION4
OVERVIEW
The Foundation for Alcohol Research and Education’s (FARE) Annual alcohol poll: Attitudes and behaviours (the Poll) assesses Australians’ attitudes towards alcohol, alcohol consumption behaviours, awareness and experiences of alcohol harm, and perspectives on various alcohol policies. In 2018, the Poll was carried out by YouGov Galaxy for the ninth consecutive year.
The Poll continues to show that a vast majority of Australians surveyed are concerned about alcohol, with 73% indicating that they believe Australia has a problem with excess drinking or alcohol abuse, 71% believing that alcohol-related problems in Australia will worsen or remain the same over the next five to ten years, and 76% believing that more needs to be done to reduce the harm caused by alcohol.
In 2018 the proportion of those surveyed who consume alcohol increased to 82% (up from 77% in 2017), largely attributable to an increase in the consumption of alcohol among men to 86% (up from 80% in 2017). The proportion of Australians drinking to get drunk in 2018 remains high at 45%, largely consistent with 2017’s findings (44%). Bottled wine continues to be preferred ahead of other alcoholic beverages, with 29% of those surveyed indicating a preference for bottled wine, followed by regular strength beer (22%).
Awareness of link to long-term harmAustralians continue to have low awareness of the long-term health conditions associated with alcohol. Fewer than half of those surveyed are aware of the link between alcohol misuse and stroke (38%), mouth and throat cancer (26%) and breast cancer (16%).
Awareness of Guidelines Awareness of the Australian Guidelines to Reduce Health Risks from Drinking Alcohol (the Guidelines) increased from 58% in 2017 to 70% in 2018. However, knowledge of the Guidelines’ content remains low, with only one in four (28%) Australians aware of the actual content. The proportion of Australians who correctly estimate the recommended number of standard drinks a person can consume to minimise long-term harm increased to 42% (up from 38% in 2017), while the proportion who could correctly estimate the number of standard drinks a person can consume to minimise short term-harm (7%) is consistent with 2017’s findings.
Right to know about long-term harm associated with regular alcohol use For the first time, Australians were asked whether they thought they had a right to know about the long-term harm associated with regular alcohol use. The vast majority of Australians (84%) believe they have the right to know about long-term harm associated with regular alcohol use and most (80%) think governments have a responsibility to educate Australians about the long-term harm associated with regular alcohol use.
Alcohol industry downplaying university research In 2018, the Poll asked whether Australians thought the alcohol industry would downplay independent university research findings linking alcohol consumption to a range of harms such as cancer and family violence. Six in ten of those surveyed (61%) think the alcohol industry would downplay independent university research findings linking alcohol consumption to a range of harms. These findings suggest that the community is deeply sceptical about the industry’s motivations and business tactics.

ANNUAL ALCOHOL POLL 2018 5
Related findings demonstrate that community perceptions of the alcohol industry remain poor. The majority of Australians continue to believe that the alcohol industry targets people under the age of 18 years (55%), that it has too much influence with governments (57%) and that it makes political donations to influence policy (53%). In addition, the majority of Australians believe that the alcohol industry should pay for reducing alcohol harm (68%).
Experiences of alcohol harm Too many Australians continue to experience alcohol harm. More than one third of those surveyed (37%) indicated that they have been affected by alcohol-related violence in this year’s Poll, with almost half of these (47%) indicating they have been affected by alcohol-related violence in the last 12 months. One in four (23%) parents with a child under 18 reported that their child has been harmed or put at risk of harm because of someone else’s drinking.
In 2018, three quarters (74%) of parents believed their child under the age of 18 has been exposed to alcohol advertising, consistent with 2017 findings. Almost half of parents indicated that their child has been exposed to alcohol advertising at a supermarket or shopping centre (48%), through the radio, television or cinema (43%) or at a sporting, musical or cultural event (42%).
Support for alcohol-related policies Strong support continues to exist for a range of alcohol policy initiatives. Two thirds (67%) of Australians support placing a ban on alcohol advertising on television before 8.30pm, consistent with 2017 (68%). In addition, just over half of Australians (52%) believe alcohol sponsorship should not be allowed at sporting events (consistent with 2017, 55%), 51% support limiting the number of alcohol outlets to reduce alcohol-related family violence, and 47% support increasing the tax on alcohol to pay for health, education and treatment of alcohol-related problems.
Other 2018 findings In 2018, for the first time, Australians were asked about their use of alcohol delivery services. Around 30% of Australian drinkers surveyed reported having used an alcohol delivery service, most commonly delivery services provided by bottle shops (15%), online wine distributors (12%) and alcohol producers such as wineries, breweries and distilleries (10%). The majority of those who have used an alcohol delivery service have used one in the past 12 months (92%), with one in four (23%) reporting that they use an alcohol delivery service weekly or more often. The main reasons alcohol delivery services are used are because they are seen to provide better value for money (36%), convenience of delivery straight to your door (34%) and discounts offered for bulk purchase (28%).
For the first time, women who have been pregnant were asked a number of questions in 2018 relating to their drinking habits during pregnancy. Just over four in ten (46%) Australian women who have been pregnant said that a health professional advised them that there is no safe level of alcohol consumption while pregnant. When asked about changes made to their alcohol consumption while pregnant, three quarters of women who drank alcohol prior to becoming pregnant (78%) said that they stopped drinking alcohol altogether during pregnancy, 17% that they restricted it to special occasions, and the remaining 5% either reduced their consumption slightly, drank the same amount or said that they increased their alcohol consumption when they were pregnant.
FOUNDATION FOR ALCOHOL RESEARCH & EDUCATION6
THE APPROACH
The Foundation for Alcohol Research and Education (FARE) carried out nation-wide polling for the ninth consecutive year to determine community attitudes and behaviours relating to alcohol. The key objectives of the polling include:
• determining community attitudes towards alcohol in Australia
• gaining an understanding of self-reported alcohol consumption trends in Australia
• determining current perspectives on various alcohol-related policies.
This report provides an overview of the findings of the 2018 nation-wide Poll. It also provides, where available, information regarding trends between 2010 and 2018.
As in previous years, the Poll was commissioned by FARE and conducted by YouGov Galaxy. YouGov Galaxy is an independent market research company which conducts opinion polling throughout Australia with results published in all major Australian newspapers.
This study is conducted online among members of pureprofile, a permission-based panel that has been used since the Poll commenced in 2010. Pureprofile has a respondent panel of 375,000 members who are sourced through a variety of online and offline sources including internal referral programs, search engine optimisation techniques, offline print, trade marketing, location-based registration, and radio advertising. Panel members are paid on a per-minute basis for participation.
The sample for this survey is selected among panel members with quotas applied to ensure that it reflects the current Australian population. The results of the Poll are weighted by age, sex, and capital city or non-capital city areas within each state and territory using Australian Bureau of Statistics (ABS) population proportions from the 2016 Census (Cat no. 2901.0). These proportions are updated each year using the ABS resident population of Australia projections. The weighting of the sample using ABS estimates ensures consistency from one time period to the next.
The survey sample is 1,820 respondents. A sample size of 1,820 allows accuracy within ±2.3% at the 95% confidence interval.
The questionnaire was designed by YouGov Galaxy in consultation with FARE. The questionnaire was transferred into Web Survey Creator format in order to be hosted online. For each question, the respondent had to click on the response which represented their answer. In addition to questions about alcohol, the questionnaire asked respondents about their place of residence, age and gender. Respondents were also asked about their voting intentions.
Fieldwork commenced on Tuesday 9 January 2018 and was completed on Tuesday 16 January 2018. The respondents were aged 18 years and older, distributed throughout Australia as follows:
• Australian Capital Territory – 100
• New South Wales – 350
• Northern Territory – 20
• Queensland – 300
• South Australia – 300
• Tasmania – 100
• Victoria – 350
• Western Australia – 300
ANNUAL ALCOHOL POLL 2018 7
In this report, a number of questions are analysed by states and territories. The Australian Capital Territory, Tasmania and the Northern Territory are not used in these analyses because sufficient data for comparison purposes could not be obtained from these jurisdictions.
High-level results are presented in the findings section of this report. Differences between demographics are only presented where differences are statistically significant at a 95% confidence interval. Where a question is being asked for the first time, this is specified in the findings. Where a question has been asked before, trend data is provided for the previous year or years of results.
Reporting of demographic differences focus on gender and age. In the case of age, on some occasions, adjacent age categories have been combined (such as ’18 to 24 year olds and 25 to 34 year olds’, into ’18 to 34 year olds’) if the groups have similar proportions and if combining the groups confers greater statistical power.
KEY TERMS
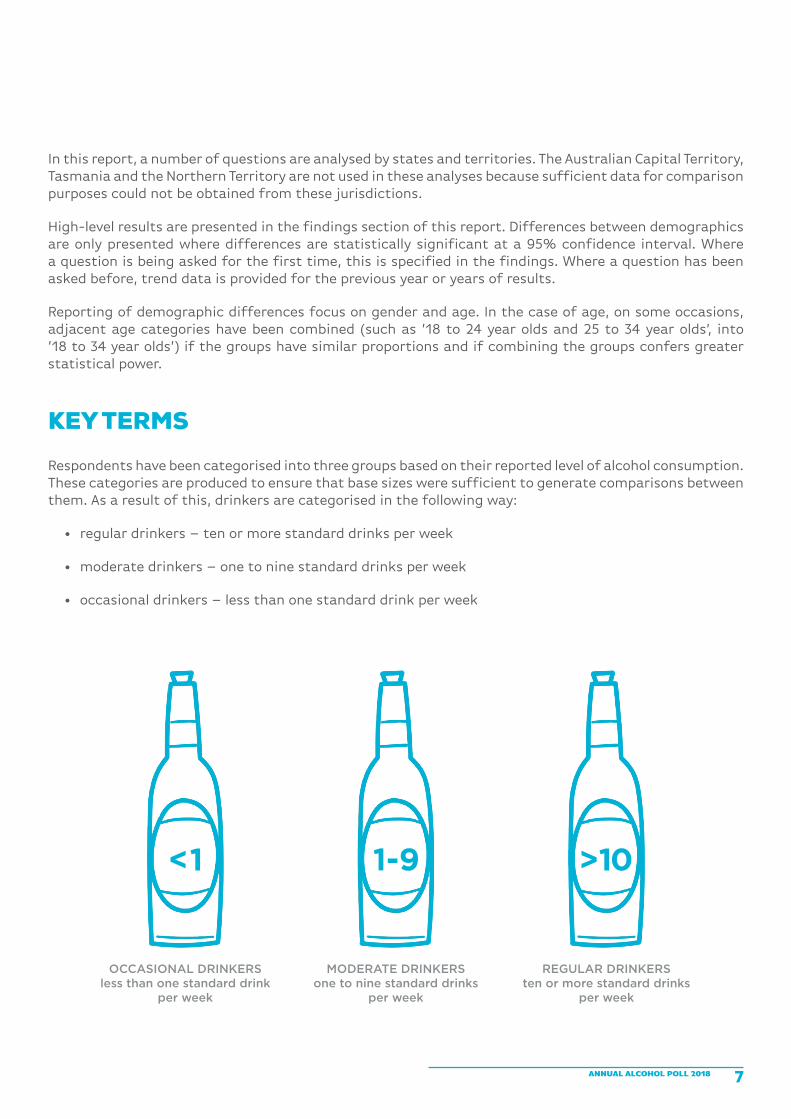
Respondents have been categorised into three groups based on their reported level of alcohol consumption. These categories are produced to ensure that base sizes were sufficient to generate comparisons between them. As a result of this, drinkers are categorised in the following way:
• regular drinkers – ten or more standard drinks per week
• moderate drinkers – one to nine standard drinks per week
• occasional drinkers – less than one standard drink per week
REGULAR DRINKERSten or more standard drinks
per week
MODERATE DRINKERSone to nine standard drinks
per week
OCCASIONAL DRINKERSless than one standard drink
per week

FOUNDATION FOR ALCOHOL RESEARCH & EDUCATION8
ATTITUDES TOWARDS ALCOHOL IN AUSTRALIA
PERCEPTIONS OF THE MOST HARMFUL DRUG IN AUSTRALIA
32% of Australians consider alcohol to be the drug that causes the most harm, behind illegal drugs (46%) and ahead of tobacco (11%) and pharmaceuticals (7%).
One third of Australians (32%) consider alcohol to be the drug that causes the most harm in Australia, behind illegal drugs (46%) and ahead of tobacco (11%) and pharmaceuticals and prescription drugs (7%), while 3% of Australians are unsure. This is consistent with 2017 results.
The following graph provides an overview of community perceptions of the drug that causes the most harm to Australians between 2014 and 2018.
Analysis of demographic results revealed that:
• Men (15%) are more likely than women (8%) to consider tobacco to be the drug that causes the most harm to Australians.
• In contrast, women (49%) are more likely than men (42%) to think that illegal drugs cause the most harm to Australians.
25
47
18
5 5
36
40
15
4 5
44
35
10
5 6
44
35
11
6 5
46
32
11
7
3
0
10
20
30
40
50
Illegal drugs Alcohol Tobacco Pharmaceutical/prescription drugs
Don't know
2014 (%) 2015 (%) 2016 (%) 2017 (%) 2018 (%)

ANNUAL ALCOHOL POLL 2018 9
AUSTRALIA’S PROBLEM WITH ALCOHOL
73% of people believe that Australia has a problem with excess drinking or alcohol abuse.
Around three quarters (73%) of people believe that Australia has a problem with excess drinking or alcohol abuse, while 16% do not believe this and 12% are unsure. This represents a decline from 2017 (78%).
The following table provides an overview of community perceptions of Australia’s problem with excess drinking or alcohol abuse, between 2010 and 2018.
2010 (%) 2011 (%) 2012 (%) 2013 (%) 2014 (%) 2015 (%) 2016 (%) 2017 (%) 2018 (%)
Yes 73 80 76 75 78 75 78 78 73↓
No 16 14 15 14 12 15 12 12 16↑
Unsure 11 6 9 11 10 11 10 9 12
↑ ↓ denotes a significant change from the previous year’s results (applied to 2018 data only).
Analysis of demographic results revealed that:
• Women (81%) are more likely than men (64%) to believe that Australia has a problem with alcohol.
• Men 35 years and older (68%) are more likely than men 18 to 34 years (59%) to think that Australia has a problem with excess drinking or alcohol abuse.
• The reverse trend was found for women with women 18 to 34 years (87%) being more likely than women 35 years and older (76%) to believe that Australia has a problem with excess drinking or alcohol abuse.
Analysis of five-year moving averages between 2010 and 2018 demonstrates that the proportion of people who believe Australia has a problem with excess drinking or alcohol abuse has remained relatively consistent over this period. The following graph provides an overview of the five-year moving average of community perceptions of Australia’s problem with excess drinking or alcohol abuse.
60
65
70
75
80
85
2010 2011 2012 2013 2014 2015 2016 2017 2018

FOUNDATION FOR ALCOHOL RESEARCH & EDUCATION10
CONCERNS ASSOCIATED WITH ALCOHOL
Australians are most concerned about alcohol-related road traffic accidents (78%), violence (75%) and child abuse and neglect (70%).
The three main alcohol-related problems associated with excess drinking or alcohol abuse that Australians are most concerned about are road traffic accidents (78%), violence (75%) and child abuse and neglect (70%). The top three concerns remain consistent with 2017, however, there has been an increase in the proportion of Australians concerned about health problems (from 53% to 57%).
The following table provides an overview of the alcohol-related problems Australians are most concerned about, between 2012 and 2018.
2012 (%) 2013 (%) 2014 (%) 2015 (%) 2016 (%) 2017 (%) 2018 (%)
Road traffic accidents 82 80 79 77 76 78 78
Violence 76 78 81 78 79 76 75
Child abuse and neglect 68 70 66 64 64 71 70
Health problems 62 62 52 51 53 53 57↑
Crime 52 57 59 54 58 57 56
Harm to unborn babies from exposure to alcohol in-utero 57 59 52 48 50 54 52
Lost productivity 27 31 21 22 24 29 27
Excessive noise around pubs and clubs 24 26 19 20 20 21 18
None of the above 2 4 3 5 5 3 5
↑ ↓ denotes a significant change from the previous year’s results (applied to 2018 data only).
Analysis of demographic results revealed that:
• Women are more likely than men to express concern about alcohol-related road traffic accidents (84% compared to 72%), alcohol-related violence (79% compared to 70%), child abuse and neglect (76% compared to 63%), health conditions from alcohol consumption (63% compared to 51%), alcohol-related crime (59% compared to 52%) and harm to unborn babies from exposure to alcohol in-utero (57% compared to 47%).
• People aged 50 years and over are more concerned than 18 to 49 year olds, about alcohol-related road traffic accidents (89% compared to 74%), alcohol-related violence (88% compared to 69%), child abuse and neglect (84% compared to 63%), alcohol-related crime (69% compared to 50%), health conditions from alcohol consumption (65% compared to 53%) and harm to unborn babies from exposure to alcohol in-utero (61% compared to 48%).

ANNUAL ALCOHOL POLL 2018 11
WORSENING OF ALCOHOL-RELATED PROBLEMS IN AUSTRALIA
71% of people believe that alcohol-related problems in Australia will either get worse or remain the same over the next five to ten years.
Twice as many Australians believe that alcohol-related problems will get worse over the next five to ten years (36%), compared to those who think that there will be a reduction in alcohol-related problems (19%). A further 36% believe that there will be no change and 10% are unsure. The proportion of Australians who believe that alcohol-related problems will get worse or remain the same (71%) has declined since 2017 (74%).
The following table provides an overview of Australian perceptions on whether alcohol-related problems will be reduced, unchanged, or get worse, between 2012 and 2018.
2012 (%) 2013 (%) 2014 (%) 2015 (%) 2016 (%) 2017 (%) 2018 (%)
Will get a lot worse 14 17 21 14 16 14 14
Will get a little worse 27 25 25 21 22 26 22↓
Subtotal 41 42 46 35 38 40 36↓
Will be somewhat reduced 10 10 10 15 13 12 16↑
Will be significantly reduced 2 2 2 2 2 4 3
Subtotal 12 12 12 17 15 15 19↑
No change 38 36 30 36 35 34 36
Don’t know 9 10 12 12 12 11 10
↑ ↓ denotes a significant change from the previous year’s results (applied to 2018 data only).
Analysis of demographic results revealed that:
• Men (25%) are more likely than women (14%) to believe that alcohol-related problems will reduce over the next 5 to 10 years while women are more likely to think they will get worse (42% compared to 29%).

FOUNDATION FOR ALCOHOL RESEARCH & EDUCATION12
ACTIONS TO ADDRESS ALCOHOL-RELATED HARM
76% of Australians believe that more needs to be done to reduce the harm caused by alcohol-related illness, injury, death, and related issues.
The majority of Australians believe that governments (57%), alcohol companies (67%), and clubs and pubs (62%) are not doing enough to address the harm caused by alcohol in Australia.
The majority (76%) of Australians believe that more needs to be done to reduce the harm caused by alcohol-related illness, injury, death and related issues, while 12% do not believe more needs to be done and 12% are unsure. This represents a decline from 2017 (81%).
The following table provides an overview of community attitudes indicating whether Australians believe more needs to be done to address alcohol harm, between 2010 and 2018.
2010 (%) 2011 (%) 2012 (%) 2013 (%) 2014 (%) 2015 (%) 2016 (%) 2017 (%) 2018 (%)
Yes 79 82 75 74 79 73 78 81 76↓
No 9 8 13 11 7 12 9 9 12↑
Unsure 12 9 12 15 14 15 13 10 12
↑ ↓ denotes a significant change from the previous year’s results (applied to 2018 data only).
More than half of Australians (57%) believe that governments are not doing enough to address alcohol misuse, with 18% believing they are doing enough and 24% unsure. The proportion of Australians who believe governments are not doing enough has declined since 2017 (61%).
Two thirds of Australians (67%) believe that alcohol companies are not doing enough to address alcohol misuse, with 15% believing they are doing enough and 18% unsure. This is consistent with 2017 (69%).
Just over six in ten Australians (62%) believe that clubs and pubs are not doing enough to address alcohol misuse, with 21% believing they are doing enough and 17% unsure. This is consistent with 2017 findings (63%).
The following table provides an overview of Australians’ attitudes towards who they believe is not doing enough to address alcohol misuse, between 2011 and 2018.
2011 (%) 2012 (%) 2013 (%) 2014 (%) 2015 (%) 2016 (%) 2017 (%) 2018 (%)
Governments are not doing enough 58 54 56 64 55 59 61 57↓
Alcohol companies are not doing enough 74 68 67 69 66 70 69 67
Clubs and pubs are not doing enough 68 64 65 69 60 65 63 62
↑ ↓ denotes a significant change from the previous year’s results (applied to 2018 data only).

ANNUAL ALCOHOL POLL 2018 13
Analysis of demographic results revealed that:
• Women (82%) are more likely than men (70%) to believe more needs to be done to address alcohol harm.
• Australians 50 years and over (81%), 18 to 24 years (76%) and 25 to 34 years (78%) are more likely than 35 to 49 year olds (69%) to believe more needs to be done to address alcohol harm.
• Australians 50 years and over (63%) are more likely than 25 to 34 year olds (55%) and 35 to 49 year olds (53%) to think that governments are not doing enough to address alcohol harm.
• Australians aged 50 years and over (73%) are more likely than 35 to 49 year olds (61%) and 25 to 34 year olds (65%) to think that alcohol companies are not doing enough to address alcohol-related harm.
• Women (66%) are more likely than men (58%) to think that pubs and clubs are not doing enough to address alcohol-related harm.
• Australians aged 50 years and over (66%) are more likely than 35 to 49 year olds (60%) to think that pubs and clubs are not doing enough to address alcohol-related harm.
ALCOHOL INDUSTRY INFLUENCE
55% of Australians believe that the alcohol industry targets young people under 18 years of age.
57% of Australians believe that the alcohol industry has too much influence with governments.
53% of Australians believe that the alcohol industry makes political donations to influence policy.
68% of Australians believe that the alcohol industry should pay for reducing alcohol harm.
Australians were asked a range of questions about their perception of the alcohol industry’s influence. More than half of Australians (55%) believe that the alcohol industry targets young people under 18 years of age, while 33% do not and 12% are unsure.
More than half of Australians (57%) believe that the alcohol industry has too much influence with governments, while 18% do not and 25% are unsure.
More than half of Australians (53%) believe that the alcohol industry makes political donations to influence policy, while 13% do not and 34% are unsure.
The majority of Australians (68%) believe that the alcohol industry should pay for reducing alcohol harm, while 20% do not and 12% are unsure. This represents a decline from 2017 (74%).

FOUNDATION FOR ALCOHOL RESEARCH & EDUCATION14
The following table provides an overview of Australians’ perceptions of the alcohol industry between 2015 and 2018.
2015 (%) 2016 (%) 2017 (%) 2018 (%)
The alcohol industry targets young people under 18 59 57 57 55
The alcohol industry has too much influence with governments 51 56 57 57
The alcohol industry makes political donations to influence policy 54 52 55 53
The alcohol industry should pay for reducing alcohol harm 70 71 74 68↓
↑ ↓ denotes a significant change from the previous year’s results (applied to 2018 data only).
Analysis of demographic results revealed that:
• Australians aged 50 years and over (64%) are more likely than 35 to 49 year olds (47%), 25 to 34 year olds (55%) and 18 to 24 year olds (54%) to believe that the alcohol industry targets young people under 18.
• Australians aged 50 years and over (65%) are more likely than 35 to 49 year olds (51%), 25 to 34 year olds (57%) and 18 to 24 year olds (54%) to believe that the alcohol industry has too much influence with governments.
• Men are more likely than women to believe that the alcohol industry makes political donations to influence policy (59% compared to 47%).
• Australians aged 50 years and over (60%) are more likely than 35 to 49 year olds (50%), 25 to 34 year olds (53%) and 18 to 24 year olds (46%) to believe that the alcohol industry makes political donations to influence policy.
• Australians aged 50 years and over (73%) and 25 to 34 year olds (73%) are more likely than 35 to 49 year olds (64%) and 18 to 24 year olds (59%) to believe that the alcohol industry should pay for reducing alcohol harm.
ALCOHOL INDUSTRY DOWNPLAYING UNIVERSITY RESEARCH
61% of Australians believe that the alcohol industry would downplay independent university research findings linking alcohol consumption to a range of harm such as cancer and family violence.
For the first time, Australians were asked in 2018 whether they thought the alcohol industry would downplay independent university research findings linking alcohol consumption to a range of harms such as cancer and family violence. Six in ten Australians (61%) think the alcohol industry would downplay independent university research findings linking alcohol consumption to a range of harms such as cancer and family violence, while 17% think it would not and 22% are unsure.
Analysis of demographic results revealed that:
• Australians aged 50 years and over (67%) are more likely than 35 to 49 year olds (58%), 25 to 34 year olds (61%) and 18 to 24 year olds (56%) to think the alcohol industry would downplay independent university research findings linking alcohol consumption to a range of harms such as cancer and family violence.

ANNUAL ALCOHOL POLL 2018 15
AWARENESS OF FOREIGN OWNERSHIP OF AUSTRALIA’S BEST-KNOWN ALCOHOL BRANDS
25% of Australians are surprised that Australia’s best-known alcohol brands, Victoria Bitter, XXXX Gold, Tooheys and James Boags, are owned by foreign-owned multinational alcohol companies.
28% of Australians say knowing that Victoria Bitter, XXXX Gold, Tooheys and James Boags are owned by foreign-owned multinational alcohol companies would influence their next purchase of alcohol.
For the first time, Australians were asked in 2018 about whether they were surprised to know that Australia’s best-known alcohol brands, Victoria Bitter, XXXX Gold, Tooheys and James Boags, are owned by foreign-owned multinational alcohol companies. One in four Australians (25%) are surprised that these brands are owned by foreign-owned companies, while 68% are not surprised and 6% didn’t know.
Once armed with the knowledge of foreign ownership of these brands, 28% of Australians say it is very likely or likely it would influence their next purchase of alcohol while 60% say it is unlikely or very unlikely.
The following table provides an overview of how knowledge of foreign ownership of alcohol brands would influence their next purchase of alcohol.
WHETHER WOULD INFLUENCE NEXT PURCHASE OF ALCOHOL 2018 (%)
Very likely 11
Likely 17
Unlikely 37
Very unlikely 23
Don’t know 12
Analysis of demographic results revealed that:
• Women (29%) are more likely than men (21%) to say they are surprised that Australia’s best-known alcohol brands, Victoria Bitter, XXXX Gold, Tooheys and James Boags, are owned by foreign-owned multinational alcohol companies.
• Australians 18 to 34 years (31%) are more likely than those 35 years and older (22%) to say they are surprised that Australia’s best-known alcohol brands, Victoria Bitter, XXXX Gold, Tooheys and James Boags, are owned by foreign-owned multinational alcohol companies.
• Australians 18 to 34 years (33%) are more likely than those 35 years and older (25%) to say knowledge of foreign ownership of these alcohol brands is likely to influence their next purchase of alcohol.

FOUNDATION FOR ALCOHOL RESEARCH & EDUCATION16
ALCOHOL CONSUMPTION BEHAVIOURS
FREQUENCY OF CONSUMING ALCOHOL
Alcohol is consumed by 82% of Australian adults.
76% of Australian drinkers consume alcohol on two days or fewer per week, while 24% consume alcohol on three days or more per week.
Alcohol is consumed by 82% of Australian adults. This represents an increase from 2017 where the Poll found alcohol was consumed by 77% of adults.
The following table provides an overview of alcohol consumption by gender, between 2010 and 2018.
2010 (%) 2011 (%) 2012 (%) 2013 (%) 2014 (%) 2015 (%) 2016 (%) 2017 (%) 2018 (%)
Men 83 88 85 81 82 80 83 80 86↑
Women 78 80 77 74 76 77 73 74 78↑
Total 81 84 81 77 79 79 78 77 82↑
↑ ↓ denotes a significant change from the previous year’s results (applied to 2018 data only).
Analysis of demographic results revealed that:
• Men (86%) are more likely than women (78%) to consume alcohol.
• Australians 25 to 34 years (86%) and 35 to 49 years (84%) are more likely than those 50 years and older (77%) to consume alcohol.
On average, Australian drinkers consume alcohol on 1.6 days a week. This is consistent with previous years, with Australian drinkers consuming alcohol on average 1.6 days a week in 2017 and 1.7 days a week in 2016. While the majority of Australian drinkers (76%) consume alcohol on two days or less per week, 18% consume alcohol on three to six days per week and 6% of Australians drink daily.
The following table provides an overview of the number of occasions alcohol is consumed per week, between 2010 and 2018.
2010 (%) 2011 (%) 2012 (%) 2013 (%) 2014 (%) 2015 (%) 2016 (%) 2017 (%) 2018 (%)
Two days or less per week 69 71 72 73 77 76 76 76 76
Three days or more per week 31 29 28 27 23 24 24 24 24
ANNUAL ALCOHOL POLL 2018 17
Analysis of demographic results revealed that:
• Men who consume alcohol are more likely to drink on more occasions per week, with 28% of men consuming alcohol three times or more a week compared to 19% of women.
• Older Australians who consume alcohol are more likely to drink on more occasions in one week, with 26% of those aged 35 to 49 years and 40% of those 50 years and over consuming alcohol on three days or more a week, compared to 13% of 25 to 34 year olds and 7% of 18 to 24 year olds.
AMOUNT OF ALCOHOL CONSUMED
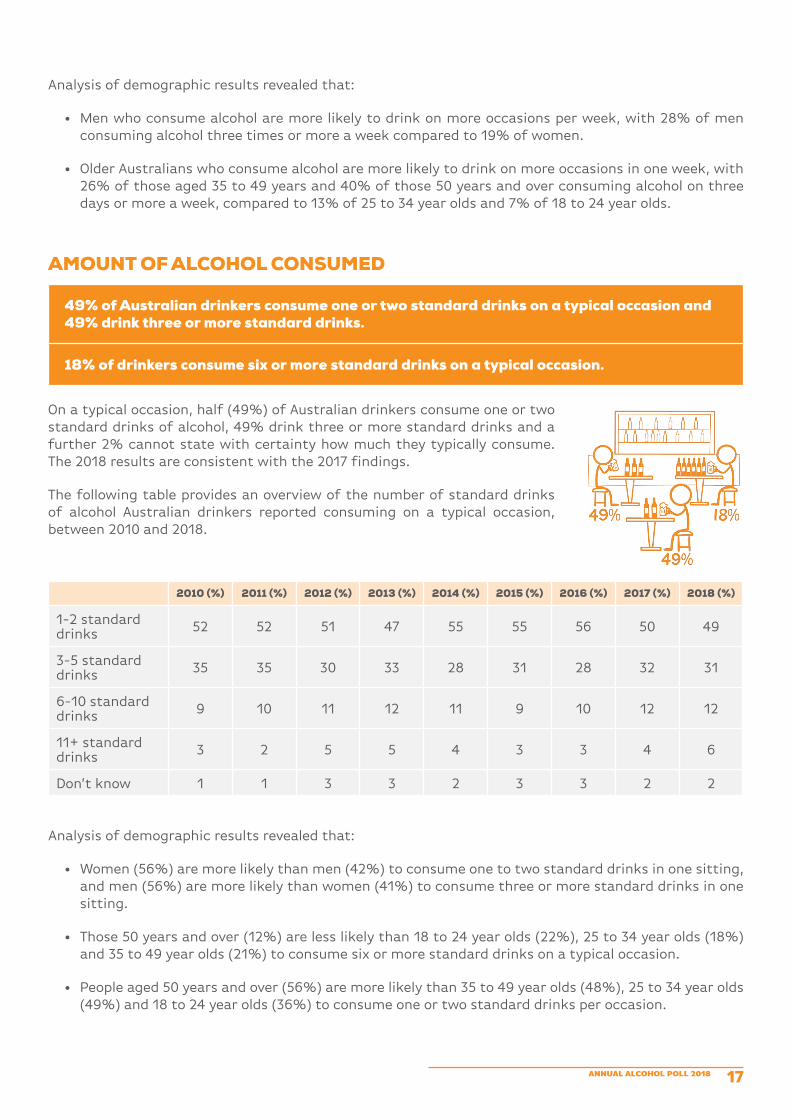
49% of Australian drinkers consume one or two standard drinks on a typical occasion and 49% drink three or more standard drinks.
18% of drinkers consume six or more standard drinks on a typical occasion.
On a typical occasion, half (49%) of Australian drinkers consume one or two standard drinks of alcohol, 49% drink three or more standard drinks and a further 2% cannot state with certainty how much they typically consume. The 2018 results are consistent with the 2017 findings.
The following table provides an overview of the number of standard drinks of alcohol Australian drinkers reported consuming on a typical occasion, between 2010 and 2018.
2010 (%) 2011 (%) 2012 (%) 2013 (%) 2014 (%) 2015 (%) 2016 (%) 2017 (%) 2018 (%)
1-2 standard drinks 52 52 51 47 55 55 56 50 49
3-5 standard drinks 35 35 30 33 28 31 28 32 31
6-10 standard drinks 9 10 11 12 11 9 10 12 12
11+ standard drinks 3 2 5 5 4 3 3 4 6
Don’t know 1 1 3 3 2 3 3 2 2
Analysis of demographic results revealed that:
• Women (56%) are more likely than men (42%) to consume one to two standard drinks in one sitting, and men (56%) are more likely than women (41%) to consume three or more standard drinks in one sitting.
• Those 50 years and over (12%) are less likely than 18 to 24 year olds (22%), 25 to 34 year olds (18%) and 35 to 49 year olds (21%) to consume six or more standard drinks on a typical occasion.
• People aged 50 years and over (56%) are more likely than 35 to 49 year olds (48%), 25 to 34 year olds (49%) and 18 to 24 year olds (36%) to consume one or two standard drinks per occasion.
FOUNDATION FOR ALCOHOL RESEARCH & EDUCATION18
ALCOHOL PRODUCT PREFERENCES
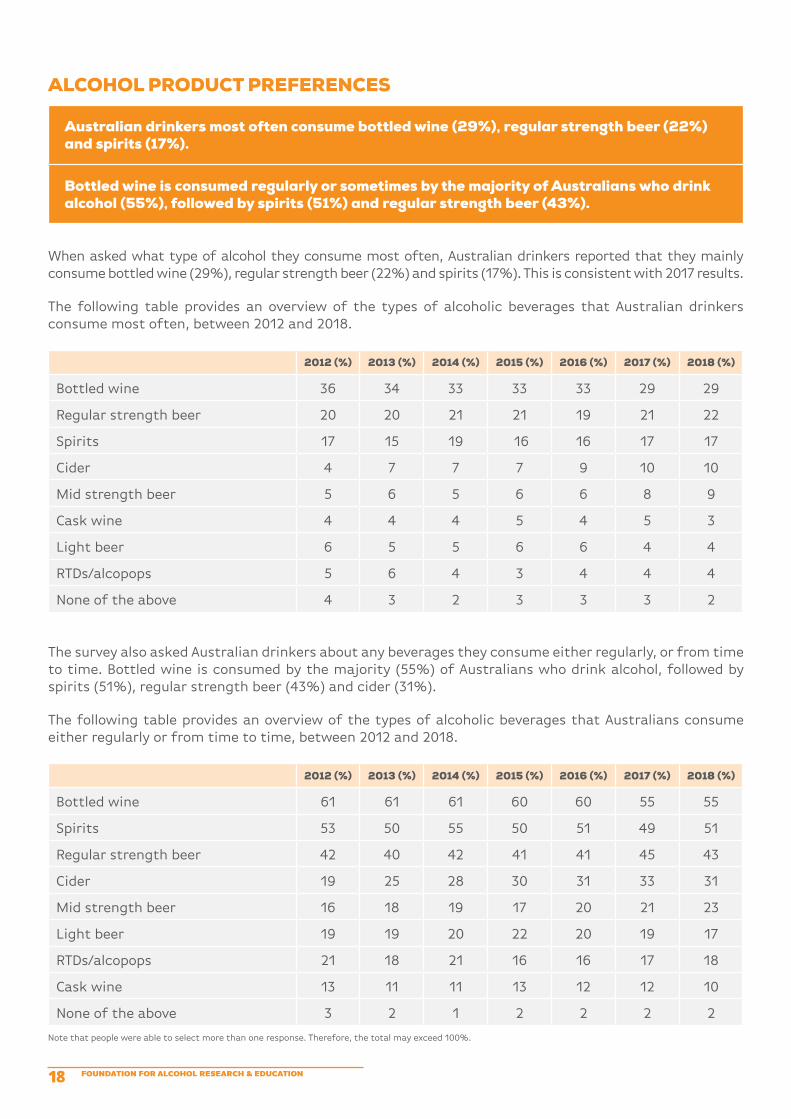
Australian drinkers most often consume bottled wine (29%), regular strength beer (22%) and spirits (17%).
Bottled wine is consumed regularly or sometimes by the majority of Australians who drink alcohol (55%), followed by spirits (51%) and regular strength beer (43%).
When asked what type of alcohol they consume most often, Australian drinkers reported that they mainly consume bottled wine (29%), regular strength beer (22%) and spirits (17%). This is consistent with 2017 results.
The following table provides an overview of the types of alcoholic beverages that Australian drinkers consume most often, between 2012 and 2018.
2012 (%) 2013 (%) 2014 (%) 2015 (%) 2016 (%) 2017 (%) 2018 (%)
Bottled wine 36 34 33 33 33 29 29
Regular strength beer 20 20 21 21 19 21 22
Spirits 17 15 19 16 16 17 17
Cider 4 7 7 7 9 10 10
Mid strength beer 5 6 5 6 6 8 9
Cask wine 4 4 4 5 4 5 3
Light beer 6 5 5 6 6 4 4
RTDs/alcopops 5 6 4 3 4 4 4
None of the above 4 3 2 3 3 3 2
The survey also asked Australian drinkers about any beverages they consume either regularly, or from time to time. Bottled wine is consumed by the majority (55%) of Australians who drink alcohol, followed by spirits (51%), regular strength beer (43%) and cider (31%).
The following table provides an overview of the types of alcoholic beverages that Australians consume either regularly or from time to time, between 2012 and 2018.
2012 (%) 2013 (%) 2014 (%) 2015 (%) 2016 (%) 2017 (%) 2018 (%)
Bottled wine 61 61 61 60 60 55 55
Spirits 53 50 55 50 51 49 51
Regular strength beer 42 40 42 41 41 45 43
Cider 19 25 28 30 31 33 31
Mid strength beer 16 18 19 17 20 21 23
Light beer 19 19 20 22 20 19 17
RTDs/alcopops 21 18 21 16 16 17 18
Cask wine 13 11 11 13 12 12 10
None of the above 3 2 1 2 2 2 2
Note that people were able to select more than one response. Therefore, the total may exceed 100%.

ANNUAL ALCOHOL POLL 2018 19
Analysis of demographic results revealed that:
• Women are more likely to choose bottled wine (41%) as their main drink of choice, while regular strength beer is favoured by men (34%).
• Men are more likely than women to mainly drink mid strength beer (12% compared to 5%) and regular strength beer (34% compared to 10%) while women are more likely to drink bottled wine (41% compared to 19%), cider (14% compared to 6%) and RTDs/alcohol pops (6% compared to 2%).
• Men are more likely than women to ever consume regular strength beer (60% compared to 25%), mid strength beer (33% compared to 12%) and light beer (22% compared to 12%) while women are more likely to ever consume bottled wine (64% compared to 47%), cider (37% compared to 26%) and RTDs/alco-pops (20% compared to 15%).
• Australians aged 50 years and over (43%) are more likely than 35 to 49 year olds (31%), 25 to 34 year olds (18%) and 18 to 24 year olds (18%) to mainly drink bottled wine.
• Australians aged 50 years and over (17%) are less likely than 35 to 49 year olds (26%) and 25 to 34 year olds (23%) to mainly drink regular strength beer.
• Australians aged 50 years and over (67%) are more likely than 35 to 49 year olds (52%), 25 to 34 year olds (53%) and 18 to 24 year olds (43%) to ever consume bottled wine.
• 18 to 24 year olds (14%) and 25 to 34 year olds (14%) are more likely than 35 to 49 year olds (8%) and those 50 years and older (6%) to mainly drink cider.
• 18 to 24 year olds (61%) are more likely than 35 to 49 year olds (48%) and those 50 years and older (46%) to ever consume spirits.
• 18 to 24 year olds (21%) and 25 to 34 year olds (24%) are more likely than those 50 years and older (9%) to ever consume RTD’s/alco-pops.
• 18 to 24 year olds (41%) and 25 to 34 year olds (43%) are more likely than 35 to 49 year olds (27%) and those 50 years and older (20%) to ever consume cider.
DRINKING TO GET DRUNK
45% of drinkers, approximately 5.7 million Australians, consume alcohol to get drunk.
Of the people who report drinking to get drunk, 47% consider themselves to be drunk when they are slurring their speech or losing their balance.
More than four in ten (45%) Australian drinkers consume alcohol with the intention of getting drunk, equating to approximately 5.7 million Australians. This is on par with 2017 (44%).
One in five (20%) Australian drinkers consume alcohol to get drunk less than once a month, while 14% drink to get drunk at least once a week.

FOUNDATION FOR ALCOHOL RESEARCH & EDUCATION20
The following table provides an overview of Australians who reported drinking to get drunk between 2011 and 2018.
2011 (%) 2012 (%) 2013 (%) 2014 (%) 2015 (%) 2016 (%) 2017 (%) 2018 (%)
At least twice a week 3 4 3 4 3 5 4 5
Once a week 6 5 8 6 6 7 8 9
At least once a month 8 9 8 7 8 7 11 11
Less than once a month 18 18 21 19 17 18 21 20
Subtotal 35 36 40 36 34 37 44 45
No, never 65 64 60 64 66 63 56 55
People who reported drinking to get drunk were asked further questions about their perception of drunkenness. Almost half of Australians (47%) who drink to get drunk perceive slurring speech or losing balance as the main indicator of drunkenness, followed by starting to feel relaxed (35%), and being over the legal blood alcohol limit to drive (14%).
The following table provides an overview of perception of drunkenness between 2012 and 2018 among Australians who reported drinking to get drunk.
2012 (%) 2013 (%) 2014 (%) 2015 (%) 2016 (%) 2017 (%) 2018 (%)
When you start to slur speech or lose balance 46 53 56 48 44 47 47
When you start to feel relaxed 35 33 29 39 38 37 35
When you are over the legal blood alcohol limit to drive 15 11 11 9 15 12 14
When you vomit 3 2 3 2 1 2 2
When you pass out 2 2 1 1 2 2 2
Analysis of demographic results revealed that:
• Men (51%) are more likely than women (39%) to drink to get drunk.
• 18 to 24 year olds (73%) are more likely than 25 to 34 year olds (58%), 35 to 49 year olds (51%) and those 50 years and over (13%) to drink to get drunk.

ANNUAL ALCOHOL POLL 2018 21
PERCEPTION OF INDIVIDUAL CONSUMPTION
71% of Australian drinkers are comfortable with the amount of alcohol they consume, 19% sometimes feel they have too much to drink and 8% admit to being uncomfortable.
41% of Australian drinkers indicated there was no change in their alcohol consumption over the past year, 39% had reduced their alcohol consumption or given up, and 19% had increased their alcohol consumption.
The majority (71%) of Australian drinkers are comfortable with the amount of alcohol they consume, 19% sometimes feel they have too much to drink, 8% admit to being uncomfortable and 2% are unsure.
The following table provides an overview of the extent Australians feel comfortable with their drinking, between 2011 and 2018.
2011 (%) 2012 (%) 2013 (%) 2014 (%) 2015 (%) 2016 (%) 2017 (%) 2018 (%)
Comfortable 69 69 71 73 69 70 70 71
Feel they have too much to drink sometimes 23 23 22 20 23 20 22 19↓
Uncomfortable 7 6 6 5 5 6 6 8
Don’t know 1 2 2 2 3 4 2 2
↑ ↓ denotes a significant change from the previous year’s results (applied to 2018 data only).
When asked about whether their consumption had changed from 12 months ago, 41% of drinkers indicated there has been no perceivable change in drinking habits over the past year, 39% of drinkers have reduced their alcohol intake or given up in the past 12 months, 19% of drinkers have increased their alcohol intake and less than 1% are not sure.
The following table provides an overview of changes in drinking habits, between 2010 and 2018.
2010 (%) 2011 (%) 2012 (%) 2013 (%) 2014 (%) 2015 (%) 2016 (%) 2017 (%) 2018 (%)
No change 51 49 49 45 46 48 50 45 41↓
Reduced or given up 35 38 37 40 38 38 35 38 39
Increased 14 13 13 14 15 13 13 16 19↑
Don’t know 0 0 1 1 1 1 2 1 1
↑ ↓ denotes a significant change from the previous year’s results (applied to 2018 data only).
Analysis of demographic results revealed that:
• Women (74%) are more likely than men (68%) to feel comfortable with how much alcohol they consume.
• 18 to 24 year olds (35%), 25 to 34 year olds (22%) and 35 to 49 year olds (20%) are more likely than those aged 50 years and over (9%) to have reported an increase in their alcohol consumption over the previous 12 months.
FOUNDATION FOR ALCOHOL RESEARCH & EDUCATION22
BEING INFLUENCED BY ALCOHOL PROMOTIONS
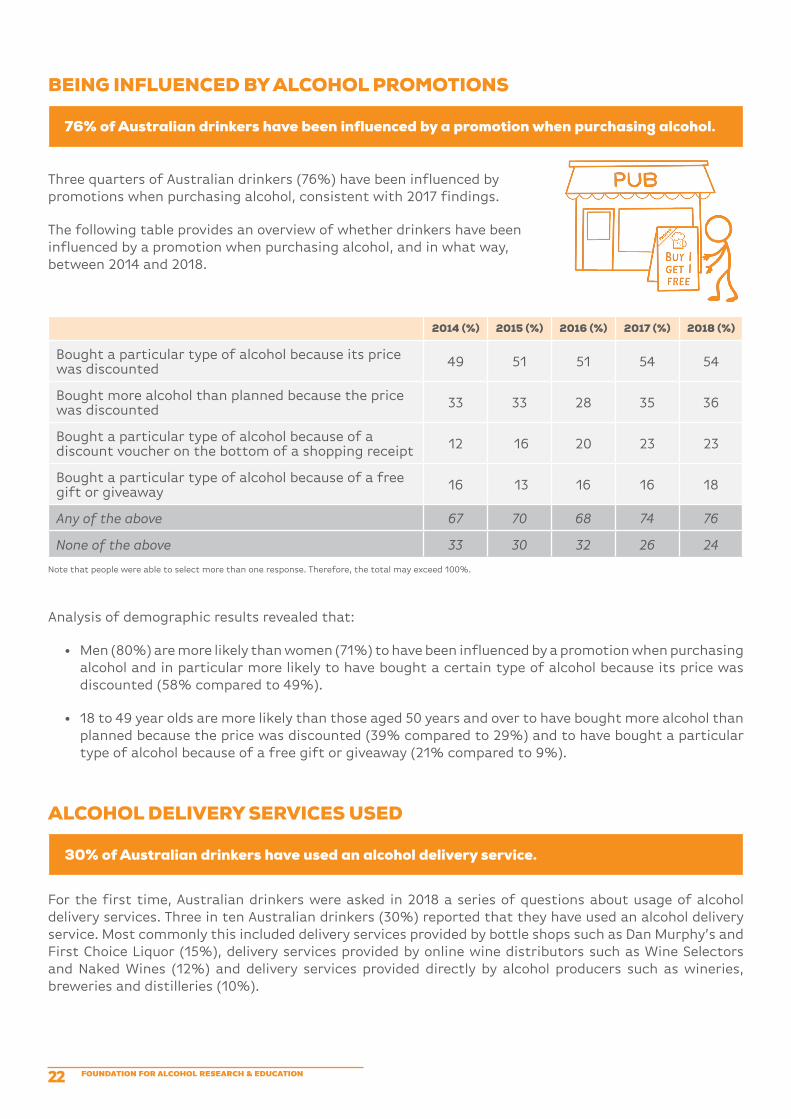
76% of Australian drinkers have been influenced by a promotion when purchasing alcohol.
Three quarters of Australian drinkers (76%) have been influenced by promotions when purchasing alcohol, consistent with 2017 findings.
The following table provides an overview of whether drinkers have been influenced by a promotion when purchasing alcohol, and in what way, between 2014 and 2018.
2014 (%) 2015 (%) 2016 (%) 2017 (%) 2018 (%)
Bought a particular type of alcohol because its price was discounted 49 51 51 54 54
Bought more alcohol than planned because the price was discounted 33 33 28 35 36
Bought a particular type of alcohol because of a discount voucher on the bottom of a shopping receipt 12 16 20 23 23
Bought a particular type of alcohol because of a free gift or giveaway 16 13 16 16 18
Any of the above 67 70 68 74 76
None of the above 33 30 32 26 24
Note that people were able to select more than one response. Therefore, the total may exceed 100%.
Analysis of demographic results revealed that:
• Men (80%) are more likely than women (71%) to have been influenced by a promotion when purchasing alcohol and in particular more likely to have bought a certain type of alcohol because its price was discounted (58% compared to 49%).
• 18 to 49 year olds are more likely than those aged 50 years and over to have bought more alcohol than planned because the price was discounted (39% compared to 29%) and to have bought a particular type of alcohol because of a free gift or giveaway (21% compared to 9%).
ALCOHOL DELIVERY SERVICES USED
30% of Australian drinkers have used an alcohol delivery service.
For the first time, Australian drinkers were asked in 2018 a series of questions about usage of alcohol delivery services. Three in ten Australian drinkers (30%) reported that they have used an alcohol delivery service. Most commonly this included delivery services provided by bottle shops such as Dan Murphy’s and First Choice Liquor (15%), delivery services provided by online wine distributors such as Wine Selectors and Naked Wines (12%) and delivery services provided directly by alcohol producers such as wineries, breweries and distilleries (10%).
ANNUAL ALCOHOL POLL 2018 23
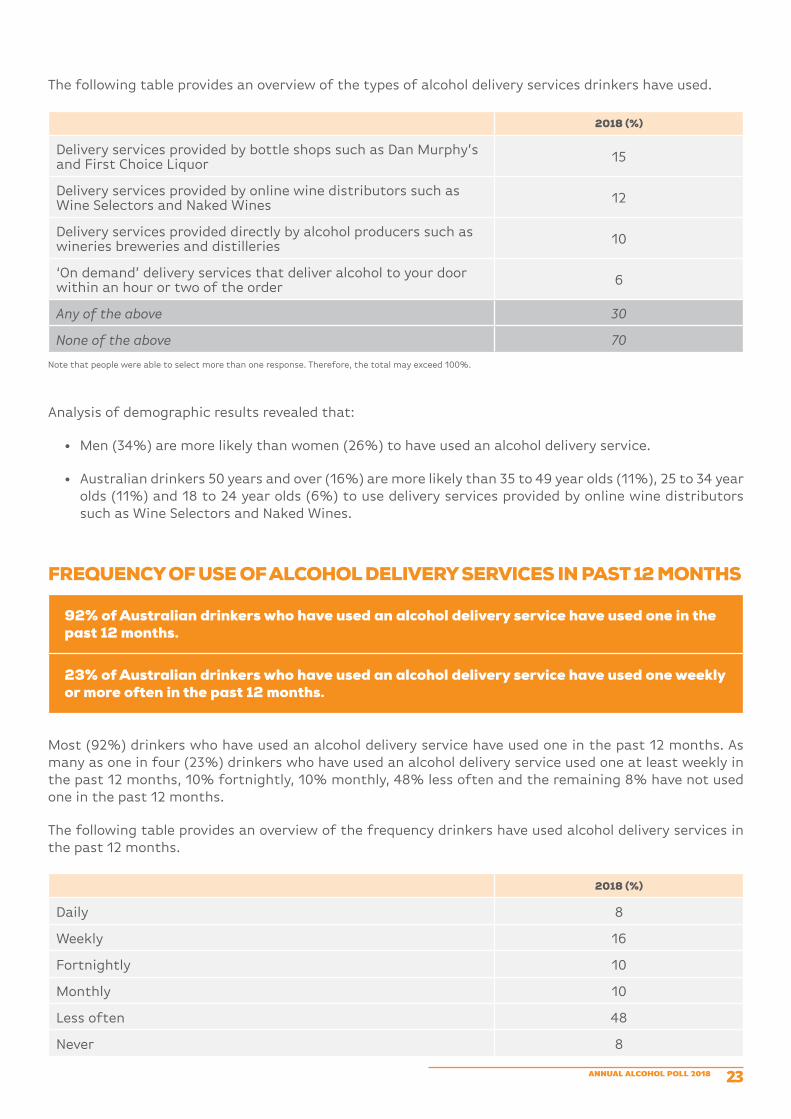
The following table provides an overview of the types of alcohol delivery services drinkers have used.
2018 (%)
Delivery services provided by bottle shops such as Dan Murphy’s and First Choice Liquor 15
Delivery services provided by online wine distributors such as Wine Selectors and Naked Wines 12
Delivery services provided directly by alcohol producers such as wineries breweries and distilleries 10
‘On demand’ delivery services that deliver alcohol to your door within an hour or two of the order 6
Any of the above 30
None of the above 70
Note that people were able to select more than one response. Therefore, the total may exceed 100%.
Analysis of demographic results revealed that:
• Men (34%) are more likely than women (26%) to have used an alcohol delivery service.
• Australian drinkers 50 years and over (16%) are more likely than 35 to 49 year olds (11%), 25 to 34 year olds (11%) and 18 to 24 year olds (6%) to use delivery services provided by online wine distributors such as Wine Selectors and Naked Wines.
FREQUENCY OF USE OF ALCOHOL DELIVERY SERVICES IN PAST 12 MONTHS
92% of Australian drinkers who have used an alcohol delivery service have used one in the past 12 months.
23% of Australian drinkers who have used an alcohol delivery service have used one weekly or more often in the past 12 months.
Most (92%) drinkers who have used an alcohol delivery service have used one in the past 12 months. As many as one in four (23%) drinkers who have used an alcohol delivery service used one at least weekly in the past 12 months, 10% fortnightly, 10% monthly, 48% less often and the remaining 8% have not used one in the past 12 months.
The following table provides an overview of the frequency drinkers have used alcohol delivery services in the past 12 months.
2018 (%)
Daily 8
Weekly 16
Fortnightly 10
Monthly 10
Less often 48
Never 8

FOUNDATION FOR ALCOHOL RESEARCH & EDUCATION24
Analysis of demographic results revealed that:
• Men who have used an alcohol delivery service in the past 12 months (28%) are more likely than women (16%) to have used an alcohol delivery service weekly or more often.
REASONS FOR USE OF AN ALCOHOL DELIVERY SERVICE
The main reasons Australian drinkers report using an alcohol delivery service are because it’s better value for money (36%), it’s more convenient as the alcohol is delivered straight to their front door (34%) and because it’s cheaper to buy alcohol in bulk online (28%).
The reasons Australian drinkers use an alcohol delivery service are because it’s better value for money (36%), it’s more convenient as the alcohol is delivered straight to their front door (34%), it’s cheaper to buy alcohol in bulk online (28%), they are part of a delivery service wine club which provides them with discounts and other rewards (21%), they can’t buy the alcohol products at their local bottle shop (21%), it’s faster to get alcohol delivered to their front door than to go and get it themselves (16%), they were over the blood alcohol limit to drive (11%) and there are no bottle shops close to where they live (9%).
The following table provides an overview of the reasons why drinkers purchase alcohol through a delivery service.
2018 (%)
Better value for money 36
More convenient as the alcohol get delivered straight to your front door 34
Cheaper to buy alcohol in bulk online 28
I am part of a delivery service wine club which provides me with discounts and other rewards 21
I can’t buy the alcohol products at my local bottleshop 21
Faster to get alcohol delivered to your front door than to go and get it myself 16
I was over the blood alcohol limit to drive 11
There are no bottleshops close to where I live 9
Note that people were able to select more than one response. Therefore, the total may exceed 100%.
Analysis of demographic results revealed that:
• Men are more likely than women to say they used an alcohol delivery service because it is cheaper to buy alcohol in bulk online (32% compared to 22%) and because it is faster to get alcohol delivered to their front door rather than to go and get it themselves (20% compared to 11%).
ANNUAL ALCOHOL POLL 2018 25
AWARENESS AND EXPERIENCES OF ALCOHOL HARM
THE AUSTRALIAN GUIDELINES TO REDUCE HEALTH RISKS FROM DRINKING ALCOHOL
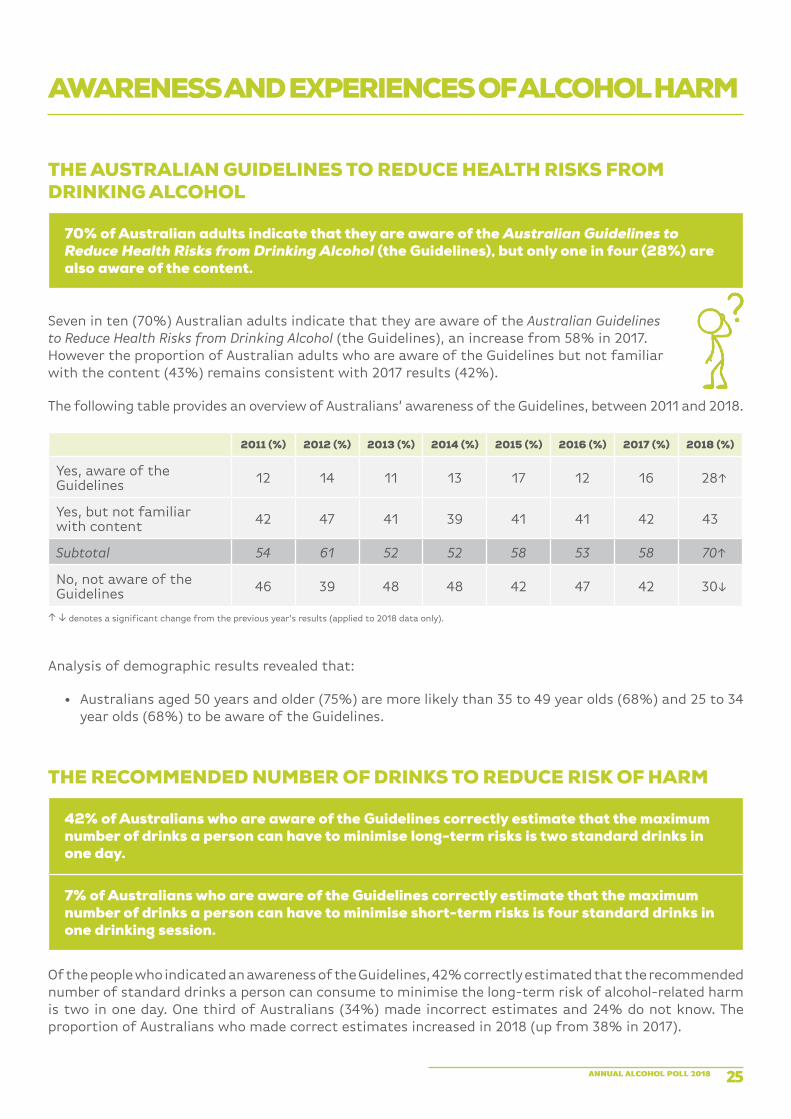
70% of Australian adults indicate that they are aware of the Australian Guidelines to Reduce Health Risks from Drinking Alcohol (the Guidelines), but only one in four (28%) are also aware of the content.
Seven in ten (70%) Australian adults indicate that they are aware of the Australian Guidelines to Reduce Health Risks from Drinking Alcohol (the Guidelines), an increase from 58% in 2017. However the proportion of Australian adults who are aware of the Guidelines but not familiar with the content (43%) remains consistent with 2017 results (42%).
The following table provides an overview of Australians’ awareness of the Guidelines, between 2011 and 2018.
2011 (%) 2012 (%) 2013 (%) 2014 (%) 2015 (%) 2016 (%) 2017 (%) 2018 (%)
Yes, aware of the Guidelines 12 14 11 13 17 12 16 28↑
Yes, but not familiar with content 42 47 41 39 41 41 42 43
Subtotal 54 61 52 52 58 53 58 70↑
No, not aware of the Guidelines 46 39 48 48 42 47 42 30↓
↑ ↓ denotes a significant change from the previous year’s results (applied to 2018 data only).
Analysis of demographic results revealed that:
• Australians aged 50 years and older (75%) are more likely than 35 to 49 year olds (68%) and 25 to 34 year olds (68%) to be aware of the Guidelines.
THE RECOMMENDED NUMBER OF DRINKS TO REDUCE RISK OF HARM
42% of Australians who are aware of the Guidelines correctly estimate that the maximum number of drinks a person can have to minimise long-term risks is two standard drinks in one day.
7% of Australians who are aware of the Guidelines correctly estimate that the maximum number of drinks a person can have to minimise short-term risks is four standard drinks in one drinking session.
Of the people who indicated an awareness of the Guidelines, 42% correctly estimated that the recommended number of standard drinks a person can consume to minimise the long-term risk of alcohol-related harm is two in one day. One third of Australians (34%) made incorrect estimates and 24% do not know. The proportion of Australians who made correct estimates increased in 2018 (up from 38% in 2017).

FOUNDATION FOR ALCOHOL RESEARCH & EDUCATION26
The following table provides an overview of this awareness of the maximum number of standard drinks per day to minimise long-term risks, between 2011 and 2018.
2011 (%) 2012 (%) 2013 (%) 2014 (%) 2015 (%) 2016 (%) 2017 (%) 2018 (%)
Made correct estimate (two standard drinks) 38 37 35 39 43 41 38 42↑
Made incorrect estimate 35 30 28 35 29 30 37 34↓
Don’t know 27 33 37 26 28 29 25 24
↑ ↓ denotes a significant change from the previous year’s results (applied to 2018 data only).
Of the people who had some awareness of the Guidelines, only 7% know that the maximum number of standard drinks a person can have in one sitting to minimise short-term risks is four. The majority (65%) of people made incorrect estimates and 28% do not know.
The following table provides an overview of this awareness of the maximum number of standard drinks in one sitting to minimise short-term risks, between 2011 and 2018.
2011 (%) 2012 (%) 2013 (%) 2014 (%) 2015 (%) 2016 (%) 2017 (%) 2018 (%)
Made correct estimate (four standard drinks) 10 11 8 7 7 9 7 7
Made incorrect estimate 60 52 52 60 60 58 65 65
Don’t know 31 37 41 33 33 33 28 28
Analysis of demographic results revealed that:
• Men (9%) are more likely than women (5%) to know that the maximum number of standard drinks a person can have in one sitting to minimise short-term risks is four.
• Men (21%) are more likely than women (11%) to overestimate the number of standard drinks to avoid long-term harm, citing more than two drinks per day.
• Men (12%) are also more likely than women (6%) to overestimate the number of standard drinks recommended to avoid short-term harm, citing more than four drinks on a single drinking occasion.
• Those 50 years and older (50%) are more likely than 35 to 49 year olds (41%), 25 to 34 year olds (39%) and 18 to 24 year olds (27%) to know that the maximum number of standard drinks per day to minimise long-term risks is two.
ANNUAL ALCOHOL POLL 2018 27
ALCOHOL GUIDELINES FOR PREGNANT WOMEN
78% of Australians correctly identify that a pregnant woman should not consume any alcohol to avoid harm to the fetus.
Australians were asked what they think is the recommended maximum number of alcoholic drinks a pregnant woman can have per day to avoid harm to the fetus. The majority of Australians (78%) are aware that pregnant women should not consume any alcohol, 12% believe they can consume one to two drinks in a day, 4% believe it is three or more drinks and 5% are unsure.
The following table provides an overview of awareness of the number of standard drinks pregnant women can have on any one day to avoid harm to the fetus, between 2012 and 2018.
2012 (%) 2013 (%) 2014 (%) 2015 (%) 2016 (%) 2017 (%) 2018 (%)
Made correct estimate (zero standard drinks) 67 65 67 74 74 80 78
Estimated 1-2 standard drinks 24 21 21 14 14 13 12
Estimated 3 or more standard drinks 1 2 2 3 2 2 4↑
Don’t know 8 11 10 9 10 5 5
↑ ↓ denotes a significant change from the previous year’s results (applied to 2018 data only).
Analysis of demographic results revealed that:
• Women (84%) are more likely than men (72%) to be aware that the recommended maximum number of alcoholic drinks a pregnant woman can have on any one day to avoid harm to the fetus is zero.
• Those 50 years and older (85%) are more likely than 35 to 49 year olds (76%), 25 to 34 year olds (75%) and 18 to 24 year olds (76%) to be aware that the recommended maximum number of alcoholic drinks a pregnant woman can have on any one day to avoid harm to the fetus is zero.
ADVICE FROM HEALTH PROFESSIONALS THAT THERE IS NO SAFE LEVEL OF ALCOHOL CONSUMPTION WHILE PREGNANT
46% of Australian women who have been pregnant said that a health professional advised them that there is no safe level of alcohol consumption while pregnant.
For the first time, Australian women who have been pregnant were asked in 2018 if a health professional advised them that there is no safe level of alcohol consumption while pregnant.
Just over four in ten (46%) women who have been pregnant said that they have received advice from a health professional that there is no safe level of alcohol consumption while pregnant, while 22% said they had not and 32% said that they can’t recall.
Analysis of demographic results revealed that:
• Those 18 to 34 years (70%) are more likely than 35 to 49 year olds (58%) and those 50 years and over (19%) to say they had received advice from a health professional that there is no safe level of alcohol consumption while pregnant.

FOUNDATION FOR ALCOHOL RESEARCH & EDUCATION28
CHANGES MADE TO ALCOHOL CONSUMPTION WHILE PREGNANT
Three quarters (78%) of Australian women who have been pregnant and drank alcohol prior to becoming pregnant said that they stopped drinking alcohol altogether while they were pregnant.
For the first time, Australian women who have been pregnant and drank alcohol prior to becoming pregnant were asked about their alcohol consumption while pregnant. Three quarters (78%) of Australian women who have been pregnant and drank alcohol prior to becoming pregnant said that they stopped drinking alcohol altogether while they were pregnant, while 17% said that they only drank alcohol on special occasions, 2% said they drank slightly less alcohol, 2% drank about the same amount and <1% said they drank more alcohol when they were pregnant.
Analysis of demographic results revealed that:
• Of those who have been pregnant and drank alcohol prior to becoming pregnant, those 35 years and older (20%) are more likely than 18 to 34 year olds (6%) to say they only drank alcohol on special occasions when they were pregnant.
AWARENESS OF HEALTH CONDITIONS ASSOCIATED WITH ALCOHOL MISUSE
Less than half of Australians are aware of the link between alcohol misuse and stroke (38%), mouth and throat cancer (26%) and breast cancer (16%).
Most Australians associate illnesses such as cirrhosis of the liver (74%) and liver cancer (69%) with alcohol misuse. However, fewer Australians are aware of the link between alcohol misuse and heart disease (49%), stroke (38%), mouth and throat cancer (26%) and breast cancer (16%). A small number of people (5%) are unaware that alcohol is linked with any of the conditions mentioned above. The proportion of Australians who link alcohol to cirrhosis of the liver declined in 2018 (74% down from 78% in 2017), as has the proportion of Australians who link alcohol to stroke (38% down from 42% in 2017).
The following table provides an overview of Australian perceptions of the link between alcohol misuse and various long-term health conditions, in 2011, 2014 and 2016 to 2018.
2011 (%) 2014 (%) 2016 (%) 2017 (%) 2018 (%)
Cirrhosis of the liver 88 80 79 78 74↓
Liver cancer 69 74 71 68 69
Heart disease 55 56 51 51 49
Stroke 44 47 44 42 38↓
Mouth and throat cancer 24 29 30 25 26
Breast cancer 11 17 16 15 16
None of the above 2 4 6 4 5
Note that people were able to select more than one response. Therefore, the totals may exceed 100%.
↑ ↓ denotes a significant change from the previous year’s results (applied to 2018 data only).

ANNUAL ALCOHOL POLL 2018 29
Analysis of demographic results revealed that:
• Women are more likely than men to perceive a link between alcohol misuse and cirrhosis of the liver (79% compared to 70%), liver cancer (72% compared to 67%), heart disease (52% compared to 47%) and stroke (40% compared to 35%).
• Those 50 years and older are more likely than those 35 to 49 years, 25 to 34 year olds and 18 to 24 year olds to perceive a link between alcohol misuse and cirrhosis of the liver (91% compared to 77%, 65% and 52%), cancer of the mouth and throat (35% compared to 25%, 24% and 16%) and breast cancer (22% compared to 15%, 14% and 8%).
RIGHT TO KNOW ABOUT LONG-TERM HARM ASSOCIATED WITH REGULAR ALCOHOL USE
When advised that the World Health Organization has claimed that alcohol is linked to approximately 200 disease and injury conditions such as breast cancer, liver disease, mouth cancer and stroke, the majority of Australians (84%) said they think Australians have the right to know about long-term harm associated with regular alcohol use.
For the first time, Australians were asked in 2018 whether they think they have a right to know about long-term harm associated with regular alcohol use. When advised that the World Health Organization has claimed that alcohol is linked to approximately 200 disease and injury conditions such as breast cancer, liver disease, mouth cancer and stroke, the majority of Australians (84%) said they think Australians have the right to know about long-term harm associated with regular alcohol use while 7% said they don’t have this right and 9% are unsure.
Analysis of demographic results revealed that:
• Women (89%) are more likely than men (80%) to think Australians have the right to know about long-term harm associated with regular alcohol use.
• Australians 50 years and older (91%) are more likely than 35 to 49 year olds (79%), 25 to 34 year olds (85%) and 18 to 24 year olds (81%) to think Australians have the right to know about long-term harm associated with regular alcohol use.
GOVERNMENTS’ RESPONSIBILITY TO EDUCATE AUSTRALIANS ABOUT LONG-TERM HARM ASSOCIATED WITH REGULAR ALCOHOL USE
Most Australians (80%) think governments have a responsibility to educate Australians about long-term harm associated with regular alcohol use.
For the first time, Australians were asked in 2018 about whether they thought governments have responsibility to educate Australians about long-term harm associated with regular alcohol use. Four in five Australians (80%) think governments have a responsibility to educate Australians about long-term harm associated with regular alcohol use while 12% said it is not their responsibility and 9% said they don’t know.

FOUNDATION FOR ALCOHOL RESEARCH & EDUCATION30
Analysis of demographic results revealed that:
• Women (86%) are more likely than men (74%) to think governments have a responsibility to educate Australians about the long-term harm associated with regular alcohol use, while men (17%) are more likely than women (6%) to think this is not the responsibility of governments.
• Australians 50 years and older (86%) are more likely than 35 to 49 year olds (75%), 25 to 34 year olds (81%) and 18 to 24 year olds (77%) to think governments have a responsibility to educate Australians about the long-term harm associated with regular alcohol use.
EXPERIENCES OF ALCOHOL-RELATED VIOLENCE
37% of Australians have been affected by alcohol-related violence, including 21% who have been victims of alcohol-related violence.
Among those who have ever been affected by alcohol-related violence, 47% have been affected by alcohol-related violence in the last 12 months, including 24% who have been victims of alcohol-related violence.
Among those who have been victims of alcohol-related violence in the last 12 months, 47% say a current or former spouse/partner/boyfriend/girlfriend was responsible, 32% a parent or guardian, 25% a person known to them but not a relative or partner/ex-partner, 22% a stranger and 22% another relative.
More than one third of Australians (37%) have been affected by alcohol-related violence, including 21% who have been victims of alcohol-related violence, and 24% who have had a family member or friend affected. These results are on par with 2017.
The following table provides an overview of experiences of alcohol-related violence from 2011 to 2018.
2011 (%) 2012 (%) 2013 (%) 2014 (%) 2015 (%) 2016 (%) 2017 (%) 2018 (%)
Have been a victim of alcohol-related violence 19 14 18 19 14 16 19 21
Have had a family member or friend be a victim of alcohol-related violence
30 22 21 26 22 20 24 24
Either of the above 41 31 32 37 30 29 35 37
Neither of the above 59 69 68 63 70 71 65 63
Note that people were able to select more than one response. Therefore, the totals may exceed 100%.

ANNUAL ALCOHOL POLL 2018 31
Analysis of demographic results revealed that:
• Women (41%) are more likely than men (34%) to have been affected by alcohol-related violence.
• Women are also more likely than men to have been direct victims of alcohol-related violence (23% compared to 18%).
• 25 to 34 year old men (24%) are more likely than men 50 years and older (14%), to have been a victim of alcohol-related violence.
Overall, 47% of those who have been affected by alcohol-related violence have been affected by alcohol-related violence in the last 12 months, including 24% who have been victims of alcohol-related violence (an increase from 17% in 2017), and 30% who have had a family member or friend affected (a decline from 36% in 2017).
The following table provides an overview of the extent those who have experienced alcohol-related violence, have experienced this in the last 12 months.
IN THE LAST 12 MONTHS… 2017 (%) 2018 (%)
Have been a victim of alcohol-related violence 17 24↑
Have had a family member or friend be a victim of alcohol-related violence 36 30↓
Either of the above 48 47
Neither of the above 52 53
Note that people were able to select more than one response. Therefore, the totals may exceed 100%.
↑ ↓ denotes a significant change from the previous year’s results (applied to 2018 data only).
Analysis of demographic results revealed that among those who have been affected by alcohol-related violence, including in the last 12 months:
• Men (27%) are more likely than women (20%) to have been a victim of alcohol-related violence in the last 12 months.
• 18 to 49 year olds (27%) are more likely than those 50 years and older (15%) to have been a victim of alcohol-related violence in the last 12 months.
Those who have been a victim of alcohol-related violence in the last 12 months were asked which persons under the influence of, or affected by, alcohol were responsible for the violence. Among those who have been victims of alcohol-related violence in the last 12 months, 47% stated that a current or former spouse/partner/boyfriend/girlfriend was responsible, 32% a parent or guardian, 25% a person known to them but not a relative/partner, 22% a stranger, 22% another relative, and 4% someone else.
2016 (%) 2017* (%) 2018 (%)
Current or former spouse/partner/boy/girlfriend 44 52 47
Parent or guardian 35 30 32
Person known to me but not a relative or partner/ ex-partner 27 19 25
Stranger 40 24 22
Other relative (e.g. uncle, child, grandparent) 15 21 22
Other 2 2 4*Change in question wording in 2017/18 – now related to violence that occurred in the last 12 months

FOUNDATION FOR ALCOHOL RESEARCH & EDUCATION32
HARM AND RISK OF HARM TO CHILDREN UNDER 18 YEARS FROM SOMEONE ELSE’S DRINKING
23% of parents or guardians of children under the age of 18 years report that their child has been harmed or put at risk of harm because of someone else’s drinking.
Most commonly a child has been verbally abused (13%), neglected in some way (9%) or been in the car with a driver who was over the legal blood alcohol limit (8%).
One in four (23%) parents or guardians with children under the age of 18 years report that their child has been harmed or put at risk of harm because of someone else’s drinking. When asked in what way their child has been harmed or put at risk, most commonly a child has been verbally abused (13%), neglected in some way (9%), been in the car with a driver who was over the legal blood alcohol limit (8%) or physically abused (5%).
The following table provides an overview of the ways in which children under the age of 18 have been harmed or put at risk of harm because of someone else’s drinking, between 2015 and 2018.
2015 (%) 2016 (%) 2017 (%) 2018 (%)
They have been verbally abused 11 13 12 13
They have been neglected in some way 8 11 9 9
They have been in a car with a driver who was over the legal blood alcohol limit 6 10 7 8
They have been physically abused 6 7 7 5
Child has been harmed or put at risk in some way 20 23 21 23
Child has not been harmed or put at risk in some way 80 77 79 77
Note that people were able to select more than one response. Therefore, the totals may exceed 100%.
CHILDREN’S EXPOSURE TO ALCOHOL ADVERTISING
74% of parents and guardians with children under 18 years of age say their children have been exposed to alcohol advertising.
Three quarters of parents and guardians (74%) believe that their child under 18 years of age has been exposed to alcohol advertising, while 18% believe they have not been exposed and 8% are unsure. This is consistent with the 2017 Poll (77%).
The main ways in which parents and guardians believe their children under 18 have been exposed to alcohol advertising include at a supermarket/shopping centre (48%), via radio, television or at the cinema (43%), at an event (including sporting, music, cultural and other events) (42%), at a licensed venue (such as a club or restaurant) (41%), while outside on the street (for instance, billboards, posters) (39%) and via social media/internet (30%).
Results from the 2018 Poll are very consistent with those achieved in 2017.

ANNUAL ALCOHOL POLL 2018 33
The following table provides an overview of the different ways in which parents and guardians believe their children under 18 years of age have been exposed to alcohol advertising from 2016 to 2018.
WAYS IN WHICH PARENTS BELIEVE CHILDREN UNDER 18 YEARS OF AGEHAVE BEEN EXPOSED TO ALCOHOL ADVERTISING 2016 (%) 2017 (%) 2018 (%)
Supermarket or shopping centre 47 49 48
Radio, television or cinema 44 43 43
At an event (including sporting, music, cultural, and other events) 33 37 42
Licensed venue (such as a club or restaurant) 35 42 41
While outside on the street (for instance, billboards, posters) 37 45 39↓
Social media/internet 26 34 30
Public transport (at a stop or on a train, bus or tram) 28 30 25↓
Other 1 1 1
Children under 18 years whose parents believe they have been exposed to alcohol advertising 71 77 74
My children have not been exposed to alcohol advertising 16 15 18
Don’t know 13 9 8Note that people were able to select more than one response. Therefore, the totals may exceed 100%.↑ ↓ denotes a significant change from the previous year’s results (applied to 2018 data only).
FOUNDATION FOR ALCOHOL RESEARCH & EDUCATION34
PERSPECTIVES ON ALCOHOL-RELATED POLICIES
REGULATING ALCOHOL ADVERTISING AND SPONSORSHIP IN SPORT
52% of Australians believe that alcohol sponsorship should not be allowed at sporting events.
63% think governments have the responsibility to phase out alcohol advertising and sponsorship of sport while 49% think it is professional sporting codes.
72% believe gambling advertising should be phased out from television during sporting broadcasts.
62% believe alcohol advertising should be phased out from television during sporting broadcasts.
54% believe junk food advertising should be phased out from television during sporting broadcasts.
More than half of Australians (52%) believe that alcohol sponsorship should not be allowed at sporting events, while 33% think it should be allowed and 15% are unsure. These results are on par with 2017.
The following table provides an overview of whether Australians believe alcohol sponsorship should be allowed at sporting events, where the question was asked in 2011 and 2014 to 2018.
2011 (%) 2014 (%) 2015 (%) 2016 (%) 2017 (%) 2018 (%)
Believe alcohol sponsorship should be allowed at sporting events 39 29 34 24 31 33
Believe alcohol sponsorship should not be allowed at sporting events 47 55 51 60 55 52
Don’t know 13 16 15 16 13 15
For the first time, Australians who believe alcohol sponsorship should not be allowed at sporting events or who are unsure were asked who they believe has responsibility to phase out alcohol advertising and sponsorship of sport. Two thirds of Australian adults (63%) think governments have the responsibility to phase out alcohol advertising and sponsorship of sport, while 49% think professional sporting codes have this responsibility, 43% sporting ground and stadium management, 33% liquor licensing regulators, 31% television broadcasters and 27% the alcohol industry/alcohol companies.

ANNUAL ALCOHOL POLL 2018 35
The following table provides an overview of who Australians think has the responsibility to phase out alcohol advertising and sponsorship of sport.
2018 (%)
Governments 63
Professional sporting codes (e.g. Cricket Australia, AFL) 49
Sporting ground and stadium management 43
Liquor licensing regulators 33
Television broadcasters 31
The alcohol industry/ alcohol companies 27
Don’t know 14
Note that people were able to select more than one response. Therefore, the total may exceed 100%.
Analysis of demographic results revealed that:
• Women are more likely than men to think professional sporting codes (53% compared to 44%), sporting ground and stadium management (48% compared to 36%), liquor licensing regulators (36% compared to 29%) and television broadcasters (34% compared to 28%) have the responsibility to phase out alcohol advertising and sponsorship of sport.
• Australians 50 years and over are more likely than 18 to 49 year olds to think governments (73% compared to 58%), professional sporting codes (60% compared to 44%), sporting ground and stadium management (52% compared to 39%) and the alcohol industry/alcohol companies (34% compared to 24%) have the responsibility to phase out alcohol advertising and sponsorship of sport.
Three quarters of Australians (72%) believe that gambling advertising should be phased out during sporting broadcasts, while 62% think alcohol advertising should be phased out and 54% think junk food advertising should be phased out during sporting broadcasts.
The following table provides an overview of whether Australians believe gambling, alcohol and junk food advertising should be phased out during sporting broadcasts for 2017-2018.
2017 (%) 2018 (%)
AGREE DISAGREE DON’T KNOW AGREE DISAGREE DON’T KNOW
Gambling advertising 73 17 9 72 17 11
Alcohol advertising 63 26 11 62 25 13
Junk food advertising 53 33 14 54 29 17
Analysis of demographic results revealed that:
• Women are more likely than men to believe that gambling advertising (77% compared to 68%), alcohol advertising (69% compared to 54%) and junk food advertising (57% compared to 50%) should be phased out during sporting broadcasts.
• Those 50 years and older are more likely than those 18 to 49 years to believe that gambling advertising (84% compared to 68%), alcohol advertising (72% compared to 57%) and junk food advertising (63% compared to 50%) should be phased out during sporting broadcasts.

FOUNDATION FOR ALCOHOL RESEARCH & EDUCATION36
REGULATING ALCOHOL ADVERTISING ON TELEVISION
67% of Australians support a ban on alcohol advertising on television before 8.30pm.
Two thirds of Australian adults (67%) support a ban on alcohol advertising on television before 8.30pm seven days a week, while 22% of people are opposed to the ban, and 12% are unsure. Fewer Australians do not support a ban on alcohol advertising on television before 8.30pm in 2018 (down from 25% in 2017).
The following table provides an overview of Australians’ support for a ban on alcohol advertising on television before 8.30pm, between 2011 and 2018.
2011 (%) 2012 (%) 2013 (%) 2014 (%) 2015 (%) 2016 (%) 2017 (%) 2018 (%)
Support a ban on TV alcohol advertising before 8.30pm
69 64 64 67 63 70 68 67
Do not support a ban on TV alcohol advertising before 8.30pm
23 24 21 21 24 18 25 22↓
Don’t know 8 12 15 12 13 12 8 12↑
↑ ↓ denotes a significant change from the previous year’s results (applied to 2018 data only).
Analysis of demographic results revealed that:
• Women (57%) are more likely than men (47%) to believe that alcohol sponsorship should not be allowed at sporting events.
• Australians aged 50 years and over (62%) are more likely than 35 to 49 year olds (47%), 25 to 34 year olds (48%) and 18 to 24 year olds (48%) to believe that alcohol sponsorship should not be allowed at sporting events.
• Women (73%) are more likely than men (60%) to support a ban on alcohol advertising on television before 8:30pm.
• Australians aged 50 years and over (78%) are more likely than 35 to 49 year olds (63%), 25 to 34 year olds (63%) and 18 to 24 year olds (58%) to support a ban on alcohol advertising on television before 8.30pm.
ANNUAL ALCOHOL POLL 2018 37
REGULATING OUTDOOR ALCOHOL ADVERTISING
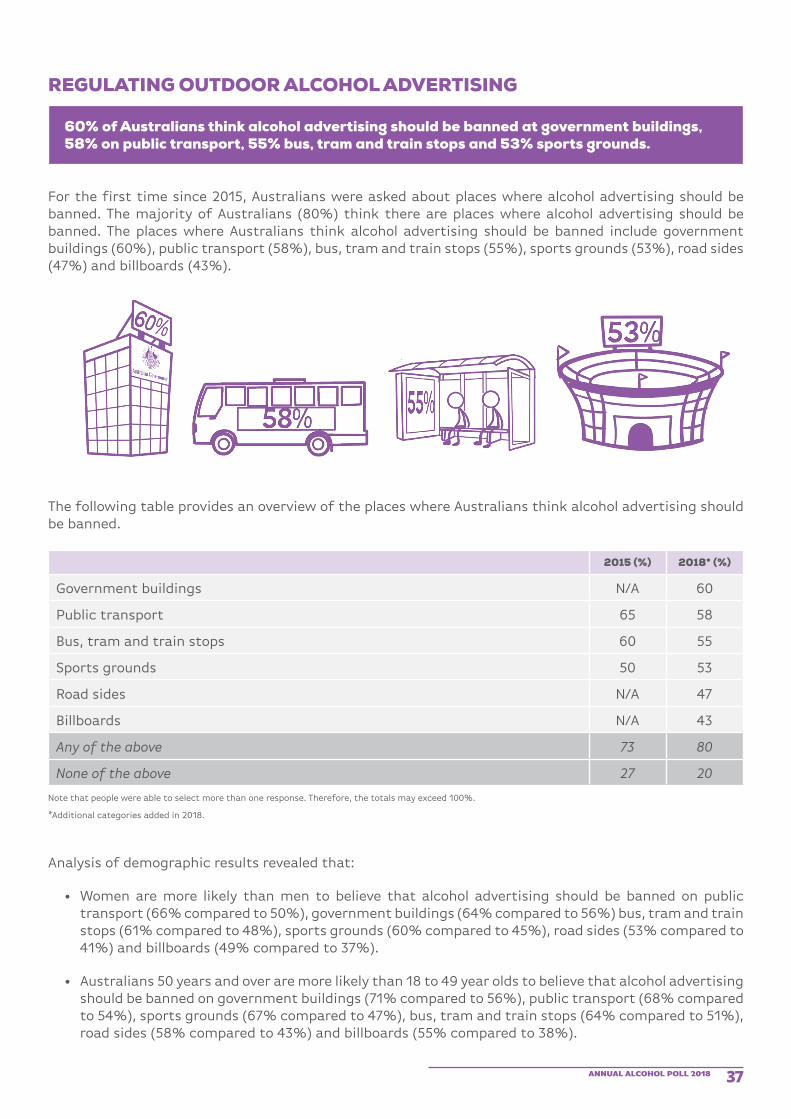
60% of Australians think alcohol advertising should be banned at government buildings, 58% on public transport, 55% bus, tram and train stops and 53% sports grounds.
For the first time since 2015, Australians were asked about places where alcohol advertising should be banned. The majority of Australians (80%) think there are places where alcohol advertising should be banned. The places where Australians think alcohol advertising should be banned include government buildings (60%), public transport (58%), bus, tram and train stops (55%), sports grounds (53%), road sides (47%) and billboards (43%).
The following table provides an overview of the places where Australians think alcohol advertising should be banned.
2015 (%) 2018* (%)
Government buildings N/A 60
Public transport 65 58
Bus, tram and train stops 60 55
Sports grounds 50 53
Road sides N/A 47
Billboards N/A 43
Any of the above 73 80
None of the above 27 20
Note that people were able to select more than one response. Therefore, the totals may exceed 100%.
*Additional categories added in 2018.
Analysis of demographic results revealed that:
• Women are more likely than men to believe that alcohol advertising should be banned on public transport (66% compared to 50%), government buildings (64% compared to 56%) bus, tram and train stops (61% compared to 48%), sports grounds (60% compared to 45%), road sides (53% compared to 41%) and billboards (49% compared to 37%).
• Australians 50 years and over are more likely than 18 to 49 year olds to believe that alcohol advertising should be banned on government buildings (71% compared to 56%), public transport (68% compared to 54%), sports grounds (67% compared to 47%), bus, tram and train stops (64% compared to 51%), road sides (58% compared to 43%) and billboards (55% compared to 38%).

FOUNDATION FOR ALCOHOL RESEARCH & EDUCATION38
INCREASING TAX TO PAY FOR HEALTH, EDUCATION AND TREATMENT OF ALCOHOL PROBLEMS
47% of Australians support increasing the tax on alcohol to pay for health, education, and treatment of alcohol-related problems.
Almost half of Australians (47%) support increasing the tax on alcohol to pay for health, education and treatment of alcohol-related problems, 42% are not supportive and 11% are unsure. This represents a decline from 2017 (54%).
The following table provides an overview of support for increasing the tax on alcohol, between 2011 and 2018.
2011 (%) 2012 (%) 2013 (%) 2014 (%) 2015 (%) 2016 (%) 2017 (%) 2018 (%)
Support increasing the tax on alcohol 46 39 41 47 48 51 54 47↓
Do not support increasing the tax on alcohol
46 48 46 41 40 35 37 42↑
Don’t know 8 13 13 12 12 14 10 11
↑ ↓ denotes a significant change from the previous year’s results (applied to 2018 data only).
Analysis of demographic results revealed that:
• Women (54%) are more likely than men (40%) to support increasing the tax on alcohol to pay for health, education and treatment of alcohol-related problems.
• 18 to 24 year olds (54%) are more likely than those 35 to 49 year olds (41%) to support increasing the tax on alcohol to pay for health, education and treatment of alcohol-related problems.
LIMITING THE NUMBER OF ALCOHOL OUTLETS TO REDUCE ALCOHOL-RELATED FAMILY VIOLENCE
Half of Australians (51%) support limiting the number of alcohol outlets to reduce alcohol-related family violence.
For the first time, Australians were asked in 2018 whether they support limiting the number of alcohol outlets to reduce alcohol-related family violence. Half of Australians (51%) support limiting the number of alcohol outlets to reduce alcohol-related family violence while 33% do not support this and 16% are unsure.
Analysis of demographic results revealed that:
• Women (57%) are more likely than men (45%) to support limiting the number of alcohol outlets to reduce alcohol-related family violence.
• 18 to 24 year olds (59%) are more likely than those 35 to 49 years (46%) and those 50 years and older (50%) to support limiting the number of alcohol outlets to reduce alcohol-related family violence.

ANNUAL ALCOHOL POLL 2018 39
SUMMARY TABLES BY DEMOGRAPHIC
Please note that some questions are based on a filtered sub-set of respondents.
1. STATE AND TERRITORY OVERVIEW
1.1 ATTITUDES TOWARDS ALCOHOL
AUSTRALIA (%) NSW(%) VIC (%) QLD (%) SA (%) WA (%)
Proportion of total respondents
1 Alcohol as the drug that causes the most harm to Australians 32 35 31 28 27 33
2 Australia has a problem with alcohol 73 68 73 74 74 76
3 More needs to be done to reduce alcohol-related harm 76 72 76 78 78 80
4 Alcohol-related problems will remain the same or get worse in next 5-10 years 71 69 71 74 72 72
5 Governments are not doing enough to address alcohol-related harm 57 52 64* 56 54 62
6 Alcohol companies are not doing enough to address alcohol-related harm 67 59* 73* 66 64 74*
7 Clubs and pubs are not doing enough to address alcohol-related harm 62 56* 68* 63 62 63
8 Believe alcohol industry targets young people under 18 years 55 52 60 53 55 55
9 Believe alcohol industry has too much influence with governments 57 58 61 53 57 54
10 Believe alcohol industry makes political donations to influence policy 53 59* 55 46* 48 48
11 Believe alcohol industry should pay for reducing alcohol harm 68 68 69 66 68 66
12 Believe alcohol industry would downplay independent university research findings 61 59 62 61 66 61
* denotes a significant difference from the Australian average.
1.2 ALCOHOL CONSUMPTION BEHAVIOURS
AUSTRALIA (%) NSW(%) VIC (%) QLD (%) SA (%) WA (%)
Proportion of total respondents
1 Consumes alcohol 82 86 80 80 81 82
Proportion of those who consume alcohol
2 1-2 standard drinks on a typical occasion 49 49 51 45 51 52
3 3-5 standard drinks on a typical occasion 31 28 30 33 34 32
4 6+ standard drinks on a typical occasion 18 20 17 20 13* 14
5 Increased alcohol consumption in past 12 months 19 25* 22 11* 13* 16
6 Comfortable with how much they drink 71 68 70 79* 72 69
7 Drink to get drunk 45 47 48 43 35* 41
8 Influenced by alcohol promotion 76 76 76 74 72 79
* denotes a significant difference from the Australian average.

FOUNDATION FOR ALCOHOL RESEARCH & EDUCATION40
1.3 AWARENESS AND EXPERIENCES OF ALCOHOL HARM
AUSTRALIA (%) NSW(%) VIC (%) QLD (%) SA (%) WA (%)
Proportion of total respondents
1 Aware of the Guidelines 70 71 66 69 71 80*
Proportion of those aware of the Guidelines
2 Know that two standard drinks is the maximum to avoid long-term harm 42 42 34* 41 42 56*
3 Know that four standard drinks is the maximum to avoid short-term harm 7 7 4* 9 9 7
Proportion of total respondents
4 Know zero is the recommended maximum drinks per day when pregnant 78 71* 79 82 87* 83*
5 Experienced alcohol-related violence 37 39 34 38 42 35
Proportion of those experienced alcohol-related violence
6 Experienced alcohol-related violence in last 12 months 47 49 51 43 30* 47
Proportion of total respondents
7 Believe Australians have the right to know about alcohol’s long-term harm 84 82 83 87 88 86
8Believe governments have a responsibility to educate Australians about alcohol’s long-term harm
80 77 78 84 81 83
* denotes a significant difference from the Australian average.
1.4 PERSPECTIVES ON ALCOHOL-RELATED POLICIES
AUSTRALIA (%) NSW(%) VIC (%) QLD (%) SA (%) WA (%)
Proportion of total respondents
1 Alcohol sponsorship should not be allowed at sporting events 52 47 58 49 51 57
2 Support ban on alcohol advertising on TV before 8.30pm 67 62 69 68 71 67
3 Believe gambling advertising should be phased out of sporting broadcasts 72 69 77 71 75 72
4 Believe alcohol advertising should be phased out of sporting broadcasts 62 57 69* 57 62 65
5 Believe junk food advertising should be phased out of sporting broadcasts 54 51 55 53 58 57
6 Support increasing tax on alcohol 47 47 48 44 51 44
7Support limiting the number of alcohol outlets to reduce alcohol-related family violence
51 50 53 47 51 61*
* denotes a significant difference from the Australian average.

ANNUAL ALCOHOL POLL 2018 41
2. GENDER OVERVIEW
2.1 ATTITUDES TOWARDS ALCOHOL
MEN (%) WOMEN (%)
Proportion of total respondents
1 Alcohol as the drug that causes the most harm to Australians 32 33
2 Australia has a problem with alcohol 64 81*
3 More needs to be done to reduce alcohol-related harm 70 82*
4 Alcohol-related problems will remain the same or get worse in next 5-10 years 67 76*
5 Governments are not doing enough to address alcohol-related harm 55 60*
6 Alcohol companies are not doing enough to address alcohol-related harm 64 69*
7 Clubs and pubs are not doing enough to address alcohol-related harm 58 66*
8 Believe alcohol industry targets young people under 18 years 53 56
9 Believe alcohol industry has too much influence with governments 57 57
10 Believe alcohol industry makes political donations to influence policy 59* 47
11 Believe alcohol industry should pay for reducing alcohol harm 66 70
12 Believe alcohol industry would downplay independent university research findings 59 63
* denotes a significant difference between men and women.
2.2 ALCOHOL CONSUMPTION BEHAVIOURS
MEN (%) WOMEN (%)
Proportion of total respondents
1 Consumes alcohol 86* 78
Proportion of those who consume alcohol
2 1-2 standard drinks on a typical occasion 42 56*
3 3-5 standard drinks on a typical occasion 33 29
4 6+ standard drinks on a typical occasion 23* 12
5 Increased alcohol consumption in past 12 months 18* 14
6 Comfortable with how much they drink 68 74*
7 Drink to get drunk 51* 39
8 Influenced by alcohol promotion 80* 71
* denotes a significant difference between men and women.

FOUNDATION FOR ALCOHOL RESEARCH & EDUCATION42
2.3 AWARENESS AND EXPERIENCES OF ALCOHOL HARM
MEN (%) WOMEN (%)
Proportion of total respondents
1 Aware of the Guidelines 72 69
Proportion of those aware of the Guidelines
2 Know that two standard drinks is the maximum to avoid long-term harm 41 42
3 Know that four standard drinks is the maximum to avoid short-term harm 9* 5
Proportion of total respondents
4 Know zero is the recommended maximum drinks per day when pregnant 72 84*
5 Experienced alcohol-related violence 34 41*
Proportion of those experienced alcohol-related violence
6 Experienced alcohol-related violence in last 12 months 54* 41
Proportion of total respondents
7 Believe Australians have the right to know about alcohol’s long-term harm 80 89*
8 Believe governments have a responsibility to educate Australians about alcohol’s long-term harm 74 86*
* denotes a significant difference between men and women.
2.4 PERSPECTIVES ON ALCOHOL-RELATED POLICIES
MEN (%) WOMEN (%)
Proportion of total respondents
1 Alcohol sponsorship should not be allowed at sporting events 47 57*
2 Support ban on alcohol advertising on TV before 8.30pm 60 73*
3 Believe gambling advertising should be phased out of sporting broadcasts 68 77*
4 Believe alcohol advertising should be phased out of sporting broadcasts 54 69*
5 Believe junk food advertising should be phased out of sporting broadcasts 50 57*
6 Support increasing tax on alcohol 40 54*
7 Support limiting the number of alcohol outlets to reduce alcohol-related family violence 45 57*
* denotes a significant difference between men and women.

ANNUAL ALCOHOL POLL 2018 43
3. AGE OVERVIEW
3.1 ATTITUDES TOWARDS ALCOHOL 18-24
YEARS (%)25-34
YEARS (%)35-49
YEARS (%)50+
YEARS (%)
Proportion of total respondents
1 Alcohol as the drug that causes the most harm to Australians 36 31 30 34
2 Australia has a problem with alcohol 72 74 71 74
3 More needs to be done to reduce alcohol-related harm 76 78 69 81
4 Alcohol-related problems will remain the same or get worse in next 5-10 years 66 65 72 79
5 Governments are not doing enough to address alcohol-related harm 60 55 53 63
6 Alcohol companies are not doing enough to address alcohol-related harm 69 65 61 73
7 Clubs and pubs are not doing enough to address alcohol-related harm 59 62 60 66
8 Believe alcohol industry targets young people under 18 years 54 55 47 64
9 Believe alcohol industry has too much influence with governments 54 57 51 65
10 Believe alcohol industry makes political donations to influence policy 46 53 50 60
11 Believe alcohol industry should pay for reducing alcohol harm 59 73 64 73
12 Believe alcohol industry would downplay independent university research findings 56 61 58 67
3.2 ALCOHOL CONSUMPTION BEHAVIOURS18-24
YEARS (%)25-34
YEARS (%)35-49
YEARS (%)50+
YEARS (%)
Proportion of total respondents
1 Consumes alcohol 81 86 84 77
Proportion of those who consume alcohol
2 1-2 standard drinks on a typical occasion 36 49 48 56
3 3-5 standard drinks on a typical occasion 37 29 29 31
4 6+ standard drinks on a typical occasion 22 18 21 12
5 Increased alcohol consumption in past 12 months 35 22 20 9
6 Comfortable with how much they drink 74 71 66 75
7 Drink to get drunk 73 58 51 13
8 Influenced by alcohol promotion 79 79 77 69

FOUNDATION FOR ALCOHOL RESEARCH & EDUCATION44
3.3 AWARENESS AND EXPERIENCES OF ALCOHOL HARM18-24
YEARS (%)25-34
YEARS (%)35-49
YEARS (%)50+
YEARS (%)
Proportion of total respondents
1 Aware of the Guidelines 70 68 68 75
Proportion of those aware of the Guidelines
2 Know that two standard drinks is the maximum to avoid long-term harm 27 39 41 50
3 Know that four standard drinks is the maximum to avoid short-term harm 8 11 5 5
Proportion of total respondents
4 Know zero is the recommended maximum drinks per day when pregnant 76 75 76 85
5 Experienced alcohol-related violence 47 40 34 34
Proportion of those experienced alcohol-related violence
6 Experienced alcohol-related violence in last 12 months 68 47 47 32
Proportion of total respondents
7 Believe Australians have the right to know about alcohol’s long-term harm 81 85 79 91
8 Believe governments have a responsibility to educate Australians about alcohol’s long-term harm 77 81 75 86
3.4 PERSPECTIVES ON ALCOHOL-RELATED POLICIES18-24
YEARS (%)25-34
YEARS (%)35-49
YEARS (%)50+
YEARS (%)
Proportion of total respondents
1 Alcohol sponsorship should not be allowed at sporting events 48 48 47 62
2 Support ban on alcohol advertising on TV before 8.30pm 58 63 63 78
3 Believe gambling advertising should be phased out of sporting broadcasts 64 68 69 84
4 Believe alcohol advertising should be phased out of sporting broadcasts 63 58 54 72
5 Believe junk food advertising should be phased out of sporting broadcasts 46 54 48 63
6 Support increasing tax on alcohol 54 50 41 48
7 Support limiting the number of alcohol outlets to reduce alcohol-related family violence 59 54 46 50

ANNUAL ALCOHOL POLL 2018 45
4. CONSUMPTION OVERVIEW
4.1 ATTITUDES TOWARDS ALCOHOL REGULAR
DRINKER (%)MODERATE
DRINKER (%)OCCASIONAL DRINKER (%)
NON-DRINKER (%)
Proportion of total respondents
1 Alcohol as the drug that causes the most harm to Australians 33 30 30 38
2 Australia has a problem with alcohol 68 67 78 79
3 More needs to be done to reduce alcohol-related harm 72 69 83 82
4 Alcohol-related problems will remain the same or get worse in next 5-10 years 70 70 73 73
5 Governments are not doing enough to address alcohol-related harm 49 53 62 67
6 Alcohol companies are not doing enough to address alcohol-related harm 60 61 73 74
7 Clubs and pubs are not doing enough to address alcohol-related harm 57 58 67 68
8 Believe alcohol industry targets young people under 18 years 52 50 58 61
9 Believe alcohol industry has too much influence with governments 53 56 58 61
10 Believe alcohol industry makes political donations to influence policy 57 51 52 55
11 Believe alcohol industry should pay for reducing alcohol harm 66 63 72 74
12 Believe alcohol industry would downplay independent university research findings 60 55 69 62
4.2 AWARENESS AND EXPERIENCES OF ALCOHOL HARMREGULAR
DRINKER (%)MODERATE
DRINKER (%)OCCASIONAL DRINKER (%)
NON-DRINKER (%)
Proportion of total respondents
1 Aware of the Guidelines 82 73 69 55
Proportion of those aware of the Guidelines
2 Know that two standard drinks is the maximum to avoid long-term harm 49 43 36 36
3 Know that four standard drinks is the maximum to avoid short-term harm 11 8 5 4
Proportion of total respondents
4 Know zero is the recommended maximum drinks per day when pregnant 73 77 81 81
5 Experienced alcohol-related violence 41 36 36 41
Proportion of those experienced alcohol-related violence
6 Experienced alcohol-related violence in last 12 months 58 53 36 41
Proportion of total respondents
7 Believe Australians have the right to know about alcohol’s long-term harm 82 80 90 85
8 Believe governments have a responsibility to educate Australians about alcohol’s long-term harm 77 76 85 83

FOUNDATION FOR ALCOHOL RESEARCH & EDUCATION46
4.3 PERSPECTIVES ON ALCOHOL-RELATED POLICIESREGULAR
DRINKER (%)MODERATE
DRINKER (%)OCCASIONAL DRINKER (%)
NON-DRINKER (%)
Proportion of total respondents
1 Alcohol sponsorship should not be allowed at sporting events 40 45 57 70
2 Support ban on alcohol advertising on TV before 8.30pm 65 56 75 76
3 Believe gambling advertising should be phased out of sporting broadcasts 75 66 78 75
4 Believe alcohol advertising should be phased out of sporting broadcasts 52 54 70 72
5 Believe junk food advertising should be phased out of sporting broadcasts 53 50 57 56
6 Support increasing tax on alcohol 27 38 57 68
7 Support limiting the number of alcohol outlets to reduce alcohol-related family violence 37 43 60 68

ANNUAL ALCOHOL POLL 2018 47
5. VOTING INTENTIONS OVERVIEW
5.1 ATTITUDES TOWARDS ALCOHOL
ALP (%) COALITION (%) GREENS (%)
Proportion of total respondents
1 Alcohol as the drug that causes the most harm to Australians 35 29 50
2 Australia has a problem with alcohol 77 68 88
3 More needs to be done to reduce alcohol-related harm 81 74 87
4 Alcohol-related problems will remain the same or get worse in next 5-10 years 72 70 75
5 Governments are not doing enough to address alcohol-related harm 63 56 65
6 Alcohol companies are not doing enough to address alcohol-related harm 71 66 74
7 Clubs and pubs are not doing enough to address alcohol-related harm 66 63 66
8 Believe alcohol industry targets young people under 18 years 59 55 59
9 Believe alcohol industry has too much influence with governments 62 55 71
10 Believe alcohol industry makes political donations to influence policy 59 52 65
11 Believe alcohol industry should pay for reducing alcohol harm 69 69 81
12 Believe alcohol industry would downplay independent university research findings 65 57 81
5.2 ALCOHOL CONSUMPTION BEHAVIOURS
ALP (%) COALITION (%) GREENS (%)
Proportion of total respondents
1 Consumes alcohol 83 87 89
Proportion of those who consume alcohol
2 1-2 standard drinks on a typical occasion 48 47 56
3 3-5 standard drinks on a typical occasion 30 37 22
4 6+ standard drinks on a typical occasion 21 14 22
5 Increased alcohol consumption in past 12 months 20 24 18
6 Comfortable with how much they drink 75 66 75
7 Drink to get drunk 49 44 57
8 Influenced by alcohol promotion 78 79 84

FOUNDATION FOR ALCOHOL RESEARCH & EDUCATION48
5.3 AWARENESS AND EXPERIENCES OF ALCOHOL HARM
ALP (%) COALITION (%) GREENS (%)
Proportion of total respondents
1 Aware of the Guidelines 71 73 79
Proportion of those aware of the Guidelines
2 Know that two standard drinks is the maximum to avoid long-term harm 42 46 45
3 Know that four standard drinks is the maximum to avoid short-term harm 6 5 9
Proportion of total respondents
4 Know zero is the recommended maximum drinks per day when pregnant 80 74 80
5 Experienced alcohol-related violence 39 34 47
Proportion of those experienced alcohol-related violence
6 Experienced alcohol-related violence in last 12 months 50 51 53
Proportion of total respondents
7 Believe Australians have the right to know about alcohol’s long-term harm 87 78 92
8 Believe governments have a responsibility to educate Australians about alcohol’s long-term harm 82 76 92
5.4 PERSPECTIVES ON ALCOHOL-RELATED POLICIES
ALP (%) COALITION (%) GREENS (%)
Proportion of total respondents
1 Alcohol sponsorship should not be allowed at sporting events 52 54 54
2 Support ban on alcohol advertising on TV before 8.30pm 67 65 85
3 Believe gambling advertising should be phased out of sporting broadcasts 72 71 85
4 Believe alcohol advertising should be phased out of sporting broadcasts 61 64 74
5 Believe junk food advertising should be phased out of sporting broadcasts 54 55 69
6 Support increasing tax on alcohol 51 43 67
7 Support limiting the number of alcohol outlets to reduce alcohol-related family violence 54 50 65

FOUNDATION FOR ALCOHOL RESEARCH & EDUCATION50
©Foundation for Alcohol Research & Education 2018ISBN 978-0-6482739-1-2