about the cover photos - kentuckykfi.ky.gov/publications/annual reports/2013 annual report...about...
TRANSCRIPT

2
About the Cover Photos
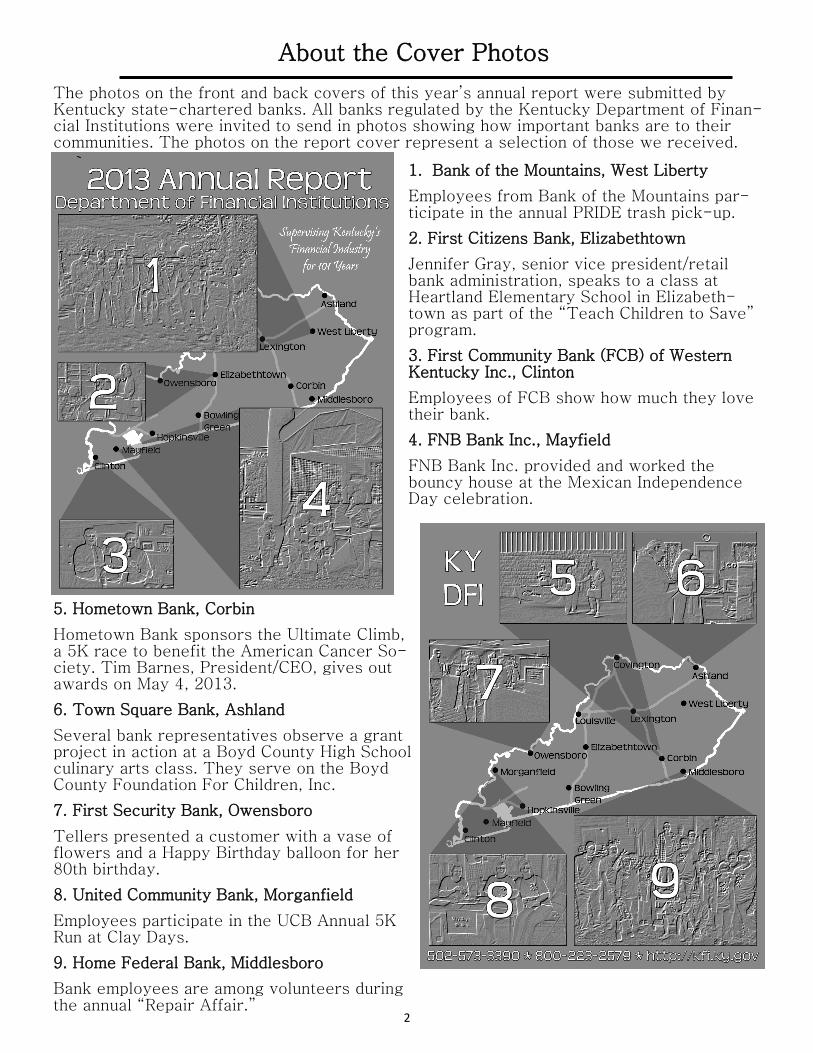
1. Bank of the Mountains, West Liberty
Employees from Bank of the Mountains par-ticipate in the annual PRIDE trash pick-up.
2. First Citizens Bank, Elizabethtown
Jennifer Gray, senior vice president/retail bank administration, speaks to a class at Heartland Elementary School in Elizabeth-town as part of the “Teach Children to Save” program.
3. First Community Bank (FCB) of Western Kentucky Inc., Clinton
Employees of FCB show how much they love their bank.
4. FNB Bank Inc., Mayfield
FNB Bank Inc. provided and worked the bouncy house at the Mexican Independence Day celebration.
The photos on the front and back covers of this year’s annual report were submitted by Kentucky state-chartered banks. All banks regulated by the Kentucky Department of Finan-cial Institutions were invited to send in photos showing how important banks are to their communities. The photos on the report cover represent a selection of those we received.
5. Hometown Bank, Corbin
Hometown Bank sponsors the Ultimate Climb, a 5K race to benefit the American Cancer So-ciety. Tim Barnes, President/CEO, gives out awards on May 4, 2013.
6. Town Square Bank, Ashland
Several bank representatives observe a grant project in action at a Boyd County High School culinary arts class. They serve on the Boyd County Foundation For Children, Inc.
7. First Security Bank, Owensboro
Tellers presented a customer with a vase of flowers and a Happy Birthday balloon for her 80th birthday.
8. United Community Bank, Morganfield
Employees participate in the UCB Annual 5K Run at Clay Days.
9. Home Federal Bank, Middlesboro
Bank employees are among volunteers during the annual “Repair Affair.”
3
Table of Contents
Letter from the Commissioner ..................................................................................... 4
Commissioners ............................................................................................................. 5
History ......................................................................................................................... 6
Mission, Values and Vision .......................................................................................... 7
Financial Institutions Board ......................................................................................... 8
Organizational Structure .............................................................................................. 9
Application and Administrative Support Branch ....................................................... 10
Division of Depository Institutions ............................................................................ 11
101st Annual Banking Report .................................................................................... 11
Bank Changes ............................................................................................... ..11
State-Chartered Banks—Annual Consolidated Statement of Assets ..................... 12
Consolidated Condition and Income Data ...................................................... 14
Total Assets .................................................................................................... 15
State-Chartered Bank Trust Departments—Trust Assets ...................................... 19
State-Chartered Independent Trust Companies—Trust Assets ............................. 20
79th Annual Credit Union Report .............................................................................. 21
Credit Union Changes .................................................................................... ..21
State-Chartered Credit Unions—Annual Consolidated Statement of Assets .......... 22
Selected Composite Operating Ratios ............................................................. 23
Report of Condition ......................................................................................... 25
Division of Nondepository Institutions ...................................................................... 26
1st Annual Mortgage Examination Branch Report .................................................... 26
1st Annual Nonmortgage Examination Branch Report ............................................. 26
1st Annual Licensing Branch Report ......................................................................... 27
5th Annual Consumer Protection Branch Report ...................................................... 27
Consumer Loan Companies—Annual Consolidated Statement of Assets ................ 29
Consolidated Report of Condition ................................................................... 30
Industrial Loan Companies—Annual Consolidated Statement of Assets ................. 31
Consolidated Report of Condition ................................................................... 32
Division of Securities ............................................................................................... ..33
27th Annual Securities Report ................................................................................... 33
Licensing and Registration Branch Report ................................................................ 34
Broker-Dealers Headquartered in Kentucky ............................................................ 34
Investment Advisers Headquartered in Kentucky .................................................... 35
Licensing and Registration Branch Report ............................................................. ..38
Compliance Branch Report ........................................................................................ 39
Enforcement Branch Report ...................................................................................... 40
Prosecution Assistance Unit Report .......................................................................... 40

4
Steven L. Beshear, Governor
Larry R. Bond, Acting Secretary
Charles Vice, Commissioner
PUBLIC PROTECTION CABINET
DEPARTMENT OF FINANCIAL INSTITUTIONS
Dear Gov. Steven L. Beshear,
As commissioner of the Kentucky Department of Financial Institutions (DFI), I
am pleased to present the 2013 Annual Report. The following pages contain
statistical and historical information regarding the financial services industry
in Kentucky.
Kentucky’s financial institutions have successfully managed through the eco-
nomic turmoil of the past few years, and are prepared to provide financial ser-
vices that are necessary to ensure future economic growth. During 2013,
Ketucky’s banks and credit unions have maintained strong capital ratios, and
have increased their lending activities during challenging economic conditions.
Profitability has been impacted by a low interest rate environment, net interest margin compression, and in-
creasing overhead costs; however, the return on average assets remains acceptable. The DFI continues to en-
courage economic expansion through effective oversight of the banking and credit union industries.
The Division of Securities provides sound regulatory oversight of investment activities, while also encouraging
capital formation for future economic growth. DFI has worked closely with law enforcement agencies to ad-
dress fraud, stop illegal securities activities, and seek restitution for investors that have been harmed. DFI
also provides investor education to help Kentucky residents save, spend and invest wisely.
The Division of Nondepository Institutions provides effective oversight of non-bank financial institutions, such
as mortgage loan companies, mortgage brokers and consumer loan companies. With the rapid and dynamic
changes in information technology, payments systems and alternative lending industries, the Division of Non-
depository Institutions has protected consumers and provided appropriate regulatory oversight of the compa-
nies we license and examine.
The DFI remains a leader in financial regulation. This annual report indicates that Kentucky’s financial services
industry is committed to helping our communities and residents prepare for future economic growth. The DFI will
fulfill its mission of maintaining a stable financial industry, providing effective and efficient regulatory oversight,
promoting consumer confidence and encouraging economic opportunities.
Sincerely,
Charles A. Vice, Commissioner

5
DFI Commissioners 1912-2013
Year Commissioner Governor
1912 Thomas J. Smith James B. McCreary 1916 George G. Speer Augustus O. Stanley 1920 James Lewis Edwin P. Morrow 1924 Charles E. Marvin William J. Fields 1928 O. S. Denny Flem D. Samson 1930 C. S. Wilson Flem D. Samson 1931 J. R. Dorman Ruby Laffoon 1935 Hiram Wilhoit A. B. Chandler 1939 Hiram Wilhoit Keene Johnson 1943 Hillard H. Smith Simeon S. Willis 1948 Henry H. Carter Earle C. Clements 1951 Henry H. Carter Lawrence W. Wetherby 1955 R. E. Glenn Lawrence W. Wetherby 1956 S. Albert Phillips A. B. Chandler 1958 Earle B. Combs A. B. Chandler 1960 H. A. Rogers Bert T. Combs 1964 H. A. Rogers Edward T. Breathitt 1965 G. D. Beach Edward T. Breathitt 1968 E. G. Adams Louie B. Nunn 1971 Lenvil R. Hall Wendell H. Ford 1971 Perry R. Miller (Acting) Wendell H. Ford 1973 Howard T. Sallee Wendell H. Ford 1975 John Williams Jr. Julian M. Carroll 1980 Randall L. Attkisson John Y. Brown Jr. 1982 Foster Pettit (Acting) John Y. Brown Jr. 1983 Morris R. Smith John Y. Brown Jr. 1983 Tracy Farmer (Acting) John Y. Brown Jr. 1983 Neil Welch (Acting) John Y. Brown Jr. 1983 Leonard B. Marshall John Y. Brown Jr. 1984 Ballard W. Cassady Jr. Martha Layne Collins 1986 Thomas B. Miller Martha Layne Collins 1988 Edward B. Hatchett Jr. Wallace G. Wilkinson 1992 Edward B. Hatchett Jr. Brereton C. Jones 1994 Edward J. Holmes (Acting) Brereton C. Jones 1995 J. Rick Jones (Acting) Brereton C. Jones 1996 Larry D. Lander Paul E. Patton 1997 Ella D. Robinson (Acting) Paul E. Patton 1998 Arthur L. Freeman Paul E. Patton 1999 Ella D. Robinson Paul E. Patton 2004* Tom B. Miller Ernie Fletcher 2005* Cordell G. Lawrence Ernie Fletcher 2007* Cordell G. Lawrence Steven L. Beshear 2008-Present Charles A. Vice Steven. L. Beshear
* Title was Executive Director from 2004-2007

6
History of DFI
DFI traces its origin to the Banking Act of 1912, which established the agency initially as the Department of Banking. Gov. James B. McCreary appointed Thomas J. Smith as the first commissioner, effective July 1, 1912. The department was charged with enforcing laws re-lating to banks, trust companies, savings banks and combined bank and trust companies do-ing business under Kentucky law. The first annual report lists six employees – a commis-sioner, deputy, clerk, and several examiners. Initially the department supervised 466 com-mercial banks, savings banks, independent trust companies and title companies with total assets of only $110 million. Exam fees ranged from $15 for banks with a “capital and sur-plus of $20,000 or less” to $35 for those between $50,000 to $100,000, plus a $10 fee for each additional $100,000.
The legislature mandated supervision of state-chartered savings (building) and loan asso-ciations in 1918 and added state-chartered credit unions in 1922. When the agency began oversight of the state’s securities industry in mid-1932, it was renamed the Department of Banking and Securities. The next year, as the Great Depression continued, the Federal De-posit Insurance Corporation (FDIC) was created. In 1933, Kentucky bank closures reached an all-time high when 23 state banks failed.
Over the years, other regulatory responsibilities were added, including consumer and in-dustrial loan companies in 1946, companies that sell money orders in 1966, mortgage loan companies and brokers in 1980 and check-cashing companies in 1992. As the agency’s scope increased over the years to include other types of financial institutions, its organiza-tional structure and name changed as well. It was renamed the Department of Financial In-stitutions in 1984.
Department of Financial Institutions Central Office, 1025 Capital Center Drive, Frankfort, Ky.
7
Mission, Values and Vision
Values Effective and Efficient Operation We will wisely use the resources entrusted to us by the Commonwealth to ensure maxi-mum output is achieved for each dollar in-vested. Responsibility We accept the serious nature of the tasks (or duties) entrusted to us, and we are will-ing to be held accountable for the actions we choose. Professionalism We will provide quality services, which will be achieved through excellence, accountabil-ity, innovation and a highly skilled workforce. Integrity We will act honestly, fairly and impartially. Teamwork We will achieve organizational goals through open, responsive communication and cooper-ation with co-workers, other state government agencies and federal regulatory authorities. Respect We will be sensitive to the viewpoints and efforts of others, and we will strive to meet the needs of all of our stakeholders. Initiative We will identify potential issues that may impact the financial services industry, formulate appropriate solutions and proactively respond to change. Vision The department will: Be a leader in developing and implementing sound public policies Be an effective, proactive, credible and respected regulatory agency Be a leader in educating and protecting the investing, depositing and borrowing public Encourage capital formation and economic development Achieve a work environment that encourages career opportunities, professional devel-
opment and equitable compensation Be responsive to emerging industry trends and issues, and implement appropriate
strategies
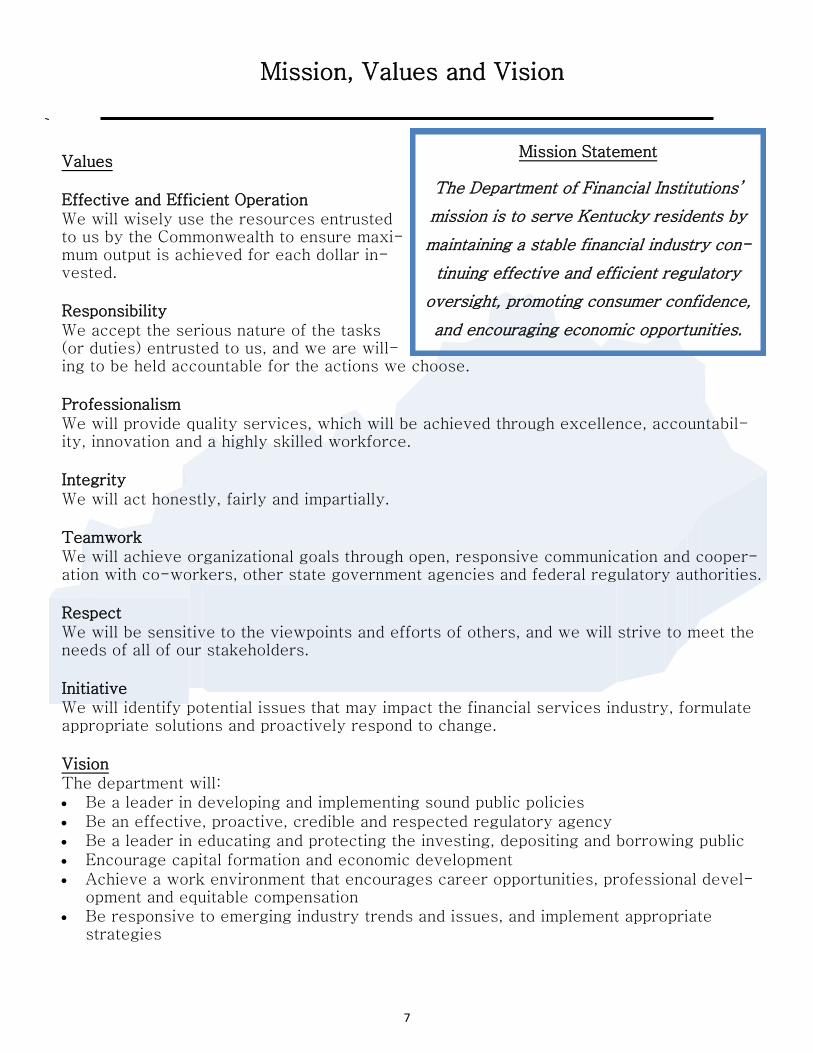
Mission Statement
The Department of Financial Institutions’
mission is to serve Kentucky residents by
maintaining a stable financial industry con-
tinuing effective and efficient regulatory
oversight, promoting consumer confidence,
and encouraging economic opportunities.
8
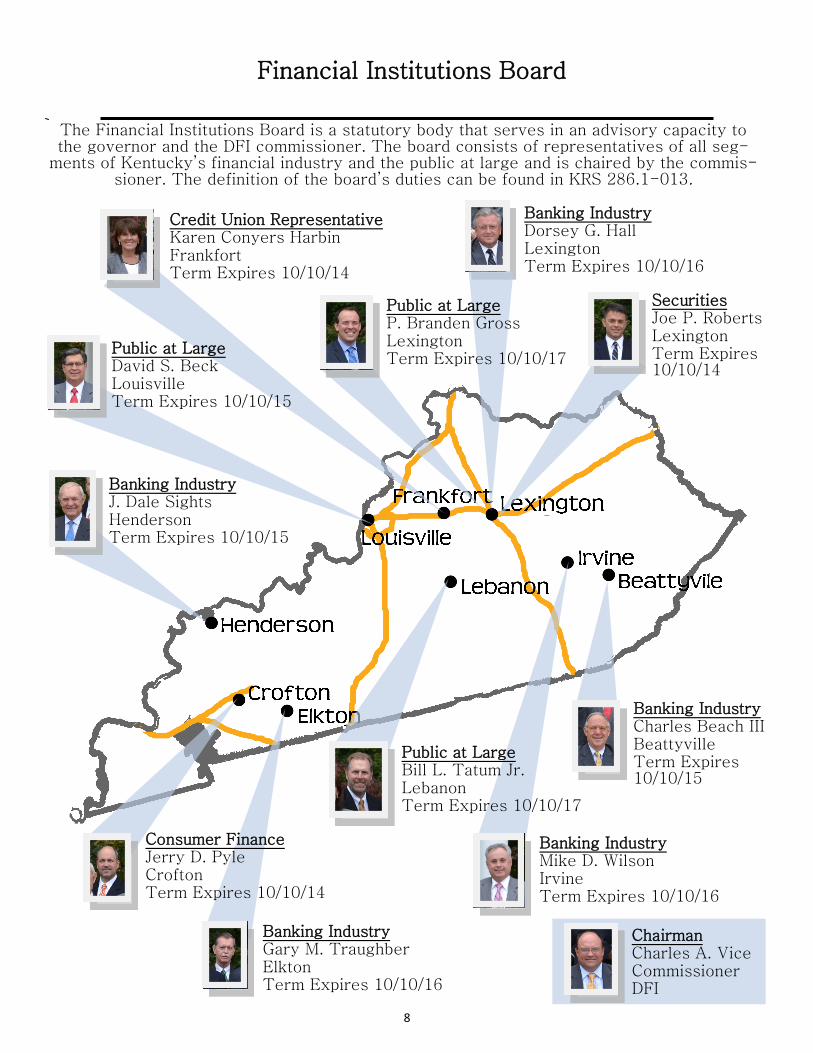
Financial Institutions Board
The Financial Institutions Board is a statutory body that serves in an advisory capacity to the governor and the DFI commissioner. The board consists of representatives of all seg-
ments of Kentucky’s financial industry and the public at large and is chaired by the commis-sioner. The definition of the board’s duties can be found in KRS 286.1-013.
Banking Industry Dorsey G. Hall Lexington Term Expires 10/10/16
Securities Joe P. Roberts Lexington Term Expires 10/10/14
Banking Industry J. Dale Sights Henderson Term Expires 10/10/15
Public at Large David S. Beck Louisville Term Expires 10/10/15
Credit Union Representative Karen Conyers Harbin Frankfort Term Expires 10/10/14
Public at Large P. Branden Gross Lexington Term Expires 10/10/17
Chairman Charles A. Vice Commissioner DFI
Banking Industry Mike D. Wilson Irvine Term Expires 10/10/16
Banking Industry Charles Beach III Beattyville Term Expires 10/10/15
Banking Industry Gary M. Traughber Elkton Term Expires 10/10/16
Consumer Finance Jerry D. Pyle Crofton Term Expires 10/10/14
Public at Large Bill L. Tatum Jr. Lebanon Term Expires 10/10/17

9
Organizational Structure
Deputy
Commissioner
Commissioner
Division of
Depository
Institutions
Division of
Nondepository
Institutions
Application &
Administrative
Support Branch
General
Counsel
Credit
Union
Branch
Bank
Branch
Mortgage
Examination
Branch
Non-mortgage
Examination
Branch
Licensing
Branch
Financial
Institutions
Board
Division of
Securities
Consumer
Protection
Branch
Licensing &
Registration
Branch
Compliance
Branch
Enforcement
Branch
Prosecution
Assistance
Unit
Frankfort
District
Louisville
District
Bowling
Green
District

10
Application and Administrative Support Branch
Employees in the Application and Administrative Support Branch provide application development and administrative support to the department in the following areas: Facilities management — Frankfort office and district offices in Eddyville, Bowling
Green, Louisville and Frankfort Fiscal management Operations and quality control Records management Safety Officer Budgeting Revenue and expenditure analysis Personnel In 2013, the Application and Administrative Support Branch continues to focus its efforts on providing the necessary tools for the department to meet its mission. This includes re-cruiting new staff and retaining qualified employees to maintain uninterrupted delivery of services to the industry and public. As it has for many years, the department maintains a toll-free telephone number. Consum-ers and industry representatives wanting to speak with a member of the agency’s staff are encouraged to call 800-223-2579 with their questions and concerns. Information for con-sumers, regulated industries and the general public is available online at http://kfi.ky.gov. Business hours are from 8 a.m. to 5 p.m. Eastern time at our office located at 1025 Capital Center Drive, Suite 200, Frankfort, KY 40601.
Commissioner Charles
Vice, standing, presents to
the DFI Board at the 2013
Annual Board Meeting at
My Old Kentucky Home in
Bardstown, Ky.
11
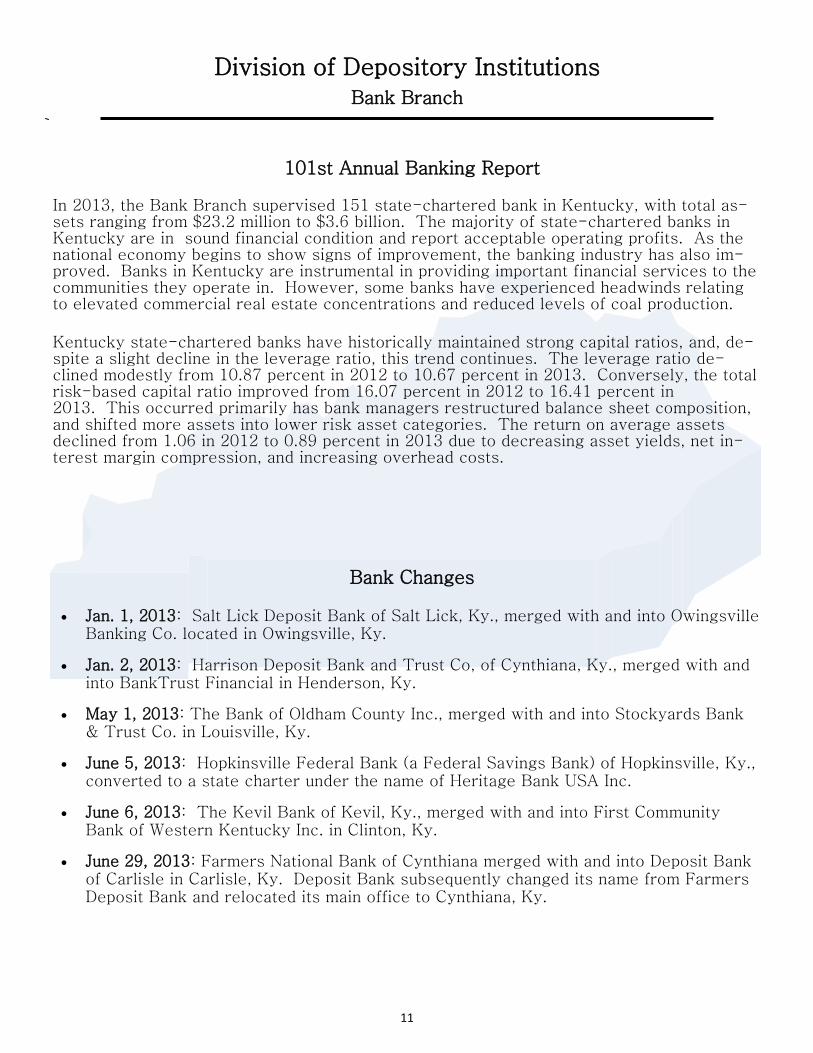
101st Annual Banking Report
Bank Changes
Jan. 1, 2013: Salt Lick Deposit Bank of Salt Lick, Ky., merged with and into Owingsville Banking Co. located in Owingsville, Ky.
Jan. 2, 2013: Harrison Deposit Bank and Trust Co, of Cynthiana, Ky., merged with and into BankTrust Financial in Henderson, Ky.
May 1, 2013: The Bank of Oldham County Inc., merged with and into Stockyards Bank & Trust Co. in Louisville, Ky.
June 5, 2013: Hopkinsville Federal Bank (a Federal Savings Bank) of Hopkinsville, Ky., converted to a state charter under the name of Heritage Bank USA Inc.
June 6, 2013: The Kevil Bank of Kevil, Ky., merged with and into First Community Bank of Western Kentucky Inc. in Clinton, Ky.
June 29, 2013: Farmers National Bank of Cynthiana merged with and into Deposit Bank of Carlisle in Carlisle, Ky. Deposit Bank subsequently changed its name from Farmers Deposit Bank and relocated its main office to Cynthiana, Ky.
Division of Depository Institutions Bank Branch
In 2013, the Bank Branch supervised 151 state-chartered bank in Kentucky, with total as-sets ranging from $23.2 million to $3.6 billion. The majority of state-chartered banks in Kentucky are in sound financial condition and report acceptable operating profits. As the national economy begins to show signs of improvement, the banking industry has also im-proved. Banks in Kentucky are instrumental in providing important financial services to the communities they operate in. However, some banks have experienced headwinds relating to elevated commercial real estate concentrations and reduced levels of coal production. Kentucky state-chartered banks have historically maintained strong capital ratios, and, de-spite a slight decline in the leverage ratio, this trend continues. The leverage ratio de-clined modestly from 10.87 percent in 2012 to 10.67 percent in 2013. Conversely, the total risk-based capital ratio improved from 16.07 percent in 2012 to 16.41 percent in 2013. This occurred primarily has bank managers restructured balance sheet composition, and shifted more assets into lower risk asset categories. The return on average assets declined from 1.06 in 2012 to 0.89 percent in 2013 due to decreasing asset yields, net in-terest margin compression, and increasing overhead costs.
12
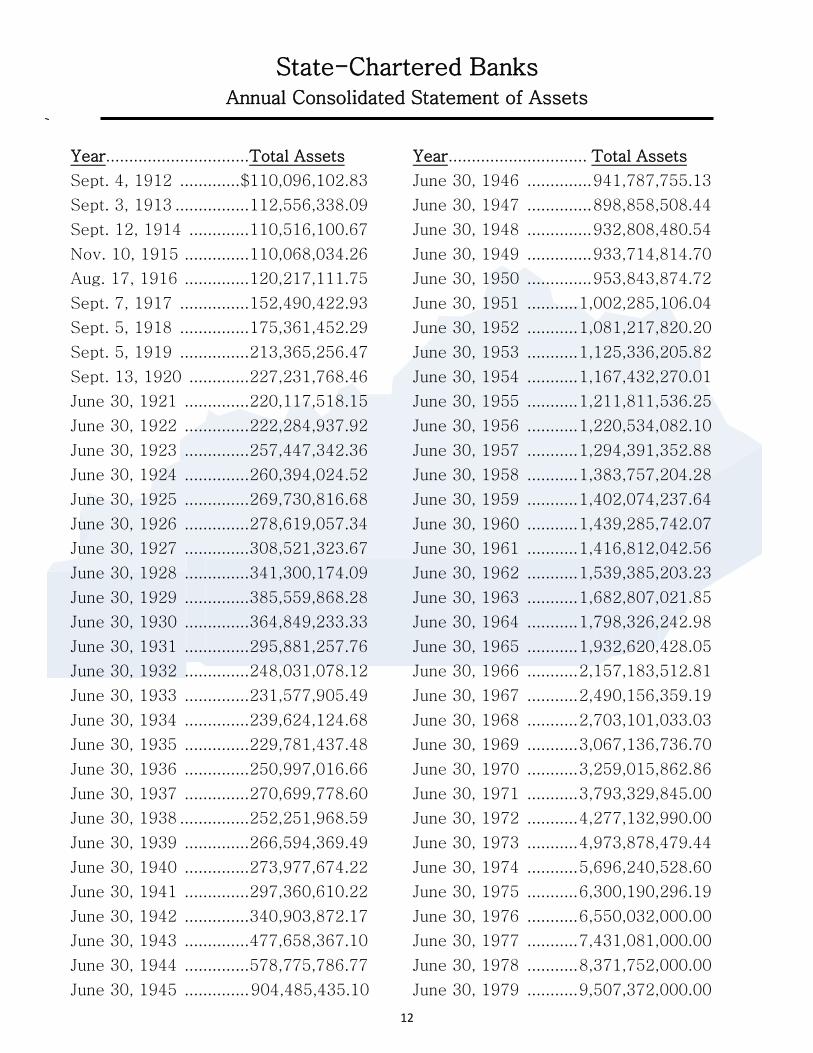
State-Chartered Banks Annual Consolidated Statement of Assets
Year...............................Total Assets
Sept. 4, 1912 ............. $110,096,102.83
Sept. 3, 1913 ................ 112,556,338.09
Sept. 12, 1914 ............. 110,516,100.67
Nov. 10, 1915 .............. 110,068,034.26
Aug. 17, 1916 .............. 120,217,111.75
Sept. 7, 1917 ............... 152,490,422.93
Sept. 5, 1918 ............... 175,361,452.29
Sept. 5, 1919 ............... 213,365,256.47
Sept. 13, 1920 ............. 227,231,768.46
June 30, 1921 .............. 220,117,518.15
June 30, 1922 .............. 222,284,937.92
June 30, 1923 .............. 257,447,342.36
June 30, 1924 .............. 260,394,024.52
June 30, 1925 .............. 269,730,816.68
June 30, 1926 .............. 278,619,057.34
June 30, 1927 .............. 308,521,323.67
June 30, 1928 .............. 341,300,174.09
June 30, 1929 .............. 385,559,868.28
June 30, 1930 .............. 364,849,233.33
June 30, 1931 .............. 295,881,257.76
June 30, 1932 .............. 248,031,078.12
June 30, 1933 .............. 231,577,905.49
June 30, 1934 .............. 239,624,124.68
June 30, 1935 .............. 229,781,437.48
June 30, 1936 .............. 250,997,016.66
June 30, 1937 .............. 270,699,778.60
June 30, 1938 ............... 252,251,968.59
June 30, 1939 .............. 266,594,369.49
June 30, 1940 .............. 273,977,674.22
June 30, 1941 .............. 297,360,610.22
June 30, 1942 .............. 340,903,872.17
June 30, 1943 .............. 477,658,367.10
June 30, 1944 .............. 578,775,786.77
June 30, 1945 .............. 904,485,435.10
Year .............................. Total Assets
June 30, 1946 .............. 941,787,755.13
June 30, 1947 .............. 898,858,508.44
June 30, 1948 .............. 932,808,480.54
June 30, 1949 .............. 933,714,814.70
June 30, 1950 .............. 953,843,874.72
June 30, 1951 ........... 1,002,285,106.04
June 30, 1952 ........... 1,081,217,820.20
June 30, 1953 ........... 1,125,336,205.82
June 30, 1954 ........... 1,167,432,270.01
June 30, 1955 ........... 1,211,811,536.25
June 30, 1956 ........... 1,220,534,082.10
June 30, 1957 ........... 1,294,391,352.88
June 30, 1958 ........... 1,383,757,204.28
June 30, 1959 ........... 1,402,074,237.64
June 30, 1960 ........... 1,439,285,742.07
June 30, 1961 ........... 1,416,812,042.56
June 30, 1962 ........... 1,539,385,203.23
June 30, 1963 ........... 1,682,807,021.85
June 30, 1964 ........... 1,798,326,242.98
June 30, 1965 ........... 1,932,620,428.05
June 30, 1966 ........... 2,157,183,512.81
June 30, 1967 ........... 2,490,156,359.19
June 30, 1968 ........... 2,703,101,033.03
June 30, 1969 ........... 3,067,136,736.70
June 30, 1970 ........... 3,259,015,862.86
June 30, 1971 ........... 3,793,329,845.00
June 30, 1972 ........... 4,277,132,990.00
June 30, 1973 ........... 4,973,878,479.44
June 30, 1974 ........... 5,696,240,528.60
June 30, 1975 ........... 6,300,190,296.19
June 30, 1976 ........... 6,550,032,000.00
June 30, 1977 ........... 7,431,081,000.00
June 30, 1978 ........... 8,371,752,000.00
June 30, 1979 ........... 9,507,372,000.00
13
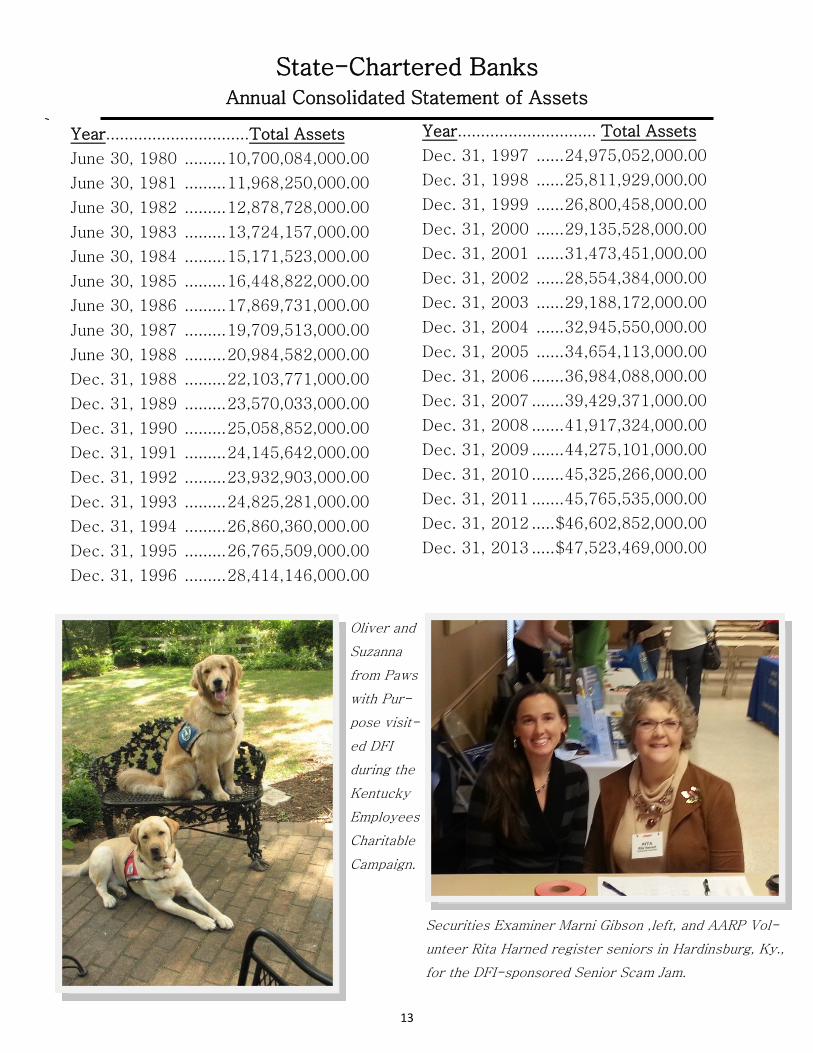
State-Chartered Banks Annual Consolidated Statement of Assets
Year...............................Total Assets
June 30, 1980 ......... 10,700,084,000.00
June 30, 1981 ......... 11,968,250,000.00
June 30, 1982 ......... 12,878,728,000.00
June 30, 1983 ......... 13,724,157,000.00
June 30, 1984 ......... 15,171,523,000.00
June 30, 1985 ......... 16,448,822,000.00
June 30, 1986 ......... 17,869,731,000.00
June 30, 1987 ......... 19,709,513,000.00
June 30, 1988 ......... 20,984,582,000.00
Dec. 31, 1988 ......... 22,103,771,000.00
Dec. 31, 1989 ......... 23,570,033,000.00
Dec. 31, 1990 ......... 25,058,852,000.00
Dec. 31, 1991 ......... 24,145,642,000.00
Dec. 31, 1992 ......... 23,932,903,000.00
Dec. 31, 1993 ......... 24,825,281,000.00
Dec. 31, 1994 ......... 26,860,360,000.00
Dec. 31, 1995 ......... 26,765,509,000.00
Dec. 31, 1996 ......... 28,414,146,000.00
Year .............................. Total Assets
Dec. 31, 1997 ...... 24,975,052,000.00
Dec. 31, 1998 ...... 25,811,929,000.00
Dec. 31, 1999 ...... 26,800,458,000.00
Dec. 31, 2000 ...... 29,135,528,000.00
Dec. 31, 2001 ...... 31,473,451,000.00
Dec. 31, 2002 ...... 28,554,384,000.00
Dec. 31, 2003 ...... 29,188,172,000.00
Dec. 31, 2004 ...... 32,945,550,000.00
Dec. 31, 2005 ...... 34,654,113,000.00
Dec. 31, 2006 ....... 36,984,088,000.00
Dec. 31, 2007 ....... 39,429,371,000.00
Dec. 31, 2008 ....... 41,917,324,000.00
Dec. 31, 2009 ....... 44,275,101,000.00
Dec. 31, 2010 ....... 45,325,266,000.00
Dec. 31, 2011 ....... 45,765,535,000.00
Dec. 31, 2012 ..... $46,602,852,000.00
Dec. 31, 2013 ..... $47,523,469,000.00
Oliver and
Suzanna
from Paws
with Pur-
pose visit-
ed DFI
during the
Kentucky
Employees
Charitable
Campaign.
Securities Examiner Marni Gibson ,left, and AARP Vol-
unteer Rita Harned register seniors in Hardinsburg, Ky.,
for the DFI-sponsored Senior Scam Jam.
14
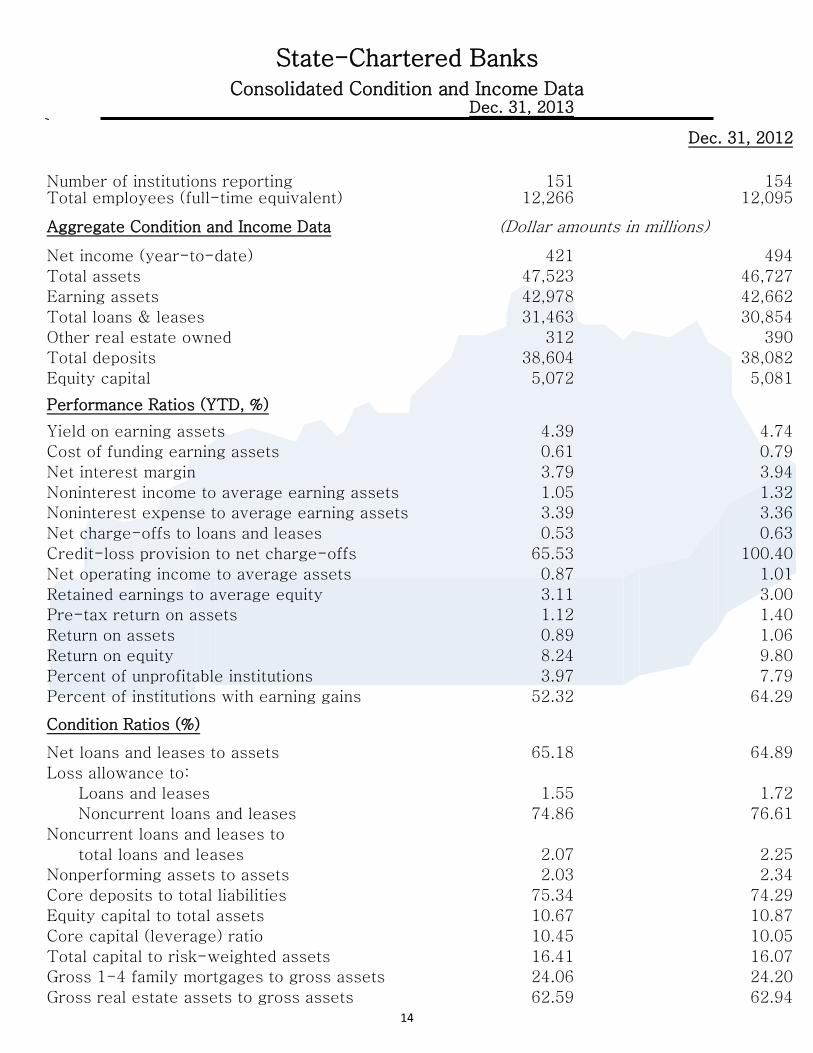
State-Chartered Banks
Consolidated Condition and Income Data
Dec. 31, 2013
Dec. 31, 2012
Number of institutions reporting
151
154 Total employees (full-time equivalent) 12,266 12,095
Aggregate Condition and Income Data (Dollar amounts in millions)
Net income (year-to-date) 421 494
Total assets 47,523 46,727
Earning assets 42,978 42,662
Total loans & leases 31,463 30,854
Other real estate owned 312 390
Total deposits 38,604 38,082
Equity capital 5,072 5,081
Performance Ratios (YTD, %)
Yield on earning assets 4.39 4.74
Cost of funding earning assets 0.61 0.79
Net interest margin 3.79 3.94
Noninterest income to average earning assets 1.05 1.32
Noninterest expense to average earning assets 3.39 3.36
Net charge-offs to loans and leases 0.53 0.63
Credit-loss provision to net charge-offs 65.53 100.40
Net operating income to average assets 0.87 1.01
Retained earnings to average equity 3.11 3.00
Pre-tax return on assets 1.12 1.40
Return on assets 0.89 1.06
Return on equity 8.24 9.80
Percent of unprofitable institutions 3.97 7.79
Percent of institutions with earning gains 52.32 64.29
Condition Ratios (%)
Net loans and leases to assets 65.18 64.89
Loss allowance to:
Loans and leases 1.55 1.72
Noncurrent loans and leases 74.86 76.61
Noncurrent loans and leases to
total loans and leases 2.07 2.25
Nonperforming assets to assets 2.03 2.34
Core deposits to total liabilities 75.34 74.29
Equity capital to total assets 10.67 10.87
Core capital (leverage) ratio 10.45 10.05
Total capital to risk-weighted assets 16.41 16.07
Gross 1-4 family mortgages to gross assets 24.06 24.20
Gross real estate assets to gross assets 62.59 62.94
15
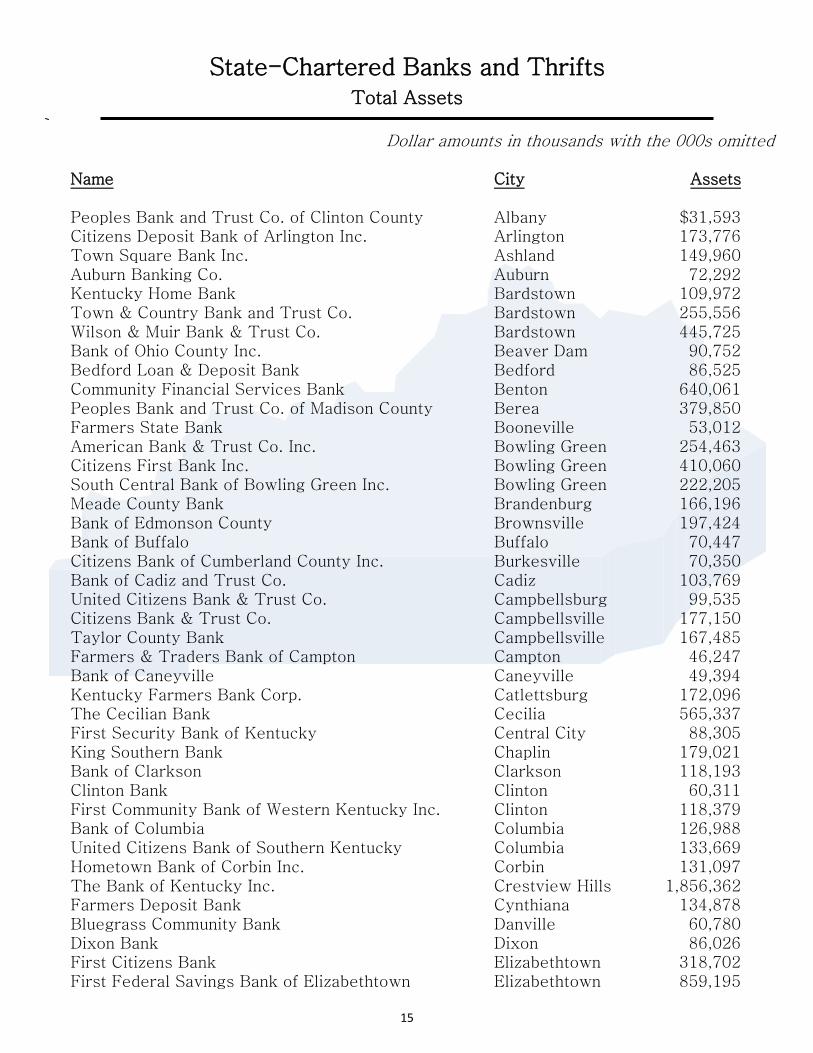
State-Chartered Banks and Thrifts Total Assets
Dollar amounts in thousands with the 000s omitted Name City Assets Peoples Bank and Trust Co. of Clinton County Albany $31,593 Citizens Deposit Bank of Arlington Inc. Arlington 173,776 Town Square Bank Inc. Ashland 149,960 Auburn Banking Co. Auburn 72,292 Kentucky Home Bank Bardstown 109,972 Town & Country Bank and Trust Co. Bardstown 255,556 Wilson & Muir Bank & Trust Co. Bardstown 445,725 Bank of Ohio County Inc. Beaver Dam 90,752 Bedford Loan & Deposit Bank Bedford 86,525 Community Financial Services Bank Benton 640,061 Peoples Bank and Trust Co. of Madison County Berea 379,850 Farmers State Bank Booneville 53,012 American Bank & Trust Co. Inc. Bowling Green 254,463 Citizens First Bank Inc. Bowling Green 410,060 South Central Bank of Bowling Green Inc. Bowling Green 222,205 Meade County Bank Brandenburg 166,196 Bank of Edmonson County Brownsville 197,424 Bank of Buffalo Buffalo 70,447 Citizens Bank of Cumberland County Inc. Burkesville 70,350 Bank of Cadiz and Trust Co. Cadiz 103,769 United Citizens Bank & Trust Co. Campbellsburg 99,535 Citizens Bank & Trust Co. Campbellsville 177,150 Taylor County Bank Campbellsville 167,485 Farmers & Traders Bank of Campton Campton 46,247 Bank of Caneyville Caneyville 49,394 Kentucky Farmers Bank Corp. Catlettsburg 172,096 The Cecilian Bank Cecilia 565,337 First Security Bank of Kentucky Central City 88,305 King Southern Bank Chaplin 179,021 Bank of Clarkson Clarkson 118,193 Clinton Bank Clinton 60,311 First Community Bank of Western Kentucky Inc. Clinton 118,379 Bank of Columbia Columbia 126,988 United Citizens Bank of Southern Kentucky Columbia 133,669 Hometown Bank of Corbin Inc. Corbin 131,097 The Bank of Kentucky Inc. Crestview Hills 1,856,362 Farmers Deposit Bank Cynthiana 134,878 Bluegrass Community Bank Danville 60,780 Dixon Bank Dixon 86,026 First Citizens Bank Elizabethtown 318,702 First Federal Savings Bank of Elizabethtown Elizabethtown 859,195
16
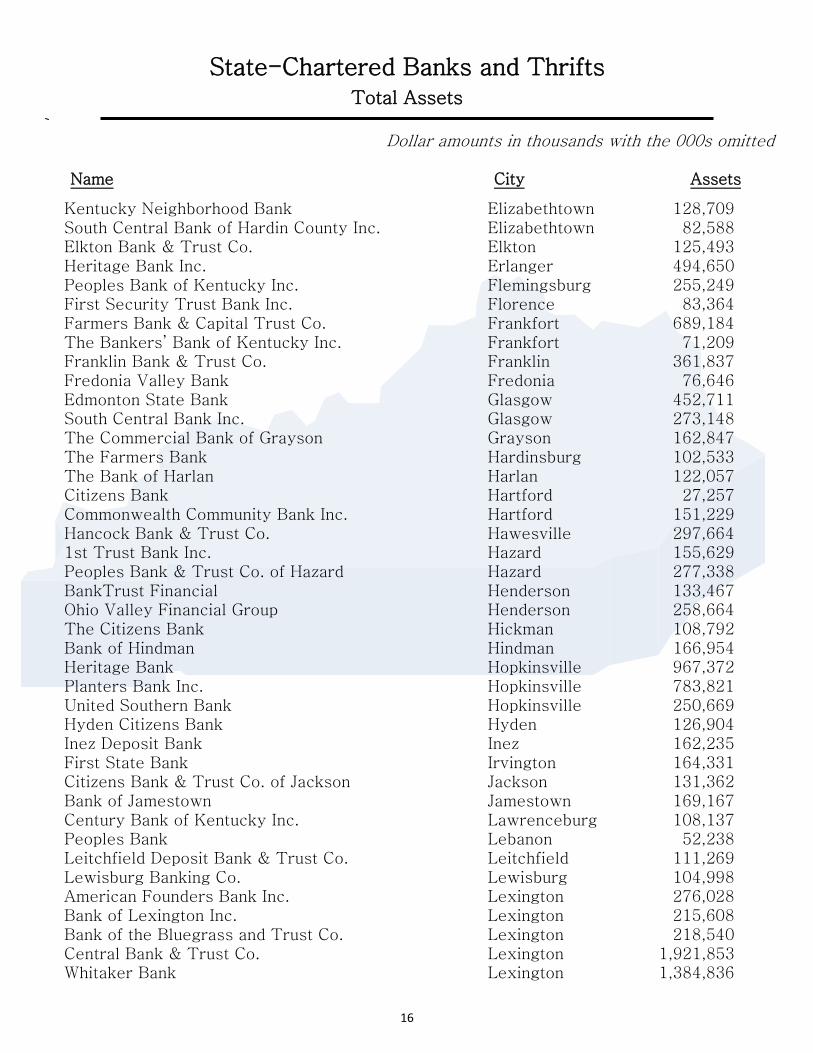
State-Chartered Banks and Thrifts Total Assets
Dollar amounts in thousands with the 000s omitted Name City Assets
Kentucky Neighborhood Bank Elizabethtown 128,709 South Central Bank of Hardin County Inc. Elizabethtown 82,588 Elkton Bank & Trust Co. Elkton 125,493 Heritage Bank Inc. Erlanger 494,650 Peoples Bank of Kentucky Inc. Flemingsburg 255,249 First Security Trust Bank Inc. Florence 83,364 Farmers Bank & Capital Trust Co. Frankfort 689,184 The Bankers’ Bank of Kentucky Inc. Frankfort 71,209 Franklin Bank & Trust Co. Franklin 361,837 Fredonia Valley Bank Fredonia 76,646 Edmonton State Bank Glasgow 452,711 South Central Bank Inc. Glasgow 273,148 The Commercial Bank of Grayson Grayson 162,847 The Farmers Bank Hardinsburg 102,533 The Bank of Harlan Harlan 122,057 Citizens Bank Hartford 27,257 Commonwealth Community Bank Inc. Hartford 151,229 Hancock Bank & Trust Co. Hawesville 297,664 1st Trust Bank Inc. Hazard 155,629 Peoples Bank & Trust Co. of Hazard Hazard 277,338 BankTrust Financial Henderson 133,467 Ohio Valley Financial Group Henderson 258,664 The Citizens Bank Hickman 108,792 Bank of Hindman Hindman 166,954 Heritage Bank Hopkinsville 967,372 Planters Bank Inc. Hopkinsville 783,821 United Southern Bank Hopkinsville 250,669 Hyden Citizens Bank Hyden 126,904 Inez Deposit Bank Inez 162,235 First State Bank Irvington 164,331 Citizens Bank & Trust Co. of Jackson Jackson 131,362 Bank of Jamestown Jamestown 169,167 Century Bank of Kentucky Inc. Lawrenceburg 108,137 Peoples Bank Lebanon 52,238 Leitchfield Deposit Bank & Trust Co. Leitchfield 111,269 Lewisburg Banking Co. Lewisburg 104,998 American Founders Bank Inc. Lexington 276,028 Bank of Lexington Inc. Lexington 215,608 Bank of the Bluegrass and Trust Co. Lexington 218,540 Central Bank & Trust Co. Lexington 1,921,853 Whitaker Bank Lexington 1,384,836

17
State-Chartered Banks and Thrifts Total Assets
Dollar amounts in thousands with the 000s omitted Name City Assets
The Casey County Bank Inc. Liberty 159,863 Louisa Community Bank Louisa 29,372 Peoples Security Bank Louisa 47,106 Central Bank of Jefferson County Louisville 199,342 Commonwealth Bank and Trust Co. Louisville 736,219 Eclipse Bank Inc. Louisville 137,786 Metro Bank Louisville 33,393 PBI Bank Louisville 1,074,597 Republic Bank & Trust Co. Louisville 3,253,875 River City Bank Inc. Louisville 276,014 Stock Yards Bank & Trust Co. Louisville 2,383,571 The First Capital Bank of Kentucky Louisville 473,525 First United Bank and Trust Co. Madisonville 199,583 Magnolia Bank Inc. Magnolia 144,381 Farmers Bank and Trust Co. Marion 138,178 The Peoples Bank Marion 36,103 First Guaranty Bank Martin 62,205 First Kentucky Bank Inc. Mayfield 374,868 FNB Bank Inc. Mayfield 409,107 Bank of Maysville Maysville 117,331 Security Bank and Trust Co. Maysville 50,727 Jackson County Bank McKee 129,395 Farmers Deposit Bank of Middleburg Inc. Middleburg 47,961 Home Federal Bank Corp. Middlesboro 334,742 The Farmers Bank of Milton Milton 221,102 The Monticello Banking Co. Monticello 545,937 The Citizens Bank Morehead 118,574 United Community Bank of West Kentucky Inc. Morganfield 211,624 Morgantown Bank & Trust Co. Inc. Morgantown 151,967 Traditional Bank Inc. Mount Sterling 1,140,070 Citizens Bank Mount Vernon 139,504 The Peoples Bank Mount Washington 77,215 Hart County Bank and Trust Co. Munfordville 27,209 Citizens Bank of Northern Kentucky Inc. Newport 252,383 The Farmers Bank Nicholasville 107,771 First Security Bank of Owensboro Inc. Owensboro 477,397 Independence Bank of Kentucky Owensboro 1,381,024 South Central Bank of Daviess County Inc. Owensboro 200,736 First Farmers Bank and Trust Co. Owenton 112,176 Peoples Bank & Trust Co. Owenton 59,178 Owingsville Banking Co. Owingsville 63,148
18
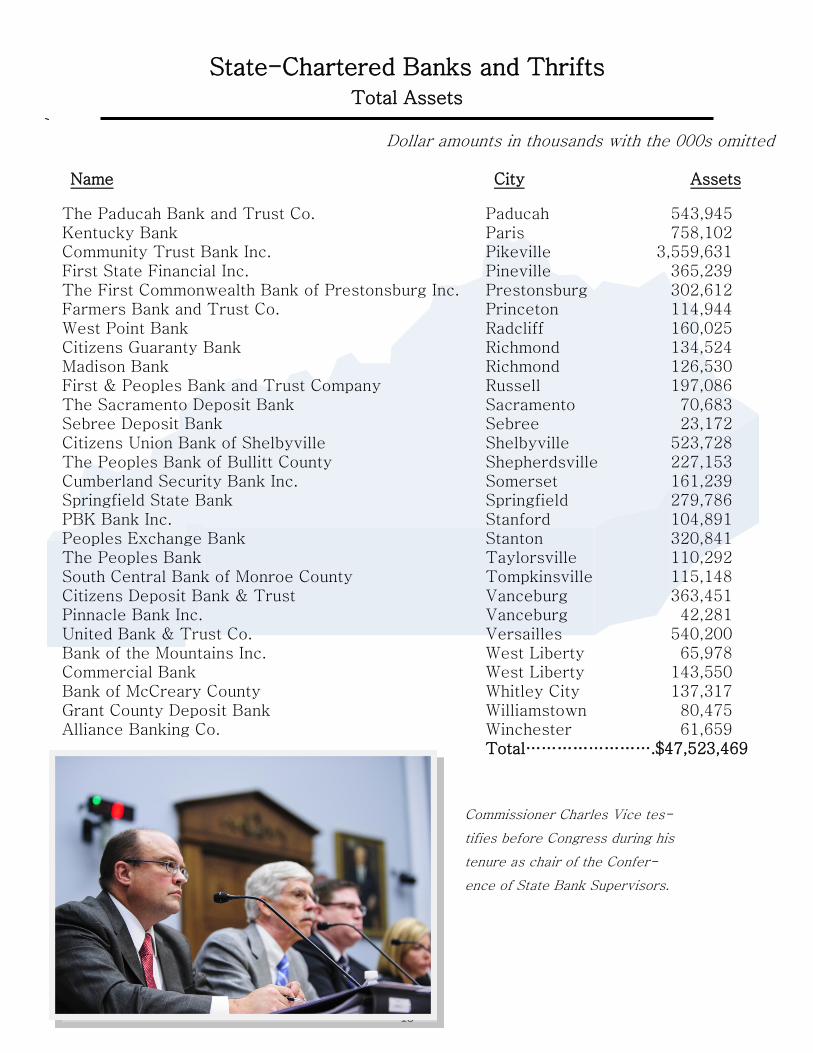
State-Chartered Banks and Thrifts Total Assets
Dollar amounts in thousands with the 000s omitted Name City Assets
The Paducah Bank and Trust Co. Paducah 543,945 Kentucky Bank Paris 758,102 Community Trust Bank Inc. Pikeville 3,559,631 First State Financial Inc. Pineville 365,239 The First Commonwealth Bank of Prestonsburg Inc. Prestonsburg 302,612 Farmers Bank and Trust Co. Princeton 114,944 West Point Bank Radcliff 160,025 Citizens Guaranty Bank Richmond 134,524 Madison Bank Richmond 126,530 First & Peoples Bank and Trust Company Russell 197,086 The Sacramento Deposit Bank Sacramento 70,683 Sebree Deposit Bank Sebree 23,172 Citizens Union Bank of Shelbyville Shelbyville 523,728 The Peoples Bank of Bullitt County Shepherdsville 227,153 Cumberland Security Bank Inc. Somerset 161,239 Springfield State Bank Springfield 279,786 PBK Bank Inc. Stanford 104,891 Peoples Exchange Bank Stanton 320,841 The Peoples Bank Taylorsville 110,292 South Central Bank of Monroe County Tompkinsville 115,148 Citizens Deposit Bank & Trust Vanceburg 363,451 Pinnacle Bank Inc. Vanceburg 42,281 United Bank & Trust Co. Versailles 540,200 Bank of the Mountains Inc. West Liberty 65,978 Commercial Bank West Liberty 143,550 Bank of McCreary County Whitley City 137,317 Grant County Deposit Bank Williamstown 80,475 Alliance Banking Co. Winchester 61,659
Total…………………….$47,523,469
Commissioner Charles Vice tes-
tifies before Congress during his
tenure as chair of the Confer-
ence of State Bank Supervisors.
19
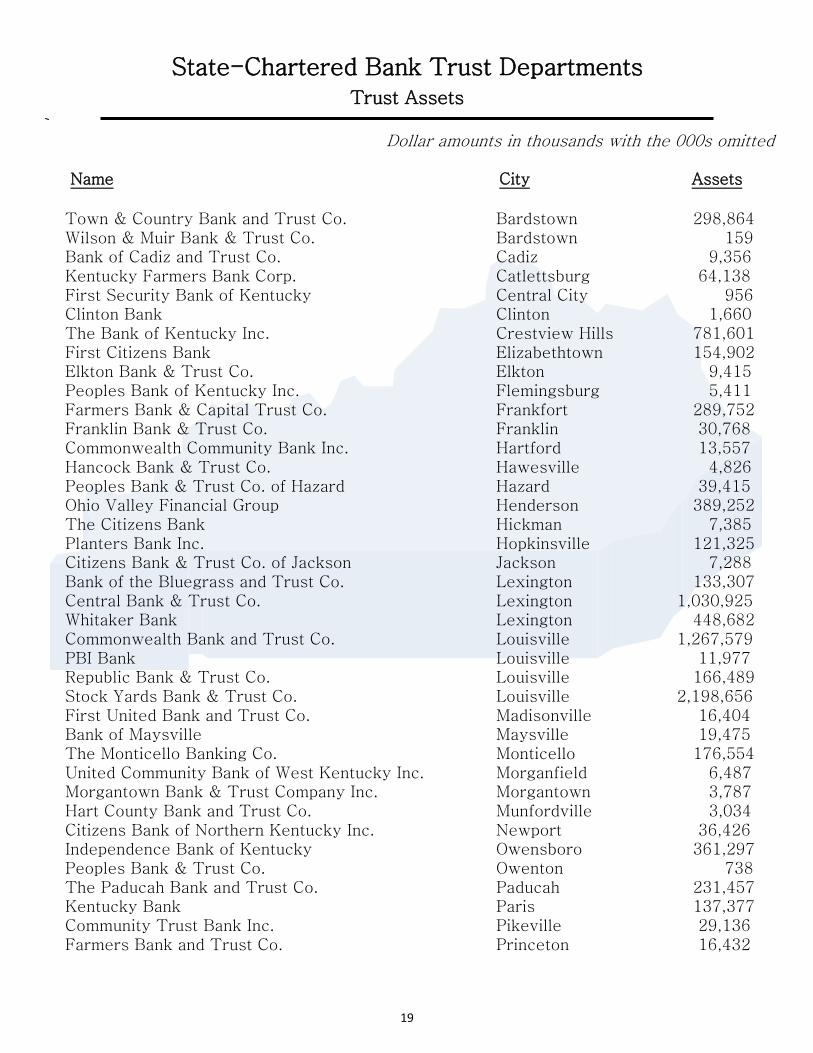
State-Chartered Bank Trust Departments Trust Assets
Dollar amounts in thousands with the 000s omitted Name City Assets
Town & Country Bank and Trust Co. Bardstown 298,864 Wilson & Muir Bank & Trust Co. Bardstown 159 Bank of Cadiz and Trust Co. Cadiz 9,356 Kentucky Farmers Bank Corp. Catlettsburg 64,138 First Security Bank of Kentucky Central City 956 Clinton Bank Clinton 1,660 The Bank of Kentucky Inc. Crestview Hills 781,601 First Citizens Bank Elizabethtown 154,902 Elkton Bank & Trust Co. Elkton 9,415 Peoples Bank of Kentucky Inc. Flemingsburg 5,411 Farmers Bank & Capital Trust Co. Frankfort 289,752 Franklin Bank & Trust Co. Franklin 30,768 Commonwealth Community Bank Inc. Hartford 13,557 Hancock Bank & Trust Co. Hawesville 4,826 Peoples Bank & Trust Co. of Hazard Hazard 39,415 Ohio Valley Financial Group Henderson 389,252 The Citizens Bank Hickman 7,385 Planters Bank Inc. Hopkinsville 121,325 Citizens Bank & Trust Co. of Jackson Jackson 7,288 Bank of the Bluegrass and Trust Co. Lexington 133,307 Central Bank & Trust Co. Lexington 1,030,925 Whitaker Bank Lexington 448,682 Commonwealth Bank and Trust Co. Louisville 1,267,579 PBI Bank Louisville 11,977 Republic Bank & Trust Co. Louisville 166,489 Stock Yards Bank & Trust Co. Louisville 2,198,656 First United Bank and Trust Co. Madisonville 16,404 Bank of Maysville Maysville 19,475 The Monticello Banking Co. Monticello 176,554 United Community Bank of West Kentucky Inc. Morganfield 6,487 Morgantown Bank & Trust Company Inc. Morgantown 3,787 Hart County Bank and Trust Co. Munfordville 3,034 Citizens Bank of Northern Kentucky Inc. Newport 36,426 Independence Bank of Kentucky Owensboro 361,297 Peoples Bank & Trust Co. Owenton 738 The Paducah Bank and Trust Co. Paducah 231,457 Kentucky Bank Paris 137,377 Community Trust Bank Inc. Pikeville 29,136 Farmers Bank and Trust Co. Princeton 16,432

20
State-Chartered Bank Trust Departments Trust Assets
Dollar amounts in thousands with the 000s omitted Name City Assets
First & Peoples Bank and Trust Co. ` Russell 37,341 Citizens Union Bank of Shelbyville Shelbyville 1,192 Cumberland Security Bank Inc. Somerset 18,252 Grant County Deposit Bank Williamstown 1,950 Total …………………… $8,584,984 * Includes Managed and Non-Managed Trust Accounts
State-Chartered Independent Trust Companies Total Assets
Name City Trust Assets Community Trust and Investment Co. Lexington 2,126,908 First Kentucky Trust Co. Louisville 472,615 Hilliard Lyons Trust Co. LLC Louisville 4,381,110 The Glenview Trust Co. Louisville 4,111,419 Total …………………… $11,092,052
Dollar amounts in thousands with the 000s omitted
DFI display table.
* Includes Managed and Non- Managed Trust Accounts
Consumer Protection
Examiner Gayle Keltner
presents to seniors at a
DFI-hosted Senior
Scam Jam in Camp-
bellsville, Ky.
21
Division of Depository Institutions Credit Union Branch
79th Annual Credit Union Report
Credit Union Changes
During 2013 two federal credit unions in Kentucky changed to state charter. One credit un-ion’s charter was dissolved through voluntary merger.
May. 31, 2013: Friends First Federal Credit Union in Owensboro converted becoming Friends First Credit Union.
Nov. 30, 2013: B. C. B. S. Credit Union, Louisville, merged into AutoTruck Credit
Union.
Dec. 31, 2013: Park Community Federal Credit Union in Louisville converted becoming Park Community Credit Union Inc.
The Credit Union Branch supervised 25 Kentucky state-chartered credit unions, with total assets ranging from $734 thousand to $944 million. Kentucky state-chartered credit unions are in a sound financial condition and report a satisfactory level of income. For the twelve months ending December 31, 2013, totals assets increased 4.11 percent, which represents a slight reduction from the 4.17 percent growth rate in 2012. Overall, net worth grew 2.38 percent, and the ratio of net worth to total assets was strong at 14.39%. The return on av-erage assets declined substantially from 1.05 percent in 2012 to 0.84 percent in 2013. The loan growth rate of 9.86 percent was nearly triple the prior year’s rate of 3.3 per-cent. Real estate secured loans accounted for 42.44 percent of total loans, with fixed rates loans secured by first liens on residential property accounting for 31.8 percent of all real estate loans. Despite the strong loan growth, asset quality remained acceptable. The ratio of delinquent loans to total loans was 1.07 percent, and the ratio of charged-off loans to average loans was 0.70 percent. Interest rate risk is increasing. The net long-term asset ratio increased from 25.84 per-cent, 32.08 percent, and 35.93 percent, in 2011, 2012, and 2013, respectively. Credit un-ions have been originating increased volumes of longer-term fixed rate real estate loans, coupled with extending the duration of their investment portfolios. Interest rate risk man-agement will be important for Kentucky state-chartered credit unions to maintain accepta-ble operating results and strong net worth positions.

22
State-Chartered Credit Unions Annual Consolidate Statements of Assets
June 30, 1934 ........................ 391,943
June 30, 1935 ........................ 725,535
June 30, 1936 ..................... 1,249,342
June 30, 1937 ..................... 1,660,520
June 30, 1938 ..................... 1,696,127
June 30, 1939 ..................... 2,057,015
June 30, 1940 .................................... *
June 30, 1941 ..................... 3,146,257
June 30, 1942 ..................... 3,251,825
June 30, 1943 ..................... 2,982,267
June 30, 1944 ..................... 3,088,248
June 30, 1945 ..................... 3,505,257
June 30, 1946 ..................... 4,144,653
June 30, 1947 ..................... 4,995,675
June 30, 1948 ..................... 6,083,221
June 30, 1949 ..................... 7,107,044
June 30, 1950 ..................... 8,334,194
June 30, 1951 ..................... 8,179,622
June 30, 1952 ................... 10,516,625
June 30, 1953 ................... 12,623,784
June 30, 1954 ................... 14,781,357
June 30, 1955 ................... 16,702,656
June 30, 1956 ................... 19,107,017
June 30, 1957 ................... 21,437,514
June 30, 1958 ................... 23,623,385
June 30, 1959 ................... 26,447,334
June 30, 1960 ................... 27,979,449
June 30, 1961 ................... 29,357,256
June 30, 1962 ................... 31,739,280
June 30, 1963 ................... 34,501,791
June 30, 1964 ................... 39,301,082
June 30, 1965 ................... 43,391,089
June 30, 1966 ................... 46,430,845
June 30, 1967 ................... 50,065,518
June 30, 1968 ................... 53,669,699
June 30, 1969 ................... 58,409,409
June 30, 1970 .................... 64,297,546
June 30, 1971 .................... 71,728,169
June 30, 1972 .................... 81,246,995
June 30, 1973 ..................... 91,221,819
June 30, 1974 ................... 100,937,750
June 30, 1975 ................... 113,438,105
June 30, 1976 ................... 129,079,696
June 30, 1977 ................... 147,094,455
June 30, 1978 ................... 169,281,627
June 30, 1979 ................... 176,261,333
June 30, 1980 ................... 170,888,349
June 30, 1981 ................... 198,916,832
June 30, 1982 ................... 190,721,775
June 30, 1983 ................... 226,257,290
June 30, 1984 ................... 270,077,766
June 30, 1985 ................... 324,359,567
June 30, 1986 ................... 465,930,836
June 30, 1987 ................... 534,721,314
June 30, 1988 ................... 522,854,417
Dec. 31, 1988 ................... 486,976,000
Dec. 31, 1989 ................... 482,857,000
Dec. 31, 1990 ................... 509,758,691
Dec. 31, 1991 ................... 554,628,084
Dec. 31, 1992 ................... 610,893,902
Dec. 31, 1993 ................... 643,540,808
Dec. 31, 1994 ................... 670,077,079
Dec. 31, 1995 ................... 697,585,006
Dec. 31, 1996 ................... 726,727,477
Dec. 31, 1997 ................... 782,580,308
Dec. 31, 1998 ................... 855,559,615
Dec. 31, 1999 ................... 897,712,452
Dec. 31, 2000 ................... 957,541,750
Dec. 31, 2001 ................ 1,081,872,980
Dec. 31, 2002 ................ 1,157,171,468
Dec. 31, 2003 ................ 1,246,656,550
Dec. 31, 2004 ................ 1,273,660,697
23
State-Chartered Credit Unions Annual Consolidate Statements of Assets
Dec. 31, 2005 ................ 1,273,328,540
Dec. 31, 2006 .............. 1,304,569,417
Dec. 31, 2007 ................ 1,387,214,179
Dec. 31, 2008 ................ 1,539,537,367
Dec. 31, 2009 ................ 1,696,546,762
Dec. 31,2010 ................. 1,714,675,332
Dec. 31, 2011 ................1,844,748,368
Dec. 31, 2012 ................ 1,921,587,548
Dec. 31, 2013 .............. $2,589,518,099
State-Chartered Credit Unions Selected Composite Operating Ratios
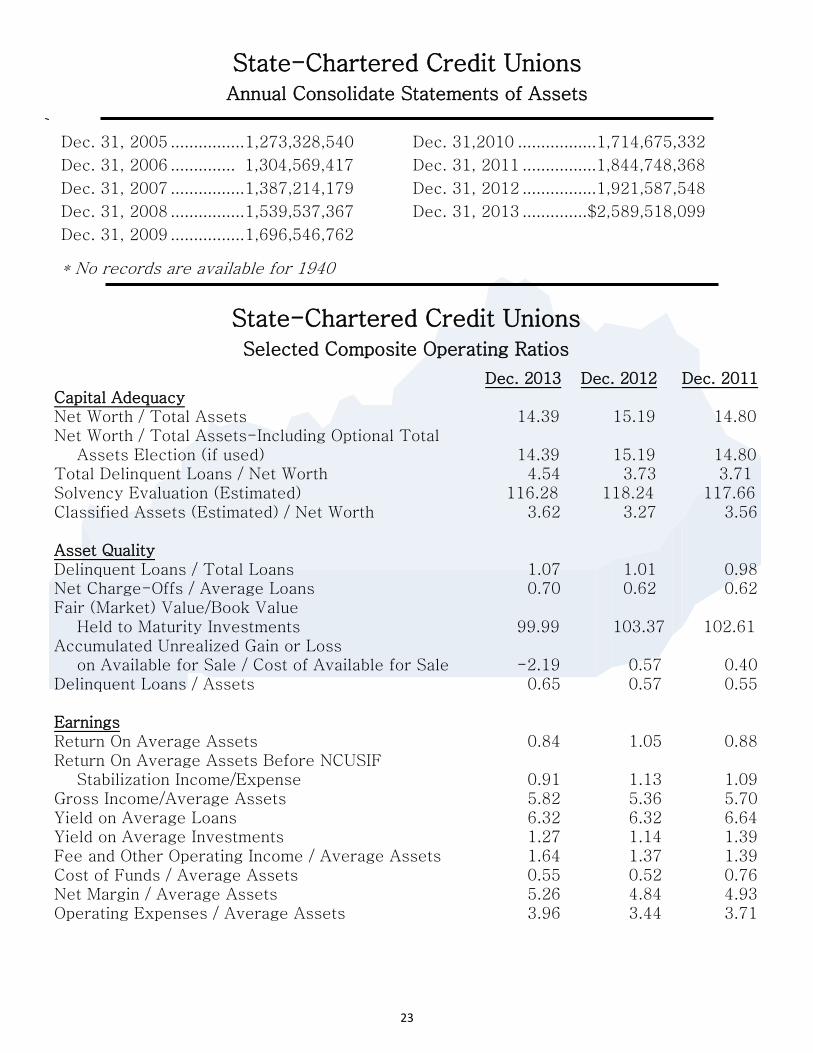
Dec. 2013 Dec. 2012 Dec. 2011 Capital Adequacy Net Worth / Total Assets 14.39 15.19 14.80 Net Worth / Total Assets-Including Optional Total Assets Election (if used) 14.39 15.19 14.80 Total Delinquent Loans / Net Worth 4.54 3.73 3.71 Solvency Evaluation (Estimated) 116.28 118.24 117.66 Classified Assets (Estimated) / Net Worth 3.62 3.27 3.56 Asset Quality Delinquent Loans / Total Loans 1.07 1.01 0.98 Net Charge-Offs / Average Loans 0.70 0.62 0.62 Fair (Market) Value/Book Value Held to Maturity Investments 99.99 103.37 102.61 Accumulated Unrealized Gain or Loss on Available for Sale / Cost of Available for Sale -2.19 0.57 0.40 Delinquent Loans / Assets 0.65 0.57 0.55 Earnings Return On Average Assets 0.84 1.05 0.88 Return On Average Assets Before NCUSIF Stabilization Income/Expense 0.91 1.13 1.09 Gross Income/Average Assets 5.82 5.36 5.70 Yield on Average Loans 6.32 6.32 6.64 Yield on Average Investments 1.27 1.14 1.39 Fee and Other Operating Income / Average Assets 1.64 1.37 1.39 Cost of Funds / Average Assets 0.55 0.52 0.76 Net Margin / Average Assets 5.26 4.84 4.93 Operating Expenses / Average Assets 3.96 3.44 3.71
* No records are available for 1940
24
State-Chartered Credit Unions Selected Composite Operating Ratios
Dec. 2013 Dec. 2012 Dec. 2011
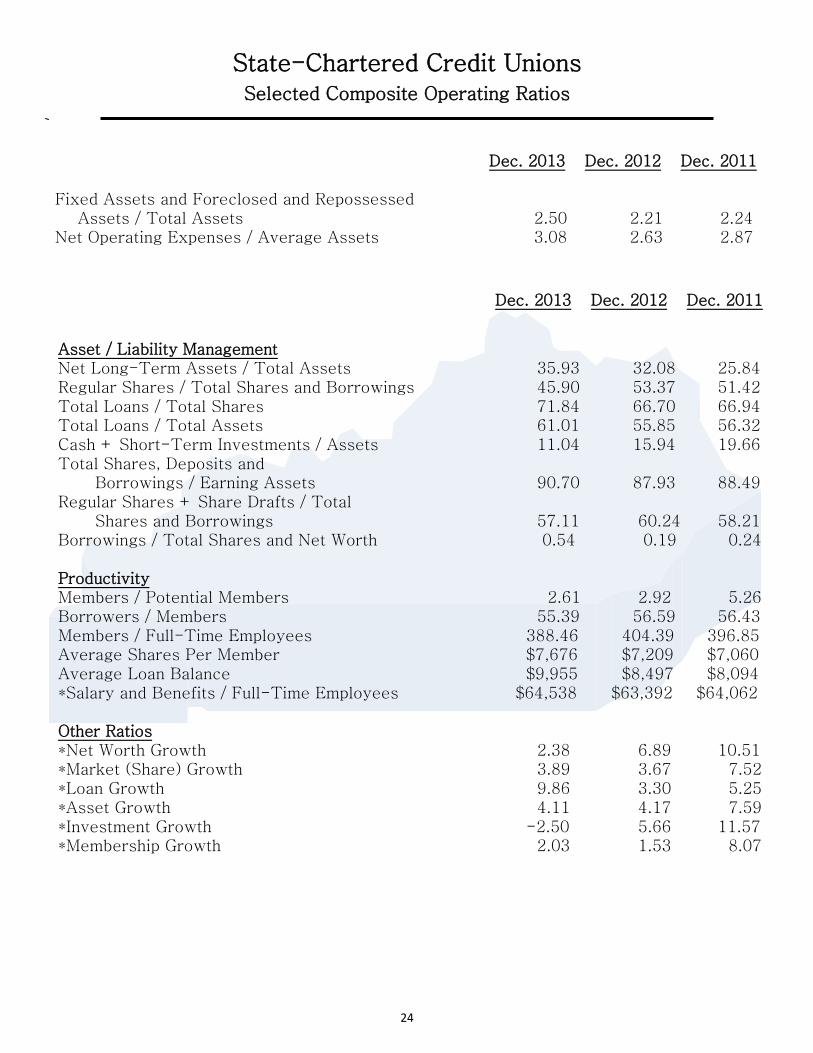
Fixed Assets and Foreclosed and Repossessed Assets / Total Assets 2.50 2.21 2.24 Net Operating Expenses / Average Assets 3.08 2.63 2.87
Dec. 2013 Dec. 2012 Dec. 2011
Asset / Liability Management Net Long-Term Assets / Total Assets 35.93 32.08 25.84 Regular Shares / Total Shares and Borrowings 45.90 53.37 51.42 Total Loans / Total Shares 71.84 66.70 66.94 Total Loans / Total Assets 61.01 55.85 56.32 Cash + Short-Term Investments / Assets 11.04 15.94 19.66 Total Shares, Deposits and Borrowings / Earning Assets 90.70 87.93 88.49 Regular Shares + Share Drafts / Total Shares and Borrowings 57.11 60.24 58.21 Borrowings / Total Shares and Net Worth 0.54 0.19 0.24 Productivity Members / Potential Members 2.61 2.92 5.26 Borrowers / Members 55.39 56.59 56.43 Members / Full-Time Employees 388.46 404.39 396.85 Average Shares Per Member $7,676 $7,209 $7,060 Average Loan Balance $9,955 $8,497 $8,094 *Salary and Benefits / Full-Time Employees $64,538 $63,392 $64,062 Other Ratios *Net Worth Growth 2.38 6.89 10.51 *Market (Share) Growth 3.89 3.67 7.52 *Loan Growth 9.86 3.30 5.25 *Asset Growth 4.11 4.17 7.59 *Investment Growth -2.50 5.66 11.57 *Membership Growth 2.03 1.53 8.07
25
State-Chartered Credit Unions Report of Condition
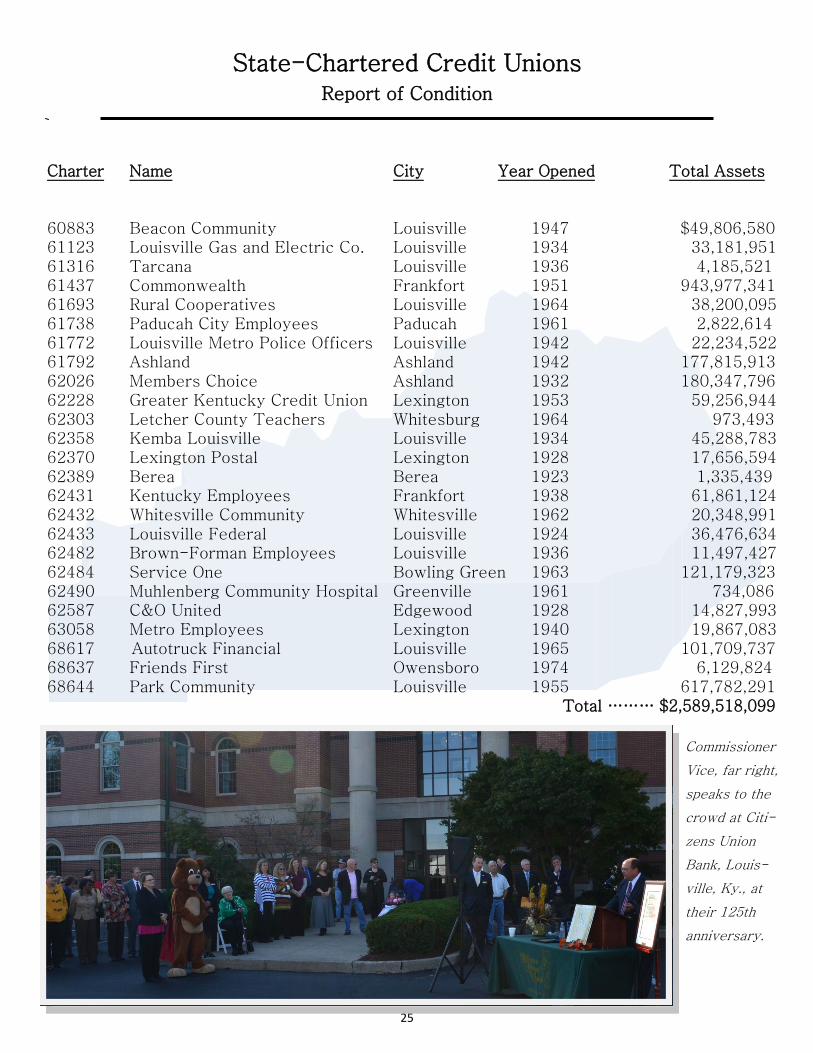
Charter Name City Year Opened Total Assets 60883 Beacon Community Louisville 1947 $49,806,580 61123 Louisville Gas and Electric Co. Louisville 1934 33,181,951 61316 Tarcana Louisville 1936 4,185,521 61437 Commonwealth Frankfort 1951 943,977,341 61693 Rural Cooperatives Louisville 1964 38,200,095 61738 Paducah City Employees Paducah 1961 2,822,614 61772 Louisville Metro Police Officers Louisville 1942 22,234,522 61792 Ashland Ashland 1942 177,815,913 62026 Members Choice Ashland 1932 180,347,796 62228 Greater Kentucky Credit Union Lexington 1953 59,256,944 62303 Letcher County Teachers Whitesburg 1964 973,493 62358 Kemba Louisville Louisville 1934 45,288,783 62370 Lexington Postal Lexington 1928 17,656,594 62389 Berea Berea 1923 1,335,439 62431 Kentucky Employees Frankfort 1938 61,861,124 62432 Whitesville Community Whitesville 1962 20,348,991 62433 Louisville Federal Louisville 1924 36,476,634 62482 Brown-Forman Employees Louisville 1936 11,497,427 62484 Service One Bowling Green 1963 121,179,323 62490 Muhlenberg Community Hospital Greenville 1961 734,086 62587 C&O United Edgewood 1928 14,827,993 63058 Metro Employees Lexington 1940 19,867,083 68617 Autotruck Financial Louisville 1965 101,709,737 68637 Friends First Owensboro 1974 6,129,824 68644 Park Community Louisville 1955 617,782,291 Total ……… $2,589,518,099
Commissioner
Vice, far right,
speaks to the
crowd at Citi-
zens Union
Bank, Louis-
ville, Ky., at
their 125th
anniversary.

26
Division of Nondepository Institutions
DFI’s Division of Nondepository Institutions has four branches: the Licensing Branch, the Consumer Protection Branch, the Mortgage Examination Branch, and the Non-mortgage Examination Branch. The staff consists of 23 examiners and investigators. Due to the challenges leading up to the recession, consumer finance laws and regulations have been rapidly changing, primarily as a result of the Dodd-Frank Act. The Division of Nondepository Institutions is committed to maintaining a well trained staff. The division also provides educational materials and outreach to protect consumers from financial fraud.
Mortgage Examination Branch 1st Annual Mortgage Examination Report
The Mortgage Examination Branch is responsible for the examination and oversight of state-licensed mortgage loan companies, mortgage loan brokers, mortgage loan origina-tors, and mortgage loan processors. Staff conducts independent compliance examinations as well as multi-state examinations of companies licensed in the Commonwealth to ensure business is being conducted in accordance with applicable state and federal law.
Examination Type Examinations 2013 Examinations 2012
Mortgage Companies 213 300 Mortgage Brokers 59 80 Total 272 380
Non-Mortgage Examination Branch 1st Annual Non-Mortgage Report
The Non-Mortgage Examination Branch is responsible for the examination and oversight of state licensed check cashers, deferred deposit/payday lenders, consumer loan companies, industrial loan companies, and money transmitters. The staff conducts independent exami-nations of companies licensed in the Commonwealth to ensure business is being conducted in accordance with state and federal law. Money transmitter examinations are also con-ducted as multi-state examinations. Examination Type Examinations 2013 Examinations 2012 Payday Lenders/Check Cashers 551 558 Consumer Loan Companies 350 341 Industrial Loan Companies 26 25 Money Transmitters 14 15 Total 941 939
27
Division of Nondepository Institutions
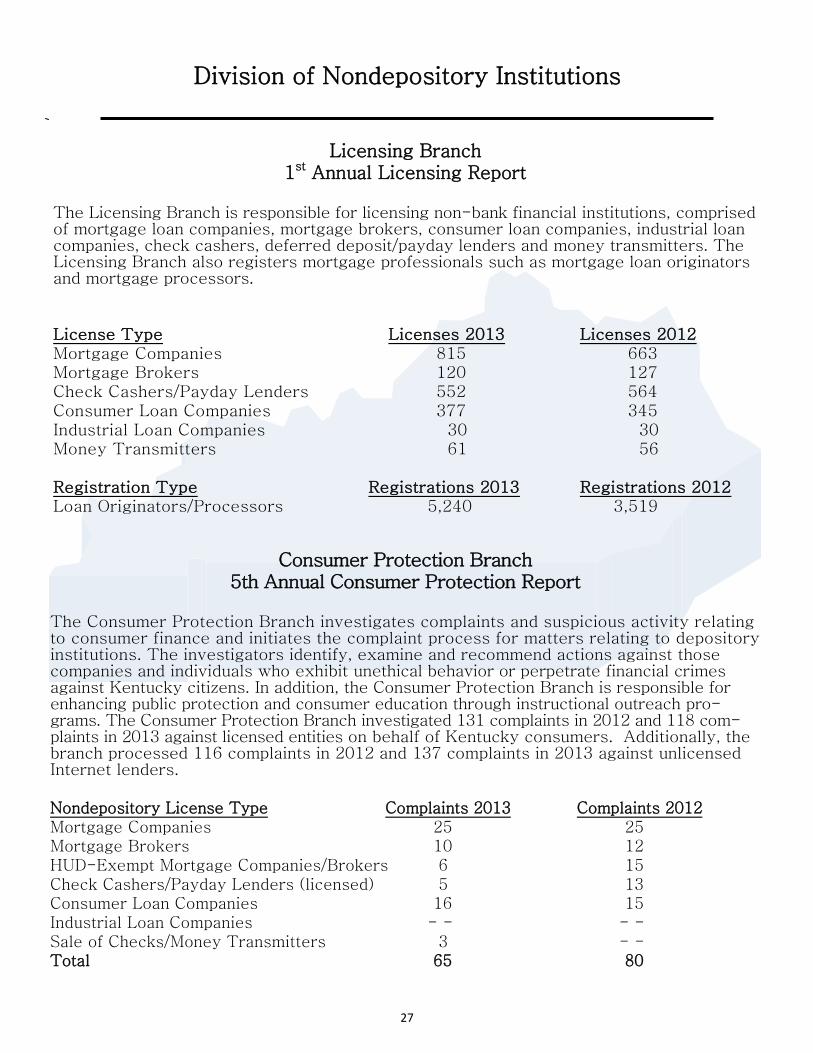
Licensing Branch 1st Annual Licensing Report
The Licensing Branch is responsible for licensing non-bank financial institutions, comprised of mortgage loan companies, mortgage brokers, consumer loan companies, industrial loan companies, check cashers, deferred deposit/payday lenders and money transmitters. The Licensing Branch also registers mortgage professionals such as mortgage loan originators and mortgage processors. License Type Licenses 2013 Licenses 2012 Mortgage Companies 815 663 Mortgage Brokers 120 127 Check Cashers/Payday Lenders 552 564 Consumer Loan Companies 377 345 Industrial Loan Companies 30 30 Money Transmitters 61 56 Registration Type Registrations 2013 Registrations 2012 Loan Originators/Processors 5,240 3,519
Consumer Protection Branch 5th Annual Consumer Protection Report
The Consumer Protection Branch investigates complaints and suspicious activity relating to consumer finance and initiates the complaint process for matters relating to depository institutions. The investigators identify, examine and recommend actions against those companies and individuals who exhibit unethical behavior or perpetrate financial crimes against Kentucky citizens. In addition, the Consumer Protection Branch is responsible for enhancing public protection and consumer education through instructional outreach pro-grams. The Consumer Protection Branch investigated 131 complaints in 2012 and 118 com-plaints in 2013 against licensed entities on behalf of Kentucky consumers. Additionally, the branch processed 116 complaints in 2012 and 137 complaints in 2013 against unlicensed Internet lenders. Nondepository License Type Complaints 2013 Complaints 2012 Mortgage Companies 25 25 Mortgage Brokers 10 12 HUD-Exempt Mortgage Companies/Brokers 6 15 Check Cashers/Payday Lenders (licensed) 5 13 Consumer Loan Companies 16 15 Industrial Loan Companies - - - - Sale of Checks/Money Transmitters 3 - - Total 65 80
28
Division of Nondepository Institutions
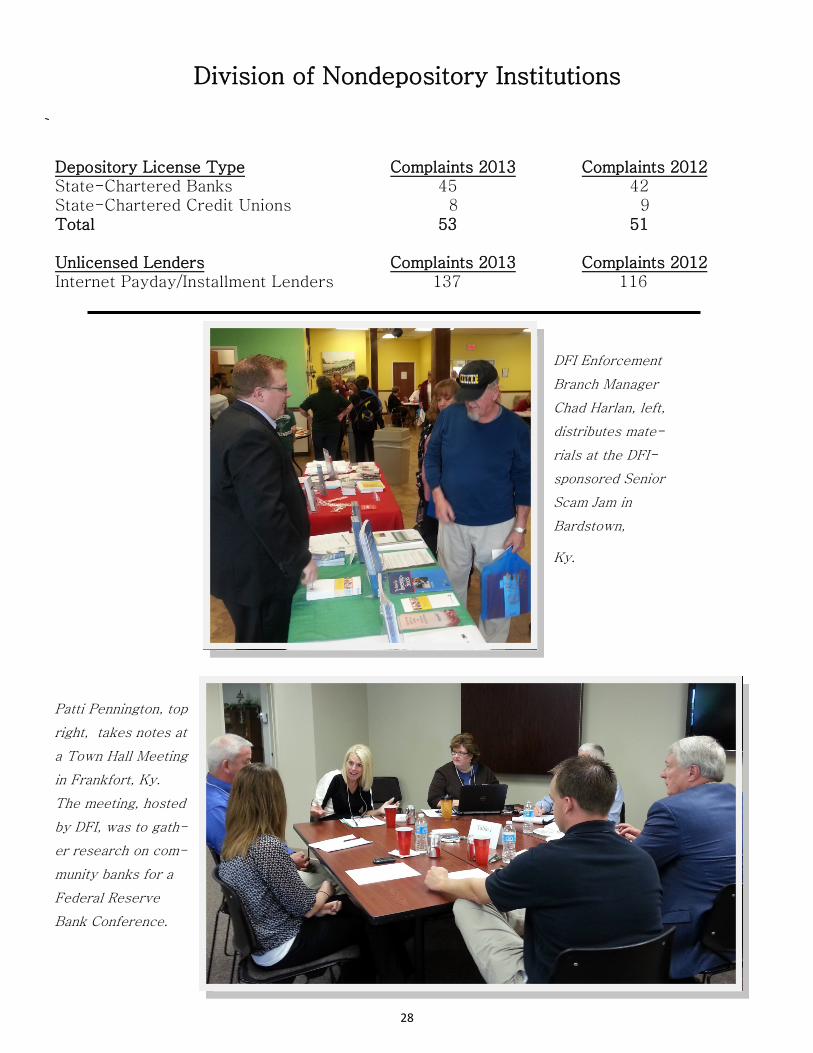
Depository License Type Complaints 2013 Complaints 2012 State-Chartered Banks 45 42 State-Chartered Credit Unions 8 9 Total 53 51 Unlicensed Lenders Complaints 2013 Complaints 2012 Internet Payday/Installment Lenders 137 116
DFI Enforcement
Branch Manager
Chad Harlan, left,
distributes mate-
rials at the DFI-
sponsored Senior
Scam Jam in
Bardstown,
Ky.
Patti Pennington, top
right, takes notes at
a Town Hall Meeting
in Frankfort, Ky.
The meeting, hosted
by DFI, was to gath-
er research on com-
munity banks for a
Federal Reserve
Bank Conference.
29
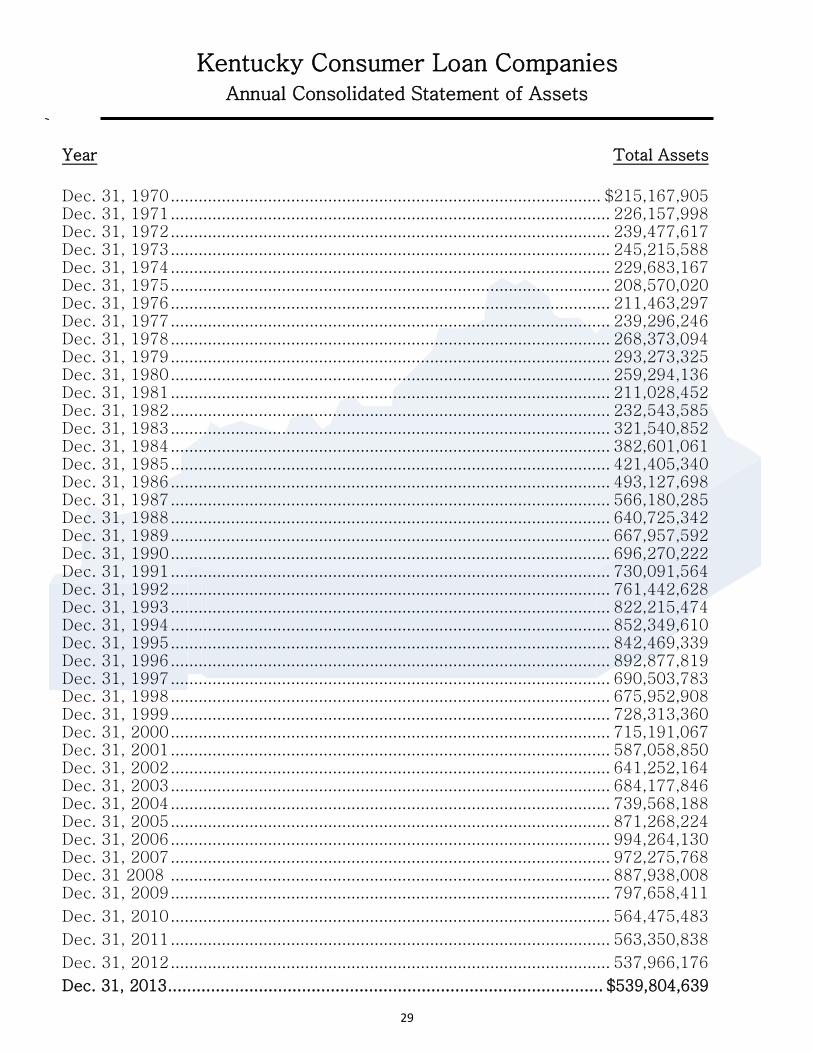
Kentucky Consumer Loan Companies Annual Consolidated Statement of Assets
Year Total Assets
Dec. 31, 1970 ............................................................................................. $215,167,905 Dec. 31, 1971 ............................................................................................... 226,157,998 Dec. 31, 1972 ............................................................................................... 239,477,617 Dec. 31, 1973 ............................................................................................... 245,215,588 Dec. 31, 1974 ............................................................................................... 229,683,167 Dec. 31, 1975 ............................................................................................... 208,570,020 Dec. 31, 1976 ............................................................................................... 211,463,297 Dec. 31, 1977 ............................................................................................... 239,296,246 Dec. 31, 1978 ............................................................................................... 268,373,094 Dec. 31, 1979 ............................................................................................... 293,273,325 Dec. 31, 1980 ............................................................................................... 259,294,136 Dec. 31, 1981 ............................................................................................... 211,028,452 Dec. 31, 1982 ............................................................................................... 232,543,585 Dec. 31, 1983 ............................................................................................... 321,540,852 Dec. 31, 1984 ............................................................................................... 382,601,061 Dec. 31, 1985 ............................................................................................... 421,405,340 Dec. 31, 1986 ............................................................................................... 493,127,698 Dec. 31, 1987 ............................................................................................... 566,180,285 Dec. 31, 1988 ............................................................................................... 640,725,342 Dec. 31, 1989 ............................................................................................... 667,957,592 Dec. 31, 1990 ............................................................................................... 696,270,222 Dec. 31, 1991 ............................................................................................... 730,091,564 Dec. 31, 1992 ............................................................................................... 761,442,628 Dec. 31, 1993 ............................................................................................... 822,215,474 Dec. 31, 1994 ............................................................................................... 852,349,610 Dec. 31, 1995 ............................................................................................... 842,469,339 Dec. 31, 1996 ............................................................................................... 892,877,819 Dec. 31, 1997 ............................................................................................... 690,503,783 Dec. 31, 1998 ............................................................................................... 675,952,908 Dec. 31, 1999 ............................................................................................... 728,313,360 Dec. 31, 2000 ............................................................................................... 715,191,067 Dec. 31, 2001 ............................................................................................... 587,058,850 Dec. 31, 2002 ............................................................................................... 641,252,164 Dec. 31, 2003 ............................................................................................... 684,177,846 Dec. 31, 2004 ............................................................................................... 739,568,188 Dec. 31, 2005 ............................................................................................... 871,268,224 Dec. 31, 2006 ............................................................................................... 994,264,130 Dec. 31, 2007 ............................................................................................... 972,275,768 Dec. 31 2008 ............................................................................................... 887,938,008 Dec. 31, 2009 ............................................................................................... 797,658,411
Dec. 31, 2010 ............................................................................................... 564,475,483
Dec. 31, 2011 ............................................................................................... 563,350,838
Dec. 31, 2012 ............................................................................................... 537,966,176
Dec. 31, 2013 ........................................................................................... $539,804,639

30
Kentucky Consumer Loan Companies Consolidated Report of Condition
Dec. 31, 2013 % Change Dec. 31, 2012
Kentucky Consumer Loan Companies 347 0.58% 345
Assets
Cash and Due from Depositor Institutions 5,652,077 -42.96% 9,908,406
Total Loans Receivable (Net of Unearned Interest and Reserves) 510,747,633 3.13% 495,254,963
Premises and Fixed Assets (Net of Depreciation) 6,351,867 -15.59% 7,524,671
Deferred Charges and Prepaid Expenses 1,324,178 -15.54% 1,567,864
*Other Assets Used in Consumer Loan Business 15,728,884 -33.66% 23,710,272 Total Assets Used in Consumer Loan Business 539,804,639 0.34% 537,966,176
Liabilities and Capital or Net Worth
Total Liabilities 367,979,443 7.98% 340,771,525
Total Capital 171,825.196 -12.87% 197,194,651
Total Net Worth 539,804,639 0.34% 537,996,176
Residential Real Estate Loans > $15,000 7,208,443 -97.84% 333,335,568
31
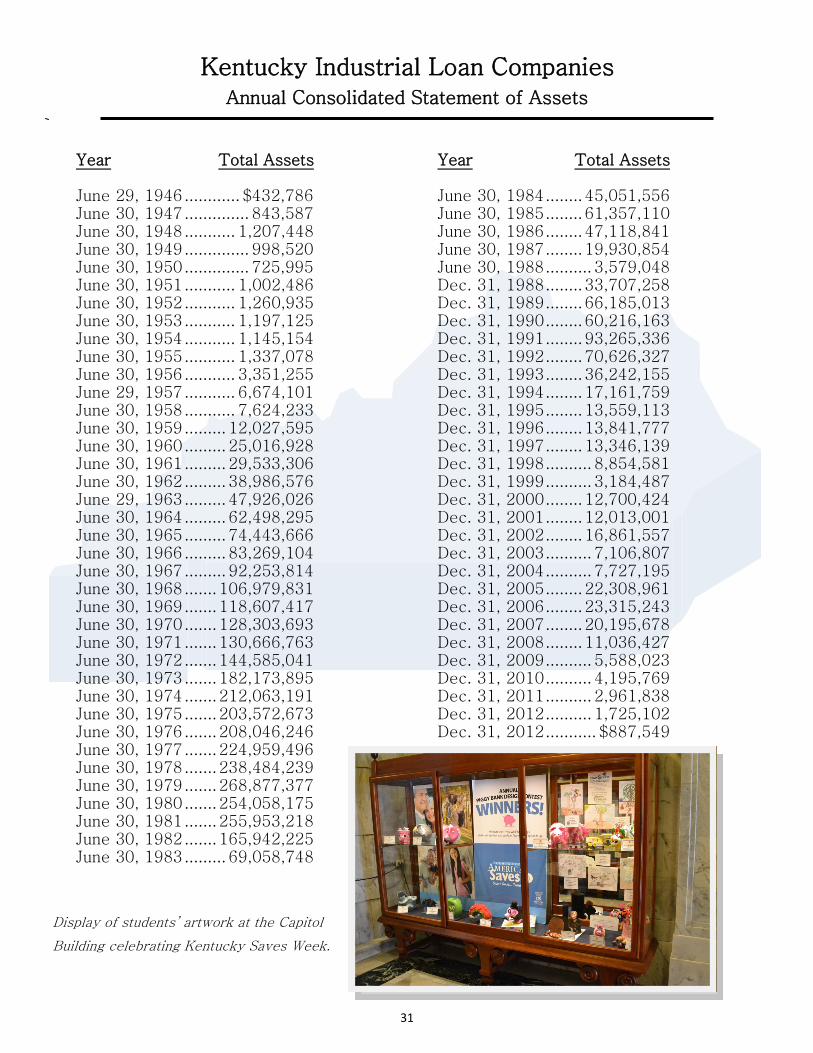
Kentucky Industrial Loan Companies Annual Consolidated Statement of Assets
Year Total Assets June 29, 1946 ............ $432,786 June 30, 1947 .............. 843,587 June 30, 1948 ........... 1,207,448 June 30, 1949 .............. 998,520 June 30, 1950 .............. 725,995 June 30, 1951 ........... 1,002,486 June 30, 1952 ........... 1,260,935 June 30, 1953 ........... 1,197,125 June 30, 1954 ........... 1,145,154 June 30, 1955 ........... 1,337,078 June 30, 1956 ........... 3,351,255 June 29, 1957 ........... 6,674,101 June 30, 1958 ........... 7,624,233 June 30, 1959 ......... 12,027,595 June 30, 1960 ......... 25,016,928 June 30, 1961 ......... 29,533,306 June 30, 1962 ......... 38,986,576 June 29, 1963 ......... 47,926,026 June 30, 1964 ......... 62,498,295 June 30, 1965 ......... 74,443,666 June 30, 1966 ......... 83,269,104 June 30, 1967 ......... 92,253,814 June 30, 1968 ....... 106,979,831 June 30, 1969 ....... 118,607,417 June 30, 1970 ....... 128,303,693 June 30, 1971 ....... 130,666,763 June 30, 1972 ....... 144,585,041 June 30, 1973 ....... 182,173,895 June 30, 1974 ....... 212,063,191 June 30, 1975 ....... 203,572,673 June 30, 1976 ....... 208,046,246 June 30, 1977 ....... 224,959,496 June 30, 1978 ....... 238,484,239 June 30, 1979 ....... 268,877,377 June 30, 1980 ....... 254,058,175 June 30, 1981 ....... 255,953,218 June 30, 1982 ....... 165,942,225 June 30, 1983 ......... 69,058,748
Year Total Assets June 30, 1984 ........ 45,051,556 June 30, 1985 ........ 61,357,110 June 30, 1986 ........ 47,118,841 June 30, 1987 ........ 19,930,854 June 30, 1988 .......... 3,579,048 Dec. 31, 1988 ........ 33,707,258 Dec. 31, 1989 ........ 66,185,013 Dec. 31, 1990 ........ 60,216,163 Dec. 31, 1991 ........ 93,265,336 Dec. 31, 1992 ........ 70,626,327 Dec. 31, 1993 ........ 36,242,155 Dec. 31, 1994 ........ 17,161,759 Dec. 31, 1995 ........ 13,559,113 Dec. 31, 1996 ........ 13,841,777 Dec. 31, 1997 ........ 13,346,139 Dec. 31, 1998 .......... 8,854,581 Dec. 31, 1999 .......... 3,184,487 Dec. 31, 2000 ........ 12,700,424 Dec. 31, 2001 ........ 12,013,001 Dec. 31, 2002 ........ 16,861,557 Dec. 31, 2003 .......... 7,106,807 Dec. 31, 2004 .......... 7,727,195 Dec. 31, 2005 ........ 22,308,961 Dec. 31, 2006 ........ 23,315,243 Dec. 31, 2007 ........ 20,195,678 Dec. 31, 2008 ........ 11,036,427 Dec. 31, 2009 .......... 5,588,023 Dec. 31, 2010 .......... 4,195,769 Dec. 31, 2011 .......... 2,961,838 Dec. 31, 2012 .......... 1,725,102 Dec. 31, 2012 ........... $887,549
Display of students’ artwork at the Capitol
Building celebrating Kentucky Saves Week.

32
Kentucky Industrial Loan Companies Consolidated Report of Condition
Dec. 31, 2013 Change Dec. 31, 2012
Total Industrial Loan Companies 30 30
Assets
Cash on Hand - - - -
Industrial Loans - - - -
Other Loans 897,678 -47.62% 1,713,841
Total Loans 897,678 -47.62% 1,713,841
Unearned Interest 395 -31.29% 575
Reserve for Loan Loss 9,734 -11.25% 10,967 Loans, Net of Unearned Interest and Reserves 887,549 -47.86% 1,702,299
Premises and Fixed Assets 0 0
Other Assets 0 -100% 22,803
Total Assets 887,549 -48.55% 1,725,102
Liabilities
Certificates of Investment - - - -
Other Liabilities 780,607 -50.15% 1,565,842
Total Liabilities 780,607 -50.15% 1,565,842
Equity Capital
Capital Stock - - - -
Surplus & Undivided Profits - - - -
Current Earnings 106,941 481.24% 159,260
Total Equity Capital 106,941 481.24% 159.260
Total Liabilities and Equity Capital 887,549 -48.55% 1,725,102

33
Division of Securities
The mission of the Division of Securities is to 1) protect investors through the active im-plementation and application of Kentucky’s securities laws in order to prevent investment fraud and related illegal conduct, and by taking remedial action, when possible, to mitigate the harm done to the investor, 2) educate the investing public about investment matters and making informed investment decisions, and 3) provide investor protection without un-due burden on the capital formation process. To fulfill its investor protection mission, the Division of Securities performs a variety of functions intended to help ensure that securities transactions are effected in compliance with the Kentucky Securities Act, and that investors have the necessary material infor-mation to make informed investment decisions and select securities professionals with whom to entrust their money. The Securities Division staff also performs educational out-reach to high school students and community groups regarding savings and investing, par-ticipates in financial literacy forums across the Commonwealth, and distributes informa-tional brochures on financial matters through public libraries, county cooperative exten-sion agencies and other public venues. Smarter regulation is the common goal of state securities regulators. New technology and new approaches to ways of investing are rapidly moving forward and continue to pro-gress; therefore, regulation must positively seek solutions that are innovative and equita-ble to continue to deliver effective investor protection and efficient industry regulation. The Department of Financial Institutions, Division of Securities strives to ensure that poli-cies intended to promote capital formation balance the need to maintain investor protec-tions and enhance investor education. During 2013 the Securities Division conducted 132 examinations and 71 investigations, which resulted in 11 administrative orders and two civil orders. Crowdfunding’s presence on the Internet has increased significantly during 2013 in antici-pation of rules to allow small businesses to raise capital online. Proposed rules imple-menting the exemption created by Title III of the Jumpstart Our Business Startups (JOBS) Act passed by Congress on March 27, 2012 were filed by the Securities and Exchange Commission (SEC) on Oct. 23, 2013. Until the Security and Exchange Commission (SEC) adopts rules permitting crowdfunding, investments cannot legally be offered through this means. On March 14, 2013, after a multi-state investigation, Kentucky joined 19 jurisdictions in issuing a Cease and Desist Order against Inter Reef Ltd d/b/a Profitable Sunrise and its owners Roman Novak and Radoslav Novak. Profitable Sunrise, headquartered in the Unit-ed Kingdom, solicited investors over the internet by claiming investor’s money was being used to fund short-term loans to businesses throughout the U.S and that all the funds de-posited with the entity were insured against loss by a leading investment bank. The Novak brothers made misrepresentations and omissions of material facts and promed investors risk-free-returns and used the internet to solicite investors. Roman Novak nor Radoslav Novak or the investment products being sold were registered in Kentucky.
27th Annual Securities Report

34
Division of Securities
Licensing and Registration Branch Report
Employees in the Licensing and Registration Branch process applications for the registra-tion of broker-dealers, investment advisers and their licensed employees. The licensing staff can deny the applications of firms and individuals who do not meet the requirements of the Kentucky securities laws. The licensing staff also responds to inquiries from the public concerning investment adviser or broker licensing status and disciplinary history.
2013 Broker-Dealers
Headquartered in Kentucky
Name City
Alexander Investment Services, Co. Louisville
Churchill Financial LLC Louisville
Cypress Alts Louisville
Dupree & Co. Inc. Lexington
First Kentucky Securities Inc. Frankfort
Investment Bank Services Inc. Louisville
J.J.B Hilliard, W.L. Lyons LLC Louisville
Jefferson National Securities Corp. Louisville
Lexington Investment Company Inc. Lexington
Nancy Barron & Associates Inc. Lexington
Private Client Services LLC Louisville
Roosevelt Equity Corp. Louisville
Supreme Alliance LLC Lancaster
35
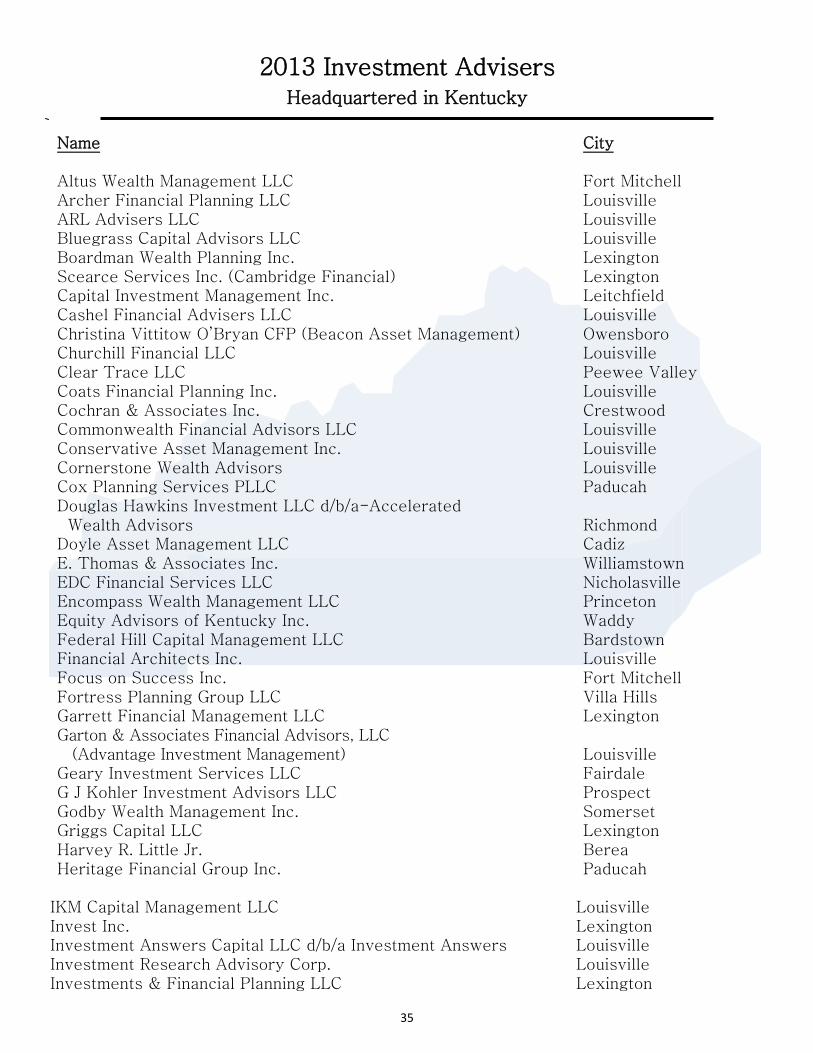
2013 Investment Advisers Headquartered in Kentucky
Name City Altus Wealth Management LLC Fort Mitchell Archer Financial Planning LLC Louisville ARL Advisers LLC Louisville Bluegrass Capital Advisors LLC Louisville Boardman Wealth Planning Inc. Lexington Scearce Services Inc. (Cambridge Financial) Lexington Capital Investment Management Inc. Leitchfield Cashel Financial Advisers LLC Louisville Christina Vittitow O’Bryan CFP (Beacon Asset Management) Owensboro Churchill Financial LLC Louisville Clear Trace LLC Peewee Valley Coats Financial Planning Inc. Louisville Cochran & Associates Inc. Crestwood Commonwealth Financial Advisors LLC Louisville Conservative Asset Management Inc. Louisville Cornerstone Wealth Advisors Louisville Cox Planning Services PLLC Paducah Douglas Hawkins Investment LLC d/b/a-Accelerated Wealth Advisors Richmond Doyle Asset Management LLC Cadiz E. Thomas & Associates Inc. Williamstown EDC Financial Services LLC Nicholasville Encompass Wealth Management LLC Princeton Equity Advisors of Kentucky Inc. Waddy Federal Hill Capital Management LLC Bardstown Financial Architects Inc. Louisville Focus on Success Inc. Fort Mitchell Fortress Planning Group LLC Villa Hills Garrett Financial Management LLC Lexington Garton & Associates Financial Advisors, LLC (Advantage Investment Management) Louisville Geary Investment Services LLC Fairdale G J Kohler Investment Advisors LLC Prospect Godby Wealth Management Inc. Somerset Griggs Capital LLC Lexington Harvey R. Little Jr. Berea Heritage Financial Group Inc. Paducah
IKM Capital Management LLC Louisville Invest Inc. Lexington Investment Answers Capital LLC d/b/a Investment Answers Louisville Investment Research Advisory Corp. Louisville Investments & Financial Planning LLC Lexington

36
2013 Investment Advisers Headquartered in Kentucky
Name City
iTrust Asset Management LLC Lexington Janlyn Capital LLC Prospect Jesse Investment Advisor Inc. Louisville J.Hagan Warren Capital Partners Limited Louisville
Journey Financial Management LLC Bowling Green JS Financial LLC Louisville KC Capital Management LLC Danville KD Fiduciary Asset Management Inc. Prospect Keepsake Management Inc. Lexington Lach Financial LLC Louisville Lancaster Advisors LLC Louisville Lang Advisors LLC Covington Lanier Asset Management LLC Louisville Lawrence Botzman, CFP Somerset Lexington Investment Co. Inc. Lexington Life Advisors Financial Planning & Wealth Management LLC Munfordville Lifetime Wealth Design LLC f/k/a Probity Wealth Solutions LLC Louisville Lighthouse Capital Management LLC Lewisburg Linker Capital Management Inc. Louisville Mackey Advisors (The Wealth Advisory Team LLC) Fort Wright Mackhouse LLC Louisville Mann Capital Management LLC Fort Mitchell Marjac Capital Management LLC Lexington MC Financial Services Inc. Louisville MCW Financial Inc. (Research & Portfolio Management) Crescent Springs Merit National Fund Advisors LLC Somerset Milestone Financial Planning LLC Mayfield MoneyTree Capital Management LLC Morganfield Moneywise, Inc. Lexington Multi-Fund Management Louisville Navin Advisors LLC Lexington New Millennium Asset Management Inc. Richmond Nina M. Wyatt & Associates LLC Owensboro Olmsted Ventures LLC d/b/a/ Olmsted Capital Louisville Outland Capital LLC Lexington Page Financial Services LLC Louisville Palmer Capital Management Inc. Verona Pierce Financial Planning Inc. Lexington Pillar Financial Advisors LLC Louisville PMK Capital Management LLC Prospect Principled Wealth Advisors LLC Covington Proactive Advisors LLC Lexington Quantum Financial Consultants LLC Louisville Regional Investment Advisors Inc. Louisville

37
2013 Investment Advisers Headquartered in Kentucky
Name City
Remington Wealth Management Louisville Resource Design Inc Edgewood Retirement Tax Advisory Group Inc Lexington Revolutionary Wealth Management Corp. Louisville RiverCities Asset Management Corp. Owensboro Riverstone Asset Management LLC Louisville Robert M. Walker & Associates Inc. Taylorsville Ron Beaton’s Money Matters Paducah Sachs Investment Group LLC Louisville Sagehare Investment Management LLC Lexington Leif Clarke Wealth Management Inc. f/k/a Sentinel Investment Advisory Services Inc. Ashland Spectrum Financial Alliance Nicholasville Springhouse Financial LLC Louisville Sterling Financial Group Ltd. Louisville Strategic Wealth Designers LLC Louisville Supreme Alliance LLC Lancaster Swendiman Wealth Strategies Inc. Park Hills Tactical Wealth Management Covington Tatro Capital LLC Lexington TMFS-Lexington LLC (The Mutual Fund Store) Lexington The Wright Legacy Group LLC Elizabethtown Thomas M. Zalla CPA/PhD Fort Mitchell Thompson Investment Advisors Inc. Louisville Thurn Financial Planning LLC Lexington Townsend Financial Planning Mount Sterling Via Wealth Management Inc. Campbellsville Walker Financial Services Inc. Bowling Green Waycross Partners LLC Louisville WealthMD Corporation Louisville Wilson Financial Services Inc. Dry Ridge Winebrenner Capital Management LLC Louisville Witter & Westlake Investments Inc. Louisville Your Best Move Inc. Bardstown
38
Division of Securities
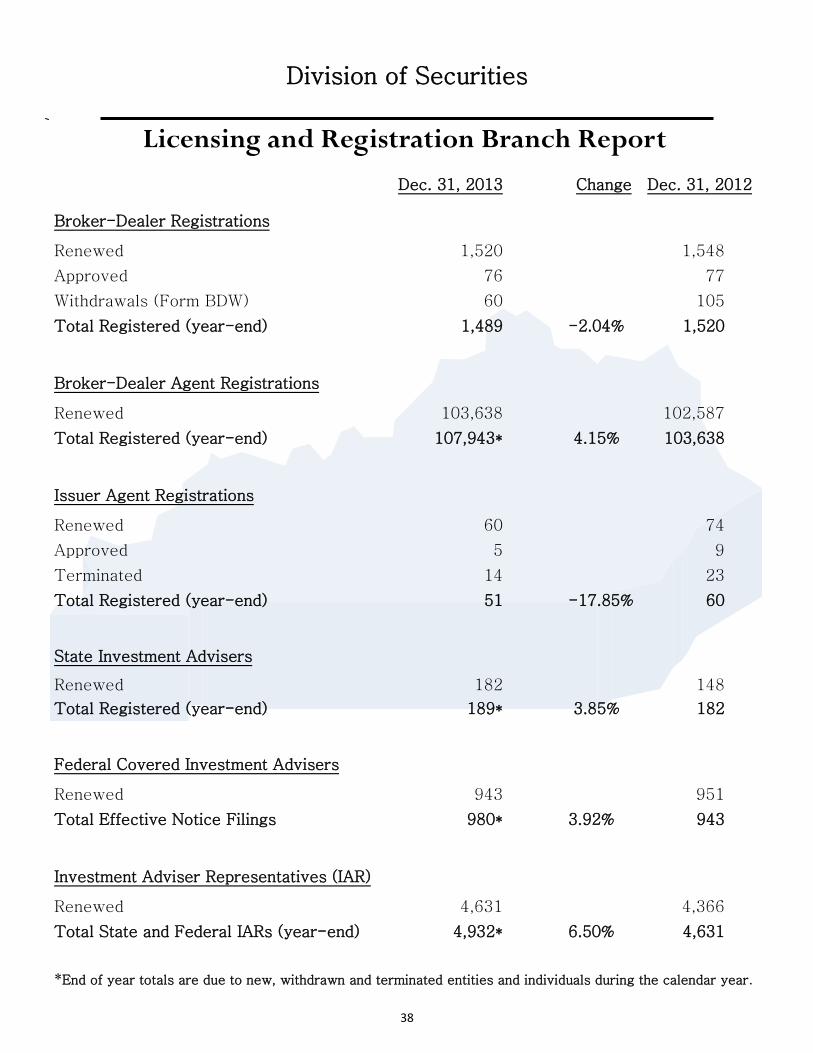
Licensing and Registration Branch Report
Dec. 31, 2013 Change Dec. 31, 2012
Broker-Dealer Registrations
Renewed 1,520 1,548
Approved 76 77
Withdrawals (Form BDW) 60 105
Total Registered (year-end) 1,489 -2.04% 1,520
Broker-Dealer Agent Registrations
Renewed 103,638 102,587
Total Registered (year-end) 107,943* 4.15% 103,638
Issuer Agent Registrations
Renewed 60 74
Approved 5 9
Terminated 14 23
Total Registered (year-end) 51 -17.85% 60
State Investment Advisers
Renewed 182 148
Total Registered (year-end) 189* 3.85% 182
Federal Covered Investment Advisers
Renewed 943 951
Total Effective Notice Filings 980* 3.92% 943
Investment Adviser Representatives (IAR)
Renewed 4,631 4,366
Total State and Federal IARs (year-end) 4,932* 6.50% 4,631
*End of year totals are due to new, withdrawn and terminated entities and individuals during the calendar year.
39
Division of Securities
Licensing and Registration Branch Report
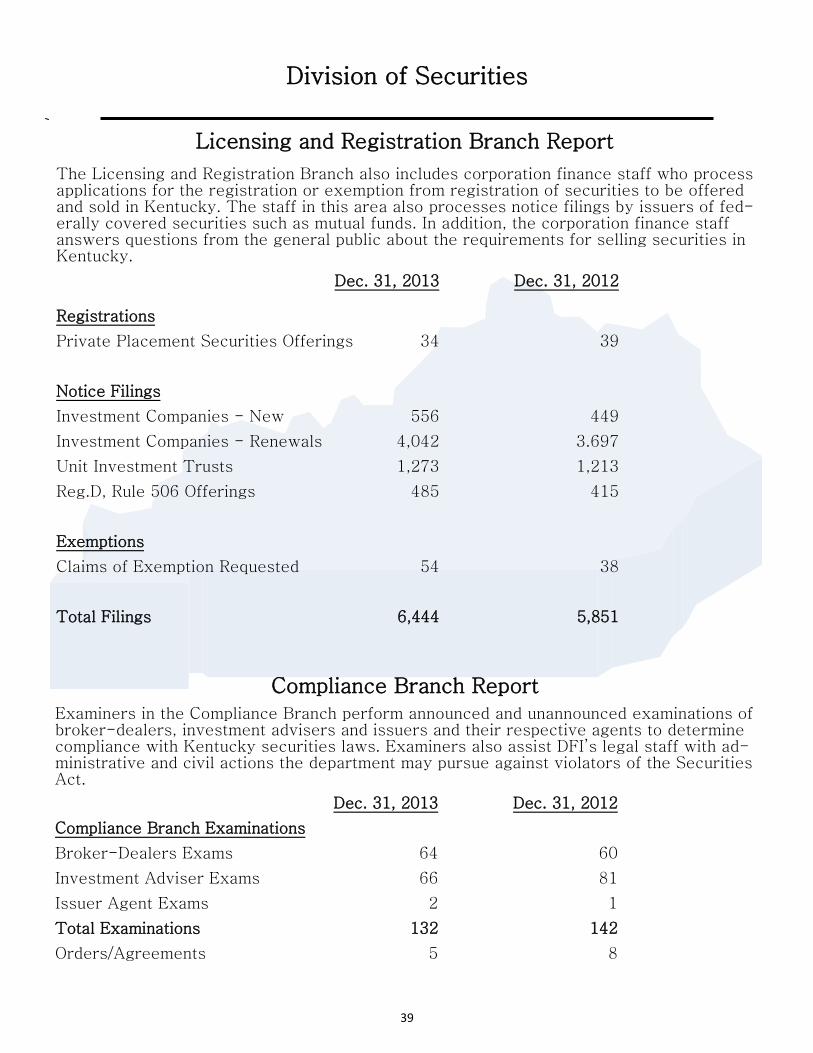
The Licensing and Registration Branch also includes corporation finance staff who process applications for the registration or exemption from registration of securities to be offered and sold in Kentucky. The staff in this area also processes notice filings by issuers of fed-erally covered securities such as mutual funds. In addition, the corporation finance staff answers questions from the general public about the requirements for selling securities in Kentucky.
Dec. 31, 2013 Dec. 31, 2012
Registrations
Private Placement Securities Offerings 34 39
Notice Filings
Investment Companies - New 556 449
Investment Companies - Renewals 4,042 3.697
Unit Investment Trusts 1,273 1,213
Reg.D, Rule 506 Offerings 485 415
Exemptions
Claims of Exemption Requested 54 38
Total Filings 6,444 5,851
Compliance Branch Report Examiners in the Compliance Branch perform announced and unannounced examinations of broker-dealers, investment advisers and issuers and their respective agents to determine compliance with Kentucky securities laws. Examiners also assist DFI’s legal staff with ad-ministrative and civil actions the department may pursue against violators of the Securities Act.
Dec. 31, 2013 Dec. 31, 2012
Compliance Branch Examinations
Broker-Dealers Exams 64 60
Investment Adviser Exams 66 81
Issuer Agent Exams 2 1
Total Examinations 132 142
Orders/Agreements 5 8
40
Division of Securities
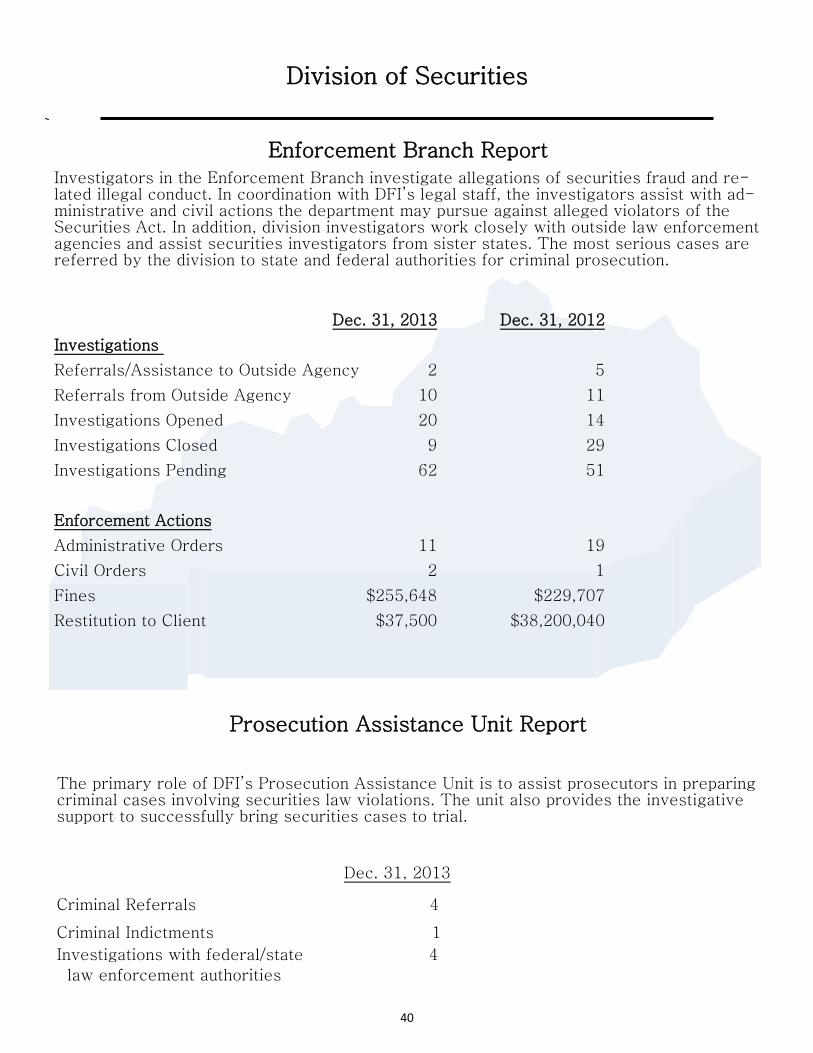
Enforcement Branch Report Investigators in the Enforcement Branch investigate allegations of securities fraud and re-lated illegal conduct. In coordination with DFI’s legal staff, the investigators assist with ad-ministrative and civil actions the department may pursue against alleged violators of the Securities Act. In addition, division investigators work closely with outside law enforcement agencies and assist securities investigators from sister states. The most serious cases are referred by the division to state and federal authorities for criminal prosecution.
Dec. 31, 2013 Dec. 31, 2012
Investigations
Referrals/Assistance to Outside Agency 2 5
Referrals from Outside Agency 10 11
Investigations Opened 20 14
Investigations Closed 9 29
Investigations Pending 62 51
Enforcement Actions
Administrative Orders 11 19
Civil Orders 2 1
Fines $255,648 $229,707
Restitution to Client $37,500 $38,200,040
Prosecution Assistance Unit Report
The primary role of DFI’s Prosecution Assistance Unit is to assist prosecutors in preparing criminal cases involving securities law violations. The unit also provides the investigative support to successfully bring securities cases to trial.
Dec. 31, 2013
Criminal Referrals 4
Criminal Indictments 1
Investigations with federal/state 4
law enforcement authorities

41