about janaagraha centre for citizenship and … the wood for the trees #ùc Ì @ yc?s wc tcc...
TRANSCRIPT

About Janaagraha Centre for Citizenship and Democracy
About Jana Urban Space Foundation (Jana USP)
About IDFC FoundationSupported by:
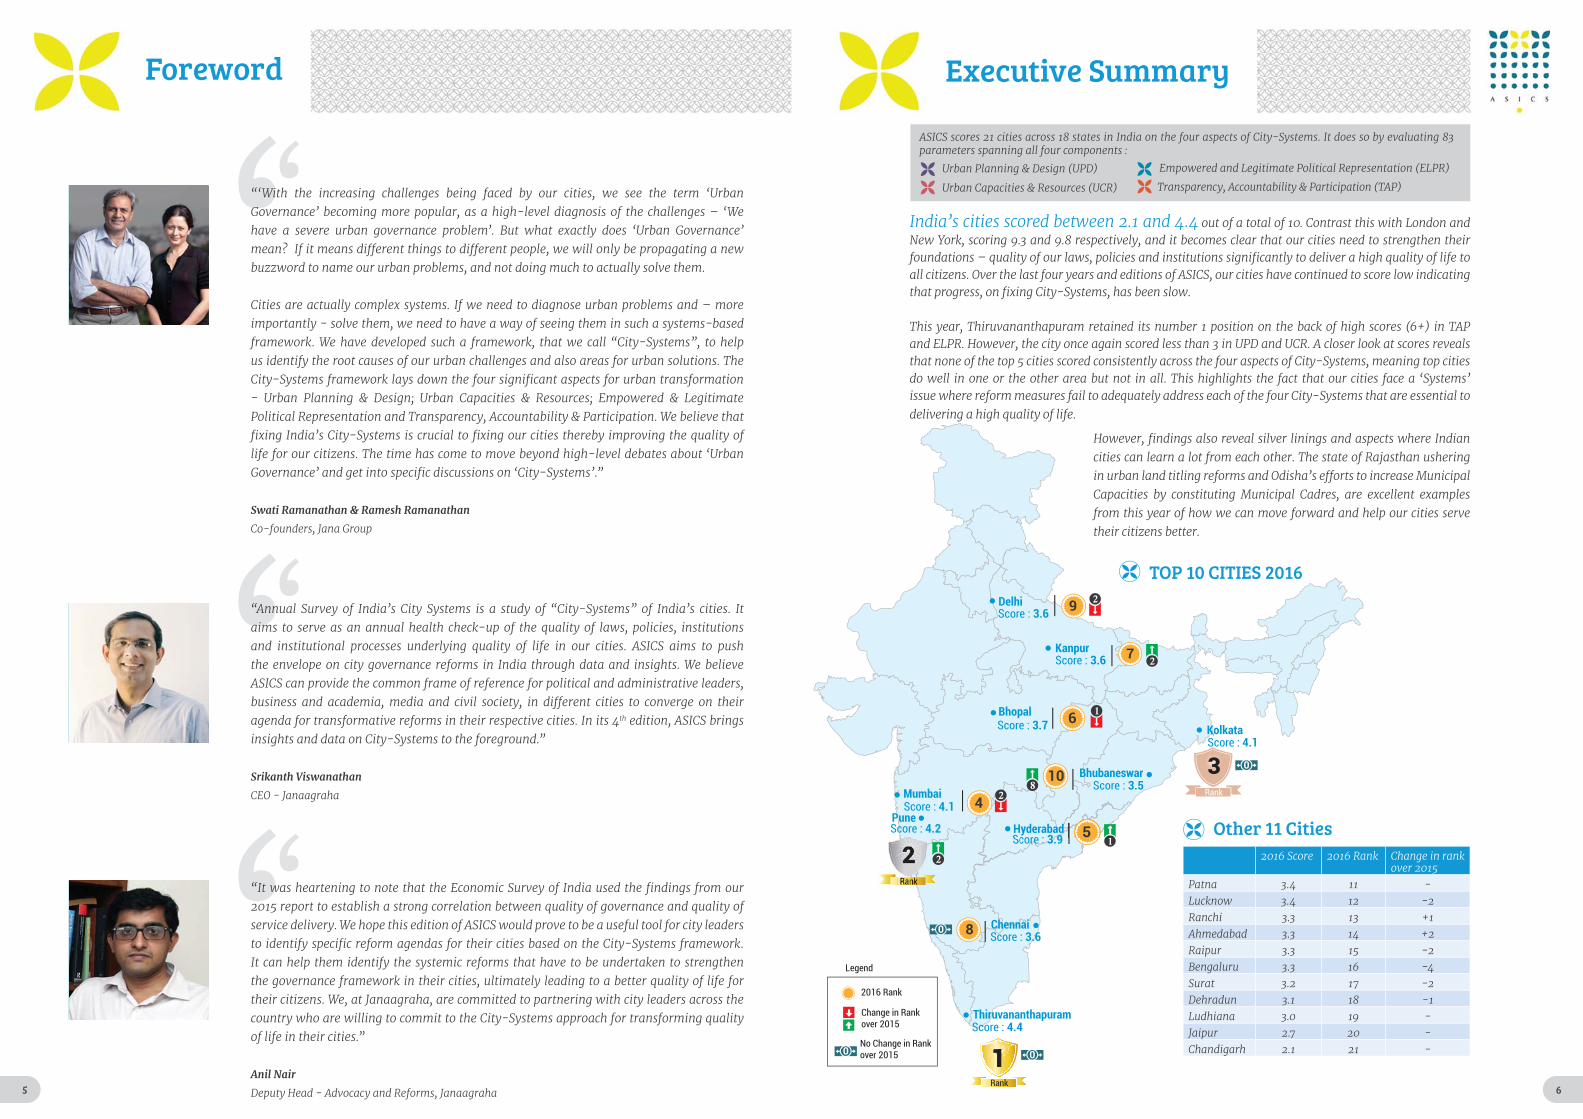
Annual Survey of India’s City-Systems 2016: Shaping India’s Urban Agenda,
2016
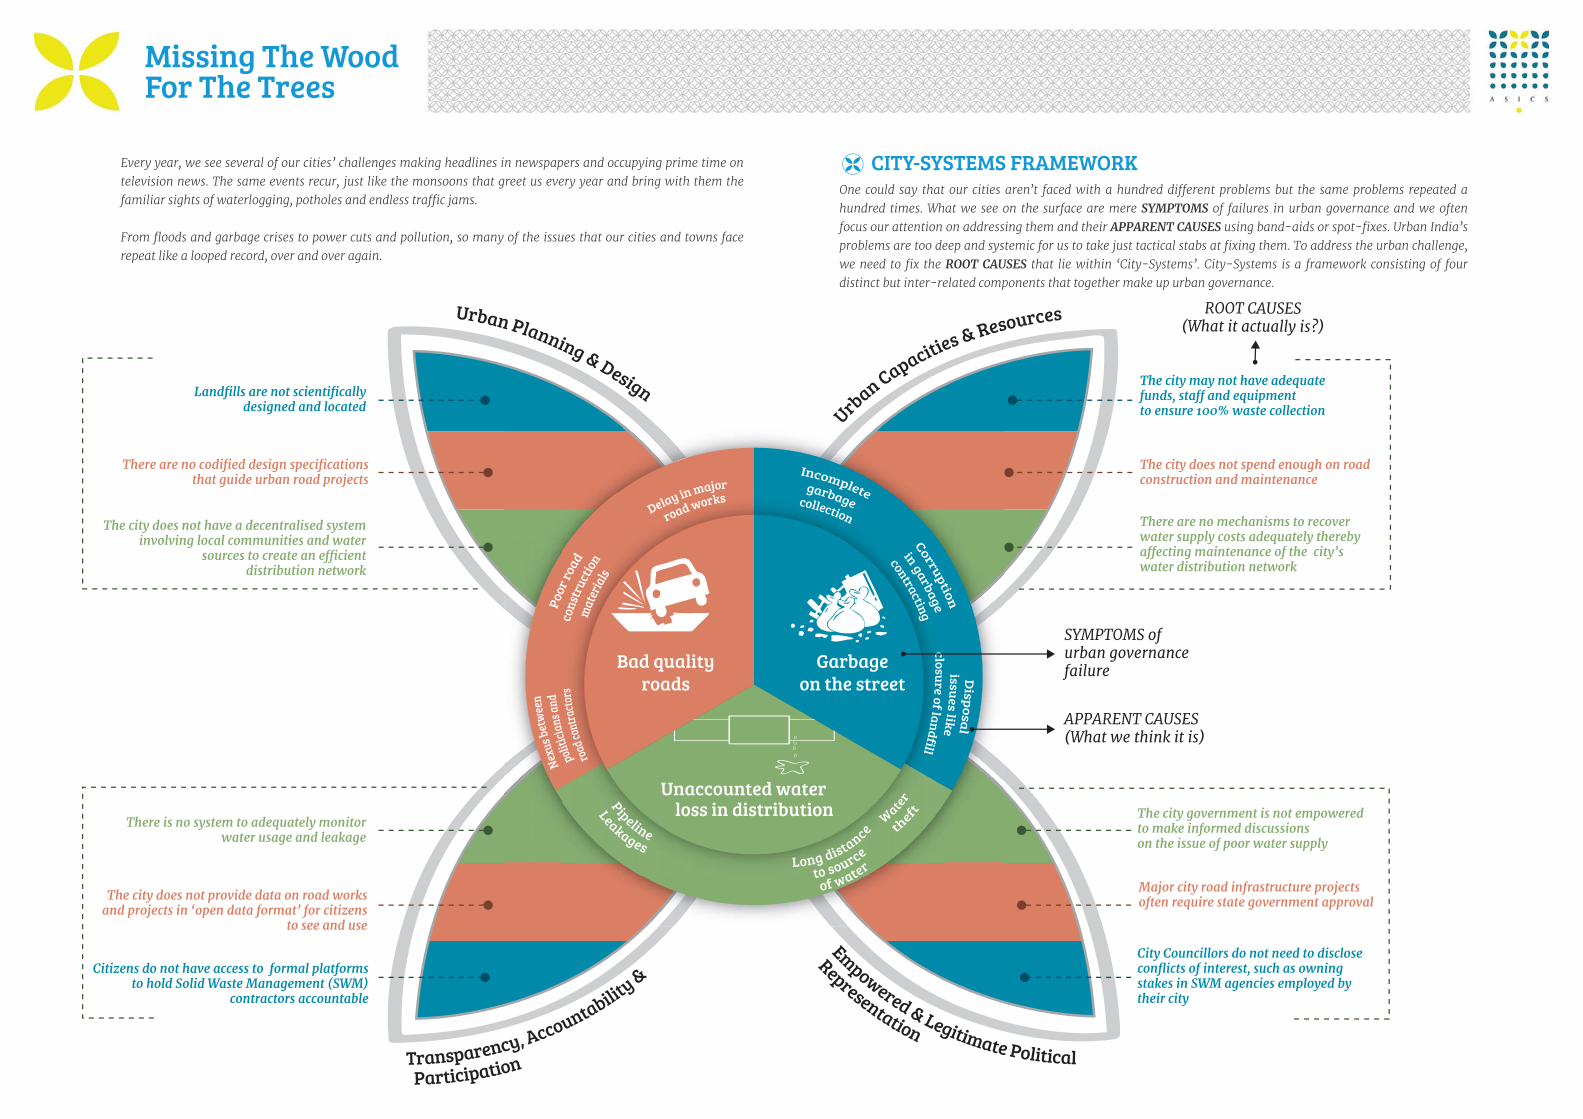
Missing The Wood For The Trees
CITY-SYSTEMS FRAMEWORK
SYMPTOMSAPPARENT CAUSES
ROOT CAUSES
Garbageon the street
Bad qualityroads
Landfills are not scientificallydesigned and located
There are no codified design specificationsthat guide urban road projects
The city does not have a decentralised systeminvolving local communities and water
sources to create an efficientdistribution network
The city may not have adequate funds, staff and equipment to ensure 100% waste collection
The city does not spend enough on roadconstruction and maintenance
City Councillors do not need to disclose conflicts of interest, such as owning stakes in SWM agencies employed by their city
The city government is not empowered to make informed discussions on the issue of poor water supply
There are no mechanisms to recover water supply costs adequately thereby affecting maintenance of the city’s water distribution network
Major city road infrastructure projects often require state government approval
Citizens do not have access to formal platformsto hold Solid Waste Management (SWM)
contractors accountable
There is no system to adequately monitorwater usage and leakage
SYMPTOMS ofurban governancefailure
APPARENT CAUSES(What we think it is)
ROOT CAUSES(What it actually is?)
Unaccounted waterloss in distribution
Urban Planning & Design
Transparency, Accountability &
Participation
Empowered & Legitimate Political
Representation
Urban Capacities & Resources
The city does not provide data on road works and projects in ‘open data format’ for citizens
to see and use
Pipeline
LeakagesLong distance
to source
of water
Delay in major
road works

Foreword
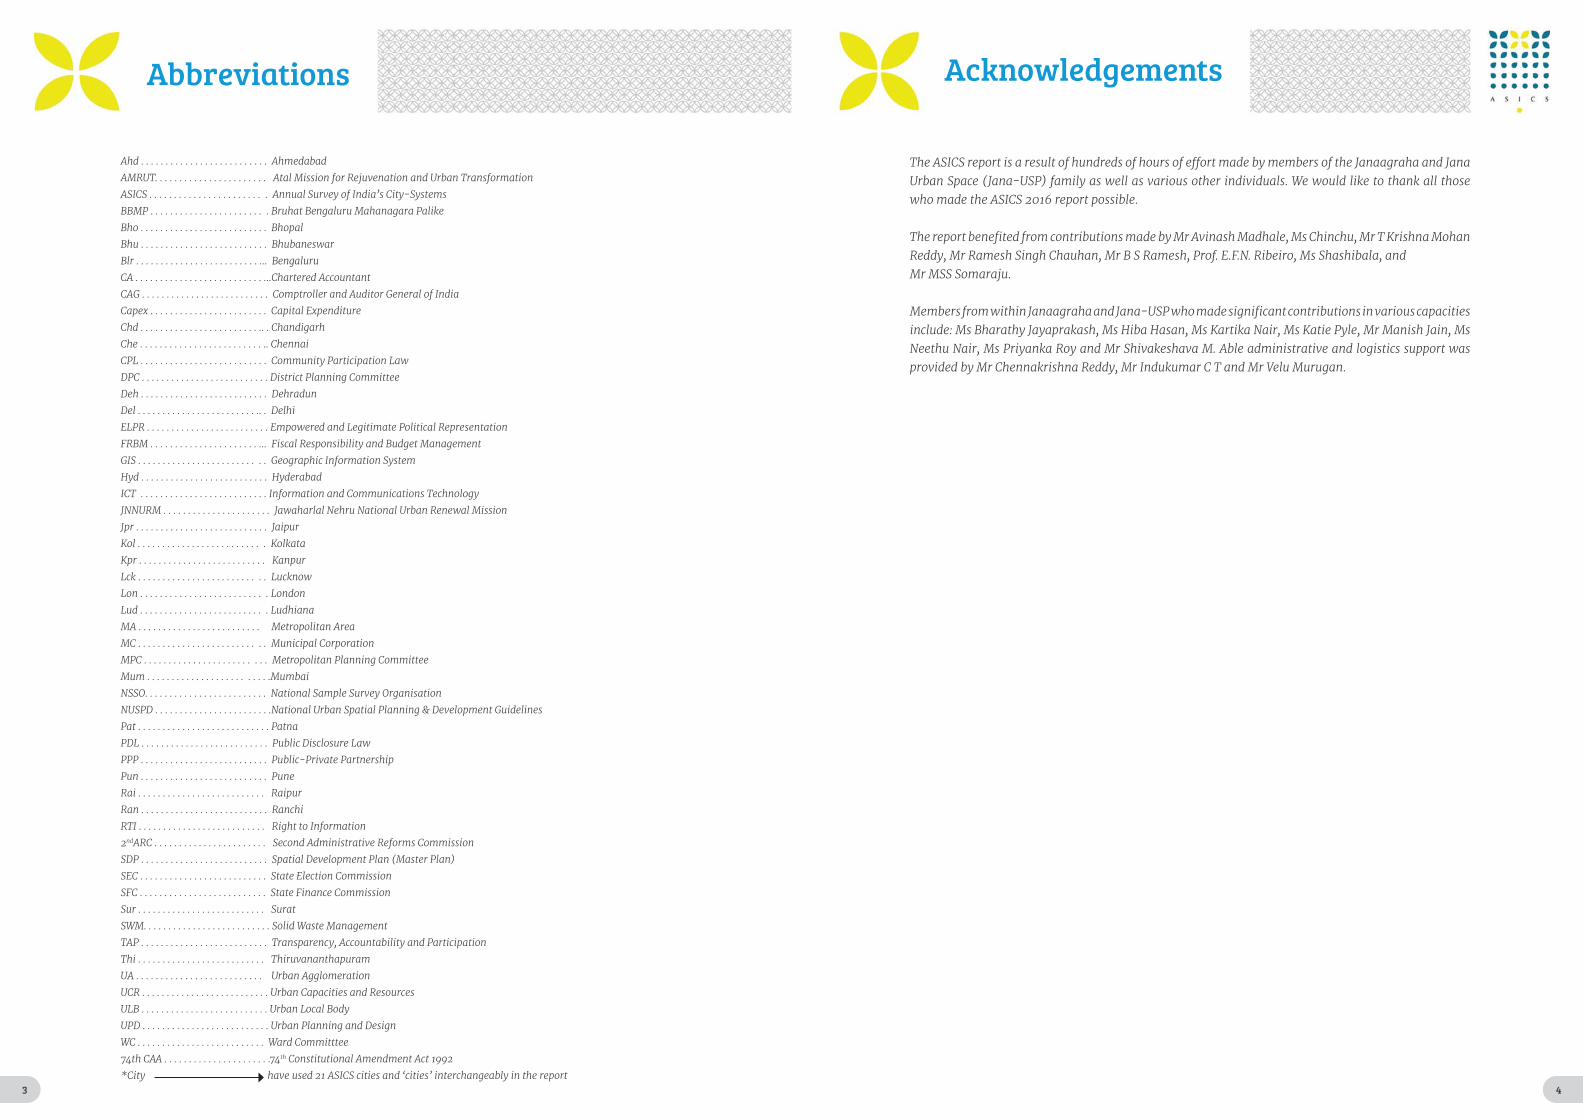
Abbreviations
Acknowledgements
3
Key Insights1
4
6
9
ExecutiveSummary
Sizing Up The Urban Challenge
Annual Survey Of India’s City-Systems
The Size Of India’s Urban Challenge : An Unknown
The Challenge Of Poor Service Delivery In Urban India10
9
5
11
Table Of Contents
Reforms To City-Systems: A Roadmap
Methodology
33
38
Data Sources41
Annexures43
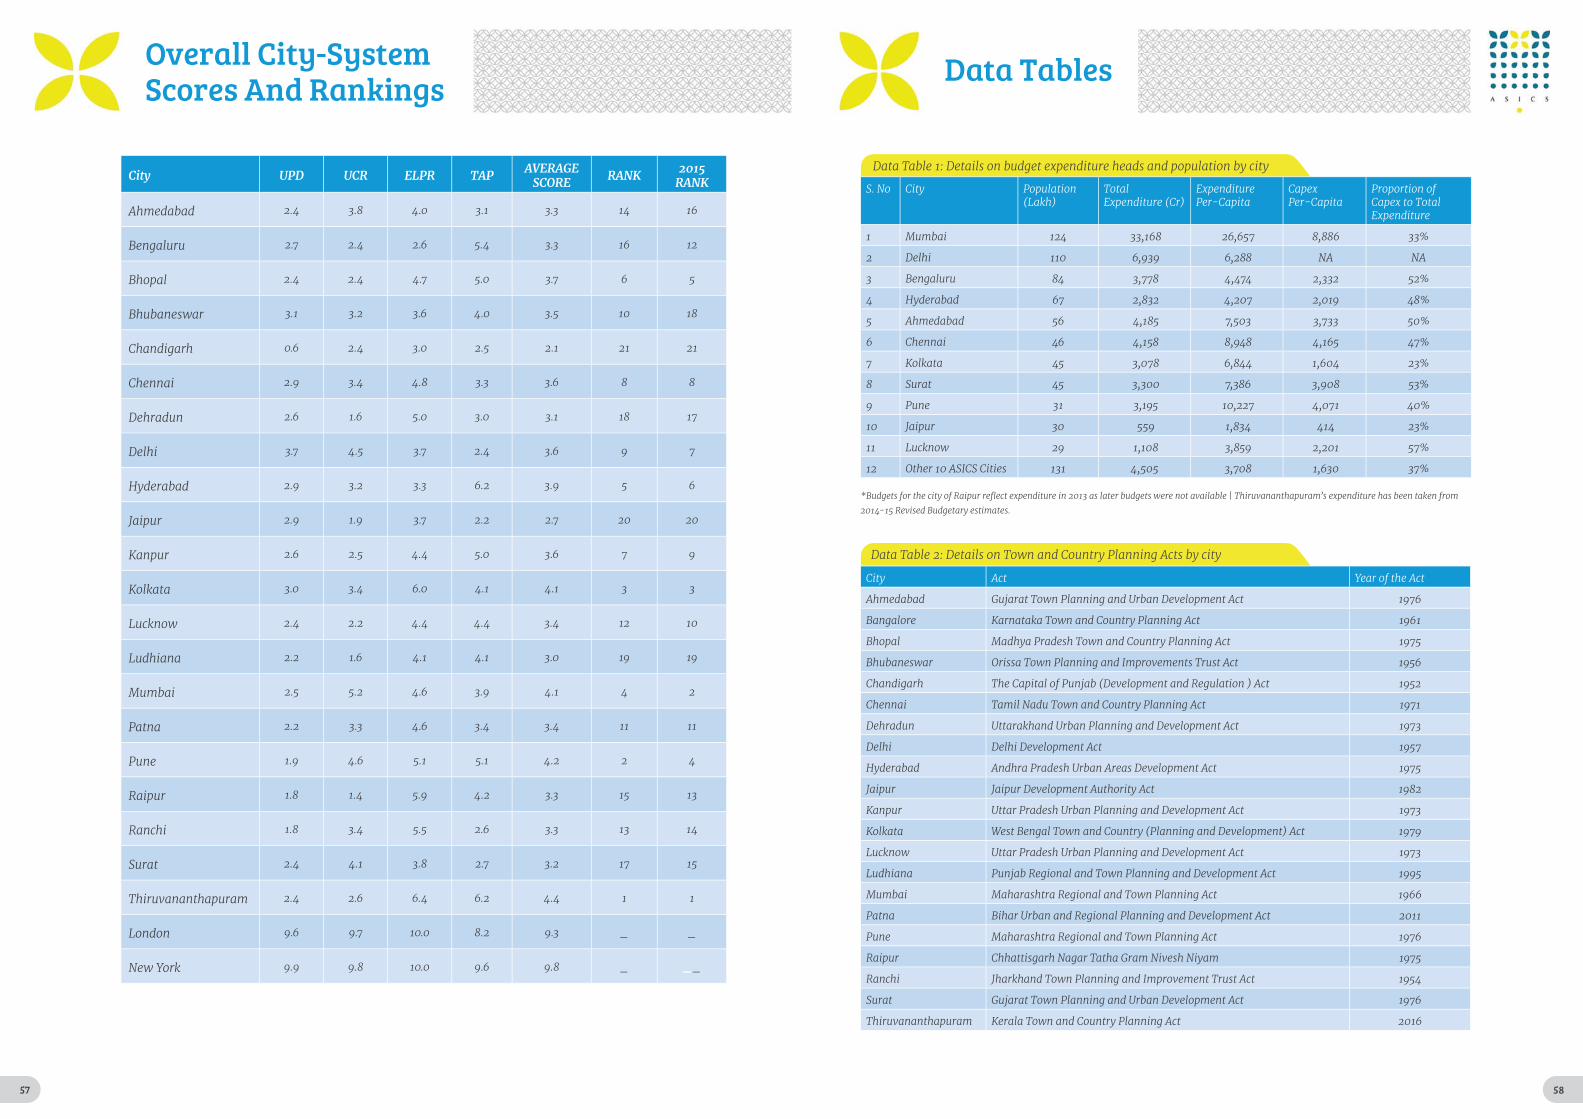
Overall City-System Scores And Rankings57
Data Tables58
13 Rankings & Scores
Urban Planning & Design (UPD)
Urban Capacities & Resources (UCR)
Empowered & Legitimate Political Representation (ELPR)
Transparency, Accountability & Participation (TAP)
17
23
29
13

1
0
2
4
6
8
10
Overall Score Urban Planning& Design
Urban Capacities& Resources
Empowered & LegitimatePolitical
Representation
Transparency,Accountability& Participation
Average Score
Maximum Score
Legend
Minimum Score
London
New York
2.1
3.5
4.4
9.39.8
0.6
2.5
3.7
9.69.9
1.42.2
4.0
6.2
2.6
4.4
6.4
10.010.0
8.2
9.6
3.0
5.2
9.7 9.8
ASI
CS
Scor
es 2
016
IndianCities
Key Insights
Urban Planning & Design is the weakest of the 4 City-Systems in India’s cities.
India’s cities face a severe systems problem as none of the cities fare well across all four City-Systems, key components that together are popularly referred to as urban governance.
and levels of devolution. This is the opposite in smaller cities.
OVERALL SCORE : 4.4 OVERALL SCORE : 4.1OVERALL SCORE : 4.2
UPD UCR
ELPRTAP
2.4 2.6
UPD UCR
ELPRTAP
UPD UCR
ELPRTAP
Thiruvananthapuram KolkataPune
6.46.2
3.0 3.4
4.1 6.0
1.9 4.6
5.1 5.1
TOP
3 R
AN
KIN
G C
ITIE
S
th
2
Rs. 33,168 Cr. Total Expenditure
MUMBAI
Population12.4 million
Expenditure Per-Capita
Rs. 26,657Expenditure Per-Capita
Expenditure Per-CapitaRs. 6,157 Rs. 3,708
Rs. 33,132 Cr. Total Expenditure
Population54.4 million Rs. 4,505 Cr.
Total Expenditure
Population13.1 million
OTHER 10 ASICS CITIESNEXT 10 MOST POPULOUSASICS CITIES
Smaller cities, which will be at the forefront of future urbanisation, invest
quality of life.
3
Abbreviations
2
th
_________________ 4
Acknowledgements
5
Foreword
Anil Nair
th
Srikanth Viswanathan
Swati Ramanathan & Ramesh Ramanathan
6
Executive Summary
Delhi
Bhopal
Mumbai
Pune
Chennai
Hyderabad
Bhubaneswar
Kolkata
Kanpur
Score : 3.6
Score : 3.6
Score : 4.1
Score : 3.5
Score : 3.7
Score : 3.9
Score : 3.6
Score : 4.4
Score : 4.1
Score : 4.2
Thiruvananthapuram
9
7
4
8
6
10
5
2
2
1
82
1
2
Rank
Change in Rankover 2015
No Change in Rankover 2015
2016 Rank
Legend
0
0
Rank
2
Rank
3
00
1112
+1+2
2021
TOP 10 CITIES 2016
Other 11 Cities

7
A1. DOES YOUR CITY HAVE A DECENTRALISED SYSTEM OF SPATIAL DEVELOPMENT PLANNING?
1 0
2 2
A2. CAN YOUR CITY IMPLEMENT SDPs SUCCESSFULLY? 1 0
2
2
A3. DOES YOUR CITY HAVE EFFECTIVE MECHANISMS TO DETER PLAN VIOLATIONS
A4. DOES YOUR CITY ENCOURAGE PARTICIPATORY PLANNING?
B1. DOES YOUR CITY INVEST ADEQUATE FUNDS IN PUBLIC INFRASTRUCTURE AND SERVICES?
1 1
2 1
1
WHAT LIES BEHIND THE RANKING
8
B3. DOES YOUR CITY MAKE OPTIMUM USE OF INFORMATION TECHNOLOGY (IT)?
1
2
B2. DOES YOUR CITY HAVE ADEQUATE NUMBER OF SKILLED HUMAN RESOURCES?
1 0
2 0
0
D1. DOES YOUR CITY PUT OUT ADEQUATE INFORMATION AND FACILITATE CITIZEN PARTICIPATION?
1 0
2 0
0
D2. HOW WELL DOES YOUR CITY ADDRESS CITIZEN COMPLAINTS? 1 0
2 0
C1. DO YOUR CITY LEADERS HAVE ADEQUATE POWER?th
1 0
2 0
0
C2. IS YOUR CITY TRULY DEMOCRATIC? 1 0
2 0
0
th th
9
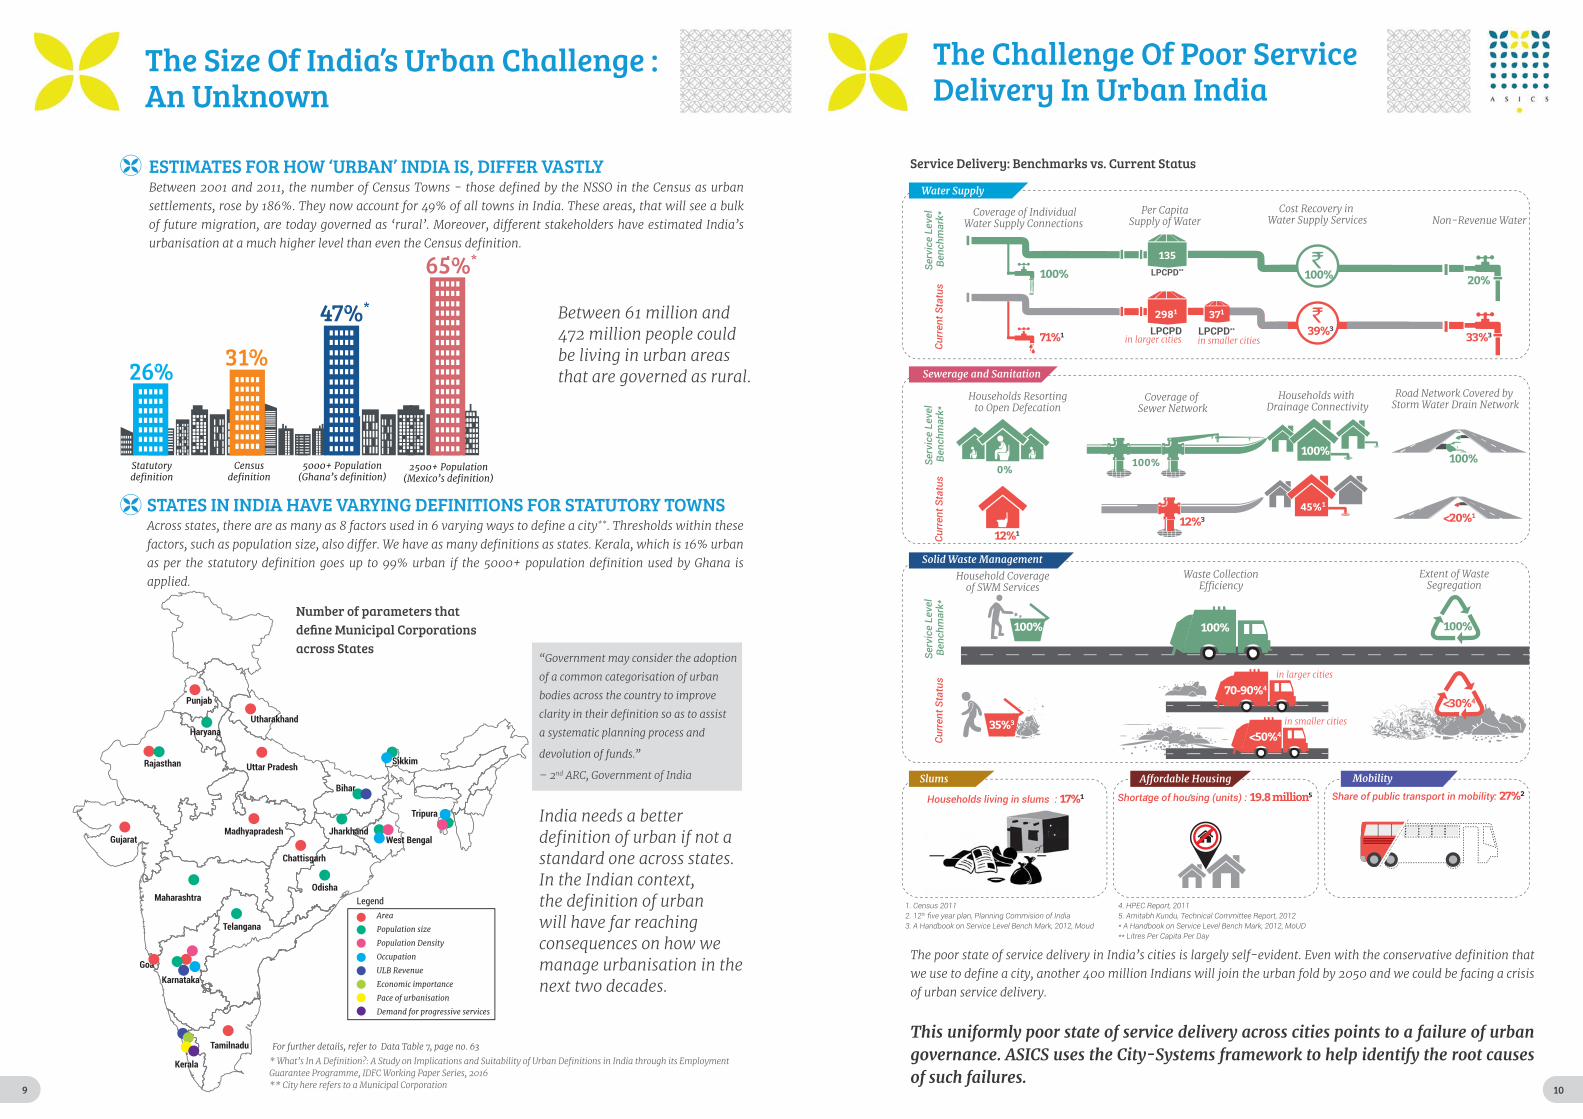
The Size Of India’s Urban Challenge : An Unknown
ESTIMATES FOR HOW ‘URBAN’ INDIA IS, DIFFER VASTLY
Bihar
Tripura
Chattisgarh
Karnataka
Tamilnadu
Telangana
Madhyapradesh
Uttar Pradesh
MaharashtraOdisha
Punjab
Rajasthan
Utharakhand
Kerala
Haryana
JharkhandWest Bengal
Goa
Gujarat
Area
Population size
Population Density
Occupation
ULB Revenue
Economic importance
Pace of urbanisation
Demand for progressive services
Sikkim
Legend
Statutorydefinition
Censusdefinition
5000+ Population(Ghana’s definition)
2500+ Population(Mexico’s definition)
26% 31%
47%*
65%*
STATES IN INDIA HAVE VARYING DEFINITIONS FOR STATUTORY TOWNS
Number of parameters that
across States
10
Coverage of IndividualWater Supply Connections
Cost Recovery in Water Supply Services Non-Revenue Water
Per CapitaSupply of Water
Serv
ice
Leve
l Be
nchm
ark*
Curr
ent S
tatu
s Se
rvic
e Le
vel
Benc
hmar
k*Cu
rren
t Sta
tus
Serv
ice
Leve
l Be
nchm
ark*
Curr
ent S
tatu
s
100%
71%1
135
LPCPD**
2981
LPCPD371
LPCPD**
100%
39%3
20%
33%3
Households Resortingto Open Defecation
Coverage of Sewer Network
Households with Drainage Connectivity
Road Network Covered by Storm Water Drain Network
Household Coverageof SWM Services
Waste CollectionEfficiency
100% 100%
<30%4
35%3
Households living in slums : 17%1 Shortage of housing (units) : 19.8 million5 Share of public transport in mobility: 27%2
Water Supply
Sewerage and Sanitation
Solid Waste Management
Slums Affordable Housing Mobility
12%1
0%
12%3
45%1
100% 100%100%
<20%1
Extent of WasteSegregation
1. Census 20112. 12th
in larger cities
in smaller cities
in larger cities in smaller cities
100%
70-90%4
<50%4
The Challenge Of Poor Service Delivery In Urban India
Service Delivery: Benchmarks vs. Current Status
This uniformly poor state of service delivery across cities points to a failure of urban governance. ASICS uses the City-Systems framework to help identify the root causes of such failures.

11
‘City-Systems’
QUALITY OF LIFE
Urban Capacities& Resources
Empowered &Legitimate Political
Representation
Transparency,Accountability &
Participation
Urban Planning& Design
Annual Survey Of India’s City-Systems
12
A
Urban Planning & Design
Urban Capacities & Resources
Empowered & Legitimate Political Representation
Transparency, Accountability & Participation
B
C
D
13
Urban Planning & Design
A
Socrates
Jane Jacobs
The ASICS report scores cities
on 33 parameters that help
us answer the following key
questions around
Urban Planning & Design.
A1.
A3.
A4.
A2.
13 14
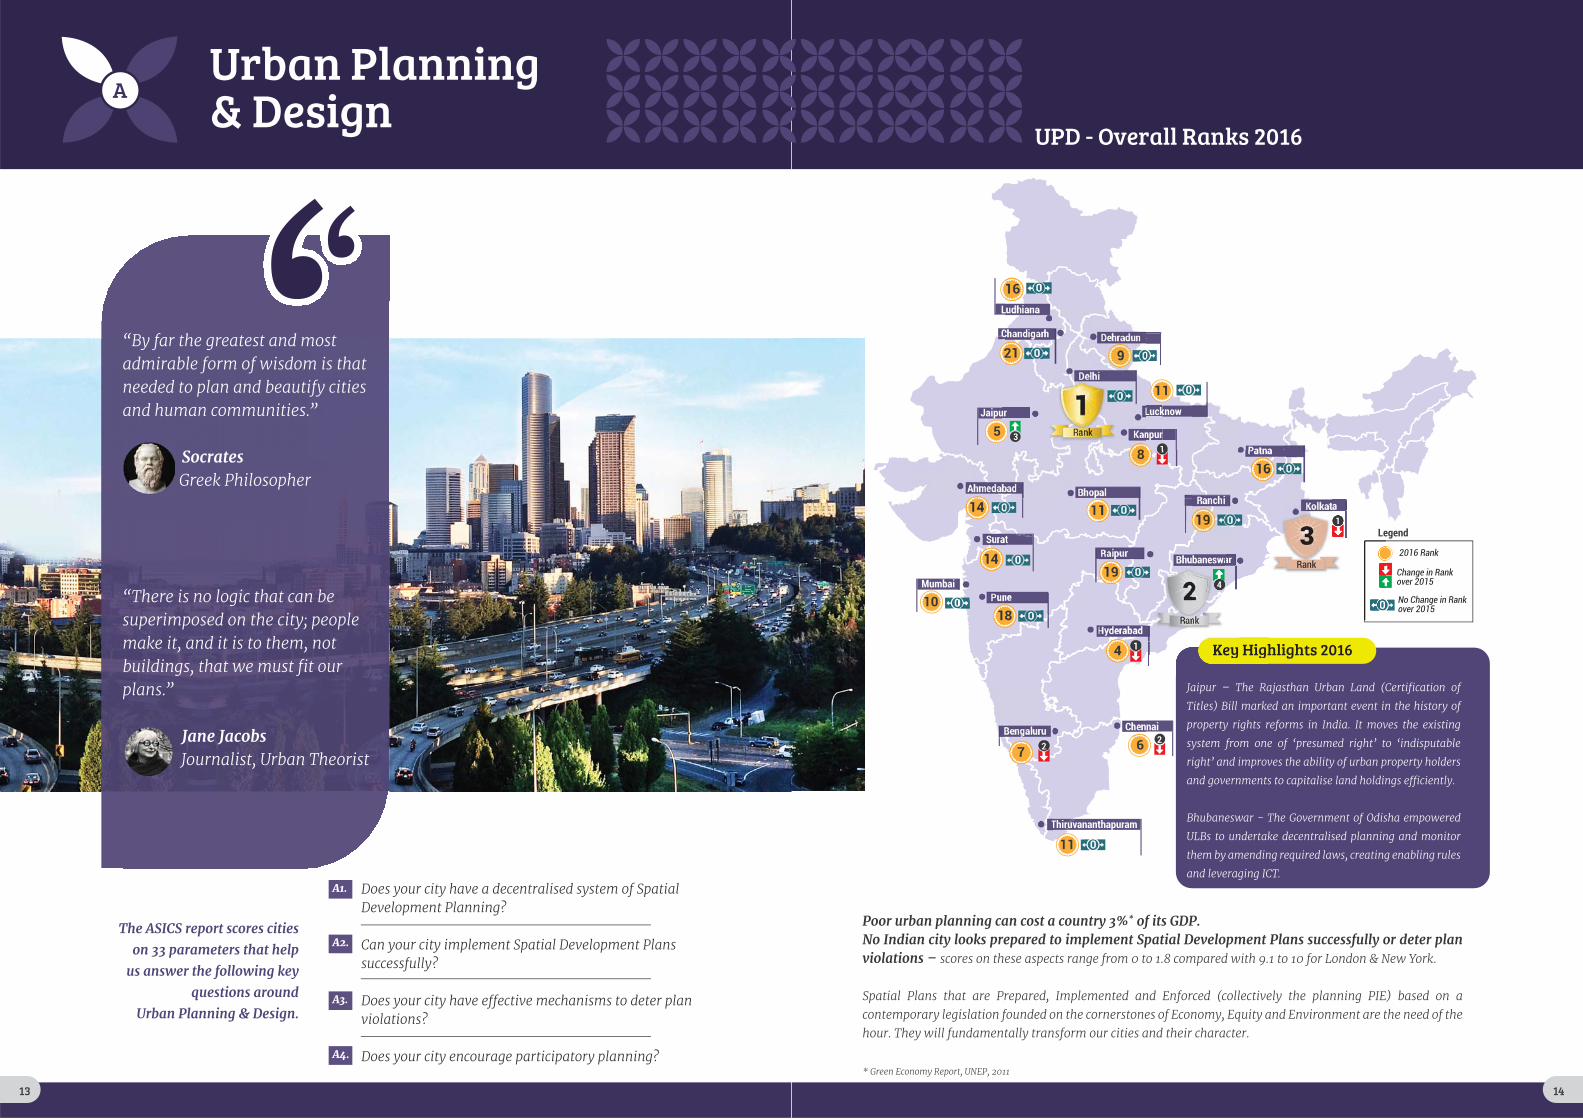
Key Highlights 2016
Delhi
Jaipur
Ahmedabad Bhopal
Surat
MumbaiPune
Bengaluru Chennai
Bhubaneswar
Kolkata
Patna
Lucknow
Dehradun
Thiruvananthapuram
9
11
21
5
14
14
10
7
11
18
6
11
4
No Change in Rankover 2015
Kanpur
8 1
1
22
16
3
Change in Rankover 2015
Ludhiana
Chandigarh
Rank
2016 Rank
Legend
00
00
0
0
0
0
00
0
0
Key High
baneswa
4
Rank
2
ta1
Le
0
ar Rank
3
Poor urban planning can cost a country 3%* of its GDP. No Indian city looks prepared to implement Spatial Development Plans successfully or deter plan violations –
UPD - Overall Ranks 2016
14
15
A1
A2
A3
A4
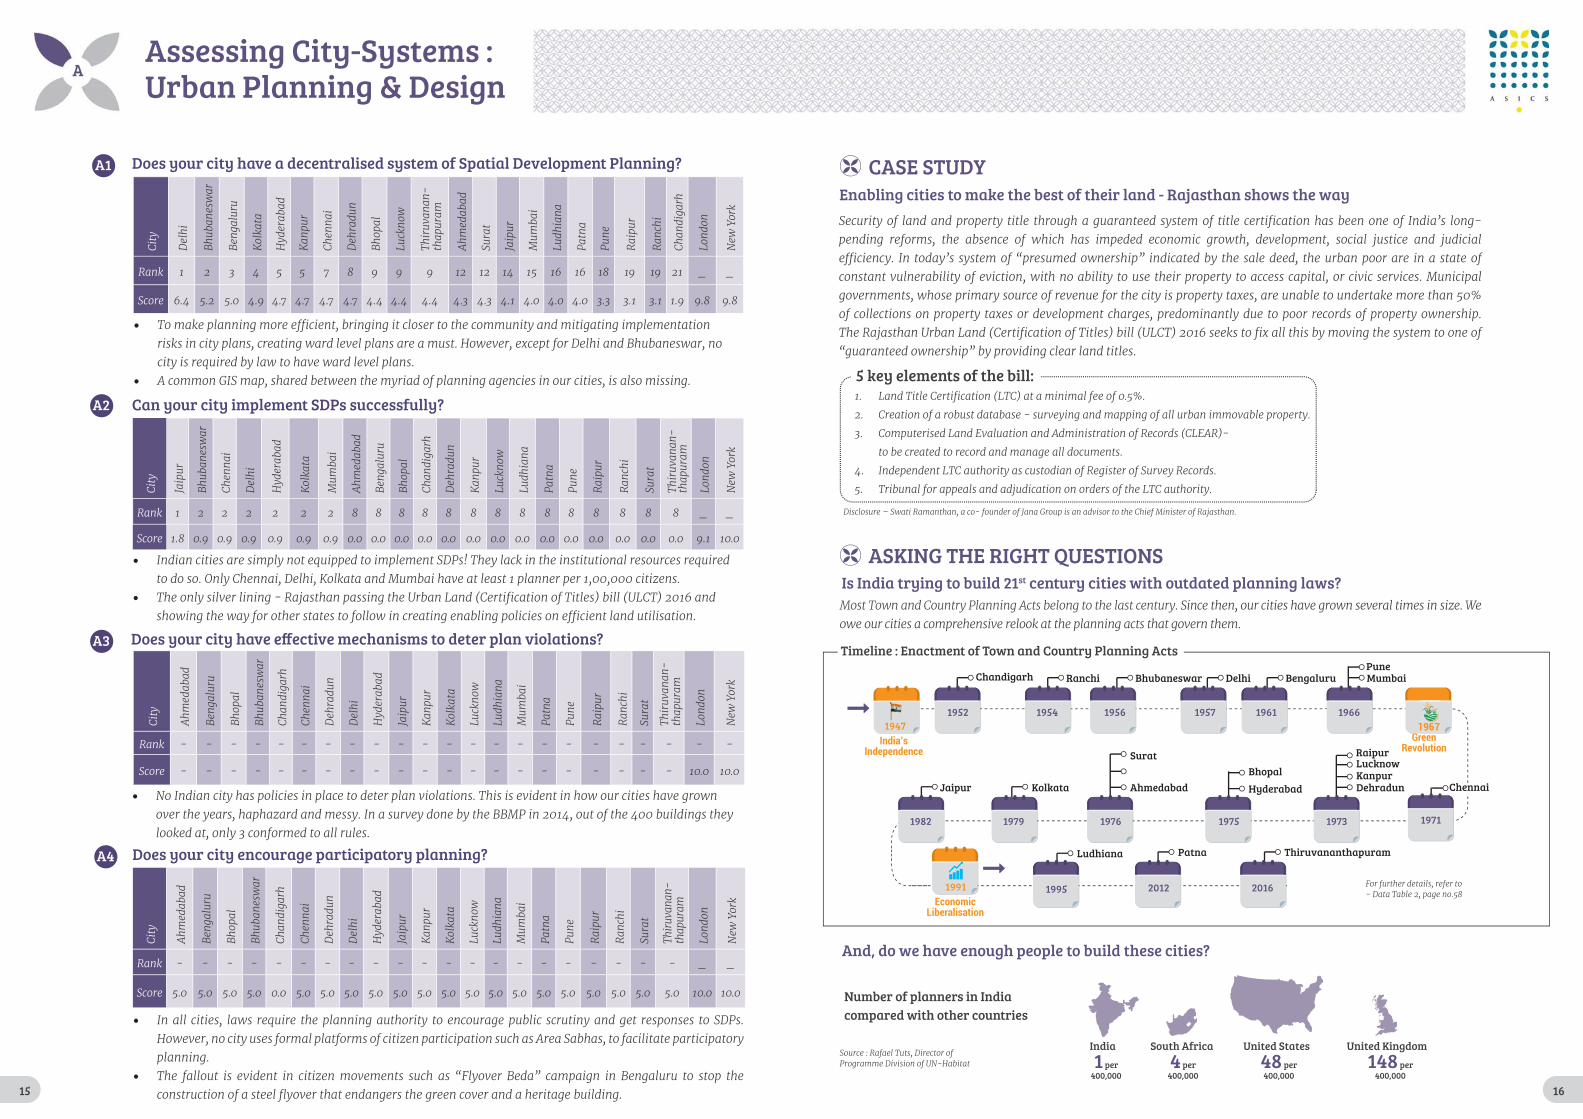
Does your city have a decentralised system of Spatial Development Planning?
Can your city implement SDPs successfully?
Does your city encourage participatory planning?
1 2 12 12 21 _ _
1 2 2 2 2 2 2 _ _
_ _
Assessing City-Systems : Urban Planning & Design
16
India
1 per400,000
South Africa
4 per400,000
United Kingdom
148 per400,000
United States
48 per400,000
ThiruvananthapuramPatnaLudhiana
Dehradun
LucknowBhopal KanpurHyderabad
RaipurSurat
Ahmedabad
Pune
KolkataJaipur
SU MO TU WE TH FR SA
APRILAPRIL
1
2 3 4 5 6 7 8
9 10 11 12 13 14 15
16 17 18 19 20 21 22
23 24 25 26 27 28 29
30
SU MO TU WE TH FR SA
APRILAPRIL
1
2 3 4 5 6 7 8
9 10 11 12 13 14 15
16 17 18 19 20 21 22
23 24 25 26 27 28 29
30
SU MO TU WE TH FR SA
APRILAPRIL
1
2 3 4 5 6 7 8
9 10 11 12 13 14 15
16 17 18 19 20 21 22
23 24 25 26 27 28 29
30
SU MO TU WE TH FR SA
APRILAPRIL
1
2 3 4 5 6 7 8
9 10 11 12 13 14 15
16 17 18 19 20 21 22
23 24 25 26 27 28 29
30
SU MO TU WE TH FR SA
APRILAPRIL
1
2 3 4 5 6 7 8
9 10 11 12 13 14 15
16 17 18 19 20 21 22
23 24 25 26 27 28 29
30
SU MO TU WE TH FR SA
APRILAPRIL
1
2 3 4 5 6 7 8
9 10 11 12 13 14 15
16 17 18 19 20 21 22
23 24 25 26 27 28 29
30
SU MO TU WE TH FR SA
APRILAPRIL
1
2 3 4 5 6 7 8
9 10 11 12 13 14 15
16 17 18 19 20 21 22
23 24 25 26 27 28 29
30
SU MO TU WE TH FR SA
PPAPRILRAPRILPR
1
2 3 4 5 6 7 8
9 10 11 12 13 14 15
16 17 18 19 20 21 22
23 24 25 26 27 28 29
30
SU MO TU WE TH FR SA
PPAPRILRAPRILPR
1
2 3 4 5 6 7 8
9 10 11 12 13 14 15
16 17 18 19 20 21 22
23 24 25 26 27 28 29
30
SU MO TU WE TH FR SA
APRILAPRIL
1
2 3 4 5 6 7 8
9 10 11 12 13 14 15
16 17 18 19 20 21 22
23 24 25 26 27 28 29
30
SU MO TU WE TH FR SA
APRILAPRIL
1
2 3 4 5 6 7 8
9 10 11 12 13 14 15
16 17 18 19 20 21 22
23 24 25 26 27 28 29
30
SU MO TU WE TH FR SA
APRILAPRIL
1
2 3 4 5 6 7 8
9 10 11 12 13 14 15
16 17 18 19 20 21 22
23 24 25 26 27 28 29
30
SU MO TU WE TH FR SA
APRILAPRIL
1
2 3 4 5 6 7 8
9 10 11 12 13 14 15
16 17 18 19 20 21 22
23 24 25 26 27 28 29
30
SU MO TU WE TH FR SA
APRILAPRIL
1
2 3 4 5 6 7 8
9 10 11 12 13 14 15
16 17 18 19 20 21 22
23 24 25 26 27 28 29
30
GreenRevolution
Bengaluru Mumbai
G1967
Chandigarh
19791982
1995 2012
Ranchi Bhubaneswar Delhi
197319751976
19661954 1956 1957 1961
2016
Chennai
1952
SU MO TU WE TH FR SA
APRILAPRIL
1
2 3 4 5 6 7 8
9 10 11 12 13 14 15
16 17 18 19 20 21 22
23 24 25 26 27 28 29
30
EconomicLiberalisation
1991
SU MO TU WE TH FR SA
APRILRAPRILPR
1
22 33 44 55 66 77 88
9 10 11 12 13 14 15
16 17 18 19 20 21 22
23 24 25 26 27 28 29
30
1971
APRILAPRIL
India’sIndependence
1947
Enabling cities to make the best of their land - Rajasthan shows the way
Number of planners in India compared with other countries
Is India trying to build 21st century cities with outdated planning laws?
Timeline : Enactment of Town and Country Planning Acts
And, do we have enough people to build these cities?
CASE STUDY
ASKING THE RIGHT QUESTIONS
5 key elements of the bill:

17
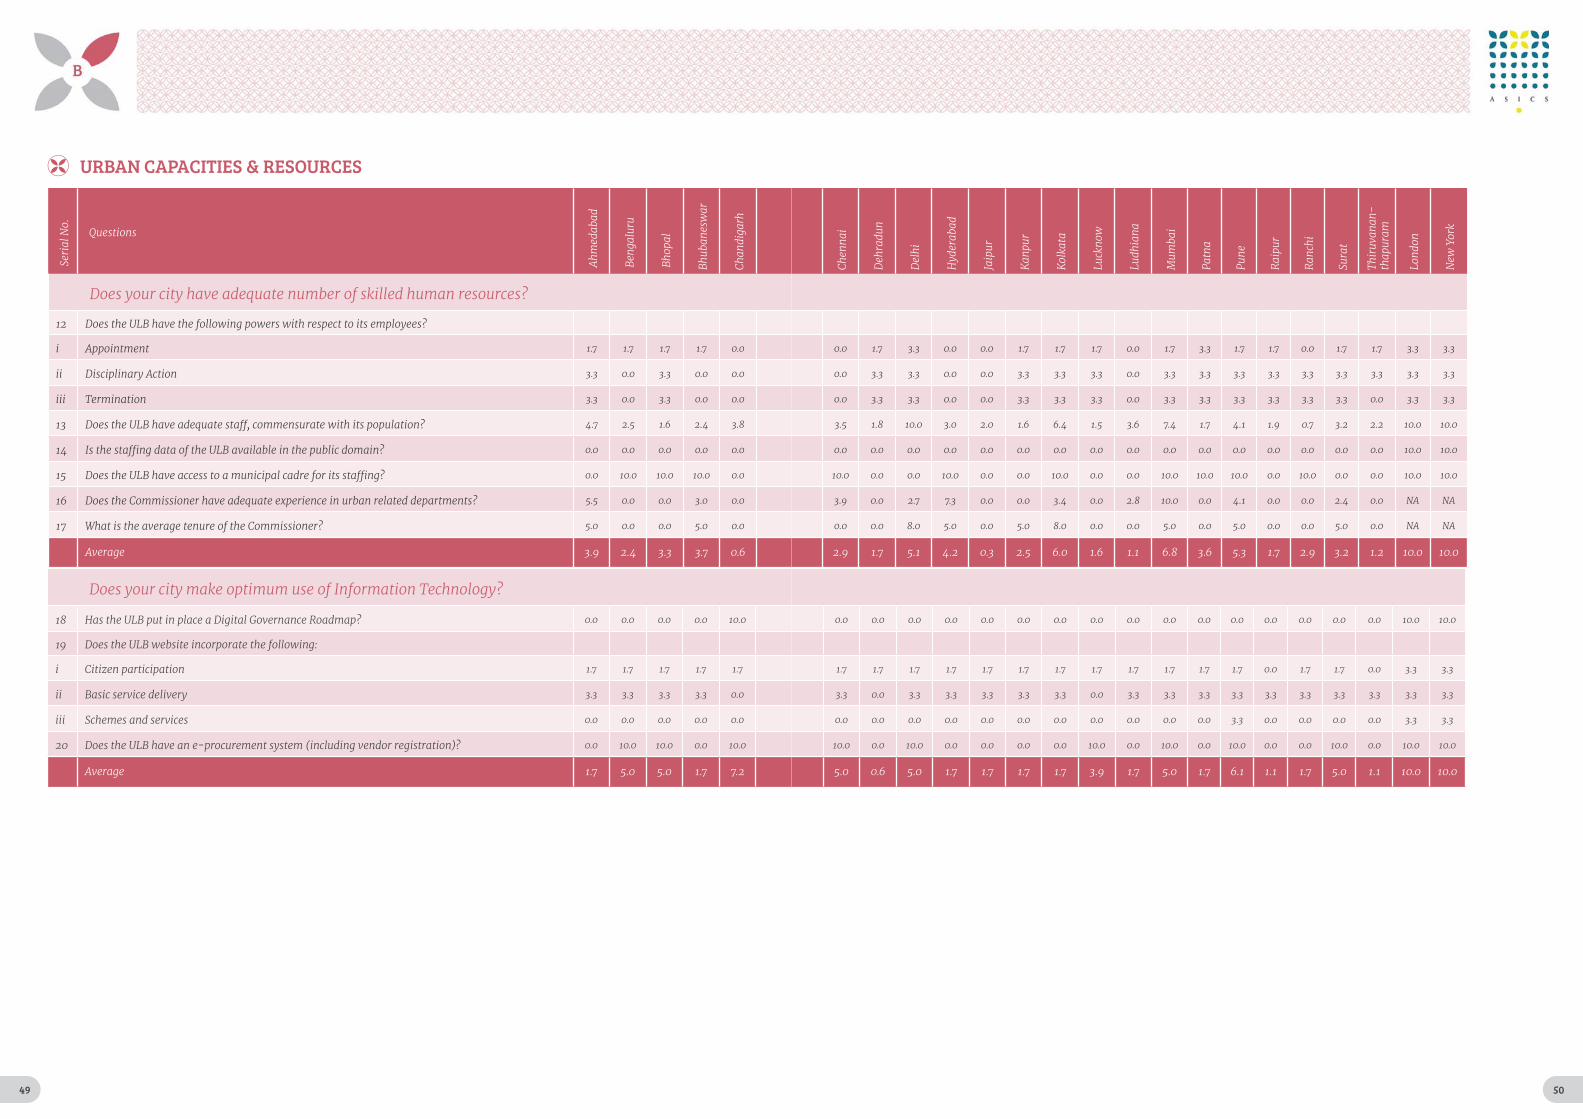
B Urban CapacitiesAnd Resources
The ASICS report scores cities on 20 parameters that help
us answer the following key questions around Urban Capacities & Resources.
N R Narayana Murthy
B1.
B3.
B2.
17 18
No Change in Rankover 2015
Change in Rankover 2015
2016 Rank
Legend
Mumbai
Patna
9
18
5
421
10
158
12
147 6
3
5
3
2
3
1
1
2
11 5
19
Rank
Pa
M
Raipur
Jaipur
Ahmedabad Bhopal
Surat
MumbaiPune
BengaluruChennai
Hyderabad
Bhubaneswar
KolkataRanchi
Patna
Lucknow
Dehradun
Thiruvananthapuram
Ludhiana
0
0
0 0
0
0
0
0
0
0
0
Rank
2
88pur
Bhopal
adun
0
0
Rank
3
Key Highlights 2016th
ASICS cities generate just 37% of the money that they spend. Barring Delhi and Mumbai, cities only have an
UCR - Overall Ranks 2016
18

19
1 2 10 11 12 20 21 _ _
B1
B2
B3
Does your city invest adequate funds in public infrastructure and services?
Does your city have adequate number of skilled human resources?
Does your city make optimum use of Information Technology?
1 2 10 11 12 20 21 _ _
1 2 10 10 10 10 10 10 10 10 10 21 _ _
Assessing City-Systems : Urban Capacities & Resources
20
ASKING THE RIGHT QUESTIONS
13.7 1.3
1.31.3
1.0
1.7
3.6
1.0
1.3
0.6
1.0
0.8
1.7
1.3
2.5
0.7
1.3
2.5
0.7
0.7
0.8
1.0
7.35.5
4.1
3.93.4
3.02.8
2.72.4
1.8
1.1
0.70.60.6
0.5
0.50.0
0.0NANA
Years of experience of current Commissioner in urban departments
Average term of Commissioner over the last 5 years
Mumbai
Hyderabad
Ahmedabad
Pune
Chennai
Kolkata
Bhubaneswar
Ludhiana
Delhi
Surat
Bhopal
Ranchi
Kanpur
Jaipur
Raipur
Bengaluru
Patna
Chandigarh
Thiruvanantapuram
Dehradun
Lucknow
How robust are our city budget estimates?
Are we ignoring small cities?
1,444 Cr.
Actuals of Lucknow
Bengaluru’s2015 estimateovershoot
1,821 Cr.
244 Cr.
Actuals of Bhubaneswar
+

21
Ahmedabad7,503(41%)
Mumbai 26,658
(66%)
Chandigarh 5,381(29%)
Delhi6,289(67%)
Jaipur 1,834 (25%)
Bengaluru4,474(47%)
Thiruvanantapuram 11,668
(24%)
Bhopal5,246 (27%)
Dehradun1,015 (28%)
Ludhiana3,814 (32%)
Kanpur2,526(22%)
Lucknow3,859 (18%)
Patna1,114 (17%)
Bhubaneswar1,901 (39%)
Kolkata6,844 (40%)
Chennai8,948(28%)
Hyderabad4,207(77%)
Pune10,227 (60%)
Surat7,386 (28%)
Raipur3,009(33%)
Ranchi1,403(24%)
London
Per capita expenditure in Rs.
City
Proportion of own revenue to total expenditure (%)
New York
Johannesburg
46% Own Revenue
68% Own Revenue
68% Own Revenue
Legend
ASKING THE RIGHT QUESTIONS Are our cities sustainable and independent economic units?
2222

23
Empowered & Legitimate PoliticalRepresentation
c
The ASICS report scores cities on 11 parameters that help
us answer the following key questions around Empowered
& Legitimate Political Representation.
Dr Shashi Tharoor,
th
C1.
C2.
23 24
Patna
6
16
11
12
20
17
14
15
95
7
8 4
18
19
213
1
1
1
13
Rank
No Change in Rankover 2015
Change in Rankover 2015
2016 Rank
Legend
Pa
Raipur
Delhi
Jaipur
Ahmedabad Bhopal
Surat
MumbaiPune
Bengaluru Chennai
Hyderabad
Bhubaneswar
KolkataRanchi
Patna
Lucknow
Dehradun
Thiruvananthapuram
Ludhiana
Chandigarh
Kanpur
0
0
0
00
0
0
0
00
0
0
0
0
00
0
Le
r
olkataKoKo
0
0
Rank
2
Rank
3
Key Highlights 2016
Of the 80 million residents in the ASICS cities, 46 million are governed by an indirectly elected
ELPR - Overall Ranks 2016
24

25
th
C1
C2
Do your city leaders have adequate power?
Is your city truly democratic?
1 2 10 11 12 20 21 _ _
1 2 10 10 12 21 _ _
Assessing City-Systems : Empowered & Legitimate Political Representation
26
Thiruvanan-thapuram Bhopal Bengaluru
Sl.N
o. Functions to be devolved as per the 12th schedule of the 74 th CAA
Cla
imed
*
Rea
lity*
Cla
imed
*
Rea
lity*
Cla
imed
*
Rea
lity*
1 Urban planning including town planning
2 Regulation of land-use and construction of buildings
3 Planning for economic and social development
4 Roads and bridges
5 Water supply for domestic, industrial and, commercial purposes
6 Public health, sanitation conservancy and solid waste management
7 Fire services
8Urban forestry, protection of the environment and promotion of ecological
aspects
9Safeguarding the interests of weaker sections of society, including the
handicapped and mentally retarded
10 Slum improvement and upgradation
11 Poverty alleviation
12Provision of urban amenities and facilities such as parks, gardens,
playgrounds
13 Promotion of cultural, educational and aesthetic aspects
14Burials and burial grounds; cremations, cremation grounds and electric
crematoriums
15 Cattle ponds; prevention of cruelty to animals
16 Vital statistics including registration of births and deaths
17Public amenities including street lighting, parking lots, bus stops and
public conveniences
18 Regulation of slaughterhouses and tanneries
Even 25 years after the passing of the 74th
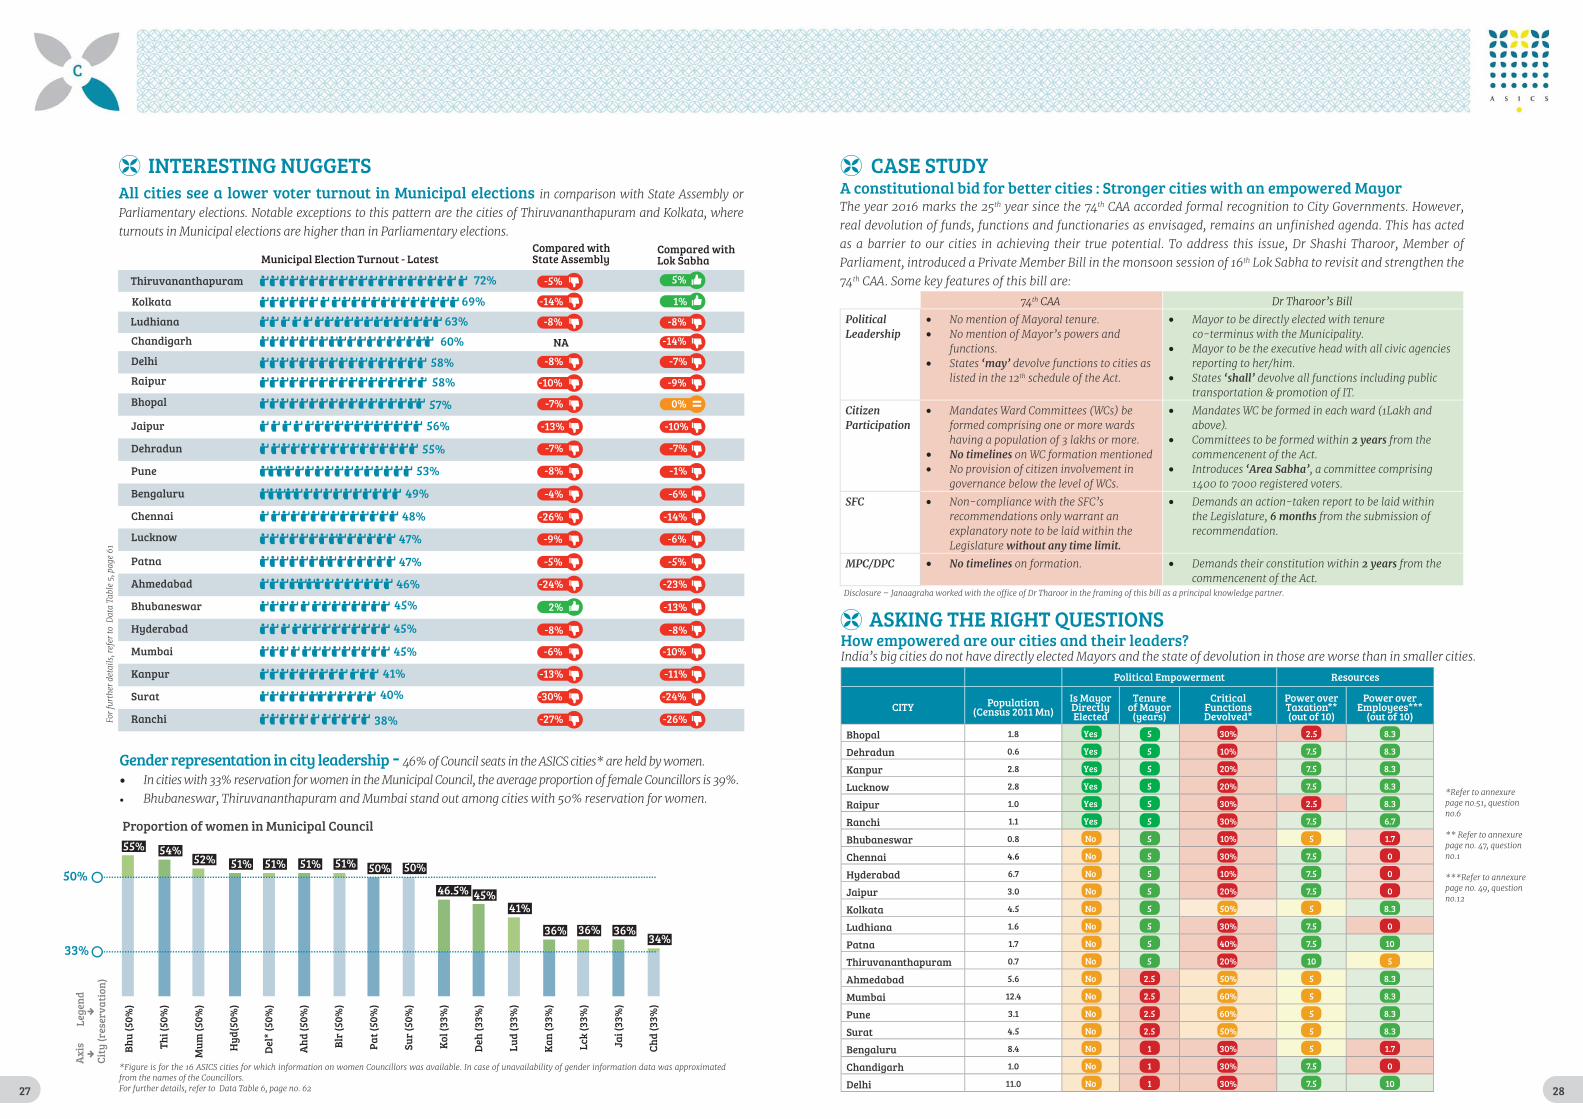
INTERESTING NUGGETS
27
Gender representation in city leadership -
Bhu
(50%
)
Thi (
50%
)
Mum
(50%
)
Hyd
(50%
)
Del
* (5
0%)
Ahd
(50%
)
Blr
(50%
)
Pat (
50%
)
Sur
(50%
)
Kol
(33%
)
Deh
(33%
)
Lud
(33%
)
Kan
(33%
)
Lck
(33%
)
Jai (
33%
)
Chd
(33%
)
50%
33%
55% 54%52% 51% 51% 51% 51% 50% 50%
46.5% 45%41%
36% 36% 36%34%
Cit
y (r
eser
vati
on)
Lege
nd
�
�
Axi
s
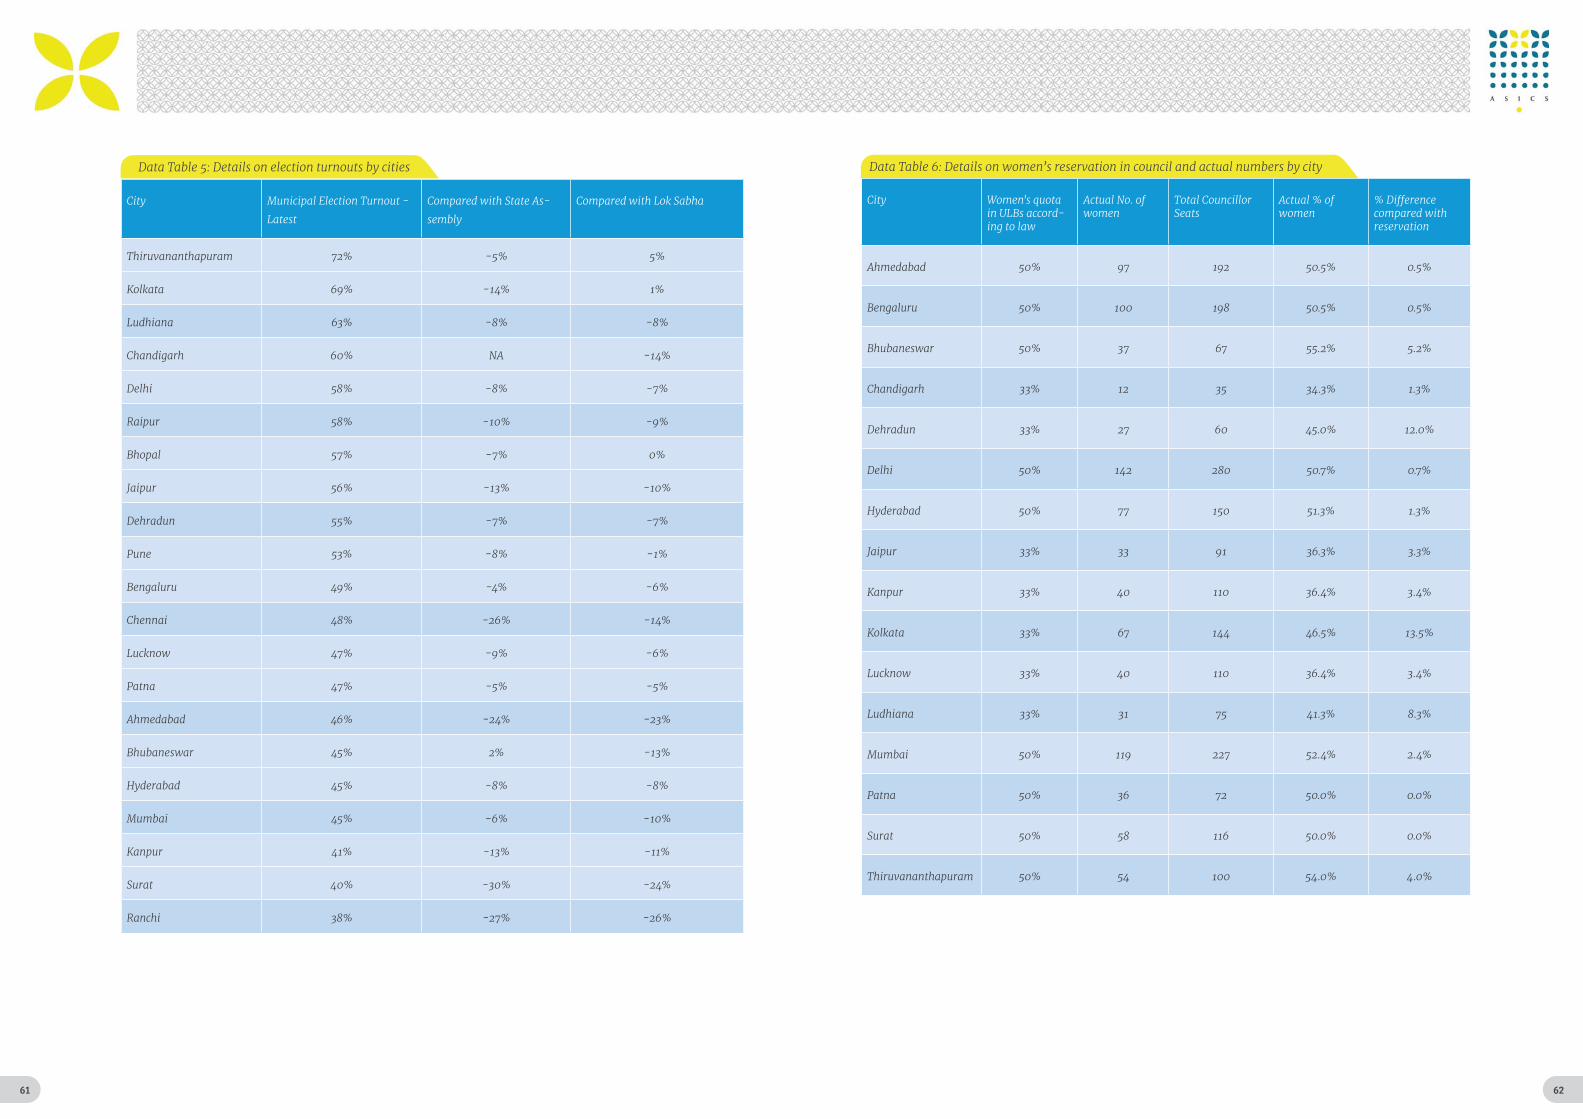
Municipal Election Turnout - LatestCompared withState Assembly
Compared withLok Sabha
-5%
-14%
-8%
-8%
-10%
-7%
-13%
-7%
-8%
-4%
-26%
-9%
-5%
-24%
2%
-8%
-6%
-13%
-30%
-27%
5%
1%
-8%
-14%
-7%
-9%
-10%
-7%
-1%
-6%
-14%
-6%
-5%
-23%
-13%
-8%
-10%
-11%
-24%
-26%
0% =
NA
72%
69%
63%
60%
58%
58%
57%
56%
55%
53%
49%
48%
47%
47%
46%
45%
45%
45%
41%
40%
38%
Thiruvananthapuram
Kolkata
Ludhiana
Chandigarh
Delhi
Raipur
Bhopal
Jaipur
Dehradun
Pune
Bengaluru
Chennai
Lucknow
Patna
Ahmedabad
Bhubaneswar
Hyderabad
Mumbai
Kanpur
Surat
Ranchi
INTERESTING NUGGETS All cities see a lower voter turnout in Municipal elections
Proportion of women in Municipal Council
28
ASKING THE RIGHT QUESTIONS
CASE STUDY
How empowered are our cities and their leaders?
th th
th
th
th
Political Leadership
‘may’ th ‘shall’
Citizen Participation
No timelines2 years
‘Area Sabha’
SFC
without any time limit.
6 months
MPC/DPC No timelines 2 years
A constitutional bid for better cities : Stronger cities with an empowered Mayor
Political Empowerment Resources
CITY Population (Census 2011 Mn)
Is Mayor Directly Elected
Tenure of Mayor
(years)
Critical Functions Devolved*
Power over Taxation**(out of 10)
Power over Employees***
(out of 10)
Bhopal 1.8 Yes 5 30% 2.5 8.3
Dehradun 0.6 Yes 5 10% 7.5 8.3
Kanpur 2.8 Yes 5 20% 7.5 8.3
Lucknow 2.8 Yes 5 20% 7.5 8.3
Raipur 1.0 Yes 5 30% 2.5 8.3
Ranchi 1.1 Yes 5 30% 7.5 6.7
Bhubaneswar 0.8 No 5 10% 5 1.7
Chennai 4.6 No 5 30% 7.5 0
Hyderabad 6.7 No 5 10% 7.5 0
Jaipur 3.0 No 5 20% 7.5 0
Kolkata 4.5 No 5 50% 5 8.3
Ludhiana 1.6 No 5 30% 7.5 0
Patna 1.7 No 5 40% 7.5 10
Thiruvananthapuram 0.7 No 5 20% 10 5
Ahmedabad 5.6 No 2.5 50% 5 8.3
Mumbai 12.4 No 2.5 60% 5 8.3
Pune 3.1 No 2.5 60% 5 8.3
Surat 4.5 No 2.5 50% 5 8.3
Bengaluru 8.4 No 1 30% 5 1.7
Chandigarh 1.0 No 1 30% 7.5 0
Delhi 11.0 No 1 30% 7.5 10
29
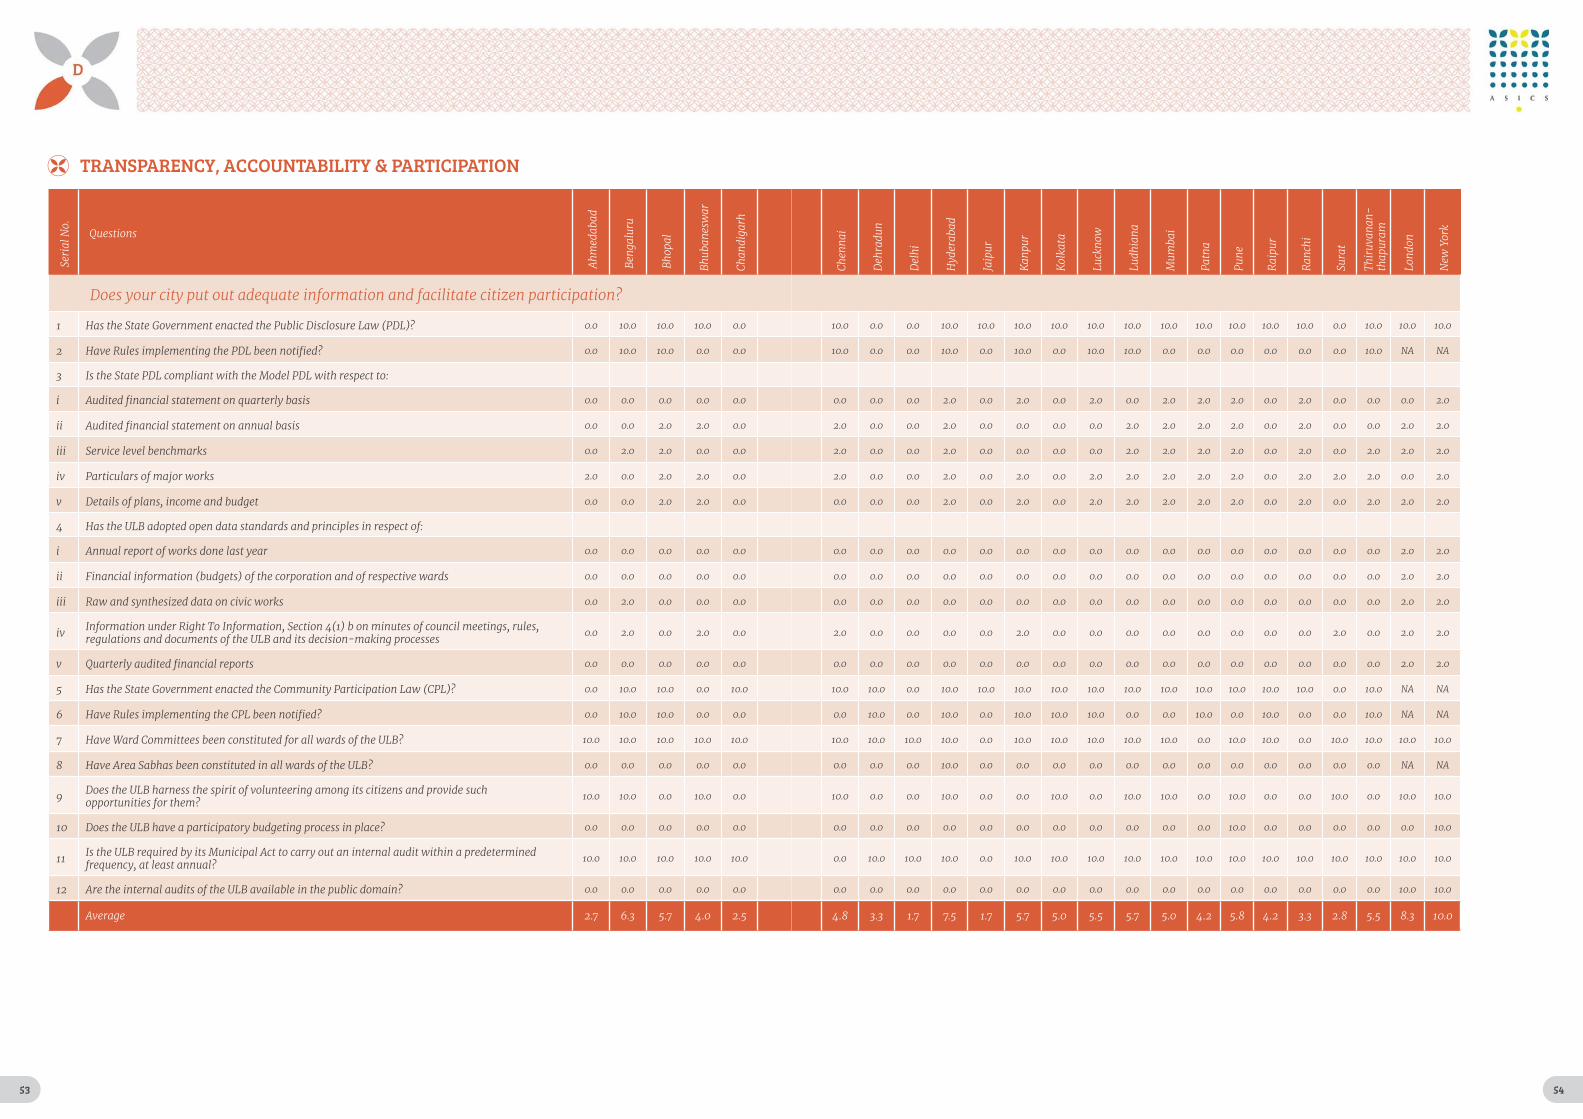
Transparency,Accountability &Participation
D
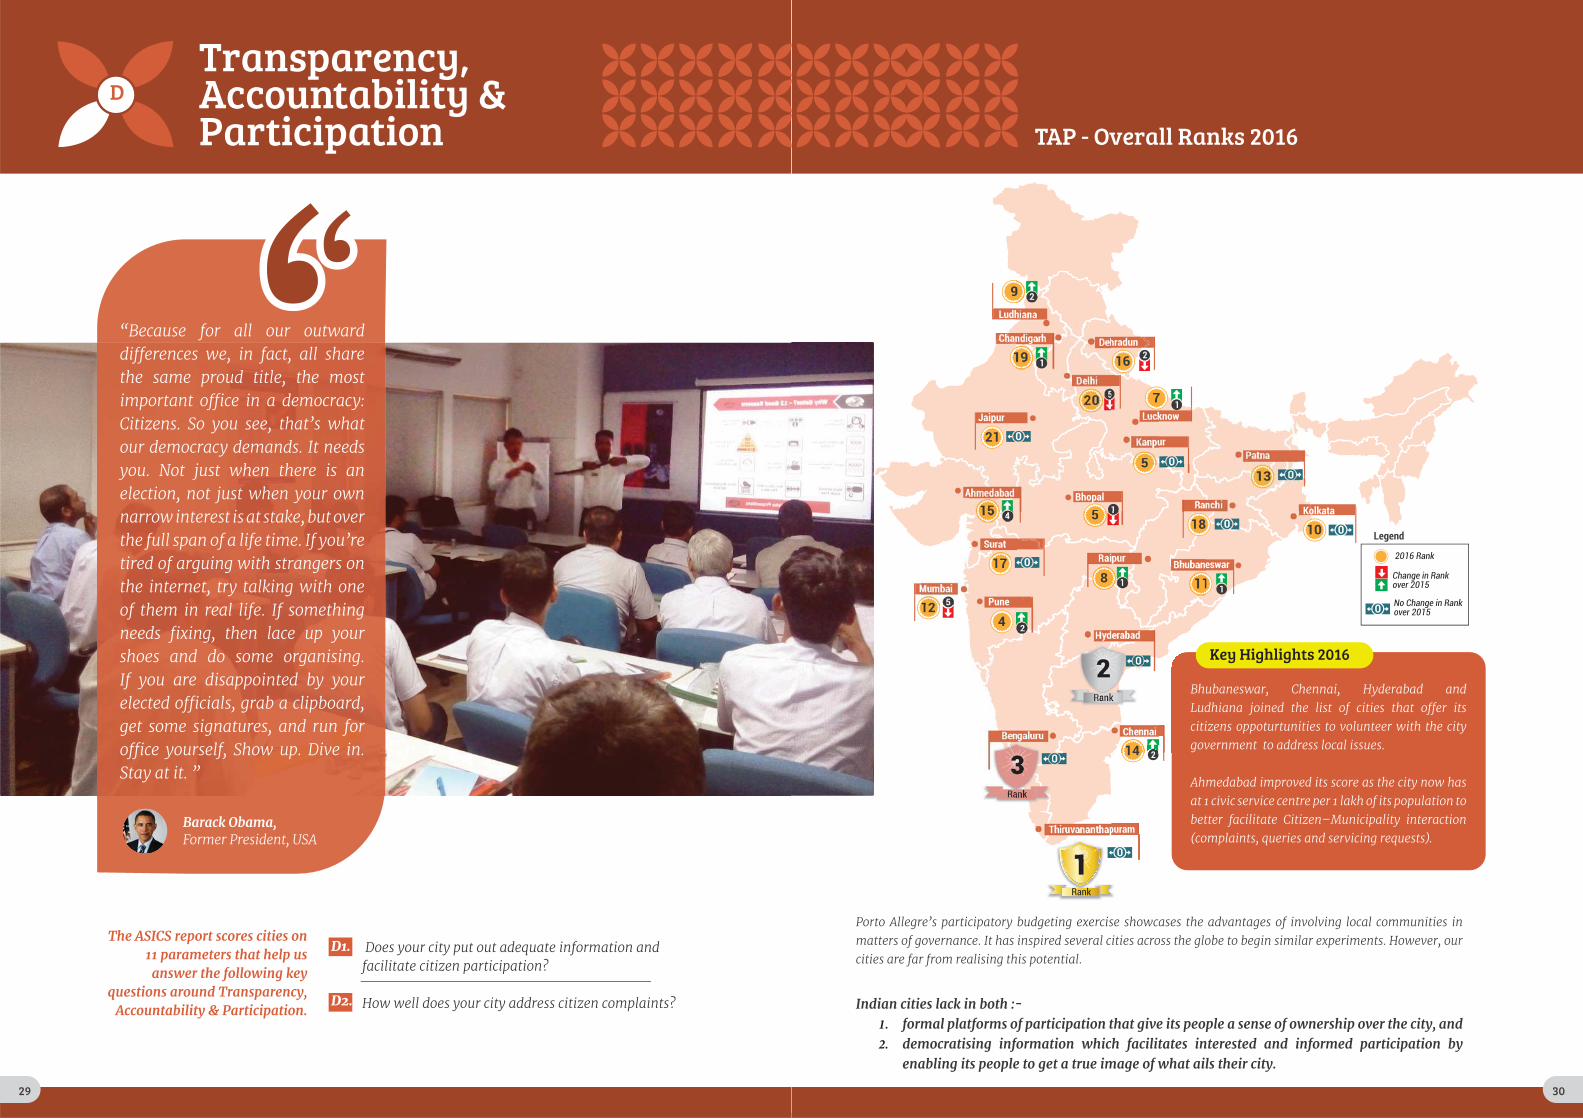
Barack Obama,
The ASICS report scores cities on 11 parameters that help us
answer the following key questions around Transparency,
Accountability & Participation.
D1.
D2.
29 30
16
20
10
135
7
19
21
15
17
12
8
4
14
518
11 1
2
2
5
5
1
1
4
1
9
1
2
Rank
No Change in Rankover 2015
Change in Rankover 2015
2016 Rank
Legend
Raipur
Delhi
Jaipur
Ahmedabad Bhopal
Surat
MumbaiPune
Bhubaneswar
KolkataRanchi
Patna
Lucknow
Dehradun
Thiruvananthapuram
Ludhiana
Chandigarh
Kanpur
0
0
0
0
0
0
0
0
114 2
2
Rank
3
Key Highlights 2016Key Highlights 2016
TAP - Overall Ranks 2016
Indian cities lack in both :- formal platforms of participation that give its people a sense of ownership over the city, and democratising information which facilitates interested and informed participation by enabling its people to get a true image of what ails their city.
30

31
1 2 10 10 12 20 20 _ _
th
D1
D2
Does your city put out adequate information and facilitate citizen participation?
How well does your city address citizen complaints?
1 2 11 12 12 20 20 _ _
Assessing City-Systems : Transparency,Accountability & Participation
32
Mohalla Sabha
Implementation of the work usingCitizen-Local Area Development Funds
or through Agencies
Work Completed Discussion on important issues in the Mohalla
Voting and selection of priority issues
�
�
�
�
�
Life Cycle of Mohalla Sabhas
Mohalla Sabhas in Delhi: A decision making process close to communities
CASE STUDY

33
URBAN PLANNING & DESIGN
Amend Planning Act:
i.e.
Reforms Timeline
Immediate Medium-Term
Reforms to City-Systems: A Roadmap
33 34
URBAN CAPACITIES & RESOURCES Reforms Timeline
Medium-TermImmediate
34

35
EMPOWERED & LEGITIMATE POLITICAL REPRESENTATION
Amend Municipal Corporation Act to :
Reforms Timeline
Stat
eSt
ate
Stat
e
Cent
re
Cent
re
Immediate Medium-Term
35 36
TRANSPARENCY, ACCOUNTABILITY & PARTICIPATION Reforms Timeline
Immediate Medium-Term
36

37
SuratSuratRaipur
Delhi
Jaipur
AhmedabadBhopal
Surat
MumbaiPune
Bangalore Chennai
Hyderabad
Bhubaneswar
KolkataRanchi
Patna
Lucknow
Dehradun
Thiruvananthapuram
LudhianaChandigarh
Kanpur
Medium City0.5 million - 1 million
Large City1 million - 5 million
Mega/Emerging Mega City>5 million
1.60.9 0.5
11
3.0 2.82.7
1.6
4.41.0
1.7
1.0
5.5
4.4
0.8
3.1
6.7
4.6
0.7
12.4
8.4
ASICS 2016Geographical Distribution of Cities
Figure 1.0 source census of India 2011*All population in millions
37 38
Methodology
THE APPROACH
Components of City-Systems framework Number of Questions
20
11
SELECTION OF CITIES
39
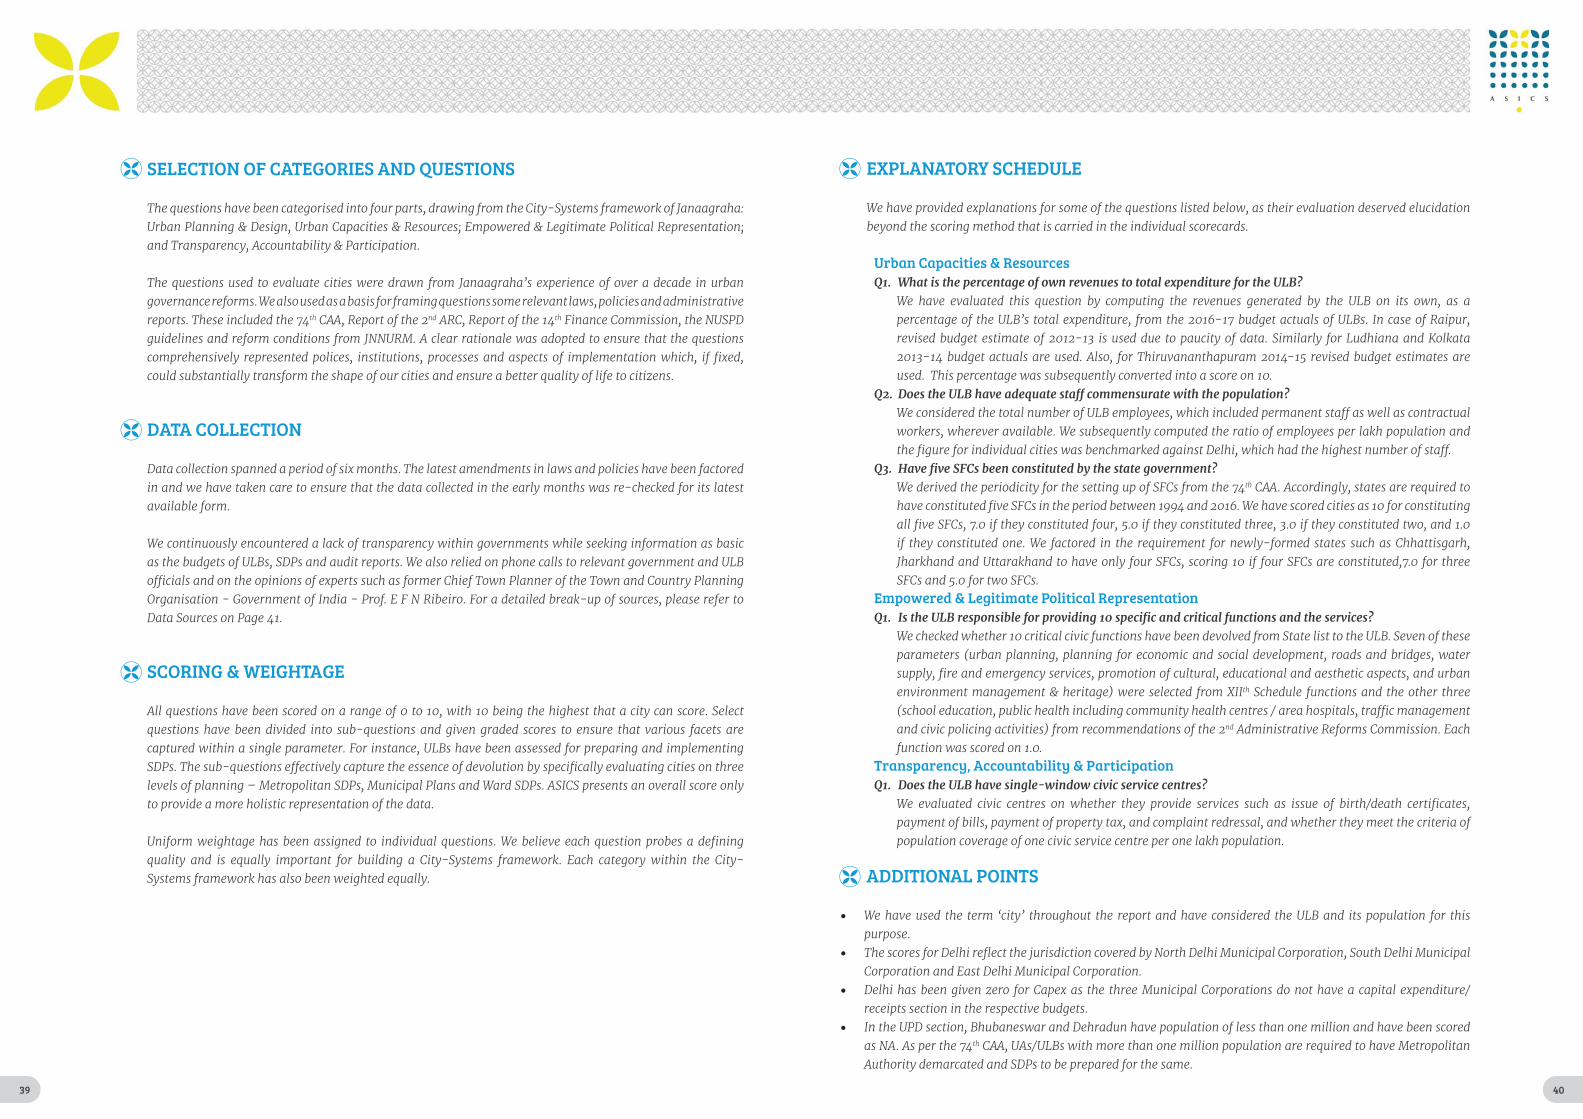
SELECTION OF CATEGORIES AND QUESTIONS
th th
DATA COLLECTION
SCORING & WEIGHTAGE
40
EXPLANATORY SCHEDULE
Urban Capacities & ResourcesQ1.
Q2.
Q3. th
Empowered & Legitimate Political RepresentationQ1.
th
Transparency, Accountability & ParticipationQ1. Does the ULB have single-window civic service centres?
ADDITIONAL POINTS
th

41
Data Sources
42
2012

43
URBAN PLANNING & DESIGN
1
2
10
11
12
Annexures
44
45
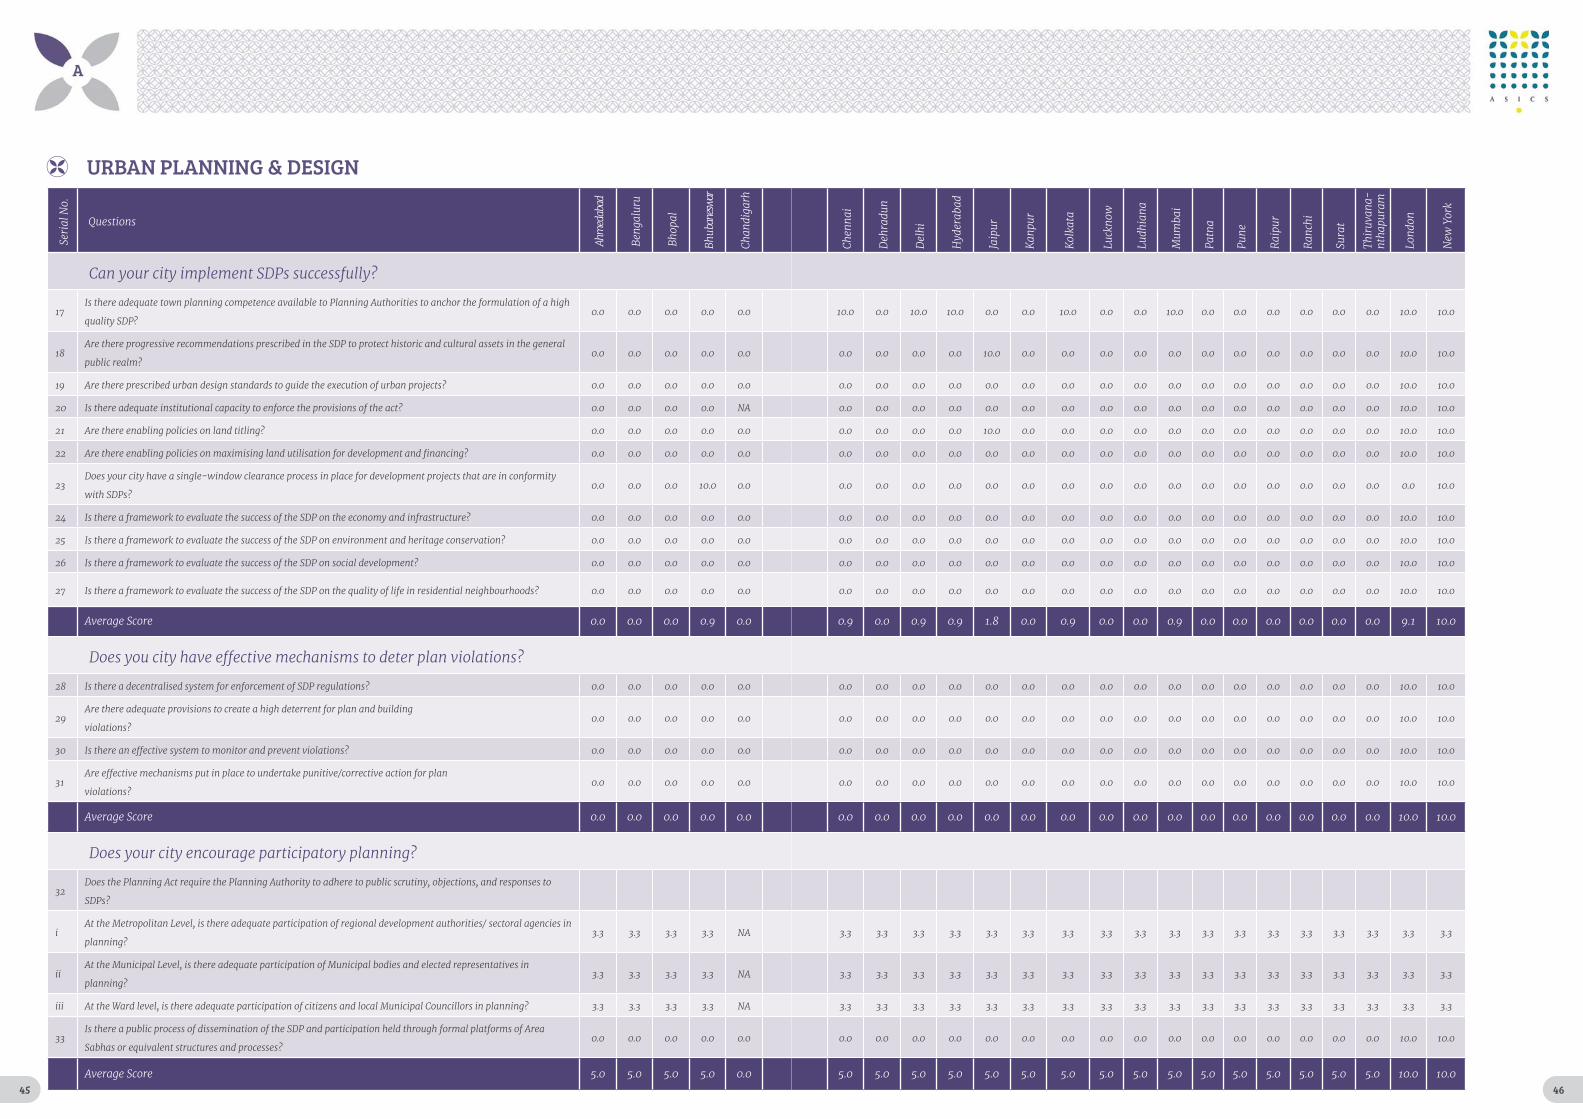
URBAN PLANNING & DESIGN
20
21
22
46

47
URBAN CAPACITIES & RESOURCES
1
2
10
11
48
49
12
20
URBAN CAPACITIES & RESOURCES
50

51
1
2
10
11
EMPOWERED & LEGITIMATE POLITICAL REPRESENTATION
52
53
1
2
10
11
12
TRANSPARENCY, ACCOUNTABILITY & PARTICIPATION
54

55
Seri
al N
o.
Questions
Ahm
edab
ad
Ben
galu
ru
Bho
pal
Bhu
bane
swar
Cha
ndig
arh
TRANSPARENCY, ACCOUNTABILITY & PARTICIPATION
56
Che
nnai
Deh
radu
n
Del
hi
Hyd
erab
ad
Jaip
ur
Kan
pur
Kol
kata
Luck
now
Ludh
iana
Mum
bai
Patn
a
Pun
e
Rai
pur
Ran
chi
Sura
t
Thi
ruva
nant
ha-
pura
m
Lon
don
New
Yor
k
57
City UPD UCR ELPR TAP AVERAGE SCORE RANK 2015
RANK
12
10
21 21
20 20
12 10
2
11 11
2
1 1
_ _
_ _ _
Overall City-System Scores And Rankings
58
1
2 110
10
11
12
2011
Data Tables

59 60
202
101
211
61 62
100
12
110
110
100

63
64

65