about island press - millennium ecosystem...
TRANSCRIPT

About Island Press
Island Press is the only nonprofit organization in theUnited States whose principal purpose is the publicationof books on environmental issues and natural resourcemanagement. We provide solutions-oriented informationto professionals, public officials, business and communityleaders, and concerned citizens who are shaping responsesto environmental problems.
In 2005, Island Press celebrates its twenty-first anniver-sary as the leading provider of timely and practical booksthat take a multidisciplinary approach to critical environ-mental concerns. Our growing list of titles reflects ourcommitment to bringing the best of an expanding bodyof literature to the environmental community throughoutNorth America and the world.
PAGE ii
Support for Island Press is provided by the Agua Fund,The Geraldine R. Dodge Foundation, Doris Duke Chari-table Foundation, Ford Foundation, The George GundFoundation, The William and Flora Hewlett Foundation,Kendeda Sustainability Fund of the Tides Foundation, TheHenry Luce Foundation, The John D. and Catherine T.MacArthur Foundation, The Andrew W. Mellon Founda-tion, The Curtis and Edith Munson Foundation, TheNew-Land Foundation, The New York CommunityTrust, Oak Foundation, The Overbrook Foundation, TheDavid and Lucile Packard Foundation, The WinslowFoundation, and other generous donors.
The opinions expressed in this book are those of theauthors and do not necessarily reflect the views of thesefoundations.
................. 11432$ $$FM 10-11-05 14:48:08 PS

Ecosystems and Human Well-being:Current State and Trends, Volume 1
PAGE iii................. 11432$ $$FM 10-11-05 14:48:08 PS

Millennium Ecosystem Assessment BoardThe MA Board represents the users of the findings of the MA process.
Co-chairsRobert T. Watson, The World BankA.H. Zakri, United Nations University
Institutional RepresentativesSalvatore Arico, Programme Officer, Division of Ecological and Earth Sciences,
United Nations Educational, Scientific and Cultural OrganizationPeter Bridgewater, Secretary General, Ramsar Convention on WetlandsHama Arba Diallo, Executive Secretary, United Nations Convention to Combat
DesertificationAdel El-Beltagy, Director General, International Center for Agricultural Research in
Dry Areas, Consultative Group on International Agricultural ResearchMax Finlayson, Chair, Scientific and Technical Review Panel, Ramsar Convention
on WetlandsColin Galbraith, Chair, Scientific Council, Convention on Migratory SpeciesErica Harms, Senior Program Officer for Biodiversity, United Nations FoundationRobert Hepworth, Acting Executive Secretary, Convention on Migratory SpeciesOlav Kjørven, Director, Energy and Environment Group, United Nations
Development ProgrammeKerstin Leitner, Assistant Director-General, Sustainable Development and Healthy
Environments, World Health Organization
At-large MembersFernando Almeida, Executive President, Business Council for Sustainable
Development-BrazilPhoebe Barnard, Global Invasive Species ProgrammeGordana Beltram, Undersecretary, Ministry of the Environment and Spatial Planning,
SloveniaDelmar Blasco, Former Secretary General, Ramsar Convention on WetlandsAntony Burgmans, Chairman, Unilever N.V.Esther Camac-Ramirez, Asociacion Ixa Ca Vaa de Desarrollo e Informacion IndigenaAngela Cropper, President, The Cropper Foundation (ex officio)Partha Dasgupta, Professor, Faculty of Economics and Politics, University of
CambridgeJose Marıa Figueres, Fundacion Costa Rica para el Desarrollo SostenibleFred Fortier, Indigenous Peoples’ Biodiversity Information NetworkMohammed H.A. Hassan, Executive Director, Third World Academy of Sciences for
the Developing WorldJonathan Lash, President, World Resources Institute
Assessment Panel
Co-chairsAngela Cropper, The Cropper FoundationHarold A. Mooney, Stanford University
MembersDoris Capistrano, Center for International Forestry ResearchStephen R. Carpenter, University of Wisconsin-MadisonKanchan Chopra, Institute of Economic GrowthPartha Dasgupta, University of CambridgeRashid Hassan, University of PretoriaRik Leemans, Wageningen UniversityRobert M. May, University of Oxford
Editorial Board ChairsJose Sarukhan, Universidad Nacional Autonoma de MexicoAnne Whyte, Mestor Associates Ltd.
DirectorWalter V. Reid, Millennium Ecosystem Assessment
Secretariat Support OrganizationsThe United Nations Environment Programme (UNEP) coordinates the MillenniumEcosystem Assessment Secretariat, which is based at the following partner institutions:• Food and Agriculture Organization of the United Nations, Italy• Institute of Economic Growth, India• International Maize and Wheat Improvement Center (CIMMYT), Mexico (until
2002)• Meridian Institute, United States• National Institute of Public Health and the Environment (RIVM), Netherlands
(until mid-2004)
PAGE iv
Alfred Oteng-Yeboah, Chair, Subsidiary Body on Scientific, Technical andTechnological Advice, Convention on Biological Diversity
Christian Prip, Chair, Subsidiary Body on Scientific, Technical and TechnologicalAdvice, Convention on Biological Diversity
Mario A. Ramos, Biodiversity Program Manager, Global Environment FacilityThomas Rosswall, Executive Director, International Council for Science – ICSUAchim Steiner, Director General, IUCN – World Conservation UnionHalldor Thorgeirsson, Coordinator, United Nations Framework Convention on
Climate ChangeKlaus Topfer, Executive Director, United Nations Environment ProgrammeJeff Tschirley, Chief, Environmental and Natural Resources Service, Research,
Extension and Training Division, Food and Agriculture Organization of theUnited Nations
Riccardo Valentini, Chair, Committee on Science and Technology, United NationsConvention to Combat Desertification
Hamdallah Zedan, Executive Secretary, Convention on Biological Diversity
Wangari Maathai, Vice Minister for Environment, KenyaPaul Maro, Professor, Department of Geography, University of Dar es SalaamHarold A. Mooney, Professor, Department of Biological Sciences, Stanford University
(ex officio)Marina Motovilova, Faculty of Geography, Laboratory of Moscow RegionM.K. Prasad, Environment Centre of the Kerala Sastra Sahitya ParishadWalter V. Reid, Director, Millennium Ecosystem AssessmentHenry Schacht, Past Chairman of the Board, Lucent TechnologiesPeter Johan Schei, Director, The Fridtjof Nansen InstituteIsmail Serageldin, President, Bibliotheca AlexandrinaDavid Suzuki, Chair, Suzuki FoundationM.S. Swaminathan, Chairman, MS Swaminathan Research FoundationJose Galızia Tundisi, President, International Institute of EcologyAxel Wenblad, Vice President Environmental Affairs, Skanska ABXu Guanhua, Minister, Ministry of Science and Technology, ChinaMuhammad Yunus, Managing Director, Grameen Bank
Prabhu Pingali, Food and Agriculture Organization of the United NationsCristian Samper, National Museum of Natural History, United StatesRobert Scholes, Council for Scientific and Industrial ResearchRobert T. Watson, The World Bank (ex officio)A.H. Zakri, United Nations University (ex officio)Zhao Shidong, Chinese Academy of Sciences
• Scientific Committee on Problems of the Environment (SCOPE), France• UNEP-World Conservation Monitoring Centre, United Kingdom• University of Pretoria, South Africa• University of Wisconsin-Madison, United States• World Resources Institute (WRI), United States• WorldFish Center, Malaysia
................. 11432$ $$FM 10-11-05 14:48:09 PS
Ecosystems and Human Well-being:Current State and Trends, Volume 1
Edited by:
Rashid Hassan Robert Scholes Neville AshUniversity of Pretoria Council for Science and Industrial Research UNEP World Conservation
South Africa South Africa Monitoring CentreUnited Kingdom
Findings of the Condition and Trends Working Groupof the Millennium Ecosystem Assessment
Washington • Covelo • London
PAGE v................. 11432$ $$FM 10-11-05 14:48:28 PS

The Millennium Ecosystem Assessment SeriesEcosystems and Human Well-being: A Framework for AssessmentEcosystems and Human Well-being: Current State and Trends, Volume 1Ecosystems and Human Well-being: Scenarios, Volume 2Ecosystems and Human Well-being: Policy Responses, Volume 3Ecosystems and Human Well-being: Multiscale Assessments, Volume 4Our Human Planet: Summary for Decision-makers
Synthesis Reports (available at MAweb.org)Ecosystems and Human Well-being: SynthesisEcosystems and Human Well-being: Biodiversity SynthesisEcosystems and Human Well-being: Desertification SynthesisEcosystems and Human Well-being: Human Health SynthesisEcosystems and Human Well-being: Wetlands and Water SynthesisEcosystems and Human Well-being: Opportunities and Challenges for Business and Industry
No copyright claim is made in the work by: N.V. Aladin, Rob Alkemade, Vyacheslav Aparin, Andrew Balmford, Andrew J. Beattie, Victor Brovkin, Elena Bykova,John Dixon, Nikolay Gorelkin, Terry Griswold, Ward Hagemeijer, Jack Ives, Jacques Lemoalle, Christian Leveque, Hassane Mahamat, Anthony David McGuire,Eduardo Mestre Rodriguez, Mwelecele-Malecela-Lazaro, Oladele Osibanjo, Joachim Otte, Reidar Persson, Igor Plotnikov, Alison Power, Juan Pulhin, Inbal Reshef,Ulf Riebesell, Alan Rodgers, Agnes Rola, Raisa Toryannikova, employees of the Australian government (C. Max Finlayson), employees of the Canadian government(Randy G. Miltion, Ian D. Thompson), employees of WHO (Robert Bos), employees of the U.K. government (Richard Betts, John Chilton), and employees ofthe U.S. government (Jill Baron, Kenneth R. Hinga, William Perrin, Joshua Rosenthal, Keith Wiebe). The views expressed in this report are those of the authorsand do not necessarily reflect the position of the organizations they are employees of.
Copyright � 2005 Millennium Ecosystem Assessment
All rights reserved under International and Pan-American Copyright Conventions. No part of this book may be reproduced in any form or by any means withoutpermission in writing from the publisher: Island Press, 1718 Connecticut Avenue, Suite 300, NW, Washington, DC 20009.
ISLAND PRESS is a trademark of The Center for Resource Economics.
Library of Congress Cataloging-in-Publication data.
Ecosystems and human well-being : current state and trends : findings ofthe Condition and Trends Working Group / edited by Rashid Hassan, RobertScholes, Neville Ash.
p. cm.—(The millennium ecosystem assessment series ; v. 1)Includes bibliographical references and index.ISBN 1-55963-227-5 (cloth : alk. paper)—ISBN 1-55963-228-3 (pbk. : alk. paper)1. Human ecology. 2. Ecosystem management. 3. Biotic communities.
4. Biological diversity. 5. Ecological assessment (Biology) I. Hassan,Rashid M. II. Scholes, Robert. III. Ash, Neville. IV. Millennium EcosystemAssessment (Program). Condition and Trends Working Group. V. Series.GF50.E264 2005333.95—dc22
2005017196
British Cataloguing-in-Publication data available.
Printed on recycled, acid-free paper
Book design by Maggie PowellTypesetting by Coghill Composition, Inc.
Manufactured in the United States of America10 9 8 7 6 5 4 3 2 1
PAGE vi................. 11432$ $$FM 10-11-05 14:48:32 PS

Millennium Ecosystem Assessment:Objectives, Focus, and Approach
The Millennium Ecosystem Assessment was carried out between 2001 and2005 to assess the consequences of ecosystem change for human well-beingand to establish the scientific basis for actions needed to enhance the conser-vation and sustainable use of ecosystems and their contributions to humanwell-being. The MA responds to government requests for information receivedthrough four international conventions—the Convention on Biological Diversity,the United Nations Convention to Combat Desertification, the Ramsar Conven-tion on Wetlands, and the Convention on Migratory Species—and is designedto also meet needs of other stakeholders, including the business community,the health sector, nongovernmental organizations, and indigenous peoples.The sub-global assessments also aimed to meet the needs of users in theregions where they were undertaken.
The assessment focuses on the linkages between ecosystems and humanwell-being and, in particular, on ‘‘ecosystem services.’’ An ecosystem is adynamic complex of plant, animal, and microorganism communities and thenonliving environment interacting as a functional unit. The MA deals with thefull range of ecosystems—from those relatively undisturbed, such as naturalforests, to landscapes with mixed patterns of human use and to ecosystemsintensively managed and modified by humans, such as agricultural land andurban areas. Ecosystem services are the benefits people obtain from ecosys-tems. These include provisioning services such as food, water, timber, andfiber; regulating services that affect climate, floods, disease, wastes, and waterquality; cultural services that provide recreational, aesthetic, and spiritual bene-fits; and supporting services such as soil formation, photosynthesis, and nutri-ent cycling. The human species, while buffered against environmental changesby culture and technology, is fundamentally dependent on the flow of ecosys-tem services.
The MA examines how changes in ecosystem services influence human well-being. Human well-being is assumed to have multiple constituents, includingthe basic material for a good life, such as secure and adequate livelihoods,enough food at all times, shelter, clothing, and access to goods; health, includ-ing feeling well and having a healthy physical environment, such as clean airand access to clean water; good social relations, including social cohesion,mutual respect, and the ability to help others and provide for children; security,including secure access to natural and other resources, personal safety, andsecurity from natural and human-made disasters; and freedom of choice andaction, including the opportunity to achieve what an individual values doingand being. Freedom of choice and action is influenced by other constituents ofwell-being (as well as by other factors, notably education) and is also a precon-dition for achieving other components of well-being, particularly with respect toequity and fairness.
The conceptual framework for the MA posits that people are integral parts ofecosystems and that a dynamic interaction exists between them and otherparts of ecosystems, with the changing human condition driving, both directly
PAGE vii
vii
and indirectly, changes in ecosystems and thereby causing changes in humanwell-being. At the same time, social, economic, and cultural factors unrelatedto ecosystems alter the human condition, and many natural forces influenceecosystems. Although the MA emphasizes the linkages between ecosystemsand human well-being, it recognizes that the actions people take that influenceecosystems result not just from concern about human well-being but also fromconsiderations of the intrinsic value of species and ecosystems. Intrinsic valueis the value of something in and for itself, irrespective of its utility for someoneelse.
The Millennium Ecosystem Assessment synthesizes information from the sci-entific literature and relevant peer-reviewed datasets and models. It incorpo-rates knowledge held by the private sector, practitioners, local communities,and indigenous peoples. The MA did not aim to generate new primary knowl-edge but instead sought to add value to existing information by collating, evalu-ating, summarizing, interpreting, and communicating it in a useful form.Assessments like this one apply the judgment of experts to existing knowledgeto provide scientifically credible answers to policy-relevant questions. Thefocus on policy-relevant questions and the explicit use of expert judgmentdistinguish this type of assessment from a scientific review.
Five overarching questions, along with more detailed lists of user needs devel-oped through discussions with stakeholders or provided by governmentsthrough international conventions, guided the issues that were assessed:
• What are the current condition and trends of ecosystems, ecosystem ser-vices, and human well-being?
• What are plausible future changes in ecosystems and their ecosystemservices and the consequent changes in human well-being?
• What can be done to enhance well-being and conserve ecosystems?What are the strengths and weaknesses of response options that can beconsidered to realize or avoid specific futures?
• What are the key uncertainties that hinder effective decision-making con-cerning ecosystems?
• What tools and methodologies developed and used in the MA canstrengthen capacity to assess ecosystems, the services they provide, theirimpacts on human well-being, and the strengths and weaknesses of re-sponse options?
The MA was conducted as a multiscale assessment, with interlinked assess-ments undertaken at local, watershed, national, regional, and global scales. Aglobal ecosystem assessment cannot easily meet all the needs of decision-makers at national and sub-national scales because the management of any
................. 11432$ $MEA 10-11-05 14:48:41 PS
Eigh
teen
asse
ssm
ents
wer
eap
prov
edas
com
pone
nts
ofth
eM
A.An
yin
stitu
tion
orco
untry
was
able
toun
derta
kean
asse
ssm
enta
spa
rtof
the
MA
ifit
agre
edto
use
the
MA
conc
eptu
alfra
mew
ork,
toce
ntra
llyin
volv
eth
ein
tend
edus
ers
asst
akeh
olde
rsan
dpa
rtner
s,an
dto
mee
tase
tofp
roce
dura
lreq
uire
men
tsre
late
dto
peer
revi
ew,m
etad
ata,
trans
pare
ncy,
and
inte
llect
ual
prop
erty
right
s.Th
eM
Aas
sess
men
tsw
ere
larg
ely
self-
fund
ed,a
lthou
ghpl
anni
nggr
ants
and
som
eco
regr
ants
wer
epr
ovid
edto
supp
orts
ome
asse
ssm
ents
.The
MA
also
drew
onin
form
atio
nfro
m16
othe
rsub
-glo
bala
sses
smen
tsaf
filia
ted
with
the
MA
that
met
asu
bset
ofth
ese
crite
riaor
wer
eat
earli
erst
ages
inde
velo
pmen
t.
PAGE viii................. 11432$ $MEA 10-11-05 14:48:49 PS

ECO
SYST
EM T
YPES
SUB-
GLO
BAL
ASSE
SSM
ENT
ECO
SYST
EM S
ERVI
CES
Alta
i-Say
an E
core
gion
San
Pedr
o de
Ata
cam
a, C
hile
Car
ibbe
an S
ea
Coa
stal
Brit
ish
Col
umbi
a, C
anad
a
Bajo
Chi
rripo
, Cos
ta R
ica
Trop
ical
For
est M
argi
ns
Indi
a Lo
cal V
illage
s
Glo
mm
a Ba
sin,
Nor
way
Papu
a N
ew G
uine
a
Vilc
anot
a, P
eru
Lagu
na L
ake
Basi
n, P
hilip
pine
s
Portu
gal
São
Paul
o G
reen
Bel
t, Br
azil
Sout
hern
Afri
ca
Stoc
khol
m a
nd K
ristia
nsta
d, S
wed
en
Nor
ther
n R
ange
, Trin
idad
Dow
nstre
am M
ekon
g W
etla
nds,
Vie
t Nam
Wes
tern
Chi
na
Alas
kan
Bore
al F
ores
t
Araf
ura
and
Tim
or S
eas
Arge
ntin
e Pa
mpa
s
Cen
tral A
sia
Mou
ntai
ns
Col
ombi
a co
ffee-
grow
ing
regi
ons
East
ern
Him
alay
as
Sina
i Pen
insu
la, E
gypt
Fiji
Hin
du K
ush-
Him
alay
as
Indo
nesi
a
Indi
a U
rban
Res
ourc
e
Tafil
alt O
asis
, Mor
occo
Nor
ther
n Au
stra
lia F
lood
plai
ns
Assi
r Nat
iona
l Par
k, S
audi
Ara
bia
Nor
ther
n H
ighl
ands
Lak
e D
istri
ct, W
isco
nsin
CO
ASTA
LC
ULT
IVAT
EDD
RYLA
ND
FOR
EST
INLA
ND
WAT
ERIS
LAN
DM
ARIN
EM
OU
NTA
INPO
LAR
UR
BAN
FOO
DW
ATER
FUEL
and
ENER
GY
BIO
DIV
ERSI
TY-
REL
ATED
CAR
BON
SEQ
UES
TRAT
ION
FIBE
Ran
dTI
MBE
RRU
NO
FF
REG
ULA
TIO
N
CU
LTU
RAL
,SP
IRIT
UAL,
AMEN
ITY
OTH
ERS
●●
●●
●●
●
●●
●●
●●
●
●●
●●
●●
●●
●
●●
●●
●●
●●
●●
●●
●●
●
●●
●●
●●
●●
●●
●●
●●
●●
●
●●
●●
●●
●●
●●
●
●●
●●
●●
●●
●
●●
●●
●●
●●
●
●●
●●
●●
●●
●
●●
●●
●●
●●
●●
●●
●●
●●
●
●●
●●
●●
●●
●
●●
●●
●●
●●
●●
●●
●●
●●
●●
●●
●●
●●
●
●●
●●
●●
●●
●●
●
●●
●●
●●
●●
●●
●
●●
●●
●●
●●
●●
●
●●
●●
●●
●●
●●
●●
●
●●
●●
●●
●●
●●
●●
●
●●
●●
●●
●●
●●
●●
●●
●●
●
●●
●●
●
●●
●●
●●
●●
●●
●●
●●
●●
●●
●●
●●
●●
●●
●●
●●
●
●●
●●
●●
●
●●
●●
●●
●
●●
●●
●●
●
●●
●●
●●
●
●
PAGE ix................. 11432$ $MEA 10-11-05 14:48:50 PS

x Ecosystems and Human Well-being: Current State and Trends
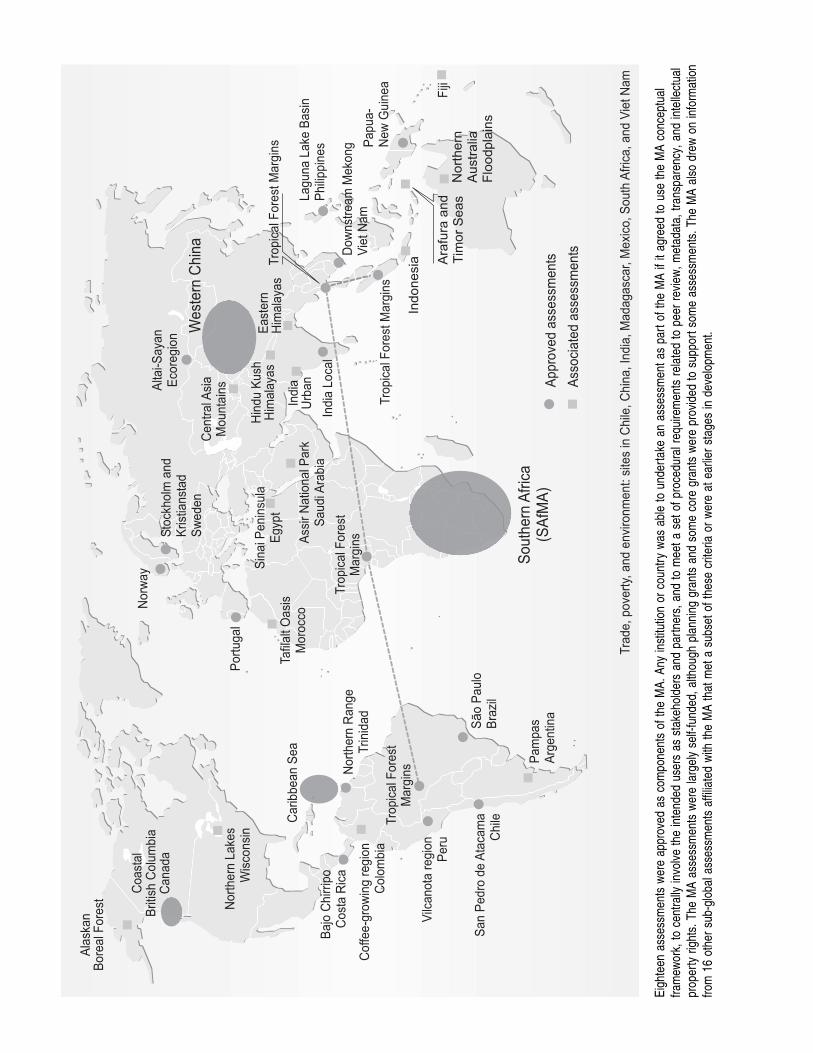
particular ecosystem must be tailored to the particular characteristics of thatecosystem and to the demands placed on it. However, an assessment focusedonly on a particular ecosystem or particular nation is insufficient because someprocesses are global and because local goods, services, matter, and energyare often transferred across regions. Each of the component assessments wasguided by the MA conceptual framework and benefited from the presence ofassessments undertaken at larger and smaller scales. The sub-global assess-ments were not intended to serve as representative samples of all ecosystems;rather, they were to meet the needs of decision-makers at the scales at whichthey were undertaken. The sub-global assessments involved in the MA proc-ess are shown in the Figure and the ecosystems and ecosystem servicesexamined in these assessments are shown in the Table.
The work of the MA was conducted through four working groups, each ofwhich prepared a report of its findings. At the global scale, the Condition andTrends Working Group assessed the state of knowledge on ecosystems, driv-ers of ecosystem change, ecosystem services, and associated human well-being around the year 2000. The assessment aimed to be comprehensive withregard to ecosystem services, but its coverage is not exhaustive. The Scenar-ios Working Group considered the possible evolution of ecosystem servicesduring the twenty-first century by developing four global scenarios exploringplausible future changes in drivers, ecosystems, ecosystem services, andhuman well-being. The Responses Working Group examined the strengthsand weaknesses of various response options that have been used to manageecosystem services and identified promising opportunities for improving humanwell-being while conserving ecosystems. The report of the Sub-global Assess-ments Working Group contains lessons learned from the MA sub-global as-sessments. The first product of the MA—Ecosystems and Human Well-being:A Framework for Assessment, published in 2003—outlined the focus, concep-tual basis, and methods used in the MA. The executive summary of this publi-cation appears as Chapter 1 of this volume.
Approximately 1,360 experts from 95 countries were involved as authors ofthe assessment reports, as participants in the sub-global assessments, or asmembers of the Board of Review Editors. The latter group, which involved 80experts, oversaw the scientific review of the MA reports by governments andexperts and ensured that all review comments were appropriately addressedby the authors. All MA findings underwent two rounds of expert and govern-mental review. Review comments were received from approximately 850 indi-viduals (of which roughly 250 were submitted by authors of other chapters inthe MA), although in a number of cases (particularly in the case of govern-ments and MA-affiliated scientific organizations), people submitted collatedcomments that had been prepared by a number of reviewers in their govern-ments or institutions.
PAGE x
The MA was guided by a Board that included representatives of five interna-tional conventions, five U.N. agencies, international scientific organizations,governments, and leaders from the private sector, nongovernmental organiza-tions, and indigenous groups. A 15-member Assessment Panel of leading so-cial and natural scientists oversaw the technical work of the assessment,supported by a secretariat with offices in Europe, North America, SouthAmerica, Asia, and Africa and coordinated by the United Nations EnvironmentProgramme.
The MA is intended to be used:
• to identify priorities for action;
• as a benchmark for future assessments;
• as a framework and source of tools for assessment, planning, and man-agement;
• to gain foresight concerning the consequences of decisions affecting eco-systems;
• to identify response options to achieve human development and sustain-ability goals;
• to help build individual and institutional capacity to undertake integratedecosystem assessments and act on the findings; and
• to guide future research.
Because of the broad scope of the MA and the complexity of the interactionsbetween social and natural systems, it proved to be difficult to provide definitiveinformation for some of the issues addressed in the MA. Relatively few ecosys-tem services have been the focus of research and monitoring and, as a conse-quence, research findings and data are often inadequate for a detailed globalassessment. Moreover, the data and information that are available are gener-ally related to either the characteristics of the ecological system or the charac-teristics of the social system, not to the all-important interactions betweenthese systems. Finally, the scientific and assessment tools and models avail-able to undertake a cross-scale integrated assessment and to project futurechanges in ecosystem services are only now being developed. Despite thesechallenges, the MA was able to provide considerable information relevant tomost of the focal questions. And by identifying gaps in data and informationthat prevent policy-relevant questions from being answered, the assessmentcan help to guide research and monitoring that may allow those questions tobe answered in future assessments.
................. 11432$ $MEA 10-11-05 14:48:51 PS

Contents
Foreword . . . . . . . . . . . . . . . . . . . . . . . . . . . . . . . . . . . . . . . . . . . . . . . . . . . . . . . . . . . . . . . . . . . . . . . . . . . . xiii
Preface . . . . . . . . . . . . . . . . . . . . . . . . . . . . . . . . . . . . . . . . . . . . . . . . . . . . . . . . . . . . . . . . . . . . . . . . . . . . . . xv
Acknowledgments . . . . . . . . . . . . . . . . . . . . . . . . . . . . . . . . . . . . . . . . . . . . . . . . . . . . . . . . . . . . . . . . . . . . . . xix
Reader’s Guide . . . . . . . . . . . . . . . . . . . . . . . . . . . . . . . . . . . . . . . . . . . . . . . . . . . . . . . . . . . . . . . . . . . . . . . . xxi
Summary: Ecosystems and Their Services around the Year 2000 . . . . . . . . . . . . . . . . . . . . . . . . . . . . . . . . . . . . 1
Part I: General Concepts and Analytical ApproachesChapter 1. MA Conceptual Framework . . . . . . . . . . . . . . . . . . . . . . . . . . . . . . . . . . . . . . . . . . . . . . . . . . . . 25Chapter 2. Analytical Approaches for Assessing Ecosystem Condition and Human Well-being . . . . . . . . . . . . 37Chapter 3. Drivers of Ecosystem Change: Summary Chapter . . . . . . . . . . . . . . . . . . . . . . . . . . . . . . . . . . . . . 73Chapter 4. Biodiversity . . . . . . . . . . . . . . . . . . . . . . . . . . . . . . . . . . . . . . . . . . . . . . . . . . . . . . . . . . . . . . . . 77Chapter 5. Ecosystem Conditions and Human Well-being . . . . . . . . . . . . . . . . . . . . . . . . . . . . . . . . . . . . . . . 123Chapter 6. Vulnerable Peoples and Places . . . . . . . . . . . . . . . . . . . . . . . . . . . . . . . . . . . . . . . . . . . . . . . . . . . 143
Part II: An Assessment of Ecosystem ServicesChapter 7. Fresh Water . . . . . . . . . . . . . . . . . . . . . . . . . . . . . . . . . . . . . . . . . . . . . . . . . . . . . . . . . . . . . . . 165Chapter 8. Food . . . . . . . . . . . . . . . . . . . . . . . . . . . . . . . . . . . . . . . . . . . . . . . . . . . . . . . . . . . . . . . . . . . . 209Chapter 9. Timber, Fuel, and Fiber . . . . . . . . . . . . . . . . . . . . . . . . . . . . . . . . . . . . . . . . . . . . . . . . . . . . . . . 243Chapter 10. New Products and Industries from Biodiversity . . . . . . . . . . . . . . . . . . . . . . . . . . . . . . . . . . . . . 271Chapter 11. Biodiversity Regulation of Ecosystem Services . . . . . . . . . . . . . . . . . . . . . . . . . . . . . . . . . . . . . . 297Chapter 12. Nutrient Cycling . . . . . . . . . . . . . . . . . . . . . . . . . . . . . . . . . . . . . . . . . . . . . . . . . . . . . . . . . . . 331Chapter 13. Climate and Air Quality . . . . . . . . . . . . . . . . . . . . . . . . . . . . . . . . . . . . . . . . . . . . . . . . . . . . . . 355Chapter 14. Human Health: Ecosystem Regulation of Infectious Diseases . . . . . . . . . . . . . . . . . . . . . . . . . . . 391Chapter 15. Waste Processing and Detoxification . . . . . . . . . . . . . . . . . . . . . . . . . . . . . . . . . . . . . . . . . . . . . 417Chapter 16. Regulation of Natural Hazards: Floods and Fires . . . . . . . . . . . . . . . . . . . . . . . . . . . . . . . . . . . . . 441Chapter 17. Cultural and Amenity Services . . . . . . . . . . . . . . . . . . . . . . . . . . . . . . . . . . . . . . . . . . . . . . . . . . 455
Part III: An Assessment of Systems from which Ecosystem Services Are DerivedChapter 18. Marine Fisheries Systems . . . . . . . . . . . . . . . . . . . . . . . . . . . . . . . . . . . . . . . . . . . . . . . . . . . . . . 477Chapter 19. Coastal Systems . . . . . . . . . . . . . . . . . . . . . . . . . . . . . . . . . . . . . . . . . . . . . . . . . . . . . . . . . . . . . 513Chapter 20. Inland Water Systems . . . . . . . . . . . . . . . . . . . . . . . . . . . . . . . . . . . . . . . . . . . . . . . . . . . . . . . . 551Chapter 21. Forest and Woodland Systems . . . . . . . . . . . . . . . . . . . . . . . . . . . . . . . . . . . . . . . . . . . . . . . . . . 585Chapter 22. Dryland Systems . . . . . . . . . . . . . . . . . . . . . . . . . . . . . . . . . . . . . . . . . . . . . . . . . . . . . . . . . . . . 623Chapter 23. Island Systems . . . . . . . . . . . . . . . . . . . . . . . . . . . . . . . . . . . . . . . . . . . . . . . . . . . . . . . . . . . . . . 663Chapter 24. Mountain Systems . . . . . . . . . . . . . . . . . . . . . . . . . . . . . . . . . . . . . . . . . . . . . . . . . . . . . . . . . . . 681Chapter 25. Polar Systems . . . . . . . . . . . . . . . . . . . . . . . . . . . . . . . . . . . . . . . . . . . . . . . . . . . . . . . . . . . . . . 717Chapter 26. Cultivated Systems . . . . . . . . . . . . . . . . . . . . . . . . . . . . . . . . . . . . . . . . . . . . . . . . . . . . . . . . . . 745Chapter 27. Urban Systems . . . . . . . . . . . . . . . . . . . . . . . . . . . . . . . . . . . . . . . . . . . . . . . . . . . . . . . . . . . . . 795
Part IV: SynthesisChapter 28. Synthesis: Condition and Trends in Systems and Services, Trade-offs for Human Well-being, andImplications for the Future . . . . . . . . . . . . . . . . . . . . . . . . . . . . . . . . . . . . . . . . . . . . . . . . . . . . . . . . . . . . . . 827
PAGE xi................. 11432$ CNTS 10-11-05 14:48:59 PS

Appendix A. Color Maps and Figures . . . . . . . . . . . . . . . . . . . . . . . . . . . . . . . . . . . . . . . . . . . . . . . . . . . . . . . . 839Appendix B. Authors . . . . . . . . . . . . . . . . . . . . . . . . . . . . . . . . . . . . . . . . . . . . . . . . . . . . . . . . . . . . . . . . . . . . 883Appendix C. Abbreviations and Acronyms . . . . . . . . . . . . . . . . . . . . . . . . . . . . . . . . . . . . . . . . . . . . . . . . . . . . 889Appendix D. Glossary . . . . . . . . . . . . . . . . . . . . . . . . . . . . . . . . . . . . . . . . . . . . . . . . . . . . . . . . . . . . . . . . . . . 893
Index . . . . . . . . . . . . . . . . . . . . . . . . . . . . . . . . . . . . . . . . . . . . . . . . . . . . . . . . . . . . . . . . . . . . . . . . . . . . . . . 901
PAGE xii................. 11432$ CNTS 10-11-05 14:48:59 PS

Foreword
The Millennium Ecosystem Assessment was called for by UnitedNations Secretary-General Kofi Annan in 2000 in his report tothe UN General Assembly, We the Peoples: The Role of the UnitedNations in the 21st Century. Governments subsequently supportedthe establishment of the assessment through decisions taken bythree international conventions, and the MA was initiated in2001. The MA was conducted under the auspices of the UnitedNations, with the secretariat coordinated by the United NationsEnvironment Programme, and it was governed by a multistake-holder board that included representatives of international institu-tions, governments, business, NGOs, and indigenous peoples.The objective of the MA was to assess the consequences of eco-system change for human well-being and to establish the scientificbasis for actions needed to enhance the conservation and sustain-able use of ecosystems and their contributions to human well-being.
This volume has been produced by the MA Condition andTrends Working Group and assesses the state of knowledge onecosystems and their services, the drivers of ecosystem change,and the consequences of ecosystem change for human well-being.The material in this report has undergone two extensive roundsof peer review by experts and governments, overseen by an inde-pendent Board of Review Editors.
This is one of four volumes (Current State and Trends, Scenarios,Policy Responses, and Multiscale Assessments) that present the tech-nical findings of the Assessment. Six synthesis reports have alsobeen published: one for a general audience and others focused onissues of biodiversity, wetlands and water, desertification, health,and business and ecosystems. These synthesis reports were pre-pared for decision-makers in these different sectors, and they syn-thesize and integrate findings from across all of the WorkingGroups for ease of use by those audiences.
This report and the other three technical volumes provide aunique foundation of knowledge concerning human dependenceon ecosystems as we enter the twenty-first century. Never beforehas such a holistic assessment been conducted that addresses mul-tiple environmental changes, multiple drivers, and multiple link-ages to human well-being. Collectively, these reports reveal boththe extraordinary success that humanity has achieved in shapingecosystems to meet the needs of growing populations and econo-
PAGE xiii
xiii
mies and the growing costs associated with many of these changes.They show us that these costs could grow substantially in thefuture, but also that there are actions within reach that could dra-matically enhance both human well-being and the conservationof ecosystems.
A more exhaustive set of acknowledgments appears later inthis volume but we want to express our gratitude to the membersof the MA Board, Board Alternates, Exploratory Steering Com-mittee, Assessment Panel, Coordinating Lead Authors, Lead Au-thors, Contributing Authors, Board of Review Editors, andExpert Reviewers for their extraordinary contributions to thisprocess. (The list of reviewers is available at www.MAweb.org.)We also would like to thank the MA Secretariat and in particularthe staff of the Condition and Trends Working Group TechnicalSupport Unit for their dedication in coordinating the productionof this volume, as well as the World Conservation MonitoringCentre, which housed this TSU.
We would particularly like to thank the Co-chairs of the Con-dition and Trends Working Group, Dr. Rashid Hassan and Dr.Robert Scholes, and the TSU Coordinator, Neville Ash, for theirskillful leadership of this Working Group and their contributionsto the overall assessment.
Dr. Robert T. WatsonMA Board Co-chairChief Scientist, The World Bank
Dr. A.H. ZakriMA Board Co-chairDirector, Institute for Advanced StudiesUnited Nations University
................. 11432$ FRWD 10-11-05 14:49:06 PS

PAGE xiv................. 11432$ FRWD 10-11-05 14:49:06 PS

Preface
The Current State and Trends assessment presents the findings ofthe Condition and Trends Working Group of the MillenniumEcosystem Assessment. This volume documents the current con-dition and recent trends of the world’s ecosystems, the servicesthey provide, and associated human well-being around the year2000. Its primary goal is to provide decision-makers, ecosystemmanagers, and other potential users with objective informationand analyses of historical trends and dynamics of the interactionbetween ecosystem change and human well-being. This assess-ment establishes a baseline for the current condition of ecosystemsat the turn of the millennium. It also assesses how changes inecosystems have affected the underlying capacity of ecosystems tocontinue to provide these services in the near future, providing alink to the Scenarios Working Group’s report. Finally, it considersrecent trends in ecosystem conditions that have been the result ofhistorical responses to ecosystem service problems, providing alink to the Responses Working Group’s report.
Although centered on the year 2000, the temporal scope ofthis assessment includes the ‘‘relevant past’’ to the ‘‘foreseeablefuture.’’ In practice, this means analyzing trends during the latterdecades of the twentieth century and extrapolating them forwardfor a decade or two into the twenty-first century. At the pointwhere the projections become too uncertain to be sustained, theScenarios Working Group takes over the exploration of alternatefutures.
The Condition and Trends assessment aims to synthesize andadd to information already available from other sources, whetherin the primary scientific literature or already in assessment form.In many instances this information is not reproduced in this vol-ume but is built upon to report additional findings here. So thisvolume does not, for example, provide an assessment of the sci-ence of climate change per se, as that is reported in the findingsof the Intergovernmental Panel on Climate Change, but thefindings of the IPCC are used here as a basis to present informa-tion on the consequences of climate change for ecosystem ser-vices.
A summary of the process leading to this document is pro-vided in Figure A.
The document has three main parts plus a synthesis chapterand supporting material. (See Figure B.) After the introductorymaterial in Part I, the findings from the technical assessments arepresented in two orthogonal ways: Part II deals with individualcategories of ecosystem services, viewed across all the ecosystemtypes from which they are derived, while Part III analyses thevarious systems from which bundles of services are derived. Suchorganization allows the chapters to be read as standalone docu-ments and assists readers with thematic interests. In Part IV, thesynthesis chapter pulls out the key threads of findings from theearlier parts to construct an integrated narrative of the key issuesrelating ecosystem change (through changes in ecosystem ser-vices) to impacts on human well-being.
PAGE xv
xv
2000
2001
2002
2003
2004
2005
Initial planning
Publication of Ecosystems and
Human Well-being
Publication in four technical reports and Summaries
Syntheses documents published
First technical design meeting, Bilthoven
Funds secured, Board appointed, and MA launched
Publication of Pilot Assessment
of Global Ecosystems
WG chairs and scientific panel appointed
Second technical design meeting, Cape Town
Condition and Trends
Working GroupConceptual Frameworkdiscussions and review First meeting: Frascatti
Second meeting: São Carlos
Third meeting: Chantilly, VA
Scenarios, Responses, and Sub-global Working Groups undergo similar process
Fourth meeting: Prague
Two rounds of expert andgovernmental review, and incorporation of review comments
Figure A. Schedule of the Condition and Trends Working GroupAssessment
Appendices provide an extensive glossary of terms, abbrevia-tions, and acronyms; information on authors; and color graphics.
Part I: General Concepts and AnalyticalApproachesThe first part of this report introduces the overarching concep-tual, methodological, and crosscutting themes of the MA inte-grated approach, and for this reason it precedes the technicalassessment parts. Following the executive summary of the MAconceptual framework volume (Ecosystems and Human Well-being:A Framework for Assessment), which is Chapter 1, the analyticalapproaches to a global assessment of ecosystems and ecosystemservices are outlined in Chapter 2. Chapter 3 provides a sum-mary assessment of the most important changes in key indirectand direct drivers of ecosystem change over the last part of the
................. 11432$ PREF 10-11-05 14:49:16 PS

xvi Ecosystems and Human Well-being: Current State and Trends
General concepts and analytical approaches
Ecosystem Services• Fresh water• Food• Timber, fuel, and fiber• New biodiversity products and industries• Biological regulation• Nutrient cycling• Climate and air quality• Ecosystem regulation of infectious diseases• Waste processing and detoxification• Regulation of floods and fires• Cultural and amenity services
• MA conceptual framework• Analytical approaches• Drivers of change• Biodiversity• Ecosystem conditions and human well-being• Vulnerable peoples and places
Systems
• Marine• Coastal• Inland water• Forest and woodland• Dryland• Island• Mountain• Polar• Cultivated• Urban
Synthesis
Figure B. Structure of the Condition and Trends Working GroupAssessment Report
twentieth century, and considers some of the key interactions be-tween these drivers (the full assessment of drivers, of which thischapter is a summary, can be found in the Scenarios volume, Chap-ter 7). The remaining chapters in Part I—on biodiversity (Chap-ter 4), human well-being (Chapter 5), and vulnerability (Chapter6)—introduce issues at a global scale but also contain a synthesisof material drawn from chapters in Parts II and III.
Each of these introductory overarching chapters aims to dealwith the general issues related to its topic, leaving the specificsembedded in later chapters. This is intended to enhance readabil-ity and to help reduce redundancy across the volume. For exam-ple, Chapter 2 seeks to give an overview of the types of analyticalapproaches and methods used in the assessment, but not providea recipe for conducting specific assessments, and Chapter 3 aimsto provide the background to the various drivers that wouldotherwise need to be discussed in multiple subsequent chapters.
Biodiversity provides composition, structure, and function toecosystems. The amount and diversity of life is an underlying ne-cessity for the provision of all ecosystem services, and for thisreason Chapter 4 is included in the introductory section ratherthan as a chapter in the part on ecosystem services. It outlinesthe key global trends in biodiversity, our state of knowledge onbiodiversity in terms of abundance and distribution, and the roleof biodiversity in the functioning of ecosystems. Later chaptersconsider more fully the role of biodiversity in the provision ofecosystem services.
The consequences of ecosystem change for human well-beingare the core subject of the MA. Chapter 5 presents our state of
PAGE xvi
knowledge on the links between ecosystems and human well-beingand outlines the broad patterns in well-being around the world.
Neither the distribution of ecosystem services nor the changein these services is evenly distributed across places and societies.Certain ecosystems, locations, and people are more at risk fromchanges in the supply of services than others. Chapter 6, on vul-nerable peoples and places, identifies these locations and groupsand examines why they are particularly vulnerable to changes inecosystems and ecosystem services.
Part II: An Assessment of Ecosystem ServicesThe Condition and Trends assessment sets out to be comprehen-sive in its treatment of ecosystem services but not exhaustive. Thelist of ‘‘benefits that people derive from ecosystems’’ grows con-tinuously with further investigation. The 11 groups of servicescovered by this assessment deal with issues that are of vital impor-tance almost everywhere in the world and represent, in the opin-ion of the Working Group, the main services that are mostimportant for human well-being and are most affected by changesin ecosystem conditions. The MA only considers ecosystem ser-vices that have a nexus with life on Earth (biodiversity). Forexample, while gemstones and tidal energy can both provide ben-efits to people, and both are found within ecosystems, they arenot addressed in this report since their generation does not de-pend on the presence of living organisms. The ecosystem servicesassessed and the chapter titles in this part are:
Provisioning services:• Fresh Water• Food• Timber, Fiber, and Fuel• New Products and Industries from Biodiversity
Regulating and supporting services:• Biological Regulation of Ecosystem Services• Nutrient Cycling• Climate and Air Quality• Human Health: Ecosystem Regulation of Infectious Diseases• Waste Processing and Detoxification• Regulation of Natural Hazards: Floods and Fires
Cultural services:• Cultural and Amenity Services
Each of the chapters in this section in fact deals with a clusterof several related ecosystem services. For instance, the chapter onfood covers the provision of numerous cereal crops, vegetablesand fruits, beverages, livestock, fish, and other edible products;the chapter on nutrient cycling addresses the benefits derivedfrom a range of nutrient cycles, but with a focus on nitrogen; andthe chapter on cultural and amenity services covers a range ofsuch services, including recreation, aesthetic, and spiritual ser-vices. The length of the treatment afforded to each service reflectsseveral factors: our assessment of its relative importance to humanwell-being; the scope and complexity of the topic; the degree towhich it has been treated in other assessments (thus reducing theneed for a comprehensive treatment here); and the amount ofinformation that is available to be assessed.
Part II considers services from each of the four MA categories:provisioning, regulating, cultural, and supporting services. Eachservice chapter has been developed to cover the same types ofinformation. First the service is defined. Then, for each service,the spatial distribution of supply and demand is quantified, alongwith recent trends. The direct and indirect drivers of change inthe service are analyzed. And finally the consequences of thechanges in the service for human well-being are examined andquantified to the degree possible.
................. 11432$ PREF 10-11-05 14:49:19 PS

xviiPreface
Examples are given of the responses by decision-makers atvarious levels (from the individual to the international) to issuesrelating to change in service supply. Both successful and unsuc-cessful interventions are described, as supportive material for thePolicy Responses volume.
Part III: An Assessment of Systems from whichEcosystem Services Are DerivedThe Condition and Trends Working Group uses the term ‘‘sys-tems’’ in describing these chapters rather than the term ‘‘ecosys-tems.’’ This is for several reasons. First, the ‘‘systems’’ used areessentially reporting units, defined for pragmatic reasons. Theyrepresent easily recognizable broad categories of landscape or sea-scape, with their included human systems, and typically representunits or themes of management or intervention interest. Ecosys-tems, on the other hand, are theoretically defined by the interac-tions of their components.
The 10 selected systems assessed here cover much larger areasthan most ecosystems in the strict sense and include areas of sys-tem type that are far apart (even isolated) and that thus interactonly weakly. In fact, there may be stronger local interactions withembedded fragments of ecosystems of a different type rather thanwithin the nominal type of the system. The ‘‘cultivated system,’’for instance, considers a landscape where crop farming is a pri-mary activity but that probably includes, as an integral part of thatsystem, patches of rangeland, forest, water, and human settle-ments.
Second, while it is recognized that humans are always part ofecosystems, the definitions of the systems used in this report takespecial note of the main patterns of human use. The systems aredefined around the main bundles of services they typically supplyand the nature of the impacts that human use has on those ser-vices.
Information within the systems chapters is frequently pre-sented by subsystems where appropriate. For example, the forestchapter deals separately with tropical, temperate, and boreal for-ests because they deliver different services; likewise, the coastalchapter deals explicitly with various coastal subsystems, such asmangroves, corals, and seagrasses.
The 10 system categories and the chapter titles in this part are:• Marine Fisheries Systems• Coastal Systems• Inland Water Systems• Forest and Woodland Systems• Dryland Systems• Island Systems• Mountain Systems• Polar Systems• Cultivated Systems• Urban Systems
Definitions for these system categories can be found in Box 1.3in Chapter 1. These system categories are not mutually exclusive,and some overlap spatially. For instance, mountain systems containareas of forest systems, dryland systems, inland water systems, culti-vated systems, and urban systems, while coastal systems include com-ponents of all of the above, including mountain systems. Due to thisoverlap, simple summations of services across systems for global totalsshould be avoided (an exercise that the MA has avoided in general):some may be double-counted, while others may be underrepre-sented. Notwithstanding these caveats, the systems have been de-fined to cover most of the Earth’s surface and not to overlapunnecessarily. In many instances the boundaries between systems are
PAGE xvii
diffuse, but not arbitrary. For instance, the coastal system blendsseamlessly into the marine system on the one hand and the landsystems on the other. The 50-meter depth distinction betweencoastal and marine separates the systems strongly influenced by ac-tions on the land from those overwhelmingly influenced by fishing.There is significant variation in the area of coverage of each system.
The system definitions are also not exhaustive, and no attempthas been made to cover every part of the global surface. Although�99% of global surface area has been covered in this assessment,there are just over 5 million square kilometers of terrestrial landsurface not included spatially within any of the MA system bound-aries. These areas are generally found within grassland, savanna, andforest biomes, and they contain a mix of land cover classes—generally grasslands, degraded forests, and marginal agriculturallands—that are not picked up within the mapping definitions forthe system boundaries. However, while these excluded areas maynot appear in the various statistics produced along system bound-aries, the issues occurring in these areas relating to ecosystem servicesare well covered in the various services chapters, which do not ex-clude areas of provision outside MA system boundaries.
The main motivation for dealing with ‘‘systems’’ as well as‘‘services’’ is that the former perspective allows us to examineinteractions between the services delivered from a single location.These interactions can take the form of trade-offs (that is, wherepromoting one service reduces the supply of another service),win-win situations (where a single management package en-hances the supply of several services), or synergies, where the si-multaneous use of services raises or depresses both more than ifthey were independently used.
The chapters in Part III all present information in a broadlysimilar manner: system description, including a map and descrip-tive statistics for the system and its subsystems; quantification ofthe services it delivers and their contribution to well-being; recenttrends in the condition of the system and its capacity to provideservices; processes leading to changes in the system; the choicesand resultant trade-offs between systems and between serviceswithin the system; and the contributions of the system to humanwell-being.
Part IV: SynthesisChapter 28 does not intend to be a summary. That task is left tothe summaries or Main Messages of each chapter and to the Sum-mary at the start of this volume. Instead, the synthesis chapterconstructs an integrated narrative, tracing the principal causes ofecosystem change, the consequences for ecosystems and ecosys-tem services, and the resultant main impacts on human well-being. The chapter considers the key intellectual issues arisingfrom the Condition and Trends assessment and presents an assess-ment of our underlying knowledge on the consequences of eco-system change for people.
Supporting material for many of the chapters, and further de-tails of the Millennium Ecosystem Assessment, including of thevarious sub-global assessments, plus a full list of reviewers, can befound at the MA Web site at www.MAweb.org.
Rashid HassanUniversity of Pretoria, South Africa
Robert ScholesCouncil for Science and Industrial Research, South Africa
Neville J. AshUNEP-World Conservation Monitoring Centre
................. 11432$ PREF 10-11-05 14:49:20 PS

PAGE xviii................. 11432$ PREF 10-11-05 14:49:21 PS

Acknowledgments
First and foremost, we would like to thank the MA Conditionand Trends Working Group for their hard work, and for all thestimulating discussions we had over the course of the project.Special thanks are also due to the MA Secretariat staff whoworked tirelessly on this project:
Walter V. Reid—Director
AdministrationNicole Khi—Program CoordinatorChan Wai Leng—Program CoordinatorBelinda Lim—Administrative OfficerTasha Merican—Program Coordinator
Sub-GlobalMarcus J. Lee—Technical Support Unit Coordinator and MA
Deputy DirectorCiara Raudsepp-Hearne—TSU Coordinator
Condition and TrendsNeville J. Ash—TSU CoordinatorDalene du Plessis—Program AssistantMampiti Matete—TSU Coordinator
ScenariosElena Bennett—TSU CoordinatorVeronique Plocq-Fichelet—Program AdministratorMonika B. Zurek—TSU Coordinator
ResponsesPushpam Kumar—TSU CoordinatorMeenakshi Rathore—Program CoordinatorHenk Simons—TSU Coordinator
Engagement and OutreachChristine Jalleh—Communications OfficerNicolas Lucas—Engagement and Outreach DirectorValerie Thompson—Associate
Other StaffJohn Ehrmann—Lead FacilitatorKeisha-Maria Garcia—Research AssistantLori Han—Publications ManagerSara Suriani—Conference ManagerJillian Thonell—Data Coordinator
InternsEmily Cooper, Elizabeth Wilson, Lina Cimarrusti
We would like to acknowledge the contributions of all of theauthors of this book, and the support provided by their institu-tions that enabled their participation. We would like to thank the
PAGE xix
xix
host organizations of the MA Technical Support Units—WorldFish Center (Malaysia); UNEP-World Conservation Moni-toring Centre (United Kingdom); Institute of Economic Growth(India); National Institute of Public Health and the Environment(Netherlands); University of Pretoria (South Africa), U.N. Foodand Agriculture Organization; World Resources Institute, Merid-ian Institute, and Center for Limnology of the University ofWisconsin-Madison (all in the United States); Scientific Commit-tee on Problems of the Environment (France); and InternationalMaize and Wheat Improvement Center (Mexico)—for the sup-port they provided to the process.
We thank several individuals who played particularly criticalroles: Linda Starke, Nigel Varty, and Lynn Newton for editingthe report; Hyacinth Billings and Caroline Taylor for providinginvaluable advice on the publication process; Maggie Powell forpreparing the page design and all the Figures and Tables; ElizabethWilson for helping to proof the Figures and Tables; Carol Inskippand Gill Bunting for checking chapter citations and references;and Ian May, Corinna Ravilious, and Simon Blythe for the prepa-ration of numerous graphics and GIS-derived statistics. And wethank the other MA volunteers, the administrative staff of the hostorganizations, and colleagues in other organizations who wereinstrumental in facilitating the process: Mariana Sanchez Abregu,Isabelle Alegre, Adlai Amor, Emmanuelle Bournay, Herbert Cau-dill, Habiba Gitay, Helen Gray, Sherry Heileman, Norbert Hen-ninger, Toshi Honda, Francisco Ingouville, Timothy Johnson,Humphrey Kagunda, Brygida Kubiak, Nicolas Lapham, Liz Lev-itt, Elaine Marshall, Christian Marx, Stephanie Moore, John Mu-koza, Arivudai Nambi, Laurie Neville, Adrian Newton, CarolinaKatz Reid, Liana Reilly, Philippe Rekacewicz, Carol Rosen,Anne Schram, Jeanne Sedgwick, Tang Siang Nee, Darrell Taylor,Tutti Tischler, Dan Tunstall, Woody Turner, Mark Valentine,Gillian Warltier, Elsie Velez Whited, Kaveh Zahedi, and MarkZimsky.
For technical assistance with figures and references in Chapter13, we thank Natalia Ungelenk and Silvana Schott, and for theirwork in developing, applying, and constructing tables from theGridded Rural-Urban Mapping Project, which was used not onlyin Chapter 27 but in several others as well, we would like tothank Francesca Pozzi, Greg Booma, Adam Storeygard, BridgetAnderson, Greg Yetman, and Lisa Lukang. Kai Lee, TerryMcGee, and Priscilla Connolly deserve special mention for theirreview of Chapter 27, as does Maria Furhacker for her review ofChapter 15.
We thank the members of the MA Board and its chairs, Rob-ert Watson and A.H. Zakri, the members of the MA AssessmentPanel and its chairs, Angela Cropper and Harold Mooney, and themembers of the MA Review Board and its chairs, Jose Sarukhanand Anne Whyte, for their guidance and support for this WorkingGroup. We also thank the current and previous Board Alternates:Ivar Baste, Jeroen Bordewijk, David Cooper, Carlos Corvalan,Nick Davidson, Lyle Glowka, Guo Risheng, Ju Hongbo, Ju Jin,
................. 11432$ $ACK 10-11-05 14:49:28 PS

xx Ecosystems and Human Well-being: Current State and Trends
Kagumaho (Bob) Kakuyo, Melinda Kimble, Kanta Kumari, Ste-phen Lonergan, Charles Ian McNeill, Joseph Kalemani Mulon-goy, Ndegwa Ndiang’ui, and Mohamed Maged Younes. Wethank the past members of the MA Board whose contributionswere instrumental in shaping the MA focus and process, includingPhilbert Brown, Gisbert Glaser, He Changchui, Richard Helmer,Yolanda Kakabadse, Yoriko Kawaguchi, Ann Kern, Roberto Len-ton, Corinne Lepage, Hubert Markl, Arnulf Muller-Helbrecht,Seema Paul, Susan Pineda Mercado, Jan Plesnik, Peter Raven,Cristian Samper, Ola Smith, Dennis Tirpak, Alvaro Umana, andMeryl Williams. We wish to also thank the members of the Ex-ploratory Steering Committee that designed the MA project in1999–2000. This group included a number of the current andpast Board members, as well as Edward Ayensu, Daniel Claasen,Mark Collins, Andrew Dearing, Louise Fresco, Madhav Gadgil,Habiba Gitay, Zuzana Guziova, Calestous Juma, John Krebs, JaneLubchenco, Jeffrey McNeely, Ndegwa Ndiang’ui, Janos Pasztor,Prabhu L. Pingali, Per Pinstrup-Andersen, and Jose Sarukhan. Wethank Ian Noble and Mingsarn Kaosa-ard for their contributionsas members of the Assessment Panel during 2002.
We would particularly like to acknowledge the input of thehundreds of individuals, institutions, and governments (see list atwww.MAweb.org) who reviewed drafts of the MA technical andsynthesis reports. We also thank the thousands of researcherswhose work is synthesized in this report. And we would like toacknowledge the support and guidance provided by the secretari-ats and the scientific and technical bodies of the Convention onBiological Diversity, the Ramsar Convention on Wetlands, theConvention to Combat Desertification, and the Convention onMigratory Species, which have helped to define the focus of theMA and of this report.
We also want to acknowledge the support of a large numberof nongovernmental organizations and networks around theworld that have assisted in outreach efforts: Alexandria University,Argentine Business Council for Sustainable Development, Asoci-acion Ixacavaa (Costa Rica), Arab Media Forum for Environmentand Development, Brazilian Business Council on Sustainable De-velopment, Charles University (Czech Republic), CambridgeConservation Forum, Chinese Academy of Sciences, EuropeanEnvironmental Agency, European Union of Science Journalists’Associations, EIS-Africa (Burkina Faso), Forest Institute of theState of Sao Paulo, Foro Ecologico (Peru), Fridtjof Nansen Insti-tute (Norway), Fundacion Natura (Ecuador), Global Develop-ment Learning Network, Indonesian Biodiversity Foundation,Institute for Biodiversity Conservation and Research–Academy ofSciences of Bolivia, International Alliance of Indigenous Peoples
PAGE xx
of the Tropical Forests, IUCN office in Uzbekistan, IUCN Re-gional Offices for West Africa and South America, PermanentInter-States Committee for Drought Control in the Sahel, Peru-vian Society of Environmental Law, Probioandes (Peru), Profes-sional Council of Environmental Analysts of Argentina, RegionalCenter AGRHYMET (Niger), Regional Environmental Centrefor Central Asia, Resources and Research for Sustainable Devel-opment (Chile), Royal Society (United Kingdom), StockholmUniversity, Suez Canal University, Terra Nuova (Nicaragua), TheNature Conservancy (United States), United Nations University,University of Chile, University of the Philippines, World Assem-bly of Youth, World Business Council for Sustainable Develop-ment, WWF-Brazil, WWF-Italy, and WWF-US.
We are extremely grateful to the donors that provided majorfinancial support for the MA and the MA Sub-global Assessments:Global Environment Facility; United Nations Foundation; Davidand Lucile Packard Foundation; World Bank; ConsultativeGroup on International Agricultural Research; United NationsEnvironment Programme; Government of China; Ministry ofForeign Affairs of the Government of Norway; Kingdom of SaudiArabia; and the Swedish International Biodiversity Programme.We also thank other organizations that provided financial support:Asia Pacific Network for Global Change Research; Association ofCaribbean States; British High Commission, Trinidad & Tobago;Caixa Geral de Depositos, Portugal; Canadian International De-velopment Agency; Christensen Fund; Cropper Foundation, En-vironmental Management Authority of Trinidad and Tobago;Ford Foundation; Government of India; International Councilfor Science; International Development Research Centre; IslandResources Foundation; Japan Ministry of Environment; LagunaLake Development Authority; Philippine Department of Envi-ronment and Natural Resources; Rockefeller Foundation; U.N.Educational, Scientific and Cultural Organization; UNEP Divi-sion of Early Warning and Assessment; United Kingdom Depart-ment for Environment, Food and Rural Affairs; United StatesNational Aeronautic and Space Administration; and Universidadede Coimbra, Portugal. Generous in-kind support has been pro-vided by many other institutions (a full list is available at www.MAweb.org). The work to establish and design the MA wassupported by grants from The Avina Group, The David and Lu-cile Packard Foundation, Global Environment Facility, Director-ate for Nature Management of Norway, Swedish InternationalDevelopment Cooperation Authority, Summit Foundation,UNDP, UNEP, United Nations Foundation, United StatesAgency for International Development, Wallace Global Fund,and World Bank.
................. 11432$ $ACK 10-11-05 14:49:28 PS

Reader’s Guide
The four technical reports present the findings of each of the MAWorking Groups: Condition and Trends, Scenarios, Responses,and Sub-global Assessments. A separate volume, Our HumanPlanet, presents the summaries of all four reports in order to offera concise account of the technical reports for decision-makers. Inaddition, six synthesis reports were prepared for ease of use byspecific audiences: Synthesis (general audience), CBD (biodiver-sity), UNCCD (desertification), Ramsar Convention (wetlands),business and industry, and the health sector. Each MA sub-globalassessment will also produce additional reports to meet the needsof its own audiences.
All printed materials of the assessment, along with core data and alist of reviewers, are available at www.MAweb.org. In this volume,Appendix A contains color maps and figures. Appendix B lists allthe authors who contributed to this volume. Appendix C lists the
PAGE xxi
xxi
acronyms and abbreviations used in this report and Appendix Dis a glossary of terminology used in the technical reports. Through-out this report, dollar signs indicate U.S. dollars and ton meanstonne (metric ton). Bracketed references within the Summary areto chapters within this volume.
In this report, the following words have been used where ap-propriate to indicate judgmental estimates of certainty, based onthe collective judgment of the authors, using the observationalevidence, modeling results, and theory that they have examined:very certain (98% or greater probability), high certainty (85–98%probability), medium certainty (65%–58% probability), low cer-tainty (52–65% probability), and very uncertain (50–52% proba-bility). In other instances, a qualitative scale to gauge the level ofscientific understanding is used: well established, established butincomplete, competing explanations, and speculative. Each timethese terms are used they appear in italics.
................. 11432$ READ 10-11-05 14:49:35 PS

PAGE xxii................. 11432$ READ 10-11-05 14:49:35 PS

Ecosystems and Human Well-being:Current State and Trends, Volume 1
PAGE xxiii................. 11432$ HFTL 10-11-05 14:49:41 PS

PAGE xxiv................. 11432$ HFTL 10-11-05 14:49:41 PS

Summary: Ecosystems and Their Services around theYear 2000
Core Writing Team: Robert Scholes, Rashid Hassan, Neville J. AshExtended Writing Team: Condition and Trends Working Group
CONTENTS
1. Human Well-being and Life on Earth . . . . . . . . . . . . . . . . . . . . . . . . . . . 2• Inescapable Link between Ecosystem Condition and Human Well-being• Special Role of Biodiversity in Supplying Ecosystem Services• Factors Causing Changes in Ecosystems
2. Trends in Ecosystem Services . . . . . . . . . . . . . . . . . . . . . . . . . . . . . . . 6• Provisioning Services• Regulating Services• Cultural Services• Supporting Services
3. How Are Key Ecological Systems Doing? . . . . . . . . . . . . . . . . . . . . . . . 14• Freshwater Systems: Wetlands, Rivers, and Lakes• Dryland Systems: Deserts, Semiarid, and Dry Subhumid Rangelands• Forests, Including Woodlands and Tree Plantations• Marine and Coastal Systems• Island Systems• Cultivated Systems: Croplands, Planted Pastures, and Agroforestry• Urban Systems• Polar Systems• Mountain Systems
4. Limits, Trade-offs, and Knowledge . . . . . . . . . . . . . . . . . . . . . . . . . . . . . 20• Limits and Thresholds in Coupled Human-Ecological Systems• Understanding the Trade-offs Associated with Our Actions• Knowledge and Uncertainty• A Call for Action
PAGE 1
1
................. 11432$ $SDM 10-11-05 14:49:47 PS

2 Ecosystems and Human Well-being: Current State and Trends
Human Well-being and Life on Earth
• Human well-being depends, among other things, on the contin-ued supply of services obtained from ecosystems.
• Human actions during the last 50 years have altered ecosys-tems to an extent and degree unprecedented in human history.The consequences for human well-being have been mixed.Health and wealth have, on average, improved, but the benefitsare unevenly distributed and further improvement may be lim-ited by an insufficient supply of key ecosystem services.
• Biological diversity is a necessary condition for the delivery ofall ecosystem services. In most cases, greater biodiversity isassociated with a larger or more dependable supply of ecosys-tem services. Diversity of genes and populations is currentlydeclining in most places in the world, along with the area ofnear-natural ecosystems.
Inescapable Link between Ecosystem Condition andHuman Well-being
All people depend on the services supplied by ecosystems,either directly or indirectly. Services are delivered both by‘‘near-natural’’ ecosystems, such as rangelands, oceans, and forests,and by highly managed ecosystems such as cultivated or urbanlandscapes.
Human well-being, by several measures and on averageacross and within many societies, has improved substan-tially over the past two centuries and continues to do so.The human population in general is becoming better nourished.People live longer, and incomes have risen. Political institutionshave become more participatory. In part these gains in well-beinghave been made possible by exploiting certain ecosystem services(the provisioning services, such as timber, grazing, and crop pro-duction), sometimes to the detriment of the ecosystem and itsunderlying capacity to continue to provide these and other ser-vices. Some gains have been made possible by the unsustainableuse of other resources. For example, the increases in food produc-tion have been partly enabled by drawing on the finite supply offossil fuels, an ecosystem service laid down millions of years ago.
The gains in human well-being are not distributedevenly among individuals or social groups, nor among thecountries they live in or the ecosystems of the world. Thegap between the advantaged and the disadvantaged is in-creasing. For example, a child born in sub-Saharan Africa is 20times more likely to die before age five than a child born in anindustrial country, and this ratio is higher than it was a decadeago. People living in urban areas, near coasts, and in systems withhigh ecosystem productivity in general have above-average well-being. People living in drylands and mountainous areas,both characterized by lower ecosystem productivity, tendto have below-average, and more variable, well-being.
Populations are growing faster in ecosystems character-ized by low well-being and low ecosystem productivitythan in high well-being, high productivity areas. Figure C1,which uses GDP as a proxy for human well-being, illustrates thissituation. Trends are similar for other measures of human well-being, such as infant mortality rate. [5, 6, 16, 22]
Many human and ecological systems are under multiplesevere and mutually reinforcing stresses. The causes includethe direct and indirect impacts of extraction of services them-selves, as well as the unintended side effects of other human activ-ities. Certain linked ecological-human systems, by virtue of their
PAGE 2
structure or location, are more sensitive to stress than others. Ex-amples include freshwater, coastal, mountain, island, and drylandsystems.
Some groups of people are disproportionately likely toexperience loss of well-being associated with declining lev-els of ecosystem services. The billion people poorest people inthe world mostly live in rural areas where they are directly depen-dent on croplands, rangelands, rivers, seas, and forests for theirlivelihoods. For them especially, mismanagement of ecosystemsthreatens survival. Among better-off and urban populations, eco-system changes affect well-being in less direct ways, but they re-main important. They are partly buffered by technology and theability to substitute some resources with others, but they also re-main ultimately dependent on ecosystems for the basic necessitiesof life. Impacts are experienced differentially as a function ofadaptive capacity, which can be manifested at the individual,household, community, national, or regional level. The groupsultimately responsible for the loss or decline of ecosystem services areoften not the ones that bear the immediate impacts of their decline.
A large and growing number of people are at high riskof adverse ecosystem changes. The world is experiencing aworsening trend of human suffering and economic lossesfrom natural disasters. Over the past four decades, for example,the number of weather-related disasters affecting at least a millionpeople has increased fourfold, while economic losses have in-creased tenfold. The greatest loss of life has been concentratedin developing countries. Ecosystem transformation has played asignificant, but not exclusive, role in increasing the vulnerabilityof people to such disasters. Examples are the increased susceptibil-ity of coastal populations to tropical storms when mangrove for-ests are cleared and the increase in downstream flooding thatfollowed land use changes in the upper Yangtze River. [16]
Special Role of Biodiversity in Supplying EcosystemServices
In some cases, biodiversity can be treated as an ecosystem servicein its own right, such as when it is the basis of nature-based tour-ism or the regulation of diseases. In other respects, it is a necessarycondition underpinning the long-term provision of other ser-vices, such as food and clean fresh water. Variation amonggenes, populations, and species and the variety of structure,function, and composition of ecosystems are necessary tomaintain an acceptable and resilient level of ecosystem ser-vices in the long term. [1]
For ecosystem functions such as productivity and nutri-ent cycling, the level, constancy of the service over time,and resilience to shocks all decline over the long term ifbiodiversity declines (established but incomplete). In general, thereis no sudden biodiversity threshold below which ecosystem ser-vices fail. Quantifying the relationship between biodiversity andlevels of ecosystem function has only been achieved in a few ex-perimental situations and remains an area of active research. Theamount and type of biodiversity required varies from service toservice. Regulatory services generally need higher levels ofbiodiversity than provisioning services do. [11]
Changes in species composition can alter ecosystemprocesses even if the number of species present remainsunchanged or increases. Thus, conserving the composition ofcommunities rather than simply maximizing species numbers ismore likely to maintain higher levels of ecosystem services. Re-duction of the number of species, especially if the species lostare locally rare, may have a hardly detectable effect on ecosystemservices in the short term. However, there is evidence from terres-
................. 11432$ $SDM 10-11-05 14:49:47 PS

3Summary: Ecosystems and Their Services around the Year 2000
0.0
0.2
0.4
0.6
0.8
1.0
Population growthbetween 1990 and 2000in percentage
Net primaryproductivity
kg / sq. meter/ year
Source: Millennium Ecosystem Assessment
0
4
8
12
16
20
Dryland
Mountain
Coastal
Cultivated
Forest and woodland
Island
Polar Dryland
Mountain
Coastal
Cultivated
Forest and woodland
Island
Polar
0
4
8
12
16
20
0
4 000
8 000
12 000
16 000
20 000
Population growthbetween 1990 and 2000in percentage
Gross domesticproduct
dollars per capita
Population growth Net primary productivity Gross domestic product
Figure C1. Population Growth Rates in 1990–2000, Per Capita GDP, and Ecosystem Productivity in 2000 in MA Ecological Systems
trial and aquatic systems that a rich regional species pool is neededto maintain ecosystem stability in the face of a changing environ-ment in the long term. [11]
The integrity of the interactions between species is crit-ical for the long-term preservation of human food produc-tion on land and in the sea. For example, pollination is anessential link in the production of food and fiber. Plant-eatinginsects and pathogens control the populations of many potentiallyharmful organisms. The services provided by coral reefs, such ashabitat and nurseries for fish, sediment stabilization, nutrient cy-cling, and carbon fixing in nutrient-poor environments, can onlybe maintained if the interaction between corals and their obligatesymbiotic algae is preserved. [11]
The preservation of genetic variation among crop spe-cies and their wild relatives and spatial heterogeneity inagricultural landscapes are considered necessary for thelong-term viability of agriculture. Genetic variability is theraw material on which plant breeding for increased productionand greater resilience depends. In general practice, agriculture un-dermines biodiversity and the regulating and supporting ecosys-tem services it provides in two ways: through transformingecosystems by converting them to cultivated lands (extensifica-tion) and through the unintended negative impacts of increasedlevels of agricultural inputs, such as fertilizers, biocides, irrigation,and mechanical tillage (intensification). Agroforestry systems,crop rotations, intercropping, and conservation tillage are someof the agricultural techniques that maintain yields and protectcrops and animals from pests without heavy investment in chemi-cal inputs. [11]
A large proportion of the world’s terrestrial species areconcentrated in a small fraction of the land area, mostlyin the tropics, and especially in forests and on mountains.Marine species are similarly concentrated, with the limitedarea of coral reefs, for example, having exceptionally highbiodiversity. Most terrestrial species have small geographicalranges, and the ranges are often clustered, leading to diagnosable‘‘hotspots’’ of both richness and endemism. These are frequently,
PAGE 3
but not exclusively, concentrated in isolated or topographicallyvariable regions such as islands, peninsulas, and mountains. TheAfrican and American tropics have the highest recorded speciesnumbers in both absolute terms and per unit of area. Endemismis also highest there and, as a consequence of its isolation, in Aus-tralasia. Locations of species richness hotspots broadly correspondwith centers of evolutionary diversity. Available evidence suggeststhat across the major taxa, tropical humid forests are especiallyimportant for both overall diversity and their unique evolutionaryhistory. [4]
Among plants and vertebrates, the great majority ofspecies are declining in distribution, abundance, or both,while a small number are expanding. Studies of Africanmammals, birds in cultivated landscapes, and commercially im-portant fish all show the majority of species to be declining inrange or number. Exceptions can be attributed to managementinterventions such as protection in reserves and elimination ofthreats such as overexploitation, or they are species that thrive inhuman-dominated landscapes. In some regions there may be anincrease in local biodiversity as a result of species introductions,the long-term consequences of which are hard to foresee. [4]
The observed rates of species extinction in moderntimes are 100 to 1,000 times higher than the average ratesfor comparable groups estimated from the fossil record(medium certainty). (See Figure C2.) The losses have occurred inall taxa, regions, and ecosystems but are particularly high insome—for instance, among primates, in the tropics, and in fresh-water habitats. Of the approximately 1,000 recorded historical ex-tinctions, most have been on islands. Currently and in the future,the most threatened species are found on the mainland, particu-larly in locations of habitat change and degradation. The currentrate of biodiversity loss, in aggregate and at a global scale,gives no indication of slowing, although there have beenlocal successes in some groups of species. The momentumof the underlying drivers of biodiversity loss, and the con-sequences of this loss, will extend many millennia into thefuture. [4]
................. 11432$ $SDM 10-11-05 14:49:49 PS
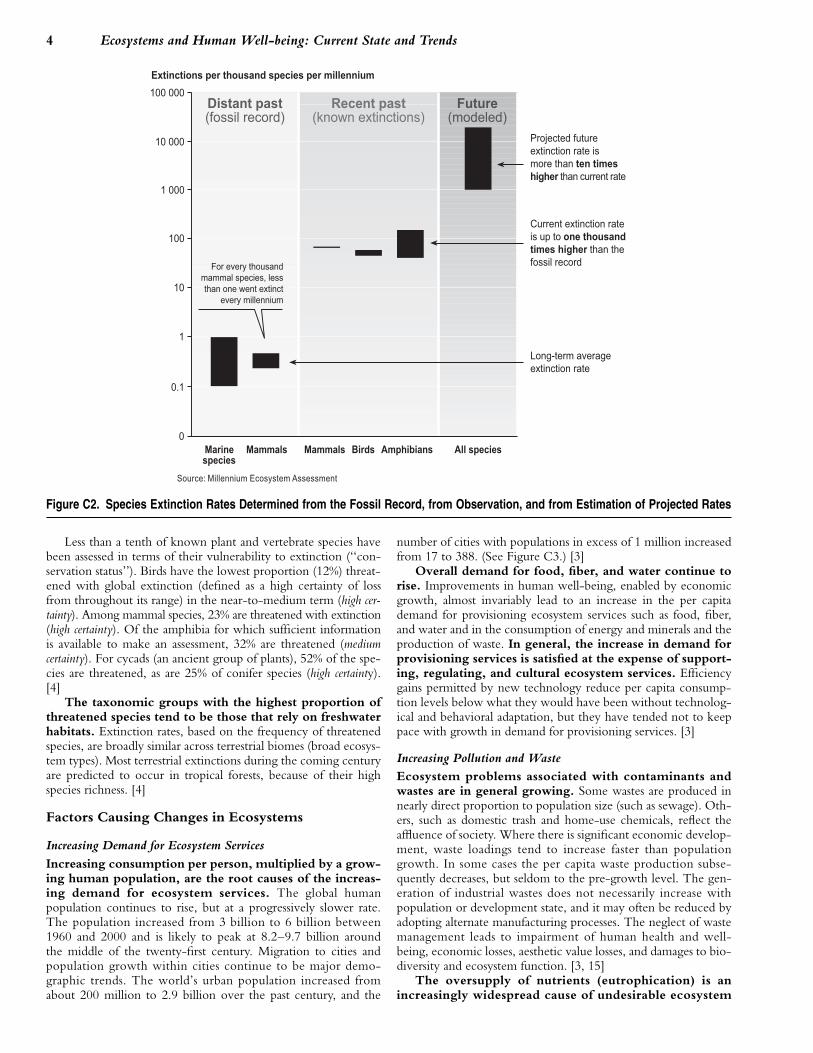
4 Ecosystems and Human Well-being: Current State and Trends
Figure C2. Species Extinction Rates Determined from the Fossil Record, from Observation, and from Estimation of Projected Rates
Less than a tenth of known plant and vertebrate species havebeen assessed in terms of their vulnerability to extinction (‘‘con-servation status’’). Birds have the lowest proportion (12%) threat-ened with global extinction (defined as a high certainty of lossfrom throughout its range) in the near-to-medium term (high cer-tainty). Among mammal species, 23% are threatened with extinction(high certainty). Of the amphibia for which sufficient informationis available to make an assessment, 32% are threatened (mediumcertainty). For cycads (an ancient group of plants), 52% of the spe-cies are threatened, as are 25% of conifer species (high certainty).[4]
The taxonomic groups with the highest proportion ofthreatened species tend to be those that rely on freshwaterhabitats. Extinction rates, based on the frequency of threatenedspecies, are broadly similar across terrestrial biomes (broad ecosys-tem types). Most terrestrial extinctions during the coming centuryare predicted to occur in tropical forests, because of their highspecies richness. [4]
Factors Causing Changes in Ecosystems
Increasing Demand for Ecosystem Services
Increasing consumption per person, multiplied by a grow-ing human population, are the root causes of the increas-ing demand for ecosystem services. The global humanpopulation continues to rise, but at a progressively slower rate.The population increased from 3 billion to 6 billion between1960 and 2000 and is likely to peak at 8.2–9.7 billion aroundthe middle of the twenty-first century. Migration to cities andpopulation growth within cities continue to be major demo-graphic trends. The world’s urban population increased fromabout 200 million to 2.9 billion over the past century, and the
PAGE 4
number of cities with populations in excess of 1 million increasedfrom 17 to 388. (See Figure C3.) [3]
Overall demand for food, fiber, and water continue torise. Improvements in human well-being, enabled by economicgrowth, almost invariably lead to an increase in the per capitademand for provisioning ecosystem services such as food, fiber,and water and in the consumption of energy and minerals and theproduction of waste. In general, the increase in demand forprovisioning services is satisfied at the expense of support-ing, regulating, and cultural ecosystem services. Efficiencygains permitted by new technology reduce per capita consump-tion levels below what they would have been without technolog-ical and behavioral adaptation, but they have tended not to keeppace with growth in demand for provisioning services. [3]
Increasing Pollution and WasteEcosystem problems associated with contaminants andwastes are in general growing. Some wastes are produced innearly direct proportion to population size (such as sewage). Oth-ers, such as domestic trash and home-use chemicals, reflect theaffluence of society. Where there is significant economic develop-ment, waste loadings tend to increase faster than populationgrowth. In some cases the per capita waste production subse-quently decreases, but seldom to the pre-growth level. The gen-eration of industrial wastes does not necessarily increase withpopulation or development state, and it may often be reduced byadopting alternate manufacturing processes. The neglect of wastemanagement leads to impairment of human health and well-being, economic losses, aesthetic value losses, and damages to bio-diversity and ecosystem function. [3, 15]
The oversupply of nutrients (eutrophication) is anincreasingly widespread cause of undesirable ecosystem
................. 11432$ $SDM 10-11-05 14:49:53 PS
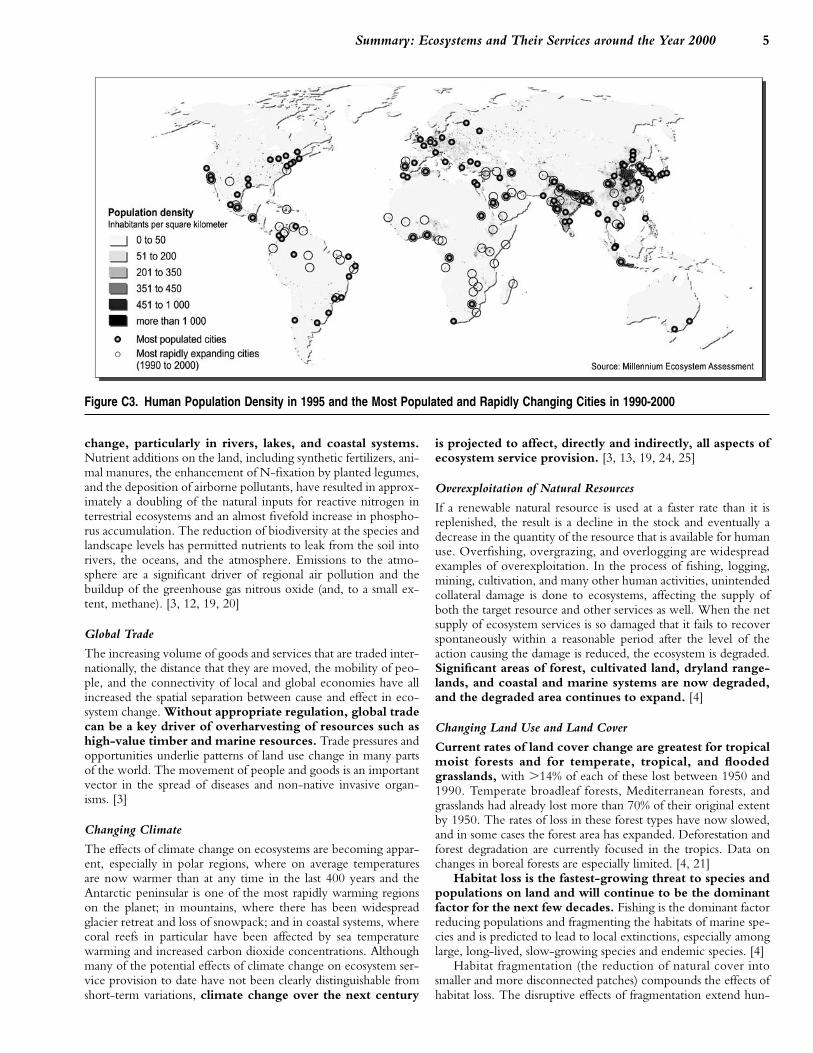
5Summary: Ecosystems and Their Services around the Year 2000
Figure C3. Human Population Density in 1995 and the Most Populated and Rapidly Changing Cities in 1990-2000
change, particularly in rivers, lakes, and coastal systems.Nutrient additions on the land, including synthetic fertilizers, ani-mal manures, the enhancement of N-fixation by planted legumes,and the deposition of airborne pollutants, have resulted in approx-imately a doubling of the natural inputs for reactive nitrogen interrestrial ecosystems and an almost fivefold increase in phospho-rus accumulation. The reduction of biodiversity at the species andlandscape levels has permitted nutrients to leak from the soil intorivers, the oceans, and the atmosphere. Emissions to the atmo-sphere are a significant driver of regional air pollution and thebuildup of the greenhouse gas nitrous oxide (and, to a small ex-tent, methane). [3, 12, 19, 20]
Global Trade
The increasing volume of goods and services that are traded inter-nationally, the distance that they are moved, the mobility of peo-ple, and the connectivity of local and global economies have allincreased the spatial separation between cause and effect in eco-system change. Without appropriate regulation, global tradecan be a key driver of overharvesting of resources such ashigh-value timber and marine resources. Trade pressures andopportunities underlie patterns of land use change in many partsof the world. The movement of people and goods is an importantvector in the spread of diseases and non-native invasive organ-isms. [3]
Changing Climate
The effects of climate change on ecosystems are becoming appar-ent, especially in polar regions, where on average temperaturesare now warmer than at any time in the last 400 years and theAntarctic peninsular is one of the most rapidly warming regionson the planet; in mountains, where there has been widespreadglacier retreat and loss of snowpack; and in coastal systems, wherecoral reefs in particular have been affected by sea temperaturewarming and increased carbon dioxide concentrations. Althoughmany of the potential effects of climate change on ecosystem ser-vice provision to date have not been clearly distinguishable fromshort-term variations, climate change over the next century
PAGE 5
is projected to affect, directly and indirectly, all aspects ofecosystem service provision. [3, 13, 19, 24, 25]
Overexploitation of Natural Resources
If a renewable natural resource is used at a faster rate than it isreplenished, the result is a decline in the stock and eventually adecrease in the quantity of the resource that is available for humanuse. Overfishing, overgrazing, and overlogging are widespreadexamples of overexploitation. In the process of fishing, logging,mining, cultivation, and many other human activities, unintendedcollateral damage is done to ecosystems, affecting the supply ofboth the target resource and other services as well. When the netsupply of ecosystem services is so damaged that it fails to recoverspontaneously within a reasonable period after the level of theaction causing the damage is reduced, the ecosystem is degraded.Significant areas of forest, cultivated land, dryland range-lands, and coastal and marine systems are now degraded,and the degraded area continues to expand. [4]
Changing Land Use and Land Cover
Current rates of land cover change are greatest for tropicalmoist forests and for temperate, tropical, and floodedgrasslands, with �14% of each of these lost between 1950 and1990. Temperate broadleaf forests, Mediterranean forests, andgrasslands had already lost more than 70% of their original extentby 1950. The rates of loss in these forest types have now slowed,and in some cases the forest area has expanded. Deforestation andforest degradation are currently focused in the tropics. Data onchanges in boreal forests are especially limited. [4, 21]
Habitat loss is the fastest-growing threat to species andpopulations on land and will continue to be the dominantfactor for the next few decades. Fishing is the dominant factorreducing populations and fragmenting the habitats of marine spe-cies and is predicted to lead to local extinctions, especially amonglarge, long-lived, slow-growing species and endemic species. [4]
Habitat fragmentation (the reduction of natural cover intosmaller and more disconnected patches) compounds the effects ofhabitat loss. The disruptive effects of fragmentation extend hun-
................. 11432$ $SDM 10-11-05 14:50:08 PS

6 Ecosystems and Human Well-being: Current State and Trends
dreds of meters inwards from the edges of the patches, makingsmall patches highly vulnerable to loss of species and functions.[11]
Invasion by Alien Species
In a wide range of terrestrial, marine, and freshwater ecosystems,accidental or voluntary introduction of non-native species by hu-mans has altered local biological community interactions, trigger-ing dramatic and often unexpected changes in ecosystemprocesses and causing large monetary and cultural losses. [3, 4, 23]
Trends in Ecosystem Services
• The supply of certain ecosystem services has increased at theexpense of others. Significant gains in the provision of foodand fiber have been achieved through habitat conversion, in-creased abstraction and degradation of inland waters, and re-duced biodiversity.
• Fish cannot continue to be harvested from wild populations atthe present rate. Deep-ocean and coastal fish stocks havechanged substantially in most parts of the world and the har-vests have begun to decline and will continue to do so.
• The supply of fresh water to people is already inadequate tomeet human and ecosystem needs in large areas of the world,and the gap between supply and demand will continue to widenif current patterns of water use will continue.
• Declining trends in the capacity of ecosystems to render pollut-ants harmless, keep nutrient levels in balance, give protectionfrom natural disasters, and control the outbreaks of pests, dis-eases, and invasive organisms are apparent in many places.
The main trends in key ecosystem services over the last 50 yearsare summarized in Table C1. Individual ecosystem services arediscussed below in further detail.
Provisioning Services
Food
Major inequalities exist in access to food despite the morethan doubling of global production over the past 40 years.An estimated 852 million people were undernourished in2000–02, up 37 million from 1997–99. [8] There are impor-tant differences in the regional trends: the number of undernour-ished people in China is declining, while the number in Africacontinues to increase. Of the global undernourished, 1% live inindustrial countries, 4% live in countries in transition, and theremaining 95% are found in developing countries.
Figure C4 demonstrates that the economic value of food pro-duction is also not evenly distributed around the world, both be-cause of the uneven distribution of natural factors such as climateand nutrient supply and because the prices obtained for foodproducts vary according to demand and wealth. The impacts ofactivities associated with food production on other ecosystem ser-vices are unevenly distributed as well.
New cultivars of wheat, maize, and rice, coupled with in-creased inputs of fertilizers, irrigation, and an expansion of thecultivated area, were the main factors underlying the 250% in-crease in total cereal production since 1960. The rate of increaseof cereal production has slowed over the last decade, forreasons that are uncertain but that include a long-term declinein the real price of cereals, a saturation in the per capita cereal
PAGE 6
consumption in many countries, a temporary decline in the useof cereals as livestock feed in the 1970s and 1980s, the decliningquality of land in agricultural production, and diminishing returnsto efforts aimed at improving yields of maize, wheat, and rice.
Adequate nutrition requires a diverse diet, containing suffi-cient micronutrients and protein as well as calories. The world’spoorest people continue to rely on starchy staples, which leads toprotein, vitamin, and mineral deficiencies. Demand for high-value, protein-rich products such as livestock and fish hasincreased with rising incomes in East and Southeast Asia (7%annual growth in livestock production over past 30 years). Theaccelerating demand for animal protein is increasingly metby intensive (‘‘industrial’’ or ‘‘landless’’) production sys-tems, especially for chicken and pigs. While these systems havecontributed to large increases in production, they create seriouswaste problems and put increased pressure on cultivated systemsand fisheries to provide feed inputs (and are thus not truly ‘‘land-less’’).
The dietary changes that accompany increasing income canimprove health; however, overconsumption, leading to obesityand heart disease, is also a growing health problem (65% ofAmericans and more than 17 million children in developingcountries are overweight). Calorie intake is only 20% higher percapita in industrial countries than in developing countries on av-erage, but protein intake is 50% higher and fat intake is almosttwice as high.
Harvest pressure has exceeded maximum sustainablelevels of exploitation in one quarter of all wild fisheries andis likely to exceed this limit in most other wild fisheries inthe near future. In every ocean in the world, one or more im-portant targeted stocks have been classified as collapsed, over-fished, or fished to their maximum sustainable levels, and at leastone quarter of important commercial fish stocks are overharvested(high certainty). Although fish consumption has doubled in devel-oping countries in the last three decades, the per capita annualconsumption has declined by 200 grams since 1985, to 9.2 kilo-grams per person (excluding China). Fish products are heavilytraded, and approximately 50% of fish exports are from develop-ing countries. Exports from developing countries and the South-ern Hemisphere presently offset much of the demand shortfall inEuropean, North American, and East Asian markets.
The growth in demand for fish protein is being met in part byaquaculture, which now accounts for 22% of total fish productionand 40% of fish consumed as food. Marine aquaculture has notto date relieved pressure on wild fisheries, because the foodprovided to captive fish is partly based on wild-harvestedfish products.
Government policies are significant drivers of foodproduction and consumption patterns, both locally andglobally. Investments in rural roads, irrigation, credit systems,and agricultural research and extension serve to stimulate foodproduction. Improved access to input and export markets boostsproductivity. Opportunities to gain access to international marketsare conditioned by international trade and food safety regulationsand by a variety of tariff and non-tariff barriers. Selective produc-tion and export subsidies stimulate overproduction of many foodcrops. This translates into relatively cheap food exports that bene-fit international consumers at the expense of domestic taxpayersand that undermine the welfare of food producers in poorercountries.
Wild terrestrial foods are locally important in many de-veloping countries, often bridging the hunger gap createdby stresses such as droughts and floods and social unrest.Wild foods are important sources of diversity in some diets, in
................. 11432$ $SDM 10-11-05 14:50:09 PS

7Summary: Ecosystems and Their Services around the Year 2000
Table C1. Trends in the Human Use of Ecosystem Services and Enhancement or Degradation of the Service around the Year 2000
Human Enhanced or MAService Sub-category Usea Degradedb Notes Chapter
Provisioning Services
Food Crops Food provision has grown faster than overall popula- C8.2tion growth. Primary source of growth from increase inproduction per unit area but also significant expansion
r rin cropland. Still persistent areas of low productivityand more rapid area expansion, e.g., sub-Saharan Af-rica and parts of Latin America.
Livestock Significant increase in area devoted to livestock in C8.2some regions, but major source of growth has been
r rmore intensive, confined production of chicken, pigs,and cattle.
Capture Fish- Marine fish harvest increased until the late 1980s and C18eries has been declining since then. Currently, one quarter C8.2.2
of marine fish stocks are overexploited or significantly C19o o depleted. Freshwater capture fisheries have also de-
clined. Human use of capture fisheries has declinedbecause of the reduced supply, not because of re-duced demand.
Aquaculture Aquaculture has become a globally significant source C8of food in the last 50 years and, in 2000, contributed Table 8.4
r r 27% of total fish production. Use of fish feed for carniv-orous aquaculture species places an additional burdenon capture fisheries.
Wild plant and Provision of these food sources is generally declining C8.3.1animal food as natural habitats worldwide are under increasing
NA oproducts pressure and as wild populations are exploited for
food, particularly by the poor, at unsustainable levels.
Fiber Timber Global timber production has increased by 60% in the C9.ESlast four decades. Plantations provide an increasing C21.1volume of harvested roundwood, amounting to 35% ofthe global harvest in 2000. Roughly 40% of forest areahas been lost during the industrial era, and forests con-
r �/�tinue to be lost in many regions (thus the service isdegraded in those regions), although forest is now re-covering in some temperate countries and thus thisservice has been enhanced (from this lower baseline)in these regions in recent decades.
Cotton, hemp, Cotton and silk production have doubled and tripled C9.ESsilk �/� �/� respectively in the last four decades. Production of
other agricultural fibers has declined.
Wood fuel Global consumption of fuelwood appears to have C9.ESpeaked in the 1990s and is now believed to be slowly�/� odeclining buts remains the dominant source of domes-tic fuel in some regions.
Genetic resources Traditional crop breeding has relied on a relatively nar- C26.2.1row range of germplasm for the major crop species,although molecular genetics and biotechnology providenew tools to quantify and expand genetic diversity inthese crops. Use of genetic resources also is growing
r oin connection with new industries base on biotechnol-ogy. Genetic resources have been lost through theloss of traditional cultivars of crop species (due in partto the adoption of modern farming practices and varie-ties) and through species extinctions.
(continues)
PAGE 7................. 11432$ $SDM 10-11-05 14:50:11 PS

8 Ecosystems and Human Well-being: Current State and Trends
Table C1. continued
Human Enhanced or MAService Sub-category Usea Degradedb Notes Chapter
Biochemicals, natural Demand for biochemicals and new pharmaceuticals is C10medicines, and growing, but new synthetic technologies compete withpharmaceuticals natural products to meet the demand. For many other
natural products (cosmetics, personal care,r o
bioremediation, biomonitoring, ecological restoration),use is growing. Species extinction and overharvestingof medicinal plants is diminishing the availability ofthese resources.
Fresh water Human modification to ecosystems (e.g., reservoir C7creation) has stabilized a substantial fraction ofcontinental river flow, making more fresh wateravailable to people but in dry regions reducing riverflows through open water evaporation and support toirrigation that also loses substantial quantities of water.Watershed management and vegetation changes havealso had an impact on seasonal river flows. From 5%to possible 25% of global freshwater use exceedslong-term accessible supplied and require supplied
r o either through engineered water transfers of overdraftof groundwater supplies. Between 15% and 35% ofirrigation withdrawals exceed supply rates. Fresh waterflowing in rivers also provides a service in the form ofenergy that is exploited through hydropower. Theconstruction of dams has not changed the amount ofenergy, but it has made the energy more available topeople. The installed hydroelectric capacity doubledbetween 1960 and 2000. Pollution and biodiversity lossare defining features of modern inland water systemsin many populated parts of the world.
Regulating Services
Air quality regulation The ability of the atmosphere to cleanse itself of C13.ESpollutants has declined slightly since preindustrialtimes but likely not by more than 10%. Then net
r o contribution of ecosystems to this change is not known.Ecosystems are also a sink for tropospheric ozone,ammonia, NOx, SO2, particulates, and CH4, butchanges in these sinks were not assessed.
Climate regulation Global Terrestrial ecosystems were on average a net source C13.ESof CO2 during the nineteenth and early twentiethcentury and became a net sink sometime around themiddle of the last century. The biophysical effect of
r r historical land cover changes (1750 to present) is netcooling on a global scale due to increased albedo,partially offsetting the warming effect of associatedcarbon emissions from land cover change over muchof that period.
Regional and Changes in land cover have affected regional and local C13.3local climates both positively and negatively, but there is a C11.3
r o preponderance of negative impacts. For example,tropical deforestation and desertification have tendedto reduce local rainfall.
Water regulation The effect of ecosystem change on the timing and C7.4.4magnitude of runoff, flooding, and aquifer recharge
r �/�depends on the ecosystem involved and on thespecific modifications made to the ecosystem.
PAGE 8................. 11432$ $SDM 10-11-05 14:50:11 PS
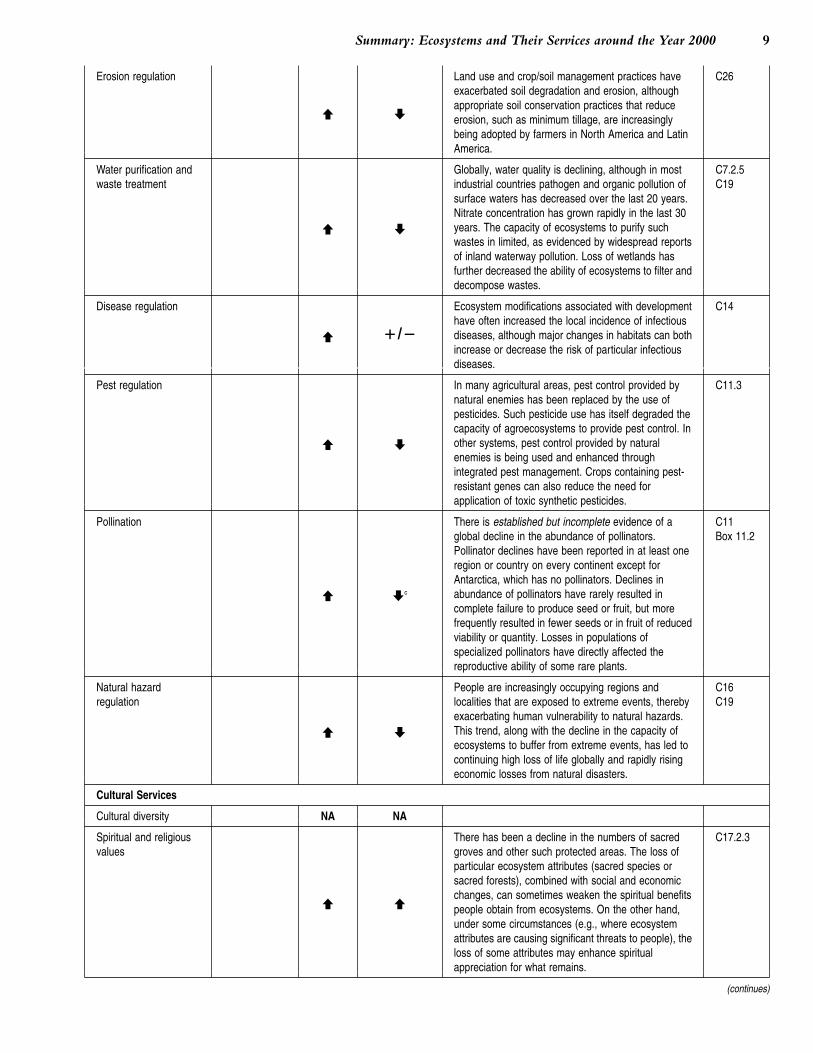
9Summary: Ecosystems and Their Services around the Year 2000
Erosion regulation Land use and crop/soil management practices have C26exacerbated soil degradation and erosion, althoughappropriate soil conservation practices that reduce
r oerosion, such as minimum tillage, are increasinglybeing adopted by farmers in North America and LatinAmerica.
Water purification and Globally, water quality is declining, although in most C7.2.5waste treatment industrial countries pathogen and organic pollution of C19
surface waters has decreased over the last 20 years.Nitrate concentration has grown rapidly in the last 30
r o years. The capacity of ecosystems to purify suchwastes in limited, as evidenced by widespread reportsof inland waterway pollution. Loss of wetlands hasfurther decreased the ability of ecosystems to filter anddecompose wastes.
Disease regulation Ecosystem modifications associated with development C14have often increased the local incidence of infectious
r �/� diseases, although major changes in habitats can bothincrease or decrease the risk of particular infectiousdiseases.
Pest regulation In many agricultural areas, pest control provided by C11.3natural enemies has been replaced by the use ofpesticides. Such pesticide use has itself degraded thecapacity of agroecosystems to provide pest control. In
r o other systems, pest control provided by naturalenemies is being used and enhanced throughintegrated pest management. Crops containing pest-resistant genes can also reduce the need forapplication of toxic synthetic pesticides.
Pollination There is established but incomplete evidence of a C11global decline in the abundance of pollinators. Box 11.2Pollinator declines have been reported in at least oneregion or country on every continent except forAntarctica, which has no pollinators. Declines in
r oc abundance of pollinators have rarely resulted incomplete failure to produce seed or fruit, but morefrequently resulted in fewer seeds or in fruit of reducedviability or quantity. Losses in populations ofspecialized pollinators have directly affected thereproductive ability of some rare plants.
Natural hazard People are increasingly occupying regions and C16regulation localities that are exposed to extreme events, thereby C19
exacerbating human vulnerability to natural hazards.r o This trend, along with the decline in the capacity of
ecosystems to buffer from extreme events, has led tocontinuing high loss of life globally and rapidly risingeconomic losses from natural disasters.
Cultural Services
Cultural diversity NA NA
Spiritual and religious There has been a decline in the numbers of sacred C17.2.3values groves and other such protected areas. The loss of
particular ecosystem attributes (sacred species orsacred forests), combined with social and economicchanges, can sometimes weaken the spiritual benefits
r rpeople obtain from ecosystems. On the other hand,under some circumstances (e.g., where ecosystemattributes are causing significant threats to people), theloss of some attributes may enhance spiritualappreciation for what remains.
(continues)
PAGE 9................. 11432$ $SDM 10-11-05 14:50:12 PS

10 Ecosystems and Human Well-being: Current State and Trends
Table C1. continued
Human Enhanced or MAService Sub-category Usea Degradedb Notes Chapter
Knowledge systems NA NA
Educational values NA NA
Inspiration NA NA
Aesthetic values The demand for aesthetically pleasing natural C17.2.5landscapes has increased in accordance withincreased urbanization. There has been a decline in
r o quantity and quality of areas to meet this demand. Areduction in the availability of and access to naturalareas for urban residents may have importantdetrimental effects on public health and economies.
Social relations NA NA
Sense of place NA NA
Cultural heritage values NA NA
Recreation and The demand for recreational use of landscapes is C17.2.6ecotourism increasing, and areas are increasingly being managed C19
to cater for this use, to reflect changing cultural valuesr �/�
and perceptions. However, many naturally occurringfeatures of the landscape (e.g., coral reefs) have beendegraded as resources for recreation.
Supporting Services
Soil formation † †
Photosynthesis † †
Primary production Several global MA systems, including drylands, forest, C22.2.1and cultivated systems, show a trend of NPP increase
† † for the period 1981 to 2000. However, high seasonaland inter-annual variations associated with climatevariability occur within this trend on the global scale
Nutrient cycling There have been large-scale changes in nutrient C12cycles in recent decades, mainly due to additionalinputs from fertilizers, livestock waste, human wastes,and biomass burning. Inland water and coastal
† †systems have been increasingly affected byeutrophication due to transfer of nutrients fromterrestrial to aquatic systems as biological buffers thatlimit these transfers have been significantly impaired.
Water cycling Humans have made major changes to water cycles C7† † through structural changes to rivers, extraction of water
from rivers, and, more recently, climate change.
a For provisioning services, human use increases if the human consumption of the service increases (e.g., greater food consumption); for regulating andcultural services, human use increases if the number of people affected by the service increases. The time frame is in general the past 50 years, although ifthe trend has changed within that time frame, the indicator shows the most recent trend.b For provisioning services, we define enhancement to mean increased production of the service through changes in area over which the service is provided(e.g., spread of agriculture) or increased production per unit area. We judge the production to be degraded if the current use exceeds sustainable levels. Forregulating and supporting services, enhancement refers to a change in the service that leads to greater benefits for people (e.g., the service of diseaseregulation could be improved by eradication of a vector known to transmit a disease to people). Degradation of a regulating and supporting service means areduction in the benefits obtained from the service, either through a change in the service (e.g., mangrove loss reducing the storm protection benefits of anecosystem) or through human pressures on the service exceeding its limits (e.g., excessive pollution exceeding the capability of ecosystems to maintainwater quality). For cultural services, degradation refers to a change in the ecosystem features that decreases the cultural (recreational, aesthetic, spiritual,etc.) benefits provided by the ecosystem. The time frame is in general the past 50 years, although if the trend has changed within that time frame theindicator shows the most recent trend.c Low to medium certainty. All other trends are medium to high certainty.
PAGE 10................. 11432$ $SDM 10-11-05 14:50:12 PS
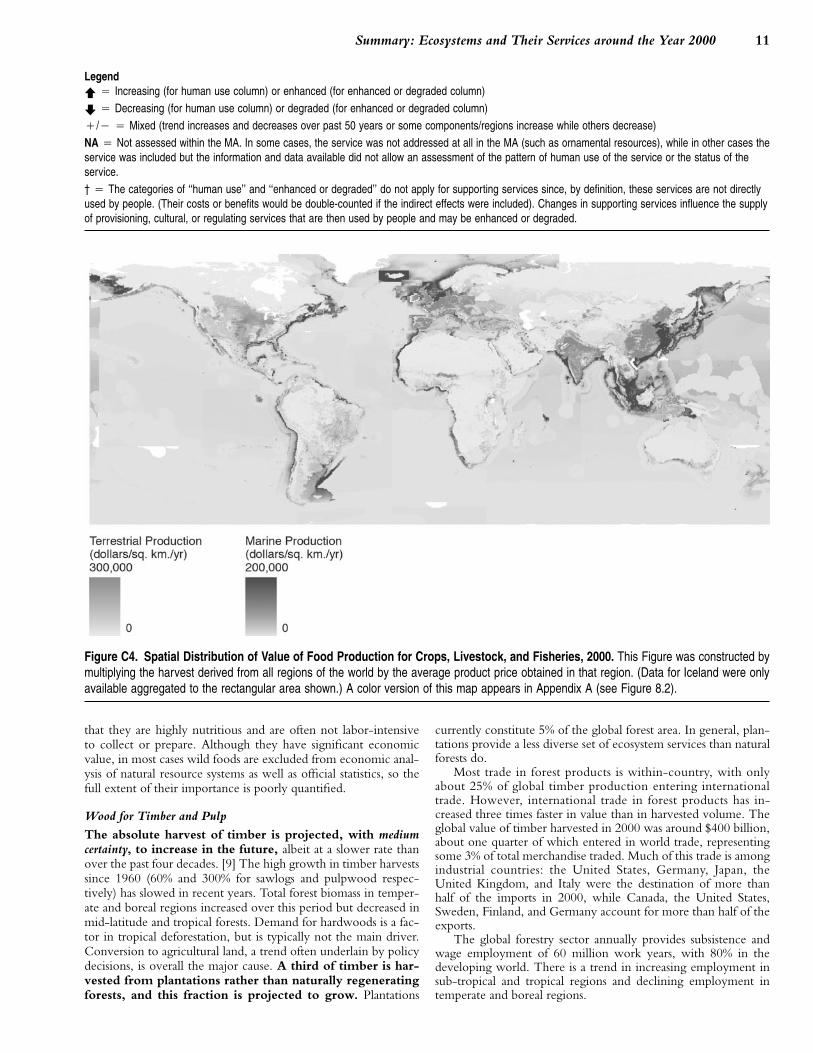
11Summary: Ecosystems and Their Services around the Year 2000
Legendr � Increasing (for human use column) or enhanced (for enhanced or degraded column)
o � Decreasing (for human use column) or degraded (for enhanced or degraded column)
�/� � Mixed (trend increases and decreases over past 50 years or some components/regions increase while others decrease)
NA � Not assessed within the MA. In some cases, the service was not addressed at all in the MA (such as ornamental resources), while in other cases theservice was included but the information and data available did not allow an assessment of the pattern of human use of the service or the status of theservice.
† � The categories of ‘‘human use’’ and ‘‘enhanced or degraded’’ do not apply for supporting services since, by definition, these services are not directlyused by people. (Their costs or benefits would be double-counted if the indirect effects were included). Changes in supporting services influence the supplyof provisioning, cultural, or regulating services that are then used by people and may be enhanced or degraded.
Figure C4. Spatial Distribution of Value of Food Production for Crops, Livestock, and Fisheries, 2000. This Figure was constructed bymultiplying the harvest derived from all regions of the world by the average product price obtained in that region. (Data for Iceland were onlyavailable aggregated to the rectangular area shown.) A color version of this map appears in Appendix A (see Figure 8.2).
that they are highly nutritious and are often not labor-intensiveto collect or prepare. Although they have significant economicvalue, in most cases wild foods are excluded from economic anal-ysis of natural resource systems as well as official statistics, so thefull extent of their importance is poorly quantified.
Wood for Timber and Pulp
The absolute harvest of timber is projected, with mediumcertainty, to increase in the future, albeit at a slower rate thanover the past four decades. [9] The high growth in timber harvestssince 1960 (60% and 300% for sawlogs and pulpwood respec-tively) has slowed in recent years. Total forest biomass in temper-ate and boreal regions increased over this period but decreased inmid-latitude and tropical forests. Demand for hardwoods is a fac-tor in tropical deforestation, but is typically not the main driver.Conversion to agricultural land, a trend often underlain by policydecisions, is overall the major cause. A third of timber is har-vested from plantations rather than naturally regeneratingforests, and this fraction is projected to grow. Plantations
PAGE 11
currently constitute 5% of the global forest area. In general, plan-tations provide a less diverse set of ecosystem services than naturalforests do.
Most trade in forest products is within-country, with onlyabout 25% of global timber production entering internationaltrade. However, international trade in forest products has in-creased three times faster in value than in harvested volume. Theglobal value of timber harvested in 2000 was around $400 billion,about one quarter of which entered in world trade, representingsome 3% of total merchandise traded. Much of this trade is amongindustrial countries: the United States, Germany, Japan, theUnited Kingdom, and Italy were the destination of more thanhalf of the imports in 2000, while Canada, the United States,Sweden, Finland, and Germany account for more than half of theexports.
The global forestry sector annually provides subsistence andwage employment of 60 million work years, with 80% in thedeveloping world. There is a trend in increasing employment insub-tropical and tropical regions and declining employment intemperate and boreal regions.
................. 11432$ $SDM 10-11-05 14:50:26 PS

12 Ecosystems and Human Well-being: Current State and Trends
Biomass Energy
Wood and charcoal remain the primary source of energyfor heating and cooking for 2.6 billion people. [9] Globalconsumption appears to have peaked in the 1990s and is nowbelieved to be slowly declining as a result of switching to alternatefuels and, to a lesser degree, more-efficient biomass energy tech-nologies. Accurate data on fuelwood production and consump-tion are difficult to collect, since much is produced and consumedlocally by households. The global aggregate value of fuelwoodproduction per capita has declined in recent years, easing concernsabout a widespread wood energy crisis, although local and re-gional shortages persist.
Serious human health damages are caused by indoorpollution associated with the use of traditional biomassfuels in homes of billions of the rural and urban poor thatlack adequate smoke venting. In 2000, 1.6 million deaths andthe equivalent of 39 million person-years of ill health (disability-adjusted life years) were attributed to the burning of traditionalbiomass fuels, with women and children most affected. Healthhazards increase where wood shortages lead to poor families usingdung or agricultural residues for heating and cooking. Where ade-quate fuels are not available, the consumption of cooked foodsdeclines, with adverse effects on nutrition and health. Local fuel-wood shortages contribute to deforestation and result in lengthyand arduous travel to collect wood in rural villages, largely bywomen.
While examples of full commercial exploitation of modernbiomass-based energy technologies are still fairly modest, theirproduction and use is likely to expand over the next decades.
Agricultural Fibers
Global cotton production has doubled and silk productionhas tripled since 1961, with major shifts in the productionregions. [9] The total land area devoted to cotton production hasstayed virtually constant; area expansion in India and the UnitedStates was offset by large declines in Pakistan and the former So-viet Union. These shifts have impacts on land available for foodcrops and on water resources, since much of the cotton crop isirrigated. Silk production shifted from Japan to China. Productionof wool, flax, hemp, jute, and sisal has declined.
Fresh Water
Water scarcity has become globally significant over the lastfour decades and is an accelerating condition for roughly1–2 billion people worldwide, leading to problems with foodproduction, human health, and economic development. Rates ofincrease in a key water scarcity measure (water use relative toaccessible supply) from 1960 to the present averaged nearly 20%per decade globally, with values of 15% to more than 30% perdecade for individual continents. Although a slowing in the globalrate of increase in use is projected between 2000 and 2010, to10% per decade, the relative use ratio for some regions is likely toremain high, with the Middle East and North Africa at 14% perdecade, Latin America at 16%, and sub-Saharan Africa at 20%. [7]
Contemporary water withdrawal is approximately 10% ofglobal continental runoff, although this amounts to between 40%and 50% of the continental runoff to which the majority of theglobal population has access during the year.
Population growth and economic development have drivenper capita levels of water availability down from 11,300 to about5,600 cubic meters per person per year between 1960 and 2000.Global per capita water availability is projected (based on a 10%per decade rate of growth of water use, which is slower than the
PAGE 12
past decades) to drop below 5,000 cubic meters per person peryear by 2010 (high certainty).
Terrestrial ecosystems are the major global source ofaccessible, renewable fresh water. Forest and mountain eco-systems are associated with the largest amounts of fresh water—57% and 28% of the total runoff, respectively. These systems eachprovide renewable water supplies to at least 4 billion people, ortwo thirds of the global population. Cultivated and urban systemsgenerate only 16% and 0.2%, respectively, of global runoff, butdue to their close proximity to humans they serve from 4.5–5billion people. Such proximity is associated with nutrient and in-dustrial water pollution.
More than 800 million people currently live in locationsso dry that there is no appreciable recharge of groundwateror year-round contribution by the landscape to runoff inrivers. They are able to survive there by drawing on ‘‘fossil’’groundwater, by having access to piped water, or by living alongrivers that have their source of water elsewhere. From 5% to pos-sibly 25% of global freshwater use exceeds long-term accessiblesupplies and is now met either through engineered water transfersor overdraft of groundwater supplies (medium certainty). In NorthAfrica and the Middle East, nonsustainable use (use in excess ofthe long-term accessible renewable supply) represents 43% of allwater use, and the current rate of use is 40% above that of thesustainable supply (medium certainty).
Growing competition for water is sharpening policy attentionon the need to allocate and use water more efficiently. Irrigationaccounts for 70% of global water withdrawals (over 90% indeveloping countries), but chronic inefficiencies in irrigatedsystems result in less than half of that water being used by crops.
The burden of disease from inadequate water, sanita-tion, and hygiene totals 1.7 million deaths and the loss ofup to 54 million healthy life years per year. Some 1.1 billionpeople lack access to improved water supply and more than 2.6billion lack access to improved sanitation. It is well established thatinvestments in clean drinking water and sanitation show a closecorrespondence with improvement in human health and eco-nomic productivity. Half of the urban population in Africa, Asia,and Latin America and the Caribbean suffer from one or morediseases associated with inadequate water and sanitation.
The management of fresh water through dams, levees,canals, and other infrastructure has had predominantlynegative impacts on the biodiversity of inland waters andcoastal ecosystems, including fragmentation and destruction ofhabitat, loss of species, and reduction of sediments destined forthe coastal zone. The 45,000 existing large dams (more than 15meters high) generate both positive and negative effects onhuman well-being. Positive effects include flow stabilization forirrigation, flood control, and hydroelectricity. Negative effects in-clude health issues associated with stagnant water and the loss ofservices derived from land that has become inundated. A signifi-cant economic consequence of soil erosion is the reduction of theuseful life of dams lower in the drainage basin due to siltation.
Genetic Resources
The exploration of biodiversity for new products and in-dustries has yielded major benefits for humanity and hasthe potential for even larger future benefits. [10] The diver-sity of living things, at the level of the gene, is the fundamentalresource for such ‘‘bioprospecting.’’ While species-rich environ-ments such as the tropics are in the long term expected to supplythe majority of pharmaceutical products derived from ecosystems,bioprospecting to date has yielded valuable products from a wide
................. 11432$ $SDM 10-11-05 14:50:27 PS

13Summary: Ecosystems and Their Services around the Year 2000
variety of environments, including temperate forests and grass-lands, arid and semiarid lands, freshwater ecosystems, mountainand polar regions, and cold and warm oceans.
The continued improvements of agricultural yields throughplant breeding and the adaptation of crops to new and changingenvironments, such as increased temperatures, droughts, andemerging pests and diseases, requires the conservation of geneticdiversity in the wild relatives of domestic species and in produc-tive agricultural landscapes themselves.
Regulating Services
The Regulation of Infectious Diseases
Ecosystem changes have played a significant role in theemergence or resurgence of several infectious diseases ofhumans. [14] The most important drivers are logging, dambuilding, road building, expansion of agriculture (especially irri-gated agriculture), urban sprawl, and pollution of coastal zones.There is evidence that ecosystems that maintain a higher diversityof species reduce the risks of infectious diseases in humans livingwithin them; the pattern of Lyme disease in North America isone example. Natural systems with preserved structure andcharacteristics are not receptive to the introduction of in-vasive human and animal pathogens brought by humanmigration and settlement. This is indicated for cholera, kala-azar, and schistosomiasis (medium certainty).
Increased human contact with ecosystems containing foci ofinfections raises the risk of human infections. Examples occurwhere urban systems are in close contact with forest systems (asso-ciated with malaria and yellow fever) and where cultivated landsare opened in forest systems (hemorrhagic fevers or hantavirus).Major changes in habitats can both increase or decrease the riskof a particular infectious disease, depending on the type of landuse, the characteristics of the cycle of disease, and the characteris-tics of the human populations. Although disease emergence andre-emergence due to ecosystem alteration can occur anywhere,people in the tropics are more likely to be affected in the futuredue to their greater exposure to reservoirs of potential diseaseand their greater vulnerability due to poverty and poorer healthinfrastructure.
Regulation of Climate, Atmospheric Composition, and AirQualityEcosystems are both strongly affected by and exert a strong influ-ence on climate and air quality. [13] Ecosystem managementhas significantly modified current greenhouse gas concen-trations. Changes in land use and land cover, especially defores-tation and agricultural practices such as paddy rice cultivation andfertilizer use, but also rangeland degradation and dryland agricul-ture, made a contribution of 15–25% to the radiative forcing ofglobal climate change from 1750 to present.
Ecosystems are currently a net sink for CO2 and troposphericozone, while they remain a net source of methane and nitrousoxide. About 20% of CO2 emissions in the 1990s originated fromchanges in land use and land management, primarily deforesta-tion.
Terrestrial ecosystems were on average a net source of CO2
during the nineteenth and early twentieth centuries; they becamea net sink sometime around the middle of the last century (highcertainty) and were a sink for about a third of total emissions in the1990s (energy plus land use). The sink may be explained partiallyby afforestation, reforestation, and forest management in NorthAmerica, Europe, China, and other regions and partially by thefertilizing effects of nitrogen deposition and increasing atmo-
PAGE 13
spheric CO2. The net impact of ocean biology changes on globalCO2 fluxes is unknown.
The potential of terrestrial ecosystem management toalter future greenhouse gas concentrations is significantthrough, for instance, afforestation, reduced deforestation,and conservation agriculture. However, the potential reduc-tions in greenhouse gases remain much smaller than the projectedfossil fuel emissions over the next century (high certainty). Themanagement of ecosystems for climate mitigation can yield otherbenefits as well, such as biodiversity conservation.
Ecosystems also modify climate through alteration of thephysical properties of Earth’s surface. For instance, deforestationin snowy regions leads to regional cooling of land surface duringthe snow season due to increase in surface albedo and to warmingduring summer due to reduction in transpiration (water recycledby plants to atmosphere). Positive feedbacks involving sea surfacetemperature and sea ice propagate this cooling to the global scale.The net physically mediated effect of conversion of high-latitudeforests to more open landscapes is to cool the atmosphere (mediumcertainty). Observations and models indicate, with medium certainty,that large-scale tropical and sub-tropical deforestation anddesertification decrease the precipitation in the affected re-gions. The mechanism involves reduction in within-regionmoisture recycling and an increase in surface albedo. [14]
Tropospheric ozone is both a greenhouse gas and an impor-tant pollutant. It is both produced and destroyed by chemical re-actions in the atmosphere, and about a third of the additionaltropospheric ozone produced as a result of human activities isdestroyed by surface absorption in ecosystems. The capacity ofthe atmosphere to convert pollutants harmful to humans andother life forms into less harmful chemicals is largely controlledby the availability of hydroxyl radicals. The global concentrationof these is believed to have declined by about 10% over the pastcenturies.
Detoxification of Wastes
Depending on the properties of the contaminant and its locationin the environment, wastes can be rendered harmless by naturalprocesses at relatively fast or extremely slow rates. The moreslowly a contaminant is detoxified, the greater the possibility thatharmful levels of the contaminant will occur. Some wastes, suchas nutrients and organic matter, are normal components of naturalecosystem processes, but the anthropogenic loading rates are oftenso much higher than the natural throughput that they significantlymodify the ecosystem and impair its ability to provide a range ofservices, such as recreation and appropriate-quality fresh waterand air. The costs of reversing damages to waste-degradedecosystems are typically large, and the time scale for reme-diation is long. In some cases, rehabilitation is effectivelyimpossible. [15]
Protection from Floods
The impact of extreme weather events is increasing inmany regions around the world. [7, 16, 19] For example,flood damage recorded in Europe in 2002 was higher than in anyprevious year. Increasing human vulnerability, rather than increas-ing physical magnitude or frequency of the events themselves, isoverall the primary factor underlying the rising impact. People areincreasingly occupying regions and locations that are exposed toflooding—settling on coasts and floodplains, for instance—thusexacerbating their vulnerability to extreme events. Ecosystemchanges have in some cases increased the severity of floods,however, for example as a result of deforestation in upland areas
................. 11432$ $SDM 10-11-05 14:50:27 PS

14 Ecosystems and Human Well-being: Current State and Trends
and the loss of mangroves. Local case studies have shown thatappropriate management of ecosystems contributes to reductionof vulnerability to extreme events.
Cultural Services
Human societies have developed in close interaction with thenatural environment, which has shaped their cultural identity,their value systems, and indeed their economic well-being.Human cultures, knowledge systems, religions, heritage values,social interactions, and the linked amenity services (such as aes-thetic enjoyment, recreation, artistic and spiritual fulfillment, andintellectual development) have always been influenced andshaped by the nature of the ecosystem and ecosystem conditionsin which culture is based. Rapid loss of culturally valued eco-systems and landscapes has led to social disruptions andsocietal marginalization in many parts of the world. [17]
The world is losing languages and cultures. At present,the greatest losses are occurring in situations where languages arenot officially recognized or populations are marginalized by rapidindustrialization, globalization, low literacy, or considerable eco-system degradation. Especially threatened are the languages of 350million indigenous peoples, representing over 5,000 linguisticgroups in 70 countries, which contain most of humankind’s tradi-tional knowledge. Much of the traditional knowledge that existedin Europe (such as knowledge on medicinal plants) has also gradu-ally eroded due to rapid industrialization in the last century. [17]
The complex relationships that exist between ecologi-cal and cultural systems can best be understood throughboth ‘‘formal knowledge’’ and ‘‘traditional knowledge.’’Traditional knowledge is a key element of sustainable develop-ment, particularly in relation to plant medicine and agriculture,and the understanding of tangible benefits derived from tradi-tional ecological knowledge such as medicinal plants and localspecies of food is relatively well developed. However, under-standing of the linkages between ecological processes and socialprocesses and their intangible benefits (such as spiritual and reli-gious values), as well as the influence on sustainable natural re-source management at the landscape level, remains relativelyweak. [17]
Many cultural and amenity services are not only of di-rect and indirect importance to human well-being, theyalso represent a considerable economic resource. (For ex-ample, nature- and culture-based tourism employs approximately60 million people and generates approximately 3% of globalGDP.) Due to changing cultural values and perceptions, there isan increasing tendency to manage landscapes for high amenityvalues (such as recreational use) at the expense of traditional land-scapes with high cultural and spiritual values. [17]
Supporting Services
There are numerous examples of both overabundance and insuf-ficiency of nutrient supply. Crop yields and nutritional value inparts of Africa, Latin America, and Asia are strongly limited bypoor soils, which have become even more depleted by farmingwith low levels of nutrient replenishment. On the other hand,overfertilization is a major contributor to environmental pollutionthrough excess nutrients in many areas of commercial farming inboth industrial and developing countries.
The capacity of terrestrial ecosystems to absorb and re-tain the nutrients supplied to them either as fertilizers orfrom the deposition of airborne nitrogen and sulfur hasbeen undermined by the radical simplification of ecosystemsinto large-scale, low-diversity agricultural landscapes. Ex-
PAGE 14
cess nutrients leak into the groundwater, rivers, and lakes and aretransported to the coast. Treated and untreated sewage releasedfrom urban areas adds to the load. The consequence of the exces-sive and imbalanced nutrient load in aquatic ecosystems is an ex-plosion of growth of certain plants (particularly algae) and a lossof many other forms of life, a syndrome known as eutrophication.The decomposing residues of the plants (often compounded byorganic pollutants) deplete the water of oxygen, creating anaero-bic ‘‘dead zones’’ devoid of life forms that depend on oxygen.Such dead zones have been discovered in many lakes and estuariesand off the mouths of several large rivers, and they are expanding.
How Are Key Ecological Systems Doing?
The systems where multiple problems are occurring at the sametime, seriously affecting the well-being of hundreds of millions ofpeople, are:• wetlands, including rivers, lakes, and salt and saltwater marshes,
where water abstraction, habitat loss and fragmentation, andpollution by nutrients, sediments, salts, and toxins have sig-nificantly impaired ecosystem function and biodiversity in mostmajor drainage basins;
• the arid parts of the world, where a large, growing, and poorpopulation often coincides with water scarcity, cultivation onmarginal lands, overgrazing, and overharvesting of trees;
• particular coastal systems, notably coral reefs, estuaries, man-groves, and urbanized coasts, where habitat loss and fragmen-tation, overharvesting, pollution, and climate change are thekey issues; and
• tropical forests, where unsustainable harvesting and clearingfor agriculture threatens biodiversity and the global climate.
The majority of ecosystems have been greatly modified byhumans. Within 9 of the 14 broad terrestrial ecosystem types(biomes), one fifth to one half of the area has been transformed tocroplands, mostly over the past two centuries. Tropical dry forestsare the most affected by cultivation, with almost half of the bi-ome’s native habitats replaced with cultivated lands. Temperategrasslands, temperate broadleaf forests, and Mediterranean forestshave each experienced more than 35% conversion. Only the bi-omes unsuited to crop plants (deserts, boreal forests, and tundra)are relatively intact. (See Table C2.) [4]
Freshwater Systems: Wetlands, Rivers, and Lakes
It is established but incomplete that inland water ecosystems arein worse condition overall than any other broad ecosystemtype, and it is speculated that about half of all freshwater wetlandshave been lost since 1900 (excluding lakes, rivers, and reservoirs).The degradation and loss of inland water habitats and species isdriven by water abstraction, infrastructure development (dams,dikes, levees, diversions, and so on), land conversion in the catch-ment, overharvesting and exploitation, introduction of exoticspecies, eutrophication and pollution, and global climate change.[20]
Clearing or drainage for agricultural development is the prin-cipal cause of wetland loss worldwide. It is estimated that by 1985,56–65% of available wetland had been drained for intensive agri-culture in Europe and North America, 27% in Asia, 6% in SouthAmerica, and 2% in Africa. The construction of dams andother structures along rivers has resulted in fragmentationof almost 40% of the large river systems in the world. This
................. 11432$ $SDM 10-11-05 14:50:28 PS

15Summary: Ecosystems and Their Services around the Year 2000
Table C2. Comparative Table of Systems as Reported by the Millennium Ecosystem Assessment. Note that these are linked humanand ecological systems and often are spatially overlapping. They can therefore be compared but they should not be added up. Figure C1presents data on human well-being by system type graphically.
Population Mean NPPShare of (kg. Share ofDensity
Areaa Terrestrial Infant Mortality carbon Systems(people per(million Surface of Growth rate GDP per Rateb (deaths per sq. Covered Share of Areasquare km.)
System and sq. Earth (percent Capita pers 1,000 live meter per by PAsc Transformedd
Subsystem km.) (percent) Urban Rural 1990–2000) (dollars) births) year) (percent) (percent)
Marine 349.3 68.6e – – – – – 0.15 0.3 -Coastal 17.2 4.1 1,105 70 15.9 8,960 41.5 – 7 –
Terrestrial 6.0 4.1 1,105 70 15.9 8,960 41.5 0.52 4 11Marine 11.2 2.2e – – – – – 0.14 9 –
Inland waterf 10.3 7.0 817 26 17 7,300 57.6 0.36 12 11Forest/woodlands 41.9 28.4 472 18 13.5 9,580 57.7 0.68 10 42
Tropical/sub-tropical 23.3 15.8 565 14 17 6,854 58.3 0.95 11 34Temperate 6.2 4.2 320 7 4.4 17,109 12.5 0.45 16 67Boreal 12.4 8.4 114 0.1 �3.7 13,142 16.5 0.29 4 25
Dryland 59.9 40.6 750 20 18.5 4,930 66.6 0.26 7 18Hyperarid 9.6 6.5 1,061 1 26.2 5,930 41.3 0.01 11 1Arid 15.3 10.4 568 3 28.1 4,680 74.2 0.12 6 5Semiarid 22.3 15.3 643 10 20.6 5,580 72.4 0.34 6 25Dry subhumid 12.7 8.6 711 25 13.6 4,270 60.7 0.49 7 35
Island 7.1 4.8 1,020 37 12.3 11,570 30.4 0.54 17 17Island states 4.7 3.2 918 14 12.5 11,148 30.6 0.45 18 21
Mountain 35.8 24.3 63 3 16.3 6,470 57.9 0.42 14 12300–1,000m 13.0 8.8 58 3 127 7,815 48.2 0.47 11 13
1,000–2,500m 11.3 7.7 69 3 20.0 5,080 67.0 0.45 14 132,500–4,500m 9.6 6.5 90 2 24.2 4,144 65.0 0.28 18 6� 4,500m 1.8 1.2 104 0 25.3 3,663 39.4 0.06 22 0.3
Polar 23.0 15.6 161g 0.06g �6.5 15,401 12.8 0.06 42g 0.3g
Cultivated 35.3 23.9 786 70 14.1 6,810 54.3 0.52 6 47Pasture 0.1 0.1 419 10 28.8 15,790 32.8 0.64 4 11Cropland 8.3 5.7 1,014 118 15.6 4,430 55.3 0.49 4 62Mixed (crop and
other) 26.9 18.2 575 22 11.8 11,060 46.5 0.6 6 43Urban 3.6 2.4 681 – 12.7 12,057 36.5 0.47 0 100GLOBAL 510 – 681 13 16.7 7,309 57.4 – 4 38
a Area estimates based on GLC2000 dataset for the year 2000 except for cultivated systems where area is based on GLCCD v2 dataset for the years1992–93 (C26 Box 1).b Deaths of children less than one year old per 1,000 live births.c Includes only natural protected areas in IUCN categories I to VI.d For all systems except forest/woodland, area transformed is calculated from land depicted as cultivated or urban areas by GLC2000 land cover dataset.The area transformed for forest/woodland systems is calculated as the percentage change in area between potential vegetation (forest biomes of the WWFecoregions) and current forest/woodland areas in GLC2000. Note: 22% of the forest/woodland system falls outside forest biomes and is therefore not includedin this analysis.e Percent of total surface of Earth.f Population density, growth rate, GDP per capita, and growth rate for the inland water system have been calculated with an area buffer of 10 kilometers.g Excluding Antarctica.
is particularly the case in river systems with parts of their basins inarid and semiarid areas. [20]
The water requirements of aquatic ecosystems are in competi-tion with human water demands. Changes in flow regime, trans-port of sediments and chemical pollutants, modification of habitat,and disruption of the migration routes of aquatic biota are someof the major consequences of this competition. Through con-sumptive use and interbasin transfers, several of the world’slargest rivers no longer run all the way to the sea for all or
PAGE 15
part of the year (such as the Nile, the Yellow, and the Colo-rado). [7]
The declining condition of inland waters is putting the ser-vices derived from these ecosystems at risk. The increase in pollu-tion to waterways, combined with the degradation of wetlands,has reduced the capacity of inland waters to filter and assimilatewaste. Water quality degradation is most severe in areas wherewater is scarce—arid, semiarid, and dry subhumid regions. Toxicsubstances and chemicals novel to the ecosystem are reaching wa-
................. 11432$ $SDM 10-11-05 14:50:28 PS

16 Ecosystems and Human Well-being: Current State and Trends
terways in increasing amounts with highly uncertain long-termeffects on ecosystems and humans. [20]
Estimates are that between 1.5 billion and 3 billion peo-ple depend on groundwater supplies for drinking. Ground-water is the source of water for 40% of industrial use and 20% ofirrigation globally. In arid countries this dependency is evengreater; for example, Saudi Arabia supplies nearly 100% of its irri-gation requirement through groundwater. Overuse and contami-nation of groundwater aquifers are known to be widespread andgrowing problems in many parts of the world, although manypollution and contamination problems that affect groundwatersupplies have been more difficult to detect and have only recentlybeen discovered. [7]
Inland waters have high aesthetic, artistic, educational, cul-tural, and spiritual values in virtually all cultures and are a focus ofgrowing demand for recreation and tourism. [20]
Dryland Systems: Deserts, Semiarid, and DrySubhumid Rangelands
Drylands cover 41% of Earth’s land surface and are inhabited bymore than 2 billion people, about one third of the human popula-tion. Semiarid drylands are the most vulnerable to loss ofecosystem services (medium certainty), because they have a rela-tively high population in relation to the productive capacity ofthe system. [22].
Desertification is the process of degradation in drylands,where degradation is defined as a persistent net loss of capacity toyield provisioning, regulating, and supporting ecosystem services.Worldwide, about 10–20% of drylands are judged to be de-graded (medium certainty). The main causes of dryland degrada-tion are grazing with domestic livestock and cutting of trees atrates exceeding the regrowth capacity of the ecosystem, inappro-priate cultivation practices that lead to erosion and salinization ofthe soil, and climate change, which is affecting rates of evapo-transpiration and precipitation.
Where the limits to sustainable cultivation and pastoralismhave been reached, the promotion of alternative livelihoods suchas production of crafts, tourism-related activities, and even aqua-culture (such as aquatic organisms of high market value, culturedin often abundant drylands’ low-quality water, within evapora-tion-proof containers) can take some pressure off dryland ecosys-tems and their services. [22]
Wetlands in drylands, such as oases, rivers, and marshes, aredisproportionately important in terms of the biodiversity that theysupport and the ecosystem services they provide. [20, 22]
It is well established that desertification has adverse im-pacts in non-dryland areas, often many thousands of kilome-ters away. For example, dust storms resulting from reducedvegetative cover lead to air quality problems, both locally and faraway. Drought and loss of land productivity are dominant factorsthat cause people to migrate from drylands to better-servicedareas. [22]
Forests, Including Woodlands and Tree Plantations
The global area of naturally regenerating forest has declinedthroughout human history and has halved over the past three cen-turies. Forests have effectively disappeared in 25 countries,and more 90% of the former forest cover has been lost in afurther 29 countries. [21]
Following severe deforestation in past centuries, forest coverand biomass in North America, Europe, and North Asia are cur-rently increasing due to the expansion of forest plantations andregeneration of natural forests. From 1990 to 2000, the global
PAGE 16
area of temperate forest increased by almost 3 million hectares peryear, of which approximately 1.2 million hectares were wasplanted forest. The main location of deforestation is now in thetropics, where it has occurred at an average rate exceeding 12million hectares per year over the past two decades. (See FigureC5.) Taken as a whole, the world’s forests are not managedin a sustainable way, and there is a total net decrease inglobal forest area, estimated at 9.4 million hectares peryear. In absolute terms, the rate and extent of woodland loss ex-ceeds that of forests.
The decline in forest condition is caused, among other factors,by the low political power of human communities in forest areasin many countries; deforestation due to competitive land use andpoor management; slow change of traditional, wood-orientedforest management paradigms; the lack of forest management onlandscape-ecosystem basis; acceleration of natural and human-induced disturbance regimes during the last decade (possiblylinked to climate change); and illegal harvest in many developingcountries and countries with economies in transition, often linkedto corruption. [21]
In addition to the 3.3 billion cubic meters of wood deliveredby forests annually, numerous non-wood forest products are im-portant in the lives of hundreds of millions people. Several studiesshow that the combined economic value of ‘‘nonmarket’’ (socialand ecological) services often exceeds the economic value of di-rect use of the timber, but the nonmarket values are usually notconsidered in the determination of forest use. Wooded landscapesare home to about 1.2 billion people, and 350 million of theworld’s people, mostly the poor, depend substantially fortheir subsistence and survival on local forests. Forests andwoodlands constitute the natural environment and almost solesource of livelihood for 60 million indigenous people and areimportant in the cultural, spiritual, and recreational life of com-munities worldwide. [21]
Terrestrial ecosystems, and wooded lands in particular, are tak-ing up about a fifth of the global anthropogenic emissions of car-bon dioxide, and they will continue to play a significant role inlimiting global climate change over the first decades of this cen-tury. Tree biomass constitutes about of 80% of terrestrial biomass,and forests and woodlands contain about half of the world’sterrestrial organic carbon stocks. Forests and woodlands pro-vide habitat for half or more of the world’s known terrestrial plantand animal species, particularly in the tropics. [21]
Marine and Coastal Systems
All the oceans of the world, no matter how remote, arenow affected by human activities. Ecosystem degradation as-sociated with fishing activities is the most widespread and domi-nant impact, with pollution as an additional factor on coastalshelves, and habitat loss a factor in populated coastal areas. [18,19]
Global fish landings peaked in the late 1980s and arenow declining (medium certainty). There is little likelihood of thisdeclining trend reversing under current practices. Fishing pressureis so strong in some marine systems that the biomass of targetedspecies, especially larger fishes as well as those caught incidentally,has been reduced by 10 times or more relative to levels prior tothe onset of industrial fishing. In addition to declining land-ings, the average trophic level of global landings is declin-ing (in other words, the high-value top-predator fish are beingreplaced in catches by smaller, less preferred species), and themean size of caught fish is diminishing in many species, includingyellowfin and bigeye tuna. [18]
................. 11432$ $SDM 10-11-05 14:50:29 PS

17Summary: Ecosystems and Their Services around the Year 2000
Source: Millennium Ecosystem Assessment
spots
Figure C5. Locations Reported by Various Studies as Undergoing High Rates of Land Cover Change in the Past Few Decades. Inthe case of forest cover change, the studies refer to the period 1980–2000 and are based on national statistics, remote sensing, and to alimited degree expert opinion. In the case of land cover change resulting from degradation in drylands (desertification), the period is unspeci-fied but inferred to be within the last half-century, and the major study was entirely based on expert opinion, with associated high levels ofuncertainty. Change in cultivated area is not shown. Note that areas showing little current change are often locations that have alreadyundergone major change.
Industrial fleets are fishing further offshore and deeper to meetthe global demand for fish. Until a few decades ago, depth anddistance from coasts protected much of the deep-ocean faunafrom the effect of fishing. Massive investments in the develop-ment of fishing capacity has led to fleets that now operate in allparts of the world’s oceans, including polar areas, at great depths,and in low-productivity tropical zones. These trawl catches areextracted from easily depleted accumulations of long-lived spe-cies. The biomass of large pelagic fishes exploited by long liners,purse seiners, and drift netters have also plummeted. Somefisheries that collapsed in recent decades show no signs ofrecovering, such as Newfoundland cod stocks in the northwestAtlantic and orange roughy in New Zealand. [18]
Oil spills, depletions of marine mammals and seabirds, andocean dumping also contribute to degradation in marine systems,especially at local and regional scales. Although major oils spillsare infrequent, their impacts are severe when they do occur.Overfishing and pollution affect marine mammals and seabirdsthrough declining food availability. An estimated 313,000 con-tainers of low-intermediate radioactive waste dumped in the At-lantic and Pacific Oceans since 1970 pose a significant threat todeep-sea ecosystems should the containers leak. [18]
Coastal ecosystems are among the most productive yet highlythreatened systems in the world. Approximately 35% of man-groves for which data are available and 20% of coral reefs areestimated to have been destroyed, and a further 20% of coralsdegraded globally since 1960. Degradation is also a severe prob-lem, both from pressures originating within the coastal zones and
PAGE 17
from the negative impacts of upstream land uses. Upstream fresh-water diversion has meant a 30% decrease worldwide in waterand sediment delivery to estuaries, which are key nursery areasand fishing grounds. [19] Knowledge of cold-water corals is lim-ited, and new large reefs are still being discovered. Cold-watercoral reefs are estimated to have high species diversity, the biggestthreat to which comes from fishery trawling activities.
The main indirect drivers of coastal ecosystem change are re-lated to development activities on the land, particularly in areasadjacent to the coast. Approximately 17% of the world liveswithin the boundaries of the MA coastal system (up to an eleva-tion of 50 meters above sea level and no further than 100 kilome-ters from a coast), and approximately 40% live in the full areawithin 100 kilometers of a coast. The absolute number is increas-ing through a combination of in-migration, high reproductionrates, and tourism. Physical demand on coastal space is increasingthrough urban sprawl, resort and port development, and aquacul-ture, the impacts of which extend beyond the direct footprintsdue to pollution, sedimentation, and changes in coastal dynamics.Destructive fishing practices, overharvesting, climate change, andassociated sea level rise are also important threats to coastal habi-tats, including forests, wetlands, and coral reefs.
Nearly half of the coastal population has no access toimproved sanitation and thus faces increasing risks of dis-ease as well as decreasing ecosystem services as a result ofpollution by human wastes. Harmful algal blooms and otherpathogens affecting the health of both humans and marine organ-isms are on the rise. [19] Nitrogen loading to the coastal zone has
................. 11432$ $SDM 10-11-05 14:50:40 PS

18 Ecosystems and Human Well-being: Current State and Trends
doubled worldwide and has driven coral reef community shifts.Alien species invasions have also altered coastal ecosystems andthreaten both marine species and human well-being. [18]
Island Systems
The ability of island systems to meet the rising demands of localpopulations for services has declined considerably, such that someislands are now unable to meet such demands without importingsignificant services from elsewhere. Biodiversity loss and habi-tat destruction on islands can have more immediate andserious repercussions than on continental systems, as a con-sequence of the relatively restricted genetic diversity, small popu-lation sizes and narrow distribution ranges of plants and animalson islands. Many studies show that specialization, coupled withisolation and endemism, make island ecosystems especially sensi-tive to disturbances. Island species have become extinct at ratesthat have exceeded those observed on continents, and the mostimportant driver of wild population declines and species extinc-tion on islands has been the introduction of invasive alien species.Although the idea that islands are more susceptible to biologicalinvasion is poorly supported by current information, the impactsof invasive species once they are established are usually more rapidand more pronounced on islands. [23]
In recent years tourism, especially nature-based tourism, hasbeen the largest area of economic diversification for inhabitedislands. However, unplanned and unregulated development hasresulted in ecosystem degradation, including pollution, and loss ofcoral reefs, which is undermining the very resource on which thetourism sector is based. Alternative, more environmentally andculturally sensitive forms of tourism (‘‘ecotourism’’) have devel-oped in some areas. [23]
Cultivated Systems: Croplands, Planted Pastures,and Agroforestry
Cultivated lands are ecosystems highly transformed and managedby humans for the purpose of providing food and fiber, often atthe expense of other ecosystem services. More land was con-verted to cropland in the 30 years after 1950 than in the 150years between 1700 and 1850, and one quarter of Earth’sterrestrial surface is now occupied by cultivated systems.(See Figure C6.) Within this area, one fifth is irrigated. [26]
As the demand for food, feed, and fiber has increased, farmershave responded both by expanding the area under cultivation (ex-tensification) and by raising yields per unit land and per unit time(intensification). Over the past 40 years, in global aggregate,intensification has been the primary source of increasedoutput, and in many regions (including in the European Union,North America, Australia, and recently China) the extent of landunder cultivation has stabilized or even contracted. However,countries with low productivity and high population pressure—conditions that apply in much of sub-Saharan Africa—continueto rely mainly on expansion of cultivated areas for increasing foodproductivity. In Asia (outside of China), almost no high-productivityland remains available for the expansion of agriculture. Areaexpansion usually brings more marginal land (steeper slopes,poorer soils, and harsher climates) into production, often withunwelcome social and environmental consequences. Urbanexpansion is a growing cause of displacement of cultivation, butthe area involved remains small in global terms. [26]
Increases in the yields of crop production systems dueto increased use of inputs over the past 40 years have re-duced the pressure to convert other ecosystems into crop-land. Twenty million square kilometers of natural ecosystem have
PAGE 18
been protected from conversion to farmland since 1950 due tomore intensive production. On the other hand, intensification hasincreased pressure on inland water ecosystems due to increasedwater withdrawals for irrigation and to nutrient and pesticideleakage from cultivated lands, with negative consequences forfreshwater and coastal systems, such as eutrophication. Inten-sification also generally reduces biodiversity within agriculturallandscapes and requires higher energy inputs in the form of mech-anization and the production of chemical fertilizers. Especially insystems that are already highly intensified, the marginal value offurther increased production must be weighed against the addi-tional environmental impacts. [26]
The intrinsic capacity of cultivated systems to supportcrop production is being undermined by soil erosion andsalinization and by loss of agricultural biodiversity, but theireffect on food production is masked by increasing use of fertilizer,water, and other agricultural inputs. (See Figure C7.) [8, 22, 26]
National policies, international agreements, and market forcesplay a significant role in determining the fate of ecosystems ser-vices as a consequence of cultivation. They all influence farmerchoices about the scale and type of cultivation as well as the leveland mix of production inputs that, in turn, influence trade-offsamong the mix and level of ecosystem services that cultivatedsystems can deliver. [26]
Urban Systems
Urban areas currently cover less than 3% of the total land areaof Earth, but they contain an increasing fraction of the world’spopulation. Currently about half of the world’s people live inurban areas. The urban requirements for ecosystem services arehigh, but it could be just as stressful if the same number of people,with similar consumption and production patterns, were dispersedover the rural landscape. In general, the well-being of urbandwellers is higher than that of their rural neighbors, as mea-sured by wealth, health, and education indicators. Urban centersfacilitate human access to and management of certain ecosystemservices through, for example, the scale economies of piped watersystems. [27]
Nevertheless, urban developments pose significant challengeswith respect to ecosystem services and human well-being. Theproblems include inadequate and inequitable access to ecosystemservices within urban areas, degradation of ecosystems adjoiningurban areas, and pressures on distant ecosystems resulting fromproduction, consumption, and trade originating in urban areas.[27]
In affluent countries, the negative impacts of urban set-tlements on ecosystem services and human well-beinghave been delayed and passed on to future generations ordisplaced onto locations away from the urban area. Whileurban developments in other parts of the world have been quitedifferent, this trend and its political implication remain significant.[27]
Interrelated problems involving local water, sanitation, waste,and pests contribute a large share of the urban burden of disease,especially in low-income settlements. The consumption and pro-duction activities driving long-term, global ecosystem change areconcentrated in urban centers, especially upper-income settle-ments. [27]
Urbanization is not inherently bad for ecosystems: eco-systems in and around urban areas can provide a high level ofbiodiversity, food production, water services, comfort, amenities,cultural values, and so on if well managed. When the loss of eco-system services due to urban activities is systematically addressed,
................. 11432$ $SDM 10-11-05 14:50:41 PS

19Summary: Ecosystems and Their Services around the Year 2000
Figure C6. Extent of Cultivated Systems in 2000. Cultivated systems (defined in the MA to be areas in which at least 30% of the landscapecomes under cultivation in any particular year) cover 24% of the terrestrial surface.
Figure C7. Trends in the Factors Related to Global Food Production since 1961. There have been significant trade-offs in cultivatedsystems between food production and water availability for other uses (due to irrigation), as well as water quality (due to increased nutrientloading). The role of improved crop varieties has also been extremely significant since 1961.
these losses can be greatly reduced. With a few exceptions, how-ever, there is little evidence of cities taking significant steps toreduce their global ecosystem burdens. A city may be sustainedby ecosystem services derived from an area up to 100 times largerthan the city itself. [27]
PAGE 19
Polar Systems
Direct, locally caused impacts of human activities on polarregions have been modest, and the most significant causesof change mainly originate outside the polar region. These
................. 11432$ $SDM 10-11-05 14:50:50 PS

20 Ecosystems and Human Well-being: Current State and Trends
global drivers must be addressed if loss of polar ecosystem servicesand human well-being is to be avoided, but in the immediateterm, mitigation of impacts is the most feasible and urgent strat-egy. Polar regions have a high potential to continue providing keyecosystem services, particularly in wetlands, where biodiversityand use of subsistence resources are concentrated. [25]
The climate has warmed more quickly in portions of the Arc-tic (particularly in the western North American Arctic and centralSiberia) and Antarctic (especially the Antarctic peninsula) thanin any other region on Earth. As a consequence of regionalwarming, ecosystem services and human well-being inpolar regions have been substantially affected (high certainty).Warming-induced thaw of permafrost is widespread in Arcticwetlands, causing threshold changes in ecosystem services, includ-ing subsistence resources and climate feedbacks (energy and tracegas fluxes) and support for industrial and residential infrastructure.
Regional warming interacts with socioeconomic change toreduce the subsistence activities of indigenous and other ruralpeople, the segment of society with greatest cultural and eco-nomic dependence on these resources. Warming has reduced ac-cess to marine mammals due to there being less sea ice and hasmade both the physical and the biotic environment less predict-able. Industrial development has further reduced the capacity ofecosystems to support subsistence activities in some locations. Thenet effect is generally to increase the economic disparity betweenrural subsistence users and urban residents in polar regions. [25]
Changes in polar biodiversity are affecting the resources onwhich Arctic people depend for their livelihoods. Importantchanges include increased shrub dominance in Arctic wetlands,which contributes to summer warming trends and alters forageavailable to caribou; changes in insect abundance that alter foodavailability to wetland birds and energy budgets of reindeer andcaribou; increased abundance of snow geese that are degradingArctic wetlands; and overgrazing by domestic reindeer in parts ofFennoscandia and Russia. There has also been a reduction of toppredators in Antarctic food webs, altering marine food resourcesin the Southern Ocean. [25]
Increases in persistent organic pollutants and radionuclides insubsistence foods have increased health risks in some regions ofthe Arctic, but diet changes associated with the decline in harvestof these foods are usually a greater health risk. [25]
Mountain Systems
Mountain systems straddle all geographical zones and containmany different ecosystem types. Ninety percent of the 720 mil-lion people in the global mountain population live in developingand transition countries, with one third of them in China. Al-most all of the people living above 2,500 meters (about 70million people) live in poverty and are especially vulnera-ble to food insecurity.
Human well-being in lowland areas often depends on re-sources originating in mountain areas, such as timber, hydroelec-tricity, and water. Indeed, river basins from mountain systemssupply nearly half of the human population with water, includingin some regions far from the mountains themselves, and loss ofecosystem functions in mountains increases environmentalrisks in both mountains and adjacent lowland areas. How-ever, there is rarely a systematic reinvestment of benefits derivedfrom mountain systems in the conservation of upland resources.Mountains often represent political borders, narrow key transportcorridors, or refuges for minorities and political opposition, andas such they are often focal areas of armed conflicts. [24]
PAGE 20
The compression of climatic zones along an elevation gradientin mountains results in large habitat diversity and species richnessin mountains, which commonly exceeds that found in lowlands.Rates of endemism are also relatively high in mountains due totopographic isolation. Mountains occupy about one fifth of theterrestrial surface but host a quarter of terrestrial biodiversity,nearly half of the world’s biodiversity ‘‘hotspots,’’ and 32% of theglobal area designated for biodiversity protection. Mountains alsohave high ethnocultural diversity. Scenic landscapes and clean airmake mountains target regions for recreation and tourism. [24]
Mountain ecosystems are unusually exposed and sensitive to avariety of stresses, specifically climate-induced vegetative changes,volcanic and seismic events, flooding, loss of soil and vegetationcaused by extractive industries, and inappropriate agriculturalpractices. On average, glaciers have lost 6–7 meters of depth(thickness) over the last 20 years, and this reduction in glaciervolume is expected to have a strong impact on dry-season riverflows in rivers fed largely by ice melt. The specialized natureof mountain biota and low temperatures in mountain sys-tems make recovery from disturbances typically very slow.[24]
Limits, Trade-offs, and Knowledge
• The growing demand for provisioning services, such as water,food, and fiber, has largely been met at the expense of support-ing, regulating, and cultural ecosystem services.
• For some provisioning services, notably fresh water and wild-harvested fish, demand exceeds the available supply in largeand expanding parts of the world.
• Some ongoing, large-scale human-induced ecosystemchanges, such as those involving loss of biodiversity, climatechange, excessive nutrient supply, and desertification, are ef-fectively irreversible. Urgent mitigation action is needed to limitthe degree of change and its negative impacts on human well-being.
• Enough is known to begin to make wiser decisions regardingprotection and use of ecosystem services. Making this informa-tion available to decision-makers is the purpose of the Millen-nium Ecosystem Assessment.
Limits and Thresholds in Coupled Human-Ecological Systems
The current demand for many ecosystems services is un-sustainable. If current trends in ecosystem services areprojected, unchanged, to the middle of the twenty-firstcentury, there is a high likelihood that widespread con-straints on human well-being will result. This highlights theneed for globally coordinated adaptive responses, a topic furtherexplored in the MA Scenarios and Policy Responses volumes.
Some limits to the degree of acceptable ecosystem change rep-resent the level of tolerance by society, reflecting the trade-offsthat people are willing (or forced) to make between different as-pects of well-being. They are ‘‘soft limits,’’ since they are sociallydetermined and thus move as social circumstances change. Manysuch limits are currently under international negotiation, indicat-ing that some key ecosystem services are approaching levels ofconcern. Examples are the amounts of fresh water allocated todifferent countries in shared basins, regional air quality norms, andthe acceptable level of global climate change.
................. 11432$ $SDM 10-11-05 14:50:52 PS
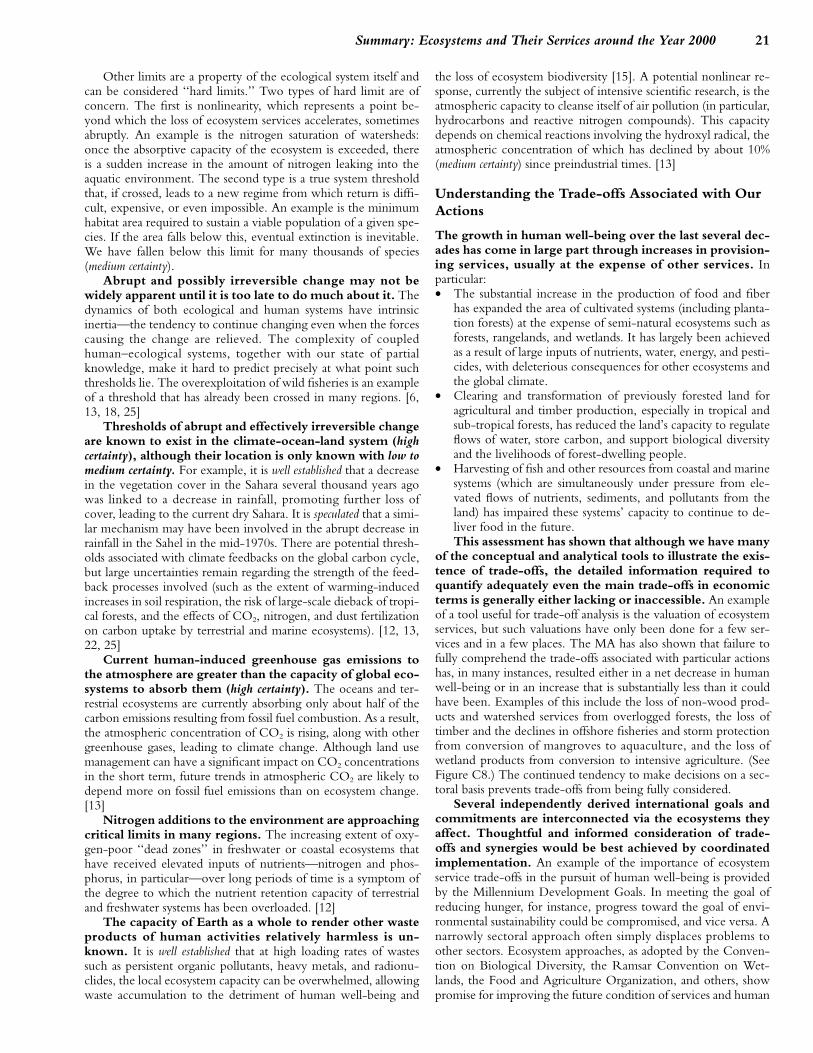
21Summary: Ecosystems and Their Services around the Year 2000
Other limits are a property of the ecological system itself andcan be considered ‘‘hard limits.’’ Two types of hard limit are ofconcern. The first is nonlinearity, which represents a point be-yond which the loss of ecosystem services accelerates, sometimesabruptly. An example is the nitrogen saturation of watersheds:once the absorptive capacity of the ecosystem is exceeded, thereis a sudden increase in the amount of nitrogen leaking into theaquatic environment. The second type is a true system thresholdthat, if crossed, leads to a new regime from which return is diffi-cult, expensive, or even impossible. An example is the minimumhabitat area required to sustain a viable population of a given spe-cies. If the area falls below this, eventual extinction is inevitable.We have fallen below this limit for many thousands of species(medium certainty).
Abrupt and possibly irreversible change may not bewidely apparent until it is too late to do much about it. Thedynamics of both ecological and human systems have intrinsicinertia—the tendency to continue changing even when the forcescausing the change are relieved. The complexity of coupledhuman–ecological systems, together with our state of partialknowledge, make it hard to predict precisely at what point suchthresholds lie. The overexploitation of wild fisheries is an exampleof a threshold that has already been crossed in many regions. [6,13, 18, 25]
Thresholds of abrupt and effectively irreversible changeare known to exist in the climate-ocean-land system (highcertainty), although their location is only known with low tomedium certainty. For example, it is well established that a decreasein the vegetation cover in the Sahara several thousand years agowas linked to a decrease in rainfall, promoting further loss ofcover, leading to the current dry Sahara. It is speculated that a simi-lar mechanism may have been involved in the abrupt decrease inrainfall in the Sahel in the mid-1970s. There are potential thresh-olds associated with climate feedbacks on the global carbon cycle,but large uncertainties remain regarding the strength of the feed-back processes involved (such as the extent of warming-inducedincreases in soil respiration, the risk of large-scale dieback of tropi-cal forests, and the effects of CO2, nitrogen, and dust fertilizationon carbon uptake by terrestrial and marine ecosystems). [12, 13,22, 25]
Current human-induced greenhouse gas emissions tothe atmosphere are greater than the capacity of global eco-systems to absorb them (high certainty). The oceans and ter-restrial ecosystems are currently absorbing only about half of thecarbon emissions resulting from fossil fuel combustion. As a result,the atmospheric concentration of CO2 is rising, along with othergreenhouse gases, leading to climate change. Although land usemanagement can have a significant impact on CO2 concentrationsin the short term, future trends in atmospheric CO2 are likely todepend more on fossil fuel emissions than on ecosystem change.[13]
Nitrogen additions to the environment are approachingcritical limits in many regions. The increasing extent of oxy-gen-poor ‘‘dead zones’’ in freshwater or coastal ecosystems thathave received elevated inputs of nutrients—nitrogen and phos-phorus, in particular—over long periods of time is a symptom ofthe degree to which the nutrient retention capacity of terrestrialand freshwater systems has been overloaded. [12]
The capacity of Earth as a whole to render other wasteproducts of human activities relatively harmless is un-known. It is well established that at high loading rates of wastessuch as persistent organic pollutants, heavy metals, and radionu-clides, the local ecosystem capacity can be overwhelmed, allowingwaste accumulation to the detriment of human well-being and
PAGE 21
the loss of ecosystem biodiversity [15]. A potential nonlinear re-sponse, currently the subject of intensive scientific research, is theatmospheric capacity to cleanse itself of air pollution (in particular,hydrocarbons and reactive nitrogen compounds). This capacitydepends on chemical reactions involving the hydroxyl radical, theatmospheric concentration of which has declined by about 10%(medium certainty) since preindustrial times. [13]
Understanding the Trade-offs Associated with OurActions
The growth in human well-being over the last several dec-ades has come in large part through increases in provision-ing services, usually at the expense of other services. Inparticular:• The substantial increase in the production of food and fiber
has expanded the area of cultivated systems (including planta-tion forests) at the expense of semi-natural ecosystems such asforests, rangelands, and wetlands. It has largely been achievedas a result of large inputs of nutrients, water, energy, and pesti-cides, with deleterious consequences for other ecosystems andthe global climate.
• Clearing and transformation of previously forested land foragricultural and timber production, especially in tropical andsub-tropical forests, has reduced the land’s capacity to regulateflows of water, store carbon, and support biological diversityand the livelihoods of forest-dwelling people.
• Harvesting of fish and other resources from coastal and marinesystems (which are simultaneously under pressure from ele-vated flows of nutrients, sediments, and pollutants from theland) has impaired these systems’ capacity to continue to de-liver food in the future.This assessment has shown that although we have many
of the conceptual and analytical tools to illustrate the exis-tence of trade-offs, the detailed information required toquantify adequately even the main trade-offs in economicterms is generally either lacking or inaccessible. An exampleof a tool useful for trade-off analysis is the valuation of ecosystemservices, but such valuations have only been done for a few ser-vices and in a few places. The MA has also shown that failure tofully comprehend the trade-offs associated with particular actionshas, in many instances, resulted either in a net decrease in humanwell-being or in an increase that is substantially less than it couldhave been. Examples of this include the loss of non-wood prod-ucts and watershed services from overlogged forests, the loss oftimber and the declines in offshore fisheries and storm protectionfrom conversion of mangroves to aquaculture, and the loss ofwetland products from conversion to intensive agriculture. (SeeFigure C8.) The continued tendency to make decisions on a sec-toral basis prevents trade-offs from being fully considered.
Several independently derived international goals andcommitments are interconnected via the ecosystems theyaffect. Thoughtful and informed consideration of trade-offs and synergies would be best achieved by coordinatedimplementation. An example of the importance of ecosystemservice trade-offs in the pursuit of human well-being is providedby the Millennium Development Goals. In meeting the goal ofreducing hunger, for instance, progress toward the goal of envi-ronmental sustainability could be compromised, and vice versa. Anarrowly sectoral approach often simply displaces problems toother sectors. Ecosystem approaches, as adopted by the Conven-tion on Biological Diversity, the Ramsar Convention on Wet-lands, the Food and Agriculture Organization, and others, showpromise for improving the future condition of services and human
................. 11432$ $SDM 10-11-05 14:50:52 PS

22 Ecosystems and Human Well-being: Current State and Trends
Figure C8. Economic Benefits under Alternate ManagementPractices. In each case, the net benefits from the more sustainablymanaged ecosystem are greater than those from the converted eco-system even though the private (market) benefits would be greaterfrom the converted ecosystem. (Where ranges of values are given inthe original source, lower estimates are plotted here.)
well-being as a whole, specifically by balancing the objectives ofeconomic development and ecosystem integrity. In managingecosystems, a balance needs to be found between provisioningservices on the one hand and supporting, regulating, cultural andamenity services on the other hand. [7, 28]
Knowledge and Uncertainty
The experience of this assessment has been that it is hard todemonstrate, quantitatively and unequivocally, the widelyaccepted and intuitive link between ecosystem changesand changes in human well-being. There are several reasonsfor this. First, the impacts of ecosystem change on well-being areoften subtle, which is not to say unimportant; impacts need notbe blatant to be significant. Second, human well-being is affectedby many factors in addition to the effects of ecosystem services.Health outcomes, for example, are the combined result of ecosys-tem condition, access to health care, economic status, and myriadother factors. Unequivocally linking ecosystem changes to changes
PAGE 22
in well-being, and vice versa, is especially difficult when the dataare patchy in both cases, as they usually are. Analyses linking well-being and ecosystem condition are most easily carried out at alocal scale, where the linkages can be most clearly identified, butinformation on ecosystems and human well-being is often onlyavailable in highly aggregated form, for instance at the nationallevel. Spatially explicit data with sub-national resolution wouldgreatly facilitate future assessments. [2]
The availability and accuracy of data sources and methods forthis assessment were greatest for provisioning services, such ascrop yield and timber production. Direct data on regulating, sup-porting, and cultural services such as nutrient cycling, climateregulation, or aesthetic value are difficult to obtain, making itnecessary to use proxies, modeled results, or extrapolations fromcase studies. Data on biodiversity have strong biases toward thespecies level, large organisms, temperate systems, and species useddirectly by people. [2, 4, 28]
Knowledge for quantifying ecosystem responses to stress isequally uneven. Methods to estimate crop yield responses to fer-tilizer application, for example, are well developed, but methodsto quantify relationships between ecosystem services and humanwell-being, such as the effects of altered levels of biodiversity onthe incidence of diseases in humans, are at an earlier stage of de-velopment. Thousands of novel chemicals, including long-livedsynthetic pharmaceuticals, are currently entering the biosphere,but there are few systematic studies to understand their impact onecosystems and human well-being. [2, 28]
Observation systems relating to ecosystem services aregenerally inadequate to support informed decision-making.Some previously more-extensive observation systems have de-clined in recent decades. For example, substantial deterioration ofhydrographic networks is occurring throughout the world. Thesame is true for standard water quality monitoring and the record-ing of biological indicators. [7]
Both ‘‘traditional’’ and ‘‘formal’’ knowledge systemshave considerable value for achieving the conservation andsustainable use of ecosystems. The loss of traditional knowl-edge has significantly weakened the linkages between ecosystemsand cultural diversity and cultural identity. This loss has also hada direct negative effect on biodiversity and the degradation ofecosystems, for instance by exceeding traditionally establishednorms for resource use. This knowledge is largely oral. As sig-nificant is the loss of languages, which are the vehicle by whichcultures are communicated and reproduced. [17]
A Call for Action
Despite the gaps in knowledge, enough is known to indicatethe need for urgent collective action, building on existingactivities, to mitigate the further loss of ecosystem ser-vices. It is well established that inadequate access to ecosystem ser-vices currently is an important factor in the low well-being of alarge fraction of the global population and is likely to constrainimprovements in well-being in the future.
Urgency is indicated because in situations where the proba-bility of effectively irreversible, negative impacts is high, wherethe human and natural systems involved have high inertia, andwhere knowledge of the consequences is incomplete, early actionto reduce the rate of change is more rational than waiting untilconditions become globally intolerable and potentially irrevers-ible. Collective action is required because uncoordinated indi-vidual action is necessary but insufficient to mitigate the manyissues that have large-scale underlying causes, mechanisms, orconsequences. Coordinated action at all levels of social organiza-
................. 11432$ $SDM 10-11-05 14:51:31 PS

23Summary: Ecosystems and Their Services around the Year 2000
tion—from local to global—is called for if the many islands oflocal failure are not to coalesce into expanding regions of degrada-tion and if problems with global reach are to be managed. Coor-dinated action is also required to enable islands of local success tobe expanded and propagated in distant locations.
The history of human civilization has many examples of socialupheaval associated with ecosystem service failure at the local orregional scale. There are many current examples where the de-mands on ecosystems are exceeding the limits of the system tosupply ecosystem services. Global-scale examples are given in thisreport, and local and regional examples are found in the MultiscaleAssessments volume. Two things are different now comparedwith any other time in history: human impacts are nowubiquitous and of greater intensity than at any time in thepast, and in most cases we can no longer plead ignoranceof the consequences. Whereas in the past, natural disasters, pol-lution, or resource depletion led to local hardships, realignmentof power, and the regional migration of people to better-serviced
PAGE 23
areas, in the present era the impacts are global in reach. Displace-ment of the problem to other places and future generations, orstarting afresh in a new place, are no longer viable options.
A turning point in the growth of the human population onEarth is likely by mid-century. As the Scenarios and Policy Responsesvolumes show, the opportunity and technical means exist to pro-vide food, water, shelter, a less-hazardous environment, and a bet-ter life to the existing population, and even to the additional 3billion people likely to inhabit Earth by the middle of the twenty-first century, but we are currently failing to achieve this. We arealso undermining our capacity to do so in the future by failing totake actions that will reduce the risk of adverse changes in Earth’secological systems that will be difficult and costly to reverse.
Reducing the pressure on critical systems and serviceswill be neither easy nor cost-free, but it is certain that nethuman well-being is better served by maintaining ecosys-tems in a condition that is capable of providing adequatelevels of essential services than by trying to restore suchfunctions at some future time.
................. 11432$ $SDM 10-11-05 14:51:32 PS

PAGE 24................. 11432$ $SDM 10-11-05 14:51:32 PS