aboriginal learners in british columbia’s public post ... · group and the post–secondary...
TRANSCRIPT

Aboriginal Learners in British Columbia’s
Public Post-Secondary System
June 2018 Ministry of Advanced Education, Skills and Training

2
Introduction ................................................................................................................................................... 3
Scope ......................................................................................................................................................... 5
Demographics of the Aboriginal Population in British Columbia ............................................................ 5
Overview of the Public Post-Secondary System in British Columbia ...................................................... 6
Section 1: K-12 Completion and Transitions ................................................................................................ 9
Six Year Completion Rates: Aboriginal and Non-Aboriginal Learners ................................................... 9
Dogwood Diplomas and Evergreen Certificates ..................................................................................... 10
Post-Secondary Transitions: Aboriginal and Non-Aboriginal Learners ................................................. 12
Section 2: Aboriginal Learners in the B.C. Public Post-Secondary System ............................................... 16
Student Full-Time Equivalents (FTEs) ................................................................................................... 16
Headcount ............................................................................................................................................... 18
Credentials .............................................................................................................................................. 20
Section 3: Aboriginal Learners in B.C. Public Post-Secondary Institutions ............................................... 22
Institutions .............................................................................................................................................. 22
Programs ................................................................................................................................................. 26
Credential Types ..................................................................................................................................... 29
Section 4: Aboriginal Learner Characteristics ............................................................................................ 31
Gender ..................................................................................................................................................... 31
Age Groups ............................................................................................................................................. 34
Section 5: Aboriginal Learner Outcomes .................................................................................................... 37
Baccalaureate Graduates Survey Data (2014-2016) ............................................................................... 37
Diploma, Associate Degree, and Certificate Survey Data (2014-2016) ................................................. 39
Apprenticeship Survey Data (2014-2016) .............................................................................................. 41
Conclusion .................................................................................................................................................. 44
Appendix 1 – Data Sources ..................................................................................................................... 48
Appendix 2 - Classification of Instructional Programs ........................................................................... 51
3
Introduction The Aboriginal Post-Secondary Education and Training Policy Framework and Action Plan (Aboriginal
Policy Framework) outlines a plan for improving post-secondary opportunities and outcomes for First
Nations, Métis and Inuit peoples. The vision in the Aboriginal Policy Framework is that:
Aboriginal learners succeed in an integrated, relevant, and effective British Columbia
post-secondary education system that enhances their participation in the social, cultural
and economic life of their communities, the province, and global society.
Consistent with commitments made in the New Relationship document, Transformative Change Accord,
and Métis Nation Relationship Accord, the Aboriginal Policy Framework was developed by a working
group of British Columbia’s Aboriginal Post-Secondary Education Partners, including the First Nations
Education Steering Committee, the Indigenous Adult and Higher Learning Association, Métis Nation
British Columbia, the First Nations Public Service, BC Colleges, BC Association of Universities and
Institutes, and the Research Universities’ Council of British Columbia. The Aboriginal Post-Secondary
Education Partners continue to monitor the implementation of the Aboriginal Policy Framework.
Goal 5 of the Aboriginal Policy Framework states that “continuous improvement is based on research,
data-tracking and sharing of leading practices.” One of the objectives under that goal is that
“Governments, Aboriginal institutes and public post-secondary institutions make evidence-based
decisions with respect to Aboriginal post-secondary education.” The Aboriginal Policy Framework notes
that there is a need to increase the amount of consistent, accurate and reliable data relating to
Aboriginal post-secondary education so that governments, post-secondary institutions and Aboriginal
institutes can work together to improve policy decisions and determine the effectiveness of various
actions over the short, medium and long-term. The Aboriginal Policy Framework commits the Province
to working with Aboriginal post-secondary partners to report accurately and regularly on post-
secondary education and training progress and outcomes, including the results and outcomes contained
in the Aboriginal Policy Framework. This report is the result of those commitments.
Developed by a working group of the Aboriginal Post-Secondary Education Partners, this report provides
an overview of Aboriginal learners in British Columbia. Section 1 examines the data on transitions from
K-12 to the post-secondary system. Section 2 discusses recent trends in the B.C. public post-secondary
system including headcount, full-time equivalents and credentials. Section 3 analyzes the Aboriginal
4
learner data by institution, program area and credential type. Section 4 highlights demographic
characteristics of the Aboriginal learner population including differences by gender and age group.
Finally, section 5 focuses on the results of the student outcomes surveys of recent graduates from
baccalaureate, certificate, diploma, associate degree, and apprenticeship programs. Data notes and
sources can be found in Appendices 1 and 2.
A note about terminology: The terms Aboriginal and Indigenous are both used as an inclusive reference
to First Nations, Inuit, and Métis peoples. The British Columbia government is now using the term
Indigenous as the collective term for First Nations, Inuit, and Métis peoples where appropriate. In this
report, the term Aboriginal is used because the data in this report has been collected based on learners
self-identifying as an Aboriginal person.
5
Scope
This report compares the experiences and outcomes of Aboriginal and non-Aboriginal domestic learners
attending public schools and public post-secondary institutions in British Columbia.
Domestic learners are learners who are Canadian residents (i.e. citizens and landed immigrants), and do
not include international learners. The focus of this report reflects the Province of British Columbia’s
commitment “to reporting progress in closing the socio-economic gap between Aboriginal and non-
Aboriginal British Columbians.”
Demographics of the Aboriginal Population in British Columbia
British Columbia‘s total population increased by 10.6% between the 2006 Census and the 2016 Census.
During the same time period, the Aboriginal population grew by 38.0%. As a result, the Aboriginal
population in B.C. grew from 4.8% of the total population in 2006 to 5.9% in 2016.1 According to the
2016 Census, the Aboriginal population in British Columbia is also much younger than the non-
Aboriginal population – with a median age of 32.8 years compared to 42.4 years for the non-Aboriginal
population. Nearly 42.5% of the Aboriginal population in the province is under 25, compared to 26.1% of
the non-Aboriginal population. Given the growth of this younger demographic within the Aboriginal
population, we can expect to see increased enrolment in the public post-secondary system and this
should be taken into account in interpreting the data. At this time, the impact of this population growth
on enrolment data has not been analyzed.
Overall, as of 2016 there were approximately 270,585 Aboriginal people living throughout British
Columbia. Of these, 63.8% self-identified as First Nations, 33.0% as Métis, 1.0% reported multiple
identities and 0.6% as Inuit. The greatest proportion of British Columbia’s Aboriginal population lives in
Vancouver Census Metropolitan Area (23%), but they account for just 3% of its overall population.
Comparatively large proportions of the Aboriginal population can also be found in the Victoria (6.4%),
Prince George (4.6%) and Kelowna (4.2%) census metropolitan areas and census agglomerations.2
1 2016 Census topic: Aboriginal peoples. Accessed October 2017 from: http://www12.statcan.gc.ca/census-recensement/2016/rt-td/ap-pa-eng.cfm 2 Statistics Canada defines an “area” as “consisting of one or more neighbouring municipalities situated around a core. A census metropolitan area must have a total population of at least 100,000 of which 50,000 or more live in the core. A census agglomeration must have a core population of at least 10,000.” See Statistics Canada. Census Dictionary. Accessed October 2017 from: http://www12.statcan.gc.ca/census-recensement/2011/ref/dict/geo009-eng.cfm
6
Compared to other groups, Aboriginal people tend to make up higher percentages of the population in
Northern and Interior communities. Some of the highest of these are Prince Rupert (38.8%), Terrace
(23.5%), and Williams Lake (20.3%).
Overview of the Public Post-Secondary System in British Columbia
In British Columbia, there are 25 public post-secondary institutions. These include four research-
intensive universities, seven teaching-intensive universities, eleven colleges, and three provincial
institutes.
• Research-intensive universities have the mandate to serve the entire province and provide
undergraduate and graduate instruction in a wide range of disciplines. These institutions offer
various undergraduate and graduate degree programs. They also offer a number of professional
certificate and diploma programs.
• Most teaching-intensive universities have the mandate to serve a region of the province and
provide adult basic education, career, technical, trades and academic programs leading to
certificates, diplomas and bachelor and master’s degrees. There are two teaching-intensive
universities with mandates to serve the entire province: Royal Roads University has a provincial
mandate to provide certificate, diploma and degree programs at the undergraduate and
graduate levels in applied and professional fields; and Emily Carr University of Art and Design
has a provincial mandate to provide applied and professional programs leading to bachelor and
master’s degrees in visual arts, design and media arts. Thompson Rivers University also has a
provincial mandate to serve the province’s open learning needs.
• Colleges have the mandate to serve specific regions of the province and provide adult basic
education, career, technical, trades and academic programs leading to certificates, diplomas and
applied bachelor degrees.
• Institutes have the mandate to serve the entire province and offer specialized programs. The
British Columbia Institute of Technology (BCIT) focuses on trades and technology programs. The
Justice Institute of British Columbia focuses on public safety programs. The Nicola Valley
Institute of Technology focuses on serving the needs of Aboriginal learners. Institutes offer a
range of credentials, including certificates, diplomas, associate degrees, and applied bachelor
degrees. BCIT also offers applied masters degrees.

7
British Columbia has a well-developed transfer system which involves all public post-secondary
institutions and some private institutions (see www.bctransferguide.ca). This system allows students to
move from one institution to another and to get credit for previous coursework. For example, if a
student does not meet the admission requirements for entering a university directly, they may be
eligible to apply for admission later as a transfer student.
British Columbia’s public post-secondary institutions award a variety of credentials upon completion of a
program, ranging from certificates and diplomas to degree and graduate programs:
• Certificate: normally involves up to one year of full-time study. Academic certificates are
typically made up of 30 credits or about 10 courses.
• Diploma: normally involves two years of full-time study. Academic diplomas are usually made
up of 60 credits or about 20 courses.
• Associate degree: requires two years of university transfer course work (60 credits) in Arts or
Sciences. B.C. universities guarantee students all 60 credits will be accepted for transfer.
• Post-baccalaureate or advanced diploma: enables diploma or undergraduate degree graduates
to gain greater specialization in their original area of study or gain core skills in a new field of
study. Program length is typically eight months to two years. These diplomas are not considered
graduate level studies.
• Bachelor’s degree: normally requires four years of academic course work. The program
structure is designed to allow a student to gain both breadth and depth in their studies. It is
common for a student to gain specialization in one subject area through a Major or Honours
program.
• Master’s degree: normally involves two years of full-time studies beyond an undergraduate
degree. The degree offers students the opportunity to enhance their knowledge and skills
through a combination of course work and independent research under a faculty advisor. The
research is presented in the form of a thesis.
• Doctoral degree: normally involves at least two years of study beyond a master’s degree. This
degree is the highest level of academic achievement available to learners. It involves the
completion of oral and written exams and original research presented in the form of a
dissertation.

8
Aboriginal Self-Identification
In 2007, the Ministry of Advanced Education, Skills and Training (AEST) worked with the then-Ministry of
Aboriginal Relations and Reconciliation, the Aboriginal Post-Secondary Education Partners Data Working
Group and the Post–Secondary Application Service of British Columbia (PASBC) to implement a system-
wide standard for Aboriginal data collection.3 The primary purpose of implementing a provincial data
standard was to support improved administrative data across the province.
The Aboriginal Administrative Data Standard was implemented by the public post-secondary system in
2008. In order to facilitate consistent reporting at every institution, the data standard uses two
standardized questions to allow Aboriginal learners to self-identify3. The two questions are:
1. Do you identify as an Aboriginal person, that is, First Nations, Métis or Inuit?
2. If you identify yourself as an Aboriginal person, are you First Nations, Métis, or Inuit?
Institutions were given a year to implement the new data standard, and by 2009/10 the data were
considered reliable for reporting. This report uses 2009/10 as the baseline data for analysis.
Unless otherwise stated, all data included in this report is based on this form of self-identification.
3 The Ministry of Education data differs slightly in that it is based on self-identification of Aboriginal ancestry.
9
Section 1: K-12 Completion and Transitions This section uses data from the Ministry of Education’s annual Aboriginal Report: How Are We Doing? It
is included here to provide additional context to the experiences of Aboriginal learners in the public
post-secondary education system. In particular, this section discusses the rates of kindergarten to
Grade 12 completion and transitions from Grade 12 graduation to public post-secondary education for
Aboriginal and non-Aboriginal learners.4
Six Year Completion Rates: Aboriginal and Non-Aboriginal Learners
The following figure shows the percentage of Aboriginal and non-Aboriginal learners who completed a
Certificate of Graduation within six years of entering Grade 8. A Certificate of Graduation is commonly
known as a Dogwood Diploma. Learners earning School Completion Certificates, also known Evergreen
Certificates, are not included in the six-year high school completion rates.5
A non-Aboriginal learner, on average, is 29 percent more likely to achieve a Dogwood Diploma within
six-years of entering Grade 8 than an Aboriginal learner. However, the six-year completion rates are
improving for Aboriginal learners, having increased by 7 percentage points, from 57% to 64% between
2011/12 and 2015/16. In comparison, graduation rates for non-Aboriginal learners have remained the
same since 2012/13.
4 Unlike other data sources in this report, data from the Ministry of Education’s annual Aboriginal report does not exclude international learners. However, the inclusion of international students in the K-12 data does not affect the comparisons to post-secondary data, which does not include international students, due to the very low number of international students in the secondary system who self-identify as Aboriginal. 5 The School Completion (“Evergreen”) Certificate is intended to celebrate success in learning that is not recognized in a Certificate of Graduation (“Dogwood Diploma”). It is used to recognize the accomplishments of students with special needs and an Individual Education Plan, who have met the goals of their education program other than graduation (and not all students with special needs should be in an Evergreen Certificate Program). The Evergreen Certificate is not a graduation credential; students who receive an Evergreen have not graduated.

10
Source: Ministry of Education, How Are We Doing Report, 2015/16
The figure below shows the difference between male and female Aboriginal learners who achieve a
Dogwood Diploma within six-years of entering Grade 8. From 2011/12 to 2015/16, on average, 7% more
female Aboriginal learners achieved graduation than males.
Source: Ministry of Education, How Are We Doing Report, 2015/16
Dogwood Diplomas and Evergreen Certificates
Aboriginal learners are less likely to receive Dogwood Diplomas than non-Aboriginal learners and they
are more highly represented among learners receiving the Evergreen Certificate. The figure below shows
a five year average of the percent of Grade 12 learners awarded a certificate or diploma by the end of
57% 60% 62% 63% 64% 61%
84% 86% 86% 86% 86% 86%
2011/12 2012/13 2013/14 2014/15 2015/16 5-year average
Six-Year High School Completion Rate by Aboriginal Identity
Aboriginal Non-Aboriginal
62% 61% 65% 67% 69% 65%
52% 58% 59% 60% 60% 58%
2011/12 2012/13 2013/14 2014/15 2015/16 5-year average
Six-Year Aboriginal High School Completion Rates by Gender
Female Male

11
the year. An Adult Graduation Diploma (or “Adult Dogwood”) is awarded to adult learners (18 and
older). Courses towards an Adult Dogwood Diploma can be taken at school district continuing education
centres, or at a post-secondary institution.
Source: Ministry of Education, How Are We Doing Report, 2015/16
In 2016, the Ministry of Education introduced changes to restrict the use of Evergreen Certificates.
British Columbia schools are no longer allowed to issue Evergreen Certificates to students unless they
are classified as students with special needs and have an Individual Learning Plan. The change was made
at the request of the First Nations Education Steering Committee, the British Columbia School Trustees
Association and British Columbia Teachers’ Federation. Restricting the use of Evergreen Certificates was
also a recommendation made by the Auditor General of British Columbia in her report, An Audit of the
Education of Aboriginal Students in the B.C. Public School System, released in November 2015.
Aboriginal learners are significantly less likely than non-Aboriginal learners to obtain a Dogwood
Diploma (51% vs. 73%), and more likely to obtain an Evergreen Certificate (4% vs. 1%) or an Adult
Dogwood Diploma (10% vs. 5%).
51%
4% 10%
73%
1% 5%
Dogwood Diploma Evergreen Certificate Adult Dogwood Diploma
Percentage of Grade 12 Students Awarded a Certificate or Diploma
by Aborginal Identity 5-year average 2011/12 - 2015/16
Aboriginal Non-Aboriginal

12
Post-Secondary Transitions: Aboriginal and Non-Aboriginal Learners
The Aboriginal Policy Framework aims to achieve the long term goal of “increase[ing] the percentage of
Aboriginal youth making the transition from K-12 to post-secondary education to 90 per cent.”6
Aboriginal learners who complete high school transition to post-secondary education at a lower rate
than non-Aboriginal learners. This difference is particularly acute when looking at rates of immediate
entry to post-secondary education from high school. When looking at the cumulative transition rate
over five years the difference remains, but decreases significantly.
The following figure presents the cumulative transition rate of Aboriginal and non-Aboriginal learners
who graduated high school with a Dogwood Diploma in the 2010/11 academic year and enrolled in a
B.C. public post-secondary institution in the 2011/12 to 2015/16 academic years. The immediate
transition rate for Aboriginal learners is 42% compared to 54% for non-Aboriginal learners. By 2015/16,
63% of the Aboriginal 2010/11 graduate cohort had transitioned to post-secondary, compared to 72% of
non-Aboriginal learners.7 The transition rate includes learners who graduated from high school and
enrolled at a public post-secondary institution to complete upgrading courses.
Source: Student Transitions Project, Fall 2016 submission
6 Aboriginal Post-Secondary Education and Training Policy Framework and Action Plan. Accessed July 2017 from: http://www2.gov.bc.ca/assets/gov/education/post-secondary-education/aboriginal-education-training/aboriginal_action_plan.pdf 7 The transition rate does not include learners who completed an Adult Dogwood Diploma.
42%
53% 58% 61% 63%
54% 64% 68% 70% 72%
2011/12 2012/13 2013/14 2014/15 2015/16
Cumulative Transition Rate to B.C. Public Post-Secondary Institution
by Aboriginal identity 2010/11 Grade 12 Graduates Cohort
Aboriginal Non-Aboriginal
13
The figure above includes those students that completed secondary school with a Dogwood Diploma;
however, the data shows that a much higher proportion of Aboriginal learners leave the education
system between grades 8 and 12.
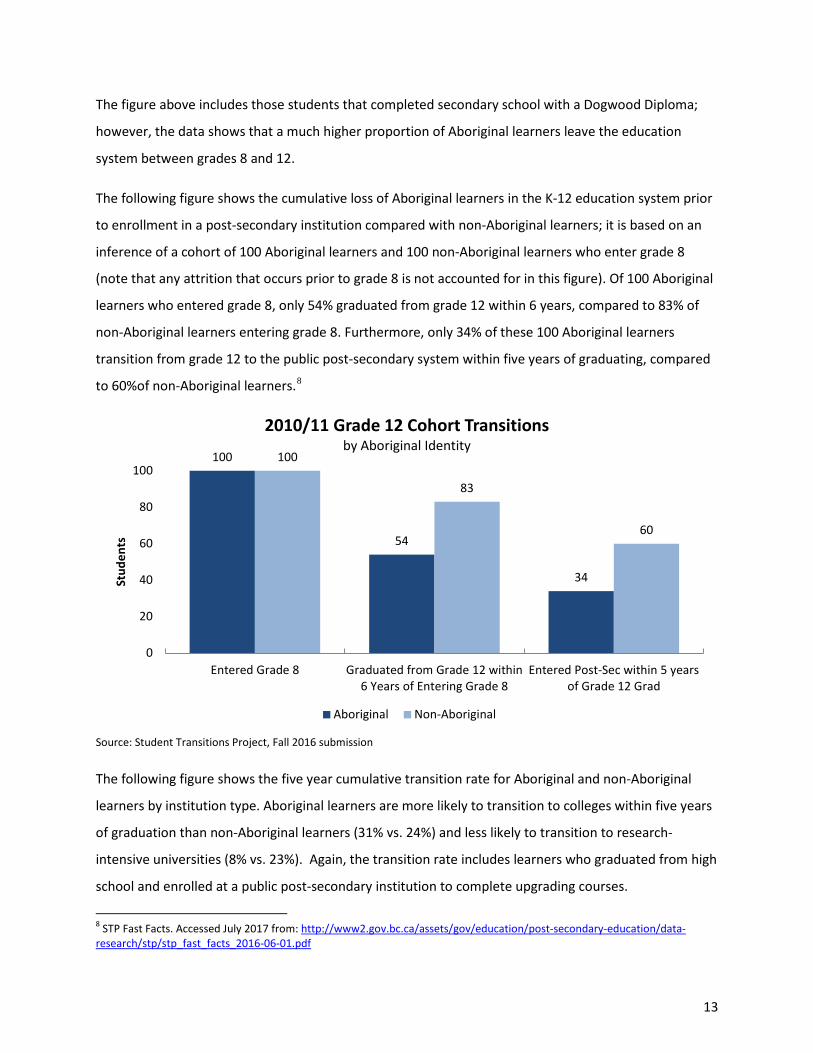
The following figure shows the cumulative loss of Aboriginal learners in the K-12 education system prior
to enrollment in a post-secondary institution compared with non-Aboriginal learners; it is based on an
inference of a cohort of 100 Aboriginal learners and 100 non-Aboriginal learners who enter grade 8
(note that any attrition that occurs prior to grade 8 is not accounted for in this figure). Of 100 Aboriginal
learners who entered grade 8, only 54% graduated from grade 12 within 6 years, compared to 83% of
non-Aboriginal learners entering grade 8. Furthermore, only 34% of these 100 Aboriginal learners
transition from grade 12 to the public post-secondary system within five years of graduating, compared
to 60%of non-Aboriginal learners.8
Source: Student Transitions Project, Fall 2016 submission
The following figure shows the five year cumulative transition rate for Aboriginal and non-Aboriginal
learners by institution type. Aboriginal learners are more likely to transition to colleges within five years
of graduation than non-Aboriginal learners (31% vs. 24%) and less likely to transition to research-
intensive universities (8% vs. 23%). Again, the transition rate includes learners who graduated from high
school and enrolled at a public post-secondary institution to complete upgrading courses.
8 STP Fast Facts. Accessed July 2017 from: http://www2.gov.bc.ca/assets/gov/education/post-secondary-education/data-research/stp/stp_fast_facts_2016-06-01.pdf
100
54
34
100
83
60
0
20
40
60
80
100
Entered Grade 8 Graduated from Grade 12 within6 Years of Entering Grade 8
Entered Post-Sec within 5 yearsof Grade 12 Grad
Stud
ents
2010/11 Grade 12 Cohort Transitions by Aboriginal Identity
Aboriginal Non-Aboriginal

14
9 Source: Student Transitions Project, Fall 2016 submission
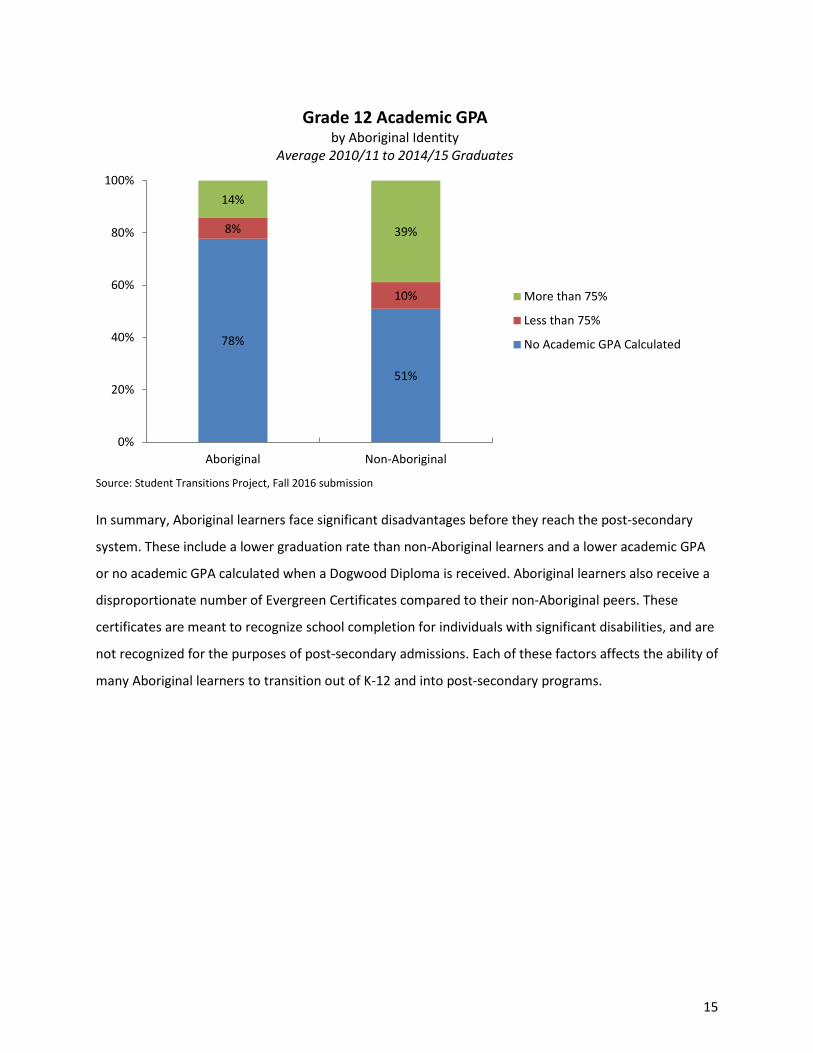
Institutions accept students by considering a number of variables, one of which can be academic grade
point average (GPA). Acceptance based on GPA differs by institution type and program of study;
research-intensive universities are more likely to rely on GPA as a factor of acceptance. Under the
current curriculum, an academic GPA is derived by taking the average GPA of English 12 and three of the
learner’s best other grade 12 academic courses. If a student does not have three grade 12 academic
courses or English 12 then an academic GPA cannot be calculated. The figure below shows that
Aboriginal learners are more likely to graduate without an academic GPA calculated than non-Aboriginal
learners (78% vs. 51%). Only 14% of Aboriginal grade 12 graduates achieve academic GPAs above 75%,
compared to 39% of non-Aboriginal learners.
An academic GPA above 75% corresponds to the average minimum GPA for admission to the research-
intensive universities, although it should be noted that there is significant variation by institution and
program area ranging from GPAs in the mid-60s to mid-80s. From 2010 to 2016 the average minimum
GPA for admission to the research-intensive universities was 76 percent. In contrast, teaching-intensive
universities, colleges and institutes are less reliant on GPA for admissions.
9 For consistency and ease of presentation, most percentages in the report have been rounded and may not always add to 100.
31%
4% 8%
20%
63%
24%
5%
23% 20%
72%
College Institute Research IntensiveUniversity
Teaching IntensiveUniversity
Total Transition
Five-year Cumulative Transition Rate by Aboriginal Identity and Institution Type
2010/11 Grade 12 Graduation Cohort
Aboriginal Non-Aboriginal
15
Source: Student Transitions Project, Fall 2016 submission
In summary, Aboriginal learners face significant disadvantages before they reach the post-secondary
system. These include a lower graduation rate than non-Aboriginal learners and a lower academic GPA
or no academic GPA calculated when a Dogwood Diploma is received. Aboriginal learners also receive a
disproportionate number of Evergreen Certificates compared to their non-Aboriginal peers. These
certificates are meant to recognize school completion for individuals with significant disabilities, and are
not recognized for the purposes of post-secondary admissions. Each of these factors affects the ability of
many Aboriginal learners to transition out of K-12 and into post-secondary programs.
78%
51%
8%
10%
14%
39%
0%
20%
40%
60%
80%
100%
Aboriginal Non-Aboriginal
Grade 12 Academic GPA by Aboriginal Identity
Average 2010/11 to 2014/15 Graduates
More than 75%
Less than 75%
No Academic GPA Calculated

16
Section 2: Aboriginal Learners in the B.C. Public Post-Secondary System This section explores trends in the Aboriginal learner population attending British Columbia’s public
post-secondary institutions with a focus on student full-time equivalents (FTEs), headcount, and
credentials.
Student Full-Time Equivalents (FTEs)10
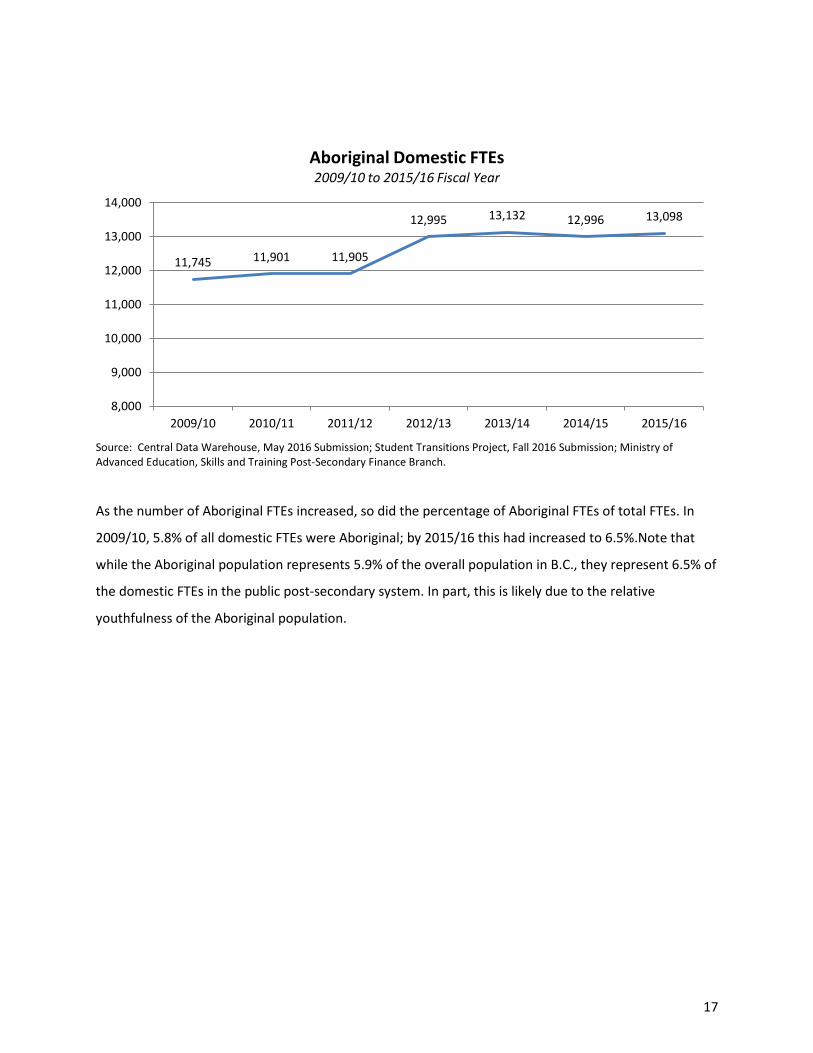
The figure below shows the number of FTEs attributed to Aboriginal learners in the system since the
Aboriginal Policy Framework baseline year of 2009/10. Overall, the number of Aboriginal learner FTEs
has increased. In 2015/16 Aboriginal learners accounted for 13,098 FTEs, an 11.5% increase over the
baseline of 11,745. During that same period the number of non-Aboriginal FTEs decreased by 2.3%.
Aboriginal FTEs have shown positive year-over-year growth in every year except 2014/15 – which
reported a decrease of 1.0% from 2013/14. This decrease is similar to the year-over-year change in non-
Aboriginal FTEs, which fell 2.1% between 2013/14 and 2014/15.
It is important to note that the increase in FTEs could be attributed in part to growth of the population
in the province. For example, between 2011 and 2016 the Aboriginal population in B.C. grew from
232,290 to 270,585 - a 16% increase.11
It should also be taken into account that the increase in Aboriginal FTEs at the post-secondary level lags
behind the increase in Aboriginal learners completing grade 12. Between the 2008/09 and 2014/2015
the number of Aboriginal learners that graduated from grade 12 and obtained a Dogwood Diploma or an
Adult Dogwood Diploma increased by 23.3% while the number of Aboriginal learners enrolling in the
B.C. public post-secondary system the following year increased by 11.5%. During the same period the
number of non-Aboriginal learners completing grade 12 decreased by 4.7% while the number of non-
Aboriginal learners enrolling in post-secondary the following year decreased by 2.3%.12
10 FTEs represent all full-time and part-time enrollments, converted to represent the number of students carrying a full-time course load. One student whose course load is equal to the normal full-time number of credits or hours required in an academic year for normal progression in a recognized program would generate 1.0 Student FTE. A Student FTE represents the instructional activity (course registrations) of one student completing all the requirements of a full-time program in a period that extends over one normal academic year. 11 Increase in Aboriginal population based on totals from National Household Survey (2011) and Census (2016). 12 B.C. Ministry of Education data received November 17, 2017.
17
Source: Central Data Warehouse, May 2016 Submission; Student Transitions Project, Fall 2016 Submission; Ministry of Advanced Education, Skills and Training Post-Secondary Finance Branch.
As the number of Aboriginal FTEs increased, so did the percentage of Aboriginal FTEs of total FTEs. In
2009/10, 5.8% of all domestic FTEs were Aboriginal; by 2015/16 this had increased to 6.5%.Note that
while the Aboriginal population represents 5.9% of the overall population in B.C., they represent 6.5% of
the domestic FTEs in the public post-secondary system. In part, this is likely due to the relative
youthfulness of the Aboriginal population.
11,745 11,901 11,905
12,995 13,132 12,996 13,098
8,000
9,000
10,000
11,000
12,000
13,000
14,000
2009/10 2010/11 2011/12 2012/13 2013/14 2014/15 2015/16
Aboriginal Domestic FTEs 2009/10 to 2015/16 Fiscal Year

18
Source: Central Data Warehouse, May 2016 Submission; Student Transitions Project, Fall 2016 Submission; Ministry of Advanced Education, Skills and Training Post-Secondary Finance Branch.
Headcount13
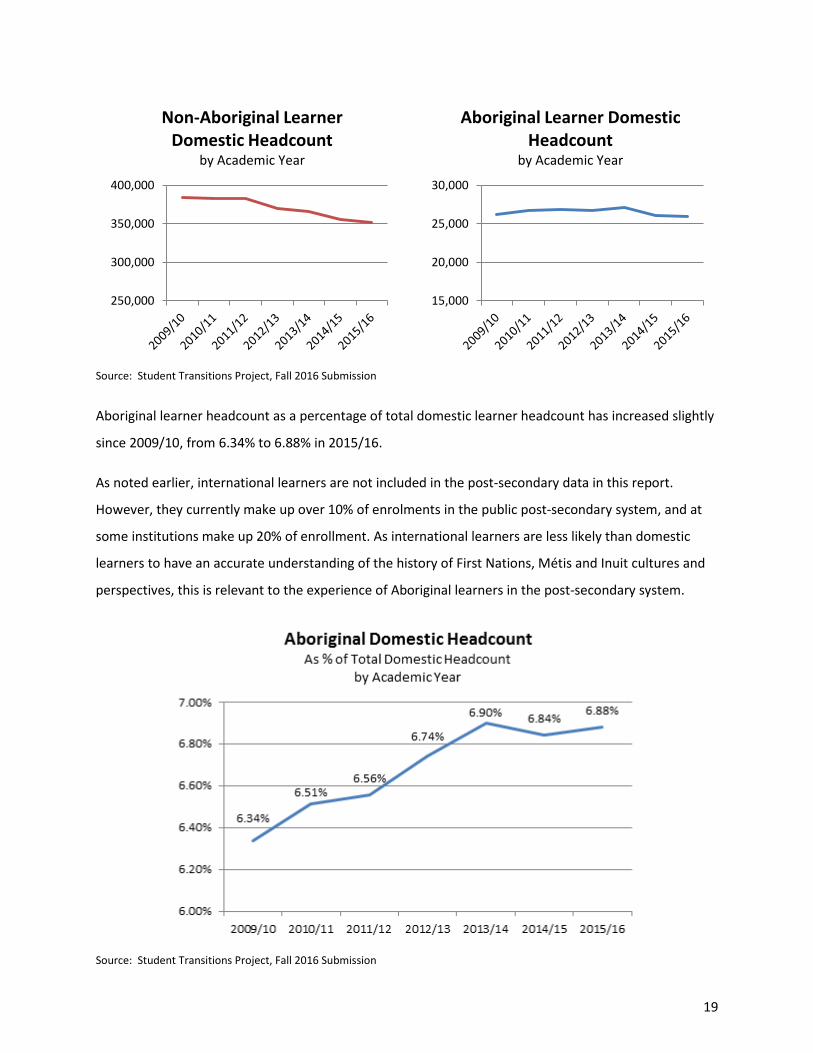
Total domestic headcount has decreased 8.1% since 2009/10, from 410,810 to 377,350 in 2015/16. The
majority of this decrease is as a result of an 8.6% decrease in non-Aboriginal headcount, from 384,775 in
2009/10 to 351,390 in 2015/16. During the same period of time, Aboriginal headcount decreased by
0.3%, from 26,035 in 2009/10 to 25,960 in 2015/16. It is worth noting that while Aboriginal learner
headcount dropped by almost 1,200 learners since 2013/14, Aboriginal FTEs only dropped by 34. This
suggests that more Aboriginal learners were studying full-time in 2015/16 than in 2013/14.
13 The number of individual students registered in courses in a given period of time. Since students can be registered in more than one program or more than one institution at a time, a unique headcount is sometimes called “unduplicated headcount.” See Appendix I for more information.
5.8% 5.9%
5.8%
6.3% 6.3% 6.4% 6.5%
5.0%
5.5%
6.0%
6.5%
7.0%
2009/10 2010/11 2011/12 2012/13 2013/14 2014/15 2015/16
Aboriginal Domestic FTEs as % of Total FTEs
2009/10 to 2015/16 Fiscal Year
19
Source: Student Transitions Project, Fall 2016 Submission
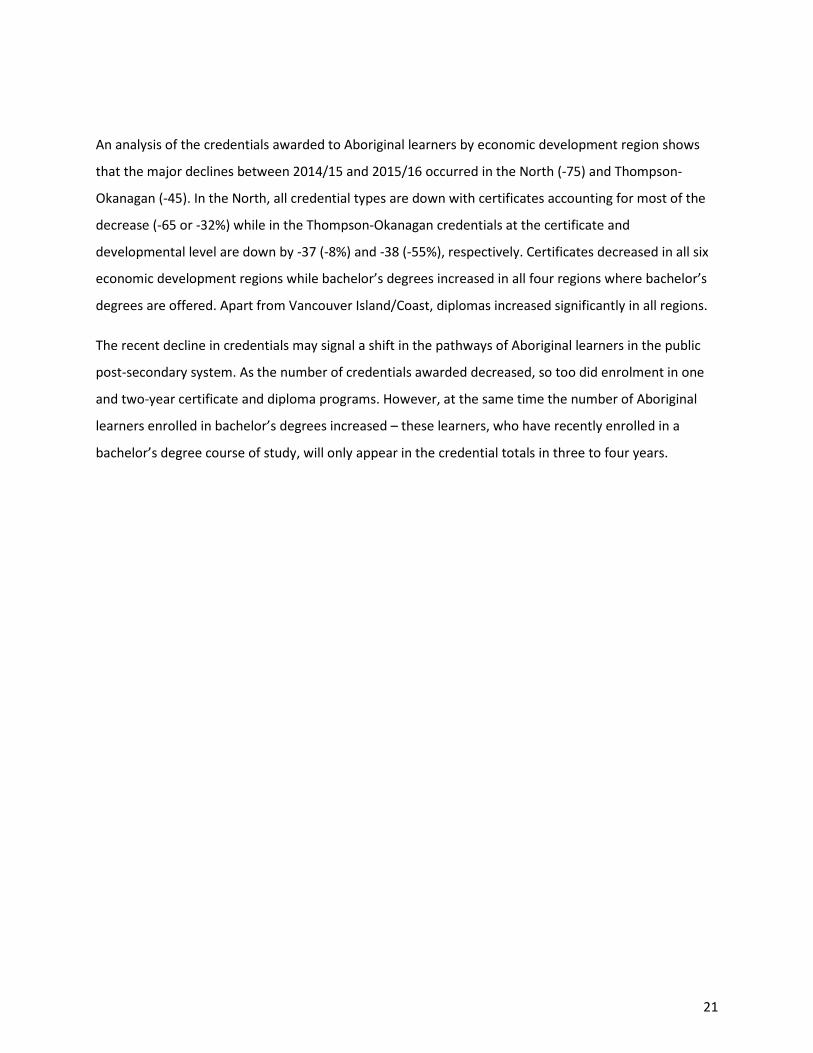
Aboriginal learner headcount as a percentage of total domestic learner headcount has increased slightly
since 2009/10, from 6.34% to 6.88% in 2015/16.
As noted earlier, international learners are not included in the post-secondary data in this report.
However, they currently make up over 10% of enrolments in the public post-secondary system, and at
some institutions make up 20% of enrollment. As international learners are less likely than domestic
learners to have an accurate understanding of the history of First Nations, Métis and Inuit cultures and
perspectives, this is relevant to the experience of Aboriginal learners in the post-secondary system.
Source: Student Transitions Project, Fall 2016 Submission
250,000
300,000
350,000
400,000
Non-Aboriginal Learner Domestic Headcount
by Academic Year
15,000
20,000
25,000
30,000
Aboriginal Learner Domestic Headcount
by Academic Year

20
Credentials
The Aboriginal Policy Framework sets a goal to increase the number of credentials awarded to
Aboriginal learners by 75%, from 2,634 in 2009/10 to 4,609 in 2020/21.14 The following figure outlines
progress towards that goal. The most recent data shows 3,244 credentials awarded to Aboriginal
learners in 2015/16, which represents a 3% decline from the previous year but a 23% increase over the
2009/10 baseline. Despite this increase over time, progress towards the goal of 4,609 credentials has
not achieved the rate necessary to meet the target set by the Aboriginal Policy Framework should
current trends continue to 2020/21.
A more detailed look at the change in credentials awarded to Aboriginal learners between 2014/15 and
2015/16 shows that most of the decline occurred at the certificate and developmental level, with losses
of 251 and 45 credentials, respectively. The number of diplomas awarded remained stable and the
number of graduate and first professional degrees awarded increased by 14 (5%). Bachelor’s degrees in
particular were up substantially by 118 (17%), which is a positive trend.
Source: Student Transitions Project, Annual submissions
14 The number of credentials awarded includes Adult upgrading at a public post-secondary institution to achieve an Adult Dogwood.
2,634 2,727 3,010 3,070
3,241 3,340 3,244
2,000
2,500
3,000
3,500
4,000
4,500
5,000
Credentials Awarded to Aboriginal Learners by Fiscal Year
Credentials awarded to Aboriginal students Target
21
An analysis of the credentials awarded to Aboriginal learners by economic development region shows
that the major declines between 2014/15 and 2015/16 occurred in the North (-75) and Thompson-
Okanagan (-45). In the North, all credential types are down with certificates accounting for most of the
decrease (-65 or -32%) while in the Thompson-Okanagan credentials at the certificate and
developmental level are down by -37 (-8%) and -38 (-55%), respectively. Certificates decreased in all six
economic development regions while bachelor’s degrees increased in all four regions where bachelor’s
degrees are offered. Apart from Vancouver Island/Coast, diplomas increased significantly in all regions.
The recent decline in credentials may signal a shift in the pathways of Aboriginal learners in the public
post-secondary system. As the number of credentials awarded decreased, so too did enrolment in one
and two-year certificate and diploma programs. However, at the same time the number of Aboriginal
learners enrolled in bachelor’s degrees increased – these learners, who have recently enrolled in a
bachelor’s degree course of study, will only appear in the credential totals in three to four years.

22
Section 3: Aboriginal Learners in B.C. Public Post-Secondary Institutions While Aboriginal participation and achievement in post-secondary education has increased in recent
years, the collective experience of Aboriginal learners differs significantly from non-Aboriginal learners.
This section looks at the public post-secondary institutions Aboriginal learners attend, the programs
they take, and the credentials they earn.
Institutions
In comparison to non-Aboriginal learners, Aboriginal learners are more likely to attend colleges (38.2%
vs. 23.2%) and teaching-intensive universities (28.1% vs. 20.3%), and less likely to attend research-
intensive universities (22.8% vs. 45.1%). The fact that Aboriginal learners are underrepresented in the
research-intensive universities is an area of concern.
Source: Central Data Warehouse, May 2016 Submission; Student Transitions Project, Fall 2016 Submission; Ministry of Advanced Education, Skills and Training Post-Secondary Finance Branch.
As the figure below illustrates, the majority of non-Aboriginal learners (68.5%) attend institutions in the
Mainland/Southwest of B.C., while only 3.2% attend institutions in the Cariboo and North. The
Aboriginal learner population follows a similar pattern of distribution, but is more evenly distributed
38.2%
10.9%
22.8% 28.1%
23.2%
11.4%
45.1%
20.3%
College Institute Research-IntensiveUniversity
Teaching-IntensiveUniversity
Distribution of Domestic FTEs by Aboriginal Identity and Institution Type
2015/16 Fiscal Year
Aboriginal Non-Aboriginal

23
across the province. The largest proportion (37.5%) still attends an institution in the
Mainland/Southwest, but the remaining learners are more evenly enrolled across the province.
Source: Central Data Warehouse, May 2016 Submission; Student Transitions Project, Fall 2016 Submission; Ministry of Advanced Education Skills and Training, Post-Secondary Finance.
The figure below shows the differing representation of Aboriginal learners across each of the institutions
in the public post-secondary system. The data show the percentage of domestic FTEs at each institution
that is attributed to Aboriginal learners. As few as 2% of domestic FTEs taught at some institutions
identify as Aboriginal, while over 91% of the domestic FTEs at Nicola Valley Institute of Technology
(NVIT), which has a mandate to serve Aboriginal learners, identify as Aboriginal.15
15 NVIT is an Aboriginal-governed provincial institute with a mandate to serve as British Columbia’s public Aboriginal post-secondary institution. NVIT offers a range of programs including developmental, career training, trades, health, human services, business and university transfer leading to certificates, diplomas and baccalaureate degrees. Established in 1983 as a private Aboriginal institution and designated as a public post-secondary institution in 1995 under the College and Institute Act, NVIT now has campuses in Merritt and Vancouver.
37.5%
24.1% 22.8% 15.6%
68.5%
18.0% 10.3%
3.2%
Mainland/Southwest Vancouver Island/Coast ThompsonOkanagan/Kootenay
Cariboo/North
Distribution of Domestic FTEs by Aboriginal Identity and Economic Development Region
2015/16 Fiscal Year
Aboriginal Non-Aboriginal

24
Lower Mainland/Southwest
Thompson Okanagan/Kootenay Vancouver Island/Coast Cariboo/North
Source: Central Data Warehouse, May 2016 Submission; Student Transitions Project, Fall 2016 Submission; Ministry of Advanced Education, Skills and Training Post-Secondary Finance Branch.
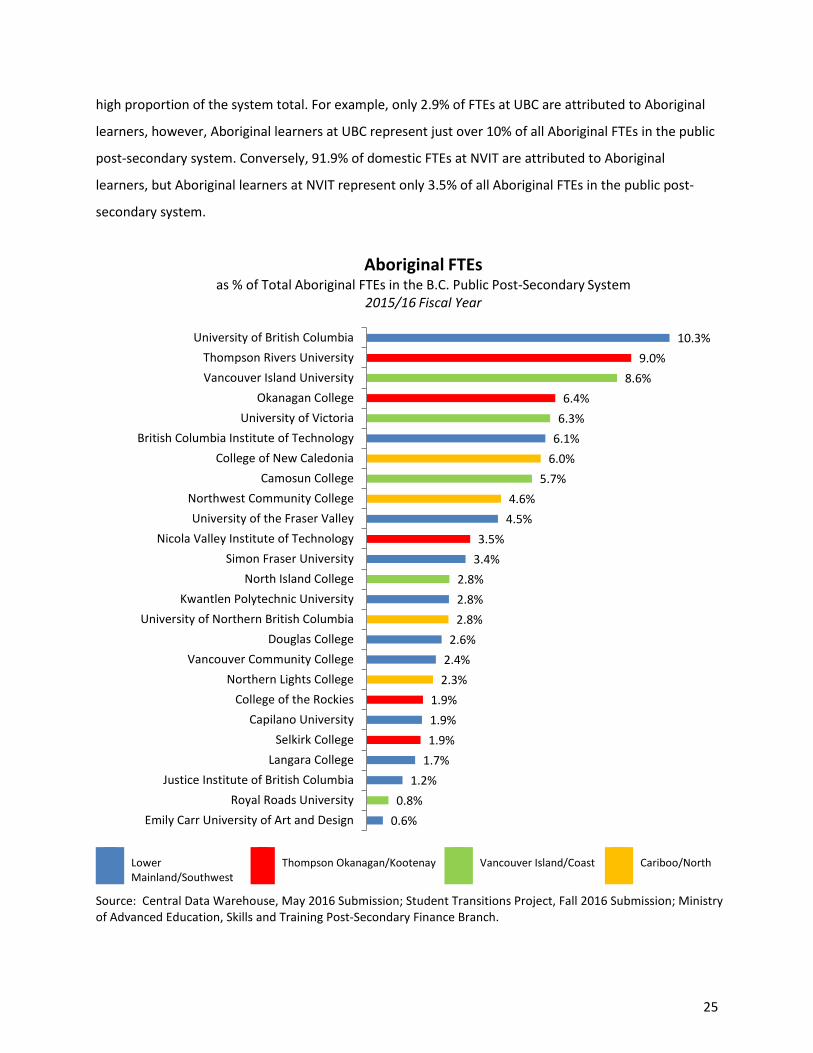
While the previous figure reported Aboriginal FTEs as a percentage of domestic FTEs at each institution,
the following figure reports each institution’s Aboriginal FTEs as a percentage of the total number of
Aboriginal FTEs in the public post-secondary system. It is worth noting that an institution may have a
relatively low proportion of domestic FTEs attributed to Aboriginal learners, but can still account for a
91.9%
44.6%
26.3%
25.3%
16.8%
15.9%
14.0%
12.7%
12.0%
11.1%
10.1%
8.6%
8.3%
6.0%
6.0%
5.6%
5.1%
4.9%
4.6%
4.2%
4.1%
3.7%
3.3%
2.9%
2.0%
Nicola Valley Institute of Technology
Northwest Community College
College of New Caledonia
Northern Lights College
North Island College
Vancouver Island University
University of Northern British Columbia
College of the Rockies
Thompson Rivers University
Okanagan College
Selkirk College
Camosun College
University of the Fraser Valley
Justice Institute of British Columbia
Capilano University
Vancouver Community College
Emily Carr University of Art and Design
University of Victoria
Royal Roads University
Douglas College
British Columbia Institute of Technology
Kwantlen Polytechnic University
Langara College
University of British Columbia
Simon Fraser University
Aboriginal FTEs as % of Domestic FTEs at Institution
2015/16 Fiscal Year
25
high proportion of the system total. For example, only 2.9% of FTEs at UBC are attributed to Aboriginal
learners, however, Aboriginal learners at UBC represent just over 10% of all Aboriginal FTEs in the public
post-secondary system. Conversely, 91.9% of domestic FTEs at NVIT are attributed to Aboriginal
learners, but Aboriginal learners at NVIT represent only 3.5% of all Aboriginal FTEs in the public post-
secondary system.
Lower Mainland/Southwest
Thompson Okanagan/Kootenay Vancouver Island/Coast Cariboo/North
Source: Central Data Warehouse, May 2016 Submission; Student Transitions Project, Fall 2016 Submission; Ministry of Advanced Education, Skills and Training Post-Secondary Finance Branch.
10.3% 9.0%
8.6% 6.4%
6.3% 6.1%
6.0% 5.7%
4.6% 4.5%
3.5% 3.4%
2.8% 2.8% 2.8%
2.6% 2.4% 2.3%
1.9% 1.9% 1.9%
1.7% 1.2%
0.8% 0.6%
University of British ColumbiaThompson Rivers UniversityVancouver Island University
Okanagan CollegeUniversity of Victoria
British Columbia Institute of TechnologyCollege of New Caledonia
Camosun CollegeNorthwest Community CollegeUniversity of the Fraser Valley
Nicola Valley Institute of TechnologySimon Fraser University
North Island CollegeKwantlen Polytechnic University
University of Northern British ColumbiaDouglas College
Vancouver Community CollegeNorthern Lights College
College of the RockiesCapilano University
Selkirk CollegeLangara College
Justice Institute of British ColumbiaRoyal Roads University
Emily Carr University of Art and Design
Aboriginal FTEs as % of Total Aboriginal FTEs in the B.C. Public Post-Secondary System
2015/16 Fiscal Year
26
Programs
The preceding section shows that Aboriginal learners tend to enrol at different institutions than non-
Aboriginal learners. This section shows that Aboriginal learners also tend to enrol in different program
areas. While the following data is for the 2015/16 academic year, the proportion of learners in the
various program areas has been relatively stable for the past five years.
The program areas outlined below represent groupings categorized according to the national
Classification of Instructional Programs (CIP).16 The following figure indicates the percentage of learners
in a program area. When using headcount at the program level a single learner may be enrolled in two
different program areas within an academic year. If this is the case they will be counted twice—once in
each program area—and the program headcount may be higher than the institution headcount. As a
result, although the overall trends are reflective of student participation, some of the proportions below
may be artificially inflated.
The following figure compares Aboriginal and non-Aboriginal learners, showing the proportion of all
learners in each population studying in each program area. For example, 27.5% of non-Aboriginal
learners study in the Arts and Sciences, compared to 22.8% of Aboriginal learners.
16 See Appendix 2 for more information on CIP.

27
Source: Student Transitions Project, Fall 2016 Submission
The data shows a significantly higher proportion of Aboriginal learners in the Developmental and
Trades17 program areas, and lower representation in the Business and Management, Engineering and
Applied Sciences, and Health program areas. Developmental programs include Adult Basic Education,
English as a Second Language, and Adult Special Education programs; these programs are not at the
post-secondary level.18
The credential data shows similar differences between Aboriginal and non-Aboriginal learners. The data
below is from the 2015/16 fiscal year across all public post-secondary institutions. This figure shows the
percentage of all credentials awarded to Aboriginal and non-Aboriginal learners within each program
area. For example, 11% of all credentials awarded to non-Aboriginal learners are in Trades programs, 17 Trades programs include trades foundation programs (introductory trades programs that provide learners with credit for the first level of apprenticeship training) and apprenticeship technical training programs (the in-school portion of an apprenticeship program). 18 The following programs clusters generally do not have credit-based programs: Developmental, Personal Improvement and Leisure, and Other. Also note that domestic headcount by program area includes learners enrolled in “intro to trades” and continuing education programs that are not credit-based.
22.8%
15.5%
15.3%
11.4%
8.7%
7.5%
7.5%
6.1%
2.8%
1.9%
0.5%
27.5%
9.5%
6.3%
10.0%
13.5%
10.2%
9.5%
6.4%
3.2%
3.1%
0.6%
Arts and Sciences
Trades
Developmental
Human and Social Services
Business and Management
Engineering and Applied Sciences
Health
Personal Improvement and Leisure
Education
Visual and Performing Arts
Other
Domestic Headcount by Aboriginal Identity and Program Area
2015/16 Academic Year
Aboriginal Non-Aboriginal
28
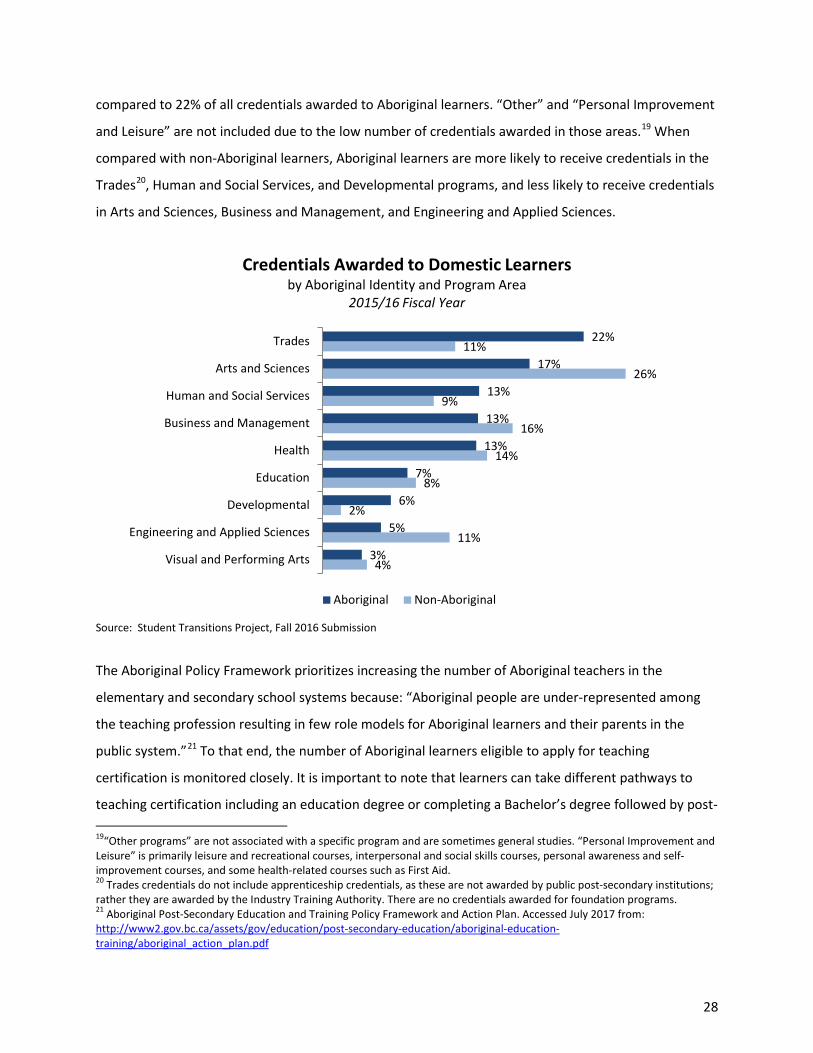
compared to 22% of all credentials awarded to Aboriginal learners. “Other” and “Personal Improvement
and Leisure” are not included due to the low number of credentials awarded in those areas.19 When
compared with non-Aboriginal learners, Aboriginal learners are more likely to receive credentials in the
Trades20, Human and Social Services, and Developmental programs, and less likely to receive credentials
in Arts and Sciences, Business and Management, and Engineering and Applied Sciences.
Source: Student Transitions Project, Fall 2016 Submission
The Aboriginal Policy Framework prioritizes increasing the number of Aboriginal teachers in the
elementary and secondary school systems because: “Aboriginal people are under-represented among
the teaching profession resulting in few role models for Aboriginal learners and their parents in the
public system.”21 To that end, the number of Aboriginal learners eligible to apply for teaching
certification is monitored closely. It is important to note that learners can take different pathways to
teaching certification including an education degree or completing a Bachelor’s degree followed by post- 19“Other programs” are not associated with a specific program and are sometimes general studies. “Personal Improvement and Leisure” is primarily leisure and recreational courses, interpersonal and social skills courses, personal awareness and self-improvement courses, and some health-related courses such as First Aid. 20 Trades credentials do not include apprenticeship credentials, as these are not awarded by public post-secondary institutions; rather they are awarded by the Industry Training Authority. There are no credentials awarded for foundation programs. 21 Aboriginal Post-Secondary Education and Training Policy Framework and Action Plan. Accessed July 2017 from: http://www2.gov.bc.ca/assets/gov/education/post-secondary-education/aboriginal-education-training/aboriginal_action_plan.pdf
4%
11%
2%
8%
14%
16%
9%
26%
11%
3%
5%
6%
7%
13%
13%
13%
17%
22%
Visual and Performing Arts
Engineering and Applied Sciences
Developmental
Education
Health
Business and Management
Human and Social Services
Arts and Sciences
Trades
Credentials Awarded to Domestic Learners by Aboriginal Identity and Program Area
2015/16 Fiscal Year
Aboriginal Non-Aboriginal
29
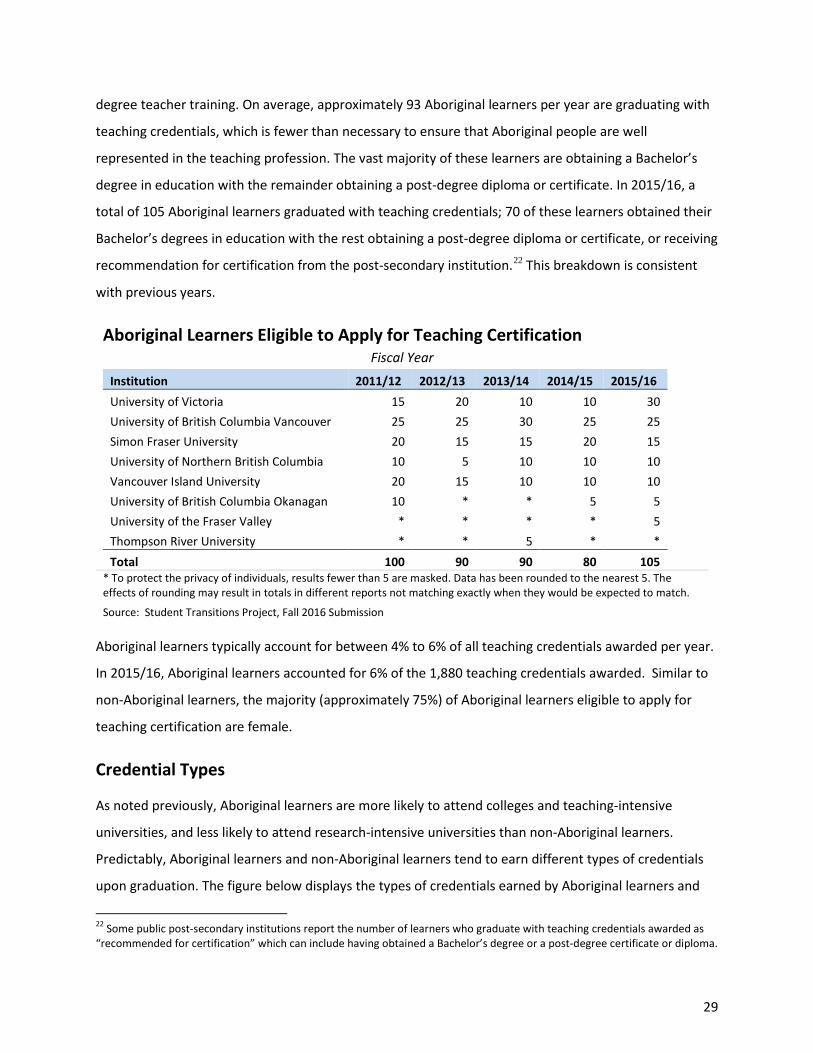
degree teacher training. On average, approximately 93 Aboriginal learners per year are graduating with
teaching credentials, which is fewer than necessary to ensure that Aboriginal people are well
represented in the teaching profession. The vast majority of these learners are obtaining a Bachelor’s
degree in education with the remainder obtaining a post-degree diploma or certificate. In 2015/16, a
total of 105 Aboriginal learners graduated with teaching credentials; 70 of these learners obtained their
Bachelor’s degrees in education with the rest obtaining a post-degree diploma or certificate, or receiving
recommendation for certification from the post-secondary institution.22 This breakdown is consistent
with previous years.
Aboriginal Learners Eligible to Apply for Teaching Certification
Fiscal Year
Institution 2011/12 2012/13 2013/14 2014/15 2015/16 University of Victoria 15 20 10 10 30 University of British Columbia Vancouver 25 25 30 25 25 Simon Fraser University 20 15 15 20 15 University of Northern British Columbia 10 5 10 10 10 Vancouver Island University 20 15 10 10 10 University of British Columbia Okanagan 10 * * 5 5 University of the Fraser Valley * * * * 5 Thompson River University * * 5 * * Total 100 90 90 80 105
* To protect the privacy of individuals, results fewer than 5 are masked. Data has been rounded to the nearest 5. The effects of rounding may result in totals in different reports not matching exactly when they would be expected to match. Source: Student Transitions Project, Fall 2016 Submission
Aboriginal learners typically account for between 4% to 6% of all teaching credentials awarded per year.
In 2015/16, Aboriginal learners accounted for 6% of the 1,880 teaching credentials awarded. Similar to
non-Aboriginal learners, the majority (approximately 75%) of Aboriginal learners eligible to apply for
teaching certification are female.
Credential Types
As noted previously, Aboriginal learners are more likely to attend colleges and teaching-intensive
universities, and less likely to attend research-intensive universities than non-Aboriginal learners.
Predictably, Aboriginal learners and non-Aboriginal learners tend to earn different types of credentials
upon graduation. The figure below displays the types of credentials earned by Aboriginal learners and
22 Some public post-secondary institutions report the number of learners who graduate with teaching credentials awarded as “recommended for certification” which can include having obtained a Bachelor’s degree or a post-degree certificate or diploma.
30
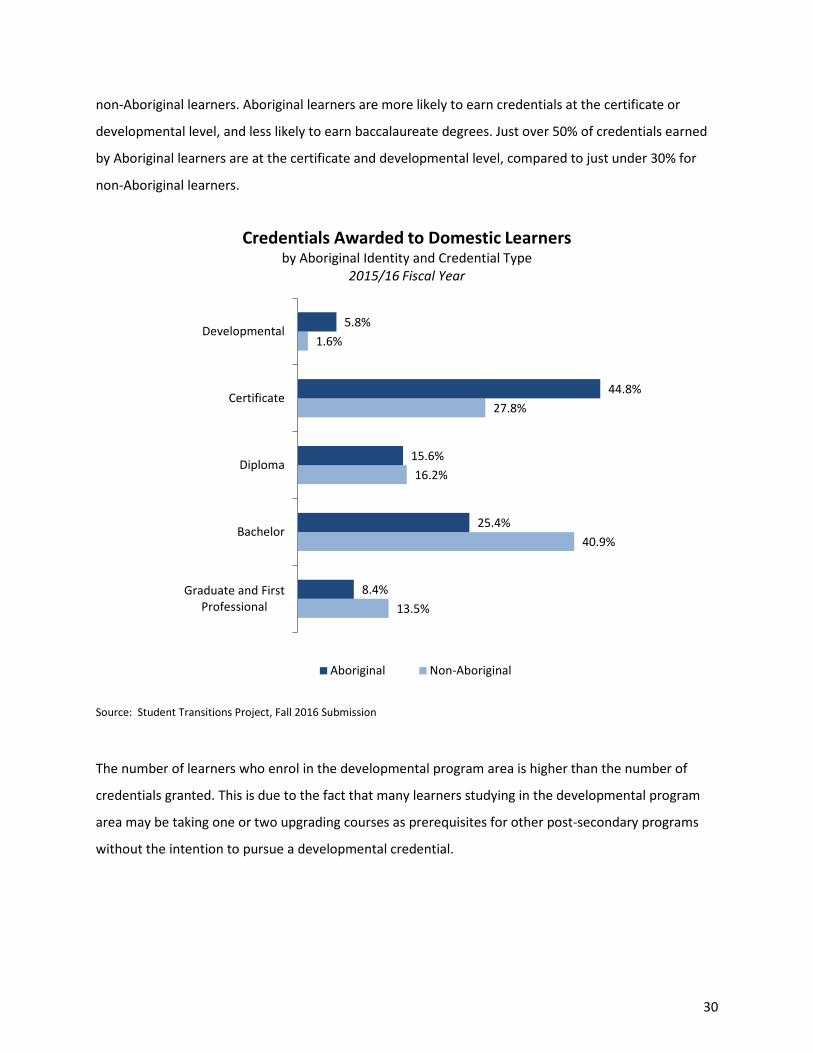
non-Aboriginal learners. Aboriginal learners are more likely to earn credentials at the certificate or
developmental level, and less likely to earn baccalaureate degrees. Just over 50% of credentials earned
by Aboriginal learners are at the certificate and developmental level, compared to just under 30% for
non-Aboriginal learners.
Source: Student Transitions Project, Fall 2016 Submission
The number of learners who enrol in the developmental program area is higher than the number of
credentials granted. This is due to the fact that many learners studying in the developmental program
area may be taking one or two upgrading courses as prerequisites for other post-secondary programs
without the intention to pursue a developmental credential.
13.5%
40.9%
16.2%
27.8%
1.6%
8.4%
25.4%
15.6%
44.8%
5.8%
Graduate and FirstProfessional
Bachelor
Diploma
Certificate
Developmental
Credentials Awarded to Domestic Learners by Aboriginal Identity and Credential Type
2015/16 Fiscal Year
Aboriginal Non-Aboriginal
31
Section 4: Aboriginal Learner Characteristics This section examines the demographic characteristics of age and gender within the Aboriginal learner
population, and offers comparisons to the non-Aboriginal learner population when appropriate.
Gender
The Aboriginal Policy Framework acknowledges that the “growing gender gap between Aboriginal male
and female students means that tools and resources need to consider the needs of male students in
particular.”23 The framework outlines a commitment to “work with Aboriginal K-12 and post-secondary
partners to identify specific strategies to increase the number of Aboriginal males participating in post-
secondary education.” This section provides data on gender differences, to determine if progress has
been made since the baseline year off 2009/10.
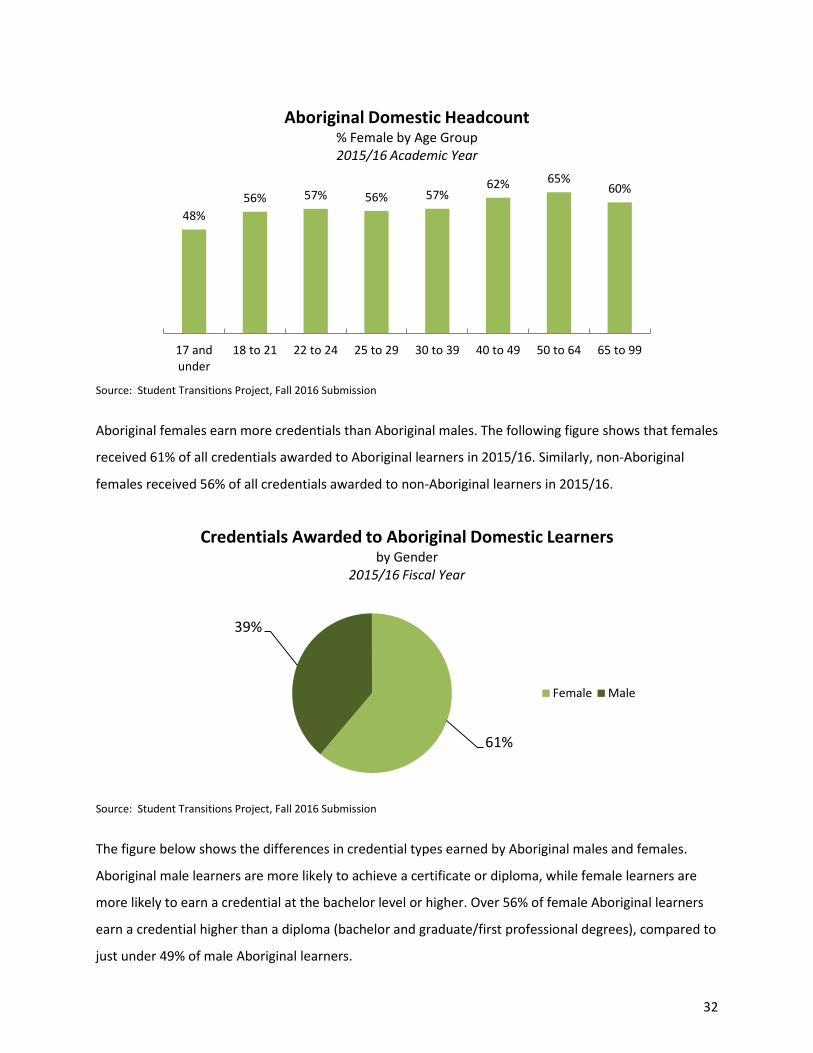
British Columbia’s public post-secondary education system has more female than male learners, but the
gap is larger in the Aboriginal learner population. On average, in the six years from 2010/11 to 2015/16,
53% of the non-Aboriginal learner population was female. Over that same period of time, 57% of the
Aboriginal learner population was female. The trend identified in the Aboriginal Policy Framework—a
consistent underrepresentation of male Aboriginal learners—has not changed. On average the gender
gap for non-Aboriginal learners is approximately 6% (47% male, 53% female). The gender gap for
Aboriginal learners is 14% (43% male, 57% female). The gender gap is larger among older learners, as
demonstrated in the following figure.
23 Aboriginal Post-Secondary Education and Training Policy Framework and Action Plan. Accessed July 2017 from: http://www2.gov.bc.ca/assets/gov/education/post-secondary-education/aboriginal-education-training/aboriginal_action_plan.pdf
32
Source: Student Transitions Project, Fall 2016 Submission
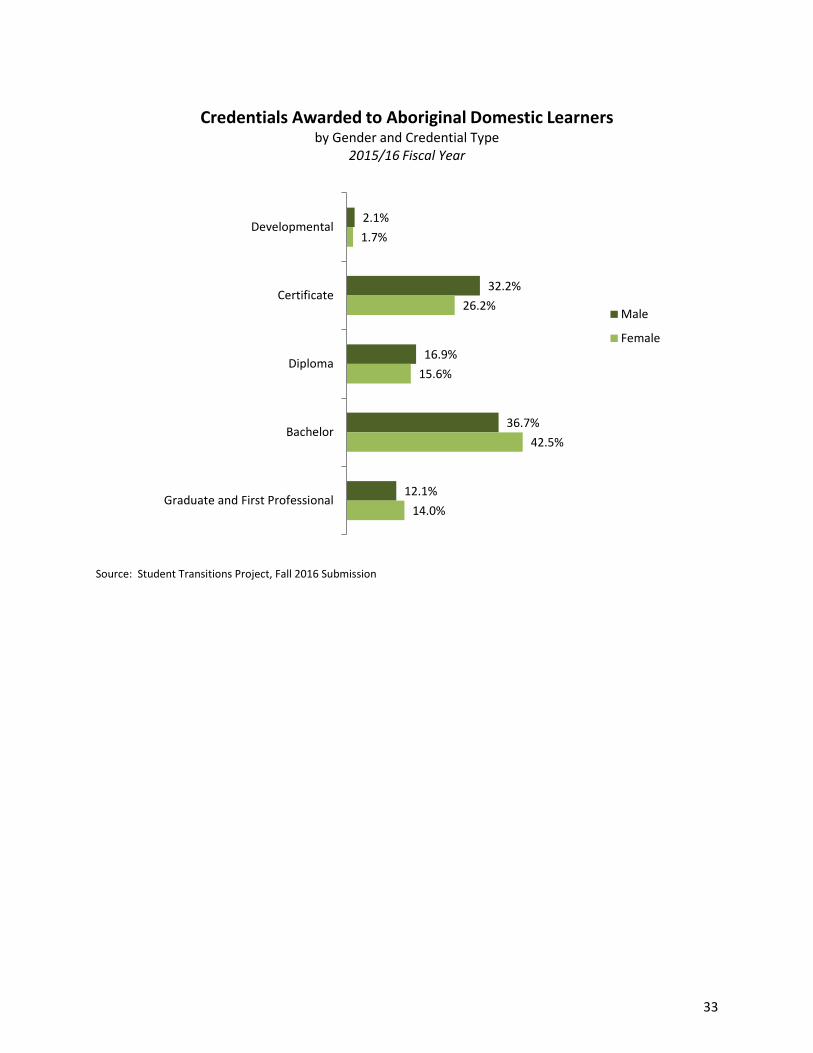
Aboriginal females earn more credentials than Aboriginal males. The following figure shows that females
received 61% of all credentials awarded to Aboriginal learners in 2015/16. Similarly, non-Aboriginal
females received 56% of all credentials awarded to non-Aboriginal learners in 2015/16.
Source: Student Transitions Project, Fall 2016 Submission
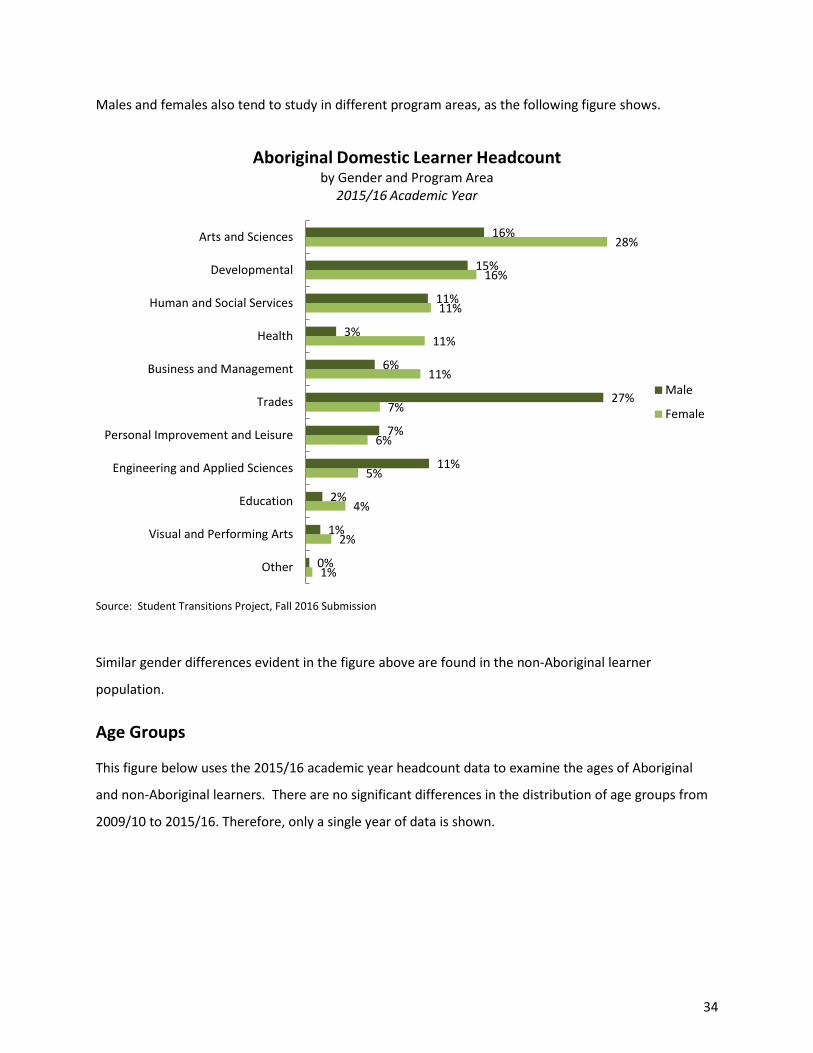
The figure below shows the differences in credential types earned by Aboriginal males and females.
Aboriginal male learners are more likely to achieve a certificate or diploma, while female learners are
more likely to earn a credential at the bachelor level or higher. Over 56% of female Aboriginal learners
earn a credential higher than a diploma (bachelor and graduate/first professional degrees), compared to
just under 49% of male Aboriginal learners.
48% 56% 57% 56% 57%
62% 65% 60%
17 andunder
18 to 21 22 to 24 25 to 29 30 to 39 40 to 49 50 to 64 65 to 99
Aboriginal Domestic Headcount % Female by Age Group 2015/16 Academic Year
61%
39%
Credentials Awarded to Aboriginal Domestic Learners by Gender
2015/16 Fiscal Year
Female Male
33
Source: Student Transitions Project, Fall 2016 Submission
2.1%
32.2%
16.9%
36.7%
12.1%
1.7%
26.2%
15.6%
42.5%
14.0%
Developmental
Certificate
Diploma
Bachelor
Graduate and First Professional
Credentials Awarded to Aboriginal Domestic Learners by Gender and Credential Type
2015/16 Fiscal Year
Male
Female
34
Males and females also tend to study in different program areas, as the following figure shows.
Source: Student Transitions Project, Fall 2016 Submission
Similar gender differences evident in the figure above are found in the non-Aboriginal learner
population.
Age Groups
This figure below uses the 2015/16 academic year headcount data to examine the ages of Aboriginal
and non-Aboriginal learners. There are no significant differences in the distribution of age groups from
2009/10 to 2015/16. Therefore, only a single year of data is shown.
1%
2%
4%
5%
6%
7%
11%
11%
11%
16%
28%
0%
1%
2%
11%
7%
27%
6%
3%
11%
15%
16%
Other
Visual and Performing Arts
Education
Engineering and Applied Sciences
Personal Improvement and Leisure
Trades
Business and Management
Health
Human and Social Services
Developmental
Arts and Sciences
Aboriginal Domestic Learner Headcount by Gender and Program Area
2015/16 Academic Year
Male
Female

35
Source: Student Transitions Project, Fall 2016 Submission
Overall, Aboriginal learners participating in post-secondary education tend to be older than non-
Aboriginal learners, though the difference is small. Non-Aboriginal learners are slightly more likely to be
in their late teens and early 20s, while Aboriginal learners are more likely to be in their 30s and 40s. This
pattern is contrary to trends in the Aboriginal population in B.C., which tends to be younger than the
non-Aboriginal population. The data supports the fact that Aboriginal learners are less likely to begin
their post-secondary education directly out of high school (as outlined in Section 1 of this report).
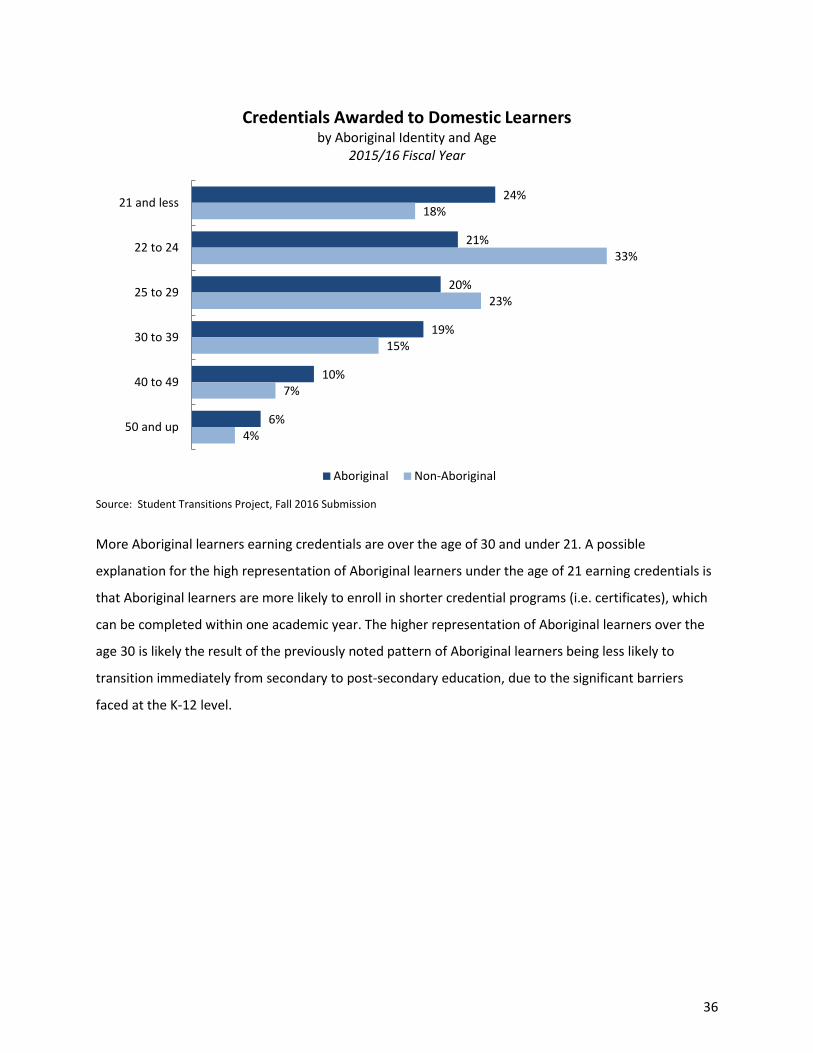
Credential data shows a similar trend; Aboriginal learners tend to be older when they are awarded a
credential. The following figure, using 2015/16 data, compares the ages of Aboriginal and non-Aboriginal
learners earning credentials.
5%
24%
15%
16%
19%
11%
8%
1%
3%
30%
18%
16%
16%
9%
7%
2%
17 years and under
18 to 21
22 to 24
25 to 29
30 to 39
40 to 49
50 to 64
65 to 99
Domestic Learner Headcount by Age Group
2015/16 Academic Year
Aboriginal Non-Aboriginal
36
Source: Student Transitions Project, Fall 2016 Submission
More Aboriginal learners earning credentials are over the age of 30 and under 21. A possible
explanation for the high representation of Aboriginal learners under the age of 21 earning credentials is
that Aboriginal learners are more likely to enroll in shorter credential programs (i.e. certificates), which
can be completed within one academic year. The higher representation of Aboriginal learners over the
age 30 is likely the result of the previously noted pattern of Aboriginal learners being less likely to
transition immediately from secondary to post-secondary education, due to the significant barriers
faced at the K-12 level.
24%
21%
20%
19%
10%
6%
18%
33%
23%
15%
7%
4%
21 and less
22 to 24
25 to 29
30 to 39
40 to 49
50 and up
Credentials Awarded to Domestic Learners by Aboriginal Identity and Age
2015/16 Fiscal Year
Aboriginal Non-Aboriginal

37
Section 5: Aboriginal Learner Outcomes This section summarizes the results of the Baccalaureate Graduates Survey; Diploma, Associate Degree,
and Certificate Student Outcomes Survey; and the Apprenticeship Student Outcomes Survey that
provide information regarding trends in the Aboriginal learner satisfaction with their education and their
employment outcomes. For each survey, the results outlined below represent the aggregated results
from three years of surveys, 2014-2016.
Baccalaureate Graduates Survey Data (2014-2016)
Each year, baccalaureate graduates from British Columbia's public post-secondary institutions are asked
to participate in a province-wide survey. These surveys provide important feedback on student
satisfaction, further education, education financing and student debt, and employment outcomes. The
survey interviews former students two years after graduation. Approximately 80 percent of
baccalaureate graduates surveyed obtained their degrees from a research university.
Education Outcomes
Baccalaureate graduates report high overall satisfaction with the education they received. Responses
also indicate high levels of satisfaction in the quality of course instruction.
Respondents Satisfied with Education Satisfied with Quality of
Instruction Aboriginal 831 93% 94% Female 605 95% 95% Male 226 91% 94% Non Aboriginal 26,268 93% 94% Female 15,990 93% 95% Male 10,278 92% 93% Source: Baccalaureate Graduate Survey 2014; 2015; 2016
Employment Outcomes
Approximately 11% of respondents were not in the labour force at the time of survey. Respondents are
not in the labour force if they are not seeking work. This includes respondents that are taking further
education. Respondents are considered unemployed if they are seeking work (e.g., are in the labour
force) but are not employed. Aboriginal baccalaureate graduates experience higher unemployment
rates than non-Aboriginal graduates (9% vs. 7%). Despite higher unemployment rates, Aboriginal
baccalaureate graduates who find employment are more likely than non-Aboriginal graduates to report
38
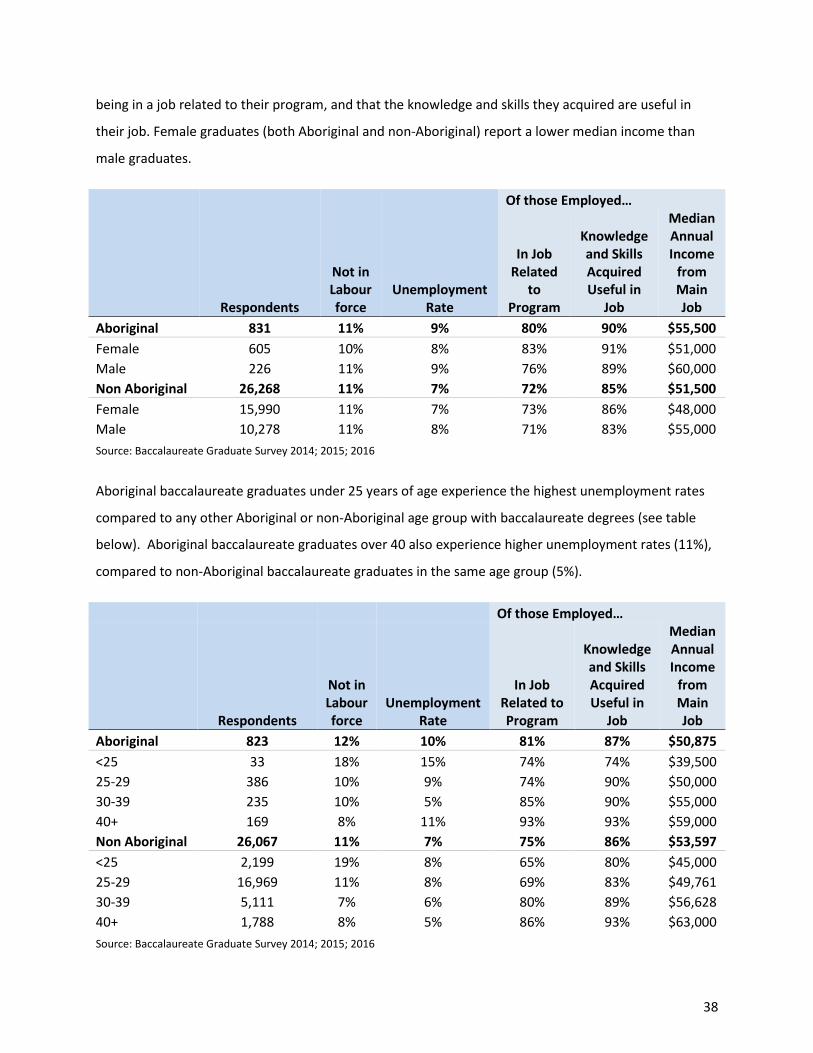
being in a job related to their program, and that the knowledge and skills they acquired are useful in
their job. Female graduates (both Aboriginal and non-Aboriginal) report a lower median income than
male graduates.
Of those Employed…
Respondents
Not in Labour force
Unemployment Rate
In Job Related
to Program
Knowledge and Skills Acquired Useful in
Job
Median Annual Income
from Main Job
Aboriginal 831 11% 9% 80% 90% $55,500 Female 605 10% 8% 83% 91% $51,000 Male 226 11% 9% 76% 89% $60,000 Non Aboriginal 26,268 11% 7% 72% 85% $51,500 Female 15,990 11% 7% 73% 86% $48,000 Male 10,278 11% 8% 71% 83% $55,000 Source: Baccalaureate Graduate Survey 2014; 2015; 2016
Aboriginal baccalaureate graduates under 25 years of age experience the highest unemployment rates
compared to any other Aboriginal or non-Aboriginal age group with baccalaureate degrees (see table
below). Aboriginal baccalaureate graduates over 40 also experience higher unemployment rates (11%),
compared to non-Aboriginal baccalaureate graduates in the same age group (5%).
Of those Employed…
Respondents
Not in Labour force
Unemployment Rate
In Job Related to Program
Knowledge and Skills Acquired Useful in
Job
Median Annual Income
from Main Job
Aboriginal 823 12% 10% 81% 87% $50,875 <25 33 18% 15% 74% 74% $39,500 25-29 386 10% 9% 74% 90% $50,000 30-39 235 10% 5% 85% 90% $55,000 40+ 169 8% 11% 93% 93% $59,000 Non Aboriginal 26,067 11% 7% 75% 86% $53,597 <25 2,199 19% 8% 65% 80% $45,000 25-29 16,969 11% 8% 69% 83% $49,761 30-39 5,111 7% 6% 80% 89% $56,628 40+ 1,788 8% 5% 86% 93% $63,000 Source: Baccalaureate Graduate Survey 2014; 2015; 2016
39
Diploma, Associate Degree, and Certificate Survey Data (2014-2016)
Each year, former students from diploma, associate degree, or certificate programs in the B.C. post-
secondary system are asked to participate in a province-wide survey. These former students, who have
been out of their programs for approximately 9 to 20 months, provide feedback on student satisfaction,
ratings of programs, further education, and employment outcomes. Not all students surveyed have
achieved a credential; students who complete the bulk of their credits at one institution but move to
another to complete the credential (e.g. university transfer students) are also included in this survey.
Students included in the employment outcomes have acquired a credential.
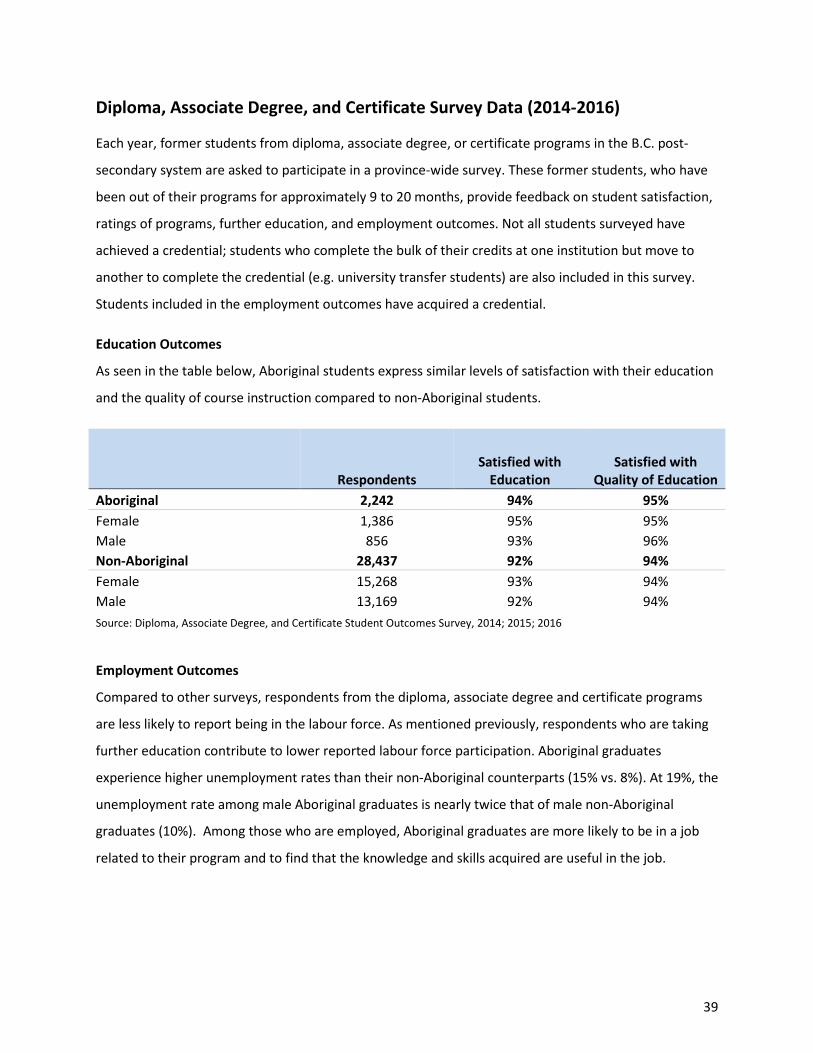
Education Outcomes
As seen in the table below, Aboriginal students express similar levels of satisfaction with their education
and the quality of course instruction compared to non-Aboriginal students.
Respondents Satisfied with
Education Satisfied with
Quality of Education Aboriginal 2,242 94% 95% Female 1,386 95% 95% Male 856 93% 96% Non-Aboriginal 28,437 92% 94% Female 15,268 93% 94% Male 13,169 92% 94% Source: Diploma, Associate Degree, and Certificate Student Outcomes Survey, 2014; 2015; 2016
Employment Outcomes
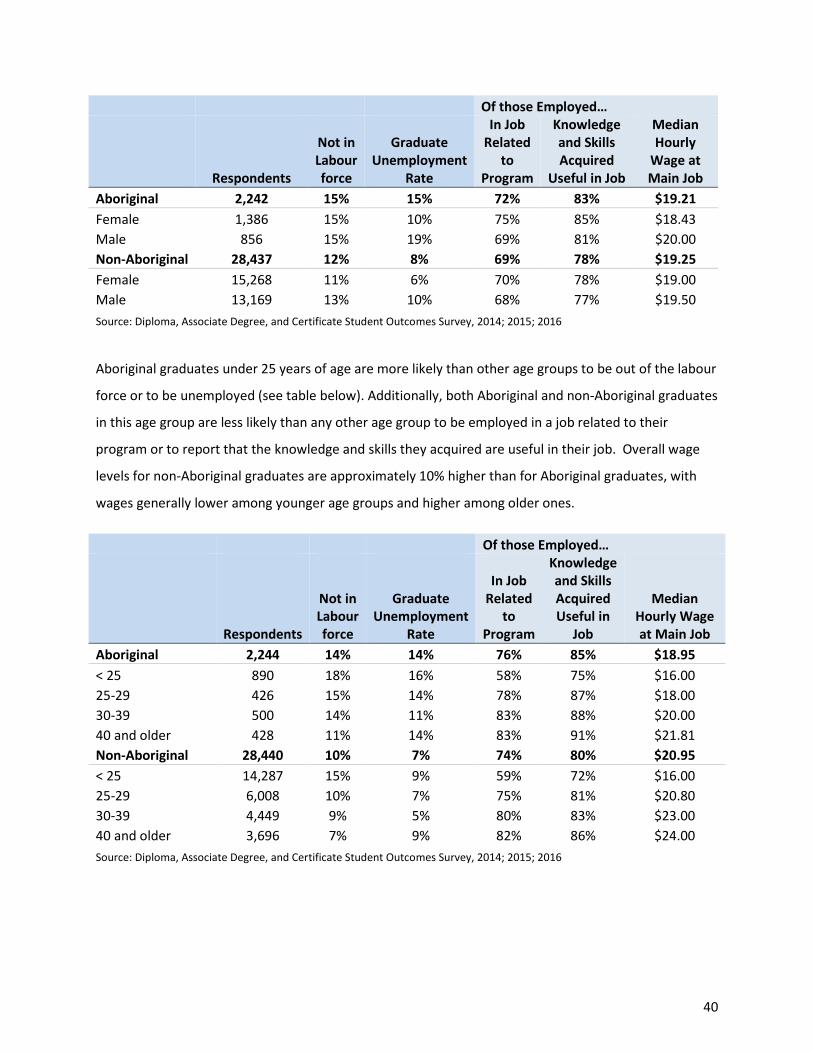
Compared to other surveys, respondents from the diploma, associate degree and certificate programs
are less likely to report being in the labour force. As mentioned previously, respondents who are taking
further education contribute to lower reported labour force participation. Aboriginal graduates
experience higher unemployment rates than their non-Aboriginal counterparts (15% vs. 8%). At 19%, the
unemployment rate among male Aboriginal graduates is nearly twice that of male non-Aboriginal
graduates (10%). Among those who are employed, Aboriginal graduates are more likely to be in a job
related to their program and to find that the knowledge and skills acquired are useful in the job.
40
Of those Employed…
Respondents
Not in Labour force
Graduate Unemployment
Rate
In Job Related
to Program
Knowledge and Skills Acquired
Useful in Job
Median Hourly
Wage at Main Job
Aboriginal 2,242 15% 15% 72% 83% $19.21 Female 1,386 15% 10% 75% 85% $18.43 Male 856 15% 19% 69% 81% $20.00 Non-Aboriginal 28,437 12% 8% 69% 78% $19.25 Female 15,268 11% 6% 70% 78% $19.00 Male 13,169 13% 10% 68% 77% $19.50 Source: Diploma, Associate Degree, and Certificate Student Outcomes Survey, 2014; 2015; 2016
Aboriginal graduates under 25 years of age are more likely than other age groups to be out of the labour
force or to be unemployed (see table below). Additionally, both Aboriginal and non-Aboriginal graduates
in this age group are less likely than any other age group to be employed in a job related to their
program or to report that the knowledge and skills they acquired are useful in their job. Overall wage
levels for non-Aboriginal graduates are approximately 10% higher than for Aboriginal graduates, with
wages generally lower among younger age groups and higher among older ones.
Of those Employed…
Respondents
Not in Labour force
Graduate Unemployment
Rate
In Job Related
to Program
Knowledge and Skills Acquired Useful in
Job
Median Hourly Wage at Main Job
Aboriginal 2,244 14% 14% 76% 85% $18.95 < 25 890 18% 16% 58% 75% $16.00 25-29 426 15% 14% 78% 87% $18.00 30-39 500 14% 11% 83% 88% $20.00 40 and older 428 11% 14% 83% 91% $21.81 Non-Aboriginal 28,440 10% 7% 74% 80% $20.95 < 25 14,287 15% 9% 59% 72% $16.00 25-29 6,008 10% 7% 75% 81% $20.80 30-39 4,449 9% 5% 80% 83% $23.00 40 and older 3,696 7% 9% 82% 86% $24.00 Source: Diploma, Associate Degree, and Certificate Student Outcomes Survey, 2014; 2015; 2016

41
Apprenticeship Survey Data (2014-2016)
The Apprenticeship Student Outcomes Survey includes learners who participated in apprenticeship
programs, which combine workplace training with in-school training at an institution. Normally,
approximately 20% of an apprenticeship is completed in school and the rest in the workplace. Over
three-quarters of apprentices attended an institution in the public post-secondary system. The results
discussed below do not include apprentices who attended a private post-secondary institution. Former
apprentices were surveyed 8 to 18 months after finishing their in-school training. Males constitute a
significant majority of apprentices.
Education Outcomes
Aboriginal and non-Aboriginal former apprentices report high levels of satisfaction with their overall
education, the quality of their course instruction, and their workplace training experience. A lower
proportion of Aboriginal former apprentices obtain their certificate of qualification compared to non-
Aboriginal former apprentices (78% vs. 85%). Female former apprentices are less likely to report having
obtained their certificate of qualification compared to male former apprentices.
Respondents
Satisfied with
Education
Satisfied with Quality of Education
Satisfied with Workplace Training Experience
Obtained Certificate of Qualification
Aboriginal 586 87% 94% 90% 78% Female 79 82% 94% 89% 75% Male 507 91% 95% 90% 81% Non-Aboriginal 6,644 94% 96% 92% 85% Female 591 94% 95% 91% 83% Male 6,053 94% 96% 92% 88% Source: Apprenticeship Student Outcomes Survey, 2014; 2015; 2016
Employment Outcomes
As seen in the table below, 10% of Aboriginal former apprentices were not in the labour force at the
time of survey. A disproportionately higher number of female Aboriginal former apprentices report not
being in the labour force, more than twice that of male Aboriginal former apprentices and female non-
Aboriginal former apprentices. Aboriginal former apprentices face an unemployment rate nearly three
times higher than that of non-Aboriginal former apprentices (22% vs 8%).

42
Of those who find employment, Aboriginal former apprentices are less likely to report they are in a
training-related job (76% vs 88%). Aboriginal former apprentices report similar median hourly wages at
$24.50. Female former apprentices report significantly lower median wages than males (this is also the
case for the non-Aboriginal female former apprentices).
Of those Employed…
Respondents
Not in Labour force
Graduate Unemployment
Rate
In Job Related
to Program
Knowledge and Skills Acquired Useful in
Job
Median Hourly
Wage at Main Job
Aboriginal 586 10% 22% 76% 86% $24.50 Female 79 14% 24% 69% 82% $20.00 Male 507 6% 20% 83% 90% $29.00 Non-Aboriginal 6,644 4% 8% 88% 91% $24.50 Female 591 6% 9% 85% 90% $19.00 Male 6,053 3% 7% 91% 93% $30.00 Source: Apprenticeship Student Outcomes Survey, 2014; 2015; 2016
Aboriginal former apprentices in the over-40 age groups are more likely to be unemployed with a 31%
unemployment rate.
Of those Employed…
Respondents
Not in Labour force
Graduate Unemployment
Rate
In Job Related
to Program
Knowledge and Skills Acquired Useful in
Job
Median Hourly
Wage at Main Job
Aboriginal 586 7% 22% 81% 89% $27.50 < 25 161 6% 20% 77% 88% $20.00 25-29 126 9% 20% 83% 90% $30.00 30-39 174 4% 16% 83% 88% $30.00 40+ 125 9% 31% 83% 88% $30.00 Non-Aboriginal 6,656 3% 7% 90% 93% $30.50 < 25 2,163 5% 8% 87% 92% $25.00 25-29 1,893 2% 7% 92% 93% $30.00 30-39 1,778 2% 6% 92% 93% $33.00 40+ 822 3% 9% 90% 92% $34.00 Source: Apprenticeship Student Outcomes Survey, 2014; 2015; 2016
43
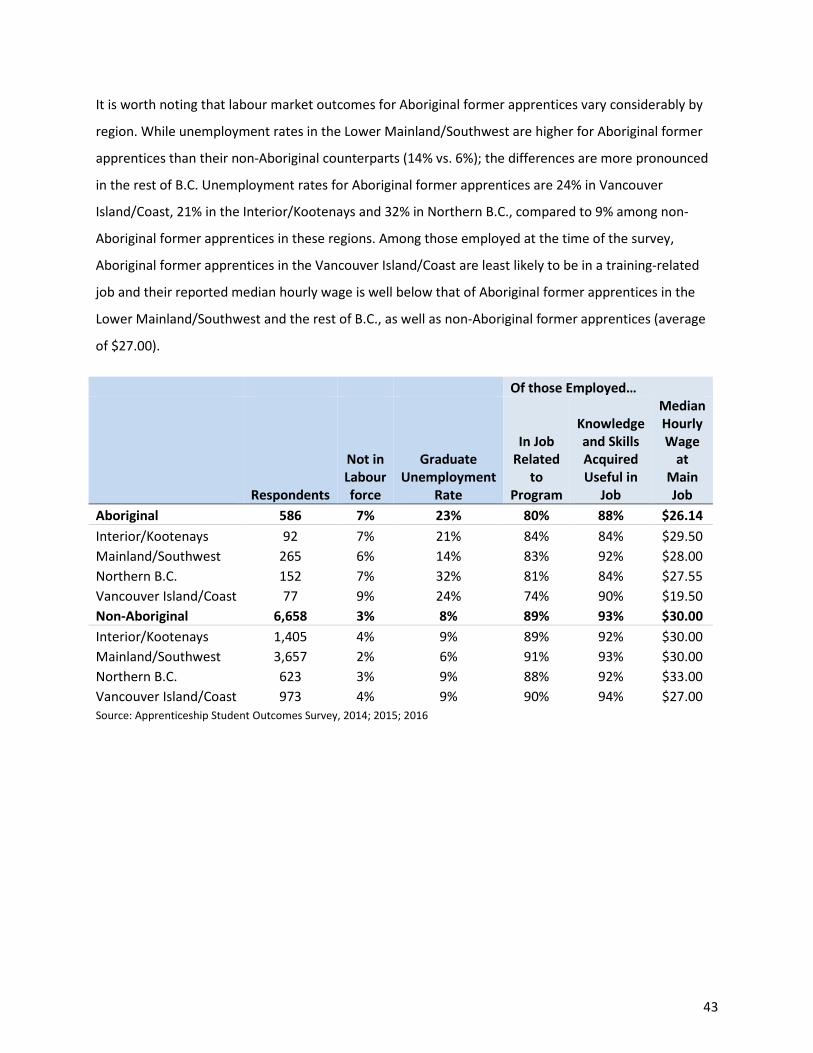
It is worth noting that labour market outcomes for Aboriginal former apprentices vary considerably by
region. While unemployment rates in the Lower Mainland/Southwest are higher for Aboriginal former
apprentices than their non-Aboriginal counterparts (14% vs. 6%); the differences are more pronounced
in the rest of B.C. Unemployment rates for Aboriginal former apprentices are 24% in Vancouver
Island/Coast, 21% in the Interior/Kootenays and 32% in Northern B.C., compared to 9% among non-
Aboriginal former apprentices in these regions. Among those employed at the time of the survey,
Aboriginal former apprentices in the Vancouver Island/Coast are least likely to be in a training-related
job and their reported median hourly wage is well below that of Aboriginal former apprentices in the
Lower Mainland/Southwest and the rest of B.C., as well as non-Aboriginal former apprentices (average
of $27.00).
Of those Employed…
Respondents
Not in Labour force
Graduate Unemployment
Rate
In Job Related
to Program
Knowledge and Skills Acquired Useful in
Job
Median Hourly Wage
at Main Job
Aboriginal 586 7% 23% 80% 88% $26.14 Interior/Kootenays 92 7% 21% 84% 84% $29.50 Mainland/Southwest 265 6% 14% 83% 92% $28.00 Northern B.C. 152 7% 32% 81% 84% $27.55 Vancouver Island/Coast 77 9% 24% 74% 90% $19.50 Non-Aboriginal 6,658 3% 8% 89% 93% $30.00 Interior/Kootenays 1,405 4% 9% 89% 92% $30.00 Mainland/Southwest 3,657 2% 6% 91% 93% $30.00 Northern B.C. 623 3% 9% 88% 92% $33.00 Vancouver Island/Coast 973 4% 9% 90% 94% $27.00 Source: Apprenticeship Student Outcomes Survey, 2014; 2015; 2016

44
Conclusion This report offers a clearer picture of the experiences of Aboriginal learners in B.C.’s public post-
secondary system.
With respect to increases in the number of Aboriginal learners participating in post-secondary education
in B.C., and the numbers of credentials being awarded to Aboriginal learners, British Columbia has made
some progress to realizing the vision of the Aboriginal Policy Framework. This progress reflects the
efforts of individual Aboriginal learners to overcome barriers at a number of stages in their journey to
post-secondary education. It also reflects efforts made by Aboriginal communities, Aboriginal institutes
and organizations, British Columbia’s public post-secondary institutions, and the Province to improve
the post-secondary education experience for Aboriginal learners. Some of the programs and services
designed to assist Aboriginal learners in achieving success in post-secondary education are outlined in
the Aboriginal Policy Framework. The Ministry of Advanced Education, Skills and Training is committed
to building on and improving programs and services that support Aboriginal learners. The purpose of
this report is to draw attention to areas needing additional work and to inform policy and program
development to make further improvements.
While the number of Aboriginal learners participating and succeeding in post-secondary education has
increased, it is important to note that Aboriginal learners continue to face significant barriers to entering
and succeeding in post-secondary education, and that the improvement in enrolment and credentials
awarded could be attributed in part to growth of the Aboriginal population in the province. Further
research is needed to determine the impact of these changing demographics on the data.
Data provided by the Ministry of Education indicates that experiences in K-12 affect the ability of
Aboriginal learners to transition into post-secondary programs. Aboriginal learners are significantly less
likely than non-Aboriginal learners to graduate with a Certificate of Graduation (Dogwood Diploma)
within six years (64% vs. 86% in 2015/16), and more likely to receive an Evergreen Certificate (although
this should change as a result of the Ministry of Education’s 2016 restriction on the granting of
Evergreen Certificates). Aboriginal learners are also less likely to graduate with an academic GPA higher
than 75%, which is an approximation of the minimum basis for admission to research-intensive
universities. There are noticeable gender disparities in Aboriginal graduation rates: from 2011/12 to
2015/16, on average, 7% more female Aboriginal learners achieved Grade 12 graduation than Aboriginal
male learners.
45
This is not to suggest that responsibility for improving transition rates rests solely with the K-12 system.
Research has shown that increased collaboration between the K-12 and post-secondary systems can
positively affect student success and transitions. This collaboration can include early outreach by post-
secondary institutions (for example, visits to schools, bringing K-12 learners to post-secondary
campuses, and summer camps).
Even for those Aboriginal learners who achieve secondary school graduation, the immediate transition
rate to post-secondary institutions is much lower than for non-Aboriginal learners (42% vs. 54%). After 5
years, this difference is smaller, with 63% of Aboriginal Grade 12 graduates transitioning to a post-
secondary institution, compared to 72% of non-Aboriginal Grade 12 graduates. It is important to note
that the higher attrition rate of Aboriginal learners in the K-12 system results in a lower number of
Aboriginal learners graduating from grade 12 and then enrolling in the B.C. public post-secondary
system.24 Programs such as the Aboriginal Service Plan initiative provide funding to some public post-
secondary institutions to assist learners in making this transition, but moving forward it is important for
public post-secondary institutions to consider what steps they can take to support this transition.
Likely as a result of the above factors, Aboriginal learners are more likely to attend a college and are less
likely to attend a research-intensive university. Aboriginal learners are also more likely than non-
Aboriginal learners to earn credentials at the developmental and certificate level and less likely to earn
baccalaureate degrees. Aboriginal learners are also more likely than non-Aboriginal learners to study in
Developmental and Trades program areas and less likely to study in the Business and Management, Arts
and Sciences, Engineering and Applied Sciences, or Health program areas, which are more frequently
associated with baccalaureate degrees. As such, looking exclusively at enrolment or credentials is not
adequate and additional work should be undertaken to ensure that Aboriginal learners are appropriately
represented across the spectrum of disciplines and programs.
Overall, the number of credentials awarded to Aboriginal learners has increased 23% since the 2009/10
baseline. It appears that progress towards the target of a 75% increase in credentials awarded to
Aboriginal learners by 2020/21 has fallen behind the rate necessary to meet the target, but it should be
noted that it can take several years for a learner to earn a credential like a baccalaureate degree.
24 STP Fast Facts. Accessed July 2017 from: http://www2.gov.bc.ca/assets/gov/education/post-secondary-education/data-research/stp/stp_fast_facts_2016-06-01.pdf

46
Overall, the number of Aboriginal learner FTEs in the B.C. public post-secondary system has increased. In
2015/16, Aboriginal learners accounted for 13,098 FTEs, an 11.5% increase over the baseline of 11,745.
As the number of Aboriginal FTEs increased, so did the share of the total domestic FTEs in the public
post-secondary sector. In 2009/10, 5.8% of all domestic FTEs were Aboriginal, by 2015/16 this had
increased to 6.5%. At the same time, the Aboriginal learner headcount has dropped, suggesting that
while fewer Aboriginal learners are attending post-secondary, more of them are studying full-time.
Aboriginal graduates report high overall satisfaction with the education they receive and the quality of
course instruction, at rates similar to non-Aboriginal graduates. The employment results are concerning,
particularly for Aboriginal graduates of apprenticeship, certificate, diploma, and associate degree
programs. These graduates experience substantially higher unemployment rates than non-Aboriginal
graduates. Aboriginal learners who complete baccalaureate degrees have a slightly higher
unemployment rate than non-Aboriginal baccalaureate holder (9% versus 7%).
This report points to some areas where post-secondary institutions can focus efforts in order to reduce
barriers and improve outcomes for Aboriginal learners. In this regard, it is important to note the
following principle from the Aboriginal Policy Framework:
Recognition that First Nations, Métis and Inuit peoples are in the best position to inform the
development of and decision-making around post-secondary education programs, policies and
services for First Nations, Métis and Inuit peoples, working collaboratively within existing
governance structures.
This report highlights areas where further research and policy work is required including:
• What factors contribute to the high proportion of Aboriginal learners graduating from high
school with no academic GPA calculated or a GPA less than 75%, making it more difficult to
transition to a research-intensive university? How can this discrepancy be addressed in the K-12
system? How can public post-secondary institutions assist this transition?
• What factors contribute to Aboriginal learners being less likely to transition immediately from
secondary to post-secondary education and then entering post-secondary education later in life
than non-Aboriginal learners? What programs have been effective in supporting students in
the transition and what systemic barriers need to be addressed?
47
• What factors contribute to the gender gap between male and female learners being greater in
the Aboriginal than the non-Aboriginal population and what measures can be taken to reduce
this gap?
• What factors contribute to lower Aboriginal teacher education program recruitment and
retention and what measures can be taken in order to increase the number of Aboriginal
learners eligible for teacher certification?
• What factors contribute to the higher unemployment rates for Aboriginal learners who graduate
from apprenticeship, diploma, certificate, and baccalaureate programs and what can be done to
address them?
Additional data analysis that would increase our understanding of the experiences of Aboriginal learners
in the B.C. public post-secondary system includes:
• The impact of population growth on the number of Aboriginal learners enrolling in post-
secondary education.
• The experiences of on-reserve First Nations learners compared to other Aboriginal learners.
• The experiences of Aboriginal learners who are former youth in care compared to those who
have not been in care.
• Measuring the retention of Aboriginal learners within the public post-secondary system.
48
Appendix 1 – Data Sources
Student Transitions Project
The Student Transitions Project (STP) is a collaborative project between the Ministry of Advanced
Education, Skills and Training; the Ministry of Education; public post-secondary institutions; and school
districts. STP links learner data in the B.C. public post-secondary education system with information
from their years in kindergarten to Grade 12 using the unique nine-digit personal education numbers
(PENs) assigned to every learner entering the public provincial educational system. Information from
the STP helps the Ministry of Advanced Education, Skills and Training ; the Ministry of Education; public
post-secondary institutions; and school districts plan and manage programs to increase learner success.
The STP identifies Aboriginal learners as anyone who self-identified at any point from kindergarten to
post-secondary in response to the questions noted on p.8 of this report. This report relies on the STP for
reporting headcount and credential data.
Headcount
Headcount represents the total number of learners enrolled in the B.C. public post-secondary system in
the academic year. It reports the number of learners enrolled over a period of time (e.g. within the
2009/10 academic year), and at the system-level, institutional-level, or program-level. Because
headcount is based on course-level data, duplication can occur depending on the granularity of the
analysis. For instance, if a learner is enrolled in a course at two institutions, they will be counted once at
the system-level, but included in each of the institutions’ data. The same is true for learners enrolled in
courses across multiple program areas or programs. As a result, the term “unique headcount” is used to
signify the number of unique learners enrolled across the whole public post-secondary system without
any duplication. Headcount includes all activity engaged in at the institution.
Credentials
Credential data represent the total number of credentials awarded across the B.C. public post-secondary
system in the fiscal year. Credentials are reported as awarded when the learner obtains their credential.
Learners who have completed their program requirements, but have not applied to receive their
credential are not included. Institutions update this data annually, and credentials can change slightly
year-over-year as some learners may request their credentials a year or more after they have completed
their studies. Any discrepancies between this report and other reports are due to these expected
adjustments.
49
Credentials reported are based on the data standards of the Ministry of Advanced Education, Skills and
Training’s Accountability Framework. The data standard excludes the following types of credentials:
those offered with less than three months of study (short certificates), apprenticeships (these are
awarded by the Industry Training Authority), credentials offered based on various evaluative
components but not within the standard definitions (other), and programs that do not offer a credential.
Central Data Warehouse & Custom Data requests
The Post-Secondary Central Data Warehouse contains standardized data relating to learner
demographics, programs, credentials, courses, session registration and campuses for 21 public post-
secondary institutions in B.C., including colleges, institutes and teaching-intensive universities.
Full-Time Equivalents (FTEs)
The Central Data Warehouse Data Definitions and Standard Element Definitions25 define the process for
the calculation of FTEs. “The FTE Divisor [representing the number of program learning units within a
program that equals a full time load for an academic year as defined by the institution] is used to
calculate the number of FTE’s delivered for a particular program by an institution.” In other words, one
FTE is defined as one learner taking a full course load or three learners with a 33% course load each. As a
result headcount will be higher than FTEs as many students with partial course loads will create a single
FTE. FTE data is tracked by the fiscal year, April 1 to March 31. Like the STP data included in this report,
FTEs include any Aboriginal learners who self-identified at any point from kindergarten to post-
secondary. Unlike credential data, FTEs reported include all activity taken at the institution.
Aboriginal FTE data for the four research-intensive universities and Royal Roads University are collected
via custom data requests and reflect the number reported in those institutions’ annual Institutional
Accountability Plan and Reports.
Student Outcomes Data
The B.C. Student Outcomes program collects learner feedback by surveying former post-secondary
learners who took baccalaureate programs, apprenticeship technical training, and diploma, certificate,
or associate degree programs. These surveys provide insight on learners’ transitions from one stage of
25 Ministry of Advanced Education, Skills and Training, “Data Definitions and Standards for the Central Data Warehouse,” modified September 2015. Accessed July 2017 from: http://www2.gov.bc.ca/gov/content/education-training/post-secondary-education/data-research/post-secondary-central-data-warehouse

50
education to another and from the post-secondary education system to the labour force. They also
provide a comprehensive overview of the province’s public post-secondary system from the learner’s
perspective. All of B.C.'s 25 public post-secondary institutions participate in the program and close to
30,000 former learners are surveyed each year. The surveys are conducted with funding from the
Ministry of Advanced Education, Skills and Training; the Industry Training Authority; and from B.C.'s
public post-secondary institutions.
The Student Outcomes surveys provide each learner the opportunity to identify as Aboriginal. However,
unlike the STP, Aboriginal identity is not matched to previous educational experiences (i.e. kindergarten
to grade 12). This creates potential differences between the set of learners tracked as Aboriginal
learners in STP and those tracked in Student Outcomes. For example, a learner who self-identified as
Aboriginal in the post-secondary system and then did not self-identify during a Student Outcomes
survey will be considered to be of Aboriginal identity by the Student Transitions Project but not by the
Student Outcomes survey. Similarly, a learner who self-identifies for the first time when taking the
survey will be considered Aboriginal in the survey but not by STP.
While the Student Outcomes surveys has an excellent response rate, once individual surveys have been
broken down into Aboriginal and non-Aboriginal respondents, numbers can be small. This is
compounded by the fact that not all learners answer all questions. As a result, this report combines
three years of data to ensure meaningful reporting can occur. With a larger sample size, the data tends
to be more reliable and meaningful.

51
Appendix 2 - Classification of Instructional Programs
CIP Cluster CIP CIP Category Title Arts and Sciences Cluster 5 Area, ethnic, cultural, and gender studies
9 Communications, journalism and related programs 10 Communications technologies/technicians and support services 16 Aboriginal and Foreign languages, literatures, and linguistics 23 English language and literature/letters 24 Liberal arts and sciences, general studies and humanities 26 Biological and biomedical sciences 27 Mathematics and statistics 30 Multidisciplinary/interdisciplinary studies 38 Philosophy and religious studies 39 Theology and religious vocations 40 Physical sciences 42 Psychology 45 Social Sciences 54 History 55 French Language and Literature/Letters
Trades Cluster 12 Personal and culinary services 46 Construction trades 47 Mechanic and repair technologies/technicians 48 Precision production 49 Transportation and materials moving
Health Cluster 51 Health professions and related clinical sciences 60 Dental, medical, and veterinary residency programs
Education Cluster 13 Education 25 Library science
Visual and Performing Arts Cluster 50 Visual and performing arts
Business and Management Cluster 52 Business, management, marketing and related support services Engineering and Applied Sciences Cluster
1 Agriculture, agriculture operations and related sciences 3 Natural resources and conservation 4 Architecture and related services
11 Computer and information sciences and support services 14 Engineering 15 Engineering technologies/technicians 41 Science technologies/technicians
Human and Social Services Cluster
19 Family and consumer sciences/human sciences 22 Legal professions and studies 31 Parks, recreation, leisure, and fitness studies 43 Security and protective services 44 Public administration and social service professions
Developmental Cluster 21 Technology education/industrial arts programs 32 Basic skills
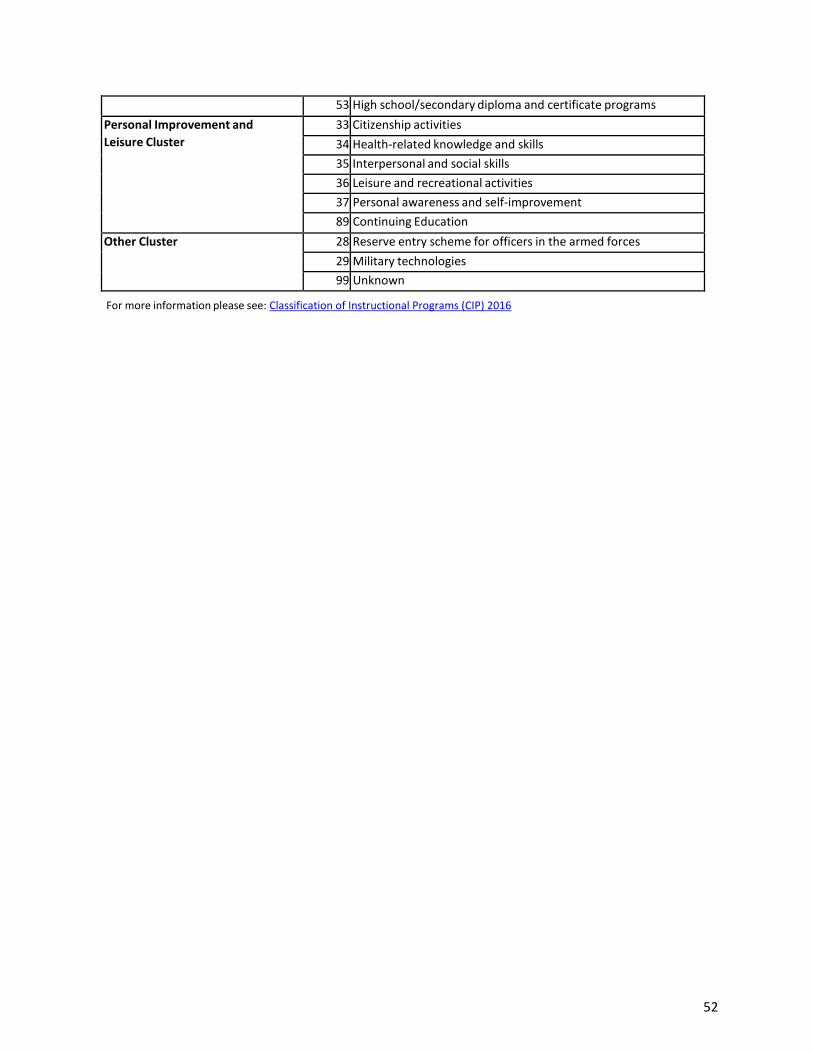
52
53 High school/secondary diploma and certificate programs Personal Improvement and Leisure Cluster
33 Citizenship activities 34 Health-related knowledge and skills 35 Interpersonal and social skills 36 Leisure and recreational activities 37 Personal awareness and self-improvement 89 Continuing Education
Other Cluster 28 Reserve entry scheme for officers in the armed forces 29 Military technologies 99 Unknown
For more information please see: Classification of Instructional Programs (CIP) 2016