abnormal returns from the common stock investments of …. ziobrowski - abnormal... · journal of...
TRANSCRIPT

JOURNAL OF FINANCIAL AND QUANTITATIVE ANALYSIS VOL. 39, NO. 4, DECEMBER 2004 COPYRIGHT 2004, SCHOOL OF BUSINESS ADMINISTRATION, UNIVERSITY OF WASHINGTON, SEATTLE, WA 98195
Abnormal Returns from the Common Stock Investments of the U.S. Senate
Alan J. Ziobrowski, Ping Cheng, James W. Boyd, and Brigitte J. Ziobrowski*
Abstract The actions of the federal government can have a profound impact on financial markets. As prominent participants in the government decision making process, U.S. Senators are likely to have knowledge of forthcoming government actions before the information be- comes public. This could provide them with an informational advantage over other in- vestors. We test for abnormal returns from the common stock investments of members of the U.S. Senate during the period 1993-1998. We document that a portfolio that mimics the purchases of U.S. Senators beats the market by 85 basis points per month, while a port- folio that mimics the sales of Senators lags the market by 12 basis points per month. The large difference in the returns of stocks bought and sold (nearly one percentage point per month) is economically large and reliably positive.
I. Introduction
Decisions made by the federal government often have serious implications for corporate profitability and are therefore of keen interest to the financial mar- kets. U.S. Senators are among the most important participants in that decision
process by virtue of their role as lawmakers and overseers of most federal agen- cies. Senators may also be embedded in social networks that provide them with access to valuable information. As such, Senators might be able to capitalize on this superior information through stock trading. Yet, despite their access to
special information, neither federal law nor The Senate Code of Official Conduct
places any unusual restrictions on the Senators' common stock transactions. Ac-
cording to the U.S. Senate Ethics Manual, "The strong presumption would be that
* Ziobrowski, [email protected], Georgia State University, Department of Real Estate, J. Mack Robinson College of Business, P.O. Box 4020, 33 Gilmer Street SE, Atlanta, GA 30302; Cheng, [email protected], Florida Atlantic University, Department of Industry Study, College of Business, 777 Glades Road, Boca Raton, FL 33431; Boyd, [email protected], Kent State University, De- partment of Finance, College of Business Administration, Kent, OH 44242; and Ziobrowski, bzio- [email protected], Augusta State University, School of Business Administration, Augusta, GA 30904. The authors express their appreciation to the Georgia State University Department of Real Estate for its financial support of this project and to former U.S. Senator Max Cleland of Georgia for his assis- tance in helping us obtain a great deal of the data at no cost. We also thank Jonathan Karpoff (the editor) and Brad Barber (the referee) for their helpful suggestions. All errors are our own.
661
662 Journal of Financial and Quantitative Analysis
the Member was working for legislation because of the public interest and the needs of his constituents and that his own financial interest was only incidentally related .... ."
However, public choice theory (see Buchanan and Tollison (1984)) suggests that such a presumption is unrealistic. That people act to maximize their personal utility in their public capacities as well as their private lives is the most funda- mental principle of public choice theory. Thus, voters can be expected to make choices that they anticipate will maximize benefits to them personally or mini- mize costs. Of more relevance to this study, their elected government officials can be expected to behave likewise. As an example, it is well documented that as a member of Congress in the 1940s and 1950s, Lyndon B. Johnson frequently used his political influence at the Federal Communication Commission to obtain licenses for his radio and television stations and to block competition from invad-
ing his markets in Texas. Johnson's influence allowed him to ultimately grow an initial investment of $17,500 into a multi-media company worth millions.1
There is no academic literature dealing with Congressional common stock returns. The only related literature is Boller (1995), who investigated a random
sample of Congressional delegates (both Senators and Members of the U.S. House of Representatives) and found that 25% of them invested in companies that could be directly affected by ongoing legislative activity. However, this result merely suggests a potential conflict of interest. His research did not demonstrate that these investments yielded unusually large returns.
Our goal in this research is to determine if the Senators' investments tend to outperform the overall market. Such a finding would support the notion that Senators use their informational advantage for personal gain. We test whether the common stocks purchased and sold by U.S. Senators exhibit abnormal returns. Assuming returns are truly "incidental," we hypothesize that U.S. Senators should not earn statistically significant positive abnormal returns on their common stock
acquisitions (the null). Rejection of the null, i.e., a finding of statistically sig- nificant positive abnormal returns, would suggest that Senators are trading stock based on information that is unavailable to the public, thereby using their unique position to increase their personal wealth.
Federal law requires all Senators to disclose their common stock transactions
annually in a Financial Disclosure Report (FDR). We use an event study method-
ology to measure abnormal returns for common stock acquisitions and sales re-
ported by the Senators in their FDRs during the period 1993 through 1998. The
trigger events in our study are the stock purchases and sales made by the Senators. Since these transactions were not publicly reported until long after they occurred
(anywhere from five to 17 months later), the subsequent returns of these stocks could not have been market reactions to the actual transactions themselves. Any statistically significant abnormal returns therefore would likely be the result of reactions to events anticipated by Senators and motivated their transactions.
We find that the behavior of common stocks purchased and sold by Senators indicates that Senators trade with a substantial informational advantage. Using the calendar-time portfolio approach with the Fama-French three-factor model
1 See Dallek (1991) and other biographies of Lyndon B. Johnson for more details.
Ziobrowski, Cheng, Boyd, and Ziobrowski 663
and the Capital Asset Pricing Model (CAPM), a portfolio that mimics the pur- chases of U.S. Senators on a trade-weighted basis outperforms the market by 85 basis points per month, while a portfolio that mimics the sales of Senators un- derperforms the market by 12 basis points per month. For Senate stock purchase transactions, the abnormal returns are both economically large and statistically significant. When measuring cumulative daily abnormal returns we find that the cumulative daily abnormal return from common stocks purchased by Senators is more than 25% during the 12 calendar months immediately following acquisition. Common stocks sold by Senators exhibit slightly positive cumulative abnormal returns throughout the year following the sale. But during the 12 months prior to sale, the cumulative daily abnormal return is also over 25%, peaking close to the time of sale.
We also analyze the data for several subsamples to examine the sensitivity of the results to the Senators' party affiliation and seniority. When transactions made by the Senators are separated by political party, we find no statistically significant differences between the abnormal returns of Democrats and Republicans. How- ever, seniority is a significant factor. The common stock investments of Senators with the least seniority (serving less than seven years) outperform the investments of the most senior Senators (serving more than 16 years) by a statistically signifi- cant margin.
II. Data and Research Design
Many of the Senate FDRs used in this study were obtained from the Web site www.opensecrets.org. However, the FDRs available at the site covered only current members of the Senate and only three years of data were provided at the time of data acquisition. Therefore, it was necessary to acquire additional FDRs from the Senate Printing Office.
In the FDRs, Senators identify all common stock purchases or sales, together with the date of the transactions and the approximate value of the transactions. We look only at assets not held in blind trusts since Senators do not report the holdings or transactions on any assets held in qualified blind trusts. The data have some serious limitations. First, although each report is personally signed and authenticated by the Senator, none of the FDRs are audited for accuracy by any government agency or organization outside the government. Therefore, we cannot verify the accuracy or completeness of these reports. Second, the care used to fill out these reports varies widely. Some are typed, some are handwritten, some include monthly financial statements from their brokerage firms, and some use abbreviations and terms that are impossible to decipher. Thus, extraction of the data was frequently difficult and despite our best efforts may have resulted in occasional errors. Third, the available data do not permit us to measure the magnitude of profits earned by individual Senators. Senators report the dollar volume of transactions only within broad ranges ($1,001 to $15,000, $15,001 to $50,000, $50,001 to $100,000, $100,001 to $250,000, $250,001 to $500,000, $500,001 to $1,000,000 and over $1,000,000). The broad ranges also present problems for trade-size-weighted analysis.
664 Journal of Financial and Quantitative Analysis
The database includes common stock transactions made by the Senators, their spouses, and their dependent children. The transactions have been recorded with the name of the Senator, the transaction date, and the approximate value of the transaction. Assets were matched by name with CUSIP numbers from the Center for Research in Security Prices (CRSP) databases.
Without knowing any details about the information the Senators may pos- sess, we cannot assume that abnormal returns would necessarily be seen within
days or even weeks of the stock purchase. Furthermore, the timing of abnor- mal performance is likely to vary across securities depending on the political and economic issues under discussion and the companies or industries affected. We therefore examine returns for a full calendar year (255 trading days) after the
acquisition or sale of the stock. Abnormal performance is measured using the calendar-time portfolio approach with the Fama-French three-factor model and CAPM as recommended by Mitchell and Stafford (2000).
Initially, we begin with 6,052 transactions. Before analysis we apply several screens to the data. Only U.S. common stocks are included in the study. These screens eliminate, among other things, all preferred stock, ADRs, REITs, foreign stocks, and mutual funds. We also eliminate all initial public offerings (IPOs) from the sample.2 In total, 360 observations are eliminated for the reasons given above. Among the surviving transactions, approximately 59% of the stocks are listed on the NYSE, 40% are traded on the NASDAQ, and about 1% are listed on the ASE.
After separating the transactions into purchases and sales, we begin by cal-
culating the cumulative abnormal return, CAR, for the buy sample and sell sample on each event-day from day -255 to day +255, where t -0 is the transaction day. First, daily average abnormal return for the sample transactions is calculated as
(1) ARZwi(Rit-Rmt),i=t
where N is the number of transactions in the sample (buy or sell), Rit is the return from sample transaction i on trading day t, Rmt is the return on the CRSP value-
weighted market index for trading day t, and wi is the trade weight of transaction i. As indicated previously, Senators report transaction amounts only within broad
ranges. We therefore estimate the value of their trades using the midpoint of the
range reported by the Senators for all transactions less than $250,000. For all transactions above $250,000, we assume a transaction size equal to $250,000. Next, we compute the cumulative abnormal returns (CAR) for day t as:
(la) CARt=ART,T=-255
where t ranges from day -255 to +255. Although we do not rely on the CARs as a basis for our main statistical inferences, they do provide an indication as to
2 IPOs were excluded because of the possibility that Senators were allocated these shares during the IPO process. Loughran and Ritter (1995) have shown that IPOs typically earn a high return on the first trading day but under-perform the market thereafter. Thus, though they may prove to be poor long-term investments, these losses are more than likely compensated for by the large first-day returns earned by many IPOs.
Ziobrowski, Cheng, Boyd, and Ziobrowski 665
whether the Senators' portfolio outperformed the market. We compute CARs for both the buy and sell samples.
The calendar-time portfolio method for detecting long-run abnormal returns was first used by Jaffe (1974) and Mandelker (1974) and is strongly recommended by Fama (1998). To briefly explain, for each calendar day a calendar-time port- folio is constructed including all those stocks that have an event date within the prior 255 days. The portfolio return is then calculated as
(2)
Rp,t=ci,tRi,tci,t,
where Rp,t is the portfolio return on day t and c i,t is the compound value of trans- action i from the event date to t - 1. For an equal-weighted portfolio, the initial value of transaction i is set at $1. To calculate the trade-weighted portfolio, we re- place the weight of $1 on the purchase date with the value of the trade. As before, we again estimate the value of their trades using the midpoint of the range re- ported by the Senators for all transactions less than $250,000. For all transactions above $250,000, we assume a transaction size equal to $250,000.
We obtain daily portfolio return series for four calendar-time portfolios: an equally-weighted portfolio of the buy transactions, a trade-size-weighted portfolio of the buy transactions, an equally-weighted portfolio of the sell transactions, and a trade-size-weighted portfolio of the sell transactions. The time span of these return series is from January 1, 1993 to December 31, 1998.
To draw statistical inferences, we compound daily returns to yield monthly returns. We then calculate portfolio excess returns by subtracting the risk-free rate from the monthly return series. We regress the portfolio excess return series on two models: the CAPM and the Fama-French three-factor model. The CAPM is shown in equation (3),
(3) Rpt-Rf,t=a-+/3i(Rm,t-Rf,t)+Ept,
where Rp,t is the monthly calendar-time portfolio return at month t, Rm,t is the monthly return on the CRSP value-weighted index at month t, Rf,t is the risk-free rate at month t, a., and /3i are the regression parameters, and E,t is the error term. The intercept, a, measures the average monthly abnormal return.
The Fama-French three-factor model is shown in equation (4),
(4) Rpt-Rf,t=a+/3i(Rm,t-Rf,t)+spSMBt+hpHMLt+Ep,t.
The regression parameters for the Fama-French model are a i, /3i, sp, and hp. The three factors 3i, sp, and hp are zero-investment portfolios representing the ex- cess return of the market (Rm - Rf), the difference between a portfolio of small stocks and a portfolio of big stocks (SMB), and the difference between a portfo- lio of high book-to-market stocks and a portfolio of low book-to-market stocks (HML), respectively. See Fama and French (1993) for details on the construc- tion of the factors. The intercept, ai (Fama-French alpha), again measures the average monthly abnormal return, given the model. Data on the Fama-French three-factor model (Rmt, SMB, and HML) are obtained from Ken French's Web
666 Journal of Financial and Quantitative Analysis
site (http://mba.tuck.dartmouth.edu/pages/faculty/ken.french/). Under our null
hypothesis that the Senators' portfolios do not exhibit significant abnormal re- turns, the regression intercept (ai) is non-distinguishable from zero for both mod- els. Rejecting this null hypothesis would indicate that there is a non-zero abnor- mal return associated with the Senators' portfolio.
III. Results
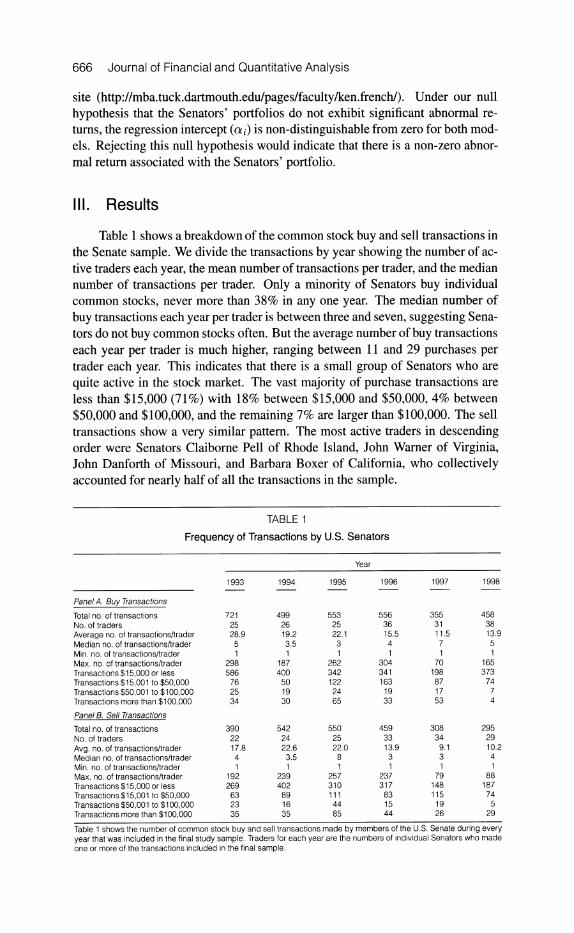
Table 1 shows a breakdown of the common stock buy and sell transactions in the Senate sample. We divide the transactions by year showing the number of ac- tive traders each year, the mean number of transactions per trader, and the median number of transactions per trader. Only a minority of Senators buy individual common stocks, never more than 38% in any one year. The median number of
buy transactions each year per trader is between three and seven, suggesting Sena- tors do not buy common stocks often. But the average number of buy transactions each year per trader is much higher, ranging between 11 and 29 purchases per trader each year. This indicates that there is a small group of Senators who are
quite active in the stock market. The vast majority of purchase transactions are less than $15,000 (71%) with 18% between $15,000 and $50,000, 4% between $50,000 and $100,000, and the remaining 7% are larger than $100,000. The sell transactions show a very similar pattern. The most active traders in descending order were Senators Claiborne Pell of Rhode Island, John Warner of Virginia, John Danforth of Missouri, and Barbara Boxer of California, who collectively accounted for nearly half of all the transactions in the sample.
TABLE 1
Frequency of Transactions by U.S. Senators
Year
1993 1994 1995 1996 1997 1998
Panel A. Buy Transactions
Total no. of transactions No. of traders Average no. of transactions/trader Median no. of transactions/trader Min. no. of transactions/trader Max. no. of transactions/trader Transactions $15,000 or less Transactions $15,001 to $50,000 Transactions $50,001 to $100,000 Transactions more than $100,000 Panel B. Sell Transactions
Total no. of transactions No. of traders Avg. no. of transactions/trader Median no. of transactions/trader Min. no. of transactions/trader Max. no. of transactions/trader Transactions $15,000 or less Transactions $15,001 to $50,000 Transactions $50,001 to $100,000 Transactions more than $100,000
721 499 553 556 355 458 25 26 28.9 5 1
298 586 76 25 34
19.2 3.5 1
187 400 50 19 30
25 22.1 3 1
262 342 122 24 65
36 31 38 15.5 11.5 13.9 4 7 5 1 1 1
304 341 163 19 33
70 198 87 17 53
165 373 74 7 4
390 542 550 459 308 295 22 24 25 33 34 29 17.8 22.6 22.0 13.9 9.1 10.2 4 3.5 8 3 3 4 1 1 1 1 1 1
192 239 257 237 79 88 269 402 310 317 148 187 63 89 111 83 115 74 23 16 44 15 19 5 35 35 85 44 26 29
Table 1 shows the number of common stock buy and sell transactions made by members of the U.S. Senate during every year that was included in the final study sample. Traders for each year are the numbers of individual Senators who made one or more of the transactions included in the final sample.

Ziobrowski, Cheng, Boyd, and Ziobrowski 667
Figure 1 presents graphs of the daily CARs for the samples of buy and sell transactions. For the 12 months prior to acquisition, common stocks purchased by Senators exhibit relatively small positive CARs (3.4%). After being acquired, the CARs increase to 28.6% during the next calendar year. The CARs for the sample of sell transactions are equally interesting. The CARs after sale by the Senators are nearly zero. However, prior to sale, we see another large run-up in the CARs
during the 12 months before the event-day (25.1%). These results clearly sup- port the notion that members of the Senate trade with a substantial informational
advantage over ordinary investors. The results suggest that Senators knew when to buy their common stocks and when to sell. Because of the well-documented statistical problems associated with the use of event-time abnormal returns, we do not formally test the statistical significance of the CARs. To formally test the
performance of stocks bought and sold, we rely on the calendar-time portfolio returns.
FIGURE 1
Daily Cumulative Abnormal Returns for Common Stocks Bought and Sold by U.S. Senators
0
Day
o z
o Day
Figure 1 depicts the cumulative abnormal returns (CARs) of the buy and sell transactions of U.S. Senators during the period 255 days prior to and after the event date (day 0 on the horizontal axis). To calculate the CAR, we use the expression, CARt = E 255 ART, where AR is the abnormal daily return on trading day t.
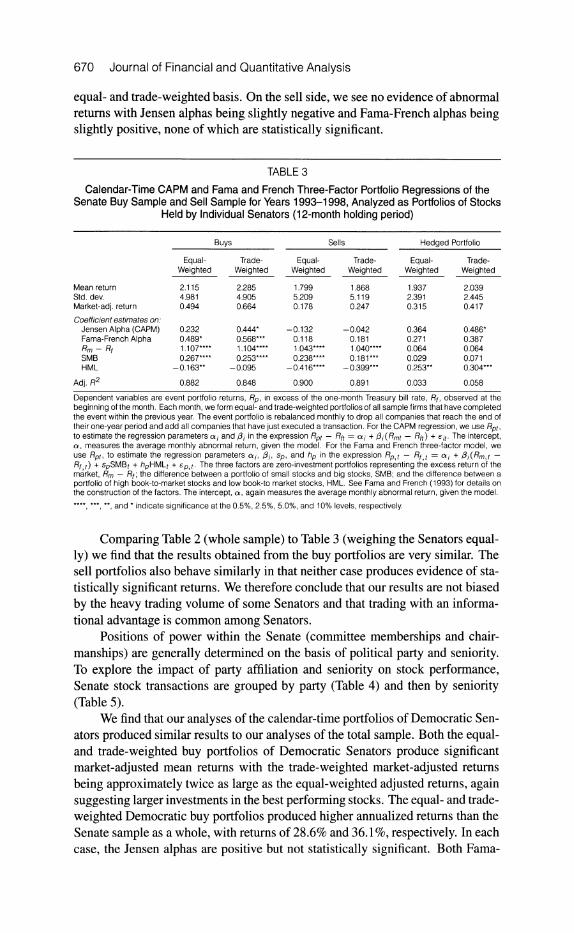
Table 2 shows the results of the calendar-time portfolio analysis for both the buy and the sell samples. Both the equal- and trade-weighted buy portfolios pro- duce positive mean market-adjusted returns. The mean annualized return for the equal-weighted Senate buy portfolio is 25.8% vs. 21.3% for the market portfolio. The mean annualized return for the trade-weighted Senate buy portfolio is 34.1%, suggesting that the Senators invested more money in the stocks that ultimately performed best.

668 Journal of Financial and Quantitative Analysis
TABLE 2 Calendar-Time CAPM and Fama-French Three-Factor Portfolio Regressions of the Senate
Buy Sample, Sell Sample, and a Hedged Portfolio for Years 1993-1998 (12-month holding period)
Buys Sells Hedged Portfolio
Equal- Trade- Equal- Trade- Equal- Trade- Weighted Weighted Weighted Weighted Weighted Weighted
Mean return 1.932 2.476 1.594 1.504 1.961 2.595 Std. dev. 4.748 6.354 5.233 5 800 1.883 3.620 Market-adj. return 0.311 0.854 -0.028 -0.118 0.339 0.973 Coefficient estimates on:
Jensen Alpha (CAPM) 0.115 0.508 -0.316 -0.336 0.432** 0.844** Fama-French Alpha 0.323** 0.849** -0.012 -0.196 0.334 1.045*** Rm - Rf 1.008**** 1.001**** 0.987**** 1.060**** 0.021 -0.059 SMB 0.296**** 0.342** 0.319**** 0.135 -0.023 0.207 HML -0.263**** -0.554**** -0.482**** -0.232 0.219*** -0.322**
Adj. R2 0.920 0.666 0.908 0.592
0.084 0.086
Dependent variables are event portfolio returns, Rp, in excess of the one-month Treasury bill rate, Rf, observed at the beginning of the month. Each month, we form equal- and trade-weighted portfolios of all sample firms that have completed the event within the previous year The event portfolio is rebalanced monthly to drop all companies that reach the end of their one-year period and add all companies that have just executed a transaction. For the CAPM regression, we use Rpt, to estimate the regression parameters a, and /i in the expression Rpt - Rft = ai + /3i(Rmt - Rft) + Eit. The intercept, a, measures the average monthly abnormal return, given the model. For the Fama and French three-factor model we use Rpt, to estimate the regression parameters ai, /,, sp, and hp in the expression Rp,t - Rf,t = ai + 3i(Rm,t -
Rf,t) + spSMBt + hpHMLt + ep,t. The three factors are zero-investment portfolios representing the excess return of the market, Rm - Rf; the difference between a portfolio of small stocks and big stocks, SMB; and the difference between a portfolio of high book-to-market stocks and low book-to market stocks, HML. See Fama and French (1993) for details on the construction of the factors. The intercept, a, again measures the average monthly abnormal return, given the model.
****, ***, **, and * indicate significance at the 0.5%, 2.5%, 5.0%, and 10% levels, respectively
Regressing the two buy portfolios on the market risk premium alone (CAPM), the Jensen alpha is positive although not statistically significant in either case. However, when we regress the buy portfolios on the Fama-French three-factor model, the Fama-French alphas are both positive and statistically significant in each case, indicating a substantial informational advantage. The Fama-French al- pha was much higher for the trade-weighted buy portfolio supporting our earlier contention that Senators tend to invest more funds in the better performing stocks. In looking at the other coefficients generated by the Fama-French regressions, we find that the beta coefficients for both buy portfolios are relatively close to one, suggesting that the Senators tilted toward stocks with average market risk. Coeffi- cients associated with the size factor, SMB, are positive and statistically different from zero, suggesting that Senators favored smaller companies. Coefficients asso- ciated with the value/growth factor, HML, are negative and significantly different from zero indicating that Senators also favored growth stocks with low book-to- market value ratios.
The market-adjusted returns are negative for both the equal- and trade-
weighted sell portfolios. Although the Jensen alphas and Fama-French alphas are negative for these portfolios, neither is significantly different from zero. As with the buy portfolios, the results suggest that Senators tended to sell stocks of smaller companies with average market risk and higher book-to-market value ratios.
To combine the effects of the buy transactions with the sell transactions, we
analyze a hedged portfolio in which we hold the purchase transactions long and short the sell transactions. The results of this analysis are also presented in Ta-

Ziobrowski, Cheng, Boyd, and Ziobrowski 669
ble 2. The Jensen alphas are positive and statistically significant for both the
equal- and trade-weighted portfolios. The Fama-French alphas are positive for both the equal- and trade-weighted portfolios but statistically significant only in the case of the trade-weighted portfolio. These results indicate substantial infor- mational advantage. Again the trade-weighted alphas are much higher suggesting that Senators invested much more heavily in the most profitable transactions. As we would expect for a hedged portfolio, the beta coefficient is not significantly different from zero indicating little market risk. Coefficients associated with the size factor, SMB, are not significantly different from zero indicating that the Sen- ators' buy transactions and sell transactions involve similarly sized firms. The coefficient associated with the value/growth factor, HML, is positive and statis-
tically significant on an equal-weighted basis suggesting Senators' buys involve more growth firms than their sells. The negative and statistically significant HML coefficient in the trade-weighted regression indicates that on a value-weighted basis, Senators invest more money in value stocks than they sell.
Taken collectively, the results of these analyses are economically very sig- nificant. Barber and Odean (2000) measured common stock returns for 66,465 randomly selected households in the U.S. from 1991 to 1996 and found that the
average household underperformed the market by approximately 12 basis points per month. Jeng, Metrick, and Zeckhauser (2001) examined the returns to corpo- rate insiders when they traded shares of their respective company's common stock
during the period 1975 to 1996 and found that insiders earned an economically significant positive abnormal return of 50 basis points per month. In comparison, we find that members of the U.S. Senate outperformed the market by almost 100 basis points per month. Although some of the abnormal returns measured for the Senate portfolios are not statistically significant, we are somewhat hampered by the short time-series of monthly returns, which invariably lowers the power of our statistical tests.3 Nonetheless, the economic returns earned by the Senators are extraordinarily large.
Because a few Senators purchased a disproportionately large number of stocks, it is necessary to address concerns that a few high volume traders might seriously bias our results. To do this, we calculate a calendar-time portfolio for each Senator and then we average the returns across Senators on each calendar day. Analyzing the data in this fashion gives each Senator's calendar-time portfo- lio equal weight in the analysis. Assuming only a few high volume traders were responsible for the abnormal returns found in the full sample, the abnormal re- turns should disappear with this analysis. On the other hand, the persistence of positive statistically significant abnormal returns would suggest that trading with an informational advantage is reasonably widespread among Senators who trade.
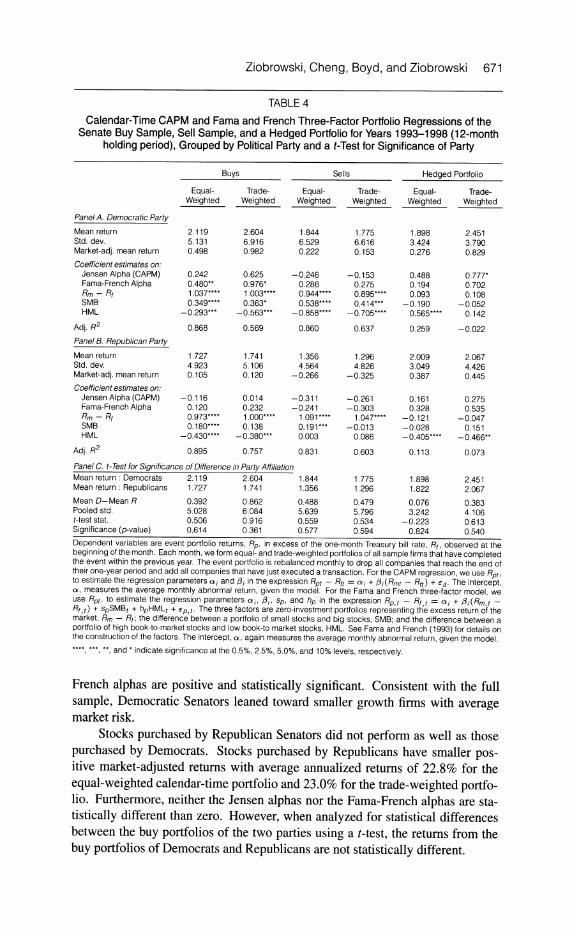
Table 3 presents the results of this analysis. When we equally weight the returns of each Senator, the buy portfolio earns a compound annual rate of 28.6% on an equal-weighted basis and 31.1% on a trade-weighted basis compared to 21.3% for the market. Both Jensen alphas for the buy portfolio are positive, but only the trade-weighted Jensen alpha is statistically significant. The Fama-French
alphas for the buy portfolio are positive and statistically significant on both an
3 Financial Disclosure Forms of the Senators are only retained six years by law. After six years, they are destroyed.
670 Journal of Financial and Quantitative Analysis
equal- and trade-weighted basis. On the sell side, we see no evidence of abnormal returns with Jensen alphas being slightly negative and Fama-French alphas being slightly positive, none of which are statistically significant.
TABLE 3
Calendar-Time CAPM and Fama and French Three-Factor Portfolio Regressions of the Senate Buy Sample and Sell Sample for Years 1993-1998, Analyzed as Portfolios of Stocks
Held by Individual Senators (12-month holding period)
Buys Sells Hedged Portfolio
Equal- Trade- Equal- Trade- Equal- Trade- Weighted Weighted Weighted Weighted Weighted Weighted
Mean return 2.115 2.285 1.799 1.868 1.937 2.039 Std. dev. 4.981 4.905 5.209 5.119 2.391 2.445 Market-adj. return 0.494 0.664 0.178 0.247 0.315 0.417 Coefficient estimates on:
Jensen Alpha (CAPM) 0.232 0.444* -0.132 -0.042 0.364 0.486* Fama-French Alpha 0.489* 0.568*** 0.118 0.181 0.271 0.387 Rm - Rf 1.107**** 1.104**** 1.043**** 1.040**** 0.064 0.064 SMB 0.267**** 0.253**** 0.238**** 0.181*** 0.029 0.071 HML -0.163** -0.095 -0.416**** -0.399*** 0.253** 0.304***
Adj. R2 0.882 0.848 0.900 0.891 0.033 0.058
Dependent variables are event portfolio returns, Rp, in excess of the one-month Treasury bill rate, Rf, observed at the beginning of the month. Each month, we form equal- and trade-weighted portfolios of all sample firms that have completed the event within the previous year. The event portfolio is rebalanced monthly to drop all companies that reach the end of their one-year period and add all companies that have just executed a transaction. For the CAPM regression, we use Rpt, to estimate the regression parameters , and 3i in the expression Rpt - Rft = oai + 3i(Rmt - Rft) + Eit. The intercept, a, measures the average monthly abnormal return, given the model. For the Fama and French three-factor model, we use Rpt, to estimate the regression parameters A,, 3i, sp, and hp in the expression Rp,t - Rf,t = a + 8i(Rm,t - Rf,t) + spSMBt + hpHMLt + 6p,t. The three factors are zero-investment portfolios representing the excess return of the market, Rm - Rf; the difference between a portfolio of small stocks and big stocks, SMB; and the difference between a portfolio of high book-to-market stocks and low book-to market stocks, HML. See Fama and French (1993) for details on the construction of the factors. The intercept, a, again measures the average monthly abnormal return, given the model. ****, ***, **, and * indicate significance at the 0.5%, 2.5%, 5.0%, and 10% levels, respectively
Comparing Table 2 (whole sample) to Table 3 (weighing the Senators equal- ly) we find that the results obtained from the buy portfolios are very similar. The sell portfolios also behave similarly in that neither case produces evidence of sta-
tistically significant returns. We therefore conclude that our results are not biased
by the heavy trading volume of some Senators and that trading with an informa- tional advantage is common among Senators.
Positions of power within the Senate (committee memberships and chair-
manships) are generally determined on the basis of political party and seniority. To explore the impact of party affiliation and seniority on stock performance, Senate stock transactions are grouped by party (Table 4) and then by seniority (Table 5).
We find that our analyses of the calendar-time portfolios of Democratic Sen- ators produced similar results to our analyses of the total sample. Both the equal- and trade-weighted buy portfolios of Democratic Senators produce significant market-adjusted mean returns with the trade-weighted market-adjusted returns
being approximately twice as large as the equal-weighted adjusted returns, again suggesting larger investments in the best performing stocks. The equal- and trade-
weighted Democratic buy portfolios produced higher annualized returns than the Senate sample as a whole, with returns of 28.6% and 36.1%, respectively. In each case, the Jensen alphas are positive but not statistically significant. Both Fama-
Ziobrowski, Cheng, Boyd, and Ziobrowski 671
TABLE 4 Calendar-Time CAPM and Fama and French Three-Factor Portfolio Regressions of the
Senate Buy Sample, Sell Sample, and a Hedged Portfolio for Years 1993-1998 (12-month holding period), Grouped by Political Party and a t-Test for Significance of Party
Buys Sells Hedged Portfolio
Equal- Trade- Equal- Trade- Equal- Trade- Weighted Weighted Weighted Weighted Weighted Weighted
Panel A. Democratic Party Mean return 2.119 2.604 1.844 1.775 1.898 2.451 Std. dev. 5.131 6.916 6.529 6.616 3.424 3.790 Market-adj. mean return 0.498 0.982 0.222 0.153 0.276 0.829 Coefficient estimates on:
Jensen Alpha (CAPM) 0.242 0.625 -0.246 -0.153 0.488 0.777* Fama-French Alpha 0.480** 0.976* 0.286 0.275 0.194 0.702 Rm - Rf 1.037**** 1.003**** 0.944**** 0.895**** 0.093 0.108 SMB 0.349**** 0.363* 0.538**** 0.414*** -0.190 -0.052 HML -0.293*** -0.563*** -0.858**** -0.705**** 0.565**** 0.142
Adj. R2 0.868 0.569 0.860 0.637 0.259 -0.022 Panel B. Republican Party Mean return 1.727 1.741 1.356 1.296 2.009 2.067 Std. dev. 4.923 5.106 4.564 4.826 3.049 4.426 Market-adj. mean return 0.105 0.120 -0.266 -0.325 0.387 0.445 Coefficient estimates on:
Jensen Alpha (CAPM) -0.116 0.014 -0.311 -0.261 0.161 0.275 Fama-French Alpha 0.120 0.232 -0.241 -0.303 0.328 0.535 Rm - Rf 0.973**** 1.000**** 1.091*** 1.047**** -0.121 -0.047 SMB 0.180**** 0.138 0.191"** -0.013 -0.028 0.151 HML -0.430**** -0.380*** 0.003 0.086 -0.405**** -0.466**
Adj. R2 0.895 0.757 0.831 0.603 0.113 0.073
Panel C. t-Test for Significance of Difference in Party Affiliation Mean return: Democrats 2.119 2.604 1.844 1.775 1.898 2.451 Mean return: Republicans 1.727 1.741 1.356 1.296 1.822 2.067 Mean D- Mean R 0.392 0.862 0.488 0.479 0.076 0.383 Pooled std. 5.028 6.084 5.639 5.796 3.242 4.106 t-test stat. 0.506 0.916 0.559 0.534 -0.223 0.613 Significance (p-value) 0.614 0.361 0.577 0.594 0.824 0.540 Dependent variables are event portfolio returns, Rp, in excess of the one-month Treasury bill rate, Rf, observed at the beginning of the month. Each month, we form equal- and trade-weighted portfolios of all sample firms that have completed the event within the previous year The event portfolio is rebalanced monthly to drop all companies that reach the end of their one-year period and add all companies that have just executed a transaction. For the CAPM regression, we use Rpt, to estimate the regression parameters ai and Oi in the expression Rpt - Rft = ai + /3i(Rmt - Rft) + eit. The intercept, a, measures the average monthly abnormal return, given the model. For the Fama and French three-factor model, we use Rpt, to estimate the regression parameters ai, 3i, sp, and hp in the expression Rp, t - Rf, t = a i + i(Rm,t - Rf,t) + spSMBt + hpHMLt + ep,t. The three factors are zero-investment portfolios representing the excess return of the market, Rm - Rf; the difference between a portfolio of small stocks and big stocks, SMB; and the difference between a portfolio of high book-to-market stocks and low book-to market stocks, HML. See Fama and French (1993) for details on the construction of the factors. The intercept, a, again measures the average monthly abnormal return, given the model. ****, ***, **, and * indicate significance at the 0.5%, 2.5%, 5.0%, and 10% levels, respectively.
French alphas are positive and statistically significant. Consistent with the full sample, Democratic Senators leaned toward smaller growth firms with average market risk.
Stocks purchased by Republican Senators did not perform as well as those purchased by Democrats. Stocks purchased by Republicans have smaller pos- itive market-adjusted returns with average annualized returns of 22.8% for the equal-weighted calendar-time portfolio and 23.0% for the trade-weighted portfo- lio. Furthermore, neither the Jensen alphas nor the Fama-French alphas are sta- tistically different than zero. However, when analyzed for statistical differences between the buy portfolios of the two parties using a t-test, the returns from the buy portfolios of Democrats and Republicans are not statistically different.

672 Journal of Financial and Quantitative Analysis
Analyses of the Democratic sell portfolios indicate no abnormal returns after sale. The equal-weighted Democratic sell portfolio yields a raw mean average annual return of 24.5% with a small positive market-adjusted mean return. The
trade-weighted Democratic sell portfolio yields a mean average annual return of 23.5%. For both Democratic sell portfolios, the regression analyses calculate a
negative Jensen alpha and a positive Fama-French alpha with none of the alphas being significantly different from zero.
Common stocks sold by Republican Senators underperformed the market
during the calendar year after sale. The mean annual return is 17.5% for the equal- weighted Republican sell portfolio and 16.7% for the trade-weighted Republican sell portfolio. The lower return for the trade-weighted portfolio suggests that Re-
publican Senators sold off a higher volume of those stocks that would do worst
TABLE 5
Calendar-Time CAPM and Fama and French Three-Factor Portfolio Regressions of the Senate Buy Sample, Sell Sample, and Hedged Portfolio for Years 1993-1998 (12-month
holding period), Grouped by Seniority, and a Nested Test for Significance of Seniority
Buys Sells Hedged Portfolio
Equal- Trade- Equal- Trade- Equal- Trade- Weighted Weighted Weighted Weighted Weighted Weighted
Panel A. Seniority Less Than 7 Years
Mean return Std. dev. Market-adj. mean return
Coefficient estimates on: Jensen Alpha (CAPM) Fama-French Alpha Rm - Rf SMB HML
Adj. R2
Panel B Seniority between 7 and 16 Years
Mean return Std. dev. Market-adj. mean return
Coefficient estimates on. Jensen Alpha (CAPM) Fama-French Alpha Rm - Rf SMB HML
Adj. R2
Panel C. Seniority More Than 16 Years
Mean return Std. dev. Market-adj. mean return
Coefficient estimates on: Jensen Alpha (CAPM) Fama-French Alpha Rm - Rf SMB HML
Adj. R2
1.911 2.581 1.359 0.861 2.175 3.343
5.066 6.034 5.640 5.660 3.132 5.793 0.290 0.960 -0.263 -0.761 0.553 1.721
0.071 0.712 -0.586* -0.775 0.657* 1.487*** 0.323 0.991*** -0.342 -0.818* 0.665* 1.808***
0.970**** 0.968**** 1.038**** 1.004**** -0.068 -0.036
0.255*** 0.262* 0.147 -0.229 0.108 0.491* -0.408**** -0.467*** -0.478**** -0.086 0.070 -0.381
0.870 0.624 0.772 0.450 -0.017 0.104
2.049 1.817 1.347 1.086 2.341 2.366 4.806 5.641 4.996 5.108 2.703 3.394 0.427 0.196 -0.275 -0.535 0.719 0.744
0.197 0.041 -0.347 -0.506 0.559* 0.561 0.306 0.062 -0.112 -0.493 0.476 0.587 1.096**** 1.038**** 0.988**** 1.003**** 0.113 0.038 0.105 -0.286* 0.273*** -0.120 -0.136 -0.149
-0.180*** -0.290* -0.304*** -0.133 0.073 -0.186
0.885 0.580 0.769 0.575 0.008 -0.002
2.023 2.209 1.879 2.050 1.768 1.776 4.860 6.734 5.372 7.620 2.526 4.194 0.402 0.587 0.258 0.428 0.146 0.154
0.289 0.297 0.114 0.163 0.170 0.130 0.534** 0.644 0.447 0.649 0.128 0.059 0.922**** 0.996**** 1.012**** 1.026**** -0.086 -0.024 0.383**** 0.548**** 0.476**** 0.670 -0.071 -0.087
-0.282**** -0.396* -0353**** -0.540**** 0.036 0.088
0.815 0.570 0.795 0.507 0.005 -0.025
(continued on next page)
Ziobrowski, Cheng, Boyd, and Ziobrowski 673
TABLE 5 (continued) Calendar-Time CAPM and Fama and French Three-Factor Portfolio Regressions of the Senate Buy Sample, Sell Sample, and Hedged Portfolio for Years 1993-1998 (12-month
holding period), Grouped by Seniority, and a Nested Test for Significance of Seniority
Panel D. t-Test for Significance of Difference in Seniority
Buys Sells Hedged Portfolio
Equal- Trade- Equal- Trade- Equal- Trade- Weighted Weighted Weighted Weighted Weighted Weighted
Mean return- seniority < 7 years (G1) 1.911 2.581 1.359 0.861 2.175 3.343 Mean return-seniority 7-16 years (G2) 2.049 1.817 1.347 1.086 2.341 2.366 Mean return-seniority > 16 years (G3) 2.023 2.209 1.879 2.050 1.768 1.776
Mean return G1 -mean return G2 -0.138 0.764 0.012 -0.226 -0.166 0.976 Pooled std. 4.938 5.841 5.330 5.393 2.925 4.748 ttest stat. -0.181 0.848 0.015 -0.270 -0.367 1.333 Significance (p-value) 0.857 0.398 0.988 0.787 0.714 0.184
Mean return G2-mean return G3 0.026 -0.391 -0.533 -0.963 0.572 0.590 Pooled std. 4.833 6.211 5.188 6.487 2.616 3.815 t-test stat. 0.035 -0.408 -0.662 -0.957 1.368 0.952 Significance (p-value) 0.972 0.684 0.509 0.340 0.173 0.342
Mean return G1-mean return G3 -0.112 0.372 -0.521 -1.189 0.407 1.567 Pooled std. 4.964 6.393 5.509 6.706 2.845 5.057 t-test stat. -0.146 0.378 -0.611 -1.145 0.880 1.970 Significance (p-value) 0.884 0.706 0.542 0.254 0.380 0.051*
Dependent variables are event portfolio returns, Rp, in excess of the one-month Treasury bill rate, Rf, observed at the beginning of the month. Each month, we form equal- and trade-weighted portfolios of all sample firms that have completed the event within the previous year. The event portfolio is rebalanced monthly to drop all companies that reach the end of their one-year period and add all companies that have just executed a transaction. For the CAPM regression, we use Rpt, to estimate the regression parameters a, and Oi in the expression Rpt - Rft = r, + 3i(Rmt - Rft) + cit. The intercept, a, measures the average monthly abnormal return, given the model. For the Fama and French three-factor model, we use Rpt, to estimate the regression parameters aic i, sp, and hp in the expression Rp,t - Rf,t = ci, + i(Rm,t -
Rf,t) + spSMBt + hpHMLt + ep,t. The three factors are zero-investment portfolios representing the excess return of the market, Rm - Rf; the difference between a portfolio of small stocks and big stocks, SMB; and the difference between a portfolio of high book-to-market stocks and low book-to market stocks, HML. See Fama and French (1993) for details on the construction of the factors. The intercept, a, again measures the average monthly abnormal return, given the model. ****, ***, **, and * indicate significance at the 0.5%, 2.5%, 5.0%, and 10% levels, respectively.
in the coming year. The Jensen alphas and Fama-French alphas are negative for both Republican sell portfolios although neither is statistically significant. The regression coefficients suggest that the stocks Republicans sold were firms with average market risk, average size, and average book-to-market value. As with the party buy portfolios, when comparing the mean returns for the respective party sell portfolios in a t-test, we find no statistically significant differences between the two political parties.
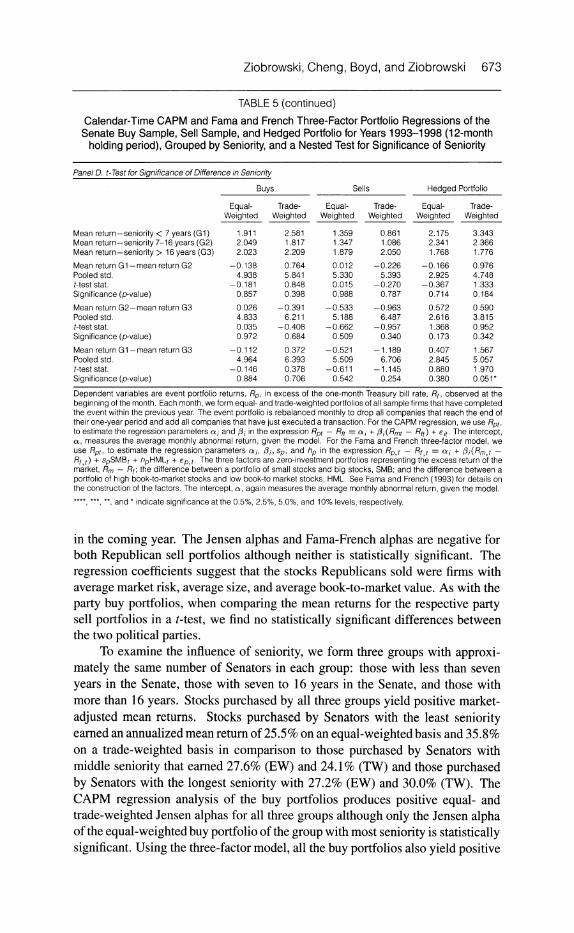
To examine the influence of seniority, we form three groups with approxi- mately the same number of Senators in each group: those with less than seven years in the Senate, those with seven to 16 years in the Senate, and those with more than 16 years. Stocks purchased by all three groups yield positive market- adjusted mean returns. Stocks purchased by Senators with the least seniority earned an annualized mean return of 25.5% on an equal-weighted basis and 35.8% on a trade-weighted basis in comparison to those purchased by Senators with middle seniority that earned 27.6% (EW) and 24.1% (TW) and those purchased by Senators with the longest seniority with 27.2% (EW) and 30.0% (TW). The CAPM regression analysis of the buy portfolios produces positive equal- and trade-weighted Jensen alphas for all three groups although only the Jensen alpha of the equal-weighted buy portfolio of the group with most seniority is statistically significant. Using the three-factor model, all the buy portfolios also yield positive
674 Journal of Financial and Quantitative Analysis
Fama-French alphas. The Fama-French alpha is only statistically significant for the trade-weighted buy portfolio of Senators with the least seniority. Comparison of the mean returns from the buy portfolios of the three seniority groups with a t-test shows no statistical differences between the groups.
Regression analyses of the sell portfolios for Senators with the least seniority and Senators with middle seniority produce all negative Jensen and Fama-French alphas, although only the sell portfolios of Senators with the least seniority pro- duce statistically significant alphas. The equal-weighted sell portfolio of Senators with the least seniority yields a statistically significant negative Jensen alpha and their trade-weighted sell portfolio yields a significant negative Fama-French al- pha. Analyses of the sell portfolios of Senators with the most seniority produce positive market-adjusted mean returns and positive alphas, none of which are sta- tistically significant. Again, a t-test reveals no significant differences among the mean returns of the sell portfolios for the three groups.
Combining the buy transactions with the sell transactions in hedged portfo- lios, we find that the hedged portfolios of Senators with the least seniority sub- stantially outperform the other two seniority groups. For Senators with the least seniority, the Jensen alphas and Fama-French alphas are positive and statistically significant when transactions are both equal- and trade-weighted. The Jensen al- phas and Fama-French alphas are also all positive for the middle seniority group, but only the Jensen alpha for the equal-weighted portfolio is statistically signif- icant. The hedged portfolios of Senators with the most seniority exhibit small positive Jensen and Fama-French alphas, none of which are significant. We also find that the mean return of the hedged trade-weighted portfolio of Senators with the least seniority is statistically higher than the mean return of the hedged trade- weighted portfolio of Senators with the most seniority.
As a final analysis, we divide the sample by years and measure cumulative abnormal returns on an annual basis. We find that, during the years 1993 through 1996, the pattern of cumulative abnormal returns for both the buy and the sell samples looks remarkably similar to the sample as a whole. In these four years, the buy samples all show moderate to low positive CARs prior to purchase fol- lowed by a strong positive surge after the event date. In 1993, 1994, 1995, and 1996, the daily CARs for the buy samples rise 39.6%, 21.6%, 43.6%, and 42.4%, respectively, during the 12 calendar months after acquisition on a trade-weighted basis. Sale samples from this same time period also behave consistently with the combined sell sample. For 1993 though 1996, we find a consistent pattern of very strong positive daily CARs in the year preceding the sale that peak just prior to sale. There were no abnormal returns after stocks were sold during these four
years. However in 1997 and 1998, we see very different results. In both of these
years, we find little evidence of abnormal returns for either the buy samples or the sell samples, suggesting that something dramatic occurred between 1996 and 1997 that curtailed the Senators' normal trading habits. We also observe that trading activity slowed considerably during these two years with Senatorial stock purchases falling 36% from 1996 to 1997 and sales falling 33% during the same period. The retirement of and failure to re-elect some Senators who were high volume traders (e.g., Senator Pell retired at the end of 1996) could have caused

Ziobrowski, Cheng, Boyd, and Ziobrowski 675
the sudden drop in trading activity in 1997. The sudden change in trading habits is more difficult to explain since we find no changes in the law that would likely cause such a reaction. Besides changes in the law, other explanations seem plau- sible. For example, Boller's (1995) work received considerable publicity in the print media and on television. Boller may have created some concern among Senators that researchers were actively investigating their trading activities.
IV. Conclusions
Members of the U.S. Senate have obvious access to valuable information by virtue of their government position and social contacts. Our goal in this research is to determine if the Senators' investments tend to outperform the overall market, which would support the notion that Senators use their informational advantage for personal gain as suggested by public choice theory. We test whether common stocks purchased and sold by U.S. Senators exhibit abnormal returns.
Cumulative abnormal returns for the portfolio of stocks bought by Senators are near zero for the calendar year prior to the date of purchase. After acquisition, the cumulative abnormal return rises over 25% within one calendar year after the purchase date. The cumulative abnormal returns for the portfolio of stocks sold by the Senators are near zero for the calendar year after the date of sale. However, these same stocks saw a cumulative abnormal positive return of 25% during the year immediately preceding the event date. These results suggest that Senators knew appropriate times to both buy and sell their common stocks.
Regressing the calendar-time portfolio returns of the entire sample on the Fama-French three-factor model, we find that stocks purchased by U.S. Senators earn statistically significant positive abnormal returns outperforming the market by 85 basis points per month on a trade-weighted basis as a further indication that Senators use their informational advantage. That Senators use an informational advantage is additionally evidenced by the fact that the trade-weighted portfolio of purchased stocks outperforms the equal-weighted portfolio suggesting that Sen- ators made much heavier investments in those stocks that ultimately performed best. After being sold by Senators, stocks underperform the market by 12 basis points per month on a trade-weighted basis although the abnormal returns after sale are not statistically significant. Combining the buy transactions with the sell transactions in a hedged portfolio we find that Senators outperform the market by 97 basis points (nearly 1%) per month on a trade-weighted basis. Abnormal returns from the hedged portfolio are statistically significant when we use either the CAPM or the Fama-French three-factor model. Regression coefficients of the Fama-French three-factor model suggest that Senators favor the common stocks of smaller growth firms with average market risk.
We find no reliable differences between the returns earned by Democrats and Republicans but seniority appears to be important. Senators with the least seniority (in their first Senatorial term) earn statistically higher returns than those Senators with the longest seniority (over 16 years in the Senate).
When we examine the trades on an annual basis, the return patterns of com- mon stocks bought and sold by Senators for years 1993 through 1996 appear very

676 Journal of Financial and Quantitative Analysis
similar to the patterns observed for the entire sample. However, in 1997 and 1998, we find significantly reduced trading volume and no evidence of abnormal returns.
It should be noted that these results should not be used to infer illegal activity. Current law does not prohibit Senators from trading stock on the basis of infor- mation acquired in the course of performing their normal Senatorial functions. Nor can we speculate on the magnitude of profits earned on these transactions because of limitations in the data. However, it seems clear that Senators have demonstrated a definite informational advantage over other investors although the specific source(s) and nature of that information remain unknown.
Until now, the primary focus of ethical concern with respect to legislative activity has been on campaign finance reform. Some Senators, most notably John McCain of Arizona, have expressed a strong belief that the methods currently used to fund political campaigns inherently cause agency problems. However, our results suggest that the problems may extend beyond campaign financing. Political power confers many benefits. Among those benefits are privileged ac- cess to information, the power to influence legislation, and the power to influence the application of regulatory jurisdiction by administrative agencies. It makes sense that politicians would use such powers for personal gain and also that they compete for any rents that arise from such influence. Our results are consistent with the hypothesis that such rents exist.
The results of this study warrant further investigation. Senate committees can be studied for abnormal returns and examined to determine if Senators serving on committees disproportionately invest in companies under their committee's juris- diction. Membership on certain key committees may provide Senators with better investment opportunities than other committees. Connections between campaign contributions and common stock transactions also seem like fertile ground for fur- ther study. We recommend that the financial transactions of members of the U.S. House of Representatives, high-ranking officials of the Federal executive branch, and Federal judges should all be examined and tested in future research.
References Barber, B. M., and T. Odean. "Trading is Hazardous to Your Wealth: The Common Stock Investment
Performance of Individual Investors." Journal of Finance, 55 (2000), 773-806. Boiler, G. "Taking Stock in Congress," by Joy Ward, Mother Jones (Sept./Oct. 1995). Buchanan, J. M., and R. Tollison. Theory of Public Choice II, Univ. of Michigan Press (1984). Dallek, R. Lone Star Rising. New York, NY: Oxford Univ. Press (1991). Fama, E. F. "Market Efficiency, Long-Term Returns and Behavioral Finance." Journal of Financial
Economics, 49 (1998), 283-306. Fama, E. F., and K. R. French. "Common Risk Factors in Returns on Stocks and Bonds." Journal of
Financial Economics, 33 (1993), 3-56. Jaffe, J. F. "Special Information and Insider Trading." Journal of Business, 47 (1974), 410-428. Jeng, L. A.; A. Metrick; and R. Zeckhauser. "Estimating Returns to Insider Trading: A Performance
Perspective." Working Paper, Boston Univ. (2001). Loughran, T., and J. R. Ritter. "The New Issues Puzzle." Journal of Finance, 50 (1995), 23-51. Mandelker, G. "Risk and Return: The Case of Merging Firms." Journal of Financial Economics, 1
(1974), 303-335. Mitchell, M. L., and E. Stafford. "Managerial Decisions and Long-Term Stock Price Performance."
Journal of Business, 73 (2000), 287-320. U.S. Senate Ethics Manual, http://ethics.senate.gov/downloads/pdffiles/manual.pdf (2003).

OB-KK157_StaffD_G_20101010213030.jpg (JPEG Image, 959x1029 pi... http://si.wsj.net/public/resources/images/OB-KK157_StaffD_G_201010...
1 of 1 1/4/2012 10:50 AM

See a sample reprint in PDF format. Order a reprint of this article now
BUSINESS OCTOBER 11, 2010
Washington Trades
Five congressional aides who bought or sold
shares in companies overseen by the staffers'
bosses.
The New Age of Insider Information onWall Street:
The Mole: Wired on Wall Street: Trader Betrays
By BRODY MULLINS, TOM MCGINTY and JASON ZWEIG
WASHINGTON—Chris Miller nearly doubled his $3,500 stock investment in a renewable-energy firm in 2008. It was a perfectly legal bet, but
he's no ordinary investor.
Mr. Miller is the top energy-policy adviser to Nevada Democrat and Senate Majority Leader Harry Reid, who helped pass legislation that wound
up benefiting the firm.
Jim Manley, a spokesman for Mr. Reid's office, initially defended Mr. Miller's purchase of shares
in the company, Energy Conversion Devices Inc. He said the aide had no influence over tax
incentives for renewable-energy firms, and that other factors boosted the stock.
But on Sunday, Mr. Manley added: "Mr. Miller showed poor judgment and Senator Reid has
made it very clear to Chris and all his staff that their actions must not only follow the law, but
must meet the higher standards the public has a right to expect from elected officials and their
staffs."
Mr. Miller isn't the only Congressional staffer making such stock bets. At least 72 aides on both
sides of the aisle traded shares of companies that their bosses help oversee, according to a Wall
Street Journal analysis of more than 3,000 disclosure forms covering trading activity by Capitol
Hill staffers for 2008 and 2009.
The Journal analysis showed that an aide to a Republican member of the Senate Banking
Committee bought Bank of America Corp. stock before results of last year's government stress
tests eased investor concerns about the health of the banking industry. A top aide to the House
Speaker profited by trading shares of Freddie Mac and Fannie Mae in a brokerage account with
her husband two days before the government authorized emergency funding for the companies.
Another aide to Republican lawmakers interested in energy issues, among other things, profited
by trading in several renewable-energy firms.
The aides identified by the Journal say they didn't profit by making trades based on any
information gathered in the halls of Congress. Even if they had done so, it would be legal,
because insider-trading laws don't apply to Congress.
A few lawmakers proposed a bill that would prevent members and employees of Congress from
trading securities based on nonpublic information they obtain. The legislation has languished
since 2006.
"Congressional staff are often privy to inside information, and an unscrupulous person could
profit off that knowledge," says Vincent Morris, a spokesman for Rep. Louise Slaughter (D.,
N.Y.), a leading backer of the "Stop Trading on Congressional Knowledge Act," or STOCK Act.
"The public should be outraged there is no law specifically banning this."
When the bill was introduced nearly five years ago, just 14 other lawmakers endorsed it. The
current version of the bill has fared worse: Only nine lawmakers support it. There is no
companion legislation in the Senate.
Congressional aides have ringside seats on the making of laws that affect American business.
Receiving salaries up to roughly $170,000 a year, they can glean information about policies and
government action before the public. They have access to information about hearings or
legislation that can move stocks and markets.
The current Congressional disclosure rules on stock trading stem from a scandal involving
Robert Baker, a senior Senate aide, in the early 1960s. Mr. Baker was accused of using his Senate
office for personal gain, partly involving the operation of a network of vending machines. He was
Dow Jones Reprints: This copy is for your personal, non-commercial use only. To order presentation-ready copies for distribution to your colleagues, clients or customers, use the Order Reprints tool at thebottom of any article or visit www.djreprints.com
Congressional Staffers Gain From Trading in Stocks
Congressional Staffers Gain From Trading in Stocks - WSJ.com http://online.wsj.com/article/SB10001424052748703431604575522434...
1 of 4 1/4/2012 10:50 AM

a Friend, Jan. 16, 2010
Swap Talk: Trader's 'Nice Little Kiss' Tests
Reach of Regulators, Mar. 31, 2010
The Pits: Wild Trading in Metals Puts Fund
Manager in Cross Hairs, Aug. 20, 2010
Debt Clash: Bankruptcy Court Is Latest
Battleground for Traders, Sept. 7, 2010
Congressional Trading:
The Intelligent Investor: A Perk of Power:
Trading in Companies You Oversee, Apr. 10,
2010
Lawmakers Bet on Stock Falls: Private Trades
Occurred as Congress Criticized Wall Street for
Risky Moves, May 4, 2010
Lawmaker Aims to Outlaw Insider Trading on
the Hill .Oct. 12, 2010
ZUMApress.com
The aides identified by the Journal say they didn'
profit by making trades based on any information
gathered in the halls of Congress.
eventually convicted of income-tax evasion and spent 16 months in prison.
The scandal led to a Senate rule in 1968 that required lawmakers and aides to disclose
information about their finances. The House of Representatives imposed similar requirements
about the same time.
The rules require all members of Congress and about 2,900 of the highest-paid congressional
aides to disclose information once a year on their finances, such as their assets, debts, spouse's
employment and other sources of income they earn, including capital gains from trading
securities. Some 15,000 lower-paid Congressional staffers aren't covered by the disclosure rule.
Unlike many Executive Branch employees, lawmakers and aides don't have restrictions on their
stock holdings and ownership interests in companies they oversee. Congressional rules say that
requiring employees to do so could "insulate a legislator from the personal and economic
interests that his or her constituency, or society in general, has in governmental decisions and
policy."
An analysis of financial-disclosure forms for 2008 and 2009 compiled by the website LegiStorm
shows that several hundred congressional aides bought or sold stocks. At least 72 traded the
stocks of companies their bosses write laws for.
The disclosure only requires dollar ranges for stock holdings and capital gains, so it is impossible
to calculate from them precisely how much aides make trading stock in dollar terms. (Some
aides opted to give precise numbers to the Journal.) Still, because the disclosure forms specify
the days when shares were bought and sold, the Journal was able to calculate the minimum
profits that aides made in percentage terms.
The calculation involved taking the high price on the day the stock was purchased and the low
price on the day it was sold. If an aide bought the stock below that daily high or sold it above that
daily low, the actual profit would have been bigger than the Journal calculation.
The Journal's analysis comes at a time of close government involvement in U.S. business. Much
of the trading was in industries dependent on government help, such as the financial-services and renewable-energy industries.
A number of aides invested in financial stocks. Karen Brown, an aide to Sen. Mike Crapo (R., Idaho), a Senate Banking Committee member,
traded Bank of America stock on seven occasions in 2009, according to filings. She bought a total of between $3,003 and $45,000 of the bank's
shares in three trades on April 17 and April 27 and sold between $51,002 and $115,000 in September. Her minimum gain during that period
would have been 43%.
At the time of the purchases, Bank of America was discussing with the government the findings of "stress tests" used to gauge the safety of U.S.
banks. On May 7, 2009, BofA shares surged when the stress-test results were made public, easing investor fears.
After it was contacted by the Journal, Mr. Crapo's office said the trades were made by Mrs. Brown's husband, "independent of any direction from
Mrs. Brown." The office said Mrs. Brown has since filed an amended financial-disclosure form.
Susan Wheeler, a spokeswoman for Mr. Crapo, said: "There is no relation between Senator Crapo's service on the Banking Committee and any
decisions made by Mr. Brown regarding the trades in question."
A spokeswoman for Mr. Crapo's office declined to specify the precise purchase and sale prices of the stock.
On Oct. 23, 2009, Mrs. Brown's form indicates two additional purchases of BoA for a total of between $65,002 and $150,000.
Joel Brubaker, the 41-year-old chief of staff to Rep. Shelley Moore Capito (R, W.Va), a member of the House Financial Services Committee, made
money trading in financial-services firms in 2009.
Mr. Brubaker says he invested $1,570 in Citigroup Inc. on Feb. 27, 2009, the day Citi and the Treasury announced the bank would issue common
stock in exchange for preferred shares. The move helped bolster investor confidence.
"I bought 1,000 shares at 12:50 p.m. on that date well after it was widely reported in the media that morning," Mr. Brubaker says.
He sold the Citi shares on Sept. 18 for at least $4,260, assuming he sold at Citi's lowest price for that day. That was a minimum profit of $2,690,
or 171%, during the nearly seven months he owned the stock.
Terri McCullough, a 41-year-old aide to House Speaker Nancy Pelosi, had several successful trades in 2008 in a Charles Schwab brokerage
account with her husband, Howard Wolfson, a former spokesman for Hillary Clinton's 2008 presidential campaign.
Mr. Wolfson says he bought about $2,000 worth of Freddie Mac and $2,700 worth of Fannie Mae on July 11, 2008, just two days before the Fed
authorized emergency funding to Freddie and Fannie. Mr. Wolfson says he bought the stock after reading a news story on the possibility of the
U.S. taking over one or both mortgage-finance companies.
As the Speaker of the House, Ms. Pelosi was briefed by the administration and Treasury Department officials about the steps they were taking in
Congressional Staffers Gain From Trading in Stocks - WSJ.com http://online.wsj.com/article/SB10001424052748703431604575522434...
2 of 4 1/4/2012 10:50 AM

the financial crisis. Ms. McCullough served as Ms. Pelosi's chief of staff, though she focuses on social issues and matters concerning Ms. Pelosi's
San Francisco-area district.
In one day Mr. Wolfson bought and sold Freddie Mac and Fannie Mae shares as the stocks jumped about 40%, for a profit of about $2,000, he
said. The couple made a total of $20,000 on trading in 2008, he said. Mr. Wolfson says that he made the trades on his own, without telling his
wife or getting any information from her.
Ms. McCullough said: "I was not involved in discussions regarding Fannie Mae or Freddie Mac, and I was unaware of the Bush Administration's
or Congress's plans regarding them. I do not make trades and had no knowledge of the trades my husband made in 2008 until after they were
made."
Another aide who trades actively is Cody Stewart, the executive director of the Western Caucus. This is a group of Republican lawmakers from
Western states interested in energy legislation and other issues that affect Western states. It doesn't have a formal role in enacting legislation.
Mr. Stewart made short-term profits by trading in firms such as NCI Building Systems Inc. that had a stake in energy legislation. He made a
$1,500 gain on two short-term trades in NCI in the summer and fall of 2009, according to Mr. Stewart and filings. He bought $3,782 in
Sunpower on Nov. 19 and sold it Dec. 15 for $4,331, for a $549 profit, or 15% gain, in less than a month, according to Mr. Stewart and the filings.
Mr. Stewart held each of his investments, which were all in the $1,000 to $15,000 range, for just a few months. He says he made a total 2009
profit of $15,000 on 47 trades, including about $9,000 on trades in financial services companies.
As the Western Caucus' top full-time employee, Mr. Stewart kept tabs on many issues that cleared the House last year, as well as tax incentives
for the renewable industry.
Mr. Stewart says he serves as a "clearinghouse for general information" to the Western Republicans, but says that he had "virtually no input on
policy in the House."
In a statement, Mr. Stewart said: "Yes, I had information about the renewable tax credits, but nothing I knew or had access to wasn't unknown by
the investment community...As a Republican staffer, I was not privy to any special or unique information in this area."
Mr. Stewart said he engaged in "a little bottom-of-the-barrel investing when the markets were at historic lows."
Mr. Miller, the 47-year-old energy aide to Mr. Reid, bought shares in Energy Conversion Devices stock in two chunks on Jan. 14 and Jan. 16,
2008, according to filings. The filing only indicated two purchases were each between $1,001 and $15,000, but a spokesman for Mr. Reid's office
said that Mr. Miller bought a total of $3,500.
Mr. Reid has supported using the federal government to help the renewable energy industry. Mr. Miller works as Mr. Reid's senior policy adviser
on energy and environment issues.
In a 2009 profile entitled "Energy: 10 Staffers to Know," Mr. Miller told the Capitol Hill newspaper Roll Call that he "meets frequently with a
broad array of energy stakeholder groups and daily with Reid himself."
One of the government incentives Mr. Reid supported for the renewable-energy industry was a 30% investment tax credit for companies in the
solar-energy business. A spokesman for Mr. Reid says Mr. Miller doesn't work on that issue, and that on Capitol Hill, the tax credit was widely
expected to pass.
"You have cherry-picked information and woven a misleading narrative," says Mr. Miller of the Journal analysis. "It's pretty straightforward: I
bought on a dip and sold on spikes, none of which had anything to do with my job."
On Sunday after Mr. Reid criticized his trading, Mr. Miller declined to respond further, according to Mr. Manley, the senator's spokesman.
A beneficiary of the tax credit was Energy Conversion Devices, a Michigan company whose solar-energy division is the "world's largest producer
of flexible solar panels," according to the company's website.
When Mr. Miller bought the Energy Conversion Devices shares, the renewable-energy industry was vulnerable because this investment-tax break
was due to expire at the end of 2008.
"We were worried as we are always worried because it meant uncertainty," said Martha Duggan, the vice president of regulatory and government
affairs for the solar unit of Energy Conversion Devices.
Within a few months, the prospects for the legislation brightened and it became more likely that some form of the investment credit would be
approved.
On May 8, the company issued an earnings report that beat analysts' expectations and sent the stock up 43% that day.
Mr. Miller sold most of his stake on May 12 and May 14, according to filings. On May 14, the House introduced its version of legislation to extend
the tax credit and voted to approve it a week later. Mr. Miller continued to hold the remainder of his ECD stake.
On Sept. 22, Mr. Miller sold his final ECD shares when the stock was declining; in all, he gained about $3,200 on an investment of about $3,500
in his ECD holdings during 2008, Mr. Manley said. That's a 91% gain.
The following day, the Senate approved extension of the tax credits.
Congressional Staffers Gain From Trading in Stocks - WSJ.com http://online.wsj.com/article/SB10001424052748703431604575522434...
3 of 4 1/4/2012 10:50 AM

Copyright 2011 Dow Jones & Company, Inc. All Rights Reserved
This copy is for your personal, non-commercial use only. Distribution and use of this material are governed by our Subscriber Agreement and by copyright law. For non-personal use or to
order multiple copies, please contact Dow Jones Reprints at 1-800-843-0008 or visit
www.djreprints.com
Write to Brody Mullins at [email protected], Tom McGinty at [email protected] and Jason Zweig at [email protected]
Corrections & Amplifications
About 2,900 of the highest-paid congressional aides must disclose information annually about their finances, and each of the forms submitted in
2008 and 2009 was reviewed by The Journal. A previous version of this article incorrectly said that about 1,700 staffers are required to submit
the disclosures.
Congressional Staffers Gain From Trading in Stocks - WSJ.com http://online.wsj.com/article/SB10001424052748703431604575522434...
4 of 4 1/4/2012 10:50 AM