abn amro small cap seminar -...
TRANSCRIPT

1
The Danish Brewery Group
ABN AMRO Small Cap Seminar 7 January 2005
The Danish Brewery Group presented by Ulrik Sørensen, CFOConnie Astrup-Larsen, International Director Eastern and Central Europe

2
• Introduction to The Danish Brewery Group• Q3 Results• The Baltic Markets
Agenda

3
Introduction to The Danish Brewery Group
Vision and Business Focus
VisionWe will with increasing profitability create a business as one of the leading providers of beverages in the Nordic and Baltic countries, and we will develop profitable export markets.
Business Focus• Nordic and Baltic countries: Domestic market• Italy and Germany: Niche strategy• The Caribbean and Africa: Niche strategy (malt)

4
i Return on invested capital - ROICAn increase from 8.8% in 2002 to more than 10% in 2004
i Cash flow
Generating a cash flow of more than DKK 200 million after tax per year
i Profit marginAn increase from 9.1% in 2002 to more than 10% in 2004
Introduction to The Danish Brewery Group
Financial Targets

1. Royal: A new strong national beer
2. Introduction of Heineken in Denmark
3. Closure of brewery in Randers
4. More marketing power
5. Increased focus on product development and innovation
6. Increased focus on staff development
7. Resource optimisation
8. Increased focus on key markets
STATUS 2004
20% of segment
1% market share
Completed
In progress
In progress
In progress
In progress
Focus on marketing
Introduction to The Danish Brewery Group
Strategic Plan V8

1. The Royal brand to be further strengthened
2. Cooperation with Heineken to be expanded
3. Relaunch of Kalnapilis in Lithuania
4. More marketing power
5. Increased focus on product development and innovation
6. Increased focus on staff development
7. Resource optimisation
8. Increased focus on key markets
Continued strong focus on
value creation and profitability
Introduction to The Danish Brewery Group
V8 NEXTUPDATE OF THE STRATEGIC PLAN IN 2004

7
Introduction to The Danish Brewery Group
What is new in V8 NEXT?
• Expansion of the Royal-brandObjective: At least 10% market share of the Danish lager segment within 5 years
• Licence production of Heineken in DenmarkObjective: Costs efficiency
• Relaunch of Kalnapilis (Lithuania)Objective: To recapture the position as the market leading supplier
• The other strategic elements to be maintained

8
Introduction to The Danish Brewery Group
V8 supports the total Value Chain
Purchase Production Distribution Sales
Closure of brewery in Randers
Increased focus on product development, innovation, and
more power on marketing
Royal
Heineken
Resource optimisation
Staff development

9
• Introduction to The Danish Brewery Group• Q3 Results• The Baltic Markets
Agenda

Sales 3.5 million HL (+13.6%)
Net revenue DKK 2.1 billion (+6.8%)
Operating profit DKK 202.9 million (-6.2%)
EBITDA DKK 358.4 million (+15.5%)
EBIT DKK 202.9 million (+15.2%)
Profit before tax DKK 172.0 million (+11.3%)
Free cash flow DKK 100.4 million (-48.1%)
i Consolidated profit before tax of DKK 172.0 million (compared to DKK 154.5 million for the same period of 2003)
i Net revenue up by 6.8% to DKK 2,145.5 millioni Q1-Q3 characterised by:
4Considerable marketing expenses relating to strategic initiatives under the V8 Next Plan
4Bad summer weather i large parts of Europe4Increased competition and pressure on prices in Northern Europe
i Increasing market shares in Italy, Denmark and Lithuaniai EBIT of DKK 202.9 million compared to DKK 176.2 million in 2003.i Free cash flow amounting to DKK 100.4 million compared to DKK 193.6 million for the
same period of 2003 primarily due to increased packaging investment.i Unchanged expectations for the full year, i.e. profit before tax in the amount of
DKK 235-265 million
Results
Highlights - Q3 2004

i V8 Next Strategic Plan introduced- Royal wins market share- Heineken shows growth- Kalnapilis relaunched- Enhanced marketing efforts in key markets- Resource optimisation programme shows results- Changes in distribution system implemented
i Intensified competition and price pressure in Northern Europe
Results
Key Events - Q1-3 2004

iDenmark:- Beer segment wins market shares (Royal Pilsner and Classic, COOP)- Soft drinks: Faxe Kondi and Mirinda win market shares
i Italy: Increasing market share in a falling total market
i Lithuania:- Kalnapilis in progress. Total market share (Kalnapilis and Tauras) of 27%
- Performance is developing positively
i Latvia:- ”Cido” leading Baltic soft drinks producer acquired- Entered into an agreement re. purchase of 83.5% of the share
capital of the Latvian brewery Lacplesa Alus
Results
Key Events - Q1-3 2004

13
Results
Financial Development - Q3, 2000-2004
Net turnover
0
1.000
2.000
3.000
2000 2001 2002 2003 2004
DK
K M
illion
Profit Margin
0
2
4
6
8
10
12
2000 2001 2002 2003 2004
Perc
en
t
Free cash flow
0
100
200
300
2000 2001 2002 2003 2004
DK
K M
illion
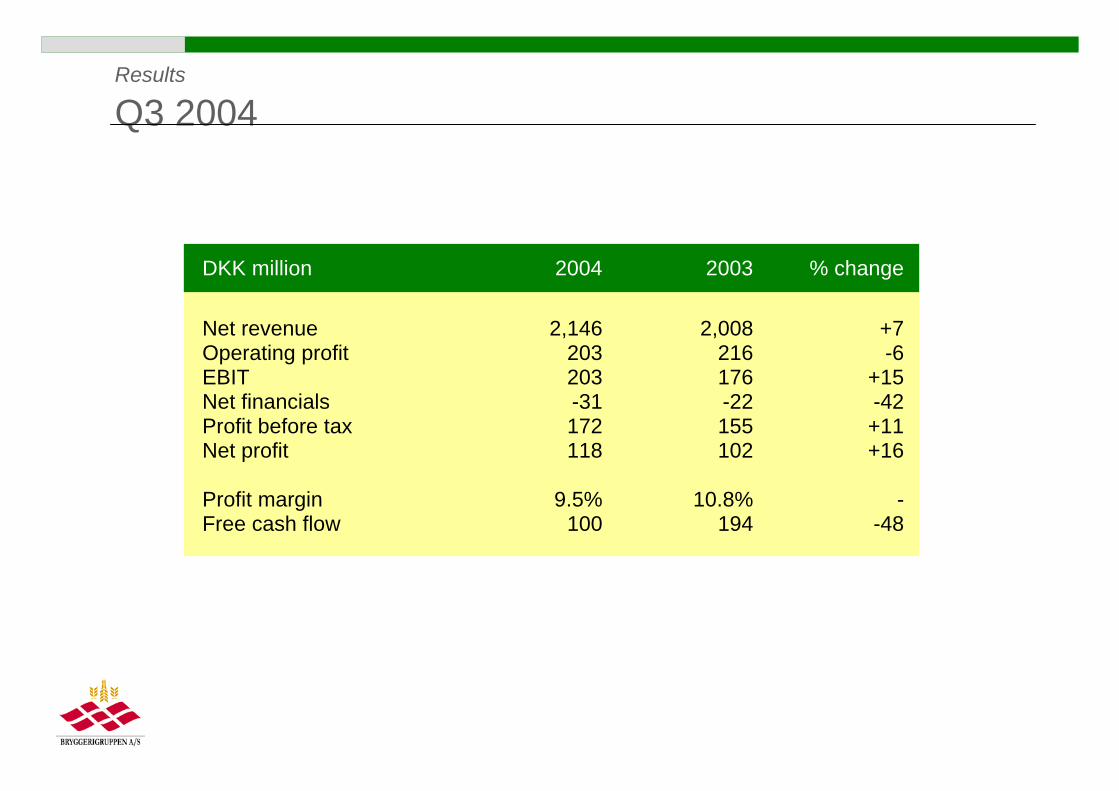
DKK million 2004 2003 % change
Net revenueOperating profitEBITNet financialsProfit before taxNet profit
2,146203203-31172118
2,008216176-22155102
+7-6
+15-42+11+16
Profit marginFree cash flow
9.5%100
10.8%194
--48
Results
Q3 2004
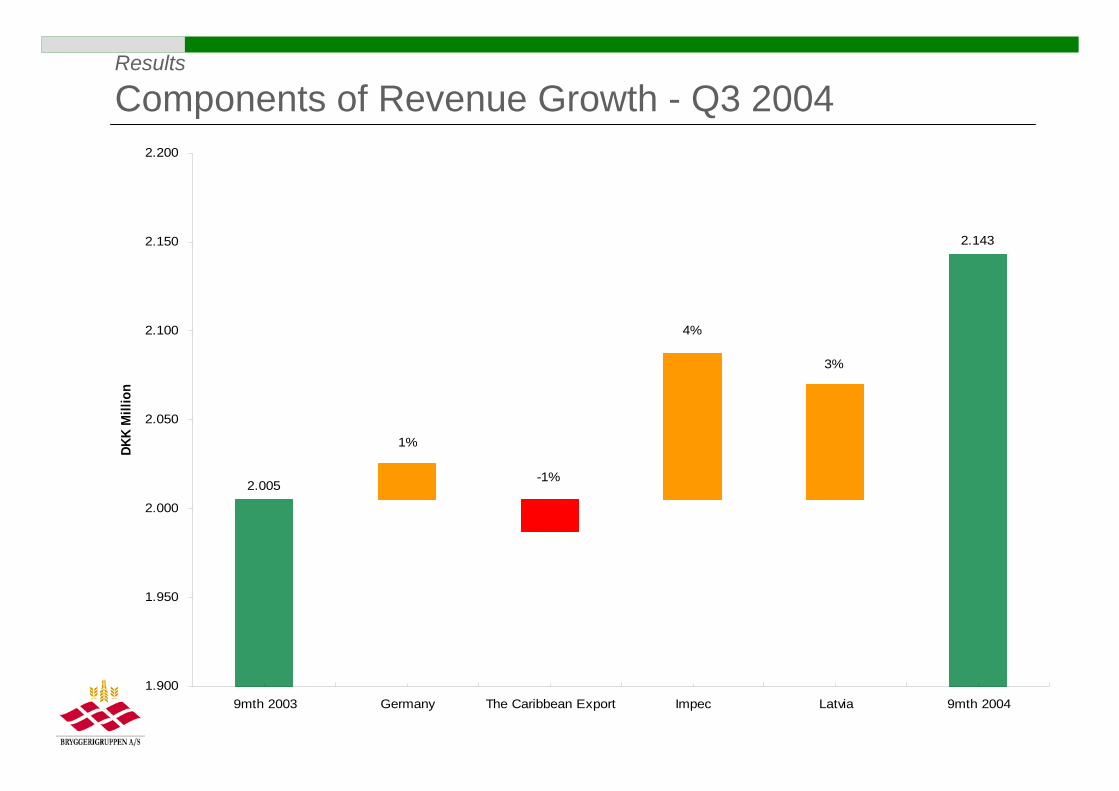
2.143
3%
4%
-1%2.005
1%
1.900
1.950
2.000
2.050
2.100
2.150
2.200
9mth 2003 Germany The Caribbean Export Impec Latvia 9mth 2004
DKK
Mill
ion
Results
Components of Revenue Growth - Q3 2004

16
1’000 HL 20043Q
20033Q
% change 20041-3Q
20031-3Q
% change
Western Europe 977 900 +8.5 2,607 2,443 +6.7
Eastern Europe 445 187 +138.6 767 501 +53.1
Other markets 62 66 -5.8 175 180 -2.6
Total volumes 1,484 1,153 +28.7 3,549 3,124 +13.6
Results
Volumes (by geographical area) - Q3 2004

17
Denmark, beer17%
Italy23%
Germany11%
UK2%
Eastern Europe12%
The Caribbean4%
Tax Free2%
Others5%
Denmark, soft drinks
24%
Denmark, beer18%
Italy26%
Germany11%
UK2%
Eastern Europe9%
The Caribbean3%
Others5%
Denmark, soft drinks
25%
Tax Free1%
2003 2004
Results
Net Turnover Q1-3

18
Denmark, beer20%
Italy11%
Germany18%
UK1%
Eastern Europe22%
The Caribbean3%
Tax Free2%
Others5%
Denmark, soft drinks
18%
Denmark, beer20%
Italy12%
Germany18%
UK2%
Eastern Europe16%
The Caribbean3%
Tax Free2%
Others6%
Denmark, soft drinks
21%
2003 2004
Results
Volumes - Q1-3

19
Results
Peer Group - Financial Performance 2003
Cash conversion ratio
0
2
4
6
8
10
12
BG
Perc
en
t
Profit margin
0
4
8
12
16
BG
Perc
en
t
ROIC
02468
1012141618
BG
Perc
en
t
Top 5 international breweries
Top 5 international breweries
Top 5 international breweries

20
• Introduction to The Danish Brewery Group• Q3 Results• The Baltic Markets
Agenda

21
The Danish Brewery Group
The Baltic MarketsPresented by Connie Astrup-Larsen,International Director, Bryggerigruppen A/S

22
The Baltic countries

23
The Baltic countries - Facts
* Source: CIA’s World Fact book** Source: Statistikos Departamentas (Statistics Lithuania)*** Source: Latvijas Statistikas**** Source: Statistical office of Estonia (”Rural” includes small towns and villages)
Lithuania
3,607,899
- 0.33%
33% / 67%**
Lithuanians 80.6%Russians 8.7%Poles 7.0%Belarussians 8.7%Others 2.1%
Latvians 57.7%Russians 29.6%Belarussians 4.1%Ukrainians 2.7%Poles 2.5%Lithuanians 1.4%Others 2.0%
Estonians 65.3%Russians 28.1%Ukrainians 2.5%Belarussians 1.5%Fins 1.0% Others 1.6%
Ethnic groups*
Latvia
2,306,306
- 0.71%
32% / 68%***
Estonia
1,356,045
- 0.66%
31% / 69%****
No. of inhabitants
Populationgrowth rate*
Rural / Urban

24
The economic development in the Baltics
• Continued high GDP growth is expected- Lithuania approx. 7% p.a., Latvia approx.
6,5% p.a., Estonia approx. 6% p.a.- Driven by a high domestic demand and strong exports
• Increased foreign investments in the Baltic• Improved business environment
- High ratings given by World Economic Forum on Competitiveness
• Inflation is only problematic in Latvia (heading for high inflation – could give concerns regarding the Euro time schedule)- Lithuania approx. 2,5%, Latvia approx. 6%, Estonia approx. 3%
• Relatively low level of interest rate, growing employment and higherincomes
• Relatively cheap but well educated workforce• Strong financial and banking systems

25
The Baltic’s entrance into EU
• The membership of EU is expected to contributesignificantly to the future economic development- Increase in international trade, new investments
and EU funds
• Strengthened platform for further growth in consumption
• Legislation is successively adapted to EU- lack of praxis in judgements- the court system is still not fully stabile
• Increase in trade across borders

26
DBG’s history in the Baltic’s
• Export from 1989
• 1998: Acquisition of importer/distributor
• 1999: Acquisition of AB Vilniaus Tauras(4th biggest brewery in Lithuania)
• 2001: Acquisition of AB Kalnapilis (3rd biggest brewery in Lithuania)
• 2003: No. 2 in the beer market in Lithuania
• Approx. 400 employees
27
DBG’s Vision
We will with increasing profitability create a business as one of the leading providers of beverages in the Nordic and Baltic countries, and we will develop profitable export markets.
The Vision is what the whole company is striving for

28
Starting point (1/4)• The beer markets – few big and quite a number of small players
00,71,21,52
3,69,510,1
24,247,2
0 5 10 15 20 25 30 35 40 45 50 55 60
Senas malunas
Daiga
Birzu alus
Mazeikiu lokys
Kauno alus
Rinkuskiai
Gubernija
Ragutis
Kalnapilis-Tauras Group
Svyturys + Utenos alus
The Lithuanian beer market: Market shares 2004 (volume)
%
Source: Lithuania’s Brewery Organisation
0,80,50,6
2,52,62,82,9
44,25,2
7,212,4
14,939,3
0 5 10 15 20 25 30 35 40 45 50
Others
Gulbenes alus daritava SIA
Zaksi SIA
Alus Nams SIA
Alus Avots SIA
Agrofirma Tervete a/s
Piebalgas alus SIA
Bauskas alus SIA
Kimmels Riga a/s
Mamas D SIA
Lacplesa alus a/s
Livu alus SIA
Cesu alus a/s
Aldaris a/s
The Latvian beer market: Market shares YTD 10/2004 (volume)
Source: Latvia’s Brewery Organisation
%

29
Starting point (2/4)
• Preference for locally produced beer brands
Share of sales (AC Nielsen data)
Local vs. International beer brands
%
* For Lithuania a small segment of imported beer is part of ”Local brands”** For Latvia ”International brands” are defined as Carlsberg + imported bottle beers.
96
95
2
5
0 10 20 30 40 50 60 70 80 90 100
Latvia**
Lithuania*
International brandsLocal brands

30
Starting point (3/4)
• Consumption is significantly lower than inNorthern Europe - but rapidly increasing
• Intense competition
• Retail trade in 2 levels:- Key accounts on western level in bigger cities- Kiosks and smaller outlets especially in rural
areas
• DBG no. 2 in the beer market in the Baltics- only in Lithuania - and with unsatisfactory profitgeneration

31
2 Strategic Targets
• Turn-around in Lithuania
• Establishment in Latvia

32
Turn-around in Lithuania
• Strengthen management - new management team
• Strengthen the platform for growth on brands- Relaunch of Kalnapilis- Upgrading of total product portfolio
• Strengthen marketing strategy and efficiency ofinvestments
• Strengthen the sales function - competence andtools
• Cost optimisation in all areas
• Focus on profitability - improve managementsystems and tools
The 2004 result for Lithuania is clearly improved

33
Establishment in Latvia – step 1
• Strategic entrance through the juice/soft drinkmarket
• Acquisition of CIDO in October 2004- Market leader in the Baltics- Strong international brands in the high
price/quality segments- Very strong position and set-up in Latvia- Best in class sales- and distribution network- International sales and strong growth potential- Good scale for establishment and good
profit potential
34
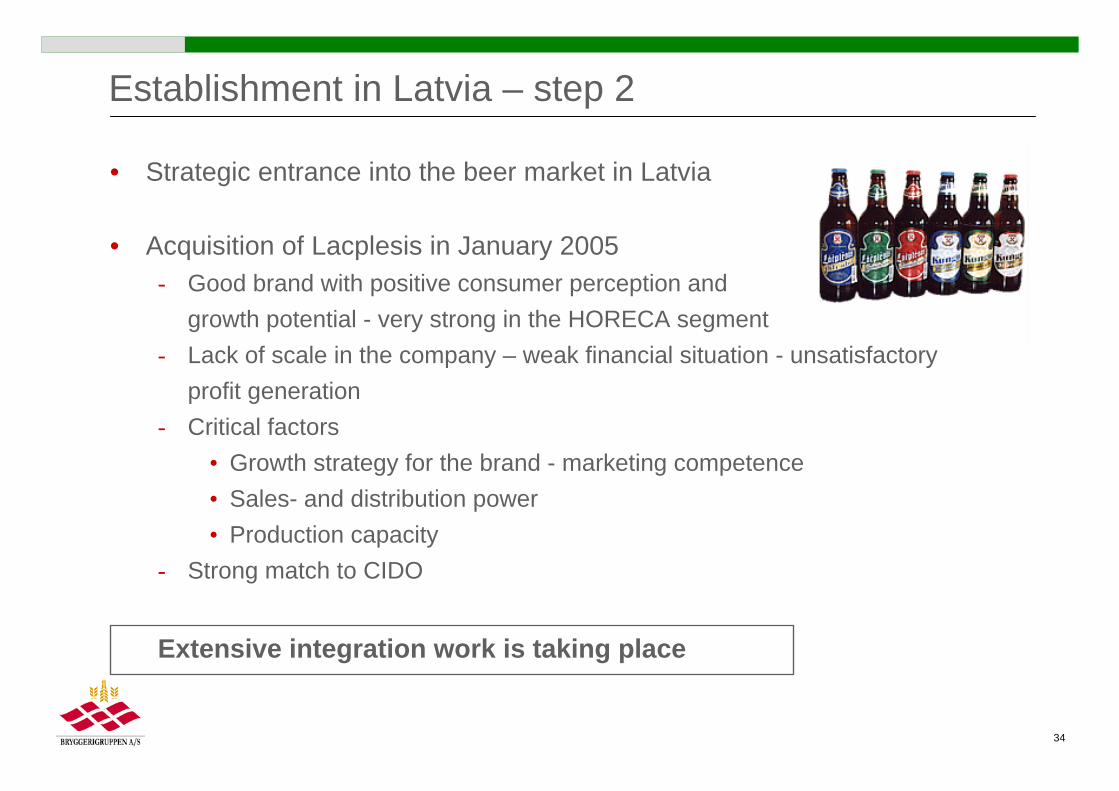
Establishment in Latvia – step 2
• Strategic entrance into the beer market in Latvia
• Acquisition of Lacplesis in January 2005- Good brand with positive consumer perception and
growth potential - very strong in the HORECA segment- Lack of scale in the company – weak financial situation - unsatisfactory
profit generation- Critical factors
i Growth strategy for the brand - marketing competencei Sales- and distribution poweri Production capacity
- Strong match to CIDO
Extensive integration work is taking place

35
DBG’s present platform in the Baltic’s
• Establishment in Lithuania and Latvia
• Turnover of approx. DKK 500 mio.
• 4 strong production sites for beer and juice/soft drinks
• Brands with a strong growth potential
• Competent management and organization
• Strong sales- and distribution network
• Approx. 1000 employees
Strong platform to achieve DBG’s vision and objectives
36
Key learning’s from the Baltic’s
• Shortage of well educated/experienced localleaders- Very action driven - need short term success - Short notice period for termination of employment- Look for best qualified with development potential -
that can be trusted!
• Significant differences in cultures- Understand culture - get close to people - build
team-work- Strong involvement in strategy and integration processes- ”Small society” - information flows rapidly- Still some ”old Russian” habits (responsibility/
administration)
• Understand the trade/key-accounts - and theirthinking/behaviour- Low loyalty towards brands- Tough in negotiations
• Need for local advisors- Legislation - and understanding local rules of the game

Thank you for your attention ...