abn amro group quarterly report fourth quarter …...abn amro group uarterly report fourth quarter...
TRANSCRIPT

Fourth quarter 2015
Quarterly Report
ABN AMRO Group N.V.

Introduction This Quarterly Report presents ABN AMRO’s result for the fourth quarter of 2015. The report contains
an update of our share’s performance, our quarterly operating and financial review, an economic
update and selected risk, capital, liquidity and funding disclosures.
Presentation of informationThe financial information contained in this Quarterly Report has been prepared according to the same
accounting policies and methods of computation as our most recent financial statements, which were
prepared in accordance with EU IFRS. The figures in this document have not been audited or reviewed
by our external auditor.
To provide a better understanding of the underlying trends, ABN AMRO has adjusted its results
reported in accordance with EU IFRS for defined special items and material divestments.
The balance sheet line item Commercial loans has been renamed Corporate loans in order to avoid
any confusion with the Corporate Banking sub-segment Commercial Clients.
This report is presented in euros (EUR), which is ABN AMRO’s presentation currency, rounded to the
nearest million (unless otherwise stated). All annual averages in this report are based on month-end
figures. Management does not believe that these month-end averages present trends that are
materially different from those that would be presented by daily averages.
Certain figures in this report may not tally exactly due to rounding. Furthermore, certain percentages
in this document have been calculated using rounded figures.
In addition to this report, ABN AMRO provides the following supplementary documents for its 2015
results on abnamro.com/ir:
Å statistical factsheet;
Å investor call presentation;
Å road show presentation;
Å quarterly reports first, second and third quarter 2015.
For a download of this report or more information, please visit us at abnamro.com/ir or contact us at
IntroductionFinancial results
Risk, funding & capital inform
ationOther
Notes to the reader

33 Risk, funding & capital informationKey developments 34
Credit risk 37
Operational risk 58
Market risk 59
Liquidity risk 61
Funding 63
Capital management 66
70 OtherEnquiries 71
2 IntroductionFigures at a glance 2
Message from the Chairman of the Managing Board 3
ABN AMRO shares 5
Economic environment 6
8 Financial resultsOperating and financial review 9
Results by segment 17
Additional financial information 31
Table of contents IntroductionFinancial results
Risk, funding & capital inform
ationOther

ABN AMRO Group Quarterly Report fourth quarter 2015
2
Financial resultsRisk, funding &
capital information
OtherIntroduction
Introduction / Figures at a glance
Figures at a glance
4
8
12
16
20
15.3
6.3
12.7
Underlying return on equity Target range is 10-13 (in %)
14.1
10.9
Q3 15 Q4 15Q4 14 Q1 15 Q2 15
74.5
100
80
60
40
20
58.6 58.5
Underlying cost/income ratio2017 target range is 56-60 (in %)
65.156.2
Q3 15 Q4 15Q4 14 Q1 15 Q2 15
4
8
12
16
20
14.814.015.5
14.2
CET1 (fully-loaded)Target range is 11.5-13.5 (in %)
14.1
Q3 15 Q4 15Q4 14 Q1 15 Q2 15
Underlying earnings per share(in EUR)
1.0
0.8
0.6
0.4
0.2
Q3 15 Q4 15Q4 14 Q1 15 Q2 15
0.64
0.27
0.540.58
0.43
750
600
450
300
150
Reported net profit(in millions)
600
509
272
543
400
Q3 15 Q4 15Q4 14 Q1 15 Q2 15
175
160
145
130
115
142149 147
Underlying net interest margin(in bps)
148
163
Q3 15 Q4 15Q4 14 Q1 15 Q2 15
25
20
15
10
5
15.4
18.4 19.1
Total capital ratio (fully-loaded)(end-of-period, in %)
19.518.9
Q3 15 Q4 15Q4 14 Q1 15 Q2 15
75
60
45
30
155
1419
38
Underlying cost of risk(in bps)
27
Q3 15 Q4 15Q4 14 Q1 15 Q2 15
1
2
3
4
5
3.13.5
3.8
Leverage ratio (fully-loaded, CDR)(end-of-period, in %)
3.53.7
Q3 15 Q4 15Q4 14 Q1 15 Q2 15
Figures at a glance
Introduction

ABN AMRO Group Quarterly Report fourth quarter 2015
3
Financial resultsRisk, funding &
capital information
OtherIntroduction
Introduction / Message from the Chairman of the Managing Board
Message from the Chairman of the Managing Board2015 was a good year for the bank. We worked hard
to create long-term value for all our stakeholders.
A fourth quarter milestone was the IPO and listing
of ABN AMRO on Euronext Amsterdam.
Our strategy is based on five priorities. While each of
these five priorities is a key ingredient for the success of
our bank, the most important is enhancing client centricity.
We took various initiatives bank-wide in 2015 to put our
clients’ interests centre stage in everything we do. Many
of these initiatives consist of technological enhancements
as the trend towards digitalisation gains momentum.
Retail Banking created a new Digital Banking unit, in
line with the shift in client preferences for mobile and online
services. Retail Banking will continue to invest in innovative
ways to ensure that our mobile services - already very
popular - are future-proof. We recently introduced the
possibility for clients with a mortgage to arrange a new
interest period themselves online, and Florius clients can
now track the status of their mortgage application online.
The ABN AMRO Social Impact Fund, together with
a number of partners, launched a Social Impact Bond for
Buzinezzclub Utrecht which specialises in getting young
people benefits by helping them to find a job, start their
own business or undergo training. While our own Equity
Capital Markets team had a lead role in the IPO of
ABN AMRO, it also participated in the IPO of Intertrust and
Flow Traders, won the mandate for the IPO of ASR and won
the award for best deal with the IPO of Grandvision.
And early 2016 ABN AMRO joined forces with NEOS, which
offers SME clients alternative financing for growth or other
purposes, funded by professional investors. This makes
ABN AMRO the first Dutch bank to bring entrepreneurs in
the Netherlands directly into contact with a supplemental
financier when multi-layered financing is the solution of
choice. MT Finance Magazine ranked our corporate bank
number 1 in the Netherlands in five categories: Corporate
Asset Management, Cash Management - Payments,
Credit Management, Factoring & Collections, Corporate
Finance and Risk Management.
ABN AMRO also issued a EUR 500 million five-year
Green Bond last May which was chosen as SRI (Socially
Responsible Investment) bond of the year at the annual
IFR (International Financing Review) awards. An important
event was the IPO of ABN AMRO in November 2015.
The listing on Euronext Amsterdam was the result of
years of hard work of all of us.
Turning to the results, the underlying net profit for the
full year 2015 went up 24% to EUR 1,924 million.
The fourth-quarter underlying net profit declined by 32%
to EUR 272 million and, as previously indicated, was
negatively impacted by regulatory levies (EUR 190 million).
The fourth quarter of 2015 also contains provisions for an
identified group of SMEs with possible derivative-related
issues and legal claims. An underlying net profit of
EUR 1,924 million, or EUR 2.03 per share, translates
into an ROE of 12.0% for 2015, up from 10.9% in 2014.
At the same time, we were able to further improve
our fully-loaded CET1 ratio from 14.1% to 15.5%.
The increase in profitability was achieved on sharply
lower impairments and despite higher regulatory levies
and project costs. Operating income for full-year 2015
went up by 5% compared with full-year 2014, on the
back of a further repricing of the loan portfolio and higher
fee and commission income.
In 2014 and 2015, we reviewed client records of an
identified group of SMEs with possible interest rate
derivative-related issues for any irregularities. We did
so in close consultation with the Netherlands Authority
for the Financial Markets (AFM). In December 2015 the
AFM came to the conclusion that the reassessments
would have to be redone. The provision we took in the
second quarter of 2015 was therefore increased in the
fourth quarter. As the current situation poses uncertainty
about the scope and magnitude of the required
reassessment going forward, we continue to consult
with the AFM to determine how the latest changes
will affect ABN AMRO’s review process in 2016.
Message from the Chairman of the Managing Board

ABN AMRO Group Quarterly Report fourth quarter 2015
4
Financial resultsRisk, funding &
capital information
OtherIntroduction
Introduction / Message from the Chairman of the Managing Board
Operating expenses in 2015 were up by 8% compared
with full-year 2014. This increase was mainly due to
EUR 129 million higher regulatory levies recorded in the
fourth quarter of 2015, increasing project costs (for various
IT and digitalisation projects, and projects to update and
improve the quality of our client files and electronic
archives) and higher pension. The continuously changing
regulatory requirements also drove up our costs.
We started investing in our core IT infrastructure in 2013,
to transform the group-wide IT platform into a less complex
and more agile system, and will continue to make these
investments up to 2020. In addition, we are investing in
a Retail digitalisation programme to accelerate our digital
banking proposition, ensuring that we maintain our leading
offering in both mobile and internet banking. In 2015,
total investments in the two programmes amounted
to EUR 159 million and the combined cost savings were
EUR 101 million. These two programmes will help us
control costs in the long term.
Loan impairments in 2015 more than halved to
EUR 505 million, benefiting from the improvement of
the Dutch economy. Even though oil and commodity
prices showed significant moves in the last six months
of the year, the cost of risk for our ECT business was
52 basispoints for the full year 2015, in the middle of
the estimated through the cycle cost of risk of Corporate
Banking. We know our clients in these sectors well and
aim to finance them conservatively, with a preference
for collateralised, transactional or senior lending, using
covenants to allow for timely amendments to a transaction.
However, it is clear that the risk in our ECT portfolio
has increased and we are actively monitoring all clients,
taking appropriate action where necessary.
Last September we updated our financial targets. These
are now:
Å a fully-loaded Common Equity Tier 1 ratio of 11.5-13.5%
Å a cost/income ratio of 56-60% by 2017
Å a return on equity of 10-13% in the coming years
Å a dividend payout ratio of 50% as from and over
the full year 2017
In 2015 we achieved a cost/income ratio of 61.8% (60.2%
in 2014). We were faced with higher investment levels
and increasing regulatory levies in 2015, which will
continue in 2016. Our cost saving measures are expected
to bring down the cost/income ratio to within our target
range by 2017. The ROE was within the target range and
rose to 12.0% in 2015 from 10.9% in 2014.
As mentioned, the capital position continued to grow and
the fully-loaded CET1 ratio was 15.5%, compared with
14.1% at the end of 2014. As the implementation of the
new Basel proposal may lead to significant risk-weighting
inflation for the bank, we will continue to grow our capital
position until there is more clarity on this topic. In the
meantime, we have increased the proposed dividend
payout ratio for 2015 from 35% to 40% of the reported
full-year net profit, or EUR 0.81 per share. This is
EUR 764 million, of which EUR 414 million (EUR 0.44
per share) is proposed as final cash dividend.
Looking ahead, we will continue to focus on executing our
strategy and adapting to challenging market developments,
such as the continued low interest rate environment,
increasing competition in the mortgage market, and
regulatory and economic uncertainty. One thing we know
for sure is that regulatory levies will increase further in 2016.
To protect our main source of income, net interest income,
we apply hedges designed to stabilise net interest income
against (upward or downward) fluctuations in interest
rates. Since the second half of 2015, we have been
experiencing increasing competition from insurance
companies, pension funds and other new entrants for
mortgages with a long dated interest period - a product
which poses a number of risks to our balance sheet,
which is why we take a prudent approach.
I would like to take this opportunity to thank our clients
for doing business with us and to our employees for
their willingness and ability to adapt in times of continuous
change. With their dedication and determination, we
are confident that the bank is equipped to take on the
opportunities and challenges that will come our way in
the years ahead.
Gerrit ZalmChairman of the Managing Board

ABN AMRO Group Quarterly Report fourth quarter 2015
5
Financial resultsRisk, funding &
capital information
OtherIntroduction
Introduction / ABN AMRO shares
ABN AMRO sharesKey developmentsFollowing the IPO on 20 November 2015 and the
subsequent exercise of the overallotment option
(‘greenshoe’), a total of 23% of ABN AMRO’s depositary
receipts representing ordinary shares have been listed
on the Euronext Amsterdam exchange. These depositary
receipts were allocated mainly to European and US-based
institutional investors and to Dutch retail investors.
The remaining 77% of the shares are held by NLFI
(‘Stichting administratiekantoor beheer financiele
instellingen’) on behalf of the Dutch government.
Listing informationA total of 216.2 million shares, or 23% of ordinary
shares, are currently held by the STAK AAG (‘Stichting
Administratiekantoor Continuïteit ABN AMRO Group’),
which subsequently issued depositary receipts
representing such shares. For more information about
the STAK AAG, please refer to the ‘About ABN AMRO’
section of abnamro.com. The depositary receipts trade
under ISIN code ‘NL0011540547’, Reuters ticker ‘ABN.AS’
and Bloomberg ticker ‘ABN NA’).
80%
90%
100%
110%
120%
Oct 2015 Nov 2015 Dec 2015
Share price development(in %)
ABN AMRO STOXX Europe 600 Banks
Amsterdam Exchange Index
Financial calendar1
Å Publication first-quarter results - 11 May 2016
Å Annual General Meeting - 18 May 2016
Å Record date final dividend - 23 May 2016
Å Publication second-quarter results - 17 August 2016
Å Record date interim dividend - 22 August 2016
Å Publication third-quarter results - 16 November 2016
1 All dates are subject to change. Please refer to abnamro.com/ir for the latest information. Dividend record date applies only if a final or interim dividend is paid.
(in millions) Q4 2015 Q3 2015 Q4 2014 2015 2014
Share countTotal shares outstanding/issued and paid-up shares 940 940 940 940 940
- of which held by NLFI 724 940 940 724 940
- of which listed (in the form of depository receipts) 216 216
- as a percentage of total outstanding shares 23% 0% 0% 23% 0%
Average number of shares 940 940 940 940 940
Average diluted number of shares 940 940 940 940 940
Key indicators per share (EUR)Underlying earnings per share 0.27 0.54 0.43 2.03 1.65
Shareholder's equity per share 17.63 17.12 15.81 17.63 15.81
Tangible shareholder's equity per share 17.36 16.84 15.54 17.44 15.54
Dividend per share 0.81 0.43
Share price development (EUR)Closing price (end of period) 20.67 20.67
High (during the period) 20.80 20.80
Low (during the period) 18.00 18.00
Market capitalisation (end of period, in billions) 19.43 19.43
Valuation indicators (end of period)Price/Earnings 10.2x 10.2x
Price/Tangible book value 1.2x 1.2x
ABN AMRO shares

ABN AMRO Group Quarterly Report fourth quarter 2015
6
Financial resultsRisk, funding &
capital information
OtherIntroduction
Introduction / Economic environment
Economic environment
Economic environment (Engels)
Introduction
Economic environment
Uncertainty surrounding developments on the global and financial markets continued in the fourth quarter. This was mainly attributable to disappointing developments in emerging economies, especially commodity-exporting countries and China. Growth of world trade and global GDP remained low, according to available data.
The US economy continued to grow, although the pace of
expansion slowed further in Q4 2015. The labour market,
however, continued to improve in Q4. Economic growth
in the eurozone remained low at 0.3% compared with the
preceding quarter. This modest figure was attributable to
the slowdown in exports to emerging markets, while growth
in domestic demand was stable. Economic growth in the
eurozone is still supported by lower oil prices, lower financing
costs and further improvements in the credit channel.
Following minor growth in Q3 2015, economic growth
in the Netherlands picked up slightly to 0.3% in Q4 2015
in comparison with the preceding quarter. Exports were
affected by the slow expansion of world trade. Private
consumption fell slightly due to significantly lower spending
on gas caused by the extremely mild weather. Investment,
however, was strong due to sizeable investments in
housing and in passenger cars (in anticipation of a less
favourable tax regime for energy-friendly cars in 2016). On
a year-on-year basis, Dutch GDP amounted to 1.6% in Q4.
Average GDP growth in full-year 2015 accelerated to 1.9%,
which was higher than the eurozone average of 1.5%.
0.1
0.40.3
GDP NL GDP Eurozone
Quarterly development of Gross Domestic Product (in % q-o-q growth)
1.0
0.8
0.6
0.4
0.2
0
0.40.5
0.9
0.6
0.1
Q3 15 Q4 15Q4 14 Q1 15 Q2 15
0.3
0.3
Source: Eurostat and CBS
Å GDP growth picked up slightly in Q4 - to 0.3%
quarter-on-quarter;
Å Domestic demand growth was stable at 0.6%
quarter-on-quarter;
Å The increase in exports was small, which reflects
the low expansion of world trade.
56
52 53
53
52
5353
NL EU
Purchasing Managers’ Index(>50: growth, <50: contraction, end-of-period)
60
55
50
45
40
51
54 53
Q3 15 Q4 15Q4 14 Q1 15 Q2 15
Source: Markit
Å Manufacturing PMI rose slightly in Q4 2015, following
a larger drop in Q3 2015;
Å At 53.4, the PMI in Q4 2015 was still well above 50,
the turning point between contraction and growth;
Å Dutch PMI was at approximately the same level as
the eurozone manufacturing figure.

ABN AMRO Group Quarterly Report fourth quarter 2015
7
Financial resultsRisk, funding &
capital information
OtherIntroduction
Introduction / Economic environment
Å
-7
65
6
Consumer confidence in the Netherlands(as % balance of positive and negative answers, end-of-period)
6
3
0
-3
-6
2
Q3 15 Q4 15Q4 14 Q1 15 Q2 15
Source: CBS
Consumer confidence was roughly stable, on balance,
in Q4 2015;
Å At +6 (end Q4 2015), confidence was significantly
higher than the long-term average (approximately -8);
Å The ‘Willingness to buy’ sub-index improved slightly
in Q4 2015.
1,781 1,764
1,528
1,2561,380
2,000
1,800
1,600
1,400
1,200
Bankruptcies in the Netherlands(number of bankruptcies)
Q4 15 Q3 15 Q4 15Q1 15 Q2 15
Source: CBS
Å The number of bankruptcies dropped by 23% in Q4 2015
compared with Q4 2014 (but +8% against Q3 2015);
Å For full-year 2015, the number fell by 22% (following a
drop of 19% in 2014);
Å The decline is attributable to a better economic climate.
Å
2.6
3.53.2
House prices in the Netherlands(in % year-over-year growth)
5
4
3
2
1
2.02.7
Q3 15 Q4 15Q4 14 Q1 15 Q2 15
Source: CBS
House prices rose by 3.2% year-on-year in Q4 2015
(full-year 2015: +2.8%);
Å Number of houses sold rose by 2.2% year-on-year
in Q4 2015;
Å This smaller rise than in preceding quarters was due
to an extremely strong sales figure in December 2014.
Å
7.0 6.9 6.8 6.6
Unemployment in the Netherlands(in % of total labour force, end-of-period)
10
8
6
4
2
Q3 15 Q4 15
Source: CBS
Q4 14 Q1 15 Q2 15
7.2
Unemployment fell slightly further in Q4 2015;
Å This was due to a slight rise in the number of jobs
and to people that left the labour market;
Å The number of dismissal permits continued to drop.

IntroductionRisk, funding &
capital information
OtherFinancial results
9 Operating and financial review
17 Results by segmentRetail Banking 17
Private Banking 20
Corporate Banking 23
Group Functions 29
31 Additional financial information
Financial results
Financial results

ABN AMRO Group Quarterly Report fourth quarter 2015
9
IntroductionRisk, funding &
capital information
Other
Financial results / Operating and financial review
Financial results
Operating and financial review
Operating and financial review Operating and financial review (Engels)
This operating and financial review includes a discussion and analysis of the results of operations and sets out the financial condition of ABN AMRO Group on the basis of underlying results. For a reconciliation of reported versus underlying results, please refer to the Additional Financial Information section of this report.
As of 2015, ABN AMRO has extended the definition of
assets under management for the Group to include client
assets in Retail Banking and has changed the name of
assets under management to client assets. Client assets
include cash and securities of clients held on accounts
with ABN AMRO. The development of client assets is
explained for Private Banking.
As of Q3 2015, the definition of the underlying return on
average equity has been altered to reflect the implications
of the accounting treatment for Additional Tier 1 instruments.
Return on equity is now calculated as underlying profit
for the period attributable to owners of the company (i.e.
underlying profit after deduction of net reserved payments
for capital securities and result attributable to non-controlling
interests) divided by the average equity attributable to
the owners of the company (i.e. excluding capital securities
and non-controlling interests).

ABN AMRO Group Quarterly Report fourth quarter 2015
10
IntroductionRisk, funding &
capital information
Other
Financial results / Operating and financial review
Financial results
Income statementOperating results
(in millions) Q4 2015 Q4 2014 Change Q3 2015 Change 2015 2014 Change
Net interest income 1,497 1,620 -8% 1,524 -2% 6,076 6,023 1%
Net fee and commission income 454 431 5% 449 1% 1,829 1,691 8%
Other operating income 101 95 7% 136 -26% 550 341 61%
Operating income 2,052 2,145 -4% 2,109 -3% 8,455 8,055 5%
Personnel expenses 640 650 -2% 619 3% 2,492 2,396 4%
Other expenses 889 748 19% 615 44% 2,736 2,453 12%
Operating expenses 1,528 1,397 9% 1,234 24% 5,228 4,849 8%
Operating result 524 748 -30% 875 -40% 3,227 3,206 1%
Impairment charges on loans and other receivables 124 181 -31% 94 32% 505 1,171 -57%
Operating profit/(loss) before taxation 399 567 -30% 781 -49% 2,722 2,035 34%
Income tax expense 128 167 -24% 272 -53% 798 484 65%
Underlying profit/(loss) for the period 272 400 -32% 509 -47% 1,924 1,551 24%
Special items -417
Reported profit/(loss) for the period 272 400 -32% 509 -47% 1,924 1,134 70%
Of which available for AT1 capital securities (net of tax) 11 11
Of which non-controlling interests 5 -1 5 -0
Other indicators
Q4 2015 Q4 2014 Q3 2015 2015 2014
Net interest margin (NIM) (in bps) 147 163 149 146 153
Underlying cost/income ratio 74.5% 65.1% 58.5% 61.8% 60.2%
Underlying cost of risk (in bps)1 19 27 14 19 45
Underlying return on average Equity2 6.3% 10.9% 12.7% 12.0% 10.9%
Underlying earnings per share (in EUR)3 0.27 0.43 0.54 2.03 1.65
31 December 2015 30 September 2015 31 December 2014
Client Assets (in billions) 314 306 302
FTEs 22,048 22,101 22,215
1 Annualised impairment charges on Loans and receivables - customers for the period divided by average Loans and receivables - customers. 2 Underlying profit for the period excluding reserved coupons for AT 1 Capital securities (net-of-tax) and results attributable to non-controlling interests divided by the average equity
attributable to the owners of the company. 3 Underlying profit for the period excluding reserved coupons for AT 1 Capital securities and results attributable to non-controlling interests divided by the average outstanding and paid-up
ordinary shares.

ABN AMRO Group Quarterly Report fourth quarter 2015
11
IntroductionRisk, funding &
capital information
Other
Financial results / Operating and financial review
Financial results
Fourth-quarter 2015 resultsABN AMRO’s underlying profit for the fourth quarter of 2015
amounted to EUR 272 million, a decrease of EUR 128 million
compared with the fourth quarter of 2014, reflecting a
EUR 99 million (net-of-tax) increase of regulatory levies,
a provision for the Euribor mortgages legal claim and an
additional provision for an identified group of SMEs with
possible derivative-related issues.
The underlying return on equity (ROE) decreased to 6.3% in
Q4 2015, compared with 10.9% in the same period in 2014.
The fourth quarter of 2015 included regulatory levies for the
National Resolution Fund (NRF), Dutch bank tax and Deposit
Guarantee Scheme (DGS). The charge for the Dutch bank tax
was also included in Q4 2014. If these regulatory levies had
been divided equally over the quarters, ROE would have
been 9.7% in Q4 2015 (versus an adjusted ROE of 12.8%
in the same period of 2014).
Operating income decreased by EUR 93 million to
EUR 2,052 million from EUR 2,145 million in Q4 2014.
Net interest income declined to EUR 1,497 million in Q4 2015
from EUR 1,620 million in Q4 2014. The net interest income
development was impacted by several negative one-off
items in Q4 2015 (including a provision for the Euribor
mortgages legal claim) and a EUR 37 million positive one-off
in Q4 2014.
Net interest income on residential mortgages increased
compared with Q4 2014 as margin improvements more than
offset the decrease in portfolio volumes. Margins improved
due to continued gradual repricing at higher margins, in
particular mortgages that originated pre-crisis. The impact
of repricing of the mortgage book in recent years continues
to contribute to higher net interest income. Compared with
Q3 2015, the repricing effect gradually levelled off.
Net interest income on consumer loans decreased due to
declining average loan volumes and slightly lower margins.
Net interest income on corporate loans increased in Q4
2015 compared with Q4 2014 due to the positive impact of
improved margins and, to a lesser extent, increased average
volumes. Margin improvements were mainly recorded in
Commercial Clients. The increase in average corporate loan
volumes was driven chiefly by volume growth in the ECT
Clients loan portfolio (including currency developments).
Average corporate loan volumes in Commercial Clients
showed a limited decline compared with Q4 2014.
Net interest income was negatively impacted by higher
liquidity buffer costs.
In combination with modestly higher average total assets,
this resulted in a net interest margin (NIM) of 147bps in
Q4 2015.
Net fee and commission income, at EUR 454 million in Q4
2015, was EUR 23 million higher than in Q4 2014. The
limited increase was recorded in all business segments.
Other operating income amounted to EUR 101 million in Q4
2015 compared with EUR 95 million in Q4 2014. Favourable
hedge accounting-related results at Group Functions and
Equity Participations results were accompanied by positive
CVA/DVA/FVA results (EUR 20 million positive in Q4 2015
versus EUR 12 million negative in Q4 2014). This was partly
offset by an additional provision for an identified group of
SMEs with possible derivative-related issues at Corporate
Banking. Q4 2014 included a gain of EUR 40 million resulting
from the sale of part of the stake in Holland Clearing House.
Personnel expenses amounted to EUR 640 million in Q4
2015, down by EUR 10 million compared with Q4 2014.
The fourth quarter of 2015 included a restructuring provision
in Group Functions. The fourth quarter of 2014 included a
restructuring provision at Retail Banking and a release from
the provision for employee benefits.

ABN AMRO Group Quarterly Report fourth quarter 2015
12
IntroductionRisk, funding &
capital information
Other
Financial results / Operating and financial review
Financial results
Other expenses increased to EUR 889 million in Q4 2015
from EUR 748 million in Q4 2014. The increase was mainly
caused by the EUR 129 million higher regulatory levies
recorded in Q4 2015 (totalling EUR 220 million) compared
with Q4 2014. The regulatory levies in Q4 2015 included the
Dutch bank tax (EUR 98 million), the National Resolution
Funds (EUR 119 million) and the Deposit Guarantee Scheme
(EUR 3 million). Implementation of the Dutch DGS has been
postponed by the national regulator to Q1 2016; the DGS
charge recorded in the fourth quarter is therefore lower than
previously communicated. In Q4 2014, only the Dutch bank
tax was recorded (EUR 91 million). Both quarters included
releases on the Deposit Guarantee Scheme for the DSB
default, although the amount recorded in Q4 2015 was lower
than in Q4 2014 (EUR 35 million in Q4 2015 versus
EUR 66 million in Q4 214). In addition, Q4 2014 included
a EUR 25 million goodwill impairment.
The operating result declined by EUR 224 million compared
with the fourth quarter of 2014 and the underlying cost/income
ratio increased by 9.4 percentage points to 74.5%. If the
regulatory levies had been divided equally over the quarters,
the cost/income ratio would have been 66% in Q4 2015
(versus 62% in Q4 2014).
Impairment charges on loans and other receivables amounted
to EUR 124 million in Q4 2015, down by EUR 57 million
compared with the same quarter in 2014. Continued
improved economic conditions in the Netherlands are
reflected in the gradually declining impaired portfolio,
which resulted in lower impairment charges.
The cost of risk for mortgages remained low with a charge
of 2bps for the fourth quarter of 2015 compared with 5bps
in the same quarter of the previous year.
Impairment charges on corporate loans increased in Q4 2015
compared with Q4 2014. Impairment charges in Commercial
Clients further improved but was more than offset by the
increase in International Clients mainly at Large Corporates.
ECT impairment charges declined to EUR 31 million in Q4
2015 from EUR 37 million at Q4 2014.
The underlying cost of risk amounted to 19bps in Q4 2015,
down from 27bps in Q4 2014. Compared with Q3 2015,
the cost of risk went up by 5bps.
International resultsOperating income from international activities grew by 2%
compared with the fourth quarter of 2014 and represents 20%
of overall operating income. The higher contribution made by
international activities was driven mainly by volume growth
in foreign ECT Clients in combination with increased income
at Capital Markets Solutions - Clearing and higher net fee
and commission income in the international Private Banking
activities due mainly to growth in Germany and France.
Full year operating income grew by 10%. Growth was mainly
in Capital Markets Solutions - Clearing, International Clients
and Private Banking (due partly to the full-year contribution
in 2015 of the acquired German private banking activities
of Credit Suisse, consolidated as of 1 September 2014).
Full-year 2015 resultsUnderlying profit for 2015 amounted to EUR 1,924 million,
up EUR 373 million compared with the previous year. The
increase was mainly due to lower loan impairments and
higher operating income.
The underlying return on equity (ROE) increased to 12.0% in
2015, compared with 10.9% in 2014.

ABN AMRO Group Quarterly Report fourth quarter 2015
13
IntroductionRisk, funding &
capital information
Other
Financial results / Operating and financial review
Financial results
Net interest income rose marginally to EUR 6,076 million in
2015 compared with EUR 6,023 million in 2014. The net
interest income development was impacted by several
negative one-offs in 2015 (including a provision for the
Euribor mortgages legal claim) and one-offs with a positive
impact in 2014.
The underlying increase was primarily driven by improved
margins on loans (mainly mortgages and, to a lesser extent,
corporate loans) and higher average corporate loan volumes.
The average volume of residential mortgages, however, was
lower. In addition, lower funding costs due to lower credit
spreads were partly offset by higher liquidity buffer costs.
Net fee and commission income, at EUR 1,829 million in 2015,
was EUR 138 million higher than in 2014. The increase was
primarily recorded in Private Banking, due to a favourable
stock market performance, and in Corporate Banking on
higher transaction volumes at Clearing.
Other operating income amounted to EUR 550 million in 2015,
up by EUR 209 million compared with the previous year. The
increase was primarily driven by higher CVA/DVA/FVA results
(EUR 76 million positive in 2015 versus EUR 58 million
negative in 2014), favourable hedge accounting-related
results at Group Functions as a result of interest rate
movements, and higher tax-exempt results at Equity
Participations on the back of improved market conditions.
This was partly offset by a one-off tax-exempt provision in
Group Functions related to the part of securities financing
activities discontinued in 2009 and a provision in Corporate
Banking for an identified group of SMEs with possible
interest rate derivative-related issues.
Personnel expenses amounted to EUR 2,492 million in 2015,
up EUR 96 million compared with the previous year. Pension
expenses were higher in 2015 due to lower discount rates.
Additionally, personnel expenses for our international
activities increased mainly as a result of FX rate developments.
Personnel expenses in 2014 were positively impacted by
releases from the employee benefits provision. Comparable
restructuring provisions were included in 2014 and 2015.
Other expenses rose by EUR 283 million to EUR 2,736 million.
The increase was driven by EUR 129 million higher
regulatory levies and higher project costs related to
enhancing client centricity and continuous improvement of
products, services and IT processes (including TOPS 2020
and Retail Digitalisation programmes). In 2015, a
EUR 55 million settlement with Vestia was recorded. These
increases were partly offset by a considerable VAT refund
which was the result of discussions with the tax authorities
related to the period 2007-2014.
The operating result improved marginally to EUR 3,227 million,
up by EUR 21 million compared with the same period last
year, and the underlying cost/income ratio increased by
1.6 percentage points to 61.8%.
Impairment charges on loans and other receivables amounted
to EUR 505 million, EUR 666 million lower than in 2014.
Lower impairment charges were recorded on all portfolios
due to improvement in the risk profile of the portfolios on the
back of improved economic circumstances. This also led to
IBNI releases, which are detemined based on recent loan
losses in the portfolio. The decreasing loan loss levels
resulted in an IBNI release of EUR 221 million in 2015
compared with an IBNI addition of EUR 22 million in 2014.
The underlying cost of risk amounted to 19bps in 2015,
down from 45bps in 2014.
The effective tax rate in 2015, at 29%, was negatively
impacted by a reassessment of our tax position.

ABN AMRO Group Quarterly Report fourth quarter 2015
14
IntroductionRisk, funding &
capital information
Other
Financial results / Operating and financial review
Financial results
Balance sheet Condensed consolidated statement of financial position
(in millions) 31 December 2015 30 September 2015 31 December 2014
Cash and balances at central banks 26,195 20,738 706
Financial assets held for trading 1,706 8,592 9,017
Derivatives 19,138 20,695 25,285
Financial investments 40,542 40,412 41,466
Securities financing 20,062 35,475 18,511
Loans and receivables - banks 15,680 17,794 21,680
Loans and receivables - customers 259,319 261,742 261,910
Other 7,676 7,839 8,292
Total assets 390,317 413,287 386,867
Financial liabilities held for trading 459 2,940 3,759
Derivatives 22,425 24,624 30,449
Securities financing 11,372 25,901 13,918
Due to banks 14,630 18,487 15,744
Due to customers 230,297 228,529 216,011
Issued debt 76,207 79,126 77,131
Subordinated liabilities 9,708 9,660 8,328
Other 7,635 6,927 6,652
Total liabilities 372,733 396,193 371,990
Equity attributable to the owners of the parent company 16,575 16,089 14,865
Capital securities 993 993
Equity attributable to non-controlling interests 17 12 12
Total equity 17,584 17,094 14,877
Total liabilities and equity 390,317 413,287 386,867
Main developments in total assets compared with 30 September 2015Total assets declined by EUR 23.0 billion to
EUR 390.3 billion at 31 December 2015, due mainly
to a decline in Securities financing assets.
Cash and balances at central banks went up by
EUR 5.5 billion as part of the liquidity buffer.
Financial assets held for trading at 31 December 2015
decreased by EUR 6.9 billion to EUR 1.7 billion compared
with 30 September 2015, mainly due to a decrease in
government bonds.
Derivatives went down by EUR 1.6 billion at
31 December 2015 compared with 30 September 2015,
mainly reflecting the impact of interest rate movements.
This is also observed in derivative liabilities.
Financial investments was EUR 40.5 billion at
31 December 2015, virtually stable compared with
30 September 2015.
Securities financing declined by EUR 15.4 billion compared
with 30 September 2015, to EUR 20.1 billion at
31 December 2015. This decline is related to the cyclicality
of the business, as clients wind down their positions
towards year-end.
Loans and receivables - banks at 31 December 2015
decreased by EUR 2.1 billion compared with
30 September 2015, partly as a result of lower cash
collateral pledged due to the decrease of the financial
liabilities held for trading.

ABN AMRO Group Quarterly Report fourth quarter 2015
15
IntroductionRisk, funding &
capital information
Other
Financial results / Operating and financial review
Financial results
Loans and receivables - customers
(in millions) 31 December 2015 30 September 2015 31 December 2014
Residential mortgages 146,932 148,535 148,402
Consumer loans 15,147 15,409 16,052
Corporate loans to clients1 78,195 80,874 80,065
Total client loans2 240,274 244,818 244,519
Loans to professional counterparties 12,194 9,165 9,635
Other loans3 6,357 7,255 6,777
Total Loans and receivables - customers2 258,825 261,238 260,931
Fair value adjustments from hedge accounting 4,849 5,028 5,739
Less: loan impairment allowance 4,355 4,524 4,761
Total Loans and receivables - customers 259,319 261,742 261,910
1 Corporate loans excluding loans to professional counterparties.2 Gross carrying amount excluding fair value adjustment from hedge accounting.3 Other loans consists of loans and receivables to government, official institutions and financial markets parties.
Loans and receivables - customers decreased by
EUR 2.4 billion compared with 30 September 2015 mainly
due to a decline in Residential mortgages.
Residential mortgages declined to EUR 146.9 billion, down
by EUR 1.6 billion compared with 30 September 2015.
The market share in new mortgage production declined
to 16% in Q4 2015 driven by fierce competition on longer
interest rate periods. Redemptions were higher due to
increased refinancing, whereas extra repayments in 2015
returned to the same levels as previous years. Low
interest rates and increased awareness among
homeowners of the possibility of residual debt are still
incentives for extra redemptions. Contractual repayments
are gradually growing, following the amended tax
regulations. As a result, redemptions exceeded new
mortgage production.
Corporate loans to clients decreased due to the
reallocation of part of the public sector loan portfolio from
Corporate Banking to Group Functions (EUR 2.3 billion).
This reallocation is related to the specific expertise
required to manage risks, other than credit risk, associated
with these longer dated loans. Corporate Banking will
continue to manage client relationships. As a result of
this reallocation, the portfolio was moved to loans to
professional counterparties.
Other loans declined to EUR 6.4 billion, driven mainly
by lower volumes at Capital Markets Solutions.
Main developments in total liabilities compared with 30 September 2015Total liabilities declined by EUR 23.5 billion compared with
30 September 2015, due mainly to decreased Securities
financing volumes.
Financial liabilities held for trading came down by
EUR 2.5 billion due to decreased short positions in bonds.
Derivative liabilities decreased by EUR 2.2 billion to
EUR 22.4 billion at 31 December 2015, mainly reflecting
the impact of interest rate movements.
Securities financing decreased by EUR 14.5 billion
compared with 30 September 2015 to EUR 11.4 billion
at 31 December 2015. The decline is related to the
cyclicality of the business as clients wind down their
positions towards year-end.
Due to banks banks decreased by EUR 3.9 billion mainly
as a result of declined money market positions.

ABN AMRO Group Quarterly Report fourth quarter 2015
16
IntroductionRisk, funding &
capital information
Other
Financial results / Operating and financial review
Financial results
Due to customers
(in millions) 31 December 2015 30 September 2015 31 December 2014
Retail Banking 98,674 98,996 95,915
Private Banking 66,465 66,665 62,902
Corporate Banking 62,850 60,498 54,740
Group Functions 2,308 2,369 2,454
Total Due to customers 230,297 228,529 216,011
Demand deposits 119,109 115,956 109,753
Saving deposits 92,472 94,233 88,655
Time deposits 18,555 18,183 17,459
Total deposits 230,136 228,372 215,867
Other due to customers 160 156 144
Total Due to customers 230,297 228,529 216,011
Due to customers increased by EUR 1.8 billion, mainly driven
by a EUR 2.4 billion growth of deposits at Corporate
Banking, partly offset by a decline at Retail Banking and
Private Banking (EUR 0.3 billion and EUR 0.2 billion,
respectively). The combined market share of 21%1 in retail
deposits at Retail Banking and Private Banking in the
Netherlands at 31 December 2015 was stable compared
with 30 September 2015.
Issued debt decreased by EUR 2.9 billion to
EUR 76.2 billion at 31 December 2015 as the need for
wholesale funding declined.
Total equity rose to EUR 17.6 billion at 31 December 2015
mainly as a result of the fourth quarter reported profit.
Main developments of total assets and liabilities compared with 31 December 2014Total assets increased by EUR 3.4 billion to
EUR 390.3 billion at 31 December 2015 from
EUR 386.9 billion at 31 December 2014, due mainly to
higher cash and balances at central banks, partly offset
by lower financial assets held for trading, derivatives and
loans and receivables - banks.
Total liabilities increased marginally by EUR 0.7 billion to
EUR 372.7 billion at 31 December 2015 compared with
EUR 372.0 billion at 31 December 2014. The increase in
due to customers and subordinated liabilities was largely
offset by a decline in derivatives, financial liabilities held
for trading, securities financing, due to banks and issued
debt.
Total equity rose by EUR 2.7 billion to EUR 17.6 billion, due
mainly to the reported profit for 2015 and, to a lesser
extent, the inaugural launch of EUR 1 billion of capital
securities qualifying as Additional Tier 1 capital.
1 Source: De Nederlandsche Bank

ABN AMRO Group Quarterly Report fourth quarter 2015
17
IntroductionRisk, funding &
capital information
Other
Financial results / Results by segment
Financial results
The results by segment section includes a discussion and analysis of the results of operations and of the financial condition of ABN AMRO Group at segment level for the fourth quarter of 2015 compared with the fourth quarter of 2014, on the basis of underlying results. A large part of the interest expenses and operating expenses incurred by Group Functions are allocated to the business lines through net interest income and other expenses, respectively.
Retail Banking Operating results
(in millions) Q4 2015 Q4 2014 Change Q3 2015 Change 2015 2014 Change
Net interest income 805 885 -9% 853 -6% 3,302 3,379 -2%
Net fee and commission income 132 124 6% 133 -0% 527 522 1%
Other operating income 5 14 -67% 3 61% 25 41 -40%
Operating income 941 1,024 -8% 988 -5% 3,853 3,942 -2%
Personnel expenses 120 186 -35% 121 -0% 487 560 -13%
Other expenses 495 411 21% 389 27% 1,619 1,475 10%
Operating expenses 616 597 3% 510 21% 2,106 2,035 3%
Operating result 325 427 -24% 478 -32% 1,748 1,907 -8%
Impairment charges on loans and other receivables 9 99 -91% 52 -82% 99 460 -79%
Operating profit/(loss) before taxation 316 328 -4% 426 -26% 1,649 1,447 14%
Income tax expense 89 90 -1% 108 -17% 423 368 15%
Underlying profit/(loss) for the period 227 238 -5% 319 -29% 1,226 1,079 14%
Special items
Reported profit/(loss) for the period 227 238 -5% 319 -29% 1,226 1,079 14%
Results by segment
Results by segment Results by segment (Engels)

ABN AMRO Group Quarterly Report fourth quarter 2015
18
IntroductionRisk, funding &
capital information
Other
Financial results / Results by segment
Financial results
Retail Banking’s underlying profit was EUR 227 million,
a decline of EUR 11 million compared with the fourth
quarter of 2014. This decline was mainly the result of
lower net interest income and higher regulatory levies.
Net interest income declined by EUR 80 million compared
with Q4 2014 to EUR 805 million in Q4 2015. This was
largely driven by provisions taken related to legal claims
(including Euribor mortgages) in Q4 2015 and a positive
one-off item in Q4 2014.
Margins on residential mortgages improved compared
with Q4 2014, due to the gradual repricing of the
residential mortgage book. In particular, mortgages which
where originated pre-crisis had low margins. This was
partly offset by lower average residential mortgage loan
volumes. Compared with Q3 2015 the repricing effect
levelled off.
Net interest income on consumer loans decreased due
to lower average loan volumes and lower margins.
Net interest income on deposits remained relatively stable
compared with Q4 2014. Modestly higher average savings
volumes were offset by slightly lower margins.
Net fee and commission income increased slightly compared
with the same quarter of the previous year.
Personnel expenses declined by EUR 66 million to
EUR 120 million in Q4 2015 compared with
EUR 186 million in Q4 2014. This was due largely to
a restructuring provision of EUR 60 million in 2014.
Excluding the restructuring provision, personnel expenses
declined EUR 6 million due to a lower average number
of staff employed in Retail Banking following a further
reduction in branches.
Other expenses were up EUR 84 million in Q4 2015.
The regulatory levies in Q4 2015 were EUR 48 million
higher compared with Q4 2014 (EUR 87 million versus
EUR 39 million). Excluding the regulatory levies, other
expenses increased by EUR 36 million. This was mainly
attributable to higher project costs (including the Retail
Digitalisation programme).
Operating result decreased by EUR 102 million in Q4 2015
to EUR 325 million. The underlying cost/income ratio
increased by 7.1 percentage points to 65.4%. If the
regulatory levies had been divided equally over the
quarters, the cost/income ratio would have been 59%
in Q4 2015 (55% in Q4 2014).
Impairment charges on loans and other receivables were
EUR 9 million in Q4 2015, down EUR 90 million from
Q4 2014. The decline in impairments is visible in both
the consumer loan portfolio and the mortgage portfolio.
Impairments on the mortgage portfolio decreased on the
back of improved conditions in the housing market. In
addition, the recovery of the Dutch economy contributed
to a lower inflow of mortgages in the impaired portfolio,
increased outflow and an improvement of the portfolio’s
risk profile. Consumer loans also benefited from improved
economic circumstances and active risk management of
the portfolio of clients in arrears, leading to significantly
lower loan impairments.
ABN AMRO Group Quarterly Report fourth quarter 2015
19
IntroductionRisk, funding &
capital information
Other
Financial results / Results by segment
Financial results
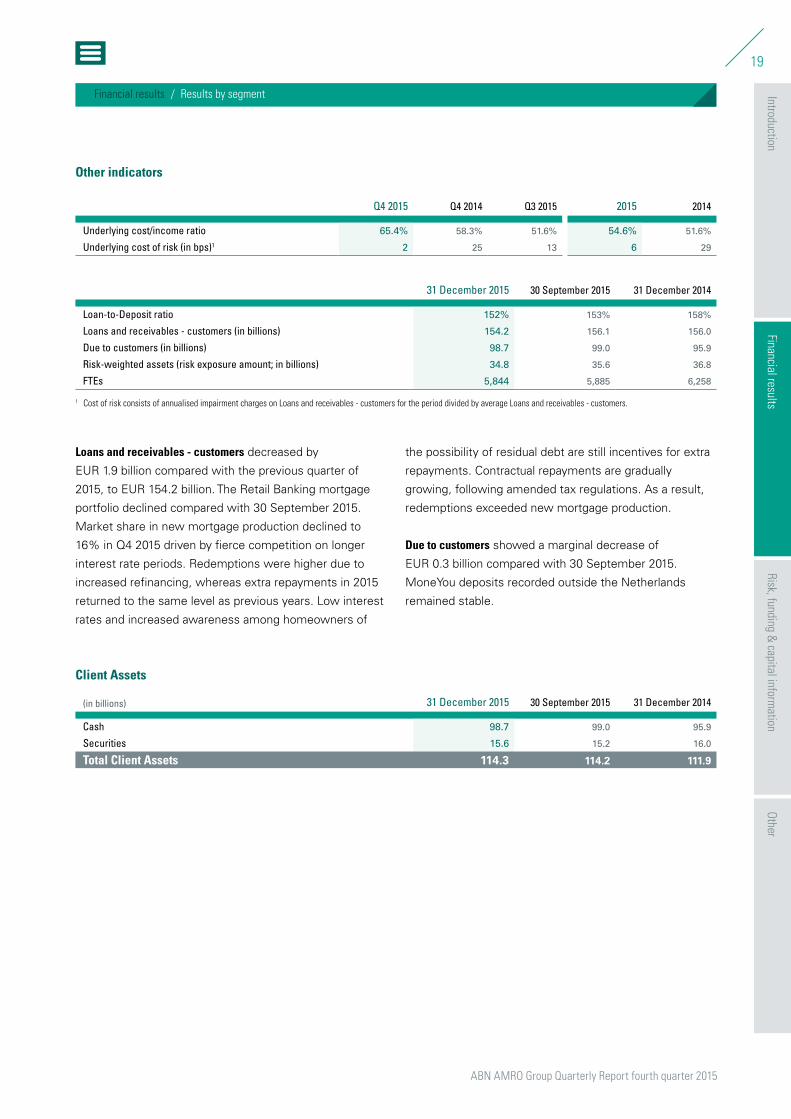
Other indicators
Q4 2015 Q4 2014 Q3 2015 2015 2014
Underlying cost/income ratio 65.4% 58.3% 51.6% 54.6% 51.6%
Underlying cost of risk (in bps)1 2 25 13 6 29
31 December 2015 30 September 2015 31 December 2014
Loan-to-Deposit ratio 152% 153% 158%
Loans and receivables - customers (in billions) 154.2 156.1 156.0
Due to customers (in billions) 98.7 99.0 95.9
Risk-weighted assets (risk exposure amount; in billions) 34.8 35.6 36.8
FTEs 5,844 5,885 6,258
1 Cost of risk consists of annualised impairment charges on Loans and receivables - customers for the period divided by average Loans and receivables - customers.
Loans and receivables - customers decreased by
EUR 1.9 billion compared with the previous quarter of
2015, to EUR 154.2 billion. The Retail Banking mortgage
portfolio declined compared with 30 September 2015.
Market share in new mortgage production declined to
16% in Q4 2015 driven by fierce competition on longer
interest rate periods. Redemptions were higher due to
increased refinancing, whereas extra repayments in 2015
returned to the same level as previous years. Low interest
rates and increased awareness among homeowners of
the possibility of residual debt are still incentives for extra
repayments. Contractual repayments are gradually
growing, following amended tax regulations. As a result,
redemptions exceeded new mortgage production.
Due to customers showed a marginal decrease of
EUR 0.3 billion compared with 30 September 2015.
MoneYou deposits recorded outside the Netherlands
remained stable.
Client Assets
(in billions) 31 December 2015 30 September 2015 31 December 2014
Cash 98.7 99.0 95.9
Securities 15.6 15.2 16.0
Total Client Assets 114.3 114.2 111.9

ABN AMRO Group Quarterly Report fourth quarter 2015
20
IntroductionRisk, funding &
capital information
Other
Financial results / Results by segment
Financial results
As of Q4 2015 the gross margin on client assets is
included for Private Banking. Gross margin on client
assets is defined as operating income for the period
divided by average client assets for the period.
Operating results
(in millions) Q4 2015 Q4 2014 Change Q3 2015 Change 2015 2014 Change
Net interest income 149 156 -5% 147 1% 589 597 -1%
Net fee and commission income 149 140 6% 149 0% 619 544 14%
Other operating income 20 4 18 12% 101 51 98%
Operating income 318 301 6% 314 1% 1,310 1,193 10%
Personnel expenses 119 123 -3% 133 -10% 501 460 9%
Other expenses 160 156 3% 136 18% 549 503 9%
Operating expenses 279 279 0% 269 4% 1,050 964 9%
Operating result 39 21 81% 45 -14% 260 229 13%
Impairment charges on loans and other receivables 6 -12 5 15% -4 23
Operating profit/(loss) before taxation 33 33 -2% 40 -18% 264 206 28%
Income tax expense 6 19 -67% 12 -46% 49 46 6%
Underlying profit/(loss) for the period 26 15 82% 28 -6% 214 160 34%
Special items
Reported profit/(loss) for the period 26 15 82% 28 -6% 214 160 34%
Private Banking’s underlying profit increased by EUR 11 million
compared with the fourth quarter of 2014 to EUR 26 million
in Q4 2015. The increase was due to higher operating income
in Q4 2015. In addition, Q4 2014 was impacted by a high
effective tax rate due to tax-exempt one-offs.
Net interest income decreased to EUR 149 million in Q4 2015,
down by EUR 7 million compared with Q4 2014. Higher
average deposit volumes were more than offset by lower
margins on deposits.
Net fee and commission income increased to EUR 149 million
in Q4 2015, up by EUR 9 million compared with the same
quarter of the previous year. Net fees increased due to higher
average client assets.
Other operating income in Q4 2015 was EUR 16 million higher
due mainly to a provision for a legal claim in Q4 2014.
Personnel expenses decreased by EUR 4 million to
EUR 119 million in Q4 2015. Personnel expenses in the
international activities in particular were lower due to a one-off
release in Q4 2015. Q3 2015 included a restructuring provision
related to the integration of the Jersey office into Guernsey.
Private Banking

ABN AMRO Group Quarterly Report fourth quarter 2015
21
IntroductionRisk, funding &
capital information
Other
Financial results / Results by segment
Financial results
Other expenses increased by EUR 4 million compared with Q4
2014. The regulatory levies in Q4 2015 were EUR 7 million
higher compared with Q4 2014 (EUR 11 million versus
EUR 4 million). The fourth quarter of 2015 also included higher
project costs related to enhancing client centricity and client
documentation and continuous improvement of products,
services and IT processes. A goodwill impairment of
EUR 25 million was included in Q4 2014.
Operating result increased by EUR 18 million to EUR 39 million
in Q4 2015 compared with EUR 21 million in Q4 2014.
The underlying cost/income ratio for Private Banking amounted
to 87.9% in Q4, a decrease of 5.0 percentage points
compared with Q4 2014. If the regulatory levies had been
divided equally over the quarters, the cost/income ratio would
have been 85% compared with 92% in Q4 2014.
Impairment charges on loans and other receivables increased
by EUR 18 million to EUR 6 million compared with
EUR 12 million negative in Q4 2014. Q4 2014 included
a release on a single client.
Other indicators
Q4 2015 Q4 2014 Q3 2015 2015 2014
Underlying cost/income ratio 87.9% 92.9% 85.7% 80.2% 80.8%
Underlying cost of risk (in bps)1 14 -28 12 -2 14
Gross margin on client assets (in bps) 64 64 62 65 67
31 December 2015 30 September 2015 31 December 2014
Loan-to-Deposit ratio 25% 25% 26%
Loans and receivables - customers (in billions) 16.6 16.5 16.7
Due to customers (in billions) 66.5 66.7 62.9
Risk-weighted assets (risk exposure amount; in billions) 8.2 8.7 8.3
FTEs 3,722 3,684 3,599
1 Annualised impairment charges on Loans and receivables - customers for the period divided by average Loans and receivables - customers.
Loans and receivables - customers remained virtually stable
at EUR 16.6 billion compared with 30 September 2015.
Due to customers showed a limited decrease of
EUR 0.2 billion compared with 30 September 2015.

ABN AMRO Group Quarterly Report fourth quarter 2015
22
IntroductionRisk, funding &
capital information
Other
Financial results / Results by segment
Financial results
Client Assets
(in billions) Q4 2015 Q3 2015 Q4 2014
Opening balance Client Assets 191.3 206.1 187.5
Net new assets -0.4 -3.3 0.3
Market performance 8.3 -11.5 2.7
Closing balance Client Assets 199.2 191.3 190.6
31 December 2015 30 September 2015 31 December 2014
Breakdown by type
Cash 66.5 66.9 63.6
Securities 132.8 124.4 127.0
- of which Custody 35.0 31.6 31.3
Total 199.2 191.3 190.6
Breakdown by geography
The Netherlands 48% 48% 47%
Rest of Europe 44% 43% 44%
Rest of the world 8% 9% 9%
Client assets grew to EUR 199.2 billion at
31 December 2015 compared with EUR 191.3 billion at
30 September 2015. This was due mainly to improved
market performance.
Net new assets (NNA) in Q4 2015 was EUR 0.4 billion
negative as net outflow was recorded outside the
eurozone, which was partly offset by net inflow in the
eurozone. The NNA in Q3 2015 was impacted by the
outflow of custody assets of a single client.

ABN AMRO Group Quarterly Report fourth quarter 2015
23
IntroductionRisk, funding &
capital information
Other
Financial results / Results by segment
Financial results
Corporate Banking
Operating results
(in millions) Q4 2015 Q4 2014 Change Q3 2015 Change 2015 2014 Change
Net interest income 545 545 -0% 515 6% 2,142 2,019 6%
Net fee and commission income 186 176 6% 187 -0% 751 646 16%
Other operating income 3 59 -94% 60 -94% 227 173 31%
Operating income 734 780 -6% 762 -4% 3,120 2,839 10%
Personnel expenses 166 158 5% 166 0% 676 618 9%
Other expenses 418 329 27% 283 48% 1,264 1,116 13%
Operating expenses 584 487 20% 449 30% 1,940 1,734 12%
Operating result 151 293 -49% 313 -52% 1,180 1,105 7%
Impairment charges on loans and other receivables 109 97 12% 41 419 717 -42%
Operating profit/(loss) before taxation 42 196 -79% 273 -85% 762 388 96%
Income tax expense 17 52 -67% 54 -68% 165 91 83%
Underlying profit/(loss) for the period 24 144 -83% 218 -89% 596 298 100%
Special items
Reported profit/(loss) for the period 24 144 -83% 218 -89% 596 298 100%
Corporate Banking’s underlying profit decreased by
EUR 120 million compared with Q4 2014 to EUR 24 million
in Q4 2015. This was due mainly to higher regulatory
levies in Q4 2015 and a further provision for an identified
group of SMEs with possible derivative-related issues.
Net interest income remained stable at EUR 545 million in
Q4 2015 compared with Q4 2014. A marginal decline at
Commercial Clients was offset by a small increase at
International Clients.
Commercial Clients posted a decline in net interest
income of EUR 5 million to EUR 340 million in Q4 2015.
The margins on loans and average deposit volumes
increased, while deposit margins decreased compared
with the same quarter in 2014. Average loan volumes also
decreased due to the reallocation of part of the public
sector loan portfolio to Group Functions.
Net interest income at International Clients increased
modestly by EUR 6 million compared with Q4 2014. ECT
Clients showed steady growth of net interest income in
line with previous quarters. In general, there is increasing
pressure on deposit margins.

ABN AMRO Group Quarterly Report fourth quarter 2015
24
IntroductionRisk, funding &
capital information
Other
Financial results / Results by segment
Financial results
Net interest income in Capital Markets Solutions
decreased by EUR 1 million to EUR 29 million in Q4 2015.
Net fee and commission income showed an increase of
EUR 10 million compared with Q4 2014, rising to
EUR 186 million.
Other operating income declined by EUR 56 million to
EUR 3 million in Q4 2015. The decrease was driven by a
further provision for an identified group of SMEs with
possible derivative-related issues at Capital Markets
Solutions. Q4 2014 included a EUR 40 million gain at
Clearing on the partial sale of its share in Holland Clearing
House. CVA/DVA/FVA impact improved compared with Q4
2014 (EUR 15 million positive in Q4 2015 versus EUR 15
million negative in Q4 2014) and the tax-exempt results by
Equity Participations increased on the back of improved
market conditions.
Personnel expenses amounted to EUR 166 million, up by
EUR 8 million compared with the same period last year.
This was due mainly to higher personnel expenses at
International Clients.
Other expenses rose by EUR 89 million compared with Q4
2014. The regulatory levies in Q4 2015 were EUR 73 million
higher compared with Q4 2014 (EUR 122 million versus
EUR 49 million). The remainder of the increase was due
mainly to higher project costs related to enhancing client
centricity and continuous improvement of products,
services and IT processes (including the TOPS 2020
programme).
Operating result was EUR 151 million in the fourth quarter
of 2015, down EUR 142 million compared with the same
period in 2014. The underlying cost/income ratio increased
to 79.5% in Q4 2015, from 62.4% in Q4 2014. If the Q4
regulatory levies had been divided equally over the
quarters, the cost/income ratio would have been 67%
in Q4 2015 (58% in Q4 2014).
Impairment charges on loans and other receivables
amounted to EUR 109 million, up by EUR 12 million
compared with Q4 2014.
Impairment charges in Commercial Clients decreased
substantially by EUR 96 million to EUR 3 million in Q4
2015. The specific loan impairments for Commercial
Clients declined sharply compared to the fourth quarter
of 2014. In addition, an IBNI release of EUR 35 million
was recorded in Q4 2015.
Loan impairments in International Clients were
EUR 103 million, which is EUR 106 million higher than in
Q4 2014. This was mainly the result of a higher level of
impairment charges at Large Corporates, mainly seen in
the Retail industry sector, in combination with
EUR 20 million IBNI additions. In the fourth quarter of
2015, the impairment charges for ECT amounted to
EUR 31 million compared with EUR 37 million in the same
period in 2014. In Q4 2014 International Clients benefited
from releases on a limited number of files.
Loan impairments in Capital Markets Solutions were limited.

ABN AMRO Group Quarterly Report fourth quarter 2015
25
IntroductionRisk, funding &
capital information
Other
Financial results / Results by segment
Financial results
Other indicators
Q4 2015 Q4 2014 Q3 2015 2015 2014
Underlying cost/income ratio 79.5% 62.4% 58.9% 62.2% 61.1%
Underlying cost of risk (in bps)1 50 46 17 46 86
31 December 2015 30 September 2015 31 December 2014
Loan-to-Deposit ratio 121% 129% 143%
Loans and receivables - customers (in billions) 80.6 85.5 85.0
Due to customers (in billions) 62.9 60.5 54.7
Risk-weighted assets (risk exposure amount; in billions) 55.1 56.8 53.5
FTEs 4,959 5,013 4,995
1 Annualised impairment charges on Loans and receivables - customers for the period divided by average Loans and receivables - customers.
Loans and receivables - customers decreased to
EUR 80.6 billion at 31 December 2015 compared with
EUR 85.5 billion at 30 September 2015. The decline was
driven by lower volumes at Commercial Clients and
Capital Markets Solutions. The decline at Commercial
Clients was mainly due to the reallocation of part of the
public sector loan portfolio (EUR 2.3 billion) from
Corporate Banking to Group Functions. This reallocation is
related to the specific expertise required to manage the
risks, other than credit risk, associated with these longer
dated loans. Corporate Banking continues to manage
client relationships.
Due to customers amounted to EUR 62.9 billion at
31 December 2015, up EUR 2.4 billion compared with
30 September 2015. This was mainly the result of
increased deposit volumes at Commercial Clients
(EUR 1.2 billion increase) and International Clients
(EUR 0.9 billion increase).

ABN AMRO Group Quarterly Report fourth quarter 2015
26
IntroductionRisk, funding &
capital information
Other
Financial results / Results by segment
Financial results
Corporate Banking - Commercial ClientsOperating results
(in millions) Q4 2015 Q4 2014 Change Q3 2015 Change 2015 2014 Change
Net interest income 340 345 -1% 305 11% 1,305 1,275 2%
Net fee and commission income 50 49 1% 53 -5% 205 196 5%
Other operating income -9 9 7 13 30 -56%
Operating income 381 404 -6% 365 4% 1,524 1,502 1%
Operating expenses 248 229 8% 202 22% 861 788 9%
Operating result 133 175 -24% 163 -18% 663 713 -7%
Impairment charges on loans and other receivables 3 99 -97% -17 213 605 -65%
Operating profit/(loss) before taxation 130 76 71% 180 -28% 450 108
Income tax expense 42 21 99% 45 -7% 121 27
Underlying profit/(loss) for the period 89 55 60% 135 -35% 329 82
Special items
Reported profit/(loss) for the period 89 55 60% 135 -35% 329 82
Other indicators
Q4 2015 Q4 2014 Q3 2015 2015 2014
Underlying cost/income ratio 65.0% 56.7% 55.3% 56.5% 52.5%
Underlying cost of risk (in bps)1 3 96 -17 53 145
31 December 2015 30 September 2015 31 December 2014
Loans and receivables - customers (in billions) 35.3 38.1 38.1
Due to customers (in billions) 34.8 33.6 31.7
Risk-weighted assets (risk exposure amount; in billions) 21.5 22.0 20.8
1 Annualised impairment charges on Loans and receivables - customers for the period divided by average Loans and receivables - customers.

ABN AMRO Group Quarterly Report fourth quarter 2015
27
IntroductionRisk, funding &
capital information
Other
Financial results / Results by segment
Financial results
Corporate Banking - International ClientsOperating results
(in millions) Q4 2015 Q4 2014 Change Q3 2015 Change 2015 2014 Change
Net interest income 176 170 3% 172 2% 709 648 9%
Net fee and commission income 66 59 12% 54 22% 232 217 7%
Other operating income 31 -8 21 48% 104 3
Operating income 272 220 24% 246 11% 1,044 868 20%
Operating expenses 157 118 34% 121 30% 522 456 14%
Operating result 115 103 12% 125 -8% 522 412 27%
Impairment charges on loans and other receivables 103 -3 58 77% 191 113 69%
Operating profit/(loss) before taxation 12 105 -88% 68 -82% 331 299 11%
Income tax expense -5 31 3 40 67 -41%
Underlying profit/(loss) for the period 17 74 -77% 65 -74% 292 232 26%
Special items
Reported profit/(loss) for the period 17 74 -77% 65 -74% 292 232 26%
Other indicators
Q4 2015 Q4 2014 Q3 2015 2015 2014
Underlying cost/income ratio 57.8% 53.4% 49.0% 50.0% 52.6%
Underlying cost of risk (in bps)1 122 -4 69 57 40
31 December 2015 30 September 2015 31 December 2014
Loans and receivables - customers (in billions) 32.2 32.2 32.2
Due to customers (in billions) 19.0 18.1 16.7
Risk-weighted assets (risk exposure amount; in billions) 22.6 22.8 19.9
1 Annualised impairment charges on Loans and receivables - customers for the period divided by average Loans and receivables - customers.

ABN AMRO Group Quarterly Report fourth quarter 2015
28
IntroductionRisk, funding &
capital information
Other
Financial results / Results by segment
Financial results
Corporate Banking - Capital Markets SolutionsOperating results
(in millions) Q4 2015 Q4 2014 Change Q3 2015 Change 2015 2014 Change
Net interest income 29 30 -5% 38 -25% 127 96 33%
Net fee and commission income 71 68 4% 80 -12% 314 233 35%
Other operating income -18 58 32 110 140 -21%
Operating income 82 156 -48% 150 -46% 551 469 18%
Operating expenses 179 140 27% 125 43% 555 489 13%
Operating result -97 16 25 -3 -20 84%
Impairment charges on loans and other receivables 4 1 -0 15 -1
Operating profit/(loss) before taxation -101 15 25 -18 -19 6%
Income tax expense -19 1 7 6 -4
Underlying profit/(loss) for the period -81 14 18 -24 -15 -57%
Special items
Reported profit/(loss) for the period -81 14 18 -24 -15 -57%
Other indicators
Q4 2015 Q4 2014 Q3 2015 2015 2014
Underlying cost/income ratio 218.8% 89.9% 83.3% 100.6% 104.3%
Underlying cost of risk (in bps)1 13 3 -2 9 -1
31 December 2015 30 September 2015 31 December 2014
Financial assets held for trading (in billions) 1.7 8.5 8.9
Loans and receivables - customers (in billions) 13.1 15.3 14.7
Financial liabilities held for trading (in billions) 0.5 2.9 3.8
Due to customers (in billions) 9.1 8.8 6.3
Risk-weighted assets (risk exposure amount; in billions) 11.0 12.0 12.8
1 Annualised impairment charges on Loans and receivables - customers for the period divided by average Loans and receivables - customers.

ABN AMRO Group Quarterly Report fourth quarter 2015
29
IntroductionRisk, funding &
capital information
Other
Financial results / Results by segment
Financial results
Group Functions
Operating results
(in millions) Q4 2015 Q4 2014 Change Q3 2015 Change 2015 2014 Change
Net interest income -2 33 8 44 28 56%
Net fee and commission income -13 -10 -38% -18 27% -68 -21
Other operating income 73 17 55 33% 197 75
Operating income 58 40 45% 45 29% 172 82 111%
Personnel expenses 234 182 29% 200 17% 828 758 9%
Other expenses -184 -148 -24% -193 5% -695 -641 -8%
Operating expenses 49 33 48% 7 133 117 14%
Operating result 9 7 29% 38 -77% 39 -35
Impairment charges on loans and other receivables -0 -3 99% -4 99% -8 -28 71%
Operating profit before taxation 9 10 -10% 42 -79% 48 -7
Income tax expense 15 6 133% 99 -85% 160 -21
Underlying profit/(loss) for the period -6 3 -56 89% -112 14
Special items -417
Reported profit/(loss) for the period -6 3 -56 89% -112 -402 72%
The underlying result of Group Functions was a loss of
EUR 6 million in the fourth quarter of 2015 compared
with a profit of EUR 3 million in Q4 2014.
Net interest income decreased to EUR 2 million negative
in Q4 2015 compared with EUR 33 million positive in
Q4 2014. The decrease of net interest income was mainly
due to a higher cash level in the liquidity buffer. This was
partly offset by the replacement of maturing funding with
relatively high spreads by new cheaper funding.
Net fee and commission income decreased by EUR 3 million,
mainly driven by higher fees paid to Capital Markets
Solutions related to Securities Financing activities. The
client-related part of the operating income of Securities
Financing activities is allocated to Capital Markets
Solutions via net fee and commission income.
Other operating income went up by EUR 56 million
compared with the same period in the previous year.
This was mainly the result of higher hedge accounting-
related results.
Personnel expenses increased to EUR 234 million in
Q4 2015 from EUR 182 million in the same quarter
in 2014. This was mainly due to higher additions to
restructuring provisions in Q4 2015 compared with
Q4 2014, a modest increase in the number of FTEs
in 2015, and the fact that Q4 2014 was positively
impacted by adjustments to employee benefits.

ABN AMRO Group Quarterly Report fourth quarter 2015
30
IntroductionRisk, funding &
capital information
Other
Financial results / Results by segment
Financial results
Other expenses decreased by EUR 36 million compared
with the same period in 2014. Group Functions had higher
project costs related to enhancing client centricity and
continuous improvement of products, services and IT
processes (including Retail Digitalisation programmes).
This was, however, offset by the fact that more operating
expenses were allocated to the commercial segments
(visible as negative expenses). Other expenses in both
years were positively impacted in Q4 by releases
of the Deposit Guarantee Scheme provision for DSB
(EUR 35 million in Q4 2015 compared with EUR 66 million
in Q4 2014) and cost savings generated by the TOPS 2020
programme.
Income tax in Q3 2015 was negatively impacted by the
reassessment of our tax position.
Other indicators
31 December 2015 30 September 2015 31 December 2014
Securities financing - assets 15.5 29.5 14.5
Loans and receivables - customers (in billions) 7.9 3.6 4.2
Securities financing - liabilities 10.2 23.6 12.6
Due to customers (in billions) 2.3 2.4 2.5
Risk-weighted assets (risk exposure amount; in billions) 9.9 9.5 11.0
FTEs 7,522 7,518 7,362
Securities financing assets decreased by EUR 14.0 billion
and Securities financing liabilities decreased by
EUR 13.4 billion compared with 30 September 2015.
These declines were related to the cyclicality of the
business as clients wind down their positions in the
fourth quarter.
Loans and receivable - customers increased to EUR 7.9 billion
at 31 December 2015, mainly as a result of the reallocation
of part of the public sector loan portfolio from Corporate
Banking to Group Functions to address the specific
expertise required to manage the risks, other than credit
risk, associated with these longer dated loans. Corporate
Banking continues to manage client relationships.

ABN AMRO Group Quarterly Report fourth quarter 2015
31
IntroductionRisk, funding &
capital information
Other
Financial results / Additional financial information
Financial results
Additional financial informationOverview of results in the last five quarters
The following table provides an overview of the
quarterly results.
Quarterly results
(in millions) Q4 2015 Q3 2015 Q2 2015 Q1 2015 Q4 2014
Net interest income 1,497 1,524 1,511 1,545 1,620
Net fee and commission income 454 449 456 470 431
Other operating income 101 136 159 154 95
Operating income 2,052 2,109 2,126 2,168 2,145
Personnel expenses 640 619 615 619 650
Other expenses 889 615 632 600 748
Operating expenses 1,528 1,234 1,247 1,219 1,397
Operating result 524 875 879 949 748
Impairment charges on loans and other receivables 124 94 34 252 181
Operating profit/(loss) before taxation 399 781 845 697 567
Income tax expense 128 272 244 154 167
Underlying profit/(loss) for the period 272 509 600 543 400
Special items
Reported profit/(loss) for the period 272 509 600 543 400
Difference between underlying and reported resultsTo provide a better understanding of the underlying
results, ABN AMRO adjusts its reported results for
defined special items and material divestments.
Special items are material and non-recurring items
which are not related to normal business activities.
As of 2014, ABN AMRO has a higher materiality threshold
to qualify as a special item.
Adjustments include past results from material divestments
and the related transaction result. No material divestments
took place in the reported periods in this report.
The following table presents the reconciliation from
underlying to reported results.
Additional financial information Additional financial information (Engels)

ABN AMRO Group Quarterly Report fourth quarter 2015
32
IntroductionRisk, funding &
capital information
Other
Financial results / Additional financial information
Financial results
Reconciliation from underlying to reported results
2015 2014
(in millions) UnderlyingSpecial
items Reported UnderlyingSpecial
items Reported
Net interest income 6,076 6,076 6,023 6,023
Net fee and commission income 1,829 1,829 1,691 1,691
Other operating income 550 550 341 341
Operating income 8,455 8,455 8,055 8,055
Personnel expenses 2,492 2,492 2,396 288 2,684
Other expenses 2,736 2,736 2,453 201 2,654
Operating expenses 5,228 5,228 4,849 489 5,338
Operating result 3,227 3,227 3,206 -489 2,717
Impairment charges on loans and other receivables 505 505 1,171 1,171
Operating profit/(loss) before taxation 2,722 2,722 2,035 -489 1,546
Income tax expense 798 798 484 -72 412
Profit/(loss) for the period 1,924 1,924 1,551 -417 1,134
Special items
(in millions) Q3 2015 Q2 2015 Q1 2015 Q4 2014 Q3 2014 Q2 2014 Q1 2014
Operating income
Total impact on Operating Income
Operating expenses
Pension settlement charge 288
SNS Levy 67 67 67
Total impact on Operating expenses 67 355 67
Loan impairments
Total impact on Loan impairments
Total impact on Income tax expense -72
Total impact on result for the period -67 -283 -67
The SNS levy amounted to a total of EUR 201 million
recorded in 2014, spread over the first three quarters
of 2014.

33
IntroductionFinancial results
OtherRisk, funding &
capital information
Key developments 34
Credit risk 37
Operational risk 58
Market risk 59
Liquidity risk 61
Funding 63
Capital management 66
Risk, funding & capital information
Risk, funding & capital information

ABN AMRO Group Quarterly Report fourth quarter 2015
34
IntroductionFinancial results
OtherRisk, funding &
capital information
Risk, funding & capital information / Key developments
Key developments
Key figures
31 December 2015 30 September 2015 31 December 2014
Total assets 390,317 413,287 386,867
Of which Residential mortgages 150,009 151,670 151,998
Of which Consumer loans 14,587 14,790 15,398
Of which Corporate loans 88,367 88,028 87,866
Total Exposure at Default (EAD) 369,169 376,828 350,762
Total RWA (REA)/total EAD 29.3% 29.4% 31.3%
Regulatory capital
Total RWA (REA) 108,001 110,602 109,647
Of which Credit risk1 86,063 88,564 87,667
Of which Operational risk 16,227 16,227 16,168
Of which Market risk 5,710 5,810 5,811
Fully-loaded CET1 ratio 15.5% 14.8% 14.1%
Fully-loaded leverage ratio 3.8% 3.5% 3.7%
Credit quality indicators
Forbearance ratio3 3.5% 3.7% 3.5%
Past due ratio3 1.9% 1.9% 2.3%
Impaired ratio3 2.7% 2.7% 2.9%
Coverage ratio3 55.8% 56.6% 53.6%
Cost of risk (year to date, in bps) - underlying2 19 19 45
Liquidity and funding indicators
Loan-to-Deposit ratio 108.9% 110.2% 116.5%
LCR >100% >100% >100%
NSFR >100% >100% >100%
1 RWA (REA) for credit value adjustment (CVA) is included in credit risk. CVA per 31 December 2015 amounted to EUR 1.1 billion (30 September 2015 EUR 1.1 billion; 31 December 2014 EUR 1.3 billion).
2 Annualised impairment charges on Loans and receivables - customers for the period divided by average Loans and receivables - customers.3 Loans and receivables - customers only.
Q4 2015 Q4 2014 Q3 2015
Underlying cost of risk (in bps) 19 27 14
Fourth-quarter developmentsIn the fourth quarter of 2015 gross domestic product
(GDP) in the Netherlands grew by 0.3%, totalling to 1.9%
year-on-year. The increase is related entirely to a rise in
consumption and investments. The revival of investments
was partly driven by an improvement of manufacturing
capacity utilisation. Growth in consumption is being
fueled by a rise in the real disposable income of family
households, which is due to the fact that wages are rising
faster than inflation.
Key developments Key developments (Engels)

ABN AMRO Group Quarterly Report fourth quarter 2015
35
IntroductionFinancial results
OtherRisk, funding &
capital information
Risk, funding & capital information / Key developments
The continued improvement of Dutch economic conditions
is reflected in the gradual decline of the impaired portfolio,
which resulted in lower impairment charges. Total impairment
charges on loans and other receivables declined by
EUR 57 million amounting to EUR 124 million in Q4 2015,
compared with EUR 181 million in the same period
last year. This decline was mainly the result of lower
impairment charges in the Consumer loans portfolio
and, to a lesser extent, the Residential mortgage portfolio,
offset partly by an increase in impairment charges for
Corporate loans.
Total impairment charges for Q4 2015 remained in line
with the annualised Impairment charges in Q3 2015, as
a result of which the cost of risk remained at the same
level (19bps) in Q4 2015. Compared with Q4 2014 the
cost of risk improved to 19bps from 45bps in Q4 2015,
due to considerably lower Impairment charges.
The Residential mortgage portfolio, which includes a fair
value adjustment for hedge accounting, decreased by
EUR 1.7 billion, amounting to a total of EUR 150.0 billion
at 31 December 2015. The decline in Residential
mortgages was the result of repayments on existing
mortgage loans exceeding new production of mortgage
loans. The Consumer loan and Corporate loan portfolios
remained relatively stable at 31 December compared
with 30 September 2015.
The forbearance ratio improved in the fourth quarter,
amounting to 3.5% at 31 December 2015, compared
with 3.7% at 30 September 2015. The ratio declined
mainly as a result of debt repayments on existing forborne
contracts. The past due ratio remained at 1.9% in the
fourth quarter of 2015. The impaired ratio remained at the
same level in this period. The coverage ratio declined to
55.8% in the fourth quarter of 2015, compared with
56.6% at 30 September 2015.
Total RWA decreased by EUR 2.6 billion to EUR 108.0 billion
at 31 December 2015, compared with EUR 110.6 billion
at 30 September 2015. This movement was mainly related
to credit risk. The decline in RWA was mainly the result
of a decrease of EUR 1.7 billion in Corporate Banking.
Total Exposure at Default declined by EUR 7.7 billion,
arriving at EUR 369.2 billion on 31 December 2015,
compared with EUR 376.8 billion at 30 September 2015.
The decline was mainly attributable to adjusted calculations
for markets exposures at Capital Markets Solutions within
Corporate Banking, and lower business volumes at Retail
Banking, and was partly offset by an increase at Group
Functions due to a rise in deposits at central banks.
The Liquidity Coverage Ratio (LCR) and the Net Stable
Funding Ratio (NSFR) both remained above 100% in the
final quarter of 2015. This is in line with the bank’s targeted
early compliance with future regulatory requirements.
The LtD ratio showed a steady decrease throughout 2015.
This is reflected in the gradual increase of the cash position
throughout 2015.
During 2015, ABN AMRO raised EUR 14.3 billion in
long-term wholesale funding (including EUR 2.8 billion
subordinated debt), of which EUR 2.9 billion in the final
quarter of 2015. The average remaining maturity of
long-term wholesale funding increased during 2015 from
4.3 to 4.6 years, mainly due to the issuance of long-term
secured funding in the third quarter of 2015. In the final
quarter of 2015, the average remaining maturity remained
stable at 4.6 years.

ABN AMRO Group Quarterly Report fourth quarter 2015
36
IntroductionFinancial results
OtherRisk, funding &
capital information
Risk, funding & capital information / Key developments
Quarterly developments
120
90
60
30
0
-30
Cost of risk per business segment(end-of-period, in bps)
Retail Banking Private Banking
GroupCorporate Banking
Q3 15 Q4 15Q4 14 Q1 15 Q2 15
75
60
45
30
15
63 64
5561
Coverage ratioConsumer loans (in %)
61
Q3 15 Q4 15Q4 14 Q1 15 Q2 15
75
60
45
30
15
65 63 6460 62
Coverage ratioCorporate loans (in %)
Q3 15 Q4 15Q4 14 Q1 15 Q2 15
10
8
6
4
20.8 0.8 0.7
Impaired ratioResidential mortgages (in %)
0.91.0
Q3 15 Q4 15Q4 14 Q1 15 Q2 15
10
8
6
4
2
5.4 5.3 5.7
Impaired ratioConsumer loans (in %)
5.45.4
Q3 15 Q4 15Q4 14 Q1 15 Q2 15
10
8
6
4
2
5.8 5.7
Impaired ratioCorporate loans (in %)
5.95.9
Q3 15 Q4 15Q4 14 Q1 15 Q2 15
5.5
200
160
120
80
4018 21
58
Underlying cost of risk per productCorporate loans (in bps)
99
39
Q3 15 Q4 15Q4 14 Q1 15 Q2 15
500
400
300
200
100
EAD per business segment(end-of-period, in billions)
365.0 377.6 376.8 369.1350.8
Q3 15 Q4 15Q4 14 Q1 15 Q2 15
Corporate Banking
Private BankingRetail Banking
Group Functions
150
120
90
60
30
RWA (REA) per business segment(end-of-period, in billions)
Corporate Banking
Private BankingRetail Banking
Group Functions
114.9 110.6 108.0109.6 113.4
Q3 15 Q4 15Q4 14 Q1 15 Q2 15
8
4
0
-4
-8
-12
-7
6
2
Underlying cost of risk per product1
Residential mortgages (in bps)
35
Q3 15 Q4 15Q4 14 Q1 15 Q2 15
1 Annualised impairment charges on Loans and receivables for the period divided by average Loans and receivables excluding fair value adjustments from hedge accounting.
200
150
100
50
0
-50
Underlying cost of risk per productConsumer loans (in bps)
4355
-18
27
182
Q3 15 Q4 15Q4 14 Q1 15 Q2 15
75
60
45
30
15
27 26 2428
Coverage ratioResidential mortgages (in %)
28
Q3 15 Q4 15Q4 14 Q1 15 Q2 15
1 Annualised impairment charges on Loans and receivables - customers for the period divided by average Loans and receivables - customers excluding fair value adjustments from hedge accounting.

ABN AMRO Group Quarterly Report fourth quarter 2015
37
IntroductionFinancial results
OtherRisk, funding &
capital information
Risk, funding & capital information / Credit risk
Credit risk
80,000
85,000
90,000
95,000
100,000
31 December2014
Delta 30 September2015
Businessvolume
Modelchanges
Other 31 December2015
86,06387,667 897 -1,949
77 -63088,564
RWA flow statement credit risk(in millions)
RWA declined from EUR 88.6 billion at 30 September 2015
to EUR 86.1 billion at 31 December 2015. The decline was
mainly attributable to Corporate Banking.
Credit risk Credit risk (Engels)

ABN AMRO Group Quarterly Report fourth quarter 2015
38
IntroductionFinancial results
OtherRisk, funding &
capital information
Risk, funding & capital information / Credit risk
Reporting scope risk
31 December 2015 30 September 2015 31 December 2014
(in millions)
Gross carrying amount
Loan impairment allowance
Carrying amount
Gross carrying amount
Loan impairment allowance
Carrying amount
Gross carrying amount
Loan impairment allowance
Carrying amount
Loans and receivables - banks 15,682 2 15,680 17,796 3 17,794 21,680 21,680
Residential mortgages 150,333 324 150,009 152,044 374 151,670 152,536 538 151,998
Less: Fair value adjustment from hedge accounting on residential mortgages 3,401 3,401 3,509 3,509 4,134 4,134
Residential mortgages, excluding fair value adjustments 146,932 324 146,608 148,535 374 148,161 148,402 538 147,864
Consumer loans 15,147 561 14,587 15,409 620 14,790 16,052 654 15,398
Corporate loans 86,312 3,380 82,932 86,136 3,421 82,715 86,299 3,439 82,860
Less: Fair value adjustment from hedge accounting on corporate loans 1,448 1,448 1,519 1,519 1,605 1,605
Corporate loans, excluding fair value adjustments 84,864 3,380 81,484 84,618 3,421 81,196 84,694 3,439 81,255
Other loans and receivables - customers1 11,882 90 11,792 12,676 109 12,567 11,783 129 11,654
Less: Fair value adjustment from hedge accounting on other loans and receivables - customers 1 1 -3 -3 -16 -16
Other loans and receivables - customers, excluding fair value adjustments1 11,881 90 11,791 12,679 109 12,570 11,799 129 11,669
Total loans and receivables - customers, excluding fair value adjustments 258,824 4,355 254,469 261,241 4,524 256,717 260,947 4,761 256,186
Fair value adjustments on Loans and receivables - customers 4,850 4,850 5,025 5,025 5,724 5,724
Total loans and receivables - customers 263,674 4,355 259,319 266,266 4,524 261,742 266,670 4,761 261,910
1 Other loans and receivables - customers consists of Government and official institutions, Financial lease receivables and Factoring.
The table above gives an overview of the figures reported
in the consolidated balance sheet (net) and the figures
reported in the Risk Management chapter (gross).

ABN AMRO Group Quarterly Report fourth quarter 2015
39
IntroductionFinancial results
OtherRisk, funding &
capital information
Risk, funding & capital information / Credit risk
Credit risk mitigation
CollateralStarting in the fourth quarter of 2015, we are reporting the
value of collateral based on its Net Collateral Value (NCV).
NCV expresses the value of collateral in the event of
a forced sale and is equal to the expected recovery
value of the collateral pledged to the bank.
A surplus for guarantees will no longer be included
after 31 December 2015, as the debtor can only be
liable for the maximum debt.
Collateral & guarantees received as security as at 31 December 20151
31 December 2015Collateral received
(in millions)Carrying amount
Master netting agree-ment4
Financial instru-ments
Property &
equipment
Other collateral
and guarantees
Total risk mitigation
Surplus collateral5
Net exposure6
Loans and receivables - banks 15,680 7,282 1,742 4 9,027 1,332 7,984
Loans and receivables - customers
Residential mortgages2 146,608 160 180,455 7,812 188,427 56,291 14,472
Consumer loans 14,587 6,474 5,462 53 11,990 4,583 7,180
Corporate loans2 81,484 3,920 29,721 42,638 13,006 89,284 24,931 17,131
Other loans and receivables - customers3 11,791 748 2,590 3,006 1,406 7,750 842 4,883
Fair value adjustment from hedge accounting 4,850 4,850
Total Loans and receivables - customers 259,319 4,668 38,944 231,561 22,277 297,450 86,647 48,515
Total Loans and receivables 274,998 11,950 40,686 231,561 22,281 306,477 87,978 56,5001 As of year-end 2015, a refined methodology for collateral reporting has been applied. Previous figures have been adjusted.2 Carrying amount includes loan impairment allowances.3 Other loans and receivables - customers consists of Government and official institutions, Financial lease receivables and Factoring.4 Collateral in the column Master netting agreement is mainly markets related and consists of master netting agreements which also includes cash collateral as part of these agreements.
Cash collateral not part of master netting agreements has been reported under Financial instruments.5 Surplus collateral is the amount of over-collateralisation, calculated on an individual basis.6 Net exposure represents the portfolio corrected for the surplus amount and gives a view on the potential shortfall in collateral on the total portfolio.

ABN AMRO Group Quarterly Report fourth quarter 2015
40
IntroductionFinancial results
OtherRisk, funding &
capital information
Risk, funding & capital information / Credit risk
Collateral & guarantees received as security as at 30 September 20151
30 September 2015
Collateral received
(in millions)Carrying amount
Master netting
agreement4
Financial instru-ments
Property &
equipment
Other collateral
and guarantees
Total risk mitigation
Surplus collateral5
Net exposure6
Loans and receivables - banks 17,794 8,217 334 2 8,553 9,241
Loans and receivables - customers
Residential mortgages2 148,161 81 209,411 4,655 214,148 74,231 8,245
Consumer loans 14,790 4,290 5,181 33 9,505 1,142 6,427
Corporate loans2 81,196 3,104 20,130 39,309 13,737 76,280 18,012 22,929
Other loans and receivables - customers3 12,570 1,057 4,540 2,981 1,626 10,204 2,631 4,997
Fair value adjustment from hedge accounting 5,025 5,025
Total Loans and receivables - customers 261,742 4,161 29,042 256,882 20,051 310,136 96,017 47,622
Total Loans and receivables 279,536 12,378 29,376 256,882 20,053 318,690 96,017 56,863
1 As of year-end 2015, a refined methodology for collateral reporting has been applied. Previous figures have been adjusted.2 Carrying amount includes loan impairment allowances.3 Other loans and receivables - customers consists of Government and official institutions, Financial lease receivables and Factoring.4 Collateral in the column Master netting agreement is mainly markets related and consists of master netting agreements which also includes cash collateral as part of these agreements.
Cash collateral not part of master netting agreements has been reported under Financial instruments. 5 Surplus collateral is the amount of over-collateralisation, calculated on an individual basis.6 Net exposure represents the portfolio corrected for the surplus amount and gives a view on the potential shortfall in collateral on the total portfolio.
Collateral & guarantees received as security as at 31 December 20141
31 December 2014
Collateral received
(in millions)Carrying amount
Master netting
agreement4
Financial instru-ments
Property &
equipment
Other collateral
and guarantees
Total risk mitigation
Surplus collateral5
Net exposure6
Loans and receivables - banks 21,680 9,850 9,850 11,830
Loans and receivables - customers
Residential mortgages2 147,864 25 98 205,730 5,072 210,925 71,635 8,574
Consumer loans 15,398 139 4,361 5,260 48 9,807 1,422 7,013
Corporate loans2 81,255 3,121 26,146 30,749 8,434 68,450 18,083 30,888
Other loans and receivables - customers3 11,669 1,585 4,008 2,866 2,488 10,946 2,287 3,010
Fair value adjustment from hedge accounting 5,724 5,724
Total Loans and receivables - customers1 261,910 4,870 34,613 244,605 16,041 300,129 93,427 55,208
Total Loans and receivables 283,590 14,720 34,613 244,605 16,041 309,979 93,427 67,038
1 As of year-end 2015, a refined methodology for collateral reporting has been applied. Previous figures have been adjusted.2 Carrying amount includes loan impairment allowances.3 Other loans and receivables - customers consists of Government and official institutions, Financial lease receivables and Factoring.4 Collateral in the column Master netting agreement is mainly markets related and consists of master netting agreements which also includes cash collateral as part of these agreements.
Cash collateral not part of master netting agreements has been reported under Financial instruments.5 Surplus collateral is the amount of over-collateralisation, calculated on an individual basis.6 Net exposure represents the portfolio corrected for the surplus amount and gives a view on the potential shortfall in collateral on the total portfolio.

ABN AMRO Group Quarterly Report fourth quarter 2015
41
IntroductionFinancial results
OtherRisk, funding &
capital information
Risk, funding & capital information / Credit risk
Fourth quarter developments Total net exposure of Total Loans and receivables -
customers increased to EUR 48.5 billion at 31 December
2015, an increase of EUR 0.9 billion from EUR 47.6 billion
at 30 September 2015. This increase is mainly the result
of the implementation of the NCV valuation method.
Total risk mitigation for residential mortgages decreased
by EUR 25.7 billion, amounting to EUR 188.4 billion at
31 December 2015, compared with EUR 214.1 billion
at 30 September 2015. This decrease is mainly the result
of the implementation of the NCV valuation method.
Although total risk mitigation decreased significantly,
the increase of net exposure was limited. The effect
of the NCV valuation method was most noticeable for
existing surplus collateral. Surplus collateral is over-
collateralisation, serving as additional security in case
the collateral value declines.
The impact of the NCV valuation method on Other loans
and receivables - customers is visible, as total risk mitigation
decreased by EUR 2.4 billion and surplus collateral by
EUR 1.8 billion.
Total net exposure of Total Loans and receivables -
customers decreased by EUR 6.7 billion, coming
down from EUR 55.2 billion at 31 December 2014 to
EUR 48.5 billion at 31 December 2015. This decrease is
mainly attributable to improved collateral reporting offset
by the implementation of the NCV valuation method.
Management of forborne, past due and impaired loans
Forborne loansThe following table provides an overview of forborne
assets, broken down into performing and non-performing
assets, specified by type of forbearance measure.
Clients in (potential) financial difficulty, for whom contract
amendments that are considered concessions on the
part of the bank have been made since 1 January 2012,
are accounted for as forborne assets. Contracts that
are in a recovery phase at the reporting date are not
considered forborne.
Overview forbearance as at 31 December 2015
31 December 2015
Gross carrying amount
Performing assets Non-performing assets Total
(in millions)
Temporary modifica-
tion
Permanent modifica-
tion
Refi-nanc-
ing Total
Temporary modifica-
tion
Permanent modifica-
tion
Refi-nanc-
ing Total
Total forborne
assets
Forbear-ance ratio
Loans and receivables - banks 15,682 0.0%
Loans and receivables - customers
Residential mortgages 146,932 1,122 23 204 1,349 354 14 39 408 1,757 1.2%
Consumer loans 15,147 174 77 174 426 105 72 47 223 648 4.3%
Corporate loans 84,864 1,368 1,330 1,244 3,941 594 839 902 2,335 6,276 7.4%
Other loans and receivables - customers1, 2 11,881 110 39 148 109 124 2 235 383 3.2%
Total Loans and receivables - customers 258,824 2,775 1,468 1,622 5,865 1,162 1,049 990 3,201 9,065 3.5%
Total1 274,506 2,775 1,468 1,622 5,865 1,162 1,049 990 3,201 9,065 3.3%1 Gross carrying amount excludes fair value adjustments from hedge accounting.2 Other loans and receivables - customers consists of Government and official institutions, Financial lease receivables and Factoring.

ABN AMRO Group Quarterly Report fourth quarter 2015
42
IntroductionFinancial results
OtherRisk, funding &
capital information
Risk, funding & capital information / Credit risk
Overview forbearance as at 30 September 2015
30 September 2015
Gross carrying amount
Performing assets Non-performing assets Total
(in millions)
Temporary modifica-
tion
Permanent modifica-
tion
Refi-nanc-
ing Total
Temporary modifica-
tion
Permanent modifica-
tion
Refi-nanc-
ing Total
Total forborne
assets
Forbear-ance ratio
Loans and receivables - banks 17,796 0.0%
Loans and receivables - customers
Residential mortgages 148,535 1,125 14 195 1,334 401 25 39 464 1,798 1.2%
Consumer loans 15,409 152 68 156 377 120 65 52 238 614 4.0%
Corporate loans 84,618 1,272 1,270 1,739 4,280 719 1,006 990 2,715 6,995 8.3%
Other loans and receivables - customers1, 2 12,679 99 24 123 117 71 5 193 316 2.5%
Total Loans and receivables - customers1 261,241 2,649 1,376 2,090 6,114 1,357 1,166 1,087 3,610 9,724 3.7%
Total1 279,038 2,649 1,376 2,090 6,114 1,357 1,166 1,087 3,610 9,724 3.4%
1 Gross carrying amount excludes fair value adjustments from hedge accounting.2 Other loans and receivables - customers consists of Government and official institutions, Financial lease receivables and Factoring.
Overview forbearance as at 31 December 2014
31 December 2014
Gross carrying amount
Performing assets Non-performing assets Total
(in millions)
Temporary modifica-
tion
Permanent modifica-
tion
Refi-nanc-
ing Total
Temporary modifica-
tion
Permanent modifica-
tion
Refi-nanc-
ing Total
Total forborne
assets
Forbear-ance ratio
Loans and receivables - banks 21,680 0.0%
Loans and receivables - customers
Residential mortgages 148,402 1,027 28 122 1,177 606 3 29 638 1,814 1.2%
Consumer loans 16,052 92 68 126 286 99 32 52 184 470 2.9%
Corporate loans 84,694 1,215 872 1,823 3,910 729 878 1,181 2,788 6,698 7.9%
Other loans and receivables - customers1, 2 11,799 23 24 64 4 68 92 0.8%
Total Loans and receivables - customers 260,947 2,358 968 2,071 5,397 1,498 917 1,262 3,677 9,074 3.5%
Total1 282,627 2,358 968 2,071 5,397 1,498 917 1,262 3,677 9,074 3.2%
1 Gross carrying amount excludes fair value adjustments from hedge accounting.2 Other loans and receivables - customers consists of Government and official institutions, Financial lease receivables and Factoring.

ABN AMRO Group Quarterly Report fourth quarter 2015
43
IntroductionFinancial results
OtherRisk, funding &
capital information
Risk, funding & capital information / Credit risk
Fourth quarter developments The total forborne assets decreased from EUR 9.7 billion at
30 September 2015 to EUR 9.1 billion at 31 December 2015.
This decline was mainly attributable to developments
within the Corporate loan portfolio. Total forborne assets
within Residential mortgages and Consumer loans have
remained fairly stable since 30 September 2015.
Total forborne for Corporate loans decreased significantly,
amounting to EUR 6.3 billion at 31 December 2015,
compared with EUR 7.0 billion at 30 September 2015.
This decline was mainly the result of debt repayments on
existing forborne contracts with refinancing measures in
the performing portfolio, primarily relating to one specific
client in the real estate sector. To a lesser extent, the
decrease in exposure is related to debt repayments by
several clients in the industrial goods and services sector.
Total forborne Corporate loans within the non-performing
portfolio amounted to EUR 2.3 billion at 31 December 2015,
declining from EUR 2.7 billion at 30 September 2015,
mainly due to the outflow of forborne exposure.
Total forborne for Other loans and receivables - customers
increased slightly to EUR 0.4 billion at 31 December 2015,
coming from EUR 0.3 billion at 30 September 2015.
Comparing year-end 2015 with year-end 2014, total forborne
exposure remained stable.
Past due loansFinancial assets past due but not impaired as at 31 December 2015
31 December 2015Carrying amount Days past due
(in millions) Gross
Assets not classified
as impaired < 30> 30 days
& < 60> 60 days
& < 90 > 90
Total past due but not
impairedPast due
ratio
Loans and receivables - banks 15,682 15,680 0.0%
Loans and receivables - customers
Residential mortgages1 146,932 145,900 2,354 322 70 30 2,776 1.9%
Consumer loans 15,147 14,287 306 122 30 149 607 4.0%
Corporate loans1 84,864 79,992 610 134 9 323 1,076 1.3%
Other loans and receivables - customers2 11,881 11,671 187 36 17 160 400 3.4%
Total Loans and receivables - customers 258,824 251,852 3,457 614 126 662 4,858 1.9%
Total Loans and receivables 274,506 267,532 3,457 614 126 662 4,858 1.8%1 Gross carrying amount excludes fair value adjustments from hedge accounting.2 Other loans and receivables - customers consists of Government and official institutions, Financial lease receivables and Factoring.

ABN AMRO Group Quarterly Report fourth quarter 2015
44
IntroductionFinancial results
OtherRisk, funding &
capital information
Risk, funding & capital information / Credit risk
Financial assets past due but not impaired as at 30 September 2015
30 September 2015
Carrying amount Days past due
(in millions) Gross
Assets not classified
as impaired < 30> 30 days
& < 60> 60 days
& < 90 > 90
Total past due but not
impairedPast due
ratio
Loans and receivables - banks 17,796 17,795 0.0%
Loans and receivables - customers
Residential mortgages1 148,535 147,396 2,565 376 94 3,035 2.0%
Consumer loans 15,409 14,599 334 123 45 201 702 4.6%
Corporate loans1 84,618 79,668 578 135 56 452 1,221 1.4%
Other loans and receivables - customers2 12,676 12,455 32 5 2 20 58 0.5%
Total Loans and receivables - customers 261,241 254,120 3,508 638 197 672 5,016 1.9%
Total Loans and receivables 279,038 271,915 3,508 638 197 672 5,016 1.8%
1 Gross carrying amount excludes fair value adjustments from hedge accounting.2 Other loans and receivables - customers consists of Government and official institutions, Financial lease receivables and Factoring.
Financial assets past due but not impaired as at 31 December 2014
31 December 2014
Carrying amount Days past due
(in millions) Gross
Assets not classified
as impaired < 30> 30 days
& < 60> 60 days
& < 90 > 90
Total past due but not
impairedPast due
ratio
Loans and receivables - banks 21,680 21,680 0.0%
Loans and receivables - customers
Residential mortgages1 148,402 146,924 3,057 463 118 3,639 2.5%
Consumer loans 16,052 15,184 335 135 38 125 633 3.9%
Corporate loans1 84,694 79,704 924 182 51 590 1,747 2.1%
Other loans and receivables - customers2 11,799 11,533 72 8 3 12 94 0.8%
Total Loans and receivables - customers 260,947 253,346 4,388 788 210 727 6,114 2.3%
Total Loans and receivables 282,627 275,027 4,388 788 210 727 6,114 2.2%
1 Gross carrying amount excludes fair value adjustments from hedge accounting.2 Other loans and receivables - customers consists of Government and official institutions, Financial lease receivables and Factoring.
Fourth quarter developments Total Loans and receivables past due decreased marginally
at 31 December 2015, arriving at EUR 4.9 billion, compared
with EUR 5.0 billion at 30 September 2015.
With regard to Residential mortgages, Consumer loans
and Corporate loans portfolio, no major movements were
noted in this period.
Other loans and receivables - customers increased by
EUR 0.3 billion to EUR 0.4 billion at 31 December 2015.
This increase was mainly attributable to the fact that
we aligned the reporting view for lease contracts with
the bank-wide view on past-due exposure.
Total past due but not impaired for total loans and receivables
continued its downward trend, arriving at EUR 4.9 billion
at 31 December 2015 compared with EUR 6.1 billion
at year-end 2014. This was mainly the result of effective
credit monitoring and the improved Dutch economy.

ABN AMRO Group Quarterly Report fourth quarter 2015
45
IntroductionFinancial results
OtherRisk, funding &
capital information
Risk, funding & capital information / Credit risk
Impaired loans Coverage and impaired ratio as at 31 December 2015
31 December 2015
(in millions)Gross carrying
amountImpaired
exposures
Allowances for Impairments
for identified credit risk Coverage ratio Impaired ratio
Loans and receivables - banks 15,682 2 -2 100.0% 0.0%
Loans and receivables - customers
Residential mortgages 146,932 1,031 -245 23.8% 0.7%
Consumer loans 15,147 860 -471 54.8% 5.7%
Corporate loans 84,864 4,872 -3,098 63.6% 5.7%
Other loans and receivables - customers1, 2 11,881 210 -78 37.4% 1.8%
Total Loans and receivables - customers 258,824 6,973 -3,892 55.8% 2.7%
Total Loans and receivables3 274,506 6,974 -3,894 55.8% 2.5%
Securities financing 20,073 11 -11 100.0% 0.1%
Total on- and off-balance sheet 414,782 7,016 -3,909 55.7% 1.7%
1 Gross carrying amount excludes fair value adjustments from hedge accounting.2 Other loans and receivables - customers consists of Government and official institutions, Financial lease receivables and Factoring.3 Amounts excluding Incurred But Not Identified (IBNI).
Coverage and impaired ratio as at 30 September 2015
30 September 2015
(in millions)Gross carrying
amountImpaired
exposures
Allowances for Impairments
for identified credit risk Coverage ratio Impaired ratio
Loans and receivables - banks 17,796 2 -2 100.0% 0.0%
Loans and receivables - customers
Residential mortgages 148,535 1,139 -295 25.9% 0.8%
Consumer loans 15,409 811 -520 64.2% 5.3%
Corporate loans 84,618 4,950 -3,123 63.1% 5.8%
Other loans and receivables - customers1, 2 12,676 222 -96 43.4% 1.7%
Total Loans and receivables - customers 261,241 7,121 -4,034 56.6% 2.7%
Total Loans and receivables3 279,038 7,123 -4,036 56.7% 2.6%
Securities financing 35,485 10 -10 100.0% 0.0%
Total on- and off-balance sheet 436,829 7,171 -4,052 56.5% 1.6%
1 Gross carrying amount excludes fair value adjustments from hedge accounting.2 Other loans and receivables - customers consists of Government and official institutions, Financial lease receivables and Factoring.3 Amounts excluding Incurred But Not Identified (IBNI).

ABN AMRO Group Quarterly Report fourth quarter 2015
46
IntroductionFinancial results
OtherRisk, funding &
capital information
Risk, funding & capital information / Credit risk
Coverage and impaired ratio as at 31 December 2014
31 December 2014
(in millions)Gross carrying
amountImpaired
exposures
Allowances for Impairments
for identified credit risk Coverage ratio Impaired ratio
Loans and receivables - banks 21,680 0.0% 0.0%
Loans and receivables - customers
Residential mortgages 148,402 1,478 -408 27.6% 1.0%
Consumer loans 16,052 868 -533 61.4% 5.4%
Corporate loans 84,694 4,989 -3,017 60.5% 5.9%
Other loans and receivables - customers1, 2 11,799 265 -115 43.2% 2.2%
Total Loans and receivables - customers 260,947 7,601 -4,073 53.6% 2.9%
Total Loans and receivables3 282,627 7,601 -4,073 53.6% 2.7%
Securities financing 18,521 10 -10 100.0% 0.1%
Total on- and off-balance sheet 413,092 7,632 -4,089 53.6% 1.8%
1 Gross carrying amount excludes fair value adjustments from hedge accounting.2 Other loans and receivables - customers consists of Government and official institutions, Financial lease receivables and Factoring.3 Amounts excluding Incurred But Not Identified (IBNI).
Fourth quarter developments In the fourth quarter of 2015, impaired exposures and
Allowances for Impairments declined compared with
30 September 2015.
A growing number of loans managed in the restructuring
portfolio are flowing back into the regular portfolio, in line
with the improving conditions in the Dutch economy.
Nevertheless, some sectors are still facing issues of a
more permanent nature, for example certain Agri-sectors
and the Retail industry. The inflow of loans into the
non-performing portfolio is declining.
The coverage ratio for Total loans and receivables –
customers decreased to 55.8% at 31 December 2015,
compared with 56.6% the year before. The Impaired ratio
in this period remained stable at 2.7%.
The coverage ratio for the residential mortgages portfolio
decreased to 23.8% at 31 December 2015, coming from
25.9% at 30 September 2015. Both the Impaired portfolio
and Allowances for impairments decreased, although the
decrease of Allowances for impairments was relatively
larger. The Impaired exposure dropped, as there was lower
inflow into and higher outflow from the impaired portfolio.
The allowances decreased mainly due to the upswing in
the Dutch housing market and continually improving
economic circumstances, which led to a lower average
loss on foreclosures. The impaired ratio decreased
slightly to 0.7%, from 0.8% at 30 September 2015, mainly
as a result of a further decline of the impaired portfolio,
which totalled EUR 1.0 billion at 31 December 2015,
compared with EUR 1.1 billion at 30 September 2015.
Impaired exposures in the Consumer loan portfolio
increased slightly during the fourth quarter of 2015. The
impaired ratio increased to 5.7% at 31 December 2015,
compared with 5.3% at 30 September 2015. Allowances
for Impairments decreased slightly. These developments
resulted in a coverage ratio of 54.8% at 31 December 2015,
down from 64.2% at 30 September 2015.
Coverage ratio for Corporate loans increased slightly,
amounting to 63.6% at 31 December 2015, compared
with 63.1% at 30 September 2015, whereas the impaired
ratio remained relatively stable.
Compared with 31 December 2014, impaired exposures
decreased by EUR 0.6 billion to EUR 7.0 billion at
31 December 2015 and Allowances for Impairments
decreased by EUR 0.2 billion to EUR 3.9 billion at
31 December 2015.

ABN AMRO Group Quarterly Report fourth quarter 2015
47
IntroductionFinancial results
OtherRisk, funding &
capital information
Risk, funding & capital information / Credit risk
Loan impairment charges and allowances
Q4 2015
(in millions)Securities financing Banks
Corporate loans
Residential mortgages
Consumer loans Other loans Total
Balance at begin of period 10 3 3,530 374 620 1 4,537
Impairment charges for the period -0 -0 312 23 26 361
Reversal of impairment allowances no longer required -0 -186 -11 -21 -0 -219
Recoveries of amounts previously written-off -0 -1 -7 -11 -19
Total impairment charges on loans and other receivables -1 125 6 -7 -0 123
Amount recorded in interest income from unwinding of discounting -11 -10 -2 -23
Currency translation differences 31 -0 2 33
Amounts written-off (net) -0 -224 -46 -47 -317
Reserve for unearned interest accrued on impaired loans 11 2 13
Other adjustments -0 8 -4 -3 1
Balance at end of period 11 2 3,470 324 561 1 4,368
Reconciliation from reported to underlying impairment charges
Total reported on-balance sheet impairment charges on loans and other receivables -1 125 6 -7 -0 123Total underlying on-balance sheet impairment charges on loans and other receivables -1 125 6 -7 -0 123

ABN AMRO Group Quarterly Report fourth quarter 2015
48
IntroductionFinancial results
OtherRisk, funding &
capital information
Risk, funding & capital information / Credit risk
Q4 2014
(in millions)Securities financing Banks
Corporate loans
Residential mortgages
Consumer loans Other loans Total
Balance as at begin of period 10 3,690 599 644 132 5,074
Impairment charges for the period 381 88 111 7 587
Reversal of impairment allowances no longer required -289 -62 -31 -5 -387
Recoveries of amounts previously written off -7 -5 -7 -19
Total impairment charges on loans and other receivables 86 20 73 2 181
Amount recorded in interest income from unwinding of discounting -13 -15 -3 -31
Currency translation differences 1 7 -0 -0 8
Amounts written off (net) -358 -57 -57 -5 -476
Reserve for unearned interest accrued on impaired loans 8 12 -6 14
Other adjustments -0 19 -21 4 -0 1
Balance as at end of period 11 3,439 538 654 129 4,771
Reconciliation from reported to underlying impairment charges
Total reported on-balance impairment charges on loans and other receivables 86 20 73 2 181
Total underlying on-balance impairment charges on loans and other receivables 86 20 73 2 181
(in millions) Q4 2015 Q4 2014
On-balance sheet 123 181
Off-balance sheet 1 -1
Total impairment charges on loans and other receivables 124 181
Fourth quarter developments Compared with the fourth quarter of 2014, the on-balance
Impairment charges declined by EUR 58 million in the
fourth quarter of 2015, arriving at EUR 123 million on
31 December 2015. The decrease in Impairment charges
is the result of the continued improvement of economic
circumstances in the Netherlands.
The decrease in Impairment charges is mainly attributable
to improvement in Consumer loans and to a lesser extent
to Residential mortgages, and is partly offset by an
increase in Impairment charges for Corporate loans.
Impairment charges for Corporate loans increased by
EUR 39 million, amounting to EUR 125 million in the
fourth quarter of 2015, compared with EUR 86 million in
the same period last year. The increase in impairment
charges was largely concentrated in the International
Clients portfolio, mainly with regard to Large Corporates
and to a lesser extent to ECT Clients. Within Corporate
loans, the Commercial Clients portfolio slowly improved as
the inflow of loans managed in the restructuring portfolio
of Financial Restructuring & Recovery (FR&R) declined and
more files were transferred back to the performing portfolio.

ABN AMRO Group Quarterly Report fourth quarter 2015
49
IntroductionFinancial results
OtherRisk, funding &
capital information
Risk, funding & capital information / Credit risk
Impairment charges for Residential mortgages declined
by EUR 14 million compared with the last quarter of 2014,
arriving at EUR 6 million in the last quarter of 2015.
Since the end of 2014, the Dutch housing market has
continuously improved, driven by historically low interest
rates and a larger number of transactions compared with
last quarter of 2014. As a result, impairment charges for
the Residential Mortgage portfolio were lower in the last
quarter 2015 than they were in 2014.
In the fourth quarter of 2015, impairment charges for
Consumer loans decreased by EUR 80 million compared
with the same period last year. The impaired volume
decreased compared with a year ago, and as a result
the Impairment charges decreased.
Loan impairment charges and allowances over the full year
2015
(in millions)Securities financing Banks
Corporate loans
Residential mortgages
Consumer loans Other loans Total
Balance as at 1 January 11 0 3,439 538 654 129 4,771
Impairment charges for the period 1 1,096 137 160 1,394
Reversal of impairment allowances no longer required -0 -0 -643 -99 -76 -0 -818
Recoveries of amounts previously written-off -0 -7 -25 -42 -74
Total impairment charges on loans and other receivables -0 446 14 43 -0 502
Amount recorded in interest income from unwinding of discounting -45 -50 -10 -105
Currency translation differences 1 79 2 82
Amounts written-off (net) -0 -629 -174 -150 -953
Reserve for unearned interest accrued on impaired loans 59 12 71
Other adjustments -0 2 123 -5 12 -131 -0
Balance as at 31 December 11 2 3,470 324 561 1 4,368
Reconciliation from reported to underlying impairment charges
Total reported on-balance sheet impairment charges on loans and other receivables -0 0 446 14 43 -0 502Total underlying on-balance sheet impairment charges on loans and other receivables -0 446 14 43 -0 502

ABN AMRO Group Quarterly Report fourth quarter 2015
50
IntroductionFinancial results
OtherRisk, funding &
capital information
Risk, funding & capital information / Credit risk
2014
(in millions)Securities financing Banks
Corporate loans
Residential mortgages
Consumer loans Other loans Total
Balance as at 1 January 24 3,672 585 612 106 4,999
Impairment charges for the period 1 1,289 436 340 70 2,135
Reversal of impairment allowances no longer required -16 -562 -228 -81 -21 -908
Recoveries of amounts previously written-off -13 -11 -36 -60
Total impairment charges on loans and other receivables -15 714 197 223 49 1,168
Amount recorded in interest income from unwinding of discounting -47 -66 -11 -125
Currency translation differences 2 67 2 71
Amounts written-off (net) -984 -196 -182 -27 -1,389
Reserve for unearned interest accrued on impaired loans 37 39 -10 65
Other adjustments -0 -19 -20 22 -0 -17
Balance as at 31 December 11 3,439 538 654 129 4,771
Reconciliation from reported to underlying impairment charges
Total reported on-balance sheet impairment charges on loans and other receivables -15 714 197 223 49 1,168
Total underlying on-balance sheet impairment charges on loans and other receivables -15 714 197 223 49 1,168
(in millions) 2015 2014
On-balance sheet 502 1,168
Off-balance sheet 3 3
Total impairment charges on loans and other receivables 505 1,171
Developments over the full year The on-balance sheet impairment charges in 2015 declined
by EUR 666 million, amounting to EUR 502 million at
31 December 2015, compared with EUR 1,168 million
at 31 December 2014. Lower impairment charges were
noted across all of the portfolios and were partly due to
IBNI releases. ABN AMRO bases its IBNI levels on recent
losses in the portfolio. Decreasing loss levels resulted in
an IBNI release of EUR 221 million in 2015, representing
around a third of the decline in impairment charges.
Impairment charges for the Corporate loans portfolio
dropped by EUR 266 million, totalling EUR 446 million in
2015, compared with EUR 714 million in 2014. This decline
was mainly the result of a decrease in impairment charges
in the Commercial Clients portfolio, which was the result of
a combination of strict credit monitoring, a well-balanced
portfolio intake and the continued upturn of the economy.
The decline was partly offset by higher impairment charges
for International Clients. Impairment charges for the
Corporate loans portfolio included an IBNI release of
EUR 138 million.

ABN AMRO Group Quarterly Report fourth quarter 2015
51
IntroductionFinancial results
OtherRisk, funding &
capital information
Risk, funding & capital information / Credit risk
Impairment charges for the Residential Mortgages
portfolio dropped by EUR 183 million in 2015, amounting
to EUR 14 million at 31 December 2015. This material
decrease was attributable to the improvements in the
housing market and Dutch economy, which resulted
in a lower impaired volume. The impairment charges
for the Residential mortgage portfolio included an
IBNI release of EUR 52 million.
For Consumer loans, the impairment charges dropped
to EUR 43 million in 2015, coming down from
EUR 223 million in 2014. This decline was also the result
of the upward trend of the Dutch economy and an
IBNI release of EUR 31 million.
Impaired loans by industry
31 December 2015 30 September 2015 31 December 2014
(in millions)Impaired
exposures
Allowances for impair-ments for identified
credit riskImpaired
exposures
Allowances for impair-ments for identified
credit riskImpaired
exposures
Allowances for impair-ments for identified
credit risk
Industry sector
Banks 12 -12 12 -12 10 -10
Financial services1 808 -696 853 -702 813 -693
Industrial goods and services 1,136 -608 1,077 -607 1,328 -703
Real estate 656 -324 665 -343 793 -390
Oil and gas 170 -73 222 -103 119 -76
Food and beverage 492 -246 538 -248 544 -245
Retail 449 -282 497 -310 630 -355
Basic resources 293 -223 286 -214 212 -152
Healthcare 207 -167 192 -159 65 -39
Construction and materials 408 -285 385 -266 371 -254
Travel and leisure 167 -88 184 -98 202 -119
Other2 353 -207 363 -195 220 -136
Subtotal Industry Classification Benchmark 5,152 -3,210 5,273 -3,258 5,308 -3,170
Private individuals (non-Industry Classification Benchmark) 1,864 -698 1,897 -795 2,324 -918
Subtotal non-Industry Classification Benchmark 1,864 -698 1,897 -795 2,324 -918
Total3 7,016 -3,909 7,171 -4,052 7,632 -4,089
1 Financial services include asset managers, credit card companies and providers of personal financial services and securities and brokers.2 Other includes, personal and household goods, media, technology, automobiles and parts, chemicals, telecommunication and insurance, in addition to unclassified.3 Amounts excluding Incurred But Not Identified (IBNI).

ABN AMRO Group Quarterly Report fourth quarter 2015
52
IntroductionFinancial results
OtherRisk, funding &
capital information
Risk, funding & capital information / Credit risk
Fourth quarter developmentsWithin the industry sectors, decreases were noted for
Impaired exposures in Oil and Gas, Food and beverage
and Retail. These were partly offset by an increase in
Industrial goods and services.
Oil and Gas showed a decrease in impaired exposure,
mainly as result of a write-off of a relatively large single
file alongside a lower exposure in another large file.
The Impaired exposure in the Food & Beverage sector
was impacted by the finalisation of restructuring of
impaired files, which resulted in write-offs. Besides,
Allowances for impairments in this sector were raised
for existing impaired files.
The Impaired exposure for Retail is volatile and the
decrease in this quarter was mainly attributable to
write-offs and releases, which were partly offset by
a few new files.
Impaired exposures for Industrial goods and services
increased due to the restructuring of one of the larger
impaired files.
The Impaired exposure declined by EUR 0.6 billion,
totalling EUR 7.0 billion at 31 December 2015 compared
with 7.6 billion at 31 December 2014. Allowances for
Impairments declined by EUR 0.2 billion, amounting
to EUR 3.9 billion at 31 December 2015 compared
with EUR 4.1 billion at 31 December 2014.
In 2015, main decreases in impaired exposure at industry
level were noted for Private Individuals, Industrial goods
and services, Retail, Real Estate and Food and Beverage,
partly offset by increases in the sectors Health care,
Basic resources and Oil and Gas.
Developments in specific portfolios Residential mortgagesThe sentiment in the Dutch housing market continued to
be positive in the fourth quarter of 2015. The upswing was
noticeable in all Dutch regions and all price categories.
The number of transactions in the Dutch housing market
was 2.2% higher than in the fourth quarter of 2014, and
the total number of transactions in 2015 increased by 16%
compared with 2014 (increase of 3.6% for Q4 2015
compared with Q3 2015), according to Statistics Netherlands
(CBS). The increase in transactions is based on homes
sold to first-time buyers as well as existing homeowners.
The CBS housing price index was 0,6% higher in the fourth
quarter of 2015 than it was in the third quarter of 2015 and
almost 7% higher than the lowest level in 2013. The last
quarter of 2015 was characterised by higher activity levels
on the mortgage market. In the last quarter of 2015, a
growing number of existing mortgage loans were refinanced
to benefit from low long-term mortgage interest rates.
ABN AMRO’s production of new mortgages in the fourth
quarter of 2015 was equal to that in the same period last
year, but 30% lower than the third quarter of 2015. The
lower level of production was driven by fierce competition
on the longer interest rate periods. Insurers and pension
funds were active on the mortgage market, as mortgages
provided an attractive alternative to low-yielding government
bonds and other low-risk asset classes. Regulations for
these parties differ from banks in terms of required capital
buffers, giving them a competitive edge on long-term
interest rates.
ABN AMRO was market leader in new mortgage production
in 2015, holding a market share of 20.3% despite our lower
market share in the fourth quarter of 2015. The NHG
proportion of the new mortgage production was 26%
in the fourth quarter of 2015, compared with 39% in the
third quarter of 2015. The lower NHG contribution can
be explained by the lower NHG limit of EUR 245,000
since 1 July 2015.

ABN AMRO Group Quarterly Report fourth quarter 2015
53
IntroductionFinancial results
OtherRisk, funding &
capital information
Risk, funding & capital information / Credit risk
Total redemptions for the fourth quarter of 2015 amounted
to EUR 4.0 billion, compared with EUR 3.6 billion in 2014.
For 2015 as a whole, total redemptions amounted to
EUR 12.3 billion, compared with EUR 10.2 billion in 2014.
The higher number of total redemptions was caused by
an increase in refinancing and relocation, while extra
repayments in 2015 stayed at the same levels as in
previous years. Low interest rates on savings and
increased awareness among homeowners of the
possibility of residual debt are still incentives for extra
redemptions. Contractual repayments are gradually
growing, following modified tax regulations.
Key residential mortgage indicators
(in millions) 31 December 2015 30 September 2015 31 December 2014
Gross carrying amount excl. fair value adjustment from hedge accounting 146,932 148,535 148,402
Of which Nationale Hypotheek Garantie (NHG) 38,872 39,003 37,540
Gross carrying amount 150,333 152,044 152,536
Exposure at Default1 162,405 164,663 160,291
Risk-weighted assets/ risk exposure amount1 20,779 22,044 22,062
RWA (REA)/EAD 12.8% 13.4% 13.8%
Forbearance ratio 1.2% 1.2% 1.2%
Past due ratio 1.8% 2.0% 2.4%
Impaired ratio 0.7% 0.8% 1.0%
Coverage ratio 23.8% 25.9% 27.6%
Cost of risk (year to date, in bps) 1 1 13
Average Loan-to-Market-Value 80% 81% 83%
Average Loan-to-Market-Value - excluding NHG 76% 77% 79%
Total risk mitigation 188,427 214,148 210,925
Total risk mitigation/carrying amount 125.3% 140.8% 138.3%
1 The RWA (REA) and Exposure at Default amounts are based on the exposure class Secured by immovable property. This scope is slightly broader than the residential mortgage portfolio.
As a result of redemptions exceeding new mortgage
production, the gross carrying amount of the residential
mortgage portfolio came to EUR 146.9 billion at
31 December 2015, a decrease of 1.1% compared with
EUR 148.5 billion at 30 September 2015 (31 December
2014: EUR 148.4 billion). NHG-guaranteed loans account
for 26% of the residential mortgage portfolio.
The RWA for the Residential mortgage portfolio
decreased considerably, coming to EUR 20.8 billion at
31 December 2015 as a result of a decreasing number
of clients in arrears and a rise in housing prices.
The EAD decreased to EUR 162.4 at 31 December 2015
in line with the reduced size of the mortgage portfolio.
The forbearance ratio remained stable at 1.2%. The
mortgage portfolio in arrears, expressed in the past-due
ratio, further declined to 1.8 % at 31 December 2015,
compared with 2.0% at 30 September 2015, a significant
decline from 2.4% at 31 December 2014.
Cost of risk at 31 December 2015 improved to 1 bps,
compared with 13 bps at 31 December 2014.
This improvement is attributable to the substantial
decline of total impairment charges, which in turn
is the result of a decrease of the impaired portfolio.

ABN AMRO Group Quarterly Report fourth quarter 2015
54
IntroductionFinancial results
OtherRisk, funding &
capital information
Risk, funding & capital information / Credit risk
The coverage ratio for the residential mortgages portfolio
stood at 23.8% on 31 December 2015, down from 25.9%
at 30 September 2015 and 27.6% at 31 December 2014.
Both the impaired portfolio and Allowances for impairments
decreased. The allowances decreased mainly due to the
upswing in the housing market and continued improved
economic circumstances, which led to lower loss levels
on foreclosures.
The impaired ratio remained stable at 0.7%. This was the
result of a further decrease of the impaired portfolio, which
totalled EUR 1.0 billion at 31 December 2015, compared with
EUR 1.1 billion at 30 September 2015 and EUR 1.5 billion
at 30 December 2014, in combination with a reduced
Residential mortgage portfolio.
The abovementioned Risk ratios have improved as a result
of continually improving economic circumstances combined
with extensive portfolio management for clients who are
in the early stages of financial difficulties. Fewer clients go
into arrears, while more clients are recovering from arrears.
The increase in house prices, combined with restrictions
on the maximum Loan-to-Market Value (LtMV) for new
residential mortgages resulted in a strong improvement
of the average LtMV of the mortgage portfolio, which
amounted to 80% at 31 December 2015, compared with
81% at 30 September 2015 and 83% at 31 December 2014.
The same trend can be noted for the LtMVs excluding NHG.
The rise in Dutch house prices was particularly strong in
the densely populated Randstad area, where more than
50% of the houses financed by ABN AMRO are situated.
Total risk mitigation for residential mortgages decreased
by EUR 25.7 billion, coming to EUR 188.4 billion at
31 December 2015, compared with EUR 214.1 billion
at 30 September 2015. This decrease is mainly the result
of the implementation of the NCV valuation method.
Residential mortgages to indexed market value
31 December 2015 30 September 2015 31 December 2014
(in millions)
Gross carrying amount
Per-centage
of total
- of which
guaran-teed
- of which
unguar-anteed
Gross carrying amount
Percent-age of
total
- of which
guaran-teed
- of which
unguar-anteed
Gross carrying amount
Percent-age of
total
- of which
guaran-teed
- of which
unguar-anteed
LtMV category1
<50% 24,768 16.9% 1.8% 15.1% 24,332 16.4% 1.7% 14.6% 23,707 16.0% 1.7% 14.3%
50% - 80% 39,755 27.1% 5.0% 22.1% 38,328 25.8% 4.6% 21.2% 36,927 24.9% 4.2% 20.7%
80% - 90% 18,218 12.4% 3.6% 8.8% 17,645 11.9% 3.3% 8.6% 16,488 11.1% 2.8% 8.3%
90% - 100% 24,943 17.0% 6.9% 10.1% 23,485 15.8% 6.1% 9.7% 20,396 13.7% 4.5% 9.2%
100% - 110% 18,928 12.9% 5.0% 7.9% 20,635 13.9% 5.6% 8.3% 21,455 14.5% 5.8% 8.7%
110% - 120% 12,648 8.6% 2.9% 5.7% 14,229 9.6% 3.2% 6.4% 16,280 11.0% 3.8% 7.2%
>120% 5,721 3.9% 1.3% 2.5% 7,525 5.1% 1.7% 3.4% 10,885 7.3% 2.5% 4.8%
Unclassified 1,951 1.3% 2,356 1.6% 2,264 1.5%
Total 146,932 100% 148,535 100% 148,402 100%
1 ABN AMRO calculates the Loan-to-Market Value using the indexation of the CBS (Statistics Netherlands).
The volume of the portfolio with LtMV rates above 100%
(i.e. the mortgage loan exceeds the value of the property)
decreased considerably, coming down to 25.3% at
31 December 2015 from 28.5% at 30 September 2015.
Note that LtMVs of more than 100% do not necessarily
indicate that these clients are in financial difficulties.

ABN AMRO Group Quarterly Report fourth quarter 2015
55
IntroductionFinancial results
OtherRisk, funding &
capital information
Risk, funding & capital information / Credit risk
Breakdown of residential mortgage origination by loan type1
Under Dutch tax regulations implemented on 1 January 2013,
mortgage interest is only deductible for redeeming
mortgage loans. In 2015, mortgage loan type origination
(defined as new production and mortgages with a loan
type modification) breaks down into 31.4% interest-only
mortgages (2012: 45%), 60.6% redeeming mortgages
(2012: 10.0%) and 3.4% savings mortgages (2012: 42%).
Production of interest-only and savings mortgages can still
take place when clients refinance loans that originated
before 2013.
Breakdown of residential mortgage portfolio by loan type
31 December 2015 30 September 2015 31 December 2014
(in millions)
Gross carrying amount
Percentage of total
Gross carrying amount
Percentage of total
Gross carrying amount
Percentage of total
Interest only (partially) 47,943 33% 48,488 33% 48,936 33%
Interest only (100%) 32,076 22% 32,800 22% 34,081 23%
Redeeming mortgages (annuity/linear) 18,569 13% 17,203 12% 11,956 8%
Savings 21,735 15% 21,975 15% 23,243 16%
Life (investment) 17,787 12% 18,619 13% 20,279 14%
Other1 8,822 6% 9,449 6% 9,908 7%
Total 146,932 100% 148,535 100% 148,402 100%
1 Other includes hybrid, other and unclassified mortgage types. The hybrid portfolio consists of a combination of savings and investment mortgages.
The shift in new production to redeeming mortgages is also
reflected in the composition of the mortgage portfolio.
Redeeming mortgages increased to 13% of the residential
mortgage portfolio, up from 12% at 30 September 2015
and 8% at 31 December 2014. ‘Redeeming mortgages’
is the only category that increased in volume.
Breakdown of the residential mortgage portfolio by year of loan modification as from 20151
(in billions)
5
10
15
20
25
2005 2006 2007 2008 2009 2010 2011 2012 2013 2014 2015
Savings2 Redeeming (annuity/linear) Interest only Other
1 Production includes the new mortgage production and all mortgages with a modification date. 2 Other includes universal life, life investment, hybrid, other and unclassified mortgage types. The hybrid portfolio consists of a combination of savings and investment mortgages. .
13.3
16.413.6
12.2
8.5 7.6 7.1 7.3 6.38.6
11.6

ABN AMRO Group Quarterly Report fourth quarter 2015
56
IntroductionFinancial results
OtherRisk, funding &
capital information
Risk, funding & capital information / Credit risk
Energy, Commodities & Transportation ClientsECT on- and off-balance sheet exposure
31 December 2015 30 September 2015 31 December 2014
(in billions) Energy CommoditiesTranspor-
tationTotal ECT
clients Energy CommoditiesTranspor-
tationTotal ECT
clients Total ECT clients
On-balance sheet exposure 4.7 11.1 9.3 25.0 4.5 11.6 8.5 24.6 22.2
Guarantees and letters of credit 0.7 5.5 0.2 6.3 0.6 5.6 0.2 6.4 7.7
Subtotal 5.3 16.5 9.5 31.4 5.1 17.2 8.7 31.0 29.9
Undrawn committed credit facilities 2.3 2.4 1.9 6.7 2.4 2.2 1.4 6.0 5.2
Total on- and off-balance sheet exposure 7.6 19.0 11.4 38.0 7.5 19.4 10.1 37.0 35.0
ABN AMRO provides financial solutions and support
to clients across the entire value chain of the Energy,
Commodities and Transportation (ECT) industry. ECT
Clients finances and services corporate clients who
are internationally active in Energy (upstream, offshore,
midstream, FPSO, corporate lending), Commodities
(energy, agricultural and metals) and Transportation
(ocean-going vessels and containers).
The majority of the loan book is US-dollar denominated
and typically secured by either commodities for which
liquid markets exist, first-priority ship mortgages, or
pledged contracted project cash flows. Conservative
advance rates are applied, taking into account through-the-
cycle asset values.
The ECT Clients’ total loan portfolio amounted to an
equivalent of EUR 25.0 billion on-balance sheet exposure
at 31 December 2015, compared with EUR 24.6 billion at
30 September 2015. The on-balance sheet exposure of
the ECT Clients portfolio increased by 1.8% in the fourth
quarter of 2015, mainly due to an increase in Energy and
Transportation and supported by a stronger US dollar. The
increase was partially offset by a decrease in Commodities,
caused by low commodity prices.
Commodities Clients remains the largest sector of
ECT Clients, accounting for EUR 11.1 billion of the
ECT Clients loan portfolio (down from EUR 11.6 billion at
30 September 2015). Loans to clients in the Transportation
Clients sector now account for EUR 9.3 billion (up from
EUR 8.5 billion at 30 September 2015). Energy Clients’ share
in the on-balance sheet exposure is now EUR 4.7 billion
(up from EUR 4.5 billion at 30 September 2015).
The off-balance-sheet exposure, consisting mainly of
short-term letters of credit secured by commodities,
guarantees and availability under committed credit lines,
increased to EUR 13.0 billion at 31 December 2015, of
which EUR 3.0 billion in Energy Clients, EUR 7.9 billion in
Commodities Clients and EUR 2.1 billion in Transportation
Clients. At 30 September 2015 the off-balance sheet
exposure was EUR 12.4 billion.
In the fourth quarter of 2015, impairment charges for
Energy, Commodities and Transportation amounted to
EUR 31 million, compared with EUR 37 million in the
same period last year. Like other parts within International
Clients, impairment charges for ECT Clients are typically
incurred for a few individual files can be relatively large
compared with other parts of the corporate loan book.

ABN AMRO Group Quarterly Report fourth quarter 2015
57
IntroductionFinancial results
OtherRisk, funding &
capital information
Risk, funding & capital information / Credit risk
ECT Clients operates in cyclical sectors. This cyclicality
is carefully considered in relation to lending policies,
financing structures, advance rates and risk management.
As some of the clients in the ECT sectors are facing
challenging market circumstances, the impact of these
developments needs to be monitored closely.
The bank periodically performs sensitivity analyses and
stress testing exercises to gain insight into the credit
performance under price scenarios, economic scenarios
and risk measures.The developments in commodity
prices and specifically in Oil & Gas are continuously
subject to close risk management attention and stringent
credit monitoring.

ABN AMRO Group Quarterly Report fourth quarter 2015
58
IntroductionFinancial results
OtherRisk, funding &
capital information
Risk, funding & capital information / Operational risk
Operational risk
RWA for operational risk is calculated based on the
Standardised Approach (TSA). To calculate the required
capital, once a year the gross income is multiplied by
a percentage (predefined by the directives).
Fourth-quarter developmentsAs the calculation is revised yearly, no changes are noted
in the fourth quarter of 2015 compared with the third
quarter of 2015.
In the fourth quarter of 2015, the total operational loss
amount increased. However, excluding the settlement of
one claim relating to the sale of interest rate derivative
contracts, the total operational loss amount would have
decreased. The loss amount for external fraud remained at
the low level of 2014. Apart from this, the bank provisioned
for litigation of some larger historical claims.
In early Q4 2015, ABN AMRO submitted an application
for the Advanced Measurement Approach (AMA) status
to the supervisor (ECB) for approval.
Developments in the full yearRWA remained stable in in 2015.
RWA flow statement operational risk(in millions)
31 December2014
Delta 30 September2015
31 December2015
16,168 59 16,227 16,227
15,500
15,750
16,000
16,250
16,500
Operational risk Operational risk (Engels)

ABN AMRO Group Quarterly Report fourth quarter 2015
59
IntroductionFinancial results
OtherRisk, funding &
capital information
Risk, funding & capital information / Market risk
Market risk
ABN AMRO is exposed to market risk in its trading book
and banking book.
Market risk in the trading bookABN AMRO has limited exposure in the trading book
RWA flow statement market risk(in millions)
31 December2014
Delta 30 September2015
Businessvolume
Other 31 December2015
5,811 -1 5,810 -88-12 5,710
5,250
5,500
5,750
6,000
6,250
RWA remained relatively stable at EUR 5.7 billion at
31 December 2015 compared with 30 September 2015.
The Internal Model Approach (IMA) was submitted to
the regulator in October 2014. The regulator is currently
reviewing this model.
Internal aggregated diversified and undiverisified VaR for all trading positions
Q4 2015 Q4 2014 Q3 2015
(in millions) Diversified Undiversified Diversified Undiversified Diversified Undiversified
VaR at last trading day of period 3.0 3.4 1.4 2.5 6.3 8.4
Highest VaR 8.7 11.0 1.8 2.8 8.5 14.4
Lowest VaR 1.8 2.9 0.8 1.6 3.5 4.6
Average VaR 2.9 4.1 1.2 2.3 5.6 7.3
In the fourth quarter of 2015, the diversified VaR increased
by EUR 1.6 million compared with the same period in 2014.
The average diversified VaR increased by EUR 1.7 million.
While the risk profile remained stable and moderate, this
increase was driven by low interest rates linked to ECB
quantitative easing in Q1 2015 and the VaR methodology.
The VaR methodology was enhanced in Q4 2015 to handle
low interest rates.
Market risk Market risk (Engels)

ABN AMRO Group Quarterly Report fourth quarter 2015
60
IntroductionFinancial results
OtherRisk, funding &
capital information
Risk, funding & capital information / Market risk
Market risk in the banking bookMarket risk in the banking book is the risk that the bank’s
value or earnings decline because of unfavourable market
movements. The market risk of the banking book consists
predominantly of interest rate risk. Interest rate risk arises
from holding loans with different interest rate maturities
than the interest rate maturities of the savings and funding
of the bank.
The assets have on average a longer behavioural maturity
than the liabilities, especially savings. ABN AMRO uses a
combination of portfolio (macro) hedges and specific asset
or liability (micro) hedges to swap fixed interest rates to
a floating interest rate position. The resulting interest rate
position, after application of interest rate hedges, is in line
with the bank’s strategy and risk appetite.
Interest rate risk metrics
31 December 2015 30 September 2015 31 December 2014
NII-at-risk (in %) 1.3 2.2 2.2
Duration of equity (in years) 3.6 3.4 4.0
NII-at-Risk is defined as the worst outcome of two
scenarios: a gradual increase in interest rates and a
gradual decline in interest rates by 200bps. A floor on
interest rates is assumed in the falling rates scenario.
NII-at-Risk in Q4 decreased to 1.3% (approximately
EUR 80 million) and, like in the previous quarter, reflects
a reduction of NII of approximately EUR 80 million in
the falling rates scenario. In a scenario in which interest
rates rise, NII would increase by 2.0% (approximately
EUR 120 million).
Duration of equity increased moderately to 3.6 years,
driven by business developments.

ABN AMRO Group Quarterly Report fourth quarter 2015
61
IntroductionFinancial results
OtherRisk, funding &
capital information
Risk, funding & capital information / Liquidity risk
Liquidity risk
Liquidity indicators
31 December 2015 30 September 2015 31 December 2014
Loan-to-Deposit ratio 109% 110% 117%
LCR >100% >100% >100%
NSFR >100% >100% >100%
Survival period (moderate stress) >12 months >12 months >12 months
Available liquidity buffer (in billions) 82.8 85.4 73.9
The Liquidity Coverage Ratio (LCR) and the Net Stable
Funding Ratio (NSFR) both remained above 100% in the
final quarter of 2015. This is in line with the bank’s targeted
early compliance with future regulatory requirements.
The survival period reflects the period that the bank’s
liquidity position is expected to remain positive in an
internal stress scenario in which wholesale funding
markets deteriorate and retail and commercial clients
withdraw a proportion of their deposits. The survival
period was consistently >12 months in the final quarter
of 2015.
Loan-to-Deposit ratio
(in millions) 31 December 2015 30 September 2015 31 December 2014
Loans and receivables - customers 259,319 261,742 261,910
Net adjustments -1,737 -2,918 -2,975
Adjusted loans and receivables - customers 257,582 258,824 258,935
Due to customers 230,297 228,529 216,011
Net adjustments 6,216 6,358 6,196
Adjusted due to customers 236,513 234,887 222,207
Loan-to-Deposit ratio 109% 110% 117%
The Loan-to-Deposit (LtD) ratio improved to 109% in the final
quarter of 2015, compared with 110% at 30 September 2015.
For full-year 2015, the LtD ratio improved to 109% at
31 December 2015, compared with 117% at 31 December
2014. The main drivers were a large increase in client
deposits across all business segments, particularly in
the first half of the year. Client loans showed a small
decrease in the final quarter of 2015.
Liquidity risk (Engels)Liquidity risk

ABN AMRO Group Quarterly Report fourth quarter 2015
62
IntroductionFinancial results
OtherRisk, funding &
capital information
Risk, funding & capital information / Liquidity risk
Liquidity buffer composition
31 December 2015 30 September 2015 31 December 2014
(in billions)Liquidity
bufferof which
LCR eligibleLiquidity
bufferof which
LCR eligibleLiquidity
bufferof which
LCR eligible
Cash & central bank deposits1 24.4 24.4 18.9 18.9 5.3 5.3
Government bonds 26.0 26.9 26.3 27.2 27.3 28.3
Covered bonds 1.4 1.3 1.5 1.3 2.0 1.8
Retained RMBS 24.0 31.2 31.8
Third party RMBS 0.7 0.6 0.7 0.6 1.0 0.8
Other 6.3 3.3 6.7 3.7 6.5 3.7
Total liquidity buffer 82.8 56.5 85.4 51.8 73.9 40.0
- of which in EUR 94.1% 94.2% 92.7%
- of which in other currencies 5.9% 5.8% 7.3%
1 The mandatory cash reserve with the central bank has been deducted from the cash and central bank deposits in the liquidity buffer.
The liquidity buffer consists to a large extent of cash and
deposits at central banks, government bonds and retained
RMBS. Most of the securities in the liquidity buffer, with
the exception of the retained RMBS, are eligible for the
LCR. The internal assessment of the eligibility and haircut
for several liquidity instruments deviates from the Basel III
regulation, which explains the differences between the
liquidity values. For government bonds, the internal haircut
is higher. This explains why the liquidity buffer value for
government bonds is lower than the LCR eligible amount.
Retained RMBS are not eligble for the LCR. However, they
do have liquidity value for internal stress testing purposes.
The gradual increase of the cash position throughout 2015
as a result of an improved LtD ratio allowed for decreasing
the retained RMBS portfolio in the final quarter of 2015.
This resulted in a further optimisation of our liquidity buffer.
The liquidity buffer decreased by EUR 2.6 billion,
amounting to EUR 82.8 billion at 31 December 2015,
compared with EUR 85.4 billion at 30 September
2015. The decrease in the liquidity buffer was primarily
driven by the decline in retained RMBS and was partially
offset by a higher cash position.
The liquidity buffer increased by EUR 8.9 billion, arriving
at EUR 82.8 billion at 31 December 2015, compared with
EUR 73.9 billion at 31 December 2014. The increase in
the buffer over the year was primarily driven by the higher
cash position. This increase was partially offset by the
decrease in retained RMBS in the final quarter of 2015.

ABN AMRO Group Quarterly Report fourth quarter 2015
63
IntroductionFinancial results
OtherRisk, funding &
capital information
Risk, funding & capital information / Funding
Funding
ABN AMRO’s strategy for wholesale funding is derived
from the bank’s moderate risk profile. This strategy aims
to optimise and diversify the bank’s funding sources in
order to maintain market access and the targeted funding
position. We aim to have a balance sheet with a diverse,
stable and cost-efficient funding base.
Client deposits (payable to clients) are a source of funding,
complemented by a well-diversified book of wholesale
funding. Client deposits amounted to EUR 230.3 billion
on 31 December 2015, up by EUR 1.8 billion from
EUR 228.5 billion at 30 September 2015. Total wholesale
funding amounted to EUR 85.9 billion on 31 December 2015,
down by EUR 2.9 billion from EUR 88.8 billion at
30 September 2015.
Funding raisedLong-term funding raised in the final quarter of 2015
amounted to EUR 2.9 billion, 52% of which was raised
in non-euro currencies. During 2015, ABN AMRO raised
EUR 14.3 billion in long-term wholesale funding (including
EUR 2.8 billion subordinated debt) compared with
EUR 9.2 billion in 2014. Furthermore, EUR 1 billion of
Additional Tier 1 capital instruments were issued in
September 2015. More information on capital instruments
is provided in the Capital management section of this report.
Overview of funding typesA key goal of the funding strategy is to diversify funding
sources. To this end, the set of funding instruments
includes a broad set of funding programmes in different
currencies, markets, maturities and investor bases. A
description of capital and funding instruments issued by
ABN AMRO is provided on our website, abnamro.com.
We continuously assess our wholesale funding base in
order to determine the optimal use of funding sources.
Long-term funding raised in 2014 and 2015(notional amounts, in billions)
2
4
6
8
10
1.8
1.83.3
1.50.2
5.0
1.5
1.3
1.6
4.5
2.6
0.42.9
1 Other long-term funding includes long-term repos, TLTRO funding and funding with the Dutch State as counterparty.
Q1 2014 Q3 2015 Q4 2015Q2 2014 Q3 2014 Q4 2014 Q1 2015 Q2 20150.52.02.0
1.6
4.12.8
0.1 2.5
5.7
2.92.0
SecuritisationsSenior unsecured Covered bonds Subordinated liabilities Other funding1
Funding Funding (Engels)

ABN AMRO Group Quarterly Report fourth quarter 2015
64
IntroductionFinancial results
OtherRisk, funding &
capital information
Risk, funding & capital information / Funding
The main wholesale funding types can be specified as follows:
(in millions) 31 December 2015 30 September 2015 31 December 2014
Euro Commercial Paper 1,326 2,798 1,706
London Certificates of Deposit 3,744 4,119 1,436
French Certificats de Dépôt 164 357 1,517
US Commercial Paper 4,585 4,440 4,070
Total Commercial Paper/Certificates of Deposit 9,820 11,714 8,729
Senior unsecured (medium-term notes) 37,404 35,403 32,252
Covered bonds 25,956 26,482 27,077
Securitisations 2,968 5,468 9,001
Saving certificates 59 59 72
Total issued debt 76,207 79,126 77,131
Subordinated liabilities 9,708 9,660 8,328
Total wholesale funding 85,915 88,786 85,458
Other long-term funding1 6,813 6,798 6,900
Total funding instruments2 92,728 95,584 92,358
- of which CP/CD matures within one year 9,820 11,714 8,729
- of which funding instruments (excl. CP/CD) matures within one year 12,044 13,422 11,618
- of which matures after one year 70,865 70,448 72,012
1 Includes long-term repos (recorded in Securities financing), TLTRO funding (recorded in Due to banks) and funding with the Dutch State as counterparty (recorded in Due to customers).2 Includes FX effects, fair value adjustments and interest movements.
Maturity calendar
2016 2017 2018 2019 2020 2021 2022 2023 2024 ≥ 20262025
Maturity calendar at 31 December 2015(notional amounts, in billions)
SecuritisationsSenior unsecured Covered bonds Subordinated liabilities Other long-term funding1
3
6
9
12
15
1 Other long-term funding includes long-term repos, TLTRO funding and funding with the Dutch State as counterparty.
11.8
13.9
10.3
7.38.7
4.7
6.7
3.11.9
3.3
6.8

ABN AMRO Group Quarterly Report fourth quarter 2015
65
IntroductionFinancial results
OtherRisk, funding &
capital information
Risk, funding & capital information / Funding
Maturity calendar
31 December 2015
(notional amounts, in billions) 2016 2017 2018 2019 2020 2021 2022 2023 2024 2025 ≥ 2026 Total
Senior unsecured 8.5 7.5 3.6 5.0 4.6 0.8 2.5 1.1 0.2 1.6 0.9 36.5
Covered bonds 0.6 2.1 1.9 1.8 2.3 2.4 2.6 1.8 1.7 0.3 5.5 23.1
Securitisations 0.6 1.1 0.8 0.5 3.0
Subordinated liabilities 1.2 2.1 1.6 1.2 1.5 0.1 1.4 9.2
Other long-term funding1 1.0 1.0 4.0 0.1 0.3 0.5 6.8
Total 11.8 13.9 10.3 7.3 8.7 4.7 6.7 3.1 1.9 3.3 6.8 78.51 Other long-term funding includes long-term repos, TLTRO funding and funding with the Dutch State as counterparty.
The average remaining maturity of the total outstanding
long-term wholesale funding was 4.6 years on
31 December 2015, which is stable compared with
30 September 2015 and an increase compared with
31 December 2014 (4.3 years). This was caused mainly
by the issuance of long-term secured funding in the
third quarter of 2015.
The stated maturity calendar assumes redemption on
the earliest possible call date or the legal maturity date,
as early redemption of subordinated instruments is
subject to the approval of the regulators. However,
this does not mean that the instruments will be called
at the earliest possible call date.
In 2014, ABN AMRO participated in the Targeted Long-Term
Refinancing Operations (TLTRO) programme, which is the
European Central Bank’s programme to support lending
to the real economy (particular for SMEs). ABN AMRO
participated in the TLTRO for a total amount of EUR 4.0 billion.
The contractual maturity date is 2018. However, depending
on developments in the eligible lending activities
underlying the TLTRO programme, early repayment could
be mandatory. Given expected developments, early
repayment in the second half of 2016 is considered likely.

ABN AMRO Group Quarterly Report fourth quarter 2015
66
IntroductionFinancial results
OtherRisk, funding &
capital information
Risk, funding & capital information / Capital management
Capital management
ABN AMRO’s solid capital position ensures that the bank is
already compliant with the fully-loaded capital requirements
of the Capital Requirements Directive IV (CRD IV). The
overall capital base increased over the fourth quarter due
to accumulated profit. The bank strives to optimise its
capital structure in anticipation of pending regulatory
requirements. The capital structure consists mainly of
common equity and highly loss-absorbing capital to cover
unexpected losses. The subordination of specific capital
instruments provides further protection to senior creditors.
Regulatory capital structure
(in millions) 31 December 2015 30 September 2015 31 December 2014
Total equity (EU IFRS) 17,584 17,094 14,877
Cash flow hedge reserve 1,056 1,152 1,223
Dividend reserve -414 -312 -275
Capital securities -993 -993
Other regulatory adjustments -466 -436 -399
Common Equity Tier 1 16,768 16,505 15,426
Innovative hybrid capital instruments 700 700 800
Capital securities 993 993
Other regulatory adjustments -234 -237 -241
Tier 1 capital 18,226 17,961 15,985
Subordinated liabilities Tier 2 4,938 4,885 5,502
Excess Tier 1 capital recognised as Tier 2 capital 300 300 200
Other regulatory adjustments -33 30 -39
Total regulatory capital 23,431 23,177 21,648
Total risk-weighted assets (risk exposure amount) 108,001 110,602 109,647
Common Equity Tier 1 ratio 15.5% 14.9% 14.1%
Tier 1 ratio 16.9% 16.2% 14.6%
Total capital ratio 21.7% 21.0% 19.7%
Common Equity Tier 1 capital (fully-loaded) 16,695 16,380 15,435
Common Equity Tier 1 ratio (fully-loaded) 15.5% 14.8% 14.1%
Tier 1 capital (fully-loaded) 17,688 17,373 15,435
Tier 1 ratio (fully-loaded) 16.4% 15.7% 14.1%
Total capital (fully-loaded) 20,624 20,311 20,746
Total capital ratio (fully-loaded) 19.1% 18.4% 18.9%
Capital management Capital management (Engels)

ABN AMRO Group Quarterly Report fourth quarter 2015
67
IntroductionFinancial results
OtherRisk, funding &
capital information
Risk, funding & capital information / Capital management
At 31 December 2015, the phase-in CRD IV Common
Equity Tier 1, Tier 1 and total capital ratios were 15.5%,
16.9% and 21.7% respectively, an increase compared
with Q3 2015. All capital ratios were well above regulatory
minimum requirements and in line with the bank’s risk
appetite and strategic ambitions. ABN AMRO’s capital
position strengthened over the fourth quarter, as a result
of profit accumulation.
Capital ratios are supported by a decrease in group level
RWA (REA) compared with 30 September 2015. Total
RWA (REA) decreased by EUR 2.6 billion, amounting to
EUR 108.0 billion at 31 December 2015, compared with
EUR 110.6 billion at 30 September 2015. This decrease
was primarily driven by lower credit risk. More information
on RWA (REA) is provided in the risk sections of this report.
The fully-loaded Common Equity Tier 1, fully-loaded Tier 1
and fully-loaded total capital ratios increased to 15.5%,
16.4% and 19.1% respectively over the fourth quarter.
In 2016, ABN AMRO will be required to meet a required
minimum CET1 ratio of 10.25% on a consolidated basis,
which is composed of a 9.5% SREP requirement and a
0.75% phase-in of the systemic risk buffer (SRB). The SRB
is expected to grow by 0.75 percentage points per annum
up to 3.0% in 2019. The 9.5% CET1 requirement for 2016
includes the capital conservation buffer. ABN AMRO is
comfortably above the 10.25% minimum, with phase-in
CET1 at 15.5% per 31 December 2015.
The fully-loaded total capital ratio increased by 0.2
percentage points compared with 31 December 2014.
Over 2015, profit accumulation, capital issuances
(EUR 1.0 billion AT1 issuance, EUR 1.5 billion T2 issuance
and USD 1.5 billion T2 issuance) and a slightly lower RWA
level more than compensated for the fact that certain Tier 2
instruments were excluded from the total capital calculation.
The exclusion applies to Tier 2 instruments that had been
issued after year-end 2011 (the CRR cut-off date) and before
revocation of the 403 liability statement of ABN AMRO
Group (on 1 June 2015) that had been issued on behalf
of ABN AMRO Bank. These Tier 2 instruments no longer
meet the requirements of the Capital Requirements
Regulation (CRR). Furthermore, three other instruments
became subject to the grandfathering regime and their
Tier 2 eligibility amortises annually.
DividendABN AMRO proposes a final cash dividend of
EUR 414 million or EUR 0.44 per share. Together with
the interim cash dividend of EUR 350 million as paid
in August 2015, this will bring the total dividend to
EUR 764 million or EUR 0.81 per share and the payout
ratio to 40%1, in line with the target payout ratio for 2015.
Developments impacting capital ratios in Q4 2015(in %)
31 December2014
Delta 30 September2015
Q4 reportednet profit
RWA (REA)change
31 December2015
13
16
19
22
25
14.114.6 14.9
16.2
19.71.2 0.2 0.5 21.7
1.415.5
21.0
Common Equity Tier 1 ratio Tier 1 ratio Total capital ratio Delta
1 This is based on reported net profit excluding net reserved coupons for AT1 capital securities and net profit attributable to non-controlling interests.

ABN AMRO Group Quarterly Report fourth quarter 2015
68
IntroductionFinancial results
OtherRisk, funding &
capital information
Risk, funding & capital information / Capital management
Leverage ratio
31 December 2015 31 December 2014
Phase-in Fully-loaded Fully-loaded
Tier 1 capital 18,226 17,688 15,435
Exposure measure (under CDR)
On-balance sheet exposures 390,317 390,317 386,867
Off-balance sheet items 29,183 29,183 26,702
On-balance sheet netting 26,621 26,621 37,709
Derivative exposure 31,541 31,541 -11,783
Securities financing exposures 1,317 1,317 1,078
Other regulatory measures -14,443 -14,322 -19,262
Exposure measure 464,536 464,657 421,311
Leverage ratio (CDR) 3.9% 3.8% 3.7%
The CRR introduced a non-risk based leverage ratio to be
monitored until 2017 and to be further refined and calibrated
before becoming a binding measure as from 2018. The
Commission Delegated Regulation (CDR), applicable since
1 January 2015, amended the leverage ratio definition
to enhance comparability of leverage ratio disclosures.
The Group aims for at least a 4% leverage ratio by year-end
2018, to be achieved by issuance of AT1 instruments,
management of the exposure measure and profit retention.
At 31 December 2015, the Group had a CDR fully-loaded
leverage ratio of 3.8%, increasing from 3.5% at
30 September 2015. The leverage ratio benefited from
an increase in Tier 1 capital through profit accumulation.
In addition, the exposure measure fell significantly over
the fourth quarter, predominantly due to a decrease in
total assets and in clearing guarantees positions as
positions are unwinded towards year-end.
The fully-loaded CDR Leverage Ratio at 31 December 2015
increased by 0.1 percentage point compared with the 2014
year-end level of 3.7%. A revised method for calculating the
exposure measure for clearing services was implemented
in Q2 2015. This revised method led to an exposure
measure add-on per 31 December 2015 of approximately
EUR 43 billion. If the fully-loaded leverage ratio had been
calculated consistently using this revised calculation
method (assuming clearing guarantees positions of
EUR 43 billion), the leverage ratio would have amounted
to 3.3% at 31 December 2014. It is anticipated that BCBS
will issue a consultation to revise the methodology
(SA-CCR instead of CEM), which might reduce the exposure
measure for clearing guarantees again. Adoption of this
method is still under discussion.

ABN AMRO Group Quarterly Report fourth quarter 2015
69
IntroductionFinancial results
OtherRisk, funding &
capital information
Risk, funding & capital information / Capital management
Regulatory capital developmentsThe CRD IV and the CRR set the framework for the
implementation of Basel III in the European Union.
CRD IV and CRR have been phased in since 1 January 2014
and will be fully effective by January 2019.
The Bank Recovery and Resolution Directive (BRRD)
provides authorities with more comprehensive and effective
measures to deal with failing banks. Implementation of
BRRD in the European Union began in 2015 and the bail-in
framework will be applicable as from January 2016.
Implementation of the bail-in framework has led to the
introduction of additional loss-absorbing measures, such
as the Minimum Requirement for own funds and Eligible
Liabilities (MREL).
The Group is monitoring pending regulatory requirements
in relation to MREL and aims for at least 8% MREL by
year-end 2018 (through subordinated debt and profit
retention). The final regulatory requirements for MREL
will determine the precise measures to be undertaken to
comply with the MREL requirement. At 31 December 2015,
the Group had a 6.8% MREL (based on Own Funds and
Other subordinated liabilities).
ABN AMRO will continue to issue new capital instruments
to further enhance its buffer of loss-absorbing instruments
in view of scheduled amortisations, MREL and any other
regulatory changes.
Although TLAC is currently not applicable to the bank,
ABN AMRO continues to monitor TLAC requirements
following publication of the final terms in November 2015.
The final terms for TLAC are considered to be in line with
the current ambition to steer MREL to 8%, while further
convergence between TLAC and MREL requirements
is anticipated.
Also commonly referred to as Basel IV, the Basel Committee
on Banking Supervision has presented two consultative
documents on a revision of the Standardised Approach
and the design of a capital floor framework based on this
revised Standardised Approach. This framework will replace
the current transitional floor based on the Basel I standard.
The aim of the revised capital floor framework is to enhance
the reliability and comparability of risk-weighted capital
ratios. The revision of the Standardised Approach for
Residential Real Estate and SMEs in combination with the
revision of the capital floors implies a potential significant
risk-weighted assets inflation risk for ABN AMRO.
Regulatory developments, such as the Basel proposal
(especially with respect to the risk-weighting of mortgages
and corporate loans) and increasing capital requirements
set by the regulators, could have a significant impact on the
bank’s capital position going forward. Hence, ABN AMRO
will continue to focus on capital efficiency and further
strengthen its capital position.

70
IntroductionFinancial results
Risk, funding & capital inform
ationOther
Other
71 Enquiries
Other

ABN AMRO Group Quarterly Report fourth quarter 2015
71
IntroductionFinancial results
Risk, funding & capital inform
ation
Other / Enquiries
Other
Enquiries
ABN AMRO Investor [email protected]
+31 20 6282 282
Investor callGerrit Zalm, Chairman of the Managing Board,
Kees van Dijkhuizen, CFO, and Wietze Reehoorn, CRO
and Head of Group Strategy, will host a conference call
for analysts and investors on Wednesday 17 February 2016
at 2:00 pm CET (1:00 pm GMT).
To participate in the conference call, we strongly advise
you to pre-register for the call using the information
provided on the ABN AMRO Investor Relations website.
More information can be found on our website
www.abnamro.com/ir.
ABN AMRO Press [email protected]
+31 20 6288 900
ABN AMRO Group N.V.Gustav Mahlerlaan 10, 1082 PP Amsterdam
P.O. Box 283, 1000 EA Amsterdam
The Netherlands
abnamro.com
Information on our website does not form part of this
Quarterly Report, unless expressly stated otherwise.
Enquiries Enquiries (Engels)

ABN AMRO Group Quarterly Report fourth quarter 2015
72
IntroductionFinancial results
Risk, funding & capital inform
ation
Other / Enquiries
Other
Disclaimer & cautionary statementsThe Group has included in this document, and from time
to time may make certain statements in its public filings,
press releases or other public statements that may
constitute “forward-looking statements” within the
meaning of the safe-harbour provisions of the United
States Private Securities Litigation Reform Act of 1995.
This includes, without limitation, such statements that
include the words “expect”, “estimate”, “project”,
“anticipate”, “should”, “intend”, “plan”, “aim”, “desire”,
“strive”, probability”, “risk”, “Value at Risk” (“VaR”),
“target”, “goal”, “objective”, “will”, “endeavour”, “outlook”,
“optimistic”, “prospects” and similar expressions or
variations on such expressions. In particular, this document
includes forward-looking statements relating, but not
limited, to ABN AMRO’s potential exposures to various
types of operational, credit and market risk, such as
counterparty risk, interest rate risk, foreign exchange rate
risk and commodity and equity price risk. Such statements
are subject to risks and uncertainties. These forward-looking
statements are not historical facts and represent only
ABN AMRO’s beliefs regarding future events, many of
which by their nature are inherently uncertain and beyond
the bank’s control.
Other factors that could cause actual results to differ
materially from those anticipated by the forward-looking
statements contained in this document include, but are
not limited to:
Å The extent and nature of future developments and
continued volatility in the credit and financial markets
and their impact on the financial industry in general
and ABN AMRO in particular;
Å The effect on ABN AMRO’s capital of write-downs
in respect of credit exposures;
Å Risks related to ABN AMRO’s merger, separation
and integration process;
Å General economic, social and political conditions in
the Netherlands and in other countries in which
ABN AMRO has significant business activities,
investments or other exposures, including the impact
of recessionary economic conditions on ABN AMRO’s
performance, liquidity and financial position;
Å Macroeconomic and geopolitical risks;
Å Reductions in ABN AMRO’s credit ratings;
Å Actions taken by the EC, governments and their agencies
to support individual banks and the banking system;
Å Monetary and interest rate policies of the ECB and G20
central banks;
Å Inflation or deflation;
Å Unanticipated turbulence in interest rates, foreign currency
exchange rates, commodity prices and equity prices;
Å Liquidity risks and related market risk losses;
Å Potential losses associated with an increase in the level
of substandard loans or non-performance by counter-
parties to other types of financial instruments, including
systemic risk;
Å Changes in Dutch and foreign laws, regulations, policies
and taxes;
Å Changes in competition and pricing environments;
Å Inability to hedge certain risks economically;
Å Adequacy of loss reserves and impairment allowances;
Å Technological changes;
Å Changes in consumer spending, investment
and saving habits;
Å Effective capital and liquidity management;
Å The success of ABN AMRO in managing the risks
involved in the foregoing.
The forward-looking statements made in this document
are only applicable as from the date of publication of this
document. ABN AMRO does not intend to publicly update
or revise these forward-looking statements to reflect
events or circumstances after the date of this report, and
ABN AMRO does not assume any responsibility to do so.
The reader should, however, take into account any further
disclosures of a forward-looking nature that ABN AMRO
may make in ABN AMRO’s interim reports.
