abi development: representation, visualization, and ... · abi development: representation,...
TRANSCRIPT

ABI Development: Representation, Visualization, and Modeling of SignalingPathways in Higher Plants
Intellectual Merits. Signal transduction pathways hold the key to understanding the early re-sponse of higher plants to abiotic stresses, such as drought, flooding, heat, cold, ozone, and salt.Traditionally, signaling pathways have been difficult to synthesize and impossible to manipulatecomputationally. Current pathway tools and databases provide only limited support for manipulat-ing pathways as networks. In particular, it is not possible for a biologist totake an existing signalingpathway and ask hypothetical questions that are answered computationally. This project builds theBeacon system to provide computational support for biologists’ questions about signaling path-ways. The user interface is an editing environment that represents and manipulates a pathway in astandard graphical notation called SBGN Activity Flow language. The project includes the curationof signaling pathways for plant abiotic stress response by recognized authorities and their archiv-ing in a Beacon database. The database representation allows the biologistto impose a semantics,such as boolean semantics, on a pathway. The Beacon simulation engine is then able to computa-tionally implement those semantics and provide results that can be queried and visualized. Addingor removing relationships in a pathway (adding or removing edges in a network) raises the diffi-cult question of causal inference: Does activity of molecule A cause activity of molecule B? Suchquestions can be assessed computationally and statistically using such tools asGranger causality,Bayesian networks, and structural equation modeling. The Beacon inference engine provides thesetools to allow the biologist to develop testable hypotheses about pathway components. The Beaconsystem is not specific to plant signaling pathways but rather enjoys more general usability.
Broader Impacts. The project will include training and education through well-established out-reach programs at Virginia Tech. These include the Multicultural Academic Opportunities Program(MAOP), which provides research opportunities for students from pre-college through the doctor-ate; S-STEM, which enhances the competitiveness of undergraduates using research experiences;and PREP and PREP-U, which use NSF funding to expose high school and undergraduate studentsto biological research that contrasts phenotypes of Arabidopsis mutant and wild-type plants.

PROJECT DESCRIPTION
1 MotivationA signal transduction pathway is a collection of interacting cellular componentsthat perform theresponse of the cell to an external or developmental signal. A pathway is most conveniently rep-resented by a network with the components as nodes and the interactions as directed edges. Thisrepresentation assists both computational manipulation and user visualization.Signal transductionpathways are keys to understanding the dynamic logic of, for example, plant responses to stress.
Responses and accommodations to adverse changes in the environment, such as drought, salin-ity, cold, and oxygen availability, are at the heart of many plant activities. Climate change eventsare expected to exacerbate the severity and duration of current adverse environmental conditions.Elucidation of the genetic response networks regulating plant dynamic responses to changing en-vironments is daily becoming more of a reality [24, 59, 87, 88, 99, 100, 116,123]. Bioinformaticsapproaches are increasingly available to address these questions. However, the full details of evenone stress signaling pathway are still not clear. Furthermore, although cross-signaling is clearly animportant part of adaptive responses [59, 75, 86, 184, 185], it is unclear to what extent recognitionand response pathways for the various abiotic stresses overlap in any one case.
We propose to expedite the consolidation of existing understanding of stress signaling in plants,facilitate its expansion, and broaden participation in knowledge building across the plant biologycommunity. To this end, we propose to facilitate a systems biology depiction of interlocking molec-ular signaling pathways in plants that respond to abiotic stresses, using extensible curated pathwaysdrawn by authorities in a common graphical language as our starting point.
Deep sequencing of non-model species, of several ecotypes of the model plant Arabidopsis, andof specific crop genotypes, is rapidly increasing our understanding ofplant genomic responses toabiotic stress [26, 38, 97, 151, 166, 189, 191]. Information is availableabout the nature of cell-specific signaling in some cases [9, 34, 119]. Regulatory events at multiple,post-transcriptional,organizational levels are integral components of stress responses [18, 63, 117, 188]. Potentially ofequal or greater importance for plants is the recently discovered role of small RNAs in epigeneticevents that modify gene expression in response to abiotic stress [104, 155].
Challenges Identified. Existing cyberinfrastructure does not support a systems view of signalingpathways in plants. Current tools for signaling pathways are drawing tools, some of which onlyresult in images [50, 133], while others store true networks [73, 74]. The work of creating a sig-naling pathway is painstaking, requiring a thorough understanding of the literature and a carefulpresentation to convey all the concepts present in the literature. The result of such work is typicallya figure in an article and perhaps an entry in a signaling pathway database.The result is only suitedfor limited computational manipulation, because the semantics of the signaling pathway remain inhuman-readable form only. This limitation has a number of negative consequences. Biologists arenot able to take an arbitrary signaling pathway and paint it with omics data fromexperiments togain insight into the operation of the pathway under experimental conditions.Generally applicablesimulation facilities for signaling pathways are limited, so that “what-if” (e.g., knockout or knock-down) experiments are rarely performedin silico. Inferring new causal links in an existing pathwayremains a difficult task; there is limited computational support for suggesting possible new causallinks. Finally, there are no widely accepted standards for the syntax and semantics of signalingpathways.
1
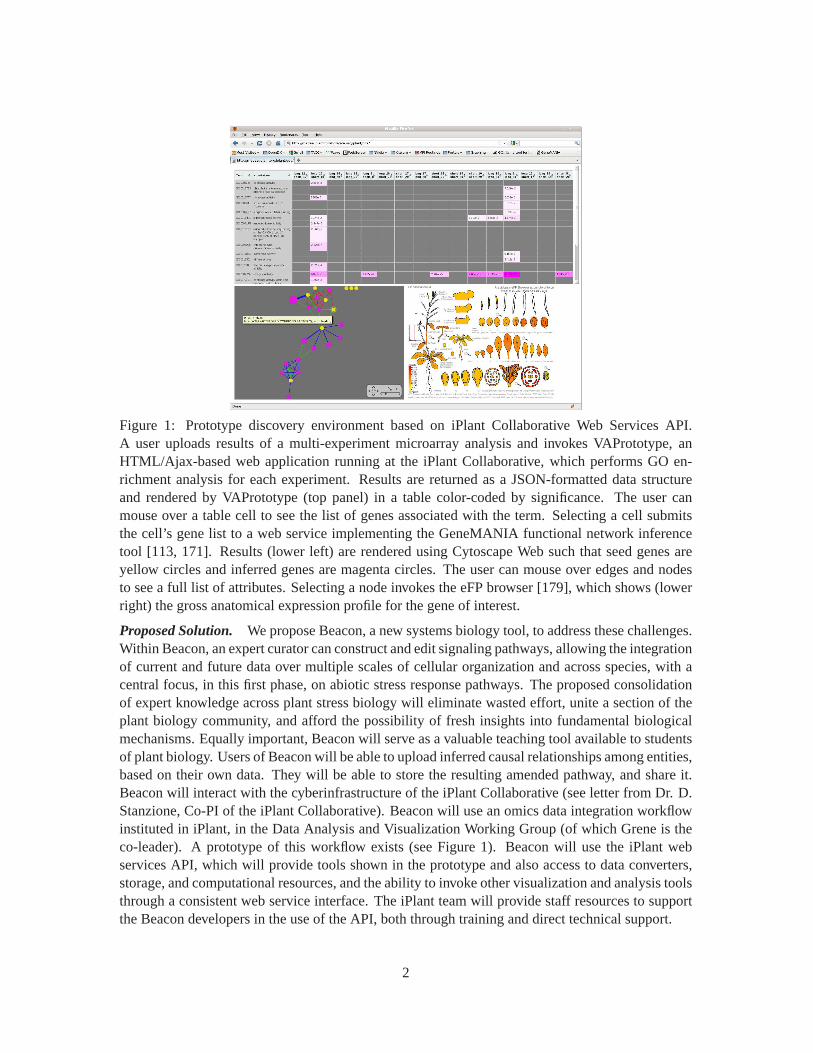
Figure 1: Prototype discovery environment based on iPlant Collaborative Web Services API.A user uploads results of a multi-experiment microarray analysis and invokes VAPrototype, anHTML/Ajax-based web application running at the iPlant Collaborative, which performs GO en-richment analysis for each experiment. Results are returned as a JSON-formatted data structureand rendered by VAPrototype (top panel) in a table color-coded by significance. The user canmouse over a table cell to see the list of genes associated with the term. Selectinga cell submitsthe cell’s gene list to a web service implementing the GeneMANIA functional network inferencetool [113, 171]. Results (lower left) are rendered using Cytoscape Web such that seed genes areyellow circles and inferred genes are magenta circles. The user can mouseover edges and nodesto see a full list of attributes. Selecting a node invokes the eFP browser [179], which shows (lowerright) the gross anatomical expression profile for the gene of interest.
Proposed Solution. We propose Beacon, a new systems biology tool, to address these challenges.Within Beacon, an expert curator can construct and edit signaling pathways, allowing the integrationof current and future data over multiple scales of cellular organization andacross species, with acentral focus, in this first phase, on abiotic stress response pathways. The proposed consolidationof expert knowledge across plant stress biology will eliminate wasted effort, unite a section of theplant biology community, and afford the possibility of fresh insights into fundamental biologicalmechanisms. Equally important, Beacon will serve as a valuable teaching tool available to studentsof plant biology. Users of Beacon will be able to upload inferred causalrelationships among entities,based on their own data. They will be able to store the resulting amended pathway, and share it.Beacon will interact with the cyberinfrastructure of the iPlant Collaborative (see letter from Dr. D.Stanzione, Co-PI of the iPlant Collaborative). Beacon will use an omics data integration workflowinstituted in iPlant, in the Data Analysis and Visualization Working Group (of whichGrene is theco-leader). A prototype of this workflow exists (see Figure 1). Beaconwill use the iPlant webservices API, which will provide tools shown in the prototype and also access to data converters,storage, and computational resources, and the ability to invoke other visualization and analysis toolsthrough a consistent web service interface. The iPlant team will provide staff resources to supportthe Beacon developers in the use of the API, both through training and direct technical support.
2

OmicsData
InferredPathways
ViVAVisualization
InferenceEngine
SignalingPathwayDatabase
SimulationEngine
BeaconUser
InterfaceBioPaxSBML
Figure 2: Beacon system diagram.
As a computational system, Beacon will be able to represent, visualize, and model signalingpathways. While Beacon will be general enough to support a large classof signaling pathways (seeSection 4.2), we will focus on abiotic stress signaling pathways in higher plants. A Beacon systemdiagram is in Figure 2. The central component is the Beacon user interface, which supports editingand visualizing pathways in the Systems Biology Graphical Notation Activity Flowlanguage (seeSection 3). The user interface also controls the movement of data, model simulation, and inference.In particular, Beacon will import and export pathways in several standard formats, including BioPaxand SBML and will import omics data and inferred pathways from tools available from the iPlantCollaborative and other sources (see Section 4.2). Beacon will allow the user to select semanticsfor the components in a pathway and to simulate “what if” scenarios implementing those semantics(see Section 4.3). Beacon will support the inference of new pathway components from importedomics data (see Section 4.3). Omics data and simulation results can be visualized and manipulatedwith the incorporation of the ViVA interactive visual tool into Beacon (see Section 4.2).
Sample Questions to be Addressed Using Beacon.What is understood about specific events inabiotic stress signaling in model plants, crop species, and specific genotypes? What similarities ordifferences exist among responses to different abiotic stresses? What are the unique features of theresponses of specific cell types or tissues? In each case, what inferences can we make about thecausal relationships that drive cellular responses to abiotic stress and their impact on phenotype?
The Availability of Interdisciplinary Scientists. Few plant biologists possess the skills to developa system such as Beacon. However, the combination of expertise in the Beacon team providesthe requisite skill set for the project. The Genetics, Bioinformatics and Computational BiologyProgram at Virginia Tech provides the requisite training for the next generation (see Section 7).Our proposed work will expand this training to other participating institutions through the virtualcommunity created by the authorities and the tools described below.
2 ObjectivesTo attain the Beacon system and database, we have the following specific objectives.
• Objective 1: Provide a curation tool for the SBGN Activity Flow language to a set of authori-ties to create an initial collection of pathways. Provide curation tool educationin a workshop.
• Objective 2: Expand the curation tool to support data import and export and to maintaindata in the Beacon database. Make the database available on the Web. Incorporate the ViVAvisualization tool.
• Objective 3: Add the simulation and inference engines to the Beacon system.
3

AUTHORITY AFFILIATION STRESS
Julia Bailey-Serres University of California, Riverside FloodingMikael Brosche University of Helsinki OzoneJaakko KangasjavriTzyy-Jen Chiou Academia Sinica, Nankang, Taipei Phosphate,
small RNAsViswanathan Chinnusamy Indian Agricultural Research Institute ColdAlejandra A. Covarrubias Instituto de Biotecnologia-UNAM, Mexico Small RNAsJose Reyes and stressJohn C. Cushman University of Nevada Root responses toMel Oliver USDA/ARS drought stressSixue Chen University of Florida Guard cellsRadhika Desikan Imperial College, London and stressRuth Finkelstein University of California, Santa Barbara Abscisic acidJose M. Pardo Instituto de Recursos Naturales y Agrobiologia, Spain SaltBjorn Usadel Max Planck Institute of Molecular Plant Physiology C, NOlena Vatamaniuk Cornell University Heavy metals
Table 1: Plant stress authorities who have agreed to provide curated pathways. In addition, Greneand Pereira will provide generalized drought stress pathways.
• Objective 4: Validate Beacon simulation predictions in collaboration with PREP.
3 Background3.1 Abiotic Stress Signaling
Much data already exist, pointing to genotype-specific variation in the responses of herbaceousplant and tree species to abiotic stress [8, 21, 23, 55, 85, 102, 114, 138, 164, 170, 176, 177, 181].Valuable insights have been obtained through these studies identifying genes or QTLs that indicatepossible molecular pathways explaining intra-specific differential responses leading to stress resis-tance. To date, it appears that genotype-based variation in stress responses may well offer clues as tobases for differential resistance to stress. “Pre-adapted” states arealso important for superior stresstolerance [35, 61, 92, 93, 102]. Nonetheless, such variation, to date,is nearly exclusively based onfitting genes into known, putative, and, in some instances, even conjectured, “resistance” pathways.We propose to first lay out generalized images of molecular stress response pathways in plants thatrepresent current, conventionally held, views. (See below for some examples.) Expert authoritieswill provide specific information in visual form during the first phase of theimplementation ofBeacon. Pathway graphs have been promised (see Table 1), and the responses of the labs contactedhave been very positive. As a second phase, the interlocking pathwayswill be further elaborated toshow variations in responses and/or constitutive states that are documented for individual genotypesand/or crop cultivars, together with any phenotypic observations that are available.
Abscisic Acid (ABA) and Abiotic Stress.ABA is a major regulator of plant responses to abi-otic stresses such as drought, salinity, and cold. These responses aremediated by changes in geneexpression as well as rapid effects on ion fluxes, such as those involved in stomatal closure. Ex-tensive genetic and biochemical studies have implicated well over 100 loci in the ABA responseand have demonstrated both direct and indirect interactions among their products. These loci com-prise numerous families with both redundant and distinct functions at everylevel of the ABA sig-naling network: multiple receptor families, protein phosphatases (PP2Cs) that interact with the
4
PYR/PYL/RCAR receptors, kinases (e.g. SnRKs) regulated directly by thePP2Cs, and transcrip-tion factors, ion channels, and numerous other substrates of the SnRK and other kinase families(reviewed in [31, 137]). Although some signaling components participate in multiple ABA re-sponses, others are specific to subsets of responses, probably through a combination of limitedexpression and preferential interactions. Currently, the best characterized ABA signaling networkis that controlling guard cell function in stomatal regulation, which has been developed as an ex-ample of a systems biology approach to signaling (reviewed in [9]). While manyaspects of thissingle-cell system may function in other ABA responses, the diversity of cellular responses to thisone signal indicates that it is unlikely that there is a universal ABA response module. There is awealth of information that could be assembled to display interactions among specific members ofthe families described above, regulation by secondary messengers, andtheir collective effects ongene expression and cellular metabolism in seeds and seedlings, as well asin guard cells. Over halfof ABA-induced changes in gene expression are induced by droughtand salinity [144].
The Central Role of Reactive Oxygen Species (ROS) Signaling in Responses to Abiotic Stress.Organisms can sense changes in their environment through the employment of controlled ROS-generating and reporting systems [109, 121]. ROS-mediated response pathways constitute a majorcomponent of plant cell responses to biotic and abiotic stresses, allowing adjustment of functionalprocesses to altered conditions [7, 89]. For example, significant flexibilityand precise control overphotosynthesis-related processes is provided by metabolism driven by redox processes [19, 132].Mediating environmental awareness are ROS generators, transmembranefacilitators, signal am-plifiers, calcium-dependent elements, and genes whose activity is controlled by the cellular redoxstate, resulting in altered hormone biosynthesis and metabolic transport processes as crucial down-stream components [66]. ROS responses, which are condition-(i.e. stress)-specific, are suggestedby gene clusters that imply the existence of networks. Distinct signaling cascades target regula-tory factors that shuttle between cytosol and nucleus [66]. Redox signaling is initiated throughligands, enzymes, or changes in membrane potential at, for example, the plasma membrane thatare perceived and internalized by protein tyrosine phosphatases (PTPs), heteromeric proteins, andtransmitted through MAPK cascades [89, 108].
An Example of ROS-Mediated Signaling — Ozone Stress.Plant exposure to elevated atmo-spheric ozone at acute levels can lead to cell death. Ozone enters the leaves through open stomataand immediately degrades to other ROS in the apoplast, including superoxide and hydrogen per-oxide. This ROS production initiates a signaling cascade that involves apoplastic GR1 (GRIMREAPER 1) and an, as yet unidentified, receptor(s) that transfer the signal to the inside of thecell [182]. As a consequence of exposure to ozone, a downstream interaction with plant hormonesignaling pathways occurs, which have a crucial role — salicylic acid and ethylene promote celldeath, whereas jasmonic acid is proposed to contain cell death [125]. Based on chemical treat-ments, phosphorylation and Ca2+ are involved in this signaling pathway, although the exact proteinsare not identified yet. The rcd1 (RADICAL-INDUCED CELL DEATH) mutant is ozone sensitive,showing higher rates of cell death than wild type Arabidopsis plants, indicating that RCD1 regulatessome aspects of cell death, possibly related to its interaction with several transcription factors [65].ROS scavenging through antioxidant defenses are important to control the level of cell death; lowascorbic acid mutants (vtc) are ozone sensitive [29]. Ozone entry to the apoplast leads to ROSproduction and activation of as yet unidentified receptor(s) that transfer the signal to the inside ofthe cell. The Ca2+ transporter DND1 (DEFENSE NO DEATH 1) mediates an essential signalingstep, since ozone induced changes in gene expression are absent in dnd1 [183]. Inside the cell, one
5
of the earliest events detected in response to ozone is activation of MAPK signaling (MPK3 andMPK6) and transport of MPK3 and MPK6 from the cytosol to the nucleus [1]. The plant hormonessalicylic acid and ethylene act as positive regulators, and NPR1 acts as a negative regulator.
ROS, ABA, and Secondary Messengers: Water Deficit and Flooding-Induced Responses.Thefrequency and severity of droughts and flooding are expected to increase in many regions of theworld, while decreased runoff can be expected to impair reservoir and ground water recharge.Inter- and intra-specific gene expression studies have identified multiple pathways that are regu-lated in response to water stress [80, 110, 164, 173, 174], and flooding [117, 118]. In the caseof severe flooding and submergence, plants are faced with an energy crisis that requires effectivemanagement of energy reserves. Submergence tolerant rice adopts a quiescence strategy, limit-ing gibberellin-activated elongation growth and conserving carbohydrates [15, 42]. Study of lowoxygen and submergence responses in Arabidopsis and wild species (e.g., Rumex) indicate thata quiescence strategy can also outweigh the benefit of rapid growth to escape submergence. Ingeneral, in the case of drought, osmotic changes, “recorded” at the cell membrane, are transducedin the form of rapid metabolic changes involving generation of ROS, ABA biosynthesis, and longdistance transport from its site of synthesis to cellular sites of action via transporter-mediated pro-cesses, where it binds to specific receptors, phospholipid metabolism, which includes the generationof secondary messengers such as phosphatidic acid, calcium sensing and the action of calcium onsignaling pathway components, antioxidant signaling and defense pathways, and the synthesis ofprotective molecules [16, 45, 91, 137, 141, 186]. It is increasingly clear that the ubiquitinationmachinery also plays a crucial role in the modulation of drought signaling pathways [27, 134, 192].
Role of Small RNAs in Stress Signaling.The many different types of small non-coding RNAs,their genes, expression characteristics, and influence on the coding part of the transcriptome arealready beginning to revolutionize our views of how phenotypes are determined [120, 193]. SmallRNAs have also been implicated in the regulation of proline biosynthesis undersalt stress [17].Regulatory effects of specific microRNAs (miRNAs) exerted by modulating transcript amount orturnover of those genes that are their targets have been shown for drought, salt, nutrient (phosphate,nitrogen, and sulfur), and temperature stress in a range of plant species [25, 76, 126, 156, 157]. Inaddition to transcriptional control, small RNAs may also exert inhibitory effects on translation [20].At this time, various stress-responsive miRNAs have been identified in various plant species, andputative targets have been assigned for many of them; however, these data remain to be verified(reviewed in [30]). The identity of the validated targets indicate that miRNAs are implicated in theregulation of transcripts encoding a wide variety of proteins, e.g., transcriptional factors (involved incold, drought, salinity and ABA responses), antioxidant enzymes, ion transporters, F-box proteins,AGO1, hormone metabolism and signaling, among others (reviewed in [30, 67]).
3.2 Computational Background
Signaling Pathway Databases.PathGuide [14] lists 62 signaling databases, most of which sup-port rendering pathway drawings (visualization) and many of which storepathways as networks,allowing the export of pathways in standard formats such as SBML and BioPax. We review somekey signaling pathway databases here. The Arabidopsis Reactome [159]is a general plant systemsbiology resource that is built on a generalized notion of “reaction”. KEGG[74] is a general resourcefor pathway information that emphasizes metabolic pathways. NetPath [73] is adatabase of curatedhuman signaling pathways stored as networks and with reactions annotated by the published liter-ature; it is supported by the PathBuilder system [72]. Science’s Signal Transduction Knowledge
6
Environment (STKE; [49, 50]) is a small database of curated pathways,supported by the literatureand available only as images. Reactome [106] is a general resource for human and other pathwaysthat includes analysis of user-supplied omics data to identify events or pathways that are overrep-resented in the data. TRANSPATH [28] is a signaling pathways database augmented with Array-Analyzer software to interpret microarray (up- and down-regulation) data to extract subnetworksfrom the genes or proteins identified as significant in the microarray. The DMSP database [169]takes protein-protein interaction information as the basis for mathematical modeling and simulationof signaling pathways using the traditional ordinary differential equation (ODE) style of modeling.SPIKE [36] is a signaling pathway database combined with an algorithmic enginethat does basicgraph-theoretic analysis of paths and connections as well as identifying pathways that are enrichedwith respect to a set of user-supplied genes. One signal transduction database of popular interestis Wikipathways [77, 133], which follows the Wiki paradigm of collaborative editing and henceincludes a visual editing tool PathVisio [162]. The system does not support any standard graphicallanguage and only represents a pathway as a drawing, not as a network. These systems are generallylimited by a lack of a means to infer new pathway components and by pathway semantics that arerestricted to the ODE view. Beacon will overcome both of these limitations (see Section 4.3).
Systems Biology Graphical Notation (SBGN).SBGN [122] is a standard visual notation for sys-tems biology diagrams, consisting of three languages: Process Description(PD), Entity Relation-ship (ER), and Activity Flow (AF). PD supports temporal changes in the activity of metabolicpathways [64]. AF depicts the information flow in a biological network and is most suited to rep-resenting signaling pathways, where intermediary metabolism plays a lesser role. A node in anAF diagram is either an activity node or a container node (for encapsulation; using SBGN, Beaconwill be able to support cellular compartments). Most activity nodes represent the activity of somebiological entity, with the remainder representing either a perturbation or a phenotype (broadly in-terpreted, ranging from apoptosis to life span). An arc (edge) typically represents either a positiveinfluence, with a→, or a negative influence, with a⊣. AF also supports boolean logic (AND, OR,and NOT). See Figure 3 for an example; it is a rendering of the ABA signaling pathway in thenucleus of guard cells in Figure 2(b) of Raghavendra et al. [137]. Itwas drawn with SBGN-ED(see below). The polygon at the top labeled “ABA” is a perturbation node,representing a changein ABA levels. Rectangles represent the activities of biological entities; forexample, rectangle“ABI5” represents the DNA binding of transcription factor ABI5, while rectangle “transcription”with the decoration “ABRE” represents transcription regulated by an ABA responsive element. ThisAF diagram is a typical rendering of signaling pathways found in the literature, where biologicalinformation flow, either positive or negative, is represented. mEPN [40] isanother proposed visualrepresentation but does not enjoy the level of community support that SBGN does.
Pathway Drawing Tools. Most pathway drawing tools are especially for metabolic pathways, buta few have functionality specific to signaling pathways. Few are based on any graphical standard.We do not survey general network visualization tools, such as Cytoscape; they are not well-suitedto drawing signaling pathways and annotating their semantics, because they take in large networksfor visualization and rely on automatic layout algorithms. PathText [78] supports construction ofpathways by automatic text mining of the literature; it uses the Payao system andCellDesignerto visualize pathways. Payao [105] is a collaborative web service platform for curating SBMLmodels. CellDesigner [43] provides the drawing environment for Payao and uses the SBGN ProcessDescription language, making it most suitable for metabolic pathways; CellDesigner is not opensource. Arcadia [168] translates SBML into SBGN Process Description language and is specifically
7

Coupling Element
CPK4 Kinase Activity
CPK4
SnRKs
ABI5
mRNA
ABRE
Ca2+
ABI3
ABI4
CPK4
Transcription
ABRE
Complex
ABI1−RCAR
Complex
ABI3−ABI5
Complex
ABI4−CE
OST1
ABA
NOT NOT
ANDAND
Figure 3: SBGN Activity Flow language. ABA is made under drought conditions. This ABAincrease relieves inhibition of OST1, which activates ABI5. Increases inABA also result in anincrease in calcium, culminating in activation of transcription factors (TFs), which bind to ABREwith ensuing gene activation. CPK4 is a calcium-dependent protein kinase.Adapted from [137].
for metabolic pathways. ChiBE [13] is a tool for visualizing pathways represented in BioPAXformat. Schreiber et al. [140] provide a general-purpose drawing tool meant to allow the user todraw any kind of biological network and customize the layout. Byrnes et al.[22] develop a PathwayEditor in the Biopathways Workbench that allows for drawing and data visualization; it is especiallysuited to KEGG pathways. SNAVI [101] is a tool for visualizing signaling pathways, with anemphasis on analyzing clusters, connectivity, and motifs. PathVisio [162] isa graphical editor forbiological pathways based on a new XML file format but with no semantic content. SBGN-ED iscurrently the only graphical editor that supports SBGN Activity Flow language and will soon beavailable as an open source project (Tobias Czauderna, personal communication).
Interactive Data Visualization. In interactive data visualization, the scientist operates on data “onthe fly” and drives the analysis in real time based on hypotheses, intuitions,and observations. In-teractive visualization has become increasingly prevalent in biology, especially tools for studying“omics” data, such as Spotfire [33], Genespring, and EGAN [127]. For interactive data visualiza-tion, Beacon will use ViVA, an analysts workbench developed by the Exploratory VisualizationGroup at the IBM T.J. Watson Research Center [135, 136]. Bernice Rogowitz, group manager anda Beacon collaborator, contributed visual analysis methods based on human perception [53, 54].ViVA is open source (SourceForge) through the iPlant Collaborative. It offers multiple comple-mentary pictures of the data and supports direct manipulation of objects represented in the picturesand dynamic linking, where applying a feature (such as color) to a subsetof the data is automati-cally reflected in all the pictures. The pictures include not only standard views, such as histogramsand scatter plots, but also category tables, metadata tables, tree lists, dendograms, and others. Thedynamically-computed univariate and bivariate statistics tables provide a richarray of descriptivestatistics, supporting comparison and convenient data subsetting. ViVA includes 250 mathematicalfunctions, allowing the user to transform variables and create new ones on the fly.
8

4 Proposed Research4.1 Objective 1: Curation
Provide a curation tool for the SBGN Activity Flow language to a set of authorities to create aninitial collection of pathways. Provide curation tool education in a workshop.
We will have authorities on individual signaling pathways (see Table 1) curate pathways inhigher plants. To facilitate curation, initial development will concentrate on theediting capabil-ities of the user interface. The result will be a curation tool that will allow authorities to enterpathways in SBGN Activity Flow language, edit them, annotate them, and save them to an initialBeacon database. The user interface will be built on the network visualization tool VANTED [69]and SBGN-ED, an extension of VANTED. We will extend SBGN-ED to createour curation tool.Usability of the tool will be addressed via a continual feedback loop between users and developers.
A 2-day training workshop for two members of each authority’s group will be held at VirginiaTech early in Year 2. Attendance at the workshop will be capped at 20 visitors. Co-PIs Grene andHeath and their students will serve as instructors. One session will be devoted to interactive dis-cussions and informal presentations by each visitor to establish a common focus within the group.Other sessions will be hands-on, in groups of two, with a final session dedicated to presentations inBeacon. Students and post-doctoral fellows will give the presentations.For groups not attendingthe workshop, we will have subsequent online training sessions on the curation tool.
4.2 Objective 2: Initial Beacon System
Expand the curation tool to support data import and export and to maintain data in the Beacondatabase. Make the database available on the Web. Incorporate the ViVA visualization tool.
Beacon Pathway Representation.Pathway representation is central to the power and flexibility ofBeacon. SBGN activity nodes, as used in Beacon, can be molecules, perturbations (e.g., “moisturelevel” or “ABA”), phenotypes (e.g., “apoptosis” or “stomatal closure”), or unknown mechanisms.The last three types of nodes are found inad hocsignaling pathways from the literature, such as theone in the Assmann review [9], but they are not available in STKE, SBML, or BioPax. Standardedge types, such as “positive influence” and “negative influence” in SBGN Activity Flow language,are typically used when Boolean semantics (i.e., nodes are either switched “on” or switched “off”)are used to interpret (model) the pathway. Beacon will fully support Boolean semantics, includingarbitrary logical functions for nodes and propagation delays on edges. Beacon will also supportmore general variable values at nodes, including more than two discrete levels and continuous val-ues (see Section 4.3). Hence, the Beacon pathway representation will include semantic information,such as variables and transfer functions, for each node. This semanticinformation will constitutea semantic model for the pathway, which can be simulated using Beacon (see Section 4.3). Anno-tations for nodes, such as cellular location, will be provided in the databaseand the visualizations.Note that pathways may overlap (have common components). Beacon will support links betweenoverlapping pathways and merging them into more comprehensive pathways.
Beacon Data Import and Export. Beacon can import and export pathways in the standard formatsSBML and BioPax. Many pathway databases support export in one of these formats, so it will befeasible to import pathways into Beacon from those databases. Note that BioPax is an OWL-basedontology for metabolic and signaling pathways. Beacon will import and export BioPax signalingpathways only. Beacon has the capability to import omics data to overlay on the pathway visualiza-tion and to use in inferring possible new relations or annotations for the pathway (see Section 4.3).
9
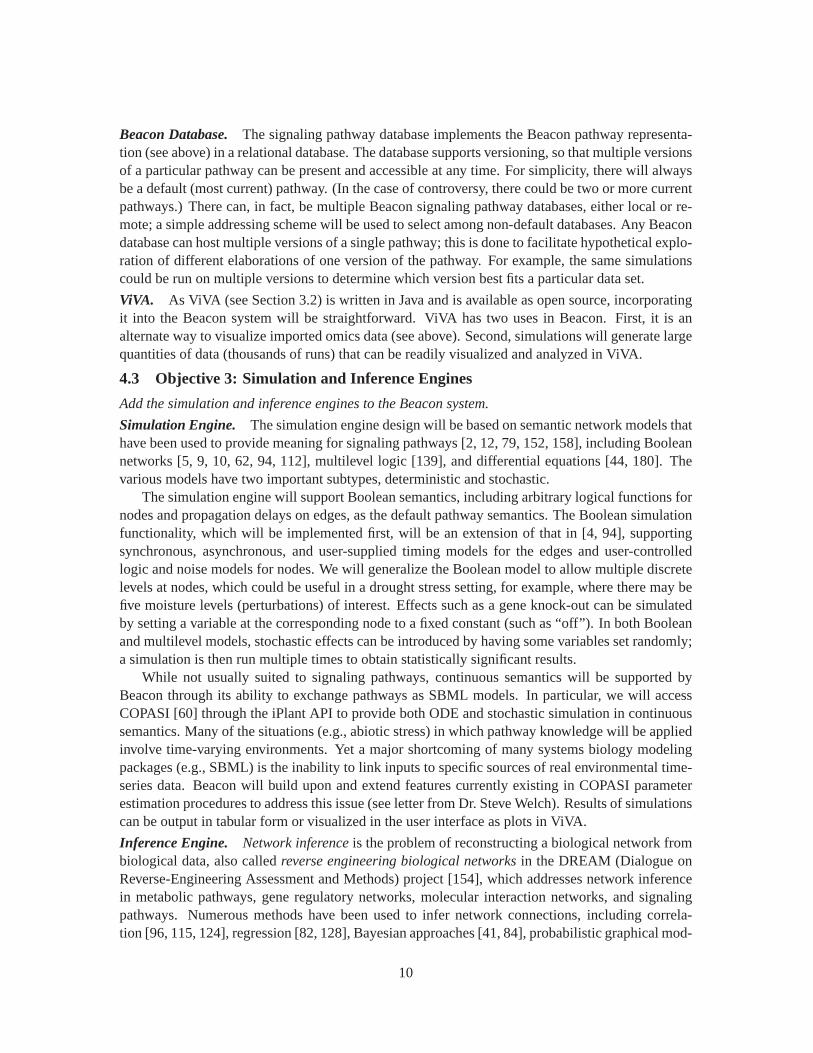
Beacon Database. The signaling pathway database implements the Beacon pathway representa-tion (see above) in a relational database. The database supports versioning, so that multiple versionsof a particular pathway can be present and accessible at any time. For simplicity, there will alwaysbe a default (most current) pathway. (In the case of controversy, there could be two or more currentpathways.) There can, in fact, be multiple Beacon signaling pathway databases, either local or re-mote; a simple addressing scheme will be used to select among non-default databases. Any Beacondatabase can host multiple versions of a single pathway; this is done to facilitatehypothetical explo-ration of different elaborations of one version of the pathway. For example, the same simulationscould be run on multiple versions to determine which version best fits a particular data set.
ViVA. As ViVA (see Section 3.2) is written in Java and is available as open source, incorporatingit into the Beacon system will be straightforward. ViVA has two uses in Beacon. First, it is analternate way to visualize imported omics data (see above). Second, simulationswill generate largequantities of data (thousands of runs) that can be readily visualized and analyzed in ViVA.
4.3 Objective 3: Simulation and Inference Engines
Add the simulation and inference engines to the Beacon system.
Simulation Engine. The simulation engine design will be based on semantic network models thathave been used to provide meaning for signaling pathways [2, 12, 79, 152, 158], including Booleannetworks [5, 9, 10, 62, 94, 112], multilevel logic [139], and differential equations [44, 180]. Thevarious models have two important subtypes, deterministic and stochastic.
The simulation engine will support Boolean semantics, including arbitrary logical functions fornodes and propagation delays on edges, as the default pathway semantics. The Boolean simulationfunctionality, which will be implemented first, will be an extension of that in [4, 94], supportingsynchronous, asynchronous, and user-supplied timing models for the edges and user-controlledlogic and noise models for nodes. We will generalize the Boolean model to allowmultiple discretelevels at nodes, which could be useful in a drought stress setting, for example, where there may befive moisture levels (perturbations) of interest. Effects such as a gene knock-out can be simulatedby setting a variable at the corresponding node to a fixed constant (suchas “off”). In both Booleanand multilevel models, stochastic effects can be introduced by having some variables set randomly;a simulation is then run multiple times to obtain statistically significant results.
While not usually suited to signaling pathways, continuous semantics will be supported byBeacon through its ability to exchange pathways as SBML models. In particular, we will accessCOPASI [60] through the iPlant API to provide both ODE and stochastic simulation in continuoussemantics. Many of the situations (e.g., abiotic stress) in which pathway knowledge will be appliedinvolve time-varying environments. Yet a major shortcoming of many systems biology modelingpackages (e.g., SBML) is the inability to link inputs to specific sources of realenvironmental time-series data. Beacon will build upon and extend features currently existingin COPASI parameterestimation procedures to address this issue (see letter from Dr. Steve Welch). Results of simulationscan be output in tabular form or visualized in the user interface as plots in ViVA.
Inference Engine. Network inferenceis the problem of reconstructing a biological network frombiological data, also calledreverse engineering biological networksin the DREAM (Dialogue onReverse-Engineering Assessment and Methods) project [154], which addresses network inferencein metabolic pathways, gene regulatory networks, molecular interaction networks, and signalingpathways. Numerous methods have been used to infer network connections, including correla-tion [96, 115, 124], regression [82, 128], Bayesian approaches [41, 84], probabilistic graphical mod-
10
els [32, 187], information theory [172, 194], algebraic methods [153],logical methods [51, 62, 81],machine learning [71, 111], and evolutionary algorithms [148]. Most of these methods are notapplicable to signaling networks due to the directed edges that connote causality.
Computationalcausal inference[46, 131] narrows the problem considerably, as each causalrelationship (directed edge) is taken to mean that the antecedent is the resultof the precedent throughsome, perhaps unknown, mechanism. Such causal relationships can be suggested by various typesof omics data. We first discuss time-course data and then contrast data (e.g., wild type versusmutant) in which an experimental intervention (e.g., gene knockout) sets some cellular activity toalways on or always off (for boolean semantics). Some prior work specifically utilizes time-coursedata in network inference [6, 32, 115, 145], with some of it especially forsignaling networks [48,68, 90]. Granger causality is a popular method for causal inference from time-course data [56, 115,142, 195]. This method uses statistical correlation to infer whether one variable (e.g., expressionof gene A) is causally related to another (e.g., expression of gene B). The Beacon inference enginewill implement Granger causality, which is generally applicable when there areadequate time-seriesdata [195]. Beacon will borrow from existing code for Granger causality (e.g., [142]).
For experimental data that shows a contrast between treatments, Pearl [130] demonstrates howto use directed graph-based models and suitable algorithms to infer the presence or absence ofcausal links. He covers Bayesian networks [37, 46, 187], which arebased on directed acyclicgraphs, and pathway analysis in structural equation modeling [83, 95, 143], which may have di-rected cycles and hence are more directly applicable in the context of signaling pathways. (Notethat MetaReg [161] does causal inference in Bayesian networks and hence does not support directedcycles.) Application of these models to causal inference proceeds as follows: A small number ofmodels (graphs) to test are proposed, and the implications of each model are evaluated statisticallyagainst empirical data [83]. In the case of structural equation modeling, the statistical analysis canbe provided by OpenMx, open source software based on the R programming language; Beacon willincorporate OpenMx into the inference engine. The Beacon inference engine will return the modelsin a ranked list in order of probability given the data. In most cases from the literature, each modelhas to be constructed from scratch by integrating whatever omics and otherdata is available. InBeacon, we have the advantage of already having curated signaling pathways (see Section 4.1) andonly needing to extend or edit a pathway with additional nodes and edges. Given general guidancefrom the user, Beacon can automatically generate all the models to be tested.
There is also the issue of removing edges that may be redundant, disproven, or represent anindirect rather than a direct causal influence. In the literature, this is addressed with the graph-theoretic algorithm of transitive reduction [3, 4]. In the Beacon inferenceengine, we will alsoimplement transitive reduction, or use the existing NET-SYNTHESIS software [70], to suggestedges that may be redundant.
4.4 Objective 4: Experimental Validation
Validate Beacon simulation predictions in collaboration with PREP.Predictive roles of genes involved in signaling pathways and the direction of signal transduction
needs to be validated to be able to base further studies on integrating the pathways. As a proofof concept, phenotypic characterization of Arabidopsis mutations in selected genes predicted inBeacon simulations to play a crucial role in stress signaling will be carried outin Years 3 and 4, incollaboration with Dr. Erin Dolan of PREP and PREP-U (see Section 7). Drought and salt stresspathways will be experimentally dissected for early signaling and cross-talk. A number of useful
11

standardized phenotypic assays and conditions for assessing the relative tolerance of Arabidopsishave been described [167], and several of these assays (1–3 below) will be used in the proposedproject. The effect of mutations in signaling genes will be assessed for perturbations in the abioticstress pathways by comparing the effects of stress imposition on mutant and wild type genotypes on:(1) growth characteristics: leaf number, leaf area, biomass accumulation, seed yield, root length,and growth; (2) phenology: bolting and flowering time; (3) leaf water content, photosynthetic rate,and stomatal conductance; and (4) the expression of selected genes that are predicted by Beacon tobe downstream of the mutant gene in each case, using quantitative RT-PCR.
Drought Stress Screens. Arabidopsis plants will be grown in Metro-Mix 350 in a controlledenvironment chamber (Conviron, 16 hour photoperiod, 22◦ day, 18◦ night). Water will be withhelduntil 50% RWC is reached in each case, after which time the plants will be re-watered and allowedto recover until the wild type genotype has reached pre-stress levels. (The extent of recovery fromdrought stress at the 50% RWC level in the mutants will be revealed in the course of the exper-iments.) The time of drought imposition will be ca. 20 days after sowing. Photosynthesis andleaf water content will be measured daily from the time of imposition of stress. One (maximum)stress and one recovery time point will be taken.Salinity Stress. Plants will be grown as describedabove for drought stress exposure prior to the stress imposition step. Salinity stress will be initi-ated at the same developmental stage as drought stress. Leaf number will be measured at the timethat the stress is initiated. At the start of the experiment, plants will be watered with 0 (control),or 150 mM NaCl in steps of 50mM separated in time to allow for adjustment by the plant [47].Phenology. Bolting and flowering time will be recorded for each genotype and each treatment, aswell as leaf number at bolting, and seed yield. (Note that these measurementscan be representedas SBGN phenotype nodes.) Gas exchange will be measured with a Li-Cor photosynthesis meter,with Arabidopsis chamber, as is routine in the Grene laboratory [103, 102,175]. In each case, sta-tistical tests (e.g., ANOVA) will be applied to the data, and differences between genotypes at the95% confidence level determined.Quantitative RT-PCR (qRT-PCR). qRT-PCR will be carriedout on selected samples by the method of Vandesompele et al. [163], which isroutinely used in theGrene laboratory [102, 164, 165]. The control transcripts used forstandardization will be UQ10 forsalinity stress [47] and adenosine kinase for drought stress [164].
5 Beacon User ScenarioThis scenario is fictional, although relevant to work to which our group contributed [92].
Experiment. Two genotypes of Arabidopsis thaliana are subjected to long-term, low level,expo-sure to the oxidizing air pollutant ozone. The genotypes differ only by a knockout mutation at a sin-gle locus G, a candidate regulatory gene, belonging to a large transcriptionfactor (TF) family. Thetime course experiment has several samples taken over the expected normal life cycle of Arabidop-sis for gene expression and phenotypic measurements. Since one phenotypic manifestation of ozonestress, at least at acute levels, is early senescence, “senescence status” is assessed through measure-ments of photosynthesis, chlorophyll levels, and the expression of well-characterized SenescenceAssociated Proteins (SAGS) and of the regulatory gene WRKY53 [11, 39, 107, 190].
Question Posed. What effect does knocking out gene G have on molecular defenses against long-term ozone stress, such as that experienced by field-grown plants under current and expected futureclimatic conditions?
12

Year 1 Year 2 Year 3 Year 41 2 3 4 1 2 3 4 1 2 3 4 1 2 3 4
ObjectiveObjective 1: CurationObjective 2: Initial Beacon systemObjective 3: Simulation and inference enginesObjective 4: Validation
Table 2: Activity schedule for Beacon objectives
Data Mining. The results of applying a GO enrichment algorithm to the transcriptomic results(see Figure 1) suggest that Pathways A and B did not respond in treatedmutant genotype plants,and that putative Regulator X was expressed to a lesser extent, and at a later time point, than inozone-exposed wild type plants. (Expression of X did not differ between the two genotypes in theabsence of ozone stress.) The phenotypic data suggest an early onset of senescence in the absenceof a functioning Gene G in the mutant genotype, and a partial, gradual, acclimation to ozone stressin the wild type plants. Using the Beacon simulation and inference engines, GeneMania [113, 171],and eFP Browser [179], a view of the current understanding of signaling pathways in which Gand/or X are thought to participate is obtained, in addition to actual data aboutother experimentalconditions under which the expression of these genes is affected. Currently, there is no comprehen-sive repository of stress signaling pathways in plants and no integration ofresults from differentsources. The implementation of Beacon will fill the first need and the iPlant workflow the second.
Results. Results obtained computationally suggest that X, the timing and extent of whoseexpres-sion is partially controlled by TF G, acts downstream to affect the timing of hormone-regulatedprocesses associated with defense against ozone [98, 178], but not previously associated with theonset of senescence. The data-processing tools employed and the nature of the experimental designallow distinctions to be made between early responses to the stress and later acclimation processes.There was also an association with a ubiquitination pathway that was not observed before for ozoneaction, although this connection was already reported for drought stress [134].
6 Management PlanObjectives, task distribution, milestones indicated in Table 2.Objective 1 Curation: GRA/Grene(PPWS), PD/Pereira (VBI).Objective 2 Initial Beacon system: GRA/Heath (CS).Objective 3Simulation and inference engines: GRA/Heath (CS), GRA/Grene (PPWS).Objective 4 Exper-imental validation: GRA/Grene (PPWS), PD/Pereira (VBI).Responsibility: Co-PI Grene coor-dinates the Curation effort in communication with external collaborators (letters of commitment).Co-PI Heath supervises the training of GRAs/PD for accomplishment of computational tasks. PIPereira supervises tasks under objectives 1 and 4.Annual milestones and deliverables: Year 1 —Curation of biological data and workshop for dissemination of methodology toa global consortiumof Collaborators. Year 2 — Beacon databases and tools established for interaction with users. Year3 — Simulation and inference engines available for user studies. Year 4 — Beacon pipeline basedpredictions validated by case studies.Internal communication is done by weekly project meet-ings, including bi-weekly video/tele-conferencing with collaborators, to discuss specific signalingpathways. Workshop in the second year will be used for initial training of external collaborators.Beacon will be implemented in a portable language (e.g., Python or Java). TheMySQL relationaldatabase system will be used for the Beacon database (Heath).Sustainability Plan. All code forBeacon will be freely available through an appropriate open source license and distributed perma-
13
nently through SourceForge. Once completed, tools will be made available ontop of the iPlantinfrastructure, allowing both tools and data to remain on active servers past the end of funding.
7 Broader ImpactsThe proposed Beacon system, to serve as a repository and simulation engine for molecular signalingpathways in plants and their relationships to phenotypic effects, will interestundergraduate studentsin the computational sciences or computational biology, as well as experimental biologists. Well-established outreach programs will be used to provide training and educational outreach activities.
Multicultural Academic Opportunities Program (MAOP). The mission of the MAOP program isto encourage and support the academic achievements of a diverse student body in STEM fields fromVirginia Tech. Programs and activities serve students from the pre-college through the doctoratelevel with a continuum of financial, academic, and social support, as well as research opportunities.VBI (the PI’s affiliation) participates in the MAOP program by sponsoring and/or hosting summerresearch internships for undergraduates [160]. Co-PI Grene hasclose ties with the MAOP programand has served on the Advisory Board for an NSF-funded project through MAOP from 2007–2009(see letter of support from Dr. Karen Sanders, Interim Vice President for Diversity and Inclusion).
S-STEM. (See letter of support from Dr. Jill Sible, Associate Dean, College of Science, VirginiaTech). The NSF-funded S-STEM Program trains a cohort of undergraduates in the classroom andlaboratory to be competitive for careers in biotechnology. S-STEM scholars take common classesand participate in a weekly seminar dedicated to academic and career preparation, research skills,ethics, and diversity. Beginning in their sophomore year, students are encouraged to participate inlaboratory research. These research experiences will be enhanced with funds from the proposedproject. S-STEM students can be important early users of the Beacon system, performing completepathway analyses. The Co-PIs will supervise the S-STEM students. Starting with relevant omicsdata, they will be invited to visualize those data in the context of a Beacon signaling pathway,use the data to infer new pathway fragments with the Beacon inference engine, conduct “what-if”exploratory simulations with the Beacon simulation engine, and commit any new pathway versionsto a Beacon database. Their feedback to the team will be highly valued.
PREP and PREP-U. We will collaborate with Dr. Erin Dolan at Virginia Tech, principal investi-gator of the Partnership for Research and Education in Plants (PREP) and PREP for Undergraduates(PREP-U), and David Lally, PREP coordinator. Through PREP (supported by a Science EducationPartnership Award from the National Center for Research Resources; see attached support letter),and PREP-U (initiated with funding from the NSF Course, Curriculum, and Laboratory Improve-ment Program), high school students and undergraduates challenge Arabidopsis mutant and wild-type plants with abiotic stresses, therefore providing opportunities to conduct authentic scientificresearch. Beacon results will be utilized to frame investigations appropriatefor these students.Students will then design and conduct experiments as tests of Beacon-generated hypotheses andreport their findings back to project investigators. The PIs will be directlyinvolved in PREP andPREP-U activities in three ways. First, they will collaborate with Dolan and Lallyto develop briefvideo pieces explaining in non-technical language the types of experimentsworthy of investigation.Second, they will provide laboratory materials appropriate for students to design and conduct theinvestigations. Third, in collaboration with Dolan, Lally, and PREP and PREP-U instructors, the PIswill discuss students’ investigations with them, either in person or using web technologies such asPREP/PREP-U discussion boards, wikis, or video chats. These discussions will encourage students
14
to develop reasoning and argumentation skills by prompting them to support their experimentaldecisions with evidence (e.g., why an investigation is worth doing, why a particular experimentaldesign makes sense, and what interpretations are supported given theirexperimental results).
Genetics, Bioinformatics, and Computational Biology (GBCB).The interdisciplinary GBCBPh.D. program is a new area of study tailored to students’ individual backgrounds. Co-PIs Greneand Heath are founding members of GBCB and serve on its steering committee. The program en-compasses the applications of molecular biology, genomics, mathematics, statistics, and computerscience to the life sciences. GBCB is designed to provide a combination of discipline-specific andcross-disciplinary course work, as well as a multidisciplinary research environment. GBCB fac-ulty members come from 11 departments and the Virginia Bioinformatics Institute. Four specialtytracks are defined: Life Sciences, Computer Science, Statistics, and Mathematics. Each studentspecializes in a track to which he or she is suited and is required to gain expertise in at least oneother track. All students are required to receive some training in the life sciences, regardless of theirchosen track. The Beacon project will hire GBCB students for the computational part of the projectand will recruit GBCB students in the life sciences track to assist with Objective 4.
8 Results from NSF SupportCurrent: Plant Genome Award. Pereira (PI), Grene (Co-PI), and others obtained the Plant Ge-nome Research Program award DBI-0922747 ($2.4M; 9/15/09 – 8/31/12) “Cereal Drought StressResponse and Resistance Networks”. Drought gene interaction networks are being created in riceand maize to provide a systems view of drought gene functions. Transcriptome data from Arabidop-sis and cereals were generated for a comparative analysis across plants, using standardized droughttreatments to simulate field drought conditions. Differentially regulated genes were compared usingorthologous loci, and significant species-common drought down-regulated genes identified repre-sented by the GO-slim categories. Putative drought responsive rice regulatory genes were identifiedwith available Ds/dSpm transposon inserts (approximately 150). The homozygous mutant linesare being generated to characterize the drought responsive phenotypes. The rice-maize commonregulatory genes will be used to identify candidate drought responsiveorthologs in maize, to bevalidated by association analysis for dissection of drought response phenotypes. The gene interac-tion networks developed for Arabidopsis and rice are being used to studyother biological pathways.
Prior: ITR Award. Heath (PI) and Grene (Co-PI) had “ITR-0219322: Understanding Stress Re-sistance Mechanisms in Plants: Multimodal Models Integrating Experimental Data, Databases,and the Literature” ($499k, 09/01/2002 – 12/31/2006, and a DCC supplement for work with theInternational Potato Center in Peru) and developed the multimodal network concept to integratebiological information from functional genomic data on drought stress in Arabidopsis genotypes,online databases, and the literature to represent and analyze molecular stress-resistance mechanismsin plants. XcisClique, a system developed in the Grene/Heath group, associates annotated genomeand gene expression data; models known cis-elements as regular expressions; identifies maximalbicliques in a bipartite gene-motif graph; and ranks bicliques based on their computed statisticalsignificance. XcisClique analysis of the promoter regions of Arabidopsis HSP90s and their putativeco-chaperones identified candidate co-chaperones for each HSP90in abiotic stress-responsive genesat the Nottingham web site. Wet lab projects in the areas of drought stress,ozone stress, and effectsof elevated carbon dioxide were completed. The central focus was on theresponses of particularaccessions to stress. Response diversity reflected differences in constitutive and inducible networks.Publications include [52, 57, 58, 92, 93, 102, 103, 129, 146, 147, 149, 150, 164, 165, 173, 174].
15
References cited[1] R. AHLFORS, V. MACIOSZEK, J. RUDD, M. BROSCHE, R. SCHLICHTING, D. SCHEEL,
AND J. KANGASJARVI, Stress hormone-independent activation and nuclear translocationof mitogen-activated protein kinases in Arabidopsis thaliana during ozone exposure, PlantJournal, 40 (2004), pp. 512–522.
[2] R. ALBERT, Network inference, analysis, and modeling in systems biology, Plant Cell, 19(2007), pp. 3327–3338.
[3] R. ALBERT, B. DASGUPTA, R. DONDI, S. KACHALO , E. SONTAG, A. ZELIKOVSKY, AND
K. WESTBROOKS, A novel method for signal transduction network inference from indirectexperimental evidence, Journal of Computational Biology, 14 (2007), pp. 927–949.
[4] R. ALBERT, B. DASGUPTA, R. DONDI, AND E. SONTAG, Inferring (biological) signaltransduction networks via transitive reductions of directed graphs, Algorithmica, 51 (2008),pp. 129–159.
[5] R. ALBERT AND R. S. WANG, Discrete dynamic modeling of cellular signaling networks,Methods in Enzymology: Computer Methods, Part B, 467 (2009), pp. 281–306.
[6] I. P. ANDROULAKIS, E. YANG, AND R. R. ALMON, Analysis of time-series gene expressiondata: Methods, challenges, and opportunities, Annual Review of Biomedical Engineering, 9(2007), pp. 205–228.
[7] K. A PEL AND H. HIRT, Reactive oxygen species: Metabolism, oxidative stress, and signaltransduction, Annual Review of Plant Biology, 55 (2004), pp. 373–399.
[8] A. A PRILE, A. M. M ASTRANGELO, A. M. D. LEONARDIS, G. GALIBA , E. RONCAGLIA ,F. FERRARI, L. D. BELLIS, L. TURCHI, G. GIULIANO , AND L. CATTIVELLI , Transcrip-tional profiling in response to terminal drought stress reveals differential responses along thewheat genome, BMC Genomics, 10 (2009), p. 18 pages.
[9] S. M. ASSMANN, Hope for Humpty Dumpty: Systems biology of cellular signaling, PlantPhysiology, 152 (2010), pp. 470–479.
[10] F. AY, F. XU, AND T. KAHVECI, Scalable steady state analysis of boolean biological regu-latory networks, Plos One, 4 (2009), p. 9 pages.
[11] N. AY, K. IRMLER, A. FISCHER, R. UHLEMANN , G. REUTER, AND K. HUMBECK, Epi-genetic programming via histone methylation at WRKY53 controls leaf senescence in Ara-bidopsis thaliana, Plant Journal, 58 (2009), pp. 333–346.
[12] C. V. S. BABU , E. J. SONG, AND Y. S. YOO, Modeling and simulation in signal transduc-tion pathways: A systems biology approach, Biochimie, 88 (2006), pp. 277–283.
[13] O. BABUR, U. DOGRUSOZ, E. DEMIR, AND C. SANDER, ChiBE: Interactive visualizationand manipulation of BioPAX pathway models, Bioinformatics, 26 (2010), pp. 429–431.
[14] G. D. BADER, M. P. CARY, AND C. SANDER, Pathguide: A pathway resource list, NucleicAcids Research, 34 (2006), pp. D504–D506.
16

[15] J. BAILEY-SERRES ANDL. A. C. J. VOESENEK, Flooding stress: Acclimations and geneticdiversity, Annual Review of Plant Biology, 59 (2008), pp. 313–339.
[16] D. BARTELS AND R. SUNKAR, Drought and salt tolerance in plants, Critical Reviews inPlant Sciences, 24 (2005), pp. 23–58.
[17] O. BORSANI, J. H. ZHU, P. E. VERSLUES, R. SUNKAR , AND J. K. ZHU, EndogenoussiRNAs derived from a pair of natural cis-antisense transcripts regulate salt tolerance inArabidopsis, Cell, 123 (2005), pp. 1279–1291.
[18] C. BRANCO-PRICE, K. A. K AISER, C. J. H. JANG, C. K. LARIVE , AND J. BAILEY-SERRES, Selective mRNA translation coordinates energetic and metabolic adjustments tocellular oxygen deprivation and reoxygenation in Arabidopsis thaliana, Plant Journal, 56(2008), pp. 743–755.
[19] K. BRAUTIGAM , L. DIETZEL, T. KLEINE, E. STROHER, D. WORMUTH, K. J. DIETZ,D. RADKE , M. WIRTZ, R. HELL , P. DORMANN, A. NUNES-NESI, N. SCHAUER, A. R.FERNIE, S. N. OLIVER , P. GEIGENBERGER, D. LEISTER, AND T. PFANNSCHMIDT,Dynamic plastid redox signals integrate gene expression and metabolism to induce dis-tinct metabolic states in photosynthetic acclimation in Arabidopsis, Plant Cell, 21 (2009),pp. 2715–2732.
[20] P. BRODERSEN, L. SAKVARELIDZE -ACHARD, M. BRUUN-RASMUSSEN, P. DUNOYER,Y. Y. YAMAMOTO , L. SIEBURTH, AND O. VOINNET, Widespread translational inhibitionby plant miRNAs and siRNAs, Science, 320 (2008), pp. 1185–1190.
[21] J. BRUMOS, J. M. COLMENERO-FLORES, A. CONESA, P. IZQUIERDO, G. SANCHEZ,D. J. IGLESIAS, M. F. LOPEZ-CLIMENT, A. GOMEZ-CADENAS, AND M. TALON, Mem-brane transporters and carbon metabolism implicated in chloride homeostasis differentiatesalt stress responses in tolerant and sensitive citrus rootstocks, Functional and IntegrativeGenomics, 9 (2009), pp. 293–309.
[22] R. W. BYRNES, D. COTTER, A. MAER, J. LI , D. NADEAU , AND S. SUBRAMANIAM ,An editor for pathway drawing and data visualization in the Biopathways Workbench, BMCSystems Biology, 3 (2009), p. 10 pages.
[23] S. B. CHEN, N. GOLLOP, AND B. HEUER, Proteomic analysis of salt-stressed tomato(Solanum lycopersicum) seedlings: Effect of genotype and exogenous application of glycine-betaine, Journal of Experimental Botany, 60 (2009), pp. 2005–2019.
[24] V. CHINNUSAMY, J. ZHU, AND J. K. ZHU, Salt stress signaling and mechanisms of plantstress tolerance, Genetic Engineering, 27 (2006), pp. 141–177.
[25] T. J. CHIOU, The role of microRNAs in sensing nutrient stress, Plant Cell and Environment,30 (2007), pp. 323–332.
[26] S. H. CHO, C. ADDO-QUAYE , C. CORUH, M. A. A RIF, Z. R. MA , W. FRANK , AND
M. J. AXTELL , Physcomitrella patens DCL3 is required for 22-24 nt siRNA accumulation,suppression of retrotransposon-derived transcripts, and normal development, Plos Genetics,4 (2008), p. 13 pages.
17

[27] S. K. CHO, M. Y. RYU , C. SONG, J. M. KWAK , AND W. T. KIM , Arabidopsis PUB22 andPUB23 are homologous U-box E3 ubiquitin ligases that play combinatory roles in responseto drought stress, Plant Cell, 20 (2008), pp. 1899–1914.
[28] C. CHOI, M. KRULL , A. KEL, O. KEL-MARGOULIS, S. PISTOR, A. POTAPOV, N. VOSS,AND E. WINGENDER, TRANSPATH (R) — A high quality database focused on signal trans-duction, Comparative and Functional Genomics, 5 (2004), pp. 163–168.
[29] P. L. CONKLIN AND C. BARTH, Ascorbic acid, a familiar small molecule intertwined inthe response of plants to ozone, pathogens, and the onset of senescence, Plant Cell andEnvironment, 27 (2004), pp. 959–970.
[30] A. A. COVARRUBIAS AND J. L. REYES, Post-transcriptional gene regulation of salinity anddrought responses by plant microRNAs, Plant Cell and Environment, 33 (2010), pp. 481–489.
[31] S. R. CUTLER, P. L. RODRIGUEZ, R. R. FINKELSTEIN, AND S. R. ABRAMS, Abscisicacid: Emergence of a core signaling network, Annual Review of Plant Biology, Vol 61, 61(2010), pp. 651–679.
[32] L. A. DAVID AND C. H. WIGGINS, Benchmarking of dynamic Bayesian networks inferredfrom stochastic time-series data, Reverse Engineering Biological Networks — Opportunitiesand Challenges in Computational Methods for Pathway Inference, 1115 (2007), pp. 90–101.
[33] P. V. DER SPEK, Neurodevelopmental pathway visualization using Spotfire and Ingenuitytechnology, Human Reproduction, 21 (2006), p. I1.
[34] J. R. DINNENY, T. A. LONG, J. Y. WANG, J. W. JUNG, D. MACE, S. POINTER, C. BAR-RON, S. M. BRADY, J. SCHIEFELBEIN, AND P. N. BENFEY, Cell identity mediates theresponse of Arabidopsis roots to abiotic stress, Science, 320 (2008), pp. 942–945.
[35] J. L. DONAHUE, C. M. OKPODU, C. L. CRAMER, E. A. GRABAU , AND R. G. ALSCHER,Responses of antioxidants to paraquat in pea leaves, Plant Physiology, 113 (1997), pp. 249–257.
[36] R. ELKON , R. VESTERMAN, N. AMIT, I. ULITSKY, I. ZOHAR, M. WEISZ, G. MASS,N. ORLEV, G. STERNBERG, R. BLEKHMAN , J. ASSA, Y. SHILOH , AND R. SHAMIR ,SPIKE — A database, visualization and analysis tool of cellular signaling pathways, BMCBioinformatics, 9 (2008), p. 15 pages.
[37] B. ELLIS AND W. H. WONG, Learning causal Bayesian network structures from experi-mental data, Journal of the American Statistical Association, 103 (2008), pp. 778–789.
[38] S. A. FILICHKIN , H. D. PRIEST, S. A. GIVAN , R. K. SHEN, D. W. BRYANT, S. E. FOX,W. K. WONG, AND T. C. MOCKLER, Genome-wide mapping of alternative splicing inArabidopsis thaliana, Genome Research, 20 (2010), pp. 45–58.
[39] I. FISCHER-K ILBIENSKI , Y. M IAO , T. ROITSCH, W. ZSCHIESCHE, K. HUMBECK, AND
K. K RUPINSKA, Nuclear targeted AtS40 modulates senescence associated gene expressionin Arabidopsis thaliana during natural development and in darkness, Plant Molecular Biol-ogy, 73 (2010), pp. 379–390.
18

[40] T. C. FREEMAN, S. RAZA , A. THEOCHARIDIS, AND P. GHAZAL , The mEPN scheme:An intuitive and flexible graphical system for rendering biological pathways, BMC SystemsBiology, 4 (2010), p. 13 pages.
[41] H. FROEHLICH, M. FELLMANN , H. SUELTMANN , A. POUSTKA, AND T. BEISSBARTH,Large scale statistical inference of signaling pathways from RNAi and microarray data, BMCBioinformatics, 8 (2007), p. 15 pages.
[42] T. FUKAO AND J. BAILEY-SERRES, Submergence tolerance conferred by Sub1A is mediatedby SLR1 and SLRL1 restriction of gibberellin responses in rice, Proceedings of the NationalAcademy of Sciences of the United States of America, 105 (2008), pp. 16814–16819.
[43] A. FUNAHASHI , Y. MATSUOKA, A. JOURAKU, M. MOROHASHI, N. KIKUCHI , AND
H. K ITANO, CellDesigner 3.5: A versatile modeling tool for biochemical networks, Pro-ceedings of the IEEE, 96 (2008), pp. 1254–1265.
[44] E. A. GAFFNEY, J. K. HEATH, AND M. Z. KWIATKOWSKA , A mass action model of afibroblast growth factor signaling pathway and its simplification, Bulletin of MathematicalBiology, 70 (2008), pp. 2229–2263.
[45] D. GEIGER, S. SCHERZER, P. MUMM , I. MARTEN, P. ACHE, S. MATSCHI, A. L IESE,C. WELLMANN , K. A. S. AL-RASHEID, E. GRILL , T. ROMEIS, AND R. HEDRICH, Guardcell anion channel SLAC1 is regulated by CDPK protein kinases with distinctCa2+ affinities,Proceedings of the National Academy of Sciences of the United States of America, 107(2010), pp. 8023–8028.
[46] C. GLYMOUR, Bayesian nets and causality, British Journal for the Philosophy of Science,60 (2009), pp. 849–855.
[47] Q. Q. GONG, P. H. LI , S. S. MA , S. I. RUPASSARA, AND H. J. BOHNERT, Salinity stressadaptation competence in the extremophile thellungiella halophila in comparisonwith itsrelative Arabidopsis thaliana, Plant Journal, 44 (2005), pp. 826–839.
[48] Y. C. GONG AND Z. L. ZHANG, Alternative pathway approach for automating analysis andvalidation of cell perturbation networks and design of perturbation experiments, Reverse En-gineering Biological Networks — Opportunities and Challenges in Computational Methodsfor Pathway Inference, 1115 (2007), pp. 267–285.
[49] N. R. GOUGH, Science’s Signal Transduction Knowledge Environment — The connectionsmaps database, Chromaffin Cell: Trnsmitter Biosynthesis, Storage, Release, Actions, andInformatics, 971 (2002), pp. 585–587.
[50] , STKE connections maps: A database of cell signaling, Regulatory Peptides, 130(2005), p. 185.
[51] T. GOWDA, S. VRUDHULA , AND S. KIM , Modeling of gene regulatory network dynam-ics using threshold logic, Challenges of Systems Biology: Community Efforts to HarnessBiological Complexity, 1158 (2009), pp. 71–81.
19

[52] R. GRENE, L. S. HEATH, T. M. MURALI , A. A. SIOSON, H. J. BOHNERT, S. MANE,P. LI , , AND C. VASQUEZ-ROBINET, Effects of chronic ozone exposure on gene expressionin Arabidopsis thaliana ecotypes and in Thellungiella halophila, Plant Cell and Environment,29 (2006), pp. 854–868.
[53] D. L. GRESH, B. E. ROGOWITZ, R. L. WINSLOW, D. F. SCOLLAN , AND C. K. YUNG,WEAVE: A system for visually linking 3-D and statistical visualizations, applied tocardiacsimulation and measurement data, in VIS ’00: Proceedings of the Conference on Visualiza-tion ’00, Los Alamitos, CA, USA, 2000, IEEE Computer Society Press, pp. 489–492.
[54] G. GRINSTEIN, S. LASKOWSKI, G. WILLS , AND B. ROGOWITZ, Information explorationshootout project and benchmark data sets (panel): Evaluating how visualization does inanalyzing real-world data analysis problems, in VIS ’97: Proceedings of the 8th Conferenceon Visualization ’97, Los Alamitos, CA, USA, 1997, IEEE Computer Society Press, pp. 511–513.
[55] P. G. GUO, M. BAUM , S. GRANDO, S. CECCARELLI, G. H. BAI , R. H. LI , M. VON KO-RFF, R. K. VARSHNEY, A. GRANER, AND J. VALKOUN , Differentially expressed genes be-tween drought-tolerant and drought-sensitive barley genotypes in response to drought stressduring the reproductive stage, Journal of Experimental Botany, 60 (2009), pp. 3531–3544.
[56] S. X. GUO, A. K. SETH, K. M. K ENDRICK, C. ZHOU, AND J. F. FENG, Partial Grangercausality — Eliminating exogenous inputs and latent variables, Journal of NeuroscienceMethods, 172 (2008), pp. 79–93.
[57] L. S. HEATH AND A. A. SIOSON, Multimodal networks: Structure and operations,IEEE/ACM Transactions on Computational Biology and Bioinformatics, 6 (2009), pp. 321–332.
[58] , Semantics of multimodal network models, IEEE/ACM Transactions on ComputationalBiology and Bioinformatics, 6 (2009), pp. 271–280.
[59] T. HIRAYAMA AND K. SHINOZAKI , Research on plant abiotic stress responses in the post-genome era: Past, present and future, Plant Journal, 61 (2010), pp. 1041–1052.
[60] S. HOOPS, S. SAHLE , R. GAUGES, C. LEE, J. PAHLE , N. SIMUS, M. SINGHAL , L. XU,P. MENDES, AND U. KUMMER, COPASI — A COmplex PAthway SImulator, Bioinformat-ics, 22 (2006), pp. 3067–3074.
[61] G. INAN , Q. ZHANG, P. H. LI , Z. L. WANG, Z. Y. CAO, H. ZHANG, C. Q. ZHANG,T. M. QUIST, S. M. GOODWIN, J. H. ZHU, H. H. SHI , B. DAMSZ, T. CHARBAJI, Q. Q.GONG, S. S. MA , M. FREDRICKSEN, D. W. GALBRAITH , M. A. JENKS, D. RHODES,P. M. HASEGAWA, H. J. BOHNERT, R. J. JOLY, R. A. BRESSAN, AND J. K. ZHU, Saltcress. A halophyte and cryophyte Arabidopsis relative model system and its applicability tomolecular genetic analyses of growth and development of extremophiles, Plant Physiology,135 (2004), pp. 1718–1737.
[62] I. I VANOV , Boolean models of genomic regulatory networks: Reduction mappings, infer-ence, and external control, Current Genomics, 10 (2009), pp. 375–387.
20

[63] A. S. IYER-PASCUZZI AND P. N. BENFEY, Transcriptional networks in root cell fatespecification, Biochimica Et Biophysica Acta-Gene Regulatory Mechanisms, 1789 (2009),pp. 315–325.
[64] A. JANSSON AND M. JIRSTRAND, Biochemical modeling with Systems Biology GraphicalNotation, Drug Discovery Today, 15 (2010), pp. 365–370.
[65] P. JASPERS, T. BLOMSTER, M. BROSCHE, J. SALOJARVI , R. AHLFORS, J. P. VAINONEN,R. A. REDDY, R. IMMINK , G. ANGENENT, F. TURCK, K. OVERMYER, AND J. KANGAS-JARVI, Unequally redundant RCD1 and SRO1 mediate stress and developmentalresponsesand interact with transcription factors, Plant Journal, 60 (2009), pp. 268–279.
[66] P. JASPERS AND J. KANGASJARVI, Reactive oxygen species in abiotic stress signaling,Physiologia Plantarum, 138 (2010), pp. 405–413.
[67] M. W. JONES-RHOADES, D. P. BARTEL, AND B. BARTEL, MicroRNAs and their regula-tory roles in plants, Annual Review of Plant Biology, 57 (2006), pp. 19–53.
[68] J. JOO, S. PLIMPTON, S. MARTIN , L. SWILER, AND J. L. FAULON, Sensitivity analysisof a computational model of the IKK-NF-κβ-Iκβα-A20 signal transduction network, Re-verse Engineering Biological Networks — Opportunities and Challenges in ComputationalMethods for Pathway Inference, 1115 (2007), pp. 221–239.
[69] B. H. JUNKER, C. KLUKAS , AND F. SCHREIBER, VANTED: A system for advanced dataanalysis and visualization in the context of biological networks, BMC Bioinformatics, 7(2006), p. 13 pages.
[70] S. KACHALO , R. R. ZHANG, E. SONTAG, R. ALBERT, AND B. DASGUPTA, NET-SYNTHESIS: A software for synthesis, inference and simplification of signal transductionnetworks, Bioinformatics, 24 (2008), pp. 293–295.
[71] S. R. KADUPITIGE, K. C. LEUNG, J. SELLMEIER, J. SIVIENG , D. R. CATCHPOOLE,M. E. BAIN , AND B. A. GAETA, MINER: Exploratory analysis of gene interaction networksby machine learning from expression data, BMC Genomics, 10 (2009), p. 8 pages.
[72] K. K ANDASAMY, S. KEERTHIKUMAR, R. RAJU, T. S. K. PRASAD, Y. L. RAMACHAN -DRA, S. MOHAN, AND A. PANDEY, PathBuilder — Open source software for annotatingand developing pathway resources, Bioinformatics, 25 (2009), pp. 2860–2862.
[73] K. K ANDASAMY, S. S. MOHAN, R. RAJU, S. KEERTHIKUMAR, G. S. S. KUMAR , A. K.VENUGOPAL, D. TELIKICHERLA , J. D. NAVARRO, S. MATHIVANAN , C. PECQUET, S. K.GOLLAPUDI , S. G. TATTIKOTA , S. MOHAN, H. PADHUKASAHASRAM , Y. SUBBAN-NAYYA , R. GOEL, H. K. C. JACOB, J. ZHONG, R. SEKHAR, V. NANJAPPA, L. BAL -AKRISHNAN , R. SUBBAIAH , Y. L. RAMACHANDRA , B. A. RAHIMAN , T. S. K. PRASAD,J. X. LIN , J. C. D. HOUTMAN , S. DESIDERIO, J. C. RENAULD , S. N. CONSTANTINESCU,O. OHARA , T. HIRANO, M. KUBO, S. SINGH, P. KHATRI , S. DRAGHICI, G. D. BADER,C. SANDER, W. J. LEONARD, AND A. PANDEY, NetPath: A public resource of curatedsignal transduction pathways, Genome Biology, 11 (2010), p. 9 pages.
21

[74] M. K ANEHISA AND S. GOTO, KEGG: Kyoto encyclopedia of genes and genomes, NucleicAcids Research, 28 (2000), pp. 27–30.
[75] A. K ARABA , S. DIXIT , R. GRECO, A. AHARONI, K. R. TRIJATMIKO , N. MARSCH-MARTINEZ, A. KRISHNAN, K. N. NATARAJA , M. UDAYAKUMAR , AND A. PEREIRA, Im-provement of water use efficiency in rice by expression of HARDY, anArabidopsis droughtand salt tolerance gene, Proceedings of the National Academy of Sciences of the UnitedStates of America, 104 (2007), pp. 15270–15275.
[76] C. G. KAWASHIMA , N. YOSHIMOTO, A. MARUYAMA -NAKASHITA , Y. N. TSUCHIYA,K. SAITO , H. TAKAHASHI , AND T. DALMAY , Sulphur starvation induces the expression ofmicroRNA-395 and one of its target genes but in different cell types, Plant Journal, 57 (2009),pp. 313–321.
[77] T. KELDER, A. R. PICO, K. HANSPERS, M. P. VAN IERSEL, C. EVELO, AND B. R. CON-KLIN , Mining biological pathways using WikiPathways Web services, Plos One, 4 (2009),p. 4 pages.
[78] B. KEMPER, T. MATSUZAKI , Y. MATSUOKA, Y. TSURUOKA, H. KITANO , S. ANANI -ADOU, AND J. TSUJII, PathText: A text mining integrator for biological pathway visualiza-tions, Bioinformatics, 26 (2010), pp. I374–I381.
[79] H. A. KESTLER, C. WAWRA , B. KRACHER, AND M. K UHL, Network modeling of signaltransduction: Establishing the global view, Bioessays, 30 (2008), pp. 1110–1125.
[80] J. KILIAN , D. WHITEHEAD, J. HORAK, D. WANKE , S. WEINL , O. BATISTIC,C. D’A NGELO, E. BORNBERG-BAUER, J. KUDLA , AND K. HARTER, The AtGenExpressglobal stress expression data set: Protocols, evaluation and model dataanalysis of UV-Blight, drought and cold stress responses, Plant Journal, 50 (2007), pp. 347–363.
[81] H. K IM , J. K. LEE, AND T. PARK, Boolean networks using the chi-square test for inferringlarge-scale gene regulatory networks, BMC Bioinformatics, 8 (2007), p. 15 pages.
[82] D. J. KLIEBENSTEIN, Quantification of variation in expression networks, in Plant SystemsBiology, D. A. Belostotsky, ed., Humana Press, New York, 2009, pp. 227–245.
[83] R. B. KLINE, Principles and Practice of Structural Equation Modeling, Guilford Press, NewYork, second ed., 2005.
[84] D. J. KLINKE , An empirical Bayesian approach for model-based inference of cellular sig-naling networks, BMC Bioinformatics, 10 (2009), p. 18 pages.
[85] K. R. KOTTAPALLI , R. RAKWAL , J. SHIBATO , G. BUROW, D. TISSUE, J. BURKE,N. PUPPALA, M. BUROW, AND P. PAYTON, Physiology and proteomics of the water-deficit stress response in three contrasting peanut genotypes, Plant Cell and Environment,32 (2009), pp. 380–407.
[86] S. KOUSSEVITZKY, N. SUZUKI , S. HUNTINGTON, L. ARMIJO, W. SHA , D. CORTES,V. SHULAEV, AND R. MITTLER, Ascorbate peroxidase 1 plays a key role in the response
22
of Arabidopsis thaliana to stress combination, Journal of Biological Chemistry, 283 (2008),pp. 34197–34203.
[87] A. K RISHNAN, M. M. R. AMBAVARAM , A. HARB, U. BATLANG , P. E. WITTICH , AND
A. PEREIRA, Genetic networks underlying plant abiotic stress responses, in Genes for PlantAbiotic Stress, M. A. Jenks and A. J. Wood, eds., John Wiley and Sons, Ames, Iowa, 2009,pp. 261–279.
[88] A. K RISHNAN AND A. PEREIRA, Integrative approaches for mining transcriptional regula-tory programs in Arabidopsis, Briefings in Functional Genomics and Proteomics, 7 (2008),pp. 264–274.
[89] C. LALOI , M. STACHOWIAK , E. PERS-KAMCZYC , E. WARZYCH, I. MURGIA, AND
K. A PEL, Cross-talk between singlet oxygen- and hydrogen peroxide-dependent signalingof stress responses in Arabidopsis thaliana, Proceedings of the National Academy of Sci-ences of the United States of America, 104 (2007), pp. 672–677.
[90] A. J. LEVINE, W. W. HU, Z. H. FENG, AND G. GIL , Reconstructing signal transduc-tion pathways — Challenges and opportunities, Reverse Engineering Biological Networks— Opportunities and Challenges in Computational Methods for Pathway Inference, 1115(2007), pp. 32–50.
[91] F. H. LI , F. L. FU, L. N. SHA , L. HE, AND W. C. LI, Differential expression of ser-ine/threonine protein phosphatase type-2C under drought stress in maize, Plant MolecularBiology Reporter, 27 (2009), pp. 29–37.
[92] P. H. LI , S. P. MANE, A. A. SIOSON, C. V. ROBINET, L. S. HEATH, H. J. BOHNERT, AND
R. GRENE, Effects of chronic ozone exposure on gene expression in Arabidopsisthalianaecotypes and in Thellungielia halophila, Plant Cell and Environment, 29 (2006), pp. 854–868.
[93] P. H. LI , A. SIOSON, S. P. MANE, A. ULANOV, G. GROTHAUS, L. S. HEATH, T. M.MURALI , H. J. BOHNERT, AND R. GRENE, Response diversity of Arabidopsis thalianaecotypes in elevated [CO2] in the field, Plant Molecular Biology, 62 (2006), pp. 593–609.
[94] S. LI , S. M. ASSMANN, AND R. ALBERT, Predicting essential components of signal trans-duction networks: A dynamic model of guard cell abscisic acid signaling, Plos Biology, 4(2006), pp. 1732–1748.
[95] B. L IU , A. DE LA FUENTE, AND I. HOESCHELE, Gene network inference via structuralequation modeling in genetical genomics experiments, Genetics, 178 (2008), pp. 1763–1776.
[96] A. L ORAINE, Co-expression analysis of metabolic pathways in plants, in Plant SystemsBiology, D. A. Belostotsky, ed., Humana Press, New York, 2009, pp. 247–264.
[97] T. LU, G. LU, D. FAN , C. ZHU, W. LI , Q. F. QIANG ZHA AND , Y. ZHAO, Y. GUO, W. LI ,X. HUANG, AND B. HAN, Function annotation of rice transcriptome at single nucleotideresolution by RNA-seq, Genome Research, online (2010), p. Epub.
23

[98] A. L UDWIKOW AND J. SADOWSKI, Gene networks in plant ozone stress response and tol-erance, Journal of Integrative Plant Biology, 50 (2008), pp. 1256–1267.
[99] S. MA AND H. J. BOHNERT, Gene networks in Arabidopsis thaliana for metabolic andenvironmental functions, Molecular Biosystems, 4 (2008), pp. 199–204.
[100] S. S. MA AND H. J. BOHNERT, Integration of Arabidopsis thaliana stress-related transcriptprofiles, promoter structures, and cell-specific expression, Genome Biology, 8 (2007), p. 22pages.
[101] A. MA’ AYAN , S. L. JENKINS, R. L. WEBB, S. I. BERGER, S. P. PURUSHOTHAMAN, N. S.ABUL-HUSN, J. M. POSNER, T. FLORES, AND R. IYENGAR, SNAVI: Desktop applicationfor analysis and visualization of large-scale signaling networks, BMC Systems Biology, 3(2009), p. 11 pages.
[102] S. P. MANE, C. V. ROBINET, A. ULANOV, R. SCHAFLEITNER, L. TINCOPA, A. GAUDIN ,G. NOMBERTO, C. ALVARADO , C. SOLIS, L. A. BOLIVAR , R. BLAS, O. ORTEGA,J. SOLIS, A. PANTA , C. RIVERA , I. SAMOLSKI , D. H. CARBAJULCA, M. BONIERBALE,A. PATI , L. S. HEATH, H. J. BOHNERT, AND R. GRENE, Molecular and physiologicaladaptation to prolonged drought stress in the leaves of two Andean potato genotypes, Func-tional Plant Biology, 35 (2008), pp. 669–688.
[103] S. P. MANE, C. VASQUEZ-ROBINET, A. A. SIOSON, L. S. HEATH, AND R. GRENE,Early PLDα-mediated events in response to progressive drought stress in Arabidopsis: Atranscriptome analysis, Journal of Experimental Botany, 58 (2007), pp. 241–252.
[104] A. MATSUI, J. ISHIDA, T. MOROSAWA, Y. MOCHIZUKI , E. KAMINUMA , T. A. ENDO,M. OKAMOTO , E. NAMBARA , M. NAKAJIMA , M. KAWASHIMA , M. SATOU, J. M. KIM ,N. KOBAYASHI , T. TOYODA, K. SHINOZAKI , AND M. SEKI, Arabidopsis transcriptomeanalysis under drought, cold, high-salinity and ABA treatment conditions using a tiling ar-ray, Plant and Cell Physiology, 49 (2008), pp. 1135–1149.
[105] Y. MATSUOKA, S. GHOSH, N. KIKUCHI , AND H. K ITANO, Payao: A community platformfor SBML pathway model curation, Bioinformatics, 26 (2010), pp. 1381–1383.
[106] L. MATTHEWS, G. GOPINATH, M. GILLESPIE, M. CAUDY, D. CROFT, B. DE BONO,P. GARAPATI , J. HEMISH, H. HERMJAKOB, B. JASSAL, A. KANAPIN , S. LEWIS, S. MA-HAJAN, B. MAY, E. SCHMIDT, I. VASTRIK, G. M. WU, E. BIRNEY, L. STEIN, AND
P. D’EUSTACHIO, Reactome knowledgebase of human biological pathways and processes,Nucleic Acids Research, 37 (2009), pp. D619–D622.
[107] Y. M IAO AND U. ZENTGRAF, A HECT E3 ubiquitin ligase negatively regulates Arabidopsisleaf senescence through degradation of the transcription factor WRKY53, Plant Journal, 63(2010), pp. 179–188.
[108] G. MILLER , V. SHULAEV, AND R. MITTLER, Reactive oxygen signaling and abiotic stress,Physiologia Plantarum, 133 (2008), pp. 481–489.
24

[109] R. MITTLER, Oxidative stress, antioxidants and stress tolerance, Trends in Plant Science, 7(2002), pp. 405–410.
[110] M. M IZOGUCHI, T. UMEZAWA , K. NAKASHIMA , S. KIDOKORO, H. TAKASAKI , Y. FU-JITA, K. YAMAGUCHI -SHINOZAKI , AND K. SHINOZAKI , Two closely related subclass IISnRK2 protein kinases cooperatively regulate drought-inducible gene expression, Plant andCell Physiology, 51 (2010), pp. 842–847.
[111] F. MORDELET AND J. P. VERT, SIRENE: Supervised inference of regulatory networks,Bioinformatics, 24 (2008), pp. I76–I82.
[112] M. K. MORRIS, J. SAEZ-RODRIGUEZ, P. K. SORGER, AND D. A. LAUFFENBURGER,Logic-based models for the analysis of cell signaling networks, Biochemistry, 49 (2010),pp. 3216–3224.
[113] S. MOSTAFAVI, D. RAY, D. WARDE-FARLEY, C. GROUIOS, AND Q. MORRIS, Gene-MANIA: A real-time multiple association network integration algorithm for predicting genefunction, Genome Biology, 9 (2008), p. 15 pages.
[114] K. MUKHERJEE, A. R. CHOUDHURY, B. GUPTA, S. GUPTA, AND D. N. SENGUPTA,An ABRE-binding factor, OSBZ8, is highly expressed in salt tolerant cultivars than in saltsensitive cultivars of indica rice, BMC Plant Biology, 6 (2006), p. 14 pages.
[115] N. D. MUKHOPADHYAY AND S. CHATTERJEE, Causality and pathway search in microar-ray time series experiment, Bioinformatics, 23 (2007), pp. 442–449.
[116] R. MUNNS AND M. TESTER, Mechanisms of salinity tolerance, Annual Review of PlantBiology, 59 (2008), pp. 651–681.
[117] A. MUSTROPH ANDJ. BAILEY-SERRES, The Arabidopsis translatome cell-specific mRNAatlas: Mining suberin and cutin lipid monomer biosynthesis genes as an example for dataapplication, Plant Signaling and Behavior, 5 (2010), pp. 320–324.
[118] A. MUSTROPH, S. C. LEE, T. OOSUMI, M. E. ZANETTI , H. J. YANG, K. MA ,A. YAGHOUBI-MASIHI , T. FUKAO , AND J. BAILEY-SERRES, Cross-kingdom comparisonof transcriptomic adjustments to low-oxygen stress highlights conserved and plant-specificresponses, Plant Physiology, 152 (2010), pp. 1484–1500.
[119] A. MUSTROPH, M. E. ZANETTI , C. J. H. JANG, H. E. HOLTAN , P. P. REPETTI, D. W.GALBRAITH , T. GIRKE, AND J. BAILEY-SERRES, Profiling translatomes of discrete cellpopulations resolves altered cellular priorities during hypoxia in Arabidopsis, Proceed-ings of the National Academy of Sciences of the United States of America, 106(2009),pp. 18843–18848.
[120] K. NOBUTA, R. C. VENU, C. LU, A. BELO, K. VEMARAJU, K. KULKARNI , W. Z.WANG, M. PILLAY , P. J. GREEN, G. L. WANG, AND B. C. MEYERS, An expression atlasof rice mRNAs and small RNAs, Nature Biotechnology, 25 (2007), pp. 473–477.
[121] G. NOCTOR, Metabolic signalling in defence and stress: The central roles of soluble redoxcouples, Plant Cell and Environment, 29 (2006), pp. 409–425.
25

[122] N. L. NOVERE, M. HUCKA , H. Y. M I , S. MOODIE, F. SCHREIBER, A. SOROKIN,E. DEMIR, K. WEGNER, M. I. A LADJEM, S. M. WIMALARATNE , F. T. BERGMAN,R. GAUGES, P. GHAZAL , H. KAWAJI , L. L I , Y. MATSUOKA, A. V ILLEGER, S. E.BOYD, L. CALZONE, M. COURTOT, U. DOGRUSOZ, T. C. FREEMAN, A. FUNAHASHI ,S. GHOSH, A. JOURAKU, S. KIM , F. KOLPAKOV, A. LUNA , S. SAHLE , E. SCHMIDT,S. WATTERSON, G. M. WU, I. GORYANIN , D. B. KELL , C. SANDER, H. SAURO, J. L.SNOEP, K. KOHN, AND H. K ITANO, The Systems Biology Graphical Notation, NatureBiotechnology, 27 (2009), pp. 735–741.
[123] D. H. OH, S. Y. LEE, R. A. BRESSAN, D. J. YUN, AND H. J. BOHNERT, Intracellu-lar consequences of SOS1 deficiency during salt stress, Journal of Experimental Botany, 61(2010), pp. 1205–1213.
[124] R. OPGEN-RHEIN AND K. STRIMMER, From correlation to causation networks: A simpleapproximate learning algorithm and its application to high-dimensional plant gene expres-sion data, BMC Systems Biology, 1 (2007), p. 10 pages.
[125] K. OVERMYER, M. BROSCHE, AND J. KANGASJARVI, Reactive oxygen species and hor-monal control of cell death, Trends in Plant Science, 8 (2003), pp. 335–342.
[126] B. D. PANT, M. MUSIALAK -LANGE, P. NUC, P. MAY, A. BUHTZ, J. KEHR,D. WALTHER, AND W. R. SCHEIBLE, Identification of nutrient-responsive Arabidopsis andrapeseed microRNAs by comprehensive real-time polymerase chain reaction profiling andsmall RNA sequencing, Plant Physiology, 150 (2009), pp. 1541–1555.
[127] J. PAQUETTE AND T. TOKUYASU, EGAN: Exploratory gene association networks, Bioin-formatics, 26 (2010), pp. 285–286.
[128] F. PARISI, H. KOEPPL, AND F. NAEF, Network inference by combining biologically mo-tivated regulatory constraints with penalized regression, Challenges of Systems Biology:Community Efforts to Harness Biological Complexity, 1158 (2009), pp. 114–124.
[129] A. PATI , C. VASQUEZ-ROBINET, L. S. HEATH, R. GRENE, AND T. M. MURALI ,Xcisclique: Analysis of regulatory bicliques, BMC Bioinformatics, 7 (2006), p. 14 pages.
[130] J. PEARL, Causality: Models, Reasoning, and Inference, Cambridge University Press, Cam-bridge, UK, 2000.
[131] J. PEARL, An introduction to causal inference, International Journal of Biostatistics, 6(2010), p. 61 pages.
[132] T. PFANNSCHMIDT, K. BRAUTIGAM , R. WAGNER, L. DIETZEL, Y. SCHROTER,S. STEINER, AND A. NYKYTENKO , Potential regulation of gene expression in photosyn-thetic cells by redox and energy state: Approaches towards better understanding, Annals ofBotany, 103 (2009), pp. 599–607.
[133] A. R. PICO, T. KELDER, M. P. VAN IERSEL, K. HANSPERS, B. R. CONKLIN , AND
C. EVELO, WikiPathways: Pathway editing for the people, Plos Biology, 6 (2008), pp. 1403–1407.
26

[134] F. QIN , Y. SAKUMA , L. S. P. TRAN, K. MARUYAMA , S. KIDOKORO, Y. FUJITA, M. FU-JITA, T. UMEZAWA , Y. SAWANO , K. I. M IYAZONO , M. TANOKURA , K. SHINOZAKI , AND
K. YAMAGUCHI -SHINOZAKI , Arabidopsis DREB2A-interacting proteins function as RINGE3 ligases and negatively regulate plant drought stress-responsive gene expression, PlantCell, 20 (2008), pp. 1693–1707.
[135] D. A. RABENHORST, Revitalizing the scatter plot, in SPIE Applied Imagery Pattern Recog-nition Workshop, 1999.
[136] , Interactive graphical method for analyzing many-dimensional data sets. U.S. Patent6,384,847, 2002.
[137] A. S. RAGHAVENDRA , V. K. GONUGUNTA, A. CHRISTMANN, AND E. GRILL , ABA per-ception and signalling, Trends in Plant Science, Epub ahead of print (2010), p. 7 pages.
[138] M. RAHAIE , G.-P. XUE, M. R. NAGHAVI , H. ALIZADEH , AND P. M. SCHENK, A MYBgene from wheat (Triticum aestivum l.) is up-regulated during salt and drought stresses anddifferentially regulated between salt-tolerant and sensitive genotypes, Plant Cell Reports,Epub ahead of print (2010), p. 10 pages.
[139] R. SCHLATTER, K. SCHMICH, I. A. V IZCARRA, P. SCHEURICH, T. SAUTER, C. BORNER,M. EDERER, I. MERFORT, AND O. SAWODNY, On/off and beyond — A boolean model ofapoptosis, Plos Computational Biology, 5 (2009), p. 13 pages.
[140] F. SCHREIBER, T. DWYER, K. MARRIOTT, AND M. WYBROW, A generic algorithm forlayout of biological networks, BMC Bioinformatics, 10 (2009), p. 12 pages.
[141] M. SEKI , A. MATSUI, J. M. KIM , J. ISHIDA, M. NAKAJIMA , T. MOROSAWA,M. K AWASHIMA , M. SATOU, T. K. TO, Y. KURIHARA , E. KAMINUMA , T. ENDO,Y. M OCHIZUKI , N. KOBAYASHI , T. TOYODA, AND K. SHINOZAKI , Arabidopsis whole-genome transcriptome analysis under drought, cold, high-salinity, and ABA treatment con-ditions using tiling array and 454 sequencing technology, Plant and Cell Physiology, 48(2007), p. S8.
[142] A. K. SETH, A MATLAB toolbox for Granger causal connectivity analysis, Journal of Neu-roscience Methods, 186 (2010), pp. 262–273.
[143] G. S. SHIEH, C. M. CHEN, C. Y. YU, J. HUANG, W. F. WANG, AND Y. C. LO, Inferringtranscriptional compensation interactions in yeast via stepwise structure equation modeling,BMC Bioinformatics, 9 (2008), p. 10 pages.
[144] K. SHINOZAKI , K. YAMAGUCHI -SHINOZAKI , AND M. SEKI, Regulatory network of geneexpression in the drought and cold stress responses, Current Opinion in Plant Biology, 6(2003), pp. 410–417.
[145] C. SIMA , J. P. HUA , AND S. W. JUNG, Inference of gene regulatory networks using time-series data: A survey, Current Genomics, 10 (2009), pp. 416–429.
[146] A. A. SIOSON, Multimodal Networks in Biology, PhD thesis, Virginia Polytechnic Instituteand State University, 2005. Virginia Tech ETD etd-12082005-154559.
27

[147] A. A. SIOSON, S. P. MANE, P. H. LI , W. SHA , L. S. HEATH, H. J. BOHNERT, AND
R. GRENE, The statistics of identifying differentially expressed genes in Expresso and TM4:A comparison, BMC Bioinformatics, 7 (2006), p. 15 pages.
[148] A. SIRBU, H. J. RUSKIN, AND M. CRANE, Comparison of evolutionary algorithms in generegulatory network model inference, BMC Bioinformatics, 11 (2010), p. 20 pages.
[149] D. J. SLOTTA, Evalutating Biological Data Using Rank Correlation Methods, PhD thesis,Virginia Polytechnic Institute and State University, 2005. Virginia Tech ETD etd-05092005-105158.
[150] D. J. SLOTTA , L. S. HEATH, N. RAMAKRISHNAN , R. HELM , AND M. POTTS, Clusteringmass spectrometry data using order statistics, Proteomics, 3 (2003), pp. 1687–1691.
[151] C. SONG, C. WANG, C. ZHANG, N. K. KORIR, H. YU, Z. MA , AND J. FANG, Deep se-quencing discovery of novel and conserved microRNAs in trifoliate orange (Citrus trifoliata),BMC Genomics, 11 (2010), p. 431.
[152] S. N. SREENATH, K. H. CHO, AND P. WELLSTEAD, Modelling the dynamics of signallingpathways, Essays in Biochemistry: Systems Biology, Vol 45, 45 (2008), pp. 1–28.
[153] B. STIGLER, A. JARRAH, M. STILLMAN , AND R. LAUBENBACHER, Reverse engineer-ing of dynamic networks, Reverse Engineering Biological Networks — Opportunities andChallenges in Computational Methods for Pathway Inference, 1115 (2007), pp. 168–177.
[154] G. STOLOVITZKY, D. MONROE, AND A. CALIFANO , Dialogue on reverse-engineeringassessment and methods — The DREAM of high-throughput pathway inference, Reverse En-gineering Biological Networks — Opportunities and Challenges in Computational Methodsfor Pathway Inference, 1115 (2007), pp. 1–22.
[155] R. SUNKAR, MicroRNAs with macro-effects on plant stress responses, Seminars in Cell andDevelopmental Biology, Epub ahead of print (2010), p. none.
[156] R. SUNKAR , V. CHINNUSAMY, J. H. ZHU, AND J. K. ZHU, Small RNAs as big players inplant abiotic stress responses and nutrient deprivation, Trends in Plant Science, 12 (2007),pp. 301–309.
[157] R. SUNKAR , A. KAPOOR, AND J. K. ZHU, Posttranscriptional induction of two Cu/Znsuperoxide dismutase genes in Arabidopsis is mediated by downregulationof miR398 andimportant for oxidative stress tolerance, Plant Cell, 18 (2006), pp. 2051–2065.
[158] B. C. V. SURESH, S. M. E. BABAR , E. J. SONG, E. OH, AND Y. S. YOO, Kinetic analysisof the MAPK and PI3K/Akt signaling pathways, Molecules and Cells, 25 (2008), pp. 397–406.
[159] N. TSESMETZIS, M. COUCHMAN, J. HIGGINS, A. SMITH , J. H. DOONAN, G. J. SEIFERT,E. E. SCHMIDT, I. VASTRIK, E. BIRNEY, G. M. WU, P. D’EUSTACHIO, L. D. STEIN,R. J. MORRIS, M. W. BEVAN , AND S. V. WALSH, Arabidopsis Reactome: A foundationknowledgebase for plant systems biology, Plant Cell, 20 (2008), pp. 1426–1436.
28

[160] O. UDIANI , A. KRISHNAN, AND A. PEREIRA, Investigating the conservation of transcrip-tion factor binding sites between evolutionary related species. The Annual Biomedical Re-search Conference for Minority Students (ABRCMS), 2008. Orlando,Florida.
[161] I. ULITSKY, I. GAT-V IKS, AND R. SHAMIR , Metareg: A platform for modeling, analysisand visualization of biological systems using large-scale experimental data, Genome Biol-ogy, 9 (2008), p. 11 pages.
[162] M. P. VAN IERSEL, T. KELDER, A. R. PICO, K. HANSPERS, S. COORT, B. R. CON-KLIN , AND C. EVELO, Presenting and exploring biological pathways with PathVisio, BMCBioinformatics, 9 (2008), p. 9 pages.
[163] J. VANDESOMPELE, K. D. PRETER, F. PATTYN , B. POPPE, N. V. ROY, A. D. PAEPE, AND
F. SPELEMAN, Accurate normalization of real-time quantitative RT-PCR data by geometricaveraging of multiple internal control genes, Genome Biology, 3 (2002), p. 12 pages.
[164] C. VASQUEZ-ROBINET, S. P. MANE, A. V. ULANOV, J. I. WATKINSON, V. K. STROM-BERG, D. D. KOEYER, R. SCHAFLEITNER, D. B. WILLMOT , M. BONIERBALE, H. J.BOHNERT, AND R. GRENE, Physiological and molecular adaptations to drought in Andeanpotato genotypes, Journal of Experimental Botany, 59 (2008), pp. 2109–2123.
[165] C. VASQUEZ-ROBINET, J. I. WATKINSON, A. A. SIOSON, N. RAMAKRISHNAN , L. S.HEATH, AND R. GRENE, Differential expression of heat shock protein genes in precondi-tioning for photosynthetic acclimation in water-stressed loblolly pine, Plant Physiology andBiochemistry, 48 (2010), pp. 256–264.
[166] J. C. VEGA-ARREGUIN, E. IBARRA-LACLETTE, B. JIMENEZ-MORAILA , O. MARTINEZ,J. P. VIELLE-CALZADA , L. HERRERA-ESTRELLA, AND A. HERRERA-ESTRELLA, Deepsampling of the Palomero maize transcriptome by a high throughput strategy of pyrosequenc-ing, BMC Genomics, 10 (2009), p. 10 pages.
[167] P. E. VERSLUES, M. AGARWAL , S. KATIYAR -AGARWAL , J. H. ZHU, AND J. K. ZHU,Methods and concepts in quantifying resistance to drought, salt and freezing, abiotic stressesthat affect plant water status, Plant Journal, 45 (2006), pp. 523–539.
[168] A. C. VILLEGER, S. R. PETTIFER, AND D. B. KELL, Arcadia: A visualization tool formetabolic pathways, Bioinformatics, 26 (2010), pp. 1470–1471.
[169] M. V ISVANOTHAN , M. BREIT, B. PFEIFER, C. BAUMGARTNER, R. MODRE-OSPRIAN,AND B. TILG, DMSP-database for modeling signaling pathways — Combining biologicaland mathematical modeling knowledge for pathways, Methods of Information in Medicine,47 (2008), pp. 140–148.
[170] H. WALIA , C. WILSON, P. CONDAMINE , A. M. I SMAIL , J. XU, X. P. CUI , AND
T. J. CLOSE, Array-based genotyping and expression analysis of barley cv. Maythorpe andGolden Promise, BMC Genomics, 8 (2007), p. 14 pages.
[171] D. WARDE-FARLEY, S. L. DONALDSON, O. COMES, K. ZUBERI, R. BADRAWI , P. CHAO,M. FRANZ, C. GROUIOS, F. KAZI , C. T. LOPES, A. MAITLAND , S. MOSTAFAVI, J. MON-TOJO, Q. SHAO, G. WRIGHT, G. D. BADER, AND Q. MORRIS, The GeneMANIA prediction
29

server: Biological network integration for gene prioritization and predictinggene function,Nucleic Acids Research, 38 (2010), pp. W214–W220.
[172] J. WATKINSON, K. C. LIANG , X. D. WANG, T. ZHENG, AND D. ANASTASSIOU, Inferenceof regulatory gene interactions from expression data using three-way mutual information,Challenges of Systems Biology: Community Efforts to Harness Biological Complexity, 1158(2009), pp. 302–313.
[173] J. I. WATKINSON, L. HENDRICKS, A. A. SIOSON, L. S. HEATH, H. J. BOHNERT, AND
R. GRENE, Tuber development phenotypes in adapted and acclimated, drought-stressedSolanum tuberosum ssp andigena have distinct expression profiles of genes associated withcarbon metabolism, Plant Physiology and Biochemistry, 46 (2008), pp. 34–45.
[174] J. I. WATKINSON, L. HENDRICKS, A. A. SIOSON, C. VASQUEZ-ROBINET, V. STROM-BERG, L. S. HEATH, M. SCHULER, H. J. BOHNERT, M. BONIERBALE, AND R. GRENE,Accessions of Solanum tuberosum ssp andigena show differences in photosynthetic recov-ery after drought stress as reflected in gene expression profiles, Plant Science, 171 (2006),pp. 745–758.
[175] J. I. WATKINSON, A. A. SIOSON, C. VASQUEZ-ROBINET, M. SHUKLA , D. KUMAR ,M. ELLIS , L. S. HEATH, N. RAMAKRISHNAN , B. CHEVONE, L. T. WATSON, L. VAN
ZYL , U. EGERTSDOTTER, R. R. SEDEROFF, AND R. GRENE, Photosynthetic acclimationis reflected in specific patterns of gene expression in drought-stressedloblolly pine, PlantPhysiology, 133 (2003), pp. 1702–1716.
[176] R. WIDODO, J. H. PATTERSON, E. NEWBIGIN, M. TESTER, A. BACIC, AND U. ROESS-NER, Metabolic responses to salt stress of barley (Hordeum vulgare l.) cultivars, Saharaand Clipper, which differ in salinity tolerance, Journal of Experimental Botany, 60 (2009),pp. 4089–4103.
[177] O. WILKINS , L. WALDRON, H. NAHAL , N. J. PROVART, AND M. M. CAMPBELL, Geno-type and time of day shape the Populus drought response, Plant Journal, 60 (2009), pp. 703–715.
[178] S. WILKINSON AND W. J. DAVIES, Drought, ozone, ABA and ethylene: New insights fromcell to plant to community, Plant Cell and Environment, 33 (2010), pp. 510–525.
[179] D. WINTER, B. VINEGAR, H. NAHAL , R. AMMAR , G. V. WILSON, AND N. J. PROVART,An “Electronic fluorescent pictograph” browser for exploring and analyzing large-scale bi-ological data sets, Plos One, 2 (2007), p. 12 pages.
[180] D. M. WITTMANN , J. KRUMSIEK, J. SAEZ-RODRIGUEZ, D. A. LAUFFENBURGER,S. KLAMT , AND F. J. THEIS, Transforming boolean models to continuous models: Method-ology and application to T-cell receptor signaling, BMC Systems Biology, 3 (2009), p. 21pages.
[181] K. WITZEL , A. WEIDNER, G. K. SURABHI , A. BORNER, AND H. P. MOCK, Salt stress-induced alterations in the root proteome of barley genotypes with contrasting response to-wards salinity, Journal of Experimental Botany, 60 (2009), pp. 3545–3557.
30

[182] M. WRZACZEK, M. BROSCHE, H. KOLLIST, AND J. KANGASJARVI, Arabidopsis GRI isinvolved in the regulation of cell death induced by extracellular ROS, Proceedings of theNational Academy of Sciences of the United States of America, 106 (2009),pp. 5412–5417.
[183] M. WRZACZEK, M. BROSCHE, J. SALOJARVI , S. KANGASJARVI, N. IDANHEIMO ,S. MERSMANN, S. ROBATZEK, S. KARPINSKI, B. KARPINSKA, AND J. KANGASJARVI,Transcriptional regulation of the CRK/DUF26 group of receptor-like protein kinases byozone and plant hormones in Arabidopsis, BMC Plant Biology, 10 (2010), p. 95.
[184] L. J. WU, Z. J. ZHANG, H. W. ZHANG, X. C. WANG, AND R. F. HUANG, Transcriptionalmodulation of ethylene response factor protein JERF3 in the oxidative stressresponse en-hances tolerance of tobacco seedlings to salt, drought, and freezing, Plant Physiology, 148(2008), pp. 1953–1963.
[185] Z. S. XU, L. L IU , Z. Y. NI , P. LIU , M. CHEN, L. C. LI , Y. F. CHEN, AND Y. Z. MA,W55a encodes a novel protein kinase that is involved in multiple stress responses, Journal ofIntegrative Plant Biology, 51 (2009), pp. 58–66.
[186] Z. YESBERGENOVA, G. H. YANG, E. ORON, D. SOFFER, R. FLUHR, AND M. SAGI, Theplant Mo-hydroxylases aldehyde oxidase and xanthine dehydrogenase have distinct reactiveoxygen species signatures and are induced by drought and abscisic acid, Plant Journal, 42(2005), pp. 862–876.
[187] C. YOO AND E. M. BRILZ, The five-gene-network data analysis with local causal discoveryalgorithm using causal Bayesian networks, Challenges of Systems Biology: CommunityEfforts to Harness Biological Complexity, 1158 (2009), pp. 93–101.
[188] M. E. ZANETTI , I. F. CHANG, F. C. GONG, D. W. GALBRAITH , AND J. BAILEY-SERRES,Immunopurification of polyribosomal complexes of Arabidopsis for global analysis of geneexpression, Plant Physiology, 138 (2005), pp. 624–635.
[189] S. ZENONI, A. FERRARINI, E. GIACOMELLI , L. XUMERLE, M. FASOLI, G. MALERBA ,D. BELLIN , M. PEZZOTTI, AND M. DELLEDONNE, Characterization of transcriptionalcomplexity during berry development in Vitis vinifera using RNA-seq, Plant Physiology, 152(2010), pp. 1787–1795.
[190] U. ZENTGRAF, T. LAUN , AND Y. M IAO, The complex regulation of WRKY53 during leafsenescence of Arabidopsis thaliana, European Journal of Cell Biology, 89 (2010), pp. 133–137.
[191] C. Z. ZHAO, H. XIA , T. P. FRAZIER, Y. Y. YAO, Y. P. BI , A. Q. LI , M. J. LI , C. S. LI ,B. H. ZHANG, AND X. J. WANG, Deep sequencing identifies novel and conserved microR-NAs in peanuts (Arachis hypogaea l.), BMC Plant Biology, 10 (2010), p. 12 pages.
[192] G. A. ZHOU, R. Z. CHANG, AND L. J. QIU, Overexpression of soybean ubiquitin-conjugating enzyme gene GmUBC2 confers enhanced drought and salttolerance throughmodulating abiotic stress-responsive gene expression in Arabidopsis, Plant Molecular Biol-ogy, 72 (2010), pp. 357–367.
31
[193] X. F. ZHOU, G. D. WANG, K. SUTOH, J. K. ZHU, AND W. X. ZHANG, Identification ofcold-inducible microRNAs in plants by transcriptome analysis, Biochimica Et BiophysicaActa-Gene Regulatory Mechanisms, 1779 (2008), pp. 780–788.
[194] P. ZOPPOLI, S. MORGANELLA, AND M. CECCARELLI, TimeDelay-ARACNE: Reverse en-gineering of gene networks from time-course data by an information theoretic approach,BMC Bioinformatics, 11 (2010), p. 17 pages.
[195] C. L. ZOU AND J. F. FENG, Granger causality vs. dynamic Bayesian network inference: Acomparative study, BMC Bioinformatics, 10 (2009), p. 17 pages.
32