abdomen scan protocol - enimed as · pdf filelt. coronal scan in mid ... tilt the probe with...
TRANSCRIPT

All information in the presentation are highly confidential and no part of contents may be informed or transmitted without permission from ALPINION Medical Systems.
Abdomen Scan Protocol
Clinical Application Team

Abdomen Scan Protocol
1. Longitudinal scan
2. Transverse scan
3. Rt. Subcostal scan
4. Rt. Hypochondriac oblique
5. Rt. Intercostal scan
6. Rt. Coronal scan in mid-axillary line
8. Lt. Coronal scan in mid-axillary line

Liver
Consists of 4 lobes ; The left, right, caudate, and quadrate lobes. The left and right lobes are separated by the falciform ligament. The small caudate lobe is the separate lobe between the IVC and the Ligamentum venosum The small quadrate lobe is inferior to the caudate lobe and porta hepatis. Ligamentum teres (obliterated left umbilical vein) is the free edge of the falciform ligament

Liver - Couinaud’s 8 Segments
S1 Caudate lobe
S2 Lateral superior segment of LT
S3 Lateral inferior segment of LT
S4 Medial segment of LT
S5 Anterior inferior segment of RT
S6 Posterior inferior segment of RT
S7 Posterior superior segment of RT
S8 Anterior superior segment of RT
Hepatic vein ; inter-segmental • MHV divides into the right/left lobes • RHV divides the RT lobe into the anterior/posterior segments • LHV divides the LT lobe into the medial/lateral segments
Portal vein ; intra-segmental • MPV divides into RPV and LPV at liver hilum • RPV divides into anterior and posterior parts • LPV proceeds cranially along the left lobe then abruptly turns anteriorly

Hepatic vein vs. Portal vein
Hepatic veins Portal veins
Between the hepatic lobes → inter-segmental
Within the lobar segments → intra-segmental
The diameter becomes greater toward the diaphragm
The diameter is greater to the porta hepatis
Border act as specular reflectors → not echogenic unless beam angles is 90 degree
Highly echogenic boundaries
Main hepatic artery Right hepatic artery Left hepatic artery
Main portal vein Right portal vein
Left portal vein (transverse & umbilical portion)

Portal veins
• Echogenic (Bright) walls • Enter the liver through porta hepatis • Largest portal vein divide in the middle of liver • Pass within lobes and segments • Flow into liver

Hepatic veins
• Imperceptible margins • Enlarge toward the IVC • Umbrella configuration • Runs between lobes and segments • Used as anatomical divider of the liver • Flow out the liver

Ligamentum venosum
• The obliterated fetal reminant of ductus venosus • Lie within fissure for ligamentum venosus • Separates the left lobe from caudate lobe

Parenchymal organ echogenicity (Brightness)
• Liver > Renal Cortex > Renal Medulla (Pyramids) • Spleen > Liver • Pancreas > Liver • Renal sinus & retro. Fat > Pancreas

Liver scan protocol
1) Longitudinal scan
2) Transverse scan 2) Subcostal scan - Scan under the right ribs 3) Intercostal scan - Scan between the ribs - Supplementary view for the right lobe

Longitudinal scan – Abdominal aorta
1) Place the probe on the mid-sagittal line right below the Xiphoid
2) Tilt the probe to the left 3) AA (Abdominal aorta) diameter measurement 4) Check the calcification or plaque in aorta (Zoom)
Celiac axis
Pancreas
Splenic Vein
Aorta
Left lobe of liver Celiac trunk and SMA branches from Abdominal aorta Diaphragm located superiorly (left), pancreas (longitudinal view) located inferiorly (right) Splenic vein runs posteriorly to pancreatic body and tail Normal AA diameter is about 3cm
SMA

1) Place the probe on the mid-sagittal line right below the Xiphoid 2) Tilt the probe to the Right 3) Check the Lt lobe margin and S1(Caudate lobe) 4) Check the IVC dilatation
IVC continues to the right atrium superiorly (left) At the same level, the hepatic veins can be seen Hypertrophy of the caudate lobe is seen in Budd-Chiari syndrome(caused by occlusion of
hepatic venous outflow) or Cirrhosis
Longitudinal scan – Left lobe
→ Enlarged caudate lobe

Subcostal scan – Portal vein
1) Place the probe under the right rib margin 2) Ask patient to take a deep breath and hold it 3) Sweep the probe to examine the whole of segmental lobe 4) IHD (Intrahepatic bile duct) measurement if it is dilatated
The bifurcation of RPV and LPV
The bifurcation of RPV and LPV (echogenic wall) S2 to S7 can be seen if you scan the umbilical portion of LPV LPV has the pars transversa and the umbilical (ascending) portion Normal IHD diameter < 2mm

Subcostal scan – Left lobe
1) Place the probe right under the right rib margin 2) Ask patient to take a deep breath and hold it 3) Scan the umbilical portion of LPV and its branches
Umbilical portion of LPV
Ligament venosum
IVC
S2
S3 S4
LPV turns abruptly anteriorly after transverse portion; Umbilical portion Umbilical portion of LPV and its branches form a “Recumbent H” sign Caudate lobe is located between ligament venosum and IVC

1) Place the probe under the right rib margin 2) Tilt the probe with cephalic angulation 3) Ask patient to take a deep breath and hold it
Subcostal scan – Hepatic vein
The hepatic veins have non-echogenic walls Size is changed as patients breathes MHV separates Rt. lobe and Lt. lobe RHV separates Anterior segment(S5, S8),
Posterior segment(S6, S7) LHV separates Superior segments(S2) and
Inferior segments(S3)

Intercostal / subcostal scan – Right lobe
1) Place the probe between the right ribs 2) Ask patient to breathe out and hold it 3) Move transducer to next intercostal space & scan
through 4) Liver hilum is displayed in right subcostal space
IVC
RPV
Visualize RHV & RPV in right lobe in detail Segment 7~8 External CBD and hepatic artery are located
above the portal vein → Liver hilum Using color Doppler, you can differ CBD from
the portal vein and hepatic artery
CBD, hepatic artery

Sonographic liver pattern
Normal
Centri-lobular
Fatty-fibrotic

Sonographic liver pattern_ Centrilobular pattern
Decrease echogenicity of liver parenchyma
Starry sky appearance
Increase visualization of PV wall (brightness, number)
Causes: acute hepatitis, acute RT side HF, leukemia/lymphoma, toxic shock, 2%
of normal

Sonographic liver pattern_ Fatty fibrotic pattern
Increased echogenicity of liver parenchyma
Decreased definition of PV walls
Echotexture
- Homogeneous (fine) - Heterogeneous (coarse)
Posterior sound attenuation
• Causes: fatty infiltration, chronic hepatitis, cirrhosis, acute alcoholic hepatitis.

Liver abnormal cases
Liver hemangioma
• Displayed as well-bordered, hyperechoic areas
Liver cirrhosis
• Irregular rough liver margins • Parenchymal echo is higher and the
tissue seems to be granular (coarse) • Ascites in the surrounding

Liver abnormal cases
Liver tumors
• Bearing of different echogenicity from surrounding parenchyma
Liver metastases
• A few bigger metastases with hypoechoic margins (halo sign)
• Liver metastasis can look diffuse with multiple hyperechoic liver area

Pancreas Location - Between the duodenal loop and the splenic hilum. - The stomach and duodenum lies anterior to the pancreas. Role of Pancreas - After food enters the duodenum, the exocrine tissues secrete a digestive juice that break down food into small molecules - The endocrine tissue(islets of Langerhans) secretes hormones(Insulin, Glucagon) directly into the bloodstream. Anatomic structure - Divided into a head, uncinate process, neck, body, tail. - Uncinate process is posterior to the SMA, SMV. - Pancreatic duct is parallel to the skin surface and its wall Common Pathology - Adenocarcinoma - Pseudocyst - Pancreatitis - Fatty change - Insulinomas - Cystic fibrosis

Pancreas scan protocol
1) Longitudinal scan
2) Transverse scan 3) Oblique Transverse scan - For scanning pancreatic tail

Transverse scan - Pancreas
1) Place the probe on the Xiphoid process with slightly caudal angulation
2) Apply enough pressure to help displace bowel gas 3) Scan from the head to the tail of pancreas in detail Head (Uncinate process) – Tilt the probe to the left Tail – Tilt the probe to the right 4) Use the splenic vein to help identify the pancreatic body 5) Measure the diameter of PD (Pancreatic duct)
Hyperechoic than liver (because of fatty infiltration) Splenic vein always runs along posterior border of pancreas The pancreatic head surrounds the portal vein Normal pancreatic duct : 1~2mm

Pancreatic disease
Lipomatous pancreas Chronic pancreatitis Pancreatic tumor

GB (Gallbladder) Role of GB - Common bile ducts carry bile from the liver to the duodenum where it helps to digest the fatty foods. - The gall bladder stores this bile in between meals. Common Bile Duct - Common hepatic duct + Cystic duct - A part of portal triad with portal vein and hepatic artery Sonographic appearance - A normal GB should be thin walled (<3mm) and anechoic. - Size varies depending on the amount of bile. - Fasted, it will be approximately 10cm long. Common Pathology - Folds/Phrygian cap - Polyp - Calculi/Sludge - Cholecystitis - Adenomyomatosis - Gallbladder Carcinoma

GB Scan Protocol
The location of GB is variable case by case 1) Subcostal scan 2) Intercostal scan 3) Perpendicular to subcostal margin.

GB scan – Long Axis view
1) Supine or left lateral decubitus position (Better) 2) Ask the patient to take a deep breath and hold it 3) Right subcostal or intercostal approach 3) Visualize the longest length of GB 4) Check internal lesion (polyp or calcification) in detail 5) Check GB wall thickening or phrygian cap Normal thickness of GB wall<3mm Sometimes there is a phrygian cap Wall thickening disease : hepatis, ascites, hypoalbuminemia renal disease, multiple myeloma
Subcostal margin

GB scan (CBD scan) – Long Axis view
1) Supine or left lateral decubitus position (Better) 2) Ask the patient to take a deep breath and hold it 3) Locate the pancreas and SMA (portal confluence) and rotate clockwise with following the portal vein.
You can appreciate the portal hepatis 3) Visualize the CBD (Common bile duct) on B/CF mode to distinguish with portal vein 4) Measure the thickness of CBD Normal CBD diameter < 6mm Proximal CBD runs along the main portal vein superiorly CBD enters to the liver hilum with hepatic artery and portal vein

GB abnormal cases
Gallstone Gallbladder polyp
• Hyperechoic objects. • Hypoechoic shadow behind the stone. • Sludge looks like hypoechoic mass inside
the bladder.
• Polyps grow into the gallbladder lumen. • Similar echogenicity as the GB wall. • Could be mistaken with gallstones, but never
find the shadow behind polyps.

GB abnormal cases
Acute cholecystitis Chronic cholecystitis
• The wall is thickened over 4mm. • Anechoic fluid near the gallbladder.
(between gallbladder and liver tissue) • Caused by air-producing bacteria.
• Gallbladder wall is thickened over 4mm. • Often gallstones present inside the GB.

Spleen Location - In the upper far left part of the abdomen, to the left of the stomach - Protected by the rib cage, you can’t easily feel it unless it’s abnormally enlarged Role of Pancreas - Acts as a filter for blood as part of the immune system. - Old red blood cells are recycled in the spleen, and platelets and white blood cells are stored there. - Helps fight certain kinds of bacteria that cause pneumonia and meningitis. Anatomic structure - Commonly fist-shaped, purple, and about 4 inches long Common Pathology - Splenomegaly >12-14 cm and becomes rounded. - Infection- multiple echogenic foci (granulomata) - Hemangioma - Lymphoma - Varices - portal hypertension - Hematomas - Abscess - Splenic infarction

Spleen scan protocol
1) Lt. longitudinal scan 2) Transverse scan with pancreatic tail

1) Supine or Right lateral decubitus position 2) Place the probe on the right mid-sagittal line obliquely 3) Overlying bowel and lung gas or rib shadows can cause
problems (more transparent by expiration) 4) Measure the major axis of spleen when hilum is seen (In case of having a liver disease, make sure to measure the size)
Spleen scan – Longitudinal scan
Spleen
Splenic vein of hilum
Homogeneous and less echogenic(dark) than liver Normal size of spleen : <12cm
Splenomegaly : >12cm Considered enlarged if it covers the entire left kidney Pancreatic tail inserts to the spleen

Kidney
Location - the back of the abdominal cavity (retroperitoneal organs), just above the waist - The liver is located just above the right kidney - The spleen is located just above the left kidney - The right kidney is usually slightly lower than the left. (liver) Role of Kidney - The removal of toxic waste products from the body - Regulate blood pressure and the production of certain hormones - homeostasis and maintaining general good health. Internal Anatomic structure
- Renal cortex : a light outer area - Renal columns : The areas between the pyramids. - Renal medulla : a darker inner area - Renal pyramids : Within the medulla, cone-shaped sections - Renal papilla : the smaller end of the renal pyramids. - Minor calyx : a cup which collects urine for removal from the kidney. merge into a Major calyx. - Renal Pelvis : the exit of the kidney connected the ureter

Kidney - Normal Appearance
• Echogenecity - Kidney is surrounded with a capsule which is a thick fiber structure (strong interface) - Renal cortex is less echogenic than the normal liver and spleen (consists of nephron) - Medulla Pyramids look anechoic (contain fluid, which is urine). - Renal sinus (renal pelvis) is central echo-dense zone made up of fibrofatty tissue. • Normal size - length : 10~12cm - width : 4~6cm - Cortical thickness (not<10mm)

Kidney scan protocol
1) Longitudinal scan 2) Transverse scan

1) Place the probe on the mid-axillary lines in the supine position 2) Slightly rotate the probe in oblique direction 3) Right kidney – Use liver for acoustic window 4) Left kidney – Use spleen for acoustic window 5) With deep inspiration, hold it 6) Measure the size for checking chronic renal failure Cortex is less echogenic(dark) than liver Medulla pyramid is hypoechoic and appears dark. Renal pelvis is filled with urine and is echo free with posterior enhancement behind renal pelvis Central sinus complex has high echogenicity. (vessels, fat, fibrous tissue)
Kidney scan – Longitudinal (Coronal) scan

Renal parenchymal echogenicity

Kidney – Abnormal Appearance
• Hydronephrosis - The swelling of a kidney due to a build-up of urine. - It happens when urine cannot drain out from the kidney (renal pelvis) to the bladder from a blockage or obstruction and it cause the renal pelvis to be enlarged.
Mild hydronephrosis Moderate hydronephrosis Severe hydronephrosis

• Renal stone - Bright hyperechoic oval/round structures within the cortex or renal sinus - Makes the posterior shadowing behind the kidney stone - Twinkle artifact in CF mode
Kidney – Abnormal Appearance
• Renal cyst - Anechoic structure often at the periphery of the renal cortex with a thin wall, and posterior acoustic enhancement. - Cysts are typically single and arise in the periphery of the kidney, but can be multiple as in polycystic kidney disease.

• Ectopic Kidney - A birth defect in which a kidney is located below, above, or on the opposite side of its usual position - The most common ectopic site is in the pelvis - The crossed-ectopic kidney : a single large fused kidney
: Cross fused ectopic kidney. The left kidney is fused to the lower pole of the right kidney
Kidney – Abnormal Appearance

Doppler Study
1. Abdominal Aorta
2. Iliac & Femoral Artery
3. IVC/Hepatic Veins
4. Portal Veins
5. Renal parenchymal study
1
2
3 4
5

Color Flow vs. Spectral Doppler
Color Flow Spectral Doppler
• Overall view of flow • Direction information • Mean velocity • Turbulent flow
• Examine flow at one site • Detail flow information • Peak velocity • various index (RI, PI, AT..)
Mean velocity

Low vs. High Resistance spectrum
A. Normal diastolic flow
B. Absence of end-diastolic flow
C. Reversed end-diastolic flow
Low Resistance waveform - Good Diastolic flow
High Resistance waveform - Poor Diastolic flow - Flow Reversal in end-diastolic

1) Abdominal Aorta
• Normal waveform; Triphasic waveform with clean spectral window • Sharp increase in antegrade flow during systole, followed by a reversal
flow in early diastole and low-velocity antegrade flow in the late diastole • Occlusive disease may change resistance and waveform

• Enlarged vessel > 3cm • Thrombus accumulation causes increased
echogenicity in the lumen • Measure true vessel size, outer – outer • Turbulence flow seen in Color • Both direction during systolic in PW Doppler
1) Abdominal Aorta – Aneurysm

2) Iliac and Femoral Artery
• Clean spectral window • High resistance waveform with a reverse
diastolic flow • Occlusive disease may change resistance
and waveform
Normal Doppler Femoral Artery Stenosis
• Turbulent flow • Spectral Broadening • High peak velocity

Spectral Broadening
• Fill – in of the spectral window • Wide range of velocities • Normal in small vessels (Renal artery, hepatic artery … ) • Other factors can cause the pseudo-spectral broadening.
Immediately after stenosis Spectral Broadening

3) IVC / Hepatic Veins
• Hepatic veins flow toward IVC and heart • Away from transducer – normally, Blue • Characteristic pulsatile flow (12~25cm/s) - Two antegrade flow toward the heart - One retrograde flow toward the liver

4) Portal Veins
• Continuous flow toward the liver (= Hepatopetal flow) • Toward the transducer – normally, Red • Low velocity (15~28cm/s) • Reflect Respiratory or Cardiac variation

5) Hepatic artery
• Rapid systolic acceleration • Continuous forward flow toward the liver • Same direction as MPV • Toward the transducer – normally, Red • RI =0.5 ~ 0.7

6) Renal Parenchymal Doppler
• Color Doppler – the perfusion to the edge of the renal cortex • Low velocities (14~18cm/s) • Normal Spectral broadening & low resistance waveform • Resistive index – measured at the interlobar / interlobular arteries

Color Doppler vs. Power Doppler
Color Doppler Power Doppler
Presence & Direction Presence of blood flow
Less sensitivity More sensitivity

Directional Power Doppler (DPDI)
• Power Doppler + Direction information • More sensitive in detection of vascularity than CF mode • Change the Color map to number 8, 9 (EC-5, 7, 9)

Guidelines for optimal Doppler examination
Adjust gain & filter
Adjust velocity scale
Doppler angle < 60 by angle steering & probe position
Color box as small & superficial as possible
Sample volume size: 2/3 of vessel width in the center

Color Doppler Parameter
Parameter Image effect
Scale (kHz) = PRF • For detection of higher flow velocities, increase the scale velocity • For detection of slower flow velocities, decrease the scale velocity
Threshold = Balance (gray-color priority) Threshold assigns the grayscale level where color information stops Lowering the threshold displays more grayscale and less color
Color box size Wider color box reduces the frame rate
Angle Steer To obtain a good CF image, color box angle should be steered
Ensemble = sensitivity Higher ensemble helps to detect the color signal more rapidly and sensitively, BUT the frame rate gets lower.
Smooth Higher smooth level makes the color flow look smoother Lower smooth level makes the pixel size smaller but, look coarse
Persist The time for displaying color lasts with higher persist
WF (Wall Filter) Filter out clutter signals caused from vessel movement

Color map
Mean Velocity range
(cm/sec)
Baseline Wall filter
Threshold = Color write
priority
Inversion Color map

Color Parameter - Box Size & Angle Steer
1) Color box size 2) Color box steering
Oversized color box Frame rate ↓
Color box should be as small & superficial as possible
Perpendicular Poor image
Angle steer Direction of flow
Good image
Steer the color box to obtain a good Doppler angle

Color Parameter - Scale (PRF)
Proper Color velocity scale 28cm/sec
Normal flow in PV
High color velocity scale (43cm/sec)
Apparent absence of flow in PV
Low color velocity scale (4cm/sec)
Color aliasing in PV & its branches
3) Color Scale (PRF)

Color Parameter - Gain & Threshold
4) Color Gain
Gain should be set as high as possible Without displaying random color speckles
5) Threshold (=Balance)
Threshold = Color-Grayscale Priority If high threshold causes overwriting of color on tissue, the threshold can be lowered

6) Ensemble (=Sensitivity)
Color Parameter – Ensemble
Ensemble 4 Ensemble 16
Increasing the ensemble will send more pulse to increase the sensitivity It is good to detect the micro-vessels, but decrease the frame rate.

Color Parameter – Smooth
6) Smooth filter
Low Smooth - Small cell size
High Smooth - Big cell size
Increasing the Smooth filter can make color image smoother, But the size of color cell gets bigger.

Imaging Tips – Color Flow mode
Goal Possible Action
Eliminate aliasing • Increase the velocity scale • Decrease color gain
Increase sensitivity • Decrease the velocity scale • Increase color gain / Decrease 2D gain • Increase Ensemble (But, FR ↓)
Decrease flash artifact • Decrease color gain • Increase color wall filter • Increase the velocity scale
Increase color smoothing • Increase persist (frame averaging) • Increase Smooth
Increase color filling • Increase color gain • Decrease the velocity scale
Increase frame rate • Decrease the color box size/depth • Decrease color line density to low • Decrease Ensemble

Parameter Image effect
SV (Sample Volume) Small sample volume is desirable for better resolution.
Scale (kHz) = PRF When aliasing artifact occurs, scale(PRF) should be increased
Baseline To prevent aliasing, the baseline should be adjusted.
Angle Correct Around 45~60 angle to the direction flow is ideal
Sweep
The displayed time interval. • Fast sweep speed (shorter interval) is useful for detail. • Slow sweep speed (longer interval) is useful to see the rate and rhythm of blood flow
Auto angle Automatic angle correction, Select among -60, 0, 60
Invert Invert the spectrum Positive velocities display below the baseline
PW Doppler Parameter
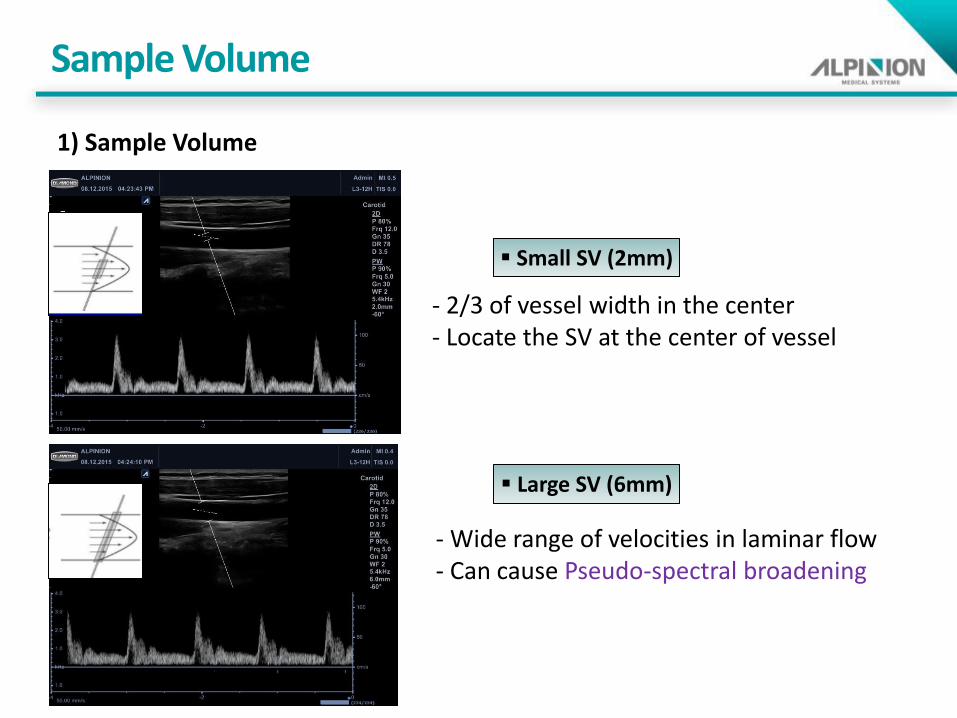
Sample Volume
- Wide range of velocities in laminar flow - Can cause Pseudo-spectral broadening
Small SV (2mm)
Large SV (6mm)
1) Sample Volume
- 2/3 of vessel width in the center - Locate the SV at the center of vessel

Spectrum location
A. Blood flow toward the transducer → Positive Doppler shifts → Above the baseline B. Blood flow perpendicular to the beam → No signals C. Blood flow away from the transducer → Negative Doppler shifts → Below the baseline
2) Spectrum Invert

Doppler Angle Correction
3) Angle Correction
PW angle: 80° PS: 220cm/s ED: 50cm/s
PW Angle: 40° PS: 52cm/s ED: 11cm/s
Use angle correction (≤ 60 degrees), if an accurate velocity is important

Velocity Scale (PRF)
4) Spectral Scale
High Spectral scale : 16.2kHz
Adjust the Spectral scale : 5.4kHz
If the PRF is too high, the waveform on the display will be very small If the PRF is too small, aliasing will occur

Imaging Tips – PW mode
Goal Possible Action
Increase sensitivity • Adjust Doppler angle to flow • Decrease SV(sample volume size) • Decrease the scale
Noise reduction • Decrease Doppler gain • Increase wall filter • Decrease SV(sample volume size)
Eliminate aliasing
• Increase the scale • Adjust the baseline • Adjust Doppler angle to flow • Turn on Xpeed™
Display low-velocity spectrum
• Decrease the velocity scale • Decrease wall filter

The range of velocities – Abdominal vessels
Abdominal Vessels Velocity range (cm/s)
Aorta 90±10
Hepatic Artery 31±13
Splenic Artery 34±9
Superior Mesenteric Artery 27±7
Renal Artery 30±10
Inferior Vena Cava 19±8
Portal Vein 26.5±5.5
Renal Vein 18±4

Artifacts • Mirror image artifacts : a lesion located near a large specular surface (metastatic liver next to diaphragm) may result in a false lesion above the diaphragm. : beam is reflected by the diaphragm and redirected into the liver before transducer.
• Reverberation Artifact : At strong interfaces, the returning echo is reflected back into the tissue. : at large superficial parallel specular reflectors (such as the urinary bladder)
• Shadowing : an absence of echoes posterior to highly reflective structures (stone, bone..)
• Acoustic enhancement : a band of increased echoes distal to a low attenuating structure (liver cyst)
Mirror image artifacts Shadowing Acoustic enhancement

• Comet-Tail Artifact : short range(internal) reverberation. : Most often caused by small metallic objects : Bright lines forming a relatively short linear stream of echoes
• Ringdown Artifact : resonance phenomenon in a pocket of air bubbles in a fluid medium (in the stomach and duodenum) : Appears as a long linear, stream of echoes. : Caused by air bubbles → can diagnosis pneumobilia or abscess : Can reduce by decreasing overall gain or TGC in near field
• Tissue Velocity Change Artifact : The machine is calibrated for average soft tissue velocities of 1540m/s. : Tissue with a slower velocity (fat) is placed at a greater distance from the transducer.
Comet-Tail artifact Ringdown artifact Velocity Change artifact
Artifacts