abbvie, inc. chris glotzbach, tom van spankeren and jeffrey li october 23, 2014
TRANSCRIPT
AbbVie, Inc.
Chris Glotzbach, Tom Van Spankeren and Jeffrey Li
October 23, 2014

Agenda1. Introduction2. Macroeconomic Review3. Relevant Stock Market Prospects4. Company Review 5. Financial Analysis6. Financial Projection7. Application of Valuation Methodologies8. Recommendation

Introduction- Spin-off of Abbott Laboratories (2013)
- Research based pharmaceutical
company
- 8th largest publicly traded
pharmeceutical
- Employs 25,000 worldwide
- Drugs are sold in over 170 Countries
Source: AbbVie, Inc. 10-K (Fiscal 2013) page 5, 10 16,

Position- Listed on NYSE - ABBV - 400 shares
- 200 shares @ $27.08
- 100 shares @ $27.53
- 100 shares @ $34.22
- Cost Basis = $28.98 ($11,592)
- Current Price = $56.90 ($22,760)
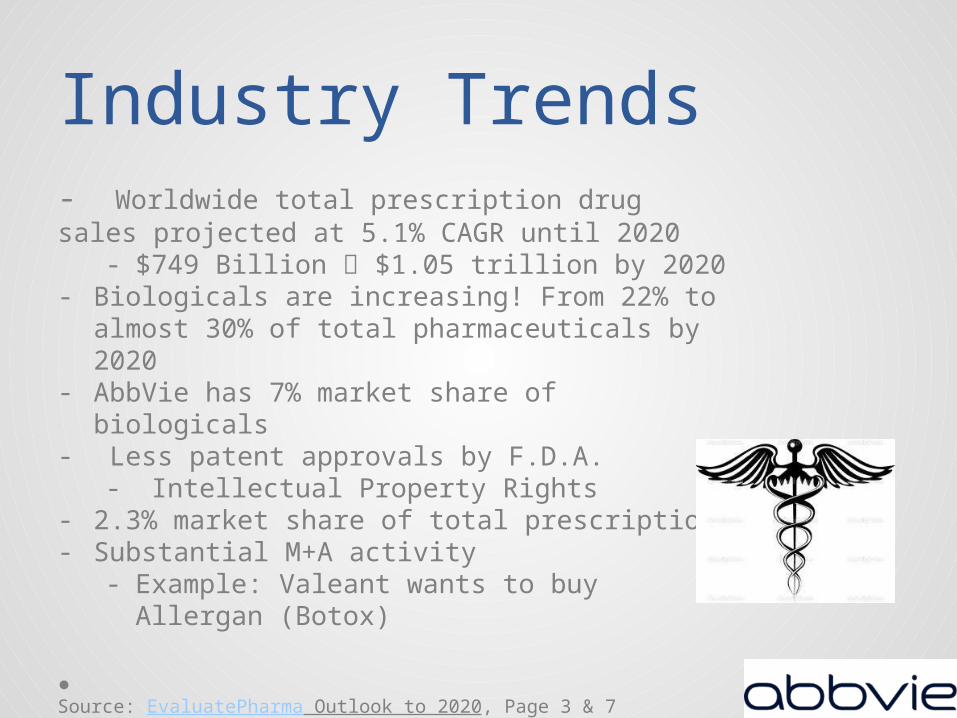
Industry Trends- Worldwide total prescription drug sales projected at 5.1% CAGR until 2020
- $749 Billion $1.05 trillion by 2020- Biologicals are increasing! From 22% to almost
30% of total pharmaceuticals by 2020- AbbVie has 7% market share of biologicals- Less patent approvals by F.D.A.
- Intellectual Property Rights- 2.3% market share of total prescriptions- Substantial M+A activity
- Example: Valeant wants to buy Allergan (Botox)
Source: EvaluatePharma Outlook to 2020, Page 3 & 7

Target Market and Demographics
- Overall trend in demographics favorable for AbbVie
- Emerging markets in focus- Increase emphasis on
disease prevention
Source: Age invaders, The Economist April 26 2014

Government Regulation- Biologics Price Competition and Innovation Act
signed by President Obama in 2009 and vastly amended with the Affordable Care Act
- Makes “biosimilars” very difficult to duplicate- They need to be “safe secure and potent”- However uncertainty exists with this legislation- AbbVie petitioned F.D.A. not to approve
biosimilars for Humira
Source: AbbVie, Inc. 10-K (Fiscal 2013) Page 9
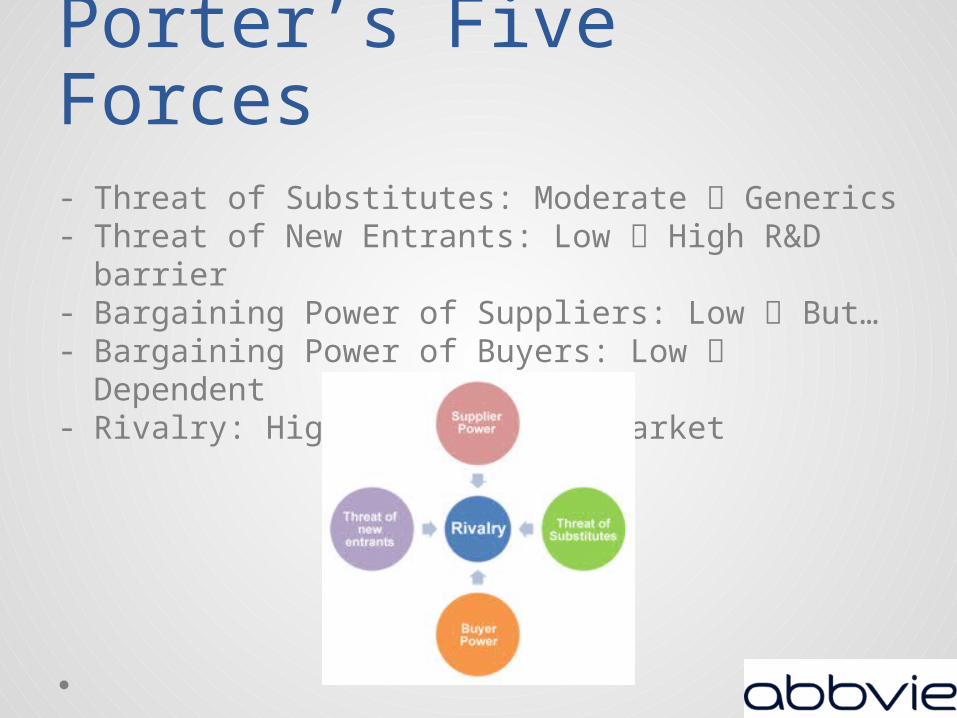
Porter’s Five Forces- Threat of Substitutes: Moderate Generics- Threat of New Entrants: Low High R&D barrier- Bargaining Power of Suppliers: Low But…- Bargaining Power of Buyers: Low Dependent- Rivalry: High Attractive market
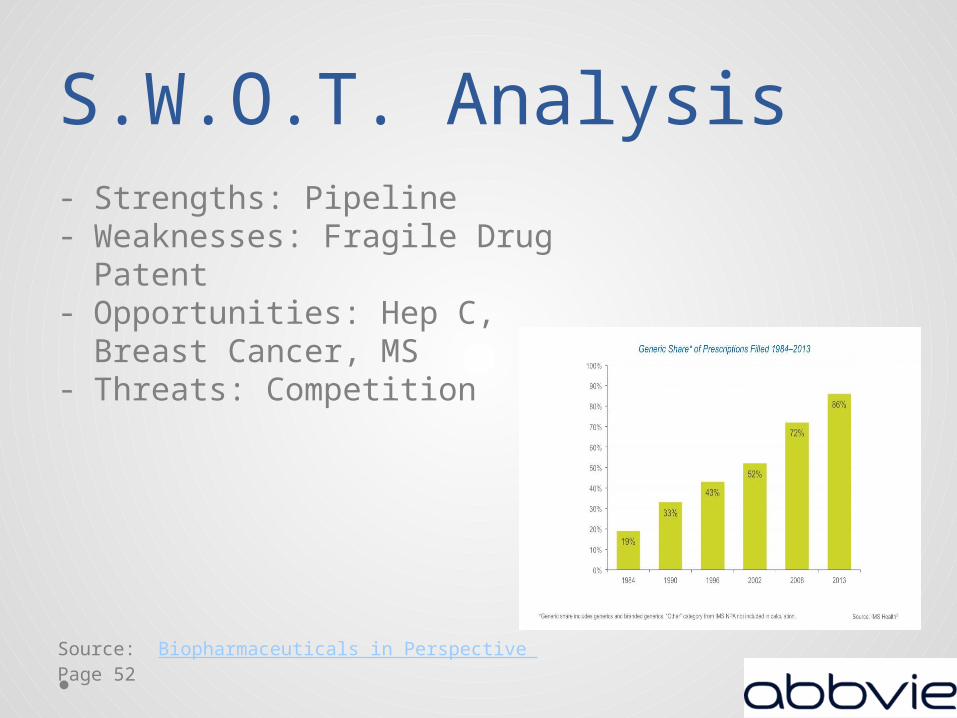
S.W.O.T. Analysis- Strengths: Pipeline- Weaknesses: Fragile Drug
Patent- Opportunities: Hep C, Breast
Cancer, MS- Threats: Competition
Source: Biopharmaceuticals in Perspective Page 52

Where in the Growth Cycle?
Growth Phase
Source: Graph Template from QuickMBA

Guidance and Mgt“Last month, we raised our 2014 earnings-per-
share guidance, reflecting strong underlying business performance. We continue to expect positive trends for the second half of the year, as well as additional progress from our pipeline, including the expected U.S. approval of our interferon-free HCV combination.“-CEO Richard Gonzalez 7/25/2014
“I wanted to send a note saying that I’m more energized than ever about our two companies coming together”-CEO Richard Gonzalez 9/29/2014
Source: AbbVie, Inc. FINANCIAL RELEASE 2014 Q2, AbbVie Tells Shire Employees: The Merger Will Go On
, WSJ Sept 29,2014

Products- Total Revenue For Fiscal 2013 (in Millions) Total = 18,790
Humira 56.73%
Androgel 5.51%
Kaletra 5.12%
Lupron 4.4%
Synthroid 3.31%
Sevoflurance 3.02%
Other 17.73%
54%46%
USAInter-national
Source: AbbVie, Inc. 10-K (Fiscal 2013) Page 45

Humira- Uses: Rheumatoid arthritis,
Chrohn’s disease and various other ailments/diseases
- 26.2% year over year sales growth- Costs approximately $2,246 a
month- 3rd largest sales in US- AbbVie must diversify away from
Humira
Source: AbbVie, Inc. 10-K (Fiscal 2013) Page 6-15
Patents?- Loses US Humira patent in December 2016 and
European patent in April 2018- Concerned considering it is blockbuster drug- Lack of clarity regarding biosimilar patents- Will it be similar to Niaspan and Tricor/Triliplex
where sales declined 90%?
Source: AbbVie, Inc. 10-K (Fiscal 2013) Page 6-15

Research & Development
- 2013: Just < $3 Billion or 15% of Sales
Source: AbbVie, Inc. 10-K (Fiscal 2013) Page 57, AbbVie R&D Page
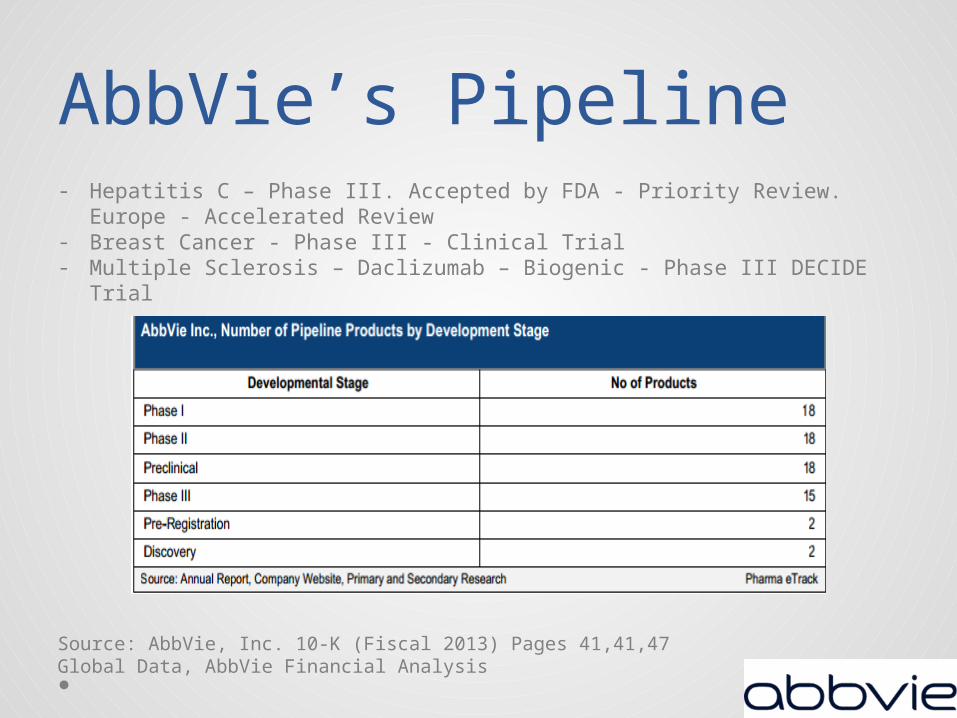
- Hepatitis C – Phase III. Accepted by FDA - Priority Review. Europe - Accelerated Review
- Breast Cancer - Phase III - Clinical Trial- Multiple Sclerosis – Daclizumab – Biogenic - Phase III DECIDE Trial
Source: AbbVie, Inc. 10-K (Fiscal 2013) Pages 41,41,47Global Data, AbbVie Financial Analysis
AbbVie’s Pipeline
Hepatitis C- “In our clinical trials, we're seeing the majority of
patients - even up to 100 percent of patients - experiencing a cure. And patients are able to tolerate the therapy very well, with fewer than 2.3 percent having to discontinue treatment due to adverse events.” – CEO Richard Gonzalez
- 130-150 million worldwide with Hepatitis C- 3.2 million Americans and 17.5 million Europeans
- Competition from Gilead’s Sovaldi (already in market) and Merck 15%-20% Discount
Source: AbbVie Annual Stockholder Meeting May 9, 2014, World Health Organization; Hepatitis C Fact Sheet , Viral Hepatitis Action Coalition

Risks for AbbVie- Creation of biosimilars- Humira patent loss- Inability to gain market share – Hepatitis C- Research and Development efforts are not
sufficient- Loss of shareholder trust with management
Source: AbbVie, Inc. 10-K (Fiscal 2013) Page 16 -26

Shire Deal? - $55 BillionPros:- “Would diversify itself
internationally”- ADD and ADHD drug
totaling 25% of revenues, rare diseases drugs
- Tax rate falls to 13% from 22% $8 billion savings in 15 years
Cons:- New inversion laws- Huge premium being
paid- Shire stock tumbled
30% at deal fallout- $1.64 billion breakup
fee – tax deductible
Source: AbbVie to Buy Shire for $54 Billion WSJ July 18 2014Collapse of AbbVie-Shire Deal Leaves Scars WSJ, oct 16 2014

Technical Analysis
Source: Fidelity Investments

Ratio Analysis
2010 2011 2012 20130.00
0.20
0.40
0.60
0.80
1.00
1.20
0.00
1.00
2.00
3.00
4.00
5.00
6.00
7.00
8.00
9.00
DuPont Analysis
Tax Burden
Interest Burden
Operating Profit Margin
Asset Turnover
Leverage TA/ TE
ROE
Leverage Ratios 2011A 2012A 2013A
Debt/Assets NA 0.54 0.49
Interest- Coverage -181.00 69.25 20.37
Greenblatt
2011A 2012A 2013AEBIT/Tangible
Assets 0.56 0.82 0.89
EBIT/EV NA 9.2% 6%
DuPont Analysis 2010A 2011A 2012A 2013A
Tax Burden 0.86 0.94 0.92 0.77Interest Burden 1.03 1.01 0.98 0.94
Operating Margin 30% 21% 32% 30%Asset Turnover 0.74 0.89 0.68 0.64
Leverage 1.35 1.64 8.03 6.50ROE 27% 29% 157% 92%
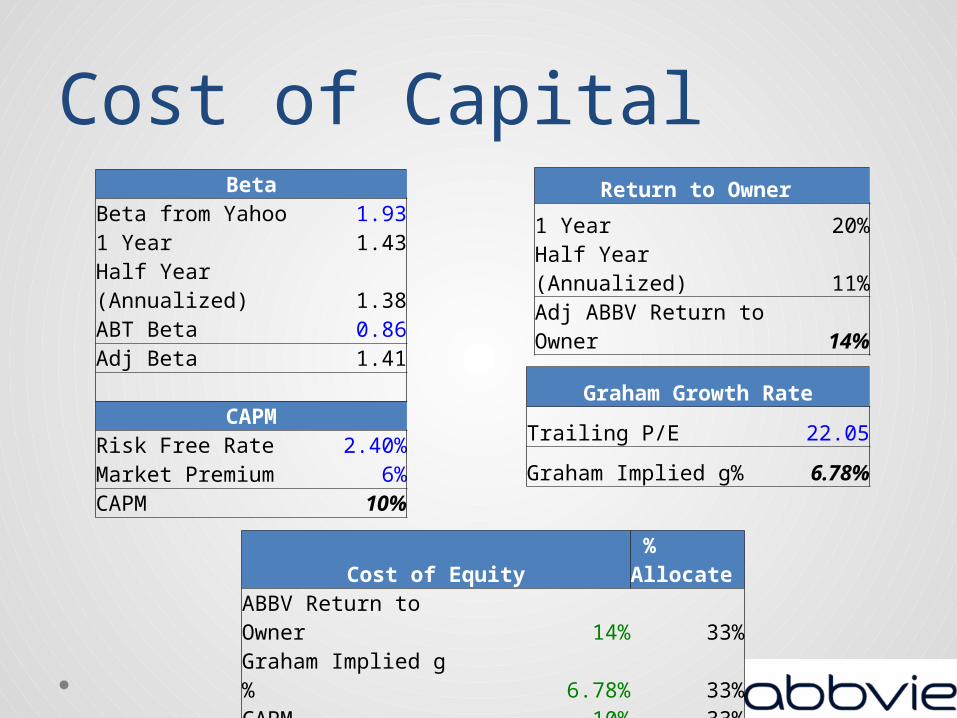
Cost of CapitalReturn to Owner
1 Year 20%
Half Year (Annualized) 11%
Adj ABBV Return to Owner 14%
Graham Growth Rate
Trailing P/E 22.05
Graham Implied g% 6.78%
BetaBeta from Yahoo 1.931 Year 1.43Half Year (Annualized) 1.38ABT Beta 0.86Adj Beta 1.41
CAPMRisk Free Rate 2.40%Market Premium 6%CAPM 10%
Cost of Equity % AllocateABBV Return to Owner 14% 33%Graham Implied g% 6.78% 33%CAPM 10% 33%Cost of Equity 10.3% 100%

Cost of CapitalCapital Structure
Debt $14,292.00 14.0%Equity 87493.12 86.0%Total Financing $101,785.12 100%
Discount Rate % AllocateCost of Equity 10.3% 100% Pre Tax - Cost of Debt 2.49% Tax Rate 22% After Tax - Cost of Debt 2% Cost of Equity 10.3% 86.0%After Tax - Cost of Debt 2% 14.0%WACC 9.1% Risk Premium 1.0% Discount Rate 10.1%

Revenue Projection- Revenue projection: Major Product Revenue
Estimation
- Gross Profit Margin: 78%
- SG&A: 28.46%
- Research and development : 15%
- Tax Rate: 22%
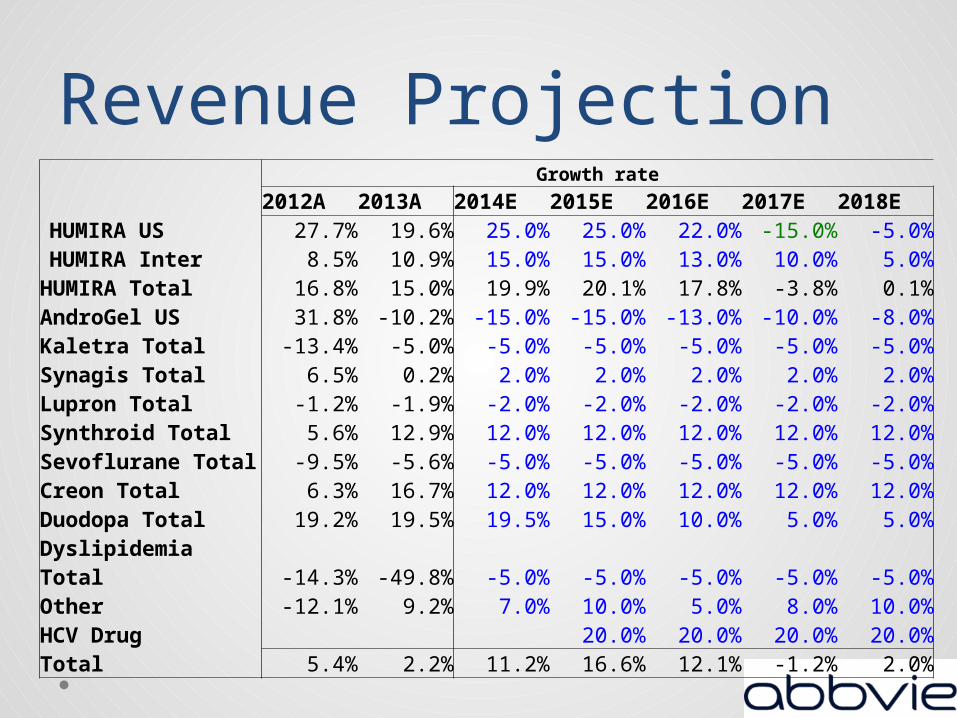
Revenue Projection Growth rate
2012A 2013A 2014E 2015E 2016E 2017E 2018EHUMIRA US 27.7% 19.6% 25.0% 25.0% 22.0% -15.0% -5.0%HUMIRA Inter 8.5% 10.9% 15.0% 15.0% 13.0% 10.0% 5.0%
HUMIRA Total 16.8% 15.0% 19.9% 20.1% 17.8% -3.8% 0.1%AndroGel US 31.8% -10.2% -15.0% -15.0% -13.0% -10.0% -8.0%Kaletra Total -13.4% -5.0% -5.0% -5.0% -5.0% -5.0% -5.0%Synagis Total 6.5% 0.2% 2.0% 2.0% 2.0% 2.0% 2.0%Lupron Total -1.2% -1.9% -2.0% -2.0% -2.0% -2.0% -2.0%Synthroid Total 5.6% 12.9% 12.0% 12.0% 12.0% 12.0% 12.0%Sevoflurane Total -9.5% -5.6% -5.0% -5.0% -5.0% -5.0% -5.0%Creon Total 6.3% 16.7% 12.0% 12.0% 12.0% 12.0% 12.0%Duodopa Total 19.2% 19.5% 19.5% 15.0% 10.0% 5.0% 5.0%Dyslipidemia Total -14.3% -49.8% -5.0% -5.0% -5.0% -5.0% -5.0%Other -12.1% 9.2% 7.0% 10.0% 5.0% 8.0% 10.0%HCV Drug 20.0% 20.0% 20.0% 20.0%Total 5.4% 2.2% 11.2% 16.6% 12.1% -1.2% 2.0%

Forecasted Figuresin millions 2014E 2015E 2016E 2017E 2018ENet sales $20,903.08 $24,369.67 $27,327.36 $27,011.10 $27,545.22
% growth 11% 17% 12% -1% 2%Cost of products sold $4,598.68 $5,361.33 $6,012.02 $5,942.44 $6,059.95
% of Sales 22.00% 22.00% 22.00% 22.00% 22.00%Gross Profit $16,304.41 $19,008.34 $21,315.34 $21,068.66 $21,485.27 % margin 78.00% 78.00% 78.00% 78.00% 78.00% Selling, general and administrative $7,589.16 $6,935.77 $7,777.55 $7,687.54 $7,839.55
% of Sales 28.46% 28.46% 28.46% 28.46% 28.46%Research and development $3,167.71 $3,693.04 $4,141.26 $4,093.33 $4,174.27
% of Sales 15.15% 15.15% 15.15% 15.15% 15.15%Acquired in-process research and development $397.20 $463.07 $519.27 $513.26 $523.41
% of Sales 1.90% 1.90% 1.90% 1.90% 1.90%EBIT $5,150.35 $7,916.46 $8,877.26 $8,774.53 $8,948.04
% Margin 24.64% 32.48% 32.48% 32.48% 32.48% Interest expense, net $282.11 $286.43 $290.96 $295.70 $300.67
% of Sales 1.48% 1.53% 1.58% 1.63% 1.68%Net foreign exchange (gain) loss $39.72 $46.30 $51.92 $51.32 $52.34
% of Sales 0.19% 0.19% 0.19% 0.19% 0.19%Other (income) expense, net ($22.62) ($26.37) ($29.57) ($29.23) ($29.81)
% of Sales -0.11% -0.11% -0.11% -0.11% -0.11%EBT $4,851.14 $7,610.10 $8,563.96 $8,456.74 $8,624.84
% Margin 23.21% 31.23% 31.34% 31.31% 31.31%Income tax expense $417.25 $1,674.22 $1,884.07 $1,860.48 $1,897.47
% Tax Rate 22% 22% 22% 22% 22%
Net earnings $4,433.89 $5,935.88 $6,679.89 $6,596.26 $6,727.38 % Margin 21.21% 24.36% 24.44% 24.42% 24.42%

Discounted Cash Flow Analysis
Discounted Cash Flow Analysis
2014 2015 2016 2017 2018 Terminal
Net Income $4,434 $5,936 $6,680 $6,596 $6,727
Depreciation & Amortization $1,353 $1,578 $1,769 $1,749 $1,783
CapEx ($418) ($487) ($547) ($540) ($551)
Change NWC $837 $887 $758 $32 $130
FCF $4,532 $6,139 $7,144 $7,772 $7,829 $113,115
PV FCF $4,115 $5,062 $5,349 $5,284 $4,833 $69,825
Implied Equity Value $94,467 Discount rate 10.13%
Less Debt $14,292 Terminal Value Growth Rate 3.00%
Implied Market Cap $80,175
Current Share Outstanding 1,593.50
Estimated Share Buy Back 40
Estimated Share Outstanding 1,553.5
Implied share price $51.61
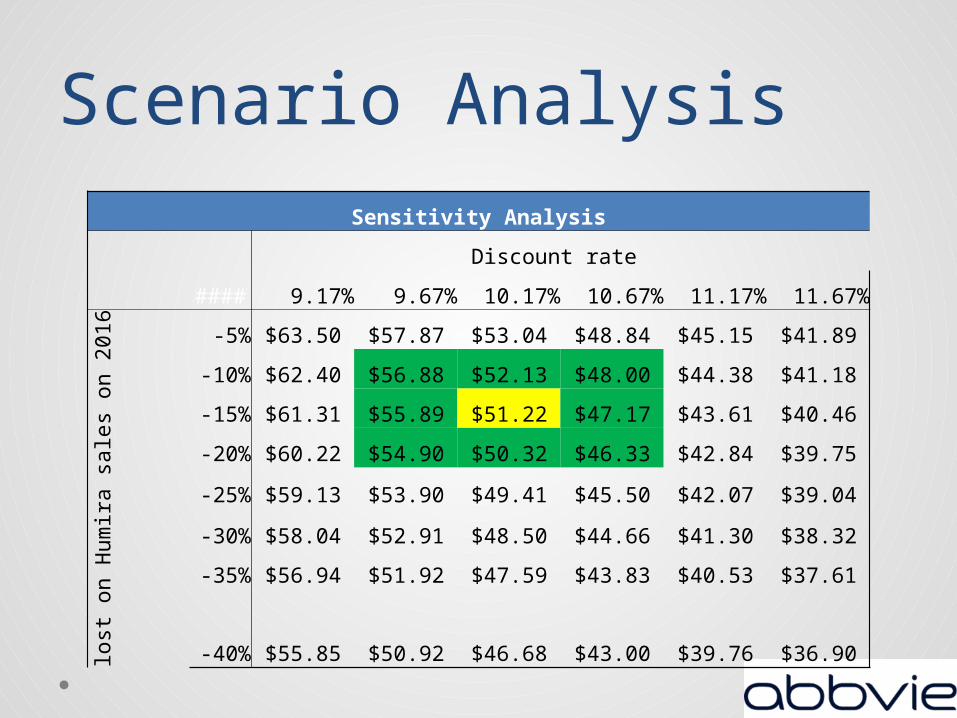
Scenario AnalysisSensitivity Analysis
Discount rate
#### 9.17% 9.67% 10.17% 10.67% 11.17% 11.67%
lost on Humira sales on
2016
-5% $63.50 $57.87 $53.04 $48.84 $45.15 $41.89
-10% $62.40 $56.88 $52.13 $48.00 $44.38 $41.18
-15% $61.31 $55.89 $51.22 $47.17 $43.61 $40.46
-20% $60.22 $54.90 $50.32 $46.33 $42.84 $39.75
-25% $59.13 $53.90 $49.41 $45.50 $42.07 $39.04
-30% $58.04 $52.91 $48.50 $44.66 $41.30 $38.32
-35% $56.94 $51.92 $47.59 $43.83 $40.53 $37.61
-40% $55.85 $50.92 $46.68 $43.00 $39.76 $36.90
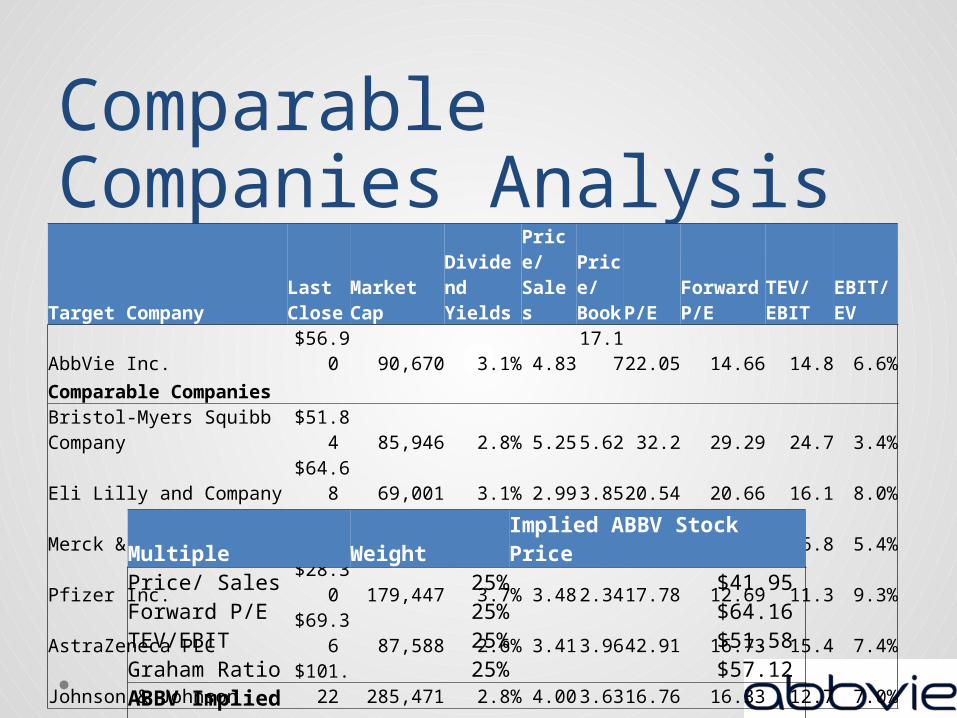
Comparable Companies Analysis
Target Company Last Close Market Cap
Dividend Yields
Price/ Sales
Price/Book P/E
Forward P/E
TEV/ EBIT EBIT/EV
AbbVie Inc. $56.90 90,670 3.1% 4.83 17.17 22.05 14.66 14.8 6.6%Comparable Companies Bristol-Myers Squibb Company $51.84 85,946 2.8% 5.25 5.62 32.2 29.29 24.7 3.4%Eli Lilly and Company $64.68 69,001 3.1% 2.99 3.85 20.54 20.66 16.1 8.0%Merck & Co. Inc. $55.51 160,124 3.3% 3.64 3.31 29.25 15.55 16.8 5.4%Pfizer Inc. $28.30 179,447 3.7% 3.48 2.34 17.78 12.69 11.3 9.3%AstraZeneca PLC $69.36 87,588 2.6% 3.41 3.96 42.91 16.73 15.4 7.4%Johnson & Johnson $101.22 285,471 2.8% 4.00 3.63 16.76 16.33 12.7 7.0%
Multiple Weight Implied ABBV Stock PricePrice/ Sales 25% $41.95 Forward P/E 25% $64.16 TEV/EBIT 25% $51.58 Graham Ratio 25% $57.12 ABBV Implied Stock Price $53.70

Decision?
HOLDValuation Summary
Weight PriceDCF 50% $ 51.61
Comparable 50% $ 53.70
$ 52.65

Main Reasoning?- Strong growth prospects with Hepatitis C drug
- Uncertainty involved with Humira patent
expiration
- Pipeline in general is strong
- Intrinsic value is less than market price
- Poor management

Questions?