abbott ireland vascular division · 4.2 solvent management plan ... abbott ireland vascular...
TRANSCRIPT
Abbott Ireland Vascular Division
IPPC Licence No. P0847-01
Annual Environmental Report 2014
Name: Abbott Ireland Vascular Division. Location address: Cashel Road, Clonmel, Tipperary. IPPCL Application Ref: Reg No: P0847-01 Environmental Contact: Nigel Hickey E-mail: [email protected]
Approver Signature Date Environmental Coordinator
Facilities & EHS Manager
Operations Director
Site Director
TABLE OF CONTENTS Executive Summary ………………………………………………………………….…1
1.0 INTRODUCTION......................................................................................................2
1.1 General ........................................................................................................2 1.2 Brief Site Description....................................................................................2 1.3 Environmental, Health and Safety Policy.....................................................3 1.4 Organisational Structure – Administration....................................................4 1.5 Organisational Structure – Environmental....................................................5
2.0 SUMMARY OF EMISSIONS 2014............................................................................6
2.1 Emissions to Air.............................................................................................6 2.2 Emissions to Sewer (Trade Effluent).............................................................8 2.3 Emissions to Surface Water..........................................................................10 2.4 Waste Management......................................................................................10 2.5 Resource Consumption................................................................................14 2.6 Environmental Incidents & Complaints.........................................................15 2.7 EPA Reportable Incidents.............................................................................15
3.0 MANAGEMENT OF ACTIVITY.................................................................................16
3.1 Environmental Management Programme (EMP).........................................16 3.2 Pollution Release and Transfer Register (PRTR)........................................16
4.0 LICENCE SPECIFIC REPORTS .............................................................................17
4.1 Environmental Noise Monitoring Report.......................................................17 4.2 Solvent Management Plan............................................................................19 4.3 Energy Efficiency Auditing ...........................................................................22 4.4 Decommissioning Management Plan (DMP) Review..................................22 4.5 Environmental Liabilities Risk Assessment (ELRA) Review........................22 4.6 Statement of Measures.................................................................................23 4.7 Testing & Inspection of Underground Tanks, Sewer pipes and Bunds........23 4.8 Waste Reduction – Prevention, Minimisation and Recycling Summary..…23 4.9 Raw Material Usage and Efficiency ………………………………………..…23 4.10 Minimisation of Water Demand and Trade Effluent………………………....23 4.11 Long Range Environmental Improvement Goals (2014-2018)………….….24 4.12 Submitted Reports 2014…………………………..........................................24
APPENDIX A – AER RETURNS WORKSHEET
5.1 RELEASES TO AIR 5.2 RELEASES TO WATER 5.3 RELEASES TO SEWER 5.4 WASTE TRANSFERS
APPENDIX B – 2014 EMP REPORT APPENDIX C – 2015 EMP PROPOSAL
31-March 2015 1 of 42 Annual Environmental Report 2014
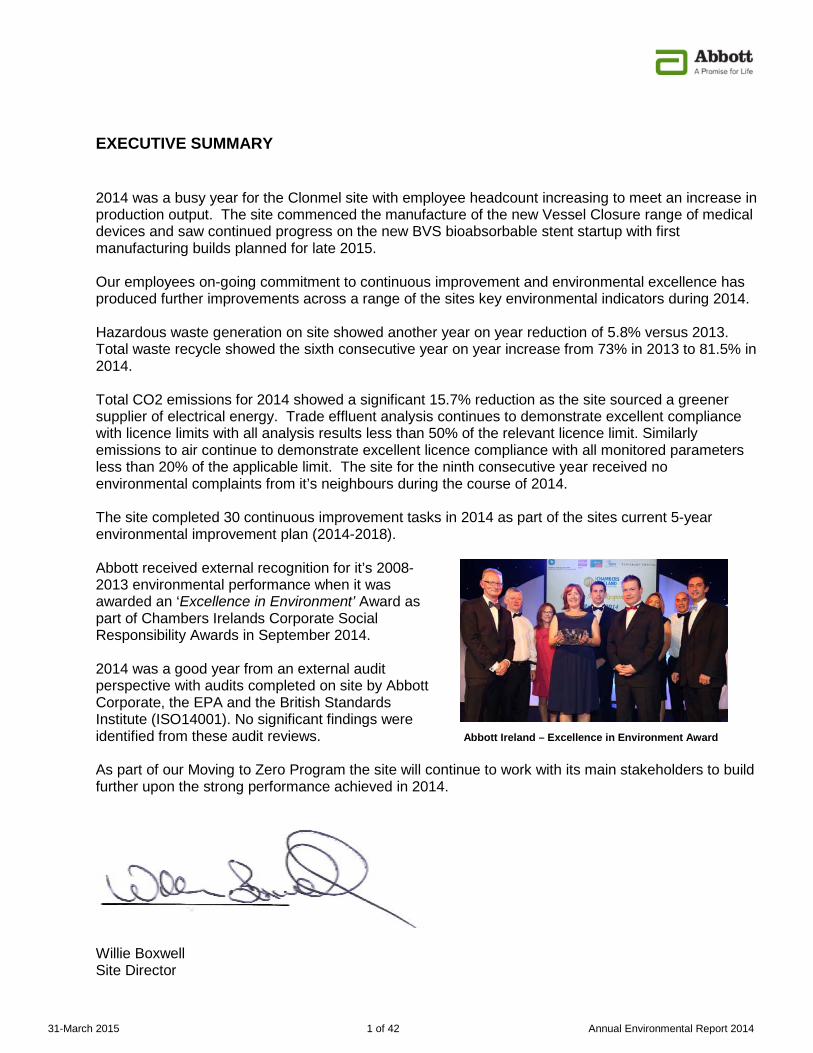
EXECUTIVE SUMMARY 2014 was a busy year for the Clonmel site with employee headcount increasing to meet an increase in production output. The site commenced the manufacture of the new Vessel Closure range of medical devices and saw continued progress on the new BVS bioabsorbable stent startup with first manufacturing builds planned for late 2015. Our employees on-going commitment to continuous improvement and environmental excellence has produced further improvements across a range of the sites key environmental indicators during 2014. Hazardous waste generation on site showed another year on year reduction of 5.8% versus 2013. Total waste recycle showed the sixth consecutive year on year increase from 73% in 2013 to 81.5% in 2014. Total CO2 emissions for 2014 showed a significant 15.7% reduction as the site sourced a greener supplier of electrical energy. Trade effluent analysis continues to demonstrate excellent compliance with licence limits with all analysis results less than 50% of the relevant licence limit. Similarly emissions to air continue to demonstrate excellent licence compliance with all monitored parameters less than 20% of the applicable limit. The site for the ninth consecutive year received no environmental complaints from it’s neighbours during the course of 2014. The site completed 30 continuous improvement tasks in 2014 as part of the sites current 5-year environmental improvement plan (2014-2018). Abbott received external recognition for it’s 2008-2013 environmental performance when it was awarded an ‘Excellence in Environment’ Award as part of Chambers Irelands Corporate Social Responsibility Awards in September 2014. 2014 was a good year from an external audit perspective with audits completed on site by Abbott Corporate, the EPA and the British Standards Institute (ISO14001). No significant findings were identified from these audit reviews. Abbott Ireland – Excellence in Environment Award As part of our Moving to Zero Program the site will continue to work with its main stakeholders to build further upon the strong performance achieved in 2014.
Willie Boxwell Site Director
31-March 2015 2 of 42 Annual Environmental Report 2014
1.0 Introduction
1.1 General
Abbott Ireland Vascular Division (Abbott), Cashel Road, Lawlesstown, Clonmel, Co. Tipperary, holds an IPPC Licence Register No. P0847-01, for “The use of coating materials in processes with a capacity to use at least 10 tonnes per year of organic solvents”. The Licence was issued by the EPA on 16th of December 2008. This Annual Environmental Report (AER) represents the fourth full AER for the Clonmel site and covers the period from January 01, 2014 to December 31, 2014. The AER has been prepared in accordance with the EPA ‘Guidance Note for Annual Environmental Report’ and other relevant updated guidance notes as provided by the EPA on the agency website (www.epa.ie).
1.2 Brief Site Description
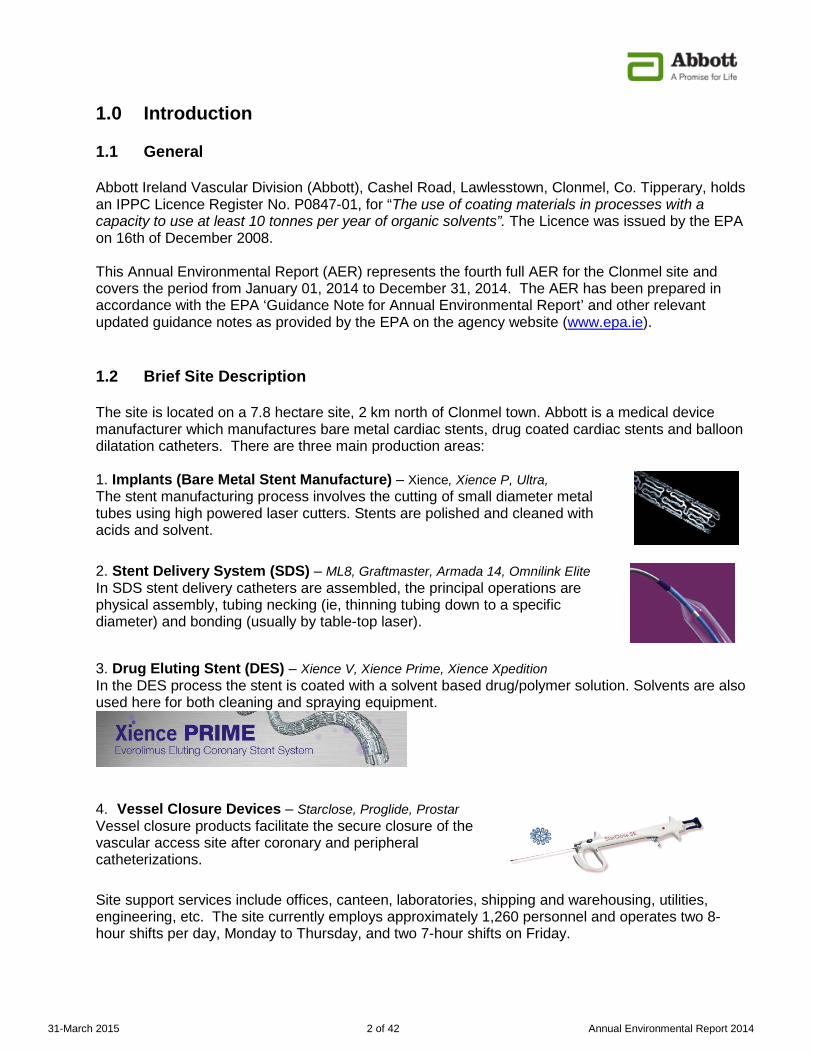
The site is located on a 7.8 hectare site, 2 km north of Clonmel town. Abbott is a medical device manufacturer which manufactures bare metal cardiac stents, drug coated cardiac stents and balloon dilatation catheters. There are three main production areas: 1. Implants (Bare Metal Stent Manufacture) – Xience, Xience P, Ultra, The stent manufacturing process involves the cutting of small diameter metal tubes using high powered laser cutters. Stents are polished and cleaned with acids and solvent.
2. Stent Delivery System (SDS) – ML8, Graftmaster, Armada 14, Omnilink Elite In SDS stent delivery catheters are assembled, the principal operations are physical assembly, tubing necking (ie, thinning tubing down to a specific diameter) and bonding (usually by table-top laser).
3. Drug Eluting Stent (DES) – Xience V, Xience Prime, Xience Xpedition
In the DES process the stent is coated with a solvent based drug/polymer solution. Solvents are also used here for both cleaning and spraying equipment.
4. Vessel Closure Devices – Starclose, Proglide, Prostar Vessel closure products facilitate the secure closure of the vascular access site after coronary and peripheral catheterizations. Site support services include offices, canteen, laboratories, shipping and warehousing, utilities, engineering, etc. The site currently employs approximately 1,260 personnel and operates two 8-hour shifts per day, Monday to Thursday, and two 7-hour shifts on Friday.
31-March 2015 3 of 42 Annual Environmental Report 2014
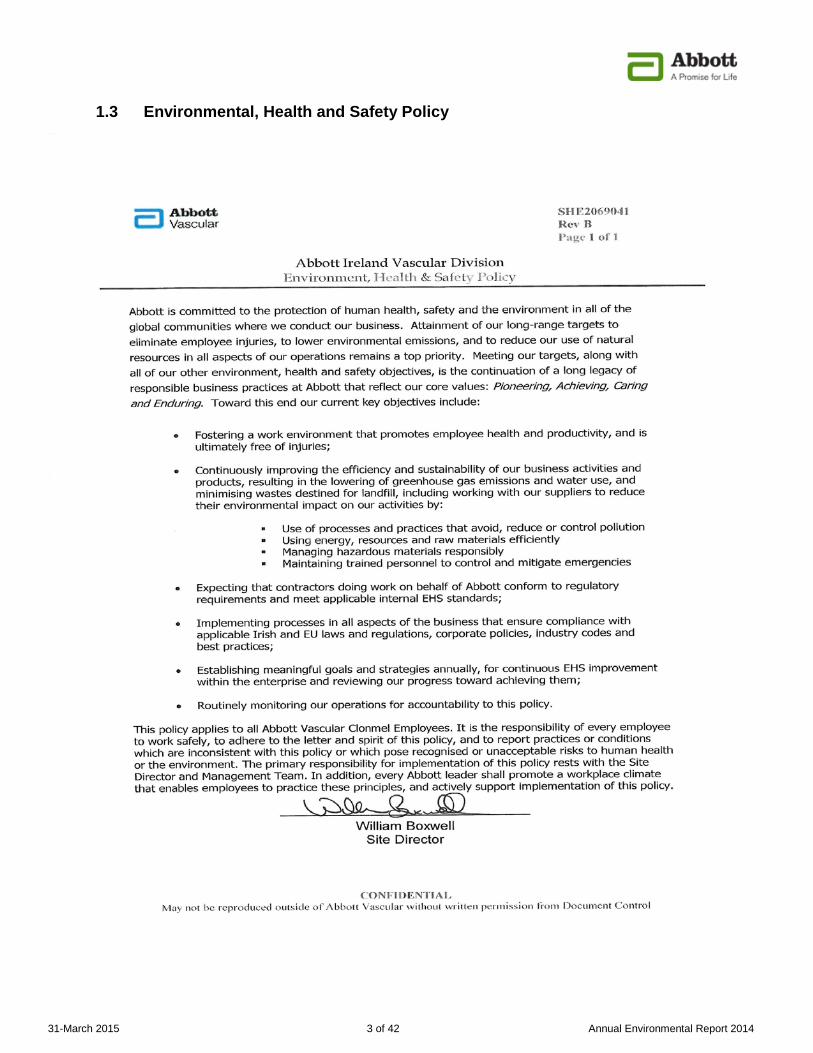
1.3 Environmental, Health and Safety Policy
31-March 2015 4 of 42 Annual Environmental Report 2014
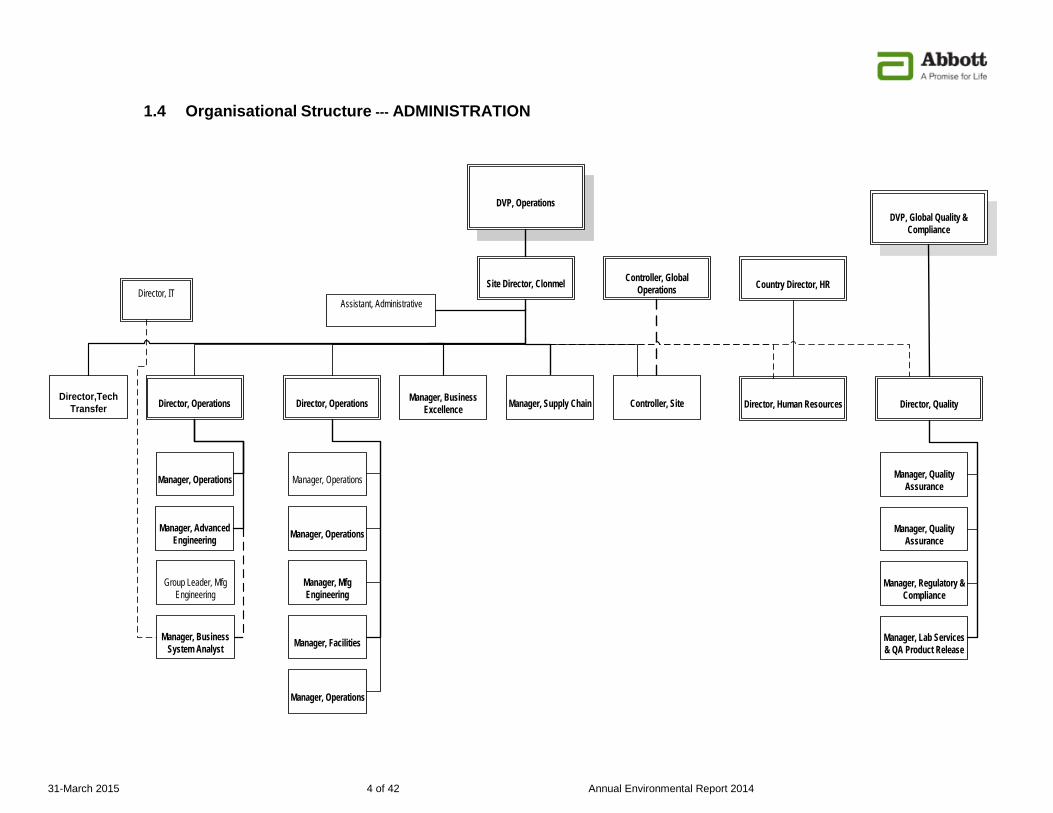
1.4 Organisational Structure --- ADMINISTRATION
Site Director, Clonmel
Director, Operations
Director, Operations
Country Director, HR
DVP, Global Quality &
Compliance
Manager, Operations
Director, Human Resources
Director, Quality
Manager, Regulatory &
Compliance
Manager, Quality
Assurance
Manager, Advanced
Engineering
Manager, Quality
Assurance
Manager, Operations
Manager, Mfg Engineering
Manager, Business
System Analyst
Manager, Supply Chain
Controller, Site
Controller, Global
Operations
DVP, Operations
Manager, Operations
Manager, Lab Services & QA Product Release
Assistant, Administrative
Manager, Facilities
Director, IT
Manager, Operations
Manager, Business
Excellence
Director,Tech
Transfer
Group Leader, Mfg
Engineering
31-March 2015 5 of 42 Annual Environmental Report 2014
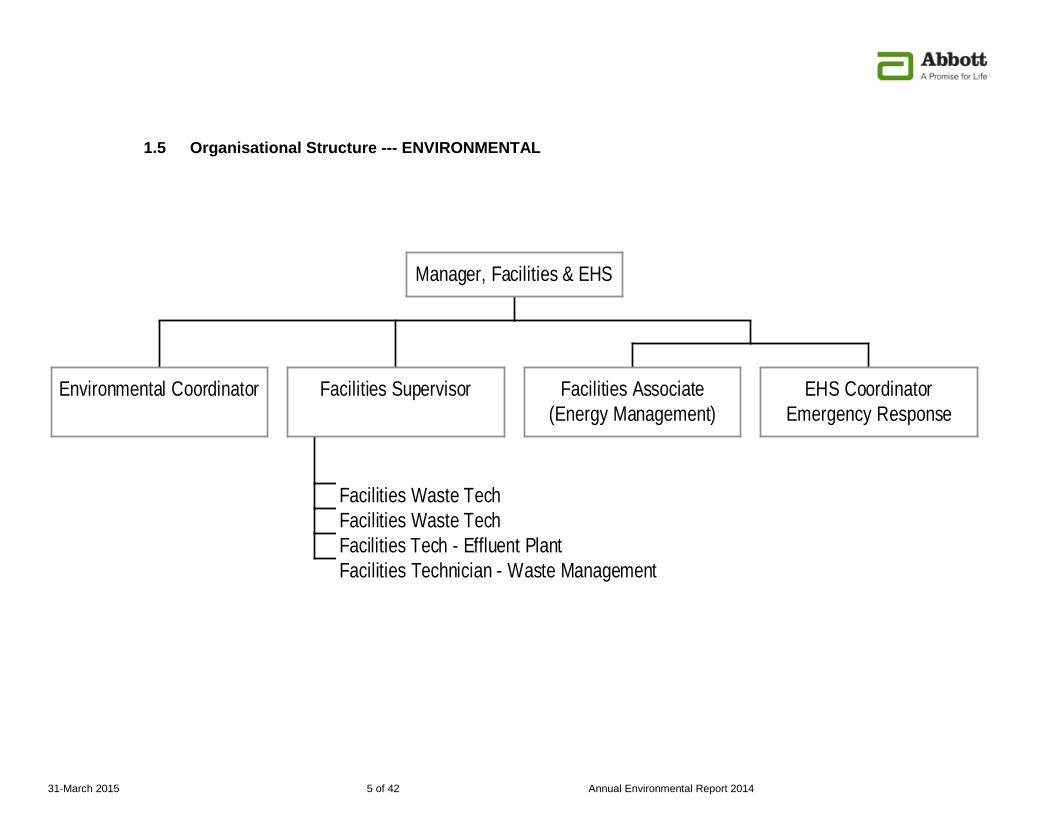
1.5 Organisational Structure --- ENVIRONMENTAL
Environmental Coordinator
Facilities Waste TechFacilities Waste TechFacilities Tech - Effluent PlantFacilities Technician - Waste Management
Facilities Supervisor Facilities Associate(Energy Management)
EHS CoordinatorEmergency Response
Manager, Facilities & EHS
31-March 2015 6 of 42 Annual Environmental Report 2014
2.0 Summary of Emissions 2014 2.1 Emissions to Air
2.1.1 Emissions to Air Overview
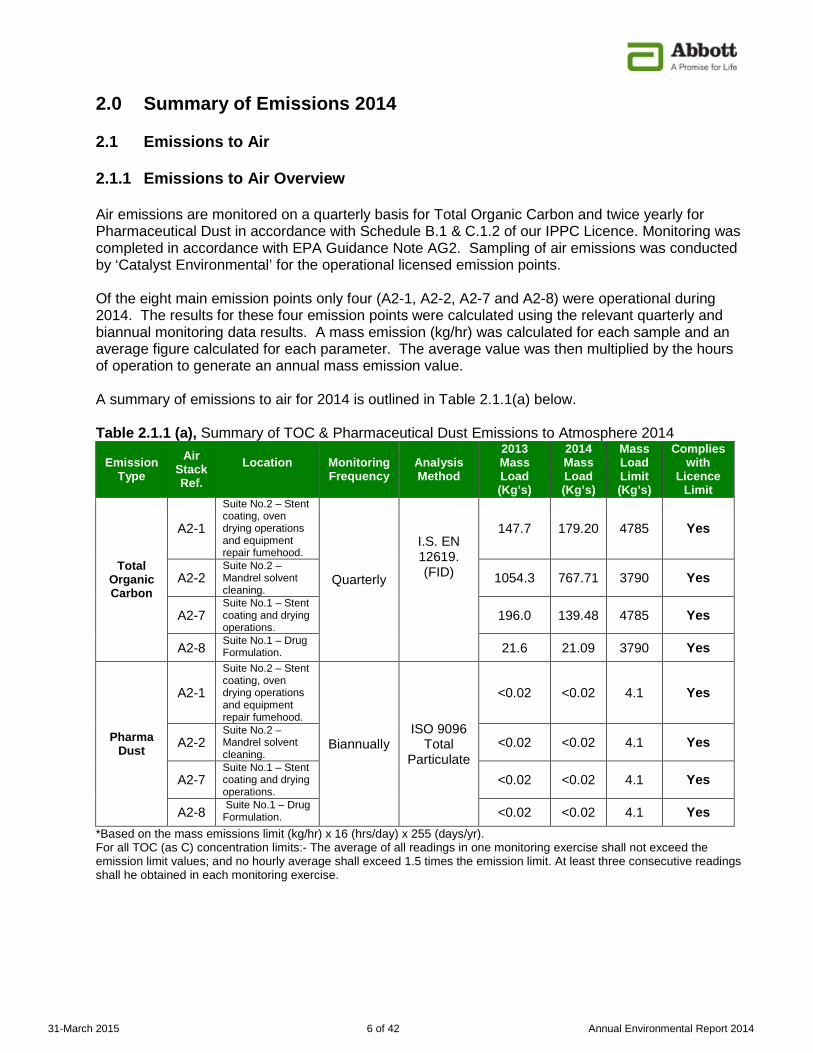
Air emissions are monitored on a quarterly basis for Total Organic Carbon and twice yearly for Pharmaceutical Dust in accordance with Schedule B.1 & C.1.2 of our IPPC Licence. Monitoring was completed in accordance with EPA Guidance Note AG2. Sampling of air emissions was conducted by ‘Catalyst Environmental’ for the operational licensed emission points. Of the eight main emission points only four (A2-1, A2-2, A2-7 and A2-8) were operational during 2014. The results for these four emission points were calculated using the relevant quarterly and biannual monitoring data results. A mass emission (kg/hr) was calculated for each sample and an average figure calculated for each parameter. The average value was then multiplied by the hours of operation to generate an annual mass emission value. A summary of emissions to air for 2014 is outlined in Table 2.1.1(a) below.
Table 2.1.1 (a), Summary of TOC & Pharmaceutical Dust Emissions to Atmosphere 2014
Emission Type
Air Stack Ref.
Location Monitoring
Frequency
Analysis Method
2013 Mass Load (Kg’s)
2014 Mass Load (Kg’s)
Mass Load Limit (Kg’s)
Complieswith
Licence Limit
Total Organic Carbon
A2-1
Suite No.2 – Stent coating, oven drying operations and equipment repair fumehood.
Quarterly
I.S. EN 12619. (FID)
147.7 179.20 4785 Yes
A2-2 Suite No.2 – Mandrel solvent cleaning.
1054.3 767.71 3790 Yes
A2-7 Suite No.1 – Stent coating and drying operations.
196.0 139.48 4785 Yes
A2-8 Suite No.1 – Drug Formulation. 21.6 21.09 3790 Yes
Pharma Dust
A2-1
Suite No.2 – Stent coating, oven drying operations and equipment repair fumehood.
Biannually ISO 9096
Total Particulate
<0.02 <0.02 4.1 Yes
A2-2 Suite No.2 – Mandrel solvent cleaning.
<0.02 <0.02 4.1 Yes
A2-7 Suite No.1 – Stent coating and drying operations.
<0.02 <0.02 4.1 Yes
A2-8 Suite No.1 – Drug Formulation. <0.02 <0.02 4.1 Yes
*Based on the mass emissions limit (kg/hr) x 16 (hrs/day) x 255 (days/yr). For all TOC (as C) concentration limits:- The average of all readings in one monitoring exercise shall not exceed the emission limit values; and no hourly average shall exceed 1.5 times the emission limit. At least three consecutive readings shall he obtained in each monitoring exercise.
31-March 2015 7 of 42 Annual Environmental Report 2014
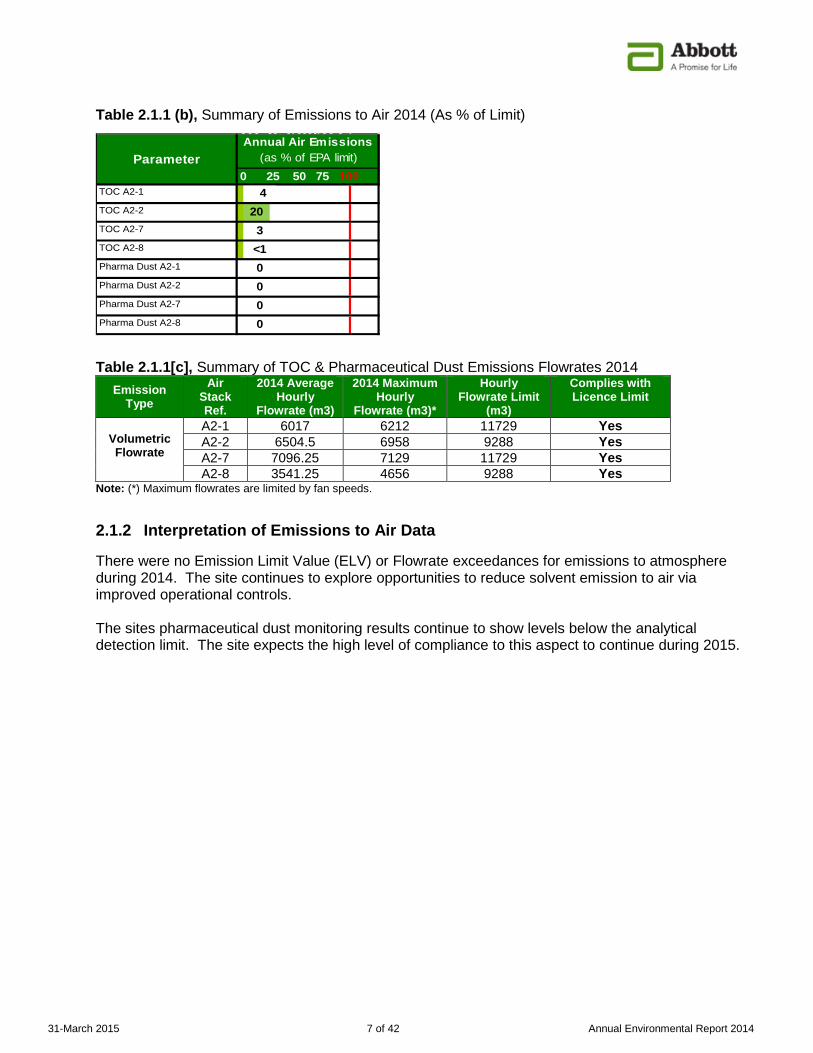
Table 2.1.1 (b), Summary of Emissions to Air 2014 (As % of Limit) Table 2.1.1[c], Summary of TOC & Pharmaceutical Dust Emissions Flowrates 2014
Emission Type
Air Stack Ref.
2014 Average Hourly
Flowrate (m3)
2014 Maximum Hourly
Flowrate (m3)*
Hourly Flowrate Limit
(m3)
Complies with Licence Limit
Volumetric Flowrate
A2-1 6017 6212 11729 Yes A2-2 6504.5 6958 9288 Yes A2-7 7096.25 7129 11729 Yes A2-8 3541.25 4656 9288 Yes
Note: (*) Maximum flowrates are limited by fan speeds.
2.1.2 Interpretation of Emissions to Air Data
There were no Emission Limit Value (ELV) or Flowrate exceedances for emissions to atmosphere during 2014. The site continues to explore opportunities to reduce solvent emission to air via improved operational controls. The sites pharmaceutical dust monitoring results continue to show levels below the analytical detection limit. The site expects the high level of compliance to this aspect to continue during 2015.
TOC A2-1
TOC A2-2
TOC A2-7
TOC A2-8
Pharma Dust A2-1
Pharma Dust A2-2
Pharma Dust A2-7
Pharma Dust A2-8
204
00
0 25 50 75 100
00
Parameter
3<1
Annual Air Emissions (as % of EPA limit)

31-March 2015 8 of 42 Annual Environmental Report 2014
2.2 Emissions to Sewer (Trade Effluent Discharges)
2.2.1 Emissions to Sewer Overview
A summary of trade effluent emissions to sewer for 2014 are shown in Table 2.2(a) below. Table 2.2.1(a), Summary of Emissions to Sewer 2014
Ref Parameter
Sampling Frequency
Analysis Method
Mass Emissions (Kg’s) 2013
Mass Emissions (Kg’s) 2014
Licensed Mass Emission Limit
(Kg’s)*
Complies with
Licence
SE-1
Volume Daily 15428 m3 17569 m3 73,000 m3 Yes
Temperature Continuous 11.85°C
(Max) 11.78°C (Max) 35°C Yes
pH Continuous Min: 6.49
Max: 9.25 Min: 6.88 Max: 9.03 5-10 Yes
BOD Quarterly G/04 APHA
2005, Method 5210B
767.5 1133.2 29,200 Yes
COD Quarterly G/03 APHA
2005 Method 5220D
2155 3730.3 45,625 Yes
Suspended Solids Quarterly
G/19 APHA 2005, Method
2540B 1627 4206.7 29,200 Yes
Orthophosphate Quarterly G/67 APHA 2005, 4500-
PE 23.3 8.3 730 Yes
Oils, Fats & Grease Quarterly
G/032 APHA Method 5520B
125.8 301.2 2,738 Yes
Sulphate Quarterly
G/67 Konelab
1131.6 642.9 3,650 Yes
Table 2.2.1(a), Summary of Emissions to Sewer 2014 (Contd.)
Ref Parameter
Sampling Frequency
Analysis Method
Mass Emissions (Kg’s) 2013
Mass Emissions (Kg’s) 2014
Licensed Mass Emission Limit
(Kg’s)*
Complies with
Licence
SE-1
Total Heavy Metals Annual
USEPA 200.8
7.31 7.6 N/A Yes
Acetone Annual G/14 Based
on ASTM Method D3695
97.2 0.5 N/A Yes IPA Annual 32.4 <L.O.D N/A Yes Other Organics** Annual <L.O.D <L.O.D N/A Yes
Table Notes: *Based on 365 days/year, i.e., kg/day Emissions Limit Values x 365. ** Results for other Organic Compounds (other than Acetone and IPA) were below their respective limits of detection (LOD) – this includes DCM, Heptane, Cyclohexanone, Methanol and Acetonitrile. N/A – Not Applicable. <LOD – Less than the level of detection. The above results are based upon average composite sample monitoring data for each parameter. The average figures were multiplied by the total annual flow to calculate the mass emissions for 2014. Sampling was conducted by ANUA (Bord Na Mona) in accordance with Schedule B.3 & C.3.2 of the Licence for the sites licensed emission point, SE-1.
31-March 2015 9 of 42 Annual Environmental Report 2014
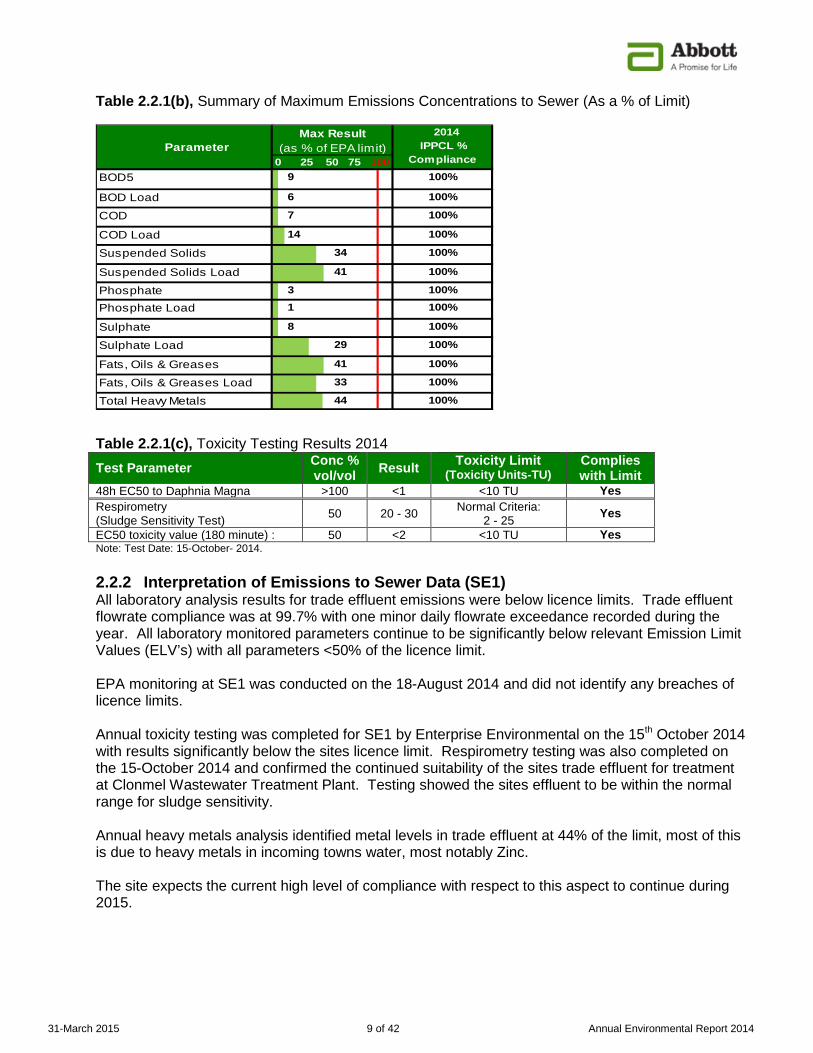
Table 2.2.1(b), Summary of Maximum Emissions Concentrations to Sewer (As a % of Limit) Table 2.2.1(c), Toxicity Testing Results 2014 Test Parameter Conc %
vol/vol Result Toxicity Limit (Toxicity Units-TU)
Complies with Limit
48h EC50 to Daphnia Magna >100 <1 <10 TU Yes Respirometry (Sludge Sensitivity Test) 50 20 - 30 Normal Criteria:
2 - 25 Yes
EC50 toxicity value (180 minute) : 50 <2 <10 TU Yes Note: Test Date: 15-October- 2014. 2.2.2 Interpretation of Emissions to Sewer Data (SE1) All laboratory analysis results for trade effluent emissions were below licence limits. Trade effluent flowrate compliance was at 99.7% with one minor daily flowrate exceedance recorded during the year. All laboratory monitored parameters continue to be significantly below relevant Emission Limit Values (ELV’s) with all parameters <50% of the licence limit. EPA monitoring at SE1 was conducted on the 18-August 2014 and did not identify any breaches of licence limits. Annual toxicity testing was completed for SE1 by Enterprise Environmental on the 15th October 2014 with results significantly below the sites licence limit. Respirometry testing was also completed on the 15-October 2014 and confirmed the continued suitability of the sites trade effluent for treatment at Clonmel Wastewater Treatment Plant. Testing showed the sites effluent to be within the normal range for sludge sensitivity. Annual heavy metals analysis identified metal levels in trade effluent at 44% of the limit, most of this is due to heavy metals in incoming towns water, most notably Zinc. The site expects the current high level of compliance with respect to this aspect to continue during 2015.
BOD5 100%
BOD Load 100%
COD 100%
COD Load 100%
Suspended Solids 100%
Suspended Solids Load 100%
Phosphate 100%
Phosphate Load 100%
Sulphate 100%
Sulphate Load 100%
Fats, Oils & Greases 100%
Fats, Oils & Greases Load 100%
Total Heavy Metals 100%
1
2014 IPPCL %
Compliance0 25 50 75 100
Max Result (as % of EPA limit) Parameter
6
7
9
8
41
33
29
3
44
14
34
41
31-March 2015 10 of 42 Annual Environmental Report 2014
2.3 Emissions to Surface Water
2.3.1 Emissions to Surface Water Overview
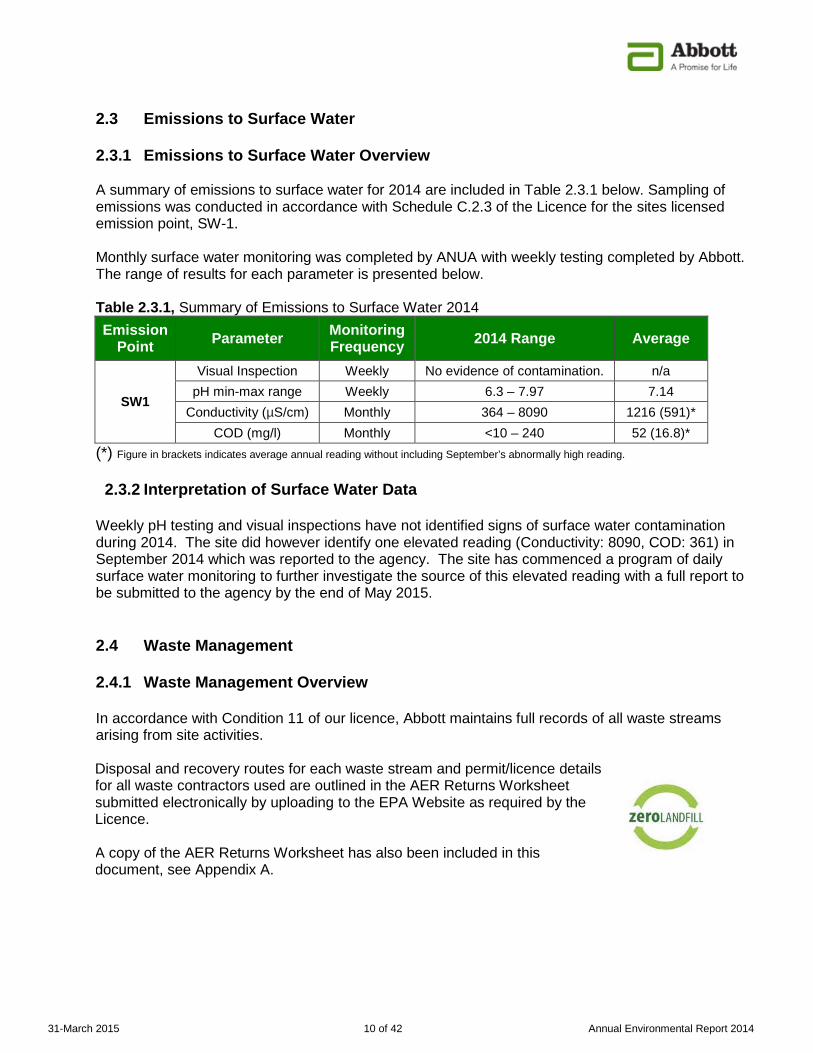
A summary of emissions to surface water for 2014 are included in Table 2.3.1 below. Sampling of emissions was conducted in accordance with Schedule C.2.3 of the Licence for the sites licensed emission point, SW-1. Monthly surface water monitoring was completed by ANUA with weekly testing completed by Abbott. The range of results for each parameter is presented below. Table 2.3.1, Summary of Emissions to Surface Water 2014 Emission
Point Parameter Monitoring Frequency 2014 Range Average
SW1
Visual Inspection Weekly No evidence of contamination. n/a pH min-max range Weekly 6.3 – 7.97 7.14
Conductivity (µS/cm) Monthly 364 – 8090 1216 (591)* COD (mg/l) Monthly <10 – 240 52 (16.8)*
(*) Figure in brackets indicates average annual reading without including September’s abnormally high reading. 2.3.2 Interpretation of Surface Water Data Weekly pH testing and visual inspections have not identified signs of surface water contamination during 2014. The site did however identify one elevated reading (Conductivity: 8090, COD: 361) in September 2014 which was reported to the agency. The site has commenced a program of daily surface water monitoring to further investigate the source of this elevated reading with a full report to be submitted to the agency by the end of May 2015. 2.4 Waste Management
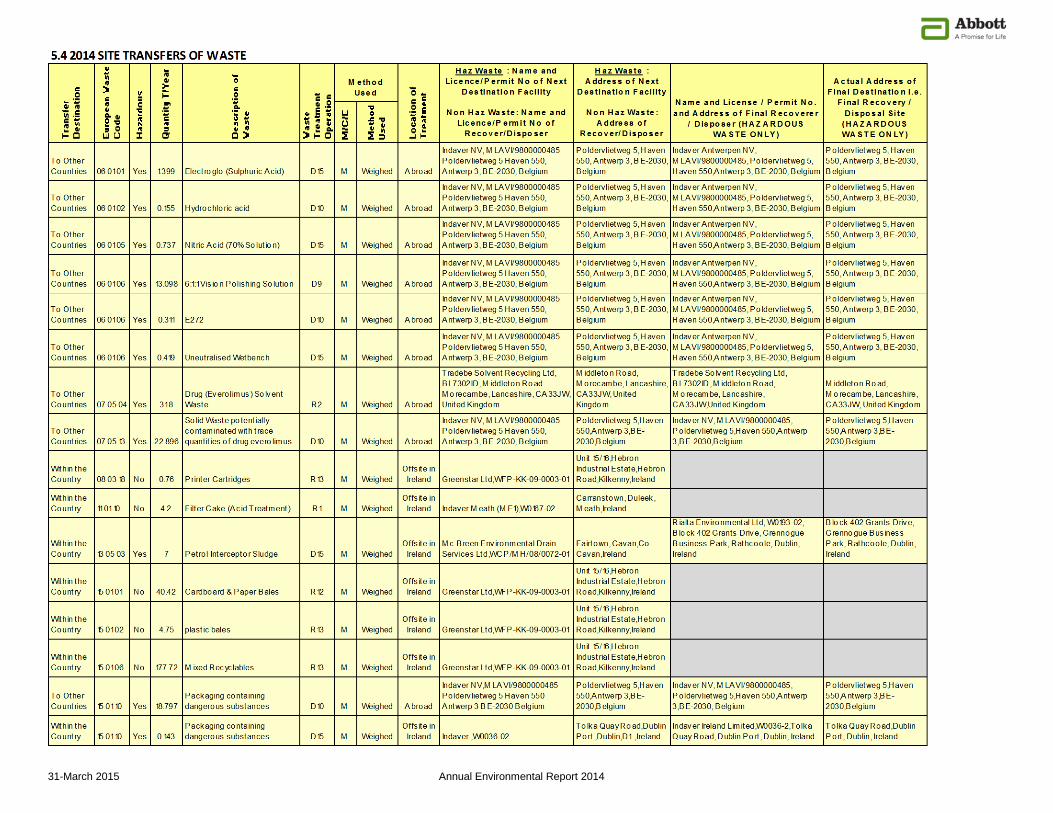
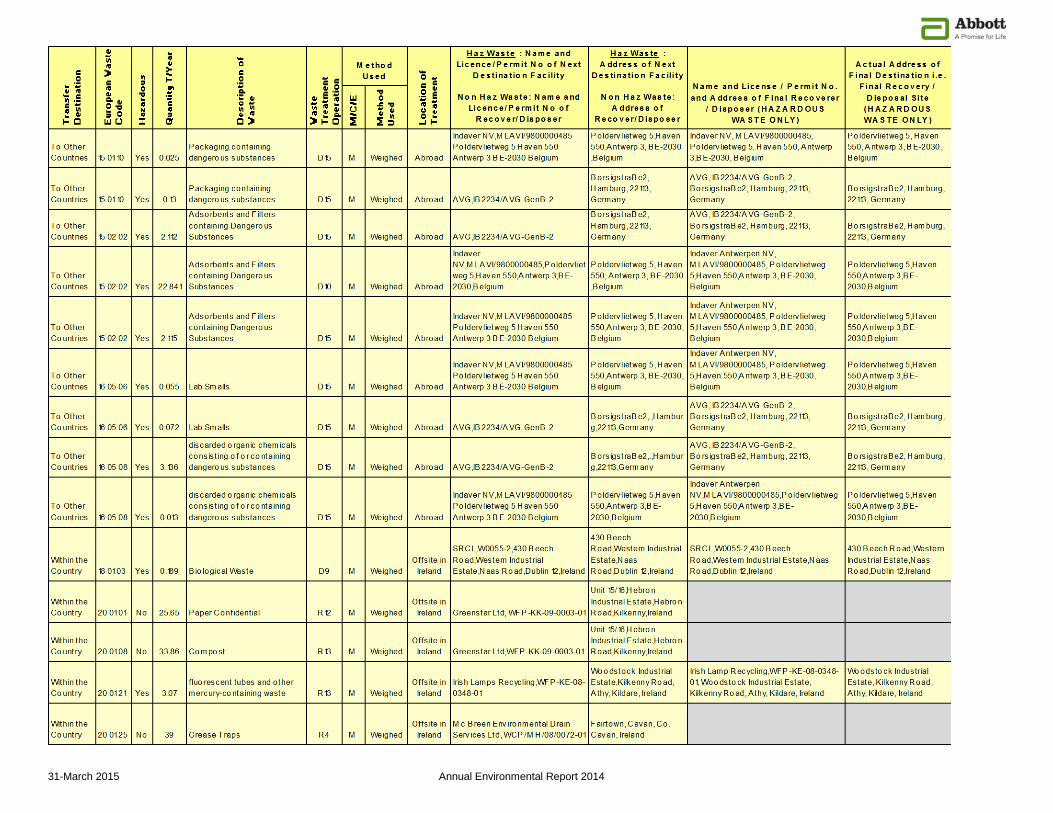
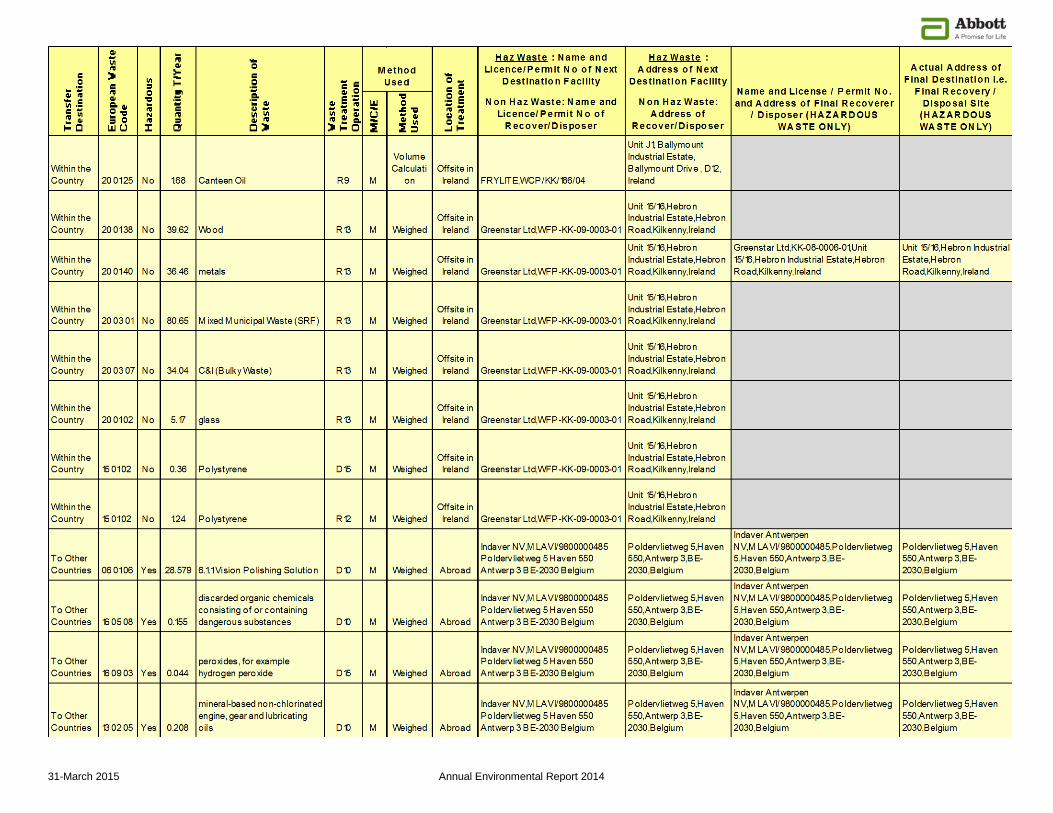
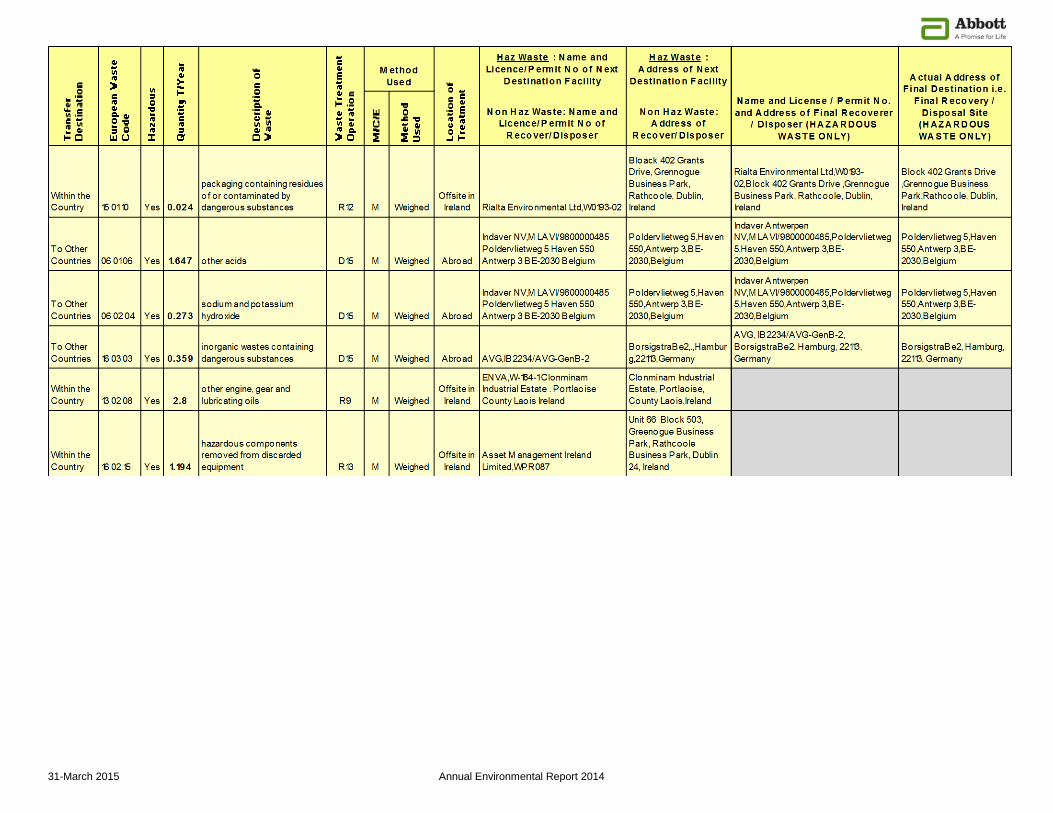
2.4.1 Waste Management Overview In accordance with Condition 11 of our licence, Abbott maintains full records of all waste streams arising from site activities. Disposal and recovery routes for each waste stream and permit/licence details for all waste contractors used are outlined in the AER Returns Worksheet submitted electronically by uploading to the EPA Website as required by the Licence. A copy of the AER Returns Worksheet has also been included in this document, see Appendix A.

31-March 2015 11 of 42 Annual Environmental Report 2014
Table 2.4.1 (a), Summary of Waste Arisings 2014
Table 2.4.1 (b), Summary of Non-Hazardous Waste 2014
Waste 2013 (Tonnes) 2014 (Tonnes) Total Waste Quantity 683.99 682.125
Total waste disposed 185.19 126.025
Total waste recycled 498.8 556.1
Total Waste Recycling % 73% 81.5%
Non-Hazardous Waste Total 511.51 520.01
Non-hazardous disposed 49.28 0
Non-hazardous recycled 462.23 520.01
Non-Hazardous Waste Recycling % 90.4% 100%
Hazardous Waste Total 172.48 162.115
Hazardous disposed 135.86 126.025
Hazardous recycled 36.62 36.09
Hazardous Waste Recycling % 21.24% 22.26%
Waste Type EWC Code 2014 (Tonnes) Toners 080318 0.76
Filter Cake (Non-Haz) 110110 4.2
Cardboard 150101 40.42
Plastic 150102 4.75
Mixed Recycle 150106 177.72
Confidential Paper 200101 25.65
Compost 200108 33.86
Greasetrap Waste 200125 39.0
Canteen Oil 200125 2.88
Wood 200138 39.62
Metals 200140 36.46
MSW Waste (SRF) 200301 80.65
C&I 200307 34.04 2014 Non-Hazardous Waste Total: 520.01
31-March 2015 12 of 42 Annual Environmental Report 2014
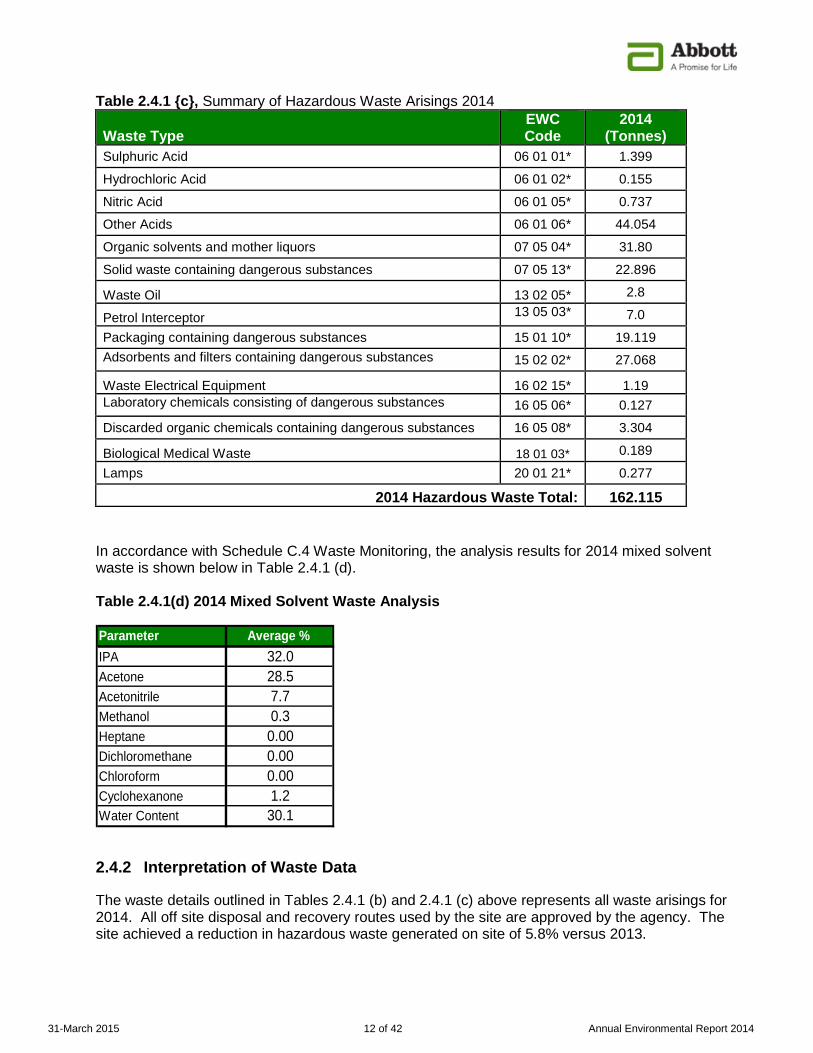
Table 2.4.1 {c}, Summary of Hazardous Waste Arisings 2014
Waste Type EWC Code
2014 (Tonnes)
Sulphuric Acid 06 01 01* 1.399
Hydrochloric Acid 06 01 02* 0.155
Nitric Acid 06 01 05* 0.737
Other Acids 06 01 06* 44.054
Organic solvents and mother liquors 07 05 04* 31.80
Solid waste containing dangerous substances 07 05 13* 22.896
Waste Oil 13 02 05* 2.8
Petrol Interceptor 13 05 03*
7.0
Packaging containing dangerous substances 15 01 10* 19.119 Adsorbents and filters containing dangerous substances
15 02 02* 27.068
Waste Electrical Equipment 16 02 15* 1.19 Laboratory chemicals consisting of dangerous substances
16 05 06* 0.127
Discarded organic chemicals containing dangerous substances 16 05 08* 3.304
Biological Medical Waste 18 01 03* 0.189
Lamps 20 01 21* 0.277
2014 Hazardous Waste Total: 162.115 In accordance with Schedule C.4 Waste Monitoring, the analysis results for 2014 mixed solvent waste is shown below in Table 2.4.1 (d). Table 2.4.1(d) 2014 Mixed Solvent Waste Analysis Parameter Average % IPA 32.0Acetone 28.5Acetonitrile 7.7Methanol 0.3Heptane 0.00Dichloromethane 0.00Chloroform 0.00Cyclohexanone 1.2Water Content 30.1 2.4.2 Interpretation of Waste Data The waste details outlined in Tables 2.4.1 (b) and 2.4.1 (c) above represents all waste arisings for 2014. All off site disposal and recovery routes used by the site are approved by the agency. The site achieved a reduction in hazardous waste generated on site of 5.8% versus 2013.
31-March 2015 13 of 42 Annual Environmental Report 2014
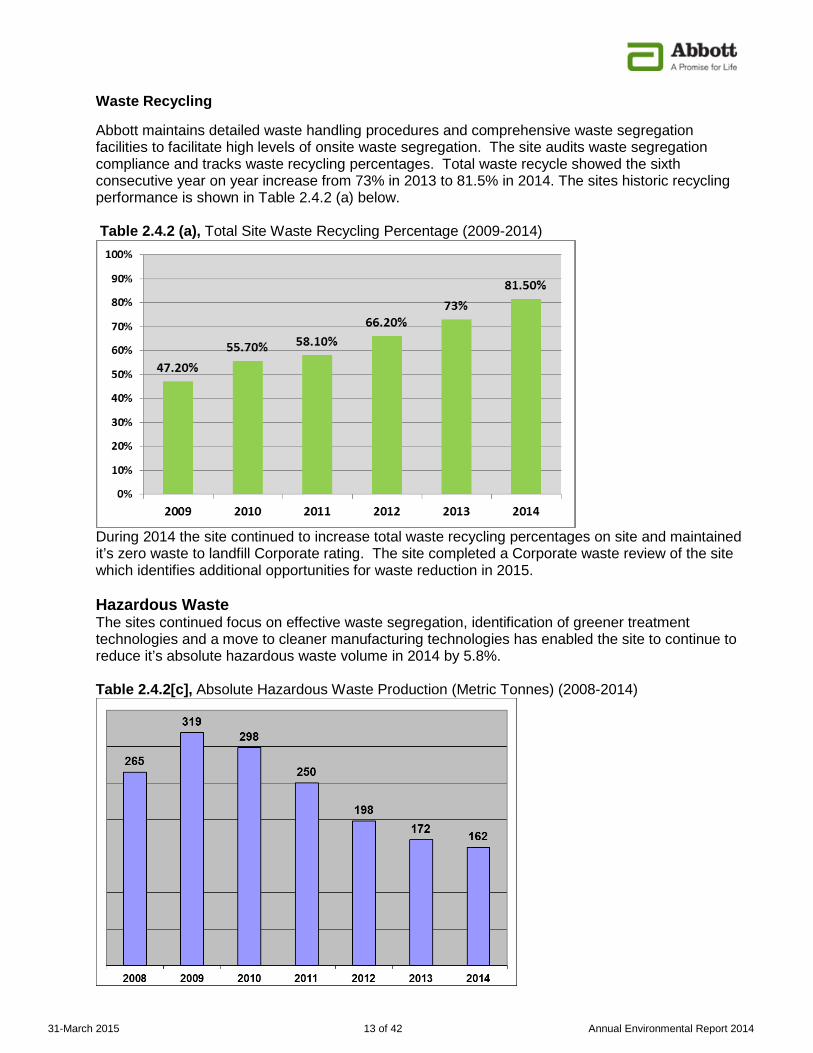
Waste Recycling Abbott maintains detailed waste handling procedures and comprehensive waste segregation facilities to facilitate high levels of onsite waste segregation. The site audits waste segregation compliance and tracks waste recycling percentages. Total waste recycle showed the sixth consecutive year on year increase from 73% in 2013 to 81.5% in 2014. The sites historic recycling performance is shown in Table 2.4.2 (a) below.
Table 2.4.2 (a), Total Site Waste Recycling Percentage (2009-2014)
During 2014 the site continued to increase total waste recycling percentages on site and maintained it’s zero waste to landfill Corporate rating. The site completed a Corporate waste review of the site which identifies additional opportunities for waste reduction in 2015. Hazardous Waste The sites continued focus on effective waste segregation, identification of greener treatment technologies and a move to cleaner manufacturing technologies has enabled the site to continue to reduce it’s absolute hazardous waste volume in 2014 by 5.8%. Table 2.4.2[c], Absolute Hazardous Waste Production (Metric Tonnes) (2008-2014)
31-March 2015 14 of 42 Annual Environmental Report 2014
2.5 Resource Consumption
A summary of site energy and water consumption for 2014 is presented below. Energy Consumption & CO2 Emissions
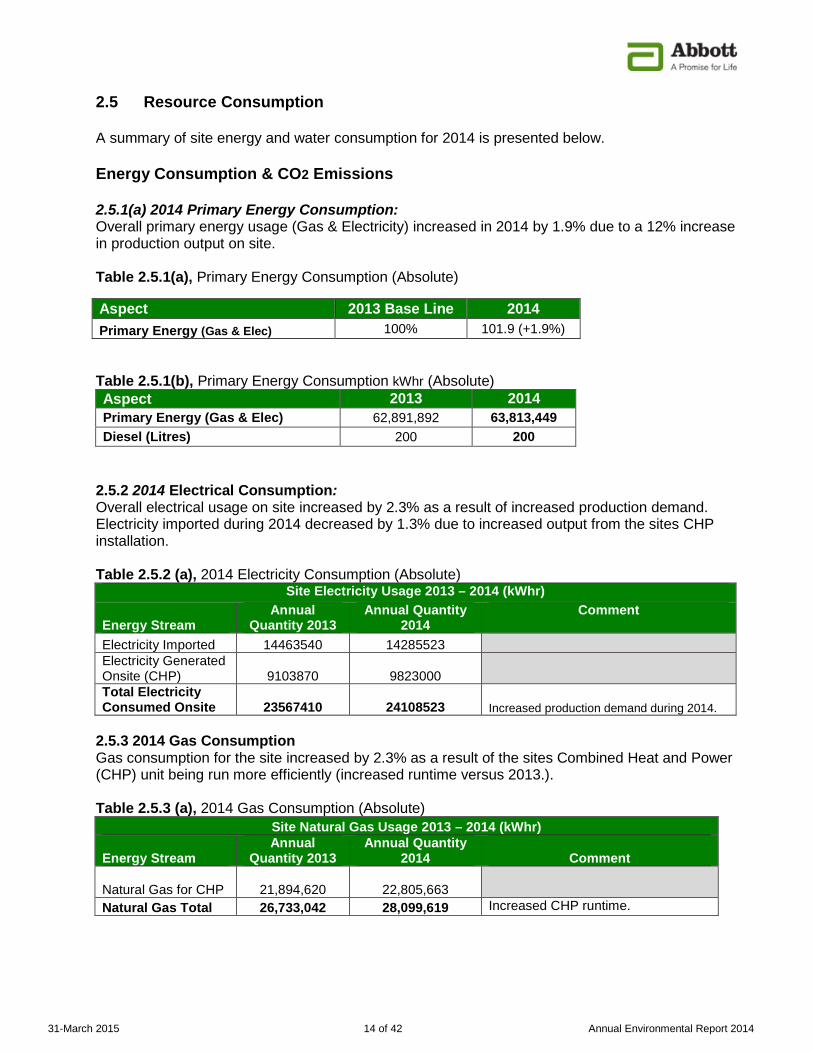
2.5.1(a) 2014 Primary Energy Consumption: Overall primary energy usage (Gas & Electricity) increased in 2014 by 1.9% due to a 12% increase in production output on site. Table 2.5.1(a), Primary Energy Consumption (Absolute) Table 2.5.1(b), Primary Energy Consumption kWhr (Absolute) Aspect 2013 2014 Primary Energy (Gas & Elec) 62,891,892 63,813,449 Diesel (Litres) 200 200
2.5.2 2014 Electrical Consumption: Overall electrical usage on site increased by 2.3% as a result of increased production demand. Electricity imported during 2014 decreased by 1.3% due to increased output from the sites CHP installation. Table 2.5.2 (a), 2014 Electricity Consumption (Absolute)
Site Electricity Usage 2013 – 2014 (kWhr)
Energy Stream Annual
Quantity 2013 Annual Quantity
2014 Comment
Electricity Imported 14463540 14285523
Electricity Generated Onsite (CHP) 9103870 9823000
Total Electricity Consumed Onsite 23567410 24108523 Increased production demand during 2014.
2.5.3 2014 Gas Consumption Gas consumption for the site increased by 2.3% as a result of the sites Combined Heat and Power (CHP) unit being run more efficiently (increased runtime versus 2013.). Table 2.5.3 (a), 2014 Gas Consumption (Absolute)
Site Natural Gas Usage 2013 – 2014 (kWhr)
Energy Stream Annual
Quantity 2013 Annual Quantity
2014
Comment
Natural Gas for CHP 21,894,620 22,805,663
Natural Gas Total 26,733,042 28,099,619 Increased CHP runtime.
Aspect 2013 Base Line 2014 Primary Energy (Gas & Elec) 100% 101.9 (+1.9%)
31-March 2015 15 of 42 Annual Environmental Report 2014
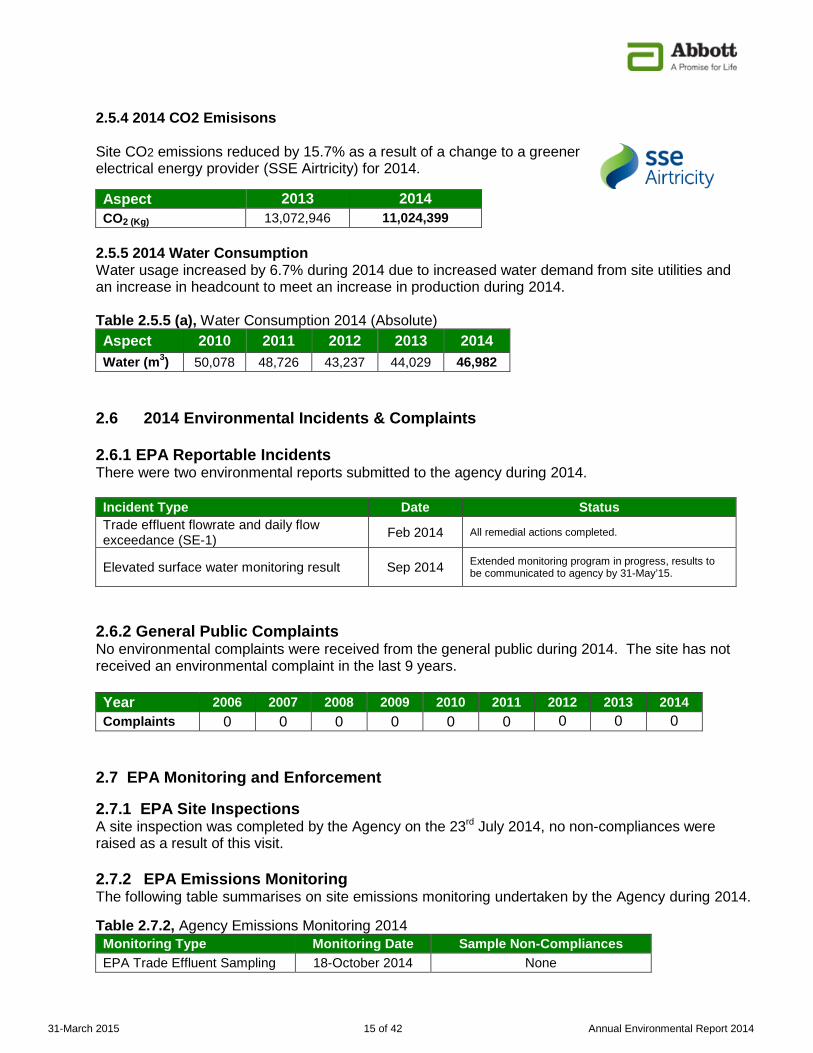
2.5.4 2014 CO2 Emisisons Site CO2 emissions reduced by 15.7% as a result of a change to a greener electrical energy provider (SSE Airtricity) for 2014.
Aspect 2013 2014 CO2 (Kg) 13,072,946 11,024,399
2.5.5 2014 Water Consumption Water usage increased by 6.7% during 2014 due to increased water demand from site utilities and an increase in headcount to meet an increase in production during 2014. Table 2.5.5 (a), Water Consumption 2014 (Absolute) Aspect 2010 2011 2012 2013 2014 Water (m3) 50,078 48,726 43,237 44,029 46,982
2.6 2014 Environmental Incidents & Complaints
2.6.1 EPA Reportable Incidents There were two environmental reports submitted to the agency during 2014. Incident Type Date Status Trade effluent flowrate and daily flow exceedance (SE-1) Feb 2014 All remedial actions completed.
Elevated surface water monitoring result Sep 2014 Extended monitoring program in progress, results to be communicated to agency by 31-May’15.
2.6.2 General Public Complaints No environmental complaints were received from the general public during 2014. The site has not received an environmental complaint in the last 9 years.
Year 2006 2007 2008 2009 2010 2011 2012 2013 2014 Complaints 0 0 0 0 0 0 0 0 0
2.7 EPA Monitoring and Enforcement
2.7.1 EPA Site Inspections A site inspection was completed by the Agency on the 23rd July 2014, no non-compliances were raised as a result of this visit. 2.7.2 EPA Emissions Monitoring The following table summarises on site emissions monitoring undertaken by the Agency during 2014.
Table 2.7.2, Agency Emissions Monitoring 2014 Monitoring Type Monitoring Date Sample Non-Compliances EPA Trade Effluent Sampling 18-October 2014 None
31-March 2015 16 of 42 Annual Environmental Report 2014
3.0 Management of the Activity
3.1 Environmental Management Programme (EMP)
3.1.1 2014 EMP Report The site completed 30 of the 33 individual tasks outlined in it’s 2014 Environmental Management Program with the 3 remaining tasks to be completed as part of the 2015 EMP program. Full 2014 program details are provided in Appendix B. 3.1.2 2015 EMP Proposal Abbott’s 2015 Draft Environmental Management Program has been prepared and is included in this document (Appendix C) for the Agencies review and approval.
3.2 Pollution Release and Transfer Register (PRTR)
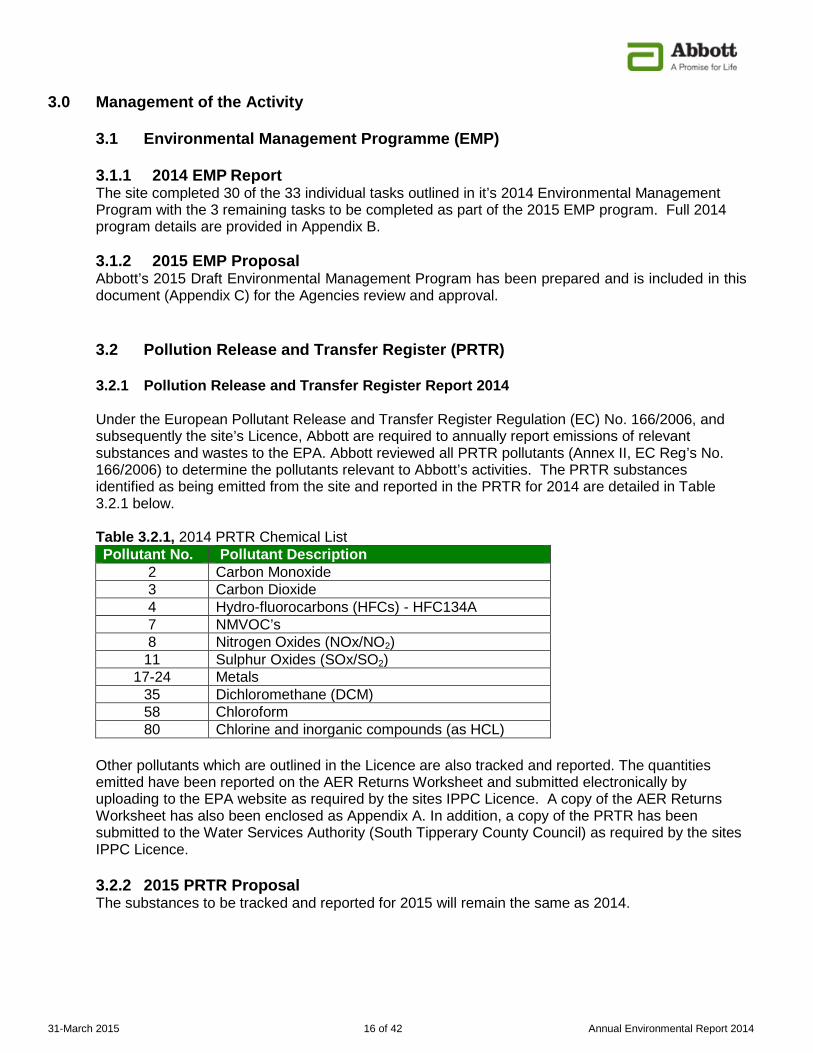
3.2.1 Pollution Release and Transfer Register Report 2014 Under the European Pollutant Release and Transfer Register Regulation (EC) No. 166/2006, and subsequently the site’s Licence, Abbott are required to annually report emissions of relevant substances and wastes to the EPA. Abbott reviewed all PRTR pollutants (Annex II, EC Reg’s No. 166/2006) to determine the pollutants relevant to Abbott’s activities. The PRTR substances identified as being emitted from the site and reported in the PRTR for 2014 are detailed in Table 3.2.1 below. Table 3.2.1, 2014 PRTR Chemical List Pollutant No. Pollutant Description
2 Carbon Monoxide 3 Carbon Dioxide 4 Hydro-fluorocarbons (HFCs) - HFC134A 7 NMVOC’s 8 Nitrogen Oxides (NOx/NO2)
11 Sulphur Oxides (SOx/SO2) 17-24 Metals
35 Dichloromethane (DCM) 58 Chloroform 80 Chlorine and inorganic compounds (as HCL)
Other pollutants which are outlined in the Licence are also tracked and reported. The quantities emitted have been reported on the AER Returns Worksheet and submitted electronically by uploading to the EPA website as required by the sites IPPC Licence. A copy of the AER Returns Worksheet has also been enclosed as Appendix A. In addition, a copy of the PRTR has been submitted to the Water Services Authority (South Tipperary County Council) as required by the sites IPPC Licence.
3.2.2 2015 PRTR Proposal The substances to be tracked and reported for 2015 will remain the same as 2014.
31-March 2015 17 of 42 Annual Environmental Report 2014
4.0 Licence Specific Reports
4.1 Environmental Noise Monitoring Report
4.1.1 Noise Monitoring Data Overview
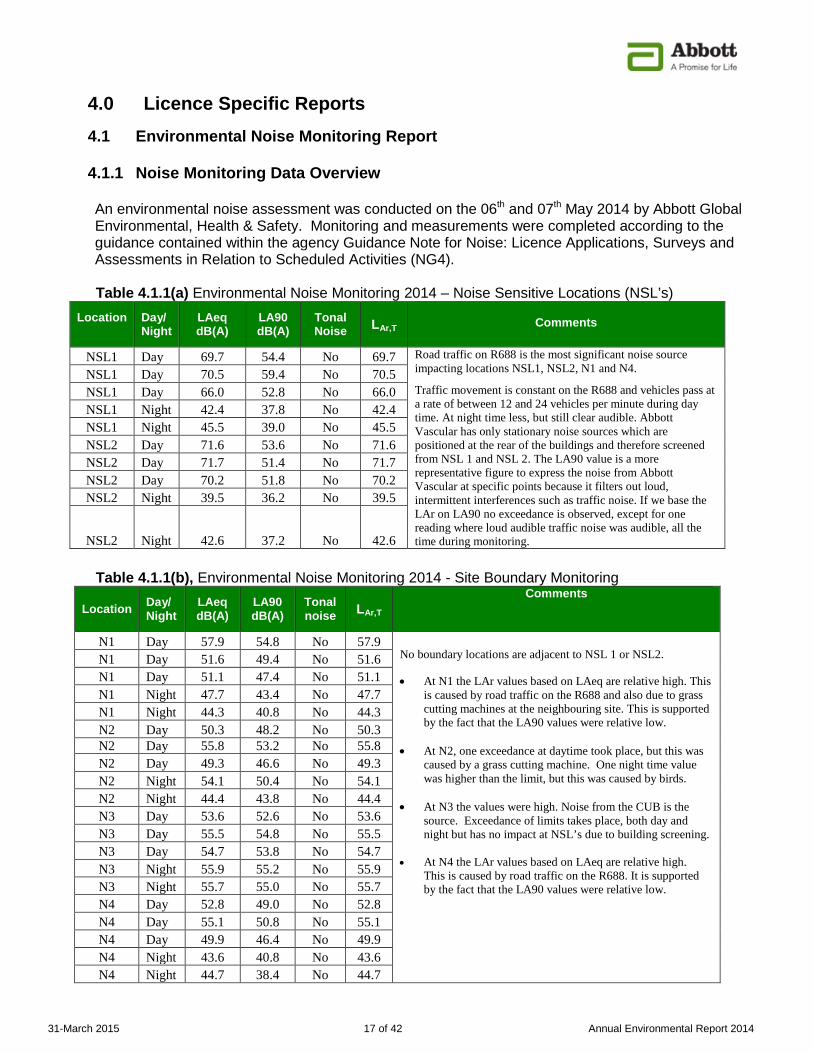
An environmental noise assessment was conducted on the 06th and 07th May 2014 by Abbott Global Environmental, Health & Safety. Monitoring and measurements were completed according to the guidance contained within the agency Guidance Note for Noise: Licence Applications, Surveys and Assessments in Relation to Scheduled Activities (NG4). Table 4.1.1(a) Environmental Noise Monitoring 2014 – Noise Sensitive Locations (NSL’s)
Location
Day/ Night
LAeq dB(A)
LA90 dB(A)
Tonal Noise LAr,T
Comments
NSL1 Day 69.7 54.4 No 69.7 Road traffic on R688 is the most significant noise source impacting locations NSL1, NSL2, N1 and N4.
Traffic movement is constant on the R688 and vehicles pass at a rate of between 12 and 24 vehicles per minute during day time. At night time less, but still clear audible. Abbott Vascular has only stationary noise sources which are positioned at the rear of the buildings and therefore screened from NSL 1 and NSL 2. The LA90 value is a more representative figure to express the noise from Abbott Vascular at specific points because it filters out loud, intermittent interferences such as traffic noise. If we base the LAr on LA90 no exceedance is observed, except for one reading where loud audible traffic noise was audible, all the time during monitoring.
NSL1 Day 70.5 59.4 No 70.5 NSL1 Day 66.0 52.8 No 66.0 NSL1 Night 42.4 37.8 No 42.4 NSL1 Night 45.5 39.0 No 45.5 NSL2 Day 71.6 53.6 No 71.6 NSL2 Day 71.7 51.4 No 71.7 NSL2 Day 70.2 51.8 No 70.2 NSL2 Night 39.5 36.2 No 39.5
NSL2 Night 42.6 37.2 No 42.6
Table 4.1.1(b), Environmental Noise Monitoring 2014 - Site Boundary Monitoring
Location Day/ Night
LAeq dB(A)
LA90 dB(A)
Tonal noise LAr,T
Comments
N1 Day 57.9 54.8 No 57.9 No boundary locations are adjacent to NSL 1 or NSL2. • At N1 the LAr values based on LAeq are relative high. This
is caused by road traffic on the R688 and also due to grass cutting machines at the neighbouring site. This is supported by the fact that the LA90 values were relative low.
• At N2, one exceedance at daytime took place, but this was caused by a grass cutting machine. One night time value was higher than the limit, but this was caused by birds.
• At N3 the values were high. Noise from the CUB is the
source. Exceedance of limits takes place, both day and night but has no impact at NSL’s due to building screening.
• At N4 the LAr values based on LAeq are relative high.
This is caused by road traffic on the R688. It is supported by the fact that the LA90 values were relative low.
N1 Day 51.6 49.4 No 51.6 N1 Day 51.1 47.4 No 51.1 N1 Night 47.7 43.4 No 47.7 N1 Night 44.3 40.8 No 44.3 N2 Day 50.3 48.2 No 50.3 N2 Day 55.8 53.2 No 55.8 N2 Day 49.3 46.6 No 49.3 N2 Night 54.1 50.4 No 54.1 N2 Night 44.4 43.8 No 44.4 N3 Day 53.6 52.6 No 53.6 N3 Day 55.5 54.8 No 55.5 N3 Day 54.7 53.8 No 54.7 N3 Night 55.9 55.2 No 55.9 N3 Night 55.7 55.0 No 55.7 N4 Day 52.8 49.0 No 52.8 N4 Day 55.1 50.8 No 55.1 N4 Day 49.9 46.4 No 49.9 N4 Night 43.6 40.8 No 43.6 N4 Night 44.7 38.4 No 44.7
31-March 2015 18 of 42 Annual Environmental Report 2014
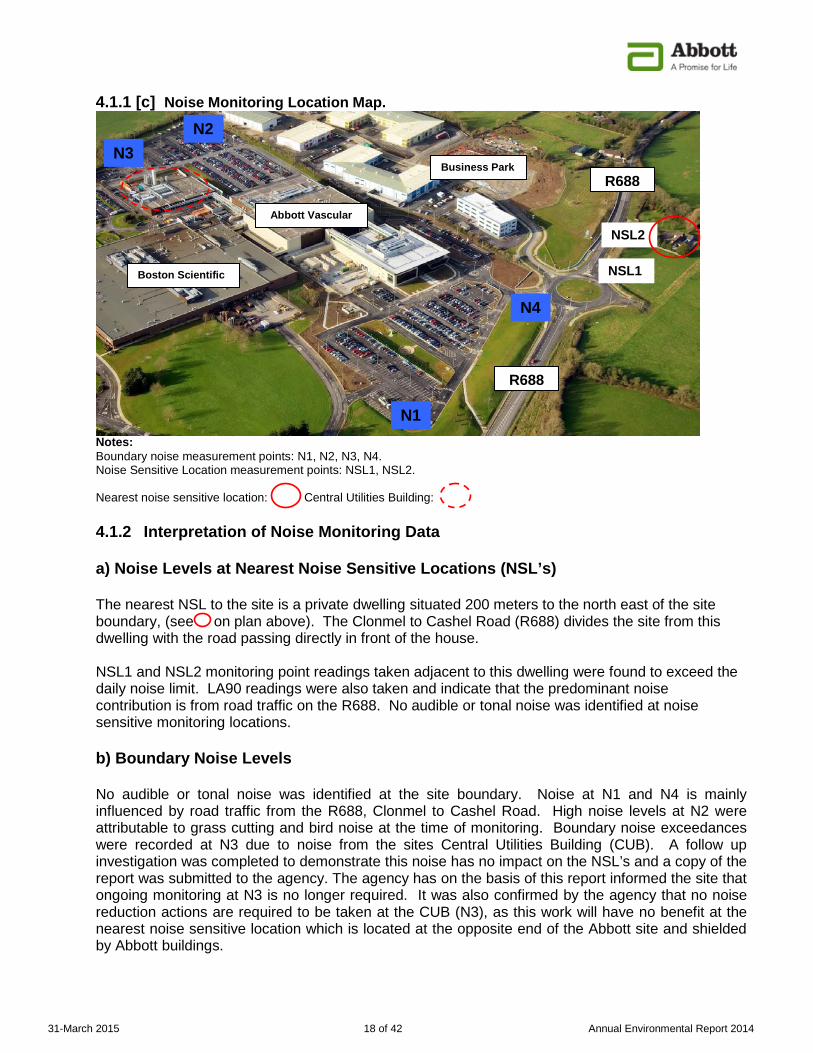
4.1.1 [c] Noise Monitoring Location Map.
Notes: Boundary noise measurement points: N1, N2, N3, N4. Noise Sensitive Location measurement points: NSL1, NSL2. Nearest noise sensitive location: Central Utilities Building: 4.1.2 Interpretation of Noise Monitoring Data a) Noise Levels at Nearest Noise Sensitive Locations (NSL’s) The nearest NSL to the site is a private dwelling situated 200 meters to the north east of the site boundary, (see on plan above). The Clonmel to Cashel Road (R688) divides the site from this dwelling with the road passing directly in front of the house. NSL1 and NSL2 monitoring point readings taken adjacent to this dwelling were found to exceed the daily noise limit. LA90 readings were also taken and indicate that the predominant noise contribution is from road traffic on the R688. No audible or tonal noise was identified at noise sensitive monitoring locations. b) Boundary Noise Levels No audible or tonal noise was identified at the site boundary. Noise at N1 and N4 is mainly influenced by road traffic from the R688, Clonmel to Cashel Road. High noise levels at N2 were attributable to grass cutting and bird noise at the time of monitoring. Boundary noise exceedances were recorded at N3 due to noise from the sites Central Utilities Building (CUB). A follow up investigation was completed to demonstrate this noise has no impact on the NSL’s and a copy of the report was submitted to the agency. The agency has on the basis of this report informed the site that ongoing monitoring at N3 is no longer required. It was also confirmed by the agency that no noise reduction actions are required to be taken at the CUB (N3), as this work will have no benefit at the nearest noise sensitive location which is located at the opposite end of the Abbott site and shielded by Abbott buildings.
N1
N4
N3 N2
NSL1
NSL2
R688
Boston Scientific
Abbott Vascular
Business Park R688
31-March 2015 19 of 42 Annual Environmental Report 2014
In summary, Abbott Vascular does not give rise to noise levels that cause nuisance to it’s neighbours. The Abbott site has not received a single noise related compliant since operations commenced in 2006.
4.2 2014 Solvent Management Plan
4.2.1. Introduction
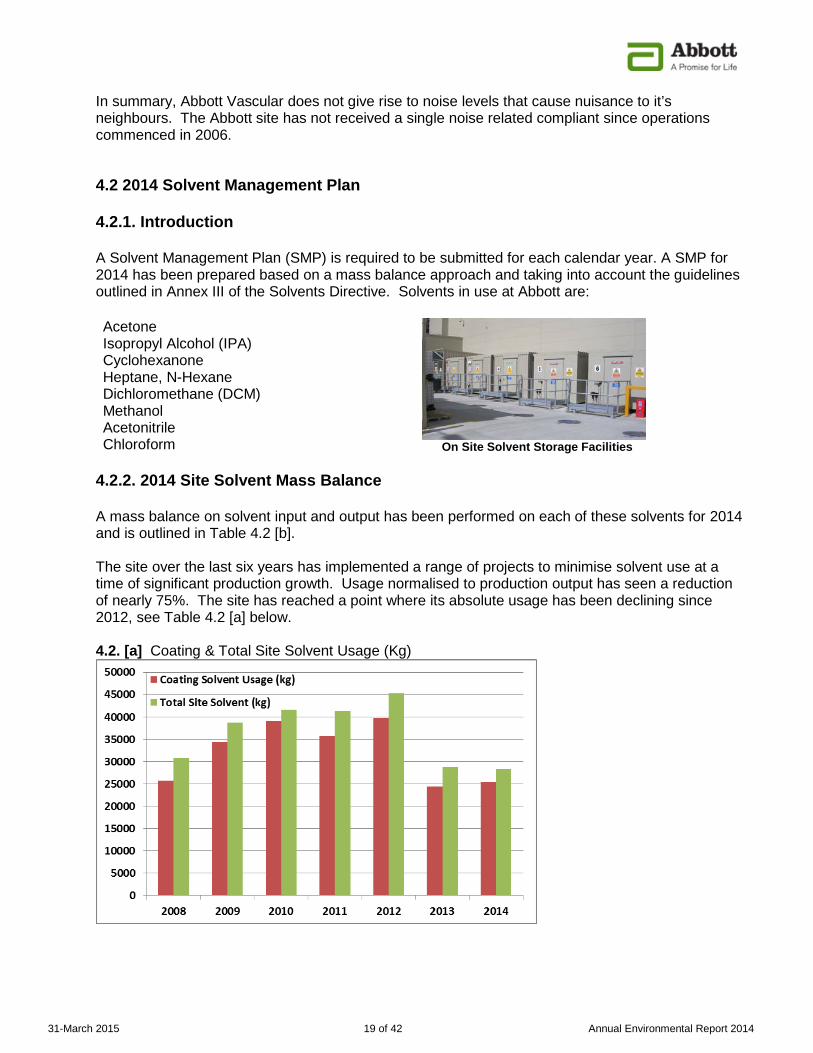
A Solvent Management Plan (SMP) is required to be submitted for each calendar year. A SMP for 2014 has been prepared based on a mass balance approach and taking into account the guidelines outlined in Annex III of the Solvents Directive. Solvents in use at Abbott are: Acetone Isopropyl Alcohol (IPA) Cyclohexanone Heptane, N-Hexane Dichloromethane (DCM) Methanol Acetonitrile Chloroform
On Site Solvent Storage Facilities
4.2.2. 2014 Site Solvent Mass Balance A mass balance on solvent input and output has been performed on each of these solvents for 2014 and is outlined in Table 4.2 [b]. The site over the last six years has implemented a range of projects to minimise solvent use at a time of significant production growth. Usage normalised to production output has seen a reduction of nearly 75%. The site has reached a point where its absolute usage has been declining since 2012, see Table 4.2 [a] below. 4.2. [a] Coating & Total Site Solvent Usage (Kg)
31-March 2015 20 of 42 Annual Environmental Report 2014
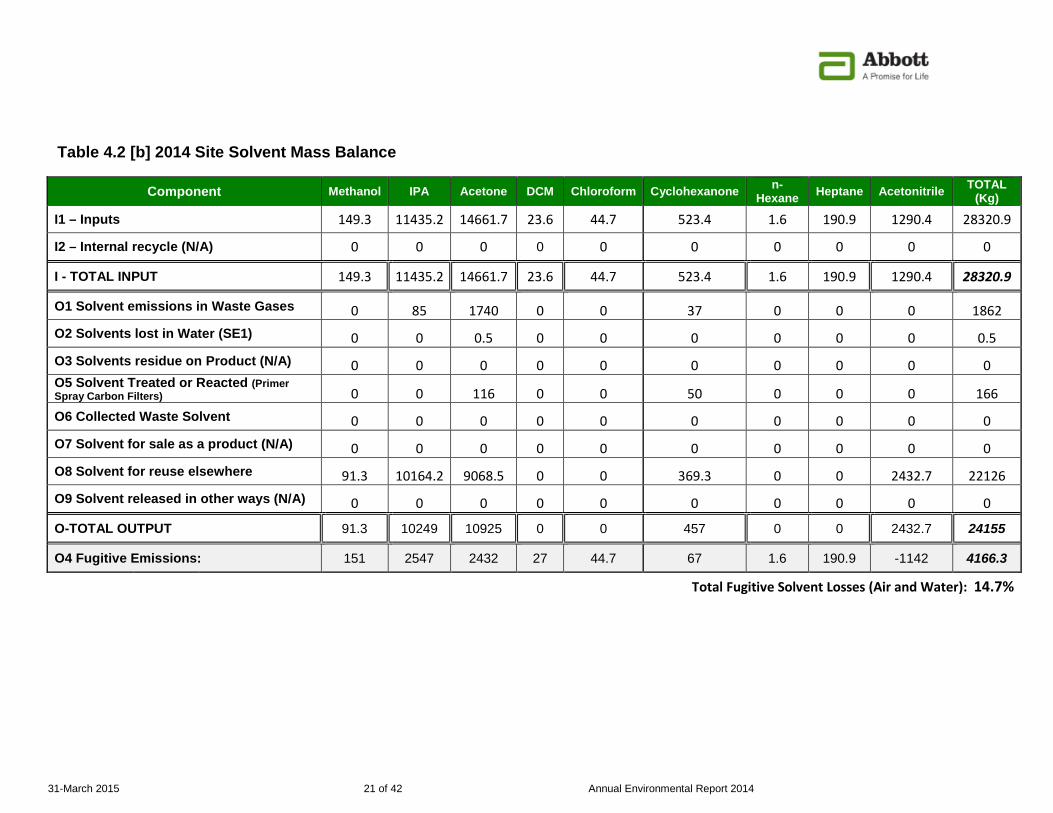
4.2.3. Discussion on 2014 SMP Result - Assessment of compliance with VOC Fugitive Emission Limit
The mass balance shown below in Table 4.2 demonstrates that the unaccounted for figure treated as fugitive emission is 14.7% of the solvent input, which is below the VOC fugitive emissions limit of 20% of the solvent input set by the sites IPPC licence. Hence, the site is compliant with the VOC fugitive emission limit. 4.2.4. 2014 Fugitive Emissions Reduction Update
The following activities were completed during the course of 2014: 1. Solvent handling tasks are constantly reviewed as part of ongoing area inspections in order to
identify opportunities for solvent evaporation reduction. 4.2.5. Solvent Recovery, Reuse & Substitution Given the nature of the sites manufacturing processes there are limited options open to the site with regards to on site solvent recovery and reuse. The site has reviewed the feasibility of substituting solvents with less harmful ones but this was found to be impracticable.
31-March 2015 21 of 42 Annual Environmental Report 2014
Table 4.2 [b] 2014 Site Solvent Mass Balance
Component Methanol IPA Acetone DCM Chloroform Cyclohexanone n-Hexane Heptane Acetonitrile TOTAL
(Kg)
I1 – Inputs 149.3 11435.2 14661.7 23.6 44.7 523.4 1.6 190.9 1290.4 28320.9
I2 – Internal recycle (N/A) 0 0 0 0 0 0 0 0 0 0
I - TOTAL INPUT 149.3 11435.2 14661.7 23.6 44.7 523.4 1.6 190.9 1290.4 28320.9
O1 Solvent emissions in Waste Gases 0 85 1740 0 0 37 0 0 0 1862 O2 Solvents lost in Water (SE1) 0 0 0.5 0 0 0 0 0 0 0.5 O3 Solvents residue on Product (N/A) 0 0 0 0 0 0 0 0 0 0 O5 Solvent Treated or Reacted (Primer Spray Carbon Filters) 0 0 116 0 0 50 0 0 0 166 O6 Collected Waste Solvent 0 0 0 0 0 0 0 0 0 0 O7 Solvent for sale as a product (N/A) 0 0 0 0 0 0 0 0 0 0 O8 Solvent for reuse elsewhere 91.3 10164.2 9068.5 0 0 369.3 0 0 2432.7 22126 O9 Solvent released in other ways (N/A) 0 0 0 0 0 0 0 0 0 0
O-TOTAL OUTPUT 91.3 10249 10925 0 0 457 0 0 2432.7 24155
O4 Fugitive Emissions: 151 2547 2432 27 44.7 67 1.6 190.9 -1142 4166.3
Total Fugitive Solvent Losses (Air and Water): 14.7%
31-March 2015 22 of 42 Annual Environmental Report 2014
The sources of data used for each input and output to complete the sites solvent mass balance are outlined below (these reflect the terminology used in the Solvents Directive): Solvent Inputs (I): I1 - Solvent inputs – the amount of fresh solvent consumed on site during 2014 was calculated from data obtained from the Supply Chain Solvent Usage Tracker and from separate Xiam orders placed by Laboratories. I2 – Internal Recycle – no recovered solvent is reused onsite, virgin solvent is required for all operations. Solvent Outputs (O): O1 - Solvent Emissions in Waste Gases. Figures calculated from quarterly monitoring data of main emissions points which were operational during 2014: A2-1, A2-2, A2-7 and A2-8. Solvents emissions from the Hazmat area were included based on historic monitoring data. There are no other point source emissions on site likely to give rise to detectable levels of VOC’s. O2 - Solvents Lost in Water. This has been calculated from annual solvent monitoring of SE1 (Trade Effluent) and the total trade effluent flow for 2014. O3 - Solvents Residue on Product – cardiac stents are implantable medical devices and therefore contain no residual solvent on the product. O5 - Solvent Treated or Reacted (Absorbed or incinerated) – Solvent used as part of the Primer Spray process is captured in an activated carbon filter. O6 - Collected Waste Solvent – Waste containing solvent sent off site for disposal (as opposed to recovery) includes wipes used for cleaning with acetone and IPA. The content of IPA and acetone on these wipes has been estimated using results of weighing wipes before and after use. Solvent which is sent for reuse/recovery is classed under O8 (Solvent Reused/Recovered Off-Site) below. O7 - Solvent for Sale as a Product - This term does not apply to the Abbott site. O8 - Solvent for Reuse elsewhere – this includes waste from Abbott which is sent off-site for recovery as the definition of recovery for reuse under the legislation is ‘the use of organic solvents recovered from an installation for any technical or commercial purpose and including use as a fuel’. Drums of solvent waste for recovery offsite were analysed for solvent content, this data was used as a basis to estimate the breakdown of all waste solvent sent off site for recycling during 2014. O9 - Organic Solvents released in Other Ways - This term is not relevant to the Abbott site.
O4 - Fugitive Solvent Emissions – fugitive emissions have been calculated based on solvent mass balance difference, i.e., the unaccounted value. In addition, solvents lost in water (O2) and solvent residue on product (O3) are required to be counted as fugitive emissions. Hence, the unaccounted value resulting from the mass balance, plus O2 and O3, has been taken as the level of fugitive solvent emissions from the site. Fugitive/Unaccounted Losses = I1+I2 – (O1+O2+O5+O6+O8) Spillages/Incidents: There were no significant spillages/incidents involving solvent during 2014.
31-March 2015 23 of 42 Annual Environmental Report 2014
4.3 Energy Efficiency Auditing Introduction The last comprehensive site energy audit was completed by the Abbott Global Energy Management Group (GEM) in April 2014. A follow up review was also completed by Electric Ireland in September 2014.
Site Energy Management System Overview Site headcount recorded at the end of 2014 was 1,277 people working onsite. The facility operates on a 5 day, 2 x 8 hour shift basis, occasionally there is overtime on Saturdays between 7am – 1pm. The current energy management system includes the following:
• Electrical consumption data is provided by Airtricity. A detailed breakdown of site energy
consumption is available via the new onsite Energy Management System (EFT) with approximately 91 energy meters installed on site and additional meters to be installed during 2015.
• Gas consumption data is provided by ESBI through monthly billing. The onsite BMS also
records gas consumption data for the site and for the Combined Heat & Power plant (CHP).
• Data from EFT and the Building Management System (BMS) is used to produce usage
trends for the key energy users on site, eg, HVAC, Chilled Water, Lighting, 208 Voltage System, Compressors and General Services.
The site completes periodic site energy audits to identify opportunities for energy reduction. A history of relevant energy reviews completed at the Clonmel site is shown below:
• Electric Ireland Site Energy Review, September 2014. • Abbott Global Energy Management (GEM), April 2014. • Chilled Water System Review, September 2011. • Low Pressure Hot Water System Review 2011. • Site Energy Survey, Dec 2009. • Chilled Water Survey Report (Johnson Controls/Retrofit Services), Aug 2008. • HVAC Energy Savings Audit Report (Curley Smith Design Ltd), Nov 2007. • Sustainable Energy Ireland (SEI) Audit, Sept 2007. • Abbott Global Energy Group (GEM) Energy Audit, July 2007.
Energy improvement projects identified from the above reviews are tracked via the sites register of energy reduction opportunities with individual projects managed via the sites annual Environmental Management Program (EMP). Projects completed in 2014 and planned for 2015 are detailed within the EMP updates provided in Appendices B & C of this document.
4.4 Decommissioning Management Plan (DMP) Review
The DMP was revised during 2014 with the update submitted to the agency on the 18-November 2014. No changes are envisaged during 2015 at this time. 4.5 Environmental Liabilities Risk Assessment (ELRA) Review The sites ELRA document was also revised during 2014 and the report submitted to the agency on the 18-November 2014. No changes are envisaged during 2015 at this time.
31-March 2015 24 of 42 Annual Environmental Report 2014
4.6 Statement of Measures
A statement of measures in relation to prevention of environmental damage and remedial actions (Environmental Liabilities) is required to be submitted in the AER. The Abbott Corporation will act as guarantor for all future environmental liabilities arising at the Clonmel site. Environmental liabilities on site will continue to be controlled as outlined in the 2014 ELRA. The site is due to submit to the agency in the first half of 2015 a revised financial surety agreement to guarantee the potential liabilities identified in the 2014 revised ELRA and DMP. 4.7 Testing & Inspection of Underground Tanks, Sewer pipes and Bunds
The testing and inspection of all underground pipes, tanks and bunds was completed during 2014 for all trade and domestic sewage pipelines. Testing included both camera surveying and hydrostatic pressure testing. All required remedial works identified by these investigations have now been completed. 4.8 Waste Reduction - Prevention, Minimisation and Recycling Summary During 2014 the site continued to reduce hazardous waste generation on site and continued to increase total waste recycling rates. Total hazardous waste quantities for the site dropped from 172 tonnes in 2013 to 162 tonnes in 2014 with total waste recycling increasing from 73% to 81.5%. With the new Vessel Closure range of medical devices starting manufacture during 2014 waste reduction will continue to be a focus for the site during 2015.
4.9 Raw Material Usage and Efficiency During 2014 the sites total solvent usage decreased by 1.4%. With manufacture of Vessel Closure Devices due to ramp up during 2015 solvent usage and control of fugitive emissions will remain a focus for the site during 2015. Key solvent reduction developments in the period 2014-2015 include:
• Solvent emissions to air from the Mandrel Cleaning Area reduced by 27% on the back of a
full year using the new sonicator cleaner covers. • Methylene Chloride (EPA approved R40) usage continues to reduce with less than 24 litres
used during 2014. • Full review of solvent usage in Vessel Closure is to be completed in 2015 to identify
opportunities for solvent reduction, quantification of solvent stack releases and minimisation of fugitive solvent losses.
• A handling review of Chloroform is to be completed once the new BVS product startup gains pace later in 2015.
4.10 Minimisation of Water Demand and Trade Effluent Water usage increased in 2014 by 6% due to increased headcount and production demands. Water management will remain a continued focus for the site and remains a key aspect covered within the sites new 5-year long range plan (2014-2018).
31-March 2015 25 of 42 Annual Environmental Report 2014
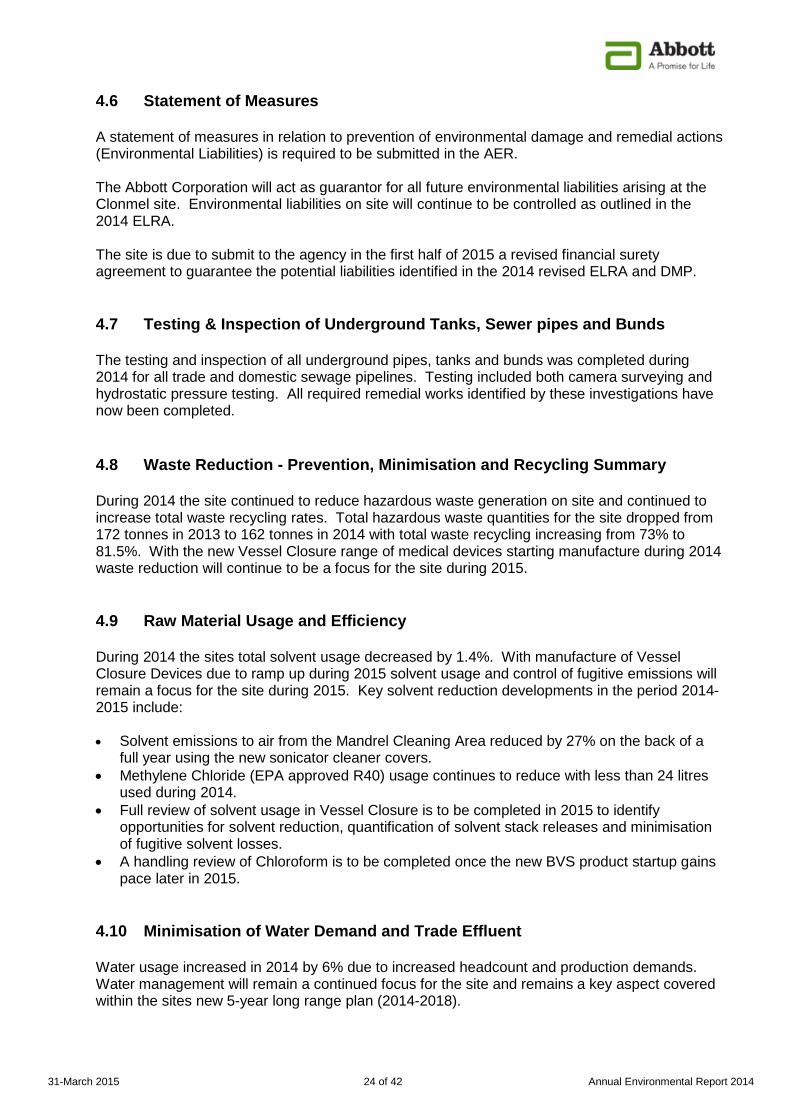
4.11 Long Range Environmental Improvement Goals (2014-2018)
The site has set the following new long range goals covering the period 2014 to 2018.
Aspect 2018 Long Range Goal
Primary Energy Reduce primary energy by 5% versus 2013 baseline.
Total Waste Reduction Reduce total waste generation by 20% versus Clonmel 2014 figure (adjusted for new Vessel Closure waste materials.)
Total Waste Recycle % Increase total waste recycle figure to > 85% Water Conservation Reduce total water usage by 15% versus
2013 usage figure.
4.12 Submitted Reports 2014 The following reports were submitted in full to the EPA during the year: • 2013 Annual Environmental Report (AER) & PRTR • RBME Data Submission • Proposal for Effluent Pipeline Integrity Testing • Central Utilities Building Perimeter Noise Testing Clarification • Vessel Closure New Product Notification • Chloroform Usage Request
31-March 2015 Annual Environmental Report 2014
APPENDIX A – AER Returns Worksheet
31-March 2015 Annual Environmental Report 2014
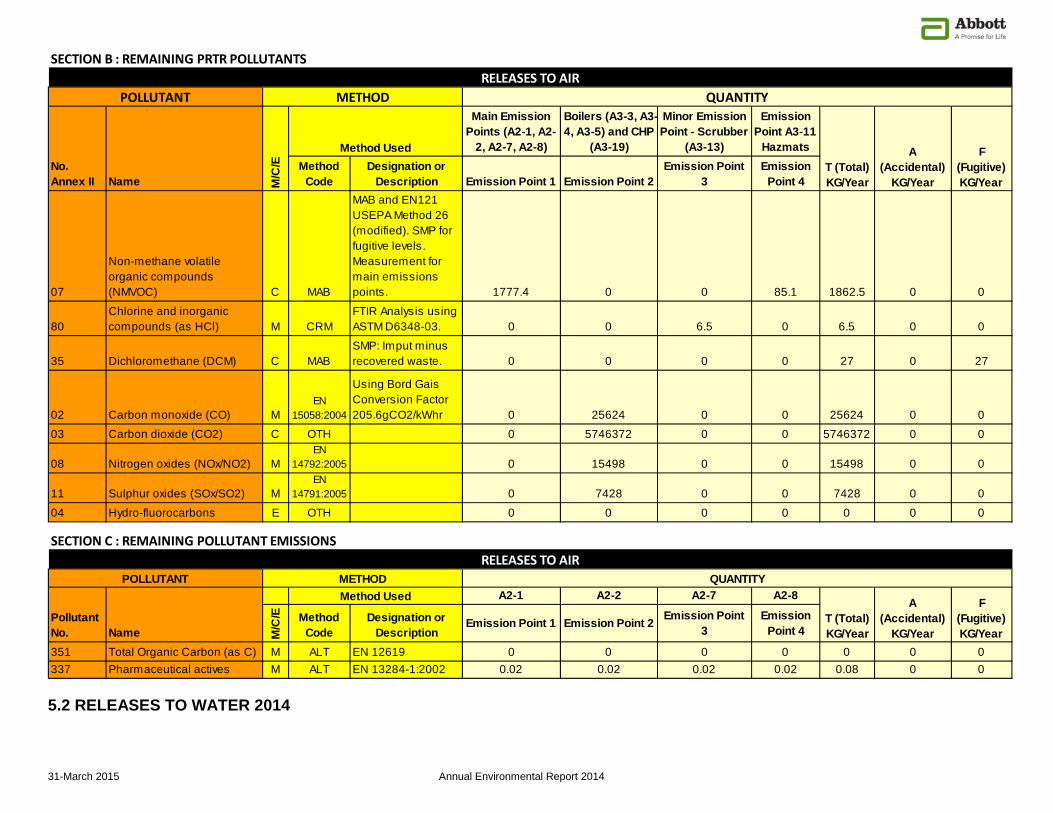
5.1 RELEASES TO AIR 2014
31-March 2015 Annual Environmental Report 2014
Main Emission Points (A2-1, A2-
2, A2-7, A2-8)
Boilers (A3-3, A3-4, A3-5) and CHP
(A3-19)
Minor Emission Point - Scrubber
(A3-13)
Emission
Point A3-11 Hazmats
No. Annex II Name M
/C/E Method
CodeDesignation or
Description Emission Point 1 Emission Point 2Emission Point
3Emission
Point 4
07
Non-methane volatile organic compounds (NMVOC) C MAB
MAB and EN121 USEPA Method 26 (modified). SMP for fugitive levels. Measurement for main emissions points. 1777.4 0 0 85.1 1862.5 0 0
80Chlorine and inorganic compounds (as HCl) M CRM
FTIR Analysis using ASTM D6348-03. 0 0 6.5 0 6.5 0 0
35 Dichloromethane (DCM) C MABSMP: Imput minus recovered waste. 0 0 0 0 27 0 27
02 Carbon monoxide (CO) MEN
15058:2004
Using Bord Gais Conversion Factor 205.6gCO2/kWhr 0 25624 0 0 25624 0 0
03 Carbon dioxide (CO2) C OTH 0 5746372 0 0 5746372 0 0
08 Nitrogen oxides (NOx/NO2) MEN
14792:2005 0 15498 0 0 15498 0 0
11 Sulphur oxides (SOx/SO2) MEN
14791:2005 0 7428 0 0 7428 0 0
04 Hydro-fluorocarbons E OTH 0 0 0 0 0 0 0
A2-1 A2-2 A2-7 A2-8
Pollutant No. Name M
/C/E Method
CodeDesignation or
DescriptionEmission Point 1 Emission Point 2 Emission Point
3Emission
Point 4
351 Total Organic Carbon (as C) M ALT EN 12619 0 0 0 0 0 0 0337 Pharmaceutical actives M ALT EN 13284-1:2002 0.02 0.02 0.02 0.02 0.08 0 0
T (Total) KG/Year
A (Accidental)
KG/Year
F (Fugitive) KG/Year
S9/TLhb . : w9aALbLbD twTw thLLUTAbTS
S9/TLhb / : w9aALbLbD thLLUTAbT 9aLSSLhbS
POLLUTANT METHODMethod Used
QUANTITY
T (Total) KG/Year
A (Accidental)
KG/Year
F (Fugitive) KG/Year
w9L9AS9S Th ALw
w9L9AS9S Th ALw
Method Used
thLLUTAbT a9TIh5 vUAbTLTY
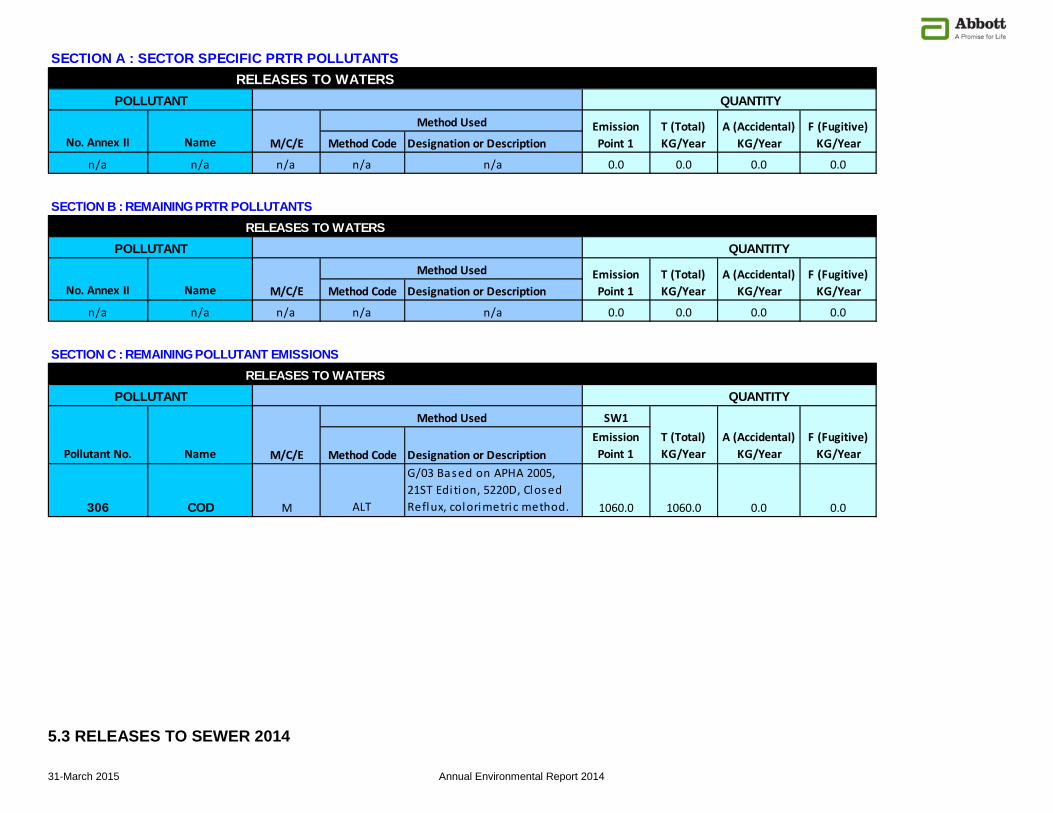
5.2 RELEASES TO WATER 2014
31-March 2015 Annual Environmental Report 2014
SECTION A : SECTOR SPECIFIC PRTR POLLUTANTS
QUANTITY
bo. Annex LL bame a///9 aethod /ode 5esignation or 5escription
n/a n/a n/a n/a n/a 0.0 0.0 0.0 0.0
SECTION B : REMAINING PRTR POLLUTANTS
QUANTITY
bo. Annex LL bame a///9 aethod /ode 5esignation or 5escription
n/a n/a n/a n/a n/a 0.0 0.0 0.0 0.0
SECTION C : REMAINING POLLUTANT EMISSIONS
QUANTITYSW1
tollutant bo. bame a///9 aethod /ode 5esignation or 5escription9mission toint 1
T (Total) YD/Year
A (Accidental) YD/Year
F (Fugitive) YD/Year
306 COD M ALT
G/03 Based on APIA 2005, 21ST Edi tion, 5220D, Closed Reflux, colorimetric method. 1060.0 1060.0 0.0 0.0
A (Accidental) YD/Year
F (Fugitive) YD/Year
RELEASES TO WATERSPOLLUTANT
aethod Used
RELEASES TO WATERSPOLLUTANT
aethod Used 9mission toint 1
T (Total) YD/Year
RELEASES TO WATERSPOLLUTANT
aethod Used 9mission toint 1
T (Total) YD/Year
A (Accidental) YD/Year
F (Fugitive) YD/Year
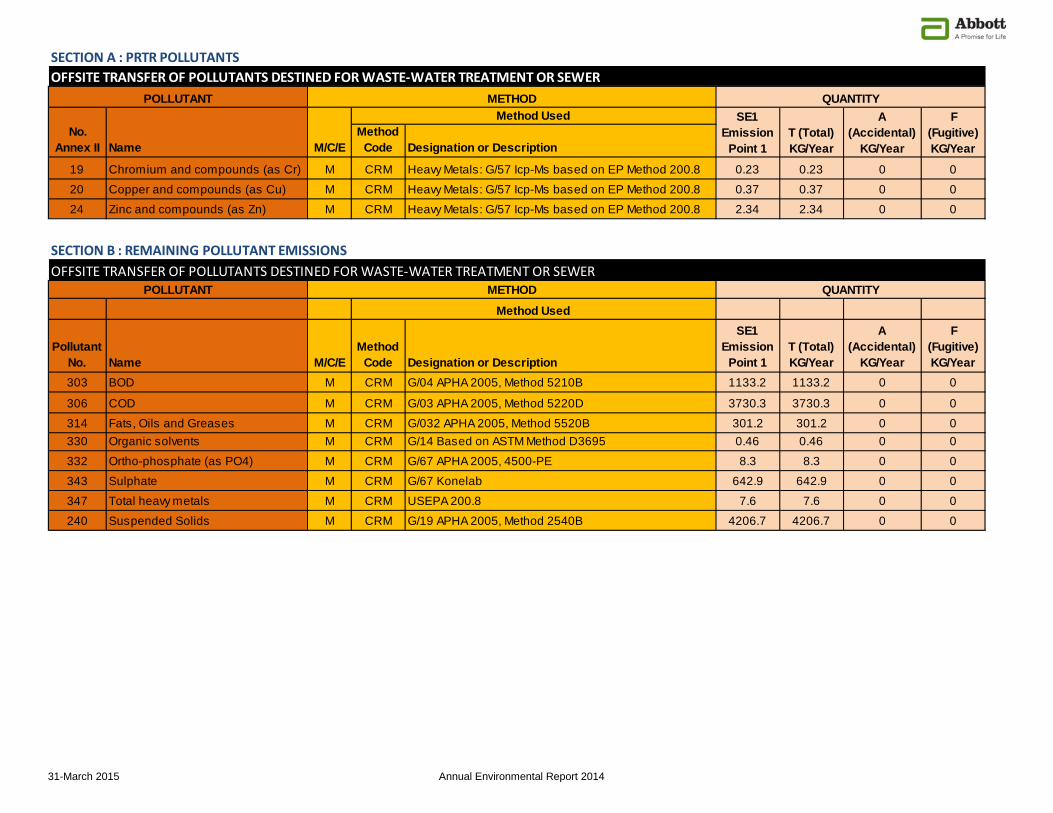
5.3 RELEASES TO SEWER 2014
31-March 2015 Annual Environmental Report 2014
No. Annex II Name M/C/E
Method Code Designation or Description
19 Chromium and compounds (as Cr) M CRM Heavy Metals: G/57 Icp-Ms based on EP Method 200.8 0.23 0.23 0 0
20 Copper and compounds (as Cu) M CRM Heavy Metals: G/57 Icp-Ms based on EP Method 200.8 0.37 0.37 0 0
24 Zinc and compounds (as Zn) M CRM Heavy Metals: G/57 Icp-Ms based on EP Method 200.8 2.34 2.34 0 0
Pollutant No. Name M/C/E
Method Code Designation or Description
SE1 Emission
Point 1T (Total) KG/Year
A (Accidental)
KG/Year
F (Fugitive) KG/Year
303 BOD M CRM G/04 APHA 2005, Method 5210B 1133.2 1133.2 0 0
306 COD M CRM G/03 APHA 2005, Method 5220D 3730.3 3730.3 0 0
314 Fats, Oils and Greases M CRM G/032 APHA 2005, Method 5520B 301.2 301.2 0 0330 Organic solvents M CRM G/14 Based on ASTM Method D3695 0.46 0.46 0 0
332 Ortho-phosphate (as PO4) M CRM G/67 APHA 2005, 4500-PE 8.3 8.3 0 0
343 Sulphate M CRM G/67 Konelab 642.9 642.9 0 0
347 Total heavy metals M CRM USEPA 200.8 7.6 7.6 0 0
240 Suspended Solids M CRM G/19 APHA 2005, Method 2540B 4206.7 4206.7 0 0
S9/TLhb A : twTw thLLUTAbTS
Method Used
SE1 Emission
Point 1T (Total) KG/Year
A (Accidental)
KG/Year
F (Fugitive) KG/Year
QUANTITY
S9/TLhb . : w9aALbLbD thLLUTAbT 9aLSSLhbS hCCSITE TRAbSCER hC PhLLUTAbTS DESTIbED ChR WASTE-WATER TREATMEbT hR SEWER
QUANTITY
POLLUTANT METHODMethod Used
POLLUTANT METHOD
hFFSLT9 TwAbSF9w hF thLLUTAbTS 59STLb95 Fhw WAST9-WAT9w Tw9ATa9bT hw S9W9w
31-March 2015 Annual Environmental Report 2014
31-March 2015 Annual Environmental Report 2014
31-March 2015 Annual Environmental Report 2014
31-March 2015 Annual Environmental Report 2014
31-March 2015 Annual Environmental Report 2014
APPENDIX B – 2014 EMP Update
31-March 2015 Annual Environmental Report 2014
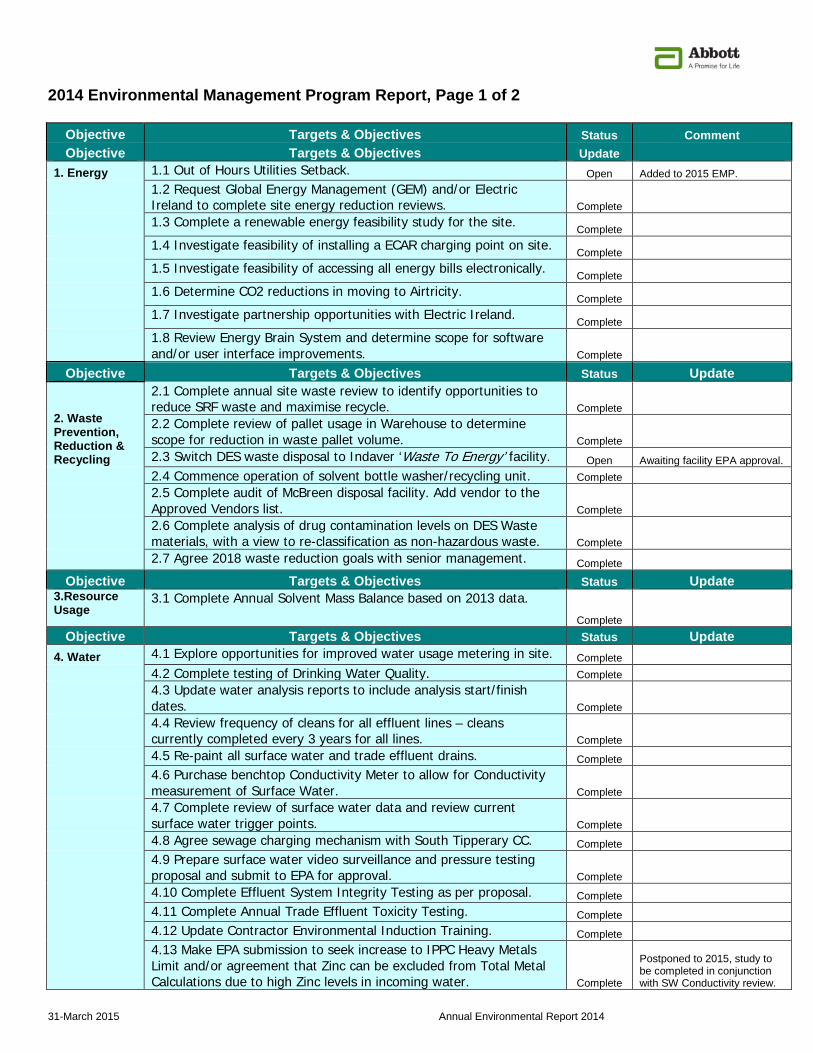
2014 Environmental Management Program Report, Page 1 of 2
Objective Targets & Objectives Status Comment Objective Targets & Objectives Update
1. Energy 1.1 Out of Hours Utilities Setback. Open Added to 2015 EMP.
1.2 Request Global Energy Management (GEM) and/or Electric Ireland to complete site energy reduction reviews. Complete
1.3 Complete a renewable energy feasibility study for the site. Complete
1.4 Investigate feasibility of installing a ECAR charging point on site. Complete
1.5 Investigate feasibility of accessing all energy bills electronically. Complete
1.6 Determine CO2 reductions in moving to Airtricity. Complete
1.7 Investigate partnership opportunities with Electric Ireland. Complete
1.8 Review Energy Brain System and determine scope for software and/or user interface improvements. Complete
Objective Targets & Objectives Status Update
2. Waste Prevention, Reduction & Recycling
2.1 Complete annual site waste review to identify opportunities to reduce SRF waste and maximise recycle. Complete 2.2 Complete review of pallet usage in Warehouse to determine scope for reduction in waste pallet volume. Complete 2.3 Switch DES waste disposal to Indaver ‘Waste To Energy’ facility. Open Awaiting facility EPA approval.
2.4 Commence operation of solvent bottle washer/recycling unit. Complete
2.5 Complete audit of McBreen disposal facility. Add vendor to the Approved Vendors list. Complete
2.6 Complete analysis of drug contamination levels on DES Waste materials, with a view to re-classification as non-hazardous waste. Complete
2.7 Agree 2018 waste reduction goals with senior management. Complete
Objective Targets & Objectives Status Update 3.Resource Usage
3.1 Complete Annual Solvent Mass Balance based on 2013 data.
Complete Objective Targets & Objectives Status Update
4. Water 4.1 Explore opportunities for improved water usage metering in site. Complete 4.2 Complete testing of Drinking Water Quality. Complete
4.3 Update water analysis reports to include analysis start/finish dates. Complete
4.4 Review frequency of cleans for all effluent lines – cleans currently completed every 3 years for all lines. Complete
4.5 Re-paint all surface water and trade effluent drains. Complete
4.6 Purchase benchtop Conductivity Meter to allow for Conductivity measurement of Surface Water. Complete
4.7 Complete review of surface water data and review current surface water trigger points. Complete
4.8 Agree sewage charging mechanism with South Tipperary CC. Complete
4.9 Prepare surface water video surveillance and pressure testing proposal and submit to EPA for approval. Complete 4.10 Complete Effluent System Integrity Testing as per proposal. Complete 4.11 Complete Annual Trade Effluent Toxicity Testing. Complete 4.12 Update Contractor Environmental Induction Training. Complete 4.13 Make EPA submission to seek increase to IPPC Heavy Metals Limit and/or agreement that Zinc can be excluded from Total Metal Calculations due to high Zinc levels in incoming water. Complete
Postponed to 2015, study to be completed in conjunction with SW Conductivity review.
31-March 2015 Annual Environmental Report 2014
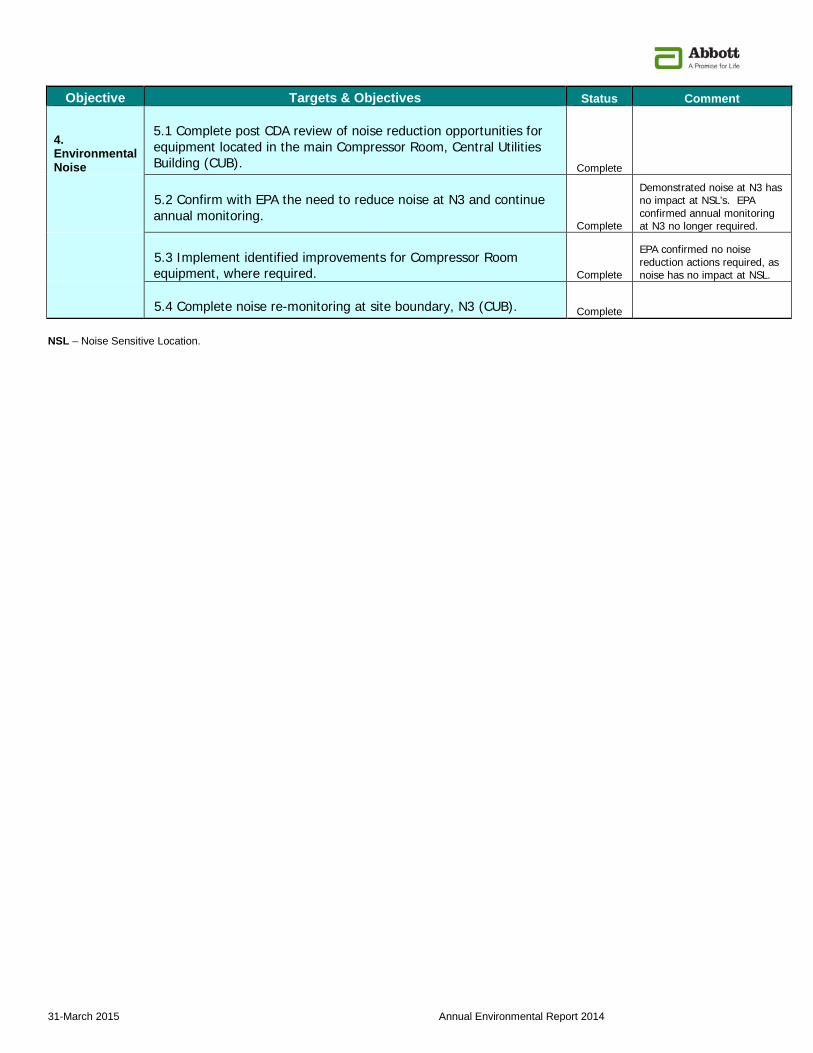
Objective Targets & Objectives Status Comment
4. Environmental Noise
5.1 Complete post CDA review of noise reduction opportunities for equipment located in the main Compressor Room, Central Utilities Building (CUB). Complete
5.2 Confirm with EPA the need to reduce noise at N3 and continue annual monitoring.
Complete
Demonstrated noise at N3 has no impact at NSL’s. EPA confirmed annual monitoring at N3 no longer required.
5.3 Implement identified improvements for Compressor Room equipment, where required. Complete
EPA confirmed no noise reduction actions required, as noise has no impact at NSL.
5.4 Complete noise re-monitoring at site boundary, N3 (CUB). Complete
NSL – Noise Sensitive Location.
31-March 2015 Annual Environmental Report 2014
APPENDIX C – 2015 EMP Proposal
31-March 2015 Annual Environmental Report 2014
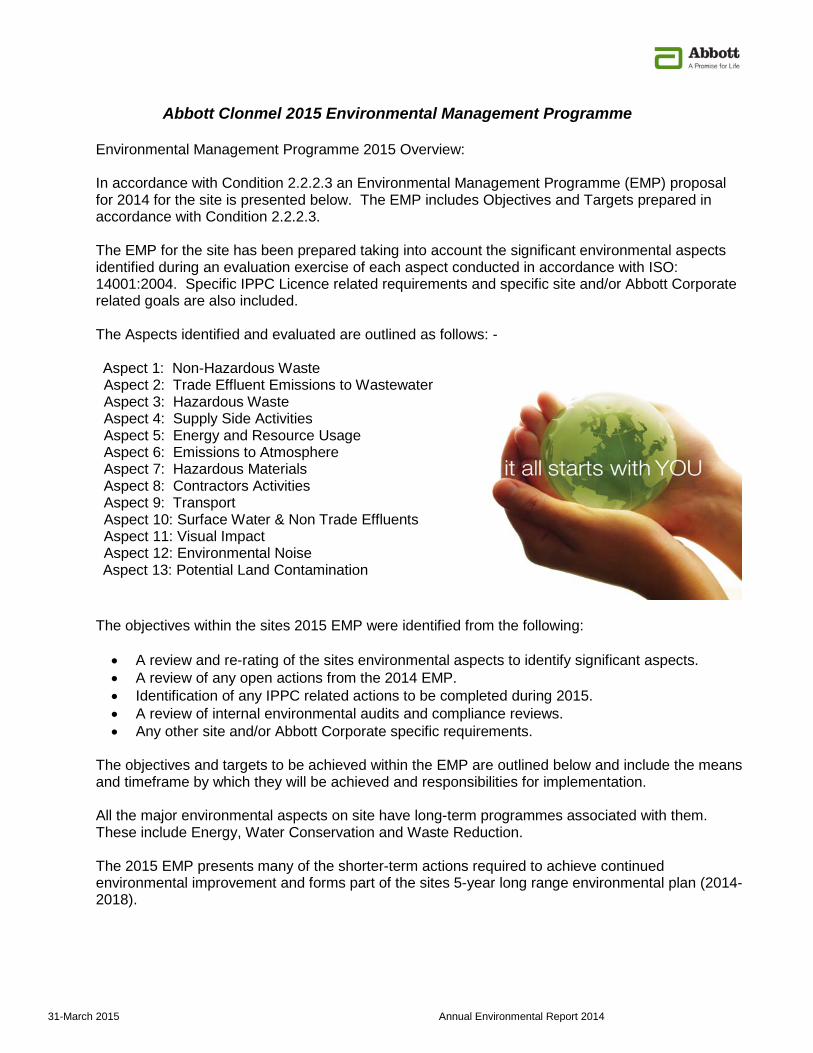
Abbott Clonmel 2015 Environmental Management Programme
Environmental Management Programme 2015 Overview:
In accordance with Condition 2.2.2.3 an Environmental Management Programme (EMP) proposal for 2014 for the site is presented below. The EMP includes Objectives and Targets prepared in accordance with Condition 2.2.2.3.
The EMP for the site has been prepared taking into account the significant environmental aspects identified during an evaluation exercise of each aspect conducted in accordance with ISO: 14001:2004. Specific IPPC Licence related requirements and specific site and/or Abbott Corporate related goals are also included.
The Aspects identified and evaluated are outlined as follows: -
Aspect 1: Non-Hazardous Waste Aspect 2: Trade Effluent Emissions to Wastewater Aspect 3: Hazardous Waste Aspect 4: Supply Side Activities Aspect 5: Energy and Resource Usage Aspect 6: Emissions to Atmosphere Aspect 7: Hazardous Materials Aspect 8: Contractors Activities Aspect 9: Transport Aspect 10: Surface Water & Non Trade Effluents Aspect 11: Visual Impact Aspect 12: Environmental Noise Aspect 13: Potential Land Contamination
The objectives within the sites 2015 EMP were identified from the following:
• A review and re-rating of the sites environmental aspects to identify significant aspects. • A review of any open actions from the 2014 EMP. • Identification of any IPPC related actions to be completed during 2015. • A review of internal environmental audits and compliance reviews. • Any other site and/or Abbott Corporate specific requirements.
The objectives and targets to be achieved within the EMP are outlined below and include the means and timeframe by which they will be achieved and responsibilities for implementation.
All the major environmental aspects on site have long-term programmes associated with them. These include Energy, Water Conservation and Waste Reduction. The 2015 EMP presents many of the shorter-term actions required to achieve continued environmental improvement and forms part of the sites 5-year long range environmental plan (2014-2018).
2015 Environmental Management Programme
SHE2062444 Rev F Page 40 of 43
31-March 2015 Annual Environmental Report 2014
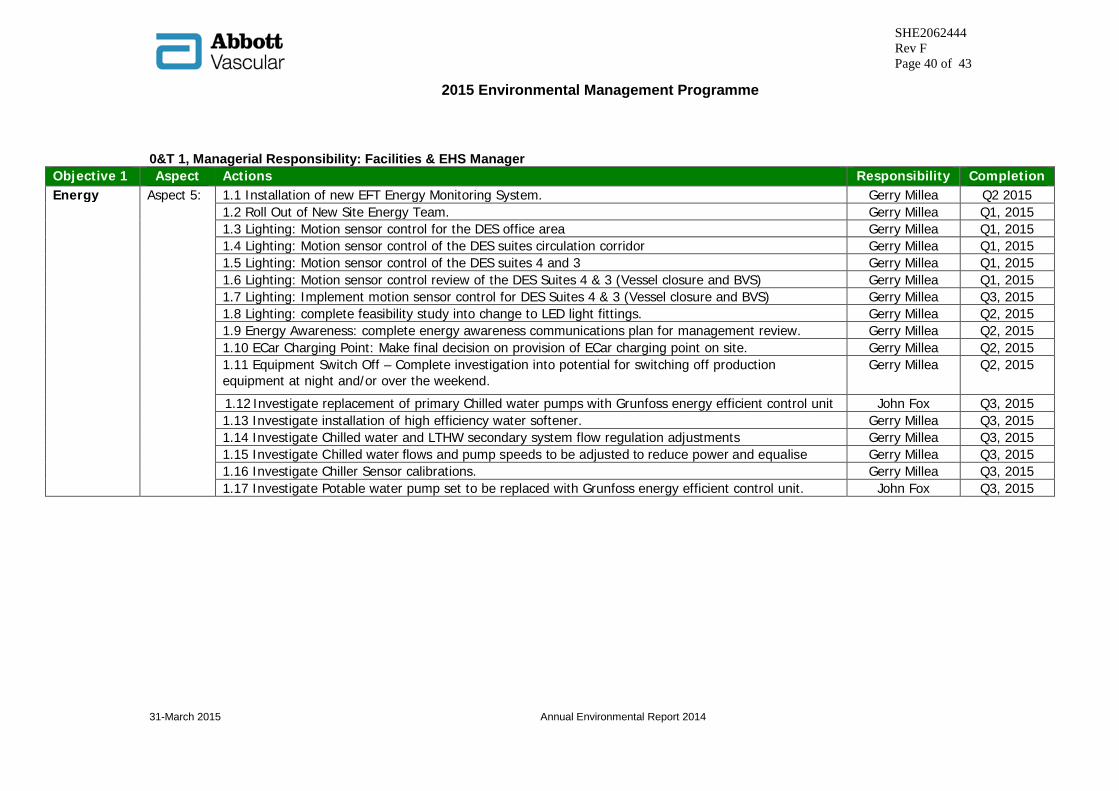
0&T 1, Managerial Responsibility: Facilities & EHS Manager Objective 1 Aspect
Actions Responsibility Completion
Energy Aspect 5: 1.1 Installation of new EFT Energy Monitoring System. Gerry Millea Q2 2015
1.2 Roll Out of New Site Energy Team. Gerry Millea Q1, 2015 1.3 Lighting: Motion sensor control for the DES office area Gerry Millea Q1, 2015 1.4 Lighting: Motion sensor control of the DES suites circulation corridor Gerry Millea Q1, 2015 1.5 Lighting: Motion sensor control of the DES suites 4 and 3 Gerry Millea Q1, 2015 1.6 Lighting: Motion sensor control review of the DES Suites 4 & 3 (Vessel closure and BVS)
Gerry Millea Q1, 2015 1.7 Lighting: Implement motion sensor control for DES Suites 4 & 3 (Vessel closure and BVS)
Gerry Millea Q3, 2015 1.8 Lighting: complete feasibility study into change to LED light fittings. Gerry Millea Q2, 2015 1.9 Energy Awareness: complete energy awareness communications plan for management review. Gerry Millea Q2, 2015 1.10 ECar Charging Point: Make final decision on provision of ECar charging point on site. Gerry Millea Q2, 2015 1.11 Equipment Switch Off – Complete investigation into potential for switching off production equipment at night and/or over the weekend.
Gerry Millea Q2, 2015
1.12 Investigate replacement of primary Chilled water pumps with Grunfoss energy efficient control unit
John Fox Q3, 2015 1.13 Investigate installation of high efficiency water softener. Gerry Millea Q3, 2015 1.14 Investigate Chilled water and LTHW secondary system flow regulation adjustments Gerry Millea Q3, 2015 1.15 Investigate Chilled water flows and pump speeds to be adjusted to reduce power and equalise
Gerry Millea Q3, 2015
1.16 Investigate Chiller Sensor calibrations. Gerry Millea Q3, 2015 1.17 Investigate Potable water pump set to be replaced with Grunfoss energy efficient control unit.
John Fox Q3, 2015
2015 Environmental Management Programme
SHE2062444 Rev G Page 41 of 43
31-March 2015 Annual Environmental Report 2014
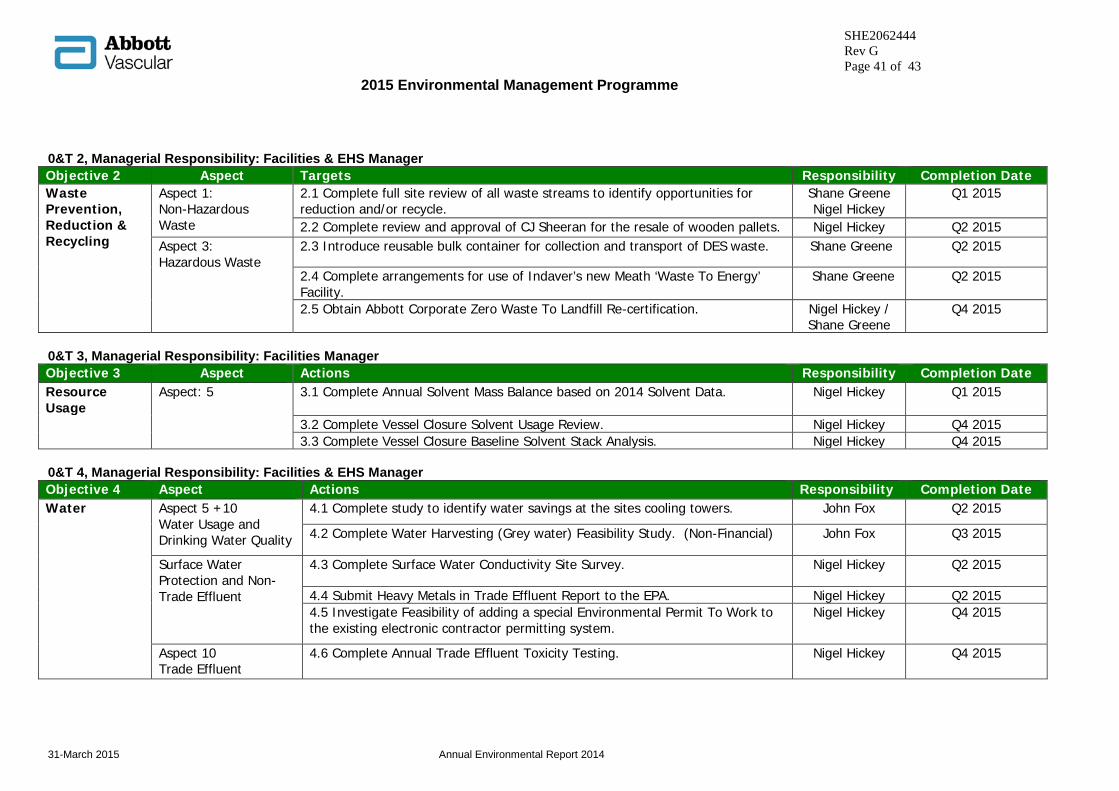
0&T 2, Managerial Responsibility: Facilities & EHS Manager Objective 2 Aspect Targets Responsibility Completion Date Waste Prevention, Reduction & Recycling
Aspect 1: Non-Hazardous Waste
2.1 Complete full site review of all waste streams to identify opportunities for reduction and/or recycle.
Shane Greene Nigel Hickey
Q1 2015
2.2 Complete review and approval of CJ Sheeran for the resale of wooden pallets. Nigel Hickey Q2 2015 Aspect 3: Hazardous Waste
2.3 Introduce reusable bulk container for collection and transport of DES waste. Shane Greene Q2 2015
2.4 Complete arrangements for use of Indaver’s new Meath ‘Waste To Energy’ Facility.
Shane Greene Q2 2015
2.5 Obtain Abbott Corporate Zero Waste To Landfill Re-certification. Nigel Hickey / Shane Greene
Q4 2015
0&T 3, Managerial Responsibility: Facilities Manager Objective 3 Aspect
Actions Responsibility Completion Date
Resource Usage
Aspect: 5 3.1 Complete Annual Solvent Mass Balance based on 2014 Solvent Data. Nigel Hickey Q1 2015
3.2 Complete Vessel Closure Solvent Usage Review. Nigel Hickey Q4 2015 3.3 Complete Vessel Closure Baseline Solvent Stack Analysis. Nigel Hickey Q4 2015 0&T 4, Managerial Responsibility: Facilities & EHS Manager Objective 4 Aspect
Actions Responsibility Completion Date
Water
Aspect 5 +10 Water Usage and Drinking Water Quality
4.1 Complete study to identify water savings at the sites cooling towers. John Fox Q2 2015
4.2 Complete Water Harvesting (Grey water) Feasibility Study. (Non-Financial) John Fox Q3 2015
Surface Water Protection and Non-Trade Effluent
4.3 Complete Surface Water Conductivity Site Survey. Nigel Hickey Q2 2015
4.4 Submit Heavy Metals in Trade Effluent Report to the EPA. Nigel Hickey Q2 2015 4.5 Investigate Feasibility of adding a special Environmental Permit To Work to the existing electronic contractor permitting system.
Nigel Hickey Q4 2015
Aspect 10 Trade Effluent
4.6 Complete Annual Trade Effluent Toxicity Testing. Nigel Hickey Q4 2015