abbott 2006 annual report - true cost of...
TRANSCRIPT

2006 Annual Report

1 Letter to Shareholders14 Medical Products16 Anatomy of a Growth Strategy: Abbott Vascular24 Nutritional Products26 Anatomy of a Growth Strategy: International Nutrition30 Pharmaceuticals32 Anatomy of a Growth Strategy: Humira 40 Advancing Access to Health Care42 Financial Report44 Consolidated Financial Statements and Notes62 Management Report on Internal Control Over Financial Reporting63 Reports of Independent Registered Public Accounting Firm64 Financial Instruments and Risk Management65 Financial Review74 Summary of Selected Financial Data75 Directors and Corporate Officers76 Shareholder and Corporate Information
On the cover: Antonio Brea Cárdenas • Spain • Xience V
After Antonio Brea Cárdenas suffered a heart attack, his doctors used Xience V, Abbott’s next-generation drug-eluting stent, to treat his arterial blockage.
Xience V was launched in Europe and Asia in 2006.
Abbott is a global, broad-based health care company that discovers, develops, manufactures and markets products that span the continuum of care – from prevention and diagnosis to treatment and cure. Abbott’s principal businesses include medical products, including devices, diagnostic tests and instruments, nutritional products for children and adults, and pharmaceuticals. Headquartered in north suburban Chicago, Abbott serves customers in more than 130 countries, with a staff of 65,000 at more than 100 manufacturing, distribution, research and development, and other locations.
Abbott 2006 Annual Report
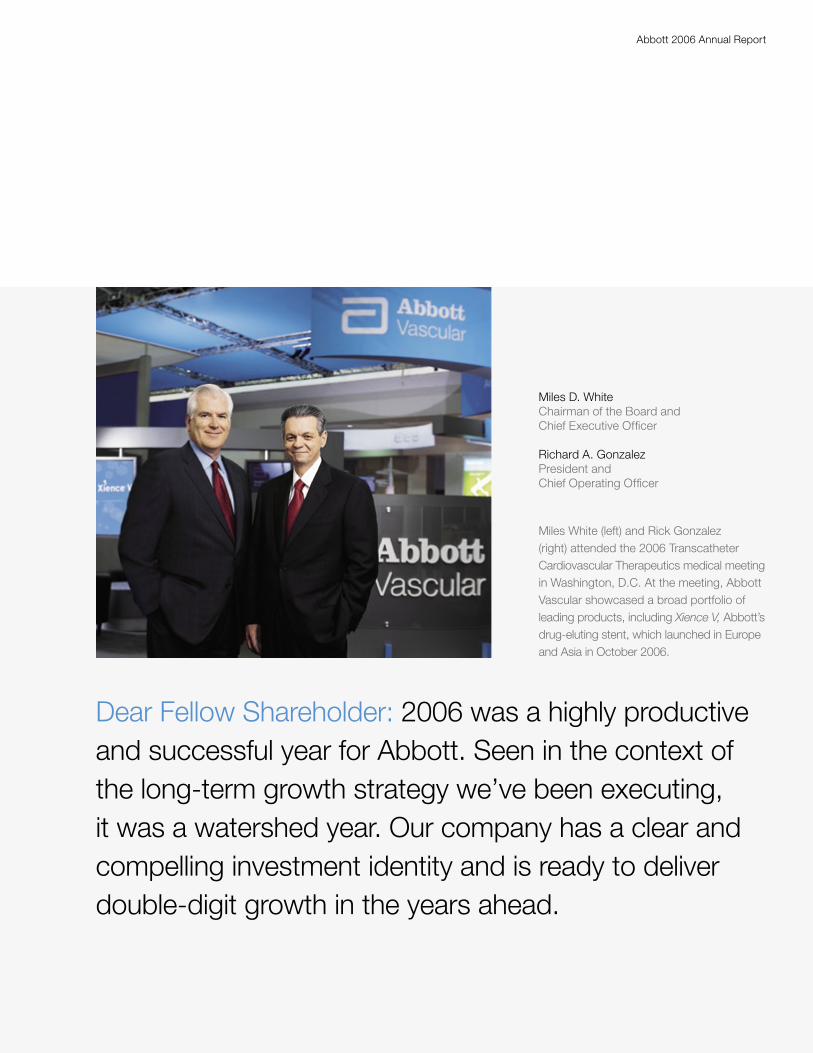
Miles D. WhiteChairman of the Board andChief Executive Officer
Richard A. GonzalezPresident andChief Operating Officer
Miles White (left) and Rick Gonzalez (right) attended the 2006 Transcatheter Cardiovascular Therapeutics medical meeting in Washington, D.C. At the meeting, AbbottVascular showcased a broad portfolio ofleading products, including Xience V, Abbott’s drug-eluting stent, which launched in Europe and Asia in October 2006.
Dear Fellow Shareholder: 2006 was a highly productive and successful year for Abbott. Seen in the context of the long-term growth strategy we’ve been executing, it was a watershed year. Our company has a clear and compelling investment identity and is ready to deliver double-digit growth in the years ahead.

Abbott 2006 Annual Report
Advancing Abbott: a strategic reshaping of our diversified business
1999 > Perclose acquisition Entering vascular care
2001 > Knoll Pharmaceuticals acquisition Adding biologics expertise and Humira
2004 > TheraSense acquisition Solidifying diabetes care leadership
2004 > Hospira spinoff Creating a new hospital products leader
2
For the past eight years, we’ve worked consistently not only to
ensure Abbott’s future, but also to elevate and accelerate it. Our
goal has been to make Abbott a more competitive company that
is capable of higher growth over the long term. As a result of our
strategic actions, Abbott is stronger today than it has been in
more than a decade.
We’ve worked steadily to make Abbott a company with a straight-
forward business model that can deliver sustained, high-quality
growth. To that end, we’ve built a richer mix of businesses that
compete in attractive markets where medical innovation wins and
where market leadership ensures a commensurate level of financial
return. Through this change process, we’ve amassed greater depth
within each of the major businesses that form our diverse frame-
work: medical products, nutritional products and pharmaceuticals.
The changes we’ve made over this period have significantly
strengthened Abbott’s core investment identity as a balanced,
broad-based health care company built for sustainable double-
digit earnings-per-share performance.
Medical Products
Our medical products business has undergone an almost
complete transformation over the past eight years. In 1999,
the elements of this business included our hospital products
business and our core laboratory diagnostics business.
We spun off the hospital products business as Hospira in 2004.
In the first quarter of 2007, we agreed to divest the core lab-
oratory diagnostics business to General Electric Co. (GE) for
$8.13 billion.
The sale of the core laboratory diagnostics business was
compelled by the steady changes in that market over the past
decade. Abbott Diagnostics grew when innovation in this
business was about developing the best new tests.
In the future, innovation in this segment will be driven by automa-
tion, system integration and a host of skills that GE can offer. As
part of GE, Abbott’s core laboratory diagnostics and point-of-care
businesses will be powerfully positioned to sustain and extend
their market success. This agreement did not include our other
diagnostics businesses, Diabetes Care and Molecular Diagnostics.
As with the spinoff of Hospira, this strategic move allows Abbott
to concentrate our attention and resources on what we do best:
high-growth businesses that are focused on continued innovation
for the patient.
These are precisely the kinds of businesses that Abbott has added
to its medical products portfolio over the past eight years, culmin-
ating with last year’s acquisition of the vascular and endovascular
businesses of the former Guidant Corp. This acquisition not only
propelled Abbott to the forefront of the vascular care business, but
it also fulfilled a strategy we’d pursued since we acquired Perclose
Inc. in 1999.
2000
Today’s Abbott: historical sales growth(dollars in billions)
2001 2002 2003 2004 2005 2006
1.6% 24.3% 11.0% 13.6% 13.7% 11.8% 12.6%
Sales excluding the announced divestiture of the diagnostics businesses and Boehringer Ingelheim products. For sales including these items see page 74.
$8.8$10.9
$12.1$13.7
$15.6$17.5
$19.7
Sales growth year over year

Abbott 2006 Annual Report
Abbott today: a portfolio of well- balanced, higher-
growth, technology-driven businesses
2006 > Abbott Nutrition International Targeting our efforts on emerging markets
2006 > Guidant vascular acquisition Propelling Abbott to the forefront of vascular care
2006 > Kos Pharmaceuticals acquisition Expanding our on-market presence and pipeline in lipid management
2007 > Core lab diagnostics divestiture Sharpening our focus on innovation-driven businesses
3
Our intention then was to achieve exactly the kind of position we
hold today. Our initial investments provided us a foothold in one
of the largest and most attractive segments of health care. With
the addition of Guidant, we achieved the position we envisioned
at the outset.
Today, we’re the third largest player in the vascular care market.
We intend and expect to be a market leader in the years ahead.
We’re also the leading supplier of carotid stents and metallic
stents, and in October 2006 saw the launch in Europe and Asia
of a new drug-eluting stent, Xience V, which studies show may
be a significant advancement. We have the industry’s largest
vascular sales force, one of the largest and most productive
vascular research and development (R&D) organizations and a
rich new-product pipeline, including a breakthrough technology
that we think represents the future of this market: bioabsorbable
stents, which are designed to be naturally absorbed by the body.
The building of our vascular business perfectly exemplifies our
strategy: We identified a large market with great potential for
profitable growth, we entered it by acquiring a small company that
had developed superior new technology, and we deliberately and
methodically built a leader on that base. This is a model that works.
Nutritional Products
Our nutritional products business brings an altogether different
dimension to our portfolio. This business offers little risk relative
to its potential. In the United States, the nutrition market is largely
mature but offers room for innovative new products that have
relatively low research and regulatory hurdles.
Outside the United States, on the other hand, large, profitable
and fast-growing markets from China to Latin America are open-
ing up to the nutrition business. What we see in these emerging
economies is that as personal incomes improve, people want to
ensure superior nutrition for their children. That’s providing great
growth for core Abbott products such as Similac Advance, sales
of which grew nearly 70 percent last year in China and more than
20 percent throughout Latin America. In 2006, we launched
Abbott Nutrition International as a stand-alone division to capture
outstanding opportunities like these. We also globalized our
nutritional products supply chain and our R&D efforts to ensure
our ability to keep competing successfully in these emerging
growth markets.
Pharmaceuticals
In 2006, this business continued to be driven by the growth of
our leading brands: Kaletra, the world’s number-one HIV protease
inhibitor; Depakote, our neuroscience treatment for mania in
bipolar disorder, certain types of epilepsy and the prevention of
migraine headaches; TriCor, our medication for management of
triglycerides and cholesterol; and Humira, our flagship biologic
medication that became Abbott’s first $2 billion brand.
Humira came to Abbott through our acquisition of Knoll Pharma-
ceuticals in 2001. Last year, we took another large step to
maintain our internal balance and to ensure our near-term future
in this important business: our acquisition of Kos Pharmaceuticals
Inc. Kos significantly expands our franchise in lipid management.
At nearly $20 billion, it’s the largest pharmaceutical market and
an area of growing interest for us. Kos also complemented our
agreement with AstraZeneca PLC to coformulate its Crestor with
an Abbott compound to address total lipid control in a single pill.
Again, our strategy is to bring superior new technologies to
markets that reward innovation and offer opportunity for growth.
The excellent late-stage pipeline we acquired with Kos will help
maintain our new pharmaceutical product flow in the near term;
for the long term, we’re working to strengthen our R&D capability
to provide a sustainable pharmaceutical pipeline going forward.

4
Abbott 2006 Annual Report
Miles D. WhiteChairman of the Board and Chief Executive OfficerMarch 1, 2007
������������ ������� ��������������������� ������� ��������������������� ������� ���������
2004 2005 2006
$4.3
$5.0$5.3
Operating cash flow(dollars in billions)
2004 2005 2006
$1.04
$1.10
$1.18
Cash dividends per share(in dollars per share)
2004 2005 2006
$1.7 $1.8
$2.3
Research & development(dollars in billions)
Delivering Results
The proof of our growth strategy is in the results we’ve delivered
in recent years. In 2006, we continued to pay down debt, buy
back shares and increase our investment in R&D and commercial
infrastructure to support future growth. In October, the board of
directors authorized a new program to repurchase up to $2.5
billion of our common stock. Dividends increased for the 34th
consecutive year, allowing us to deliver a total return to share-
holders of 27 percent. And our operating cash flow grew to
a record $5.3 billion. We remain committed to improving our
gross margin to deliver even better results in the future.
A company’s success, of course, is a function and reflection
of the people who make it work. The 65,000 Abbott people around
the world performed with their customary skill and dedication to
our company and its purpose. And we continued to build our
management team to meet the shifting needs of the market and
our organization.
I’d also like to recognize the 12,000 people of the Abbott
Diagnostics and Abbott Point of Care divisions, who will be leaving
us to join GE. Diagnostics is a great and proud part of Abbott’s
history. These colleagues saw their business through changing
conditions to deliver market-leading growth in 2006. We thank
them for their many contributions and wish them all the best.
On the Move
As 2006 clearly demonstrated, Abbott is a company on the move.
Our accomplishments last year and the success of our long-term
strategy made 2006 one of the most satisfying years for me
personally since I became Abbott’s CEO, eight years ago.
As a result of the growth strategy we’ve executed, today’s Abbott
has the size and scope, the competitive desire and the ability to win
in the health care marketplace — and to do so despite the chal-
lenges in our business environment. We’re positioned to address
the needs of the next generation of patients and to help manage
the future of health care with breakthrough medical technologies.
Today’s Abbott is a uniquely well-balanced company, with leader-
ship positions in each of three great and essential businesses:
medical products, nutritional products and pharmaceuticals.
We’ve built a rich and varied portfolio to increase our range of
opportunities and limit risk to our overall performance. We’ve
strengthened that base with a heightened emphasis on techno-
logical innovation, developed both within and outside of Abbott.
Our work is never done, of course, and we remain highly ambi-
tious to pursue our growth strategy to still greater success ahead.
But in 2006, we made major strides toward advancing Abbott’s
business and its investment identity to the strong and promising
position we’ve desired and worked for over the years. Today, all
of our businesses match the high-performance profile we’ve built
toward and provide a strong and productive template for future
building and future growth. No other health care company today
is more ready than Abbott to deliver results for patients, for share-
holders and for all the people it serves.
5
LeadershipOur broad-based growth strategycreated an Abbott that is a leader inmany of the world’s most importantareas of medical need.
In 2006, we made changes to reshape and significantly strengthen the depth of each of our major businesses: medical products, nutritional products and pharmaceuticals.

6
Abbott 2006 Annual Report
Broad-Based and Balanced

7
Abbott 2006 Annual Report
Medical Products Nutritional Products Pharmaceuticals
Animal Health
Diabetes Care
Molecular Diagnostics
Spine
Vascular
Healthy Living
Medical Nutrition
Pediatric Nutrition
Anesthesia
Anti-infectives
Cardiovascular
Immunology
Metabolics
Neuroscience
Oncology
Pain Care
Renal Care
Virology
In 2006, we delivered strong financial results, reflecting theactions we’ve taken to build a portfolio of well-balanced,higher-growth, technology-driven businesses that deliverconsistent double-digit performance.

8
Abbott 2006 Annual Report
Market Presence and Potential
Serving customers in more than 130 countries, Abbott’s presence is as broad as the markets it serves.
With sales of more than $22 billion, Abbott’s broad product portfolio addresses critical needs across the $2 trillion health care market.
At the number-three position in the nearly $10 billion vascular care market, Abbott has the potential to become a leader with Xience V, a next-generation drug-eluting stent.

9
Abbott 2006 Annual Report
We have the potential to achieve leadership positions across a growing number of important areas — from vascular care to nutrition to cholesterol management — creating a strongfoundation for continued growth.
By 2030, 360 million people worldwide are expected to be living with diabetes – twice as many as today. Abbott is a leader in diabetes care, with the world’s smallest blood glucose meter, delivering rapid test results.
With $2 billion in annual sales just four years after approval, Humira shows great promise in treating several additional autoimmune diseases in the years to come.
Abbott nutritional products, such as Similac Advance for infants and Ensure for adults, are growing rapidly in emerging markets such as China, where sales increased more than 100 percent in 2006.
Abbott competes in the nearly $20 billion cholesterol market – the largest U.S. pharmaceutical market – with TriCor and Niaspan, and is developing three additional cholesterol compounds.
Abbott Molecular Diagnostics is one of the fastest- growing molecular businesses in a market that is expected to double with the mapping of the human genome now complete.
Represents Abbott’s major facilities worldwide.

10
Abbott 2006 Annual Report
Innovation and Impact
Abbott’s cutting-edge vascular product pipeline includes key development programs in next-generation drug-eluting stents.
Abbott scientists are developing new ways to manage diabetes better, diagnose diseases faster, preserve spine mobility and improve vascular care.
Diabetes CareIn diabetes care, we are developing new products that reduce the pain and incon-venience of blood glucose monitoring. This includes the FreeStyle Navigator Continuous Glucose Monitoring System, an investiga-tional device that is designed to measure glucose levels every minute to allow patients to monitor their diabetes more closely. Also in development is an all-in-one glucose monitoring system that combines a glucose meter, test strips and lancing capabilities in one device.
Molecular DiagnosticsIn diagnostics, we continue to make advancements in molecular testing, which have demonstrated advantages in detection, the selection of appropriate therapies and improved monitoring of disease progression. Included in our molecular diagnostics pipeline are real-time PCR (polymerase chain reaction) tests for infectious diseases and cancer.
SpineWe are committed to improving the stan-dard of care with product innovations that correct abnormal spinal curvatures, including scoliosis, and address problems caused by traumatic spine injury. Additional technologies in the pipeline, such as the Wallis System, address motion preservation and dynamic stabilization of the spine — areas that are the future of spine care.
VascularBeyond our drug-eluting stent, Xience V, we have a robust portfolio of cutting-edge vascular development programs. Abbott is developing next-generation drug-eluting stents to address more complex vascular disease. We are the first to develop and evaluate in clinical trials a fully bioabsorbable drug-eluting coronary stent. We are also studying the role of vulnerable plaque, which could help identify and treat at-risk patients before a heart attack occurs.
Based on real-time PCR (polymerase chain reaction) technology for disease detection and monitoring, the m2000, a fully automated system, represents the future of molecular diagnostics testing.

11
Abbott 2006 Annual Report
Abbott scientists are studying compounds that target neuronal nicotinic receptors, which regulate key neurological functions, such as pain, mood and memory.
An Abbott scientist uses state-of-the-art tools to measure cellular responses to compounds in drug discovery.
Combining small molecule and biologic capabilities with advancements in medical devices, we continue to strengthen our scientific expertise at Abbott. Our research and development of new technologies for patients remains the driving force behind Abbott’s success.
Abbott’s pharmaceutical research and development is dedicated to discovering new treatments in therapeutic areas, such as cardiovascular disease, immunology, oncology, neuroscience and pain care and infectious diseases.
CardiovascularWe are building on the success of our triglyceride-reducing fenofibrate, TriCor, with ABT-335, our next-generation fenofibrate, in late-stage trials. With AstraZeneca, we arecodeveloping a statin-fenofibrate combina-tion product with Crestor and TriCor or ABT-335 to target HDL, LDL and triglycerides. A new caplet formulation of Niaspan is under U.S. FDA review for primarily raising HDL, and we are working on a statin-combination opportunity with Niaspan called Simcor.
ImmunologyIn immunology, Abbott scientists continue to research and develop biologic treatments for autoimmune diseases. Humira continues in late-stage development for psoriasis, juvenile rheumatoid arthritis and ulcerative colitis. ABT-874 is a biologic being evaluated for psoriasis and Crohn’s disease.
OncologyIn our oncology pipeline, there are a number of breakthrough therapies being investi-gated to treat various forms of cancer. One in earlier stages, known as a Bcl-2 family inhibitor, is designed to kill tumors such as lymphomas. Another compound is designed to prevent DNA repair in cancer cells to stop the disease from progressing.
Neuroscience and Pain CareIn neuroscience and pain care, a controlled-release form of Vicodin is in Phase III development for moderate to moderately severe pain. Our scientists are also researching cutting-edge compounds for schizophrenia, Alzheimer’s disease, attention deficit hyperactivity disorder (ADHD) and pain.
Additional Therapies in DevelopmentFlutiform is in Phase III development for asthma. We are also conducting early-stage infectious disease research to develop protease inhibitors for hepatitis C. This builds on our foundation in HIV where Abbott scientists discovered the protease inhibitor Kaletra.

12
Abbott 2006 Annual Report
2006 Key Highlights
Created Abbott Nutrition International and later globalized our nutrition business to strengthen our international reach in rapidly growing markets, such as China, Southeast Asia and Latin America.
Received U.S. FDA clearance to market FreeStyle Freedom, an easy-to-read, easy-to-hold blood glucose meter, which offers virtually pain-free testing.
Acquired Guidant’s vascular business, which, combined with Abbott’s vascular business, created a leading vascular device company.
Launched Humira for ankylosing spondylitis, a form of arthritis affecting the spine and the third new indication for Humira.
Improved convenience with the U.S. launch of the Humira Pen, a one-touch device that offers patients an easier way to self-administer Humira at home just twice a month.
Q2Q1

13
Abbott 2006 Annual Report
2006 was a year in which we delivered strong performance and maintained leadership positions across our businesses, reaching a number of important milestones.
Submitted global regulatory applications for the approval of Humira for the treatment of Crohn’s disease.
Announced a collaboration with AstraZeneca to develop a fixed-dose combination lipid management therapy of Crestor and Abbott’s TriCor or ABT-335, our next- generation fenofibrate.
Launched Xience V, our next-generation drug- eluting stent, in Europe and Asia. Positive clinical results for Xience V demonstrated superiority to a leading drug-eluting stent, with respect to the study’s primary endpoint.
Acquired Kos Pharmaceuticals, broadening our presence in cholesterol management with HDL-raising Niaspan and expanding our mid- to late-stage pipeline.
Q3 Q4

14
Abbott 2006 Annual Report
MedicalProducts
Abbott is an innovative leader in the fast-paced, high-growth medical technology space. Abbott’s medical products are advancing disease diagnosis, diabetes management and the treatment of vascular disease and spinal disorders.
Diabetes Care
Precision Xtra, FreeStyle Flash and FreeStyle Freedom blood glucose meters offer fast test times and require tiny blood samples. Precision Xtra is a home-use meter that also measures blood ketone levels.
Spine
Ant-Cer, a dynamic cervical plate, is used in patients to stabilize the cervical spine. Its unique design allows natural compression forces to promote spinal fusion.
15
Abbott 2006 Annual Report
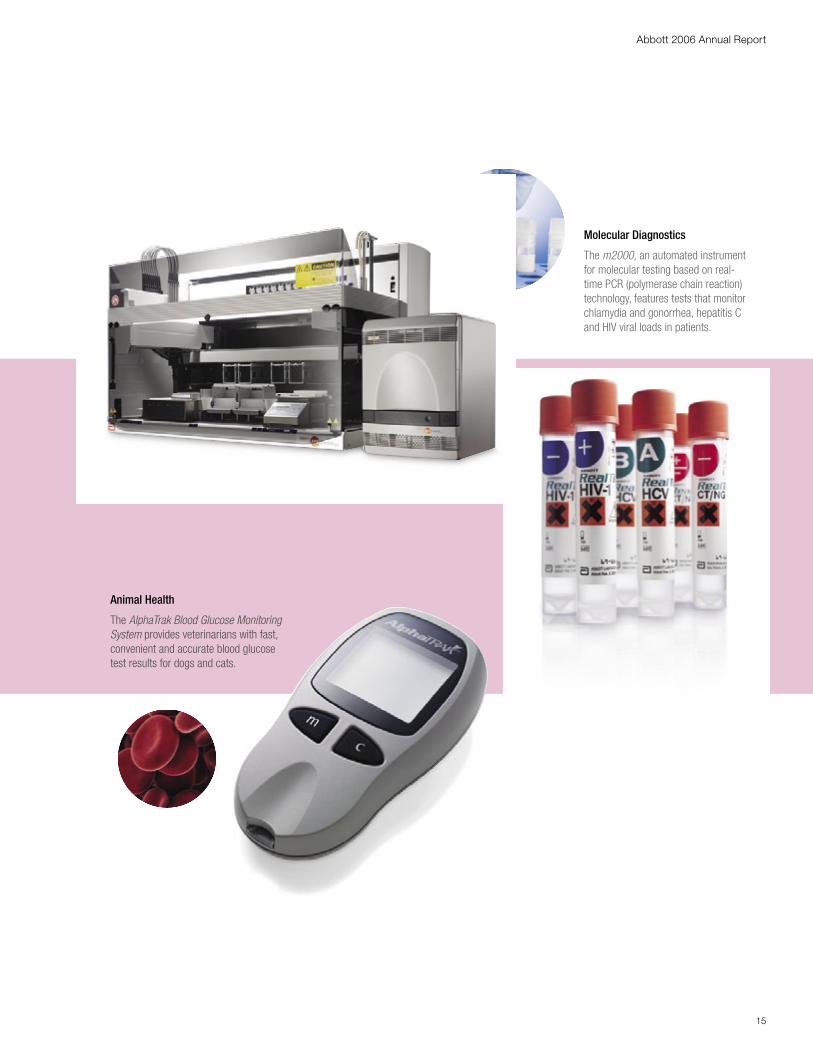
Molecular Diagnostics
The m2000, an automated instrument for molecular testing based on real-time PCR (polymerase chain reaction) technology, features tests that monitor chlamydia and gonorrhea, hepatitis C and HIV viral loads in patients.
Animal Health
The AlphaTrak Blood Glucose Monitoring System provides veterinarians with fast, convenient and accurate blood glucose test results for dogs and cats.

Medical Products
16
Abbott 2006 Annual Report
Abbott advanced to the forefront of vascular care with the acquisition of Guidant’s vascular business in 2006. The transaction significantly and immediately expanded our commercial, manufacturing, and research and development capabilities and built leadership positions across three distinct businesses — coronary, endovascular and vessel closure.
Anatomy of a growth strategy
Abbott Vascular
Xience Vdrug-eluting stent
17
Abbott 2006 Annual Report
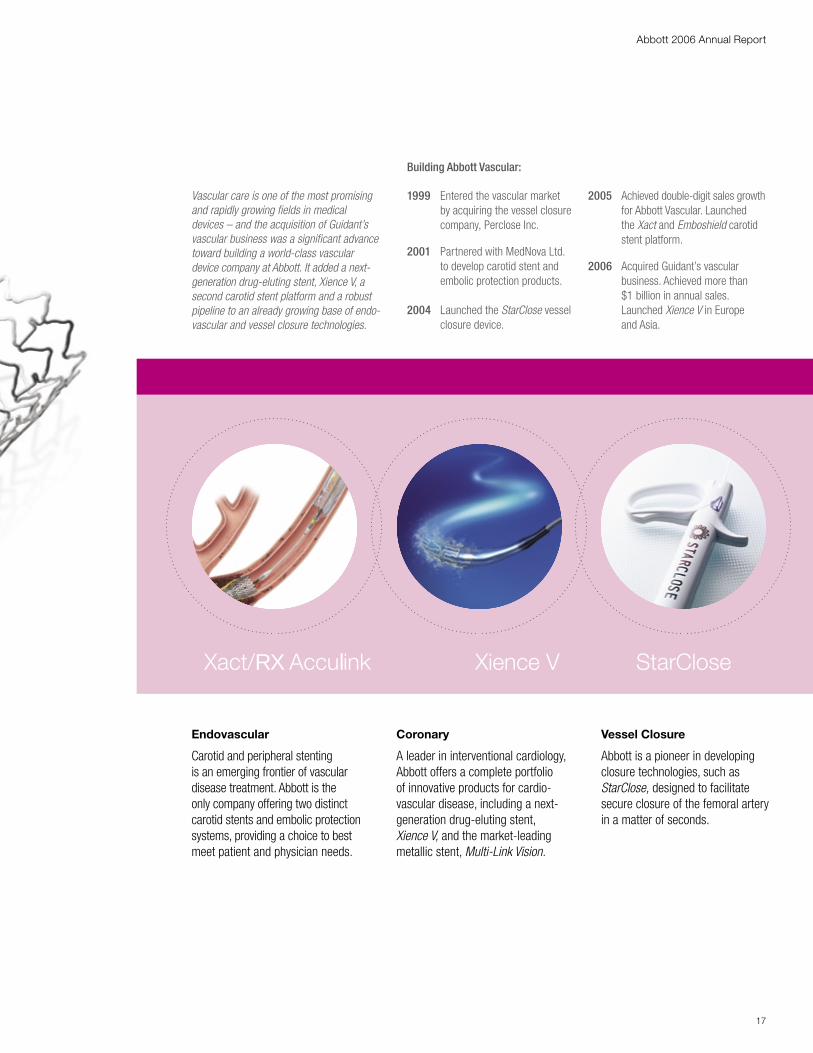
Xact/RX Acculink Xience V
Endovascular
Carotid and peripheral stenting is an emerging frontier of vascular disease treatment. Abbott is the only company offering two distinct carotid stents and embolic protection systems, providing a choice to best meet patient and physician needs.
Coronary
A leader in interventional cardiology, Abbott offers a complete portfolio of innovative products for cardio-vascular disease, including a next- generation drug-eluting stent, Xience V, and the market-leading metallic stent, Multi-Link Vision.
StarClose
Vessel Closure
Abbott is a pioneer in developing closure technologies, such as StarClose, designed to facilitate secure closure of the femoral artery in a matter of seconds.
1999 Entered the vascular market by acquiring the vessel closure company, Perclose Inc.
2001 Partnered with MedNova Ltd. to develop carotid stent and embolic protection products.
2004 Launched the StarClose vessel closure device.
2005 Achieved double-digit sales growth for Abbott Vascular. Launched the Xact and Emboshield carotid stent platform.
2006 Acquired Guidant’s vascular business. Achieved more than $1 billion in annual sales. Launched Xience V in Europe and Asia.
Vascular care is one of the most promising and rapidly growing fields in medical devices – and the acquisition of Guidant’s vascular business was a significant advance toward building a world-class vascular device company at Abbott. It added a next-generation drug-eluting stent, Xience V, a second carotid stent platform and a robust pipeline to an already growing base of endo-vascular and vessel closure technologies.
Building Abbott Vascular:


Abbott 2006 Annual Report
Medical Products: improving patient care with new technologies
In 2006, our medical products business introduced new products
and advanced a pipeline of promising technologies in key high-growth,
technology-driven markets. Most notably, we launched Xience V —
our next-generation drug-eluting stent to treat coronary artery disease —
in Europe and Asia.
Vascular: building a leader and expanding our presence
We increased our presence in the rapidly growing vascular marketplace
in 2006 with the acquisition of Guidant’s coronary and endovascular
businesses, significantly expanding our commercial, manufacturing, and
research and development (R&D) capabilities, and creating the world’s largest
vascular sales force. Guidant added a robust pipeline and a leading product
portfolio, featuring the Xience V Everolimus-Eluting Coronary Stent System,
the Multi-Link Vision metallic stent and a second carotid stent platform.
Drug-eluting stents are tiny metal scaffolds placed in diseased arteries
to keep them open and re-establish blood flow — a treatment alternative
to open-heart surgery. In our coronary business, we launched Xience V
in Europe and Asia. Currently an investigational device in the United States
and Japan, Xience V has been well-received by physicians outside of
the United States for its world-class deliverability, safety profile and
unprecedented efficacy. The results of a recent clinical trial demonstrated
the superiority of Xience V compared with a leading drug-eluting stent
with respect to the study’s primary endpoint. Xience V features the market-
leading Multi-Link Vision coronary stent platform and everolimus, a drug
shown to reduce tissue growth. Beyond Xience V, Abbott Vascular is
developing additional next-generation technologies, such as a bioabsorb-
able drug-eluting stent, which could address clinical challenges that still exist.
Abbott’s endovascular business offers a portfolio of carotid stents,
embolic protection devices, balloons and wires. In this emerging frontier of
vascular disease, Abbott is the only company that offers two carotid stent
platforms — providing physicians with a choice to better address patient
needs. Carotid stenting is a less-invasive alternative to surgery for patients
at risk of stroke from a partially blocked carotid artery, the major blood
vessel in the neck that supplies blood to the brain. The Xact and RX Acculink
stents are used with the Emboshield and RX Accunet embolic protection
devices to catch plaque (emboli) fragments that may be released during
the stenting procedure. Abbott continues to research carotid stenting to
expand access to more patients.
Abbott is a pioneer in closure technologies, offering products designed
to facilitate secure closure of the vascular access site following catheter-
izations. StarClose, our novel clip-based technology, closes the femoral
artery securely in a matter of seconds and continues to be well-received
by clinicians worldwide.
Jerry Mellott • Montana
After Jerry Mellott complained of neck pain, dizziness and blurred vision, his doctor used the RX Accunet embolic protection device and RX Acculink carotid stent to re-establish blood flow in his clogged carotid artery. With a reduced risk of stroke, Jerry’s enjoying nature in Montana.
19
Medical ProductsYear in Review
RX Acculink andRX Accunet

Abbott 2006 Annual Report
Diabetes Care: improving patient comfort and convenience
Abbott has established a leading position in the large and growing blood
glucose monitoring market by recognizing and reducing the discomfort
and inconvenience patients often experience with traditional finger-stick
testing. We continue to introduce systems that are easier to use, require
smaller blood samples and provide faster results.
In 2006, Abbott launched FreeStyle Freedom, an easy-to-read, easy-to-
hold blood glucose meter. FreeStyle Freedom features virtually pain-free
testing, using the world’s smallest blood sample size. It also offers a fast
five-second test time. Abbott also markets FreeStyle Flash (FreeStyle
Mini), the world’s smallest meter, and Precision Xtra (Precision Optium/
Xceed), a home-use meter that measures glucose and ketone levels.
We continue to update and refresh our current product lines to further
improve comfort and convenience for patients.
Looking to the future of blood glucose testing, two next-generation prod-
ucts in our pipeline have the potential to further enhance diabetes manage-
ment. The FreeStyle Navigator Continuous Glucose Monitoring System is
designed to measure glucose levels once per minute, 24 hours a day, using
a sensor worn on the body that wirelessly transmits readings to a pager-
like device kept in a pocket or purse. By supplying patients with more data
about their glucose levels, FreeStyle Navigator has the potential to improve
diabetes management. We are also developing a fully integrated blood
glucose monitoring system that combines a glucose meter, test strips and
lancing capabilities in one device, enabling simple point-and-click testing.
Molecular Diagnostics: building leadership by improving testing
Molecular diagnostics — the analysis of DNA, RNA and proteins at the
molecular level — is a relatively new and fast-growing market. Our instru-
ments and tests provide physicians with critical information based on
subtle changes in patients’ genes, allowing for earlier diagnosis, selection
of appropriate therapies and monitoring of disease progression.
Abbott’s product portfolio includes the m2000, a less labor-intensive,
automated instrument for molecular testing based on real-time PCR
(polymerase chain reaction) technology. In 2006, we expanded our test-
ing menu in Europe with a real-time PCR test for chlamydia and gonorrhea,
the two most common sexually transmitted diseases in the world. We plan
to launch a real-time PCR hepatitis B assay in 2007, expanding the m2000
system’s growing menu of tests and providing laboratories in Europe
a complete menu of infectious disease assays. We anticipate launching
the m2000 in the United States in 2007. We are also researching molecular
diagnostics for several types of cancer and expect to introduce new tests
for melanoma and cervical cancer in Europe in 2007.
20
Medical ProductsYear in Review
Rosa Rosen • New York
Diabetes doesn’t slow Rosa Rosen down. FreeStyle Freedom gives her an accurate reading of her blood glucose levels in just five seconds, allowing Rosa to spend more time working as a diabetes educator, teaching others about the disease.
FreeStyle Freedom


Abbott 2006 Annual Report
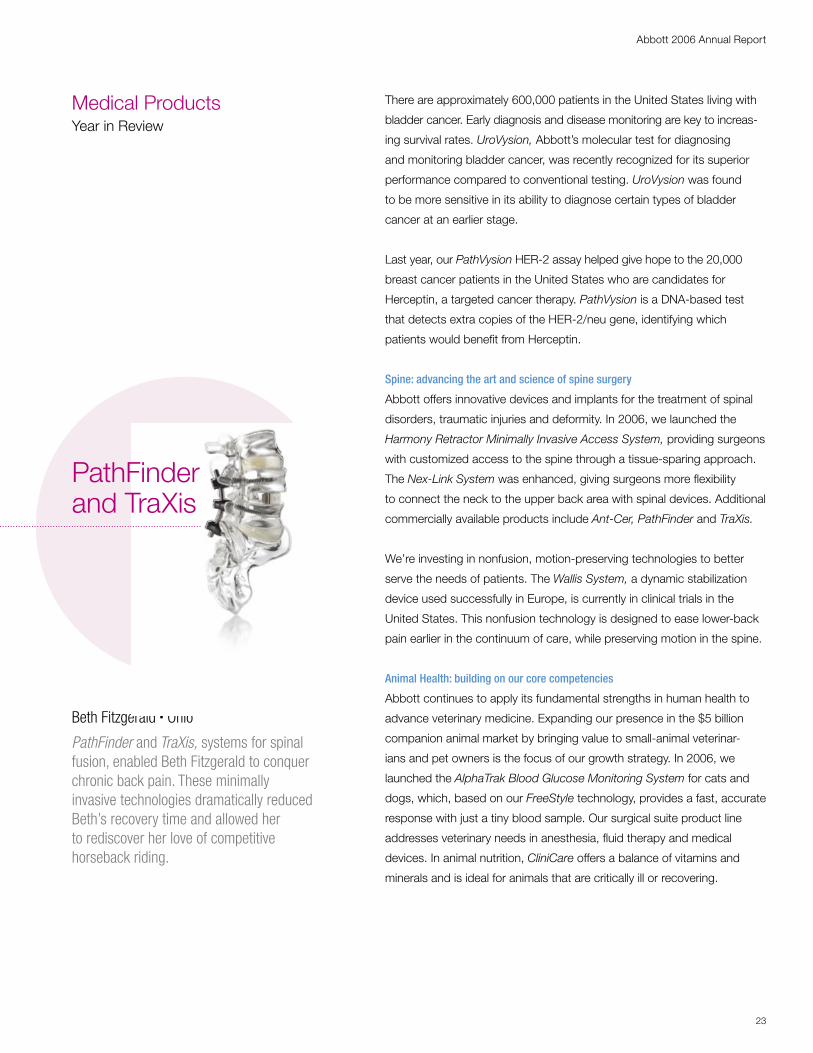
Beth Fitzgerald • Ohio
PathFinder and TraXis, systems for spinal fusion, enabled Beth Fitzgerald to conquer chronic back pain. These minimally invasive technologies dramatically reduced Beth’s recovery time and allowed her to rediscover her love of competitive horseback riding.
Medical ProductsYear in Review
There are approximately 600,000 patients in the United States living with
bladder cancer. Early diagnosis and disease monitoring are key to increas-
ing survival rates. UroVysion, Abbott’s molecular test for diagnosing
and monitoring bladder cancer, was recently recognized for its superior
performance compared to conventional testing. UroVysion was found
to be more sensitive in its ability to diagnose certain types of bladder
cancer at an earlier stage.
Last year, our PathVysion HER-2 assay helped give hope to the 20,000
breast cancer patients in the United States who are candidates for
Herceptin, a targeted cancer therapy. PathVysion is a DNA-based test
that detects extra copies of the HER-2/neu gene, identifying which
patients would benefit from Herceptin.
Spine: advancing the art and science of spine surgery
Abbott offers innovative devices and implants for the treatment of spinal
disorders, traumatic injuries and deformity. In 2006, we launched the
Harmony Retractor Minimally Invasive Access System, providing surgeons
with customized access to the spine through a tissue-sparing approach.
The Nex-Link System was enhanced, giving surgeons more flexibility
to connect the neck to the upper back area with spinal devices. Additional
commercially available products include Ant-Cer, PathFinder and TraXis.
We’re investing in nonfusion, motion-preserving technologies to better
serve the needs of patients. The Wallis System, a dynamic stabilization
device used successfully in Europe, is currently in clinical trials in the
United States. This nonfusion technology is designed to ease lower-back
pain earlier in the continuum of care, while preserving motion in the spine.
Animal Health: building on our core competencies
Abbott continues to apply its fundamental strengths in human health to
advance veterinary medicine. Expanding our presence in the $5 billion
companion animal market by bringing value to small-animal veterinar-
ians and pet owners is the focus of our growth strategy. In 2006, we
launched the AlphaTrak Blood Glucose Monitoring System for cats and
dogs, which, based on our FreeStyle technology, provides a fast, accurate
response with just a tiny blood sample. Our surgical suite product line
addresses veterinary needs in anesthesia, fluid therapy and medical
devices. In animal nutrition, CliniCare offers a balance of vitamins and
minerals and is ideal for animals that are critically ill or recovering.
23
PathFinderand TraXis

24
Abbott 2006 Annual Report
NutritionalProducts
Abbott offers some of the world’s most trusted brands of pediatric and healthy living nutritional products, including Similac Advance, Ensure and ZonePerfect. We also provide medical nutritional products for patients with special dietary needs due to injury or illness.
Abbott’s U.S. nutrition business offers infants and children a variety of nutritious products, found in retail stores across the country.
Healthy Living and Medical Nutrition
Healthy living and medical nutritional products include Ensure, ZonePerfect and Myoplex brands for healthy, active adults. Glucerna is specifically designed for people with diabetes.
Pediatric Nutrition
Pediatric nutrition includes a broad line of infant formula products, such as Similac Advance, as well as nutrition solutions for toddlers and children, such as NutriPals, Pedia-Sure and Gain Plus Advance.


26
Abbott 2006 Annual Report
Nutritional Products
In the world’s most rapidly growing economies, demand for high-quality nutritional products is rising at an unprecedented pace. To address this emerging need, Abbott created Abbott Nutrition International in 2006, which offers a broad portfolio of formulas, shakes and nutrition and energy bars to meet consumers’ needs at all stages of life.
Anatomy of a growth strategy
InternationalNutrition
27
Abbott 2006 Annual Report
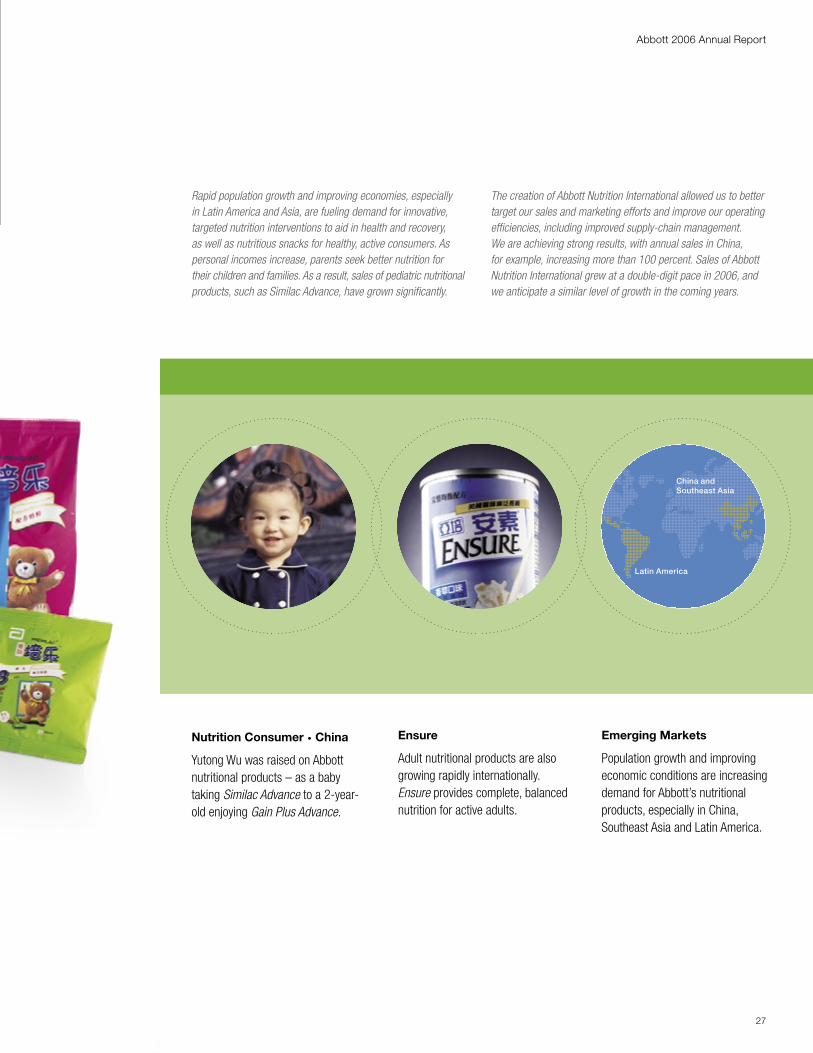
Latin America
Rapid population growth and improving economies, especially in Latin America and Asia, are fueling demand for innovative, targeted nutrition interventions to aid in health and recovery, as well as nutritious snacks for healthy, active consumers. As personal incomes increase, parents seek better nutrition for their children and families. As a result, sales of pediatric nutritional products, such as Similac Advance, have grown significantly.
The creation of Abbott Nutrition International allowed us to better target our sales and marketing efforts and improve our operating efficiencies, including improved supply-chain management. We are achieving strong results, with annual sales in China, for example, increasing more than 100 percent. Sales of Abbott Nutrition International grew at a double-digit pace in 2006, and we anticipate a similar level of growth in the coming years.
Nutrition Consumer • China
Yutong Wu was raised on Abbott nutritional products – as a baby taking Similac Advance to a 2-year-old enjoying Gain Plus Advance.
Ensure
Adult nutritional products are also growing rapidly internationally. Ensure provides complete, balanced nutrition for active adults.
Emerging Markets
Population growth and improving economic conditions are increasing demand for Abbott’s nutritional products, especially in China, Southeast Asia and Latin America.
China and Southeast Asia


29
Abbott 2006 Annual Report
Yutong Wu • China
Abbott nutritional products have been an important part of Yutong Wu’s life. Similac Advance, Premilac and Gain Plus Advance have helped her develop, grow and prepare for nursery school.
Pediatric Nutrition
Nutritional ProductsYear in Review
Nutritional Products: strengthening our presence worldwide
In 2006, we launched our newest division, Abbott Nutrition International,
to concentrate our sales and marketing efforts on rapidly growing inter-
national markets for nutritional products, such as Latin America and Asia.
We also introduced new products in the United States, such as Similac
Organic infant formula and PediaSure NutriPals nutritious shakes and
snack bars.
International Nutrition: responding to a growing market need
With increased demand for nutritional products in countries with improving
economies and growing populations, such as China, Southeast Asia,
Mexico and Venezuela, Abbott created a new division to focus solely
on its international nutrition business. Abbott Nutrition International
ensures our nutritional products receive the focus and resources needed
to aggressively pursue existing and emerging growth opportunities
around the world. Sales of international nutritional products grew nearly
20 percent in 2006.
Later in the year, we globalized our nutritional business to realign product
R&D, improve operating efficiencies, target sales efforts and focus on
Abbott hallmark brands, such as Similac Advance, Gain Plus Advance
and Ensure. With better supply-chain management, we have been able
to leverage manufacturing efficiencies and distribute our products more
effectively. During the year, we began construction of a new manufactur-
ing facility in Singapore that will help ensure we meet the strong future
demand in Asia.
U.S. Nutrition: expanding our trusted brands
The multi-billion-dollar U.S. nutrition market is well-established, but there
is still significant opportunity to extend the reach of our well-known and
trusted consumer brands. Based on feedback from our customers, we
redesigned the packaging and labels for our infant nutritional products,
making it easier for parents to recognize.
We introduced Similac Organic, the first USDA-certified organic infant
formula from a major brand manufacturer. This new product delivers all the
nutritional benefits of Similac Advance, including DHA and ARA, nutrients
to help brain and eye development. We also launched PediaSure NutriPals
shakes and bars, nutritious snacks for active children. NutriPals bars con-
tain about twice the amount of protein and fiber of the leading bars children
eat, and NutriPals shakes have less sugar than the leading yogurt drinks.
We hold a leading position in the healthy living and medical nutrition
segment with products such as Ensure, ZonePerfect, Myoplex and
AdvantEdge for healthy, active adults, and Glucerna, which has been
specially formulated to help manage blood glucose for people with diabetes.
30
Abbott 2006 Annual Report
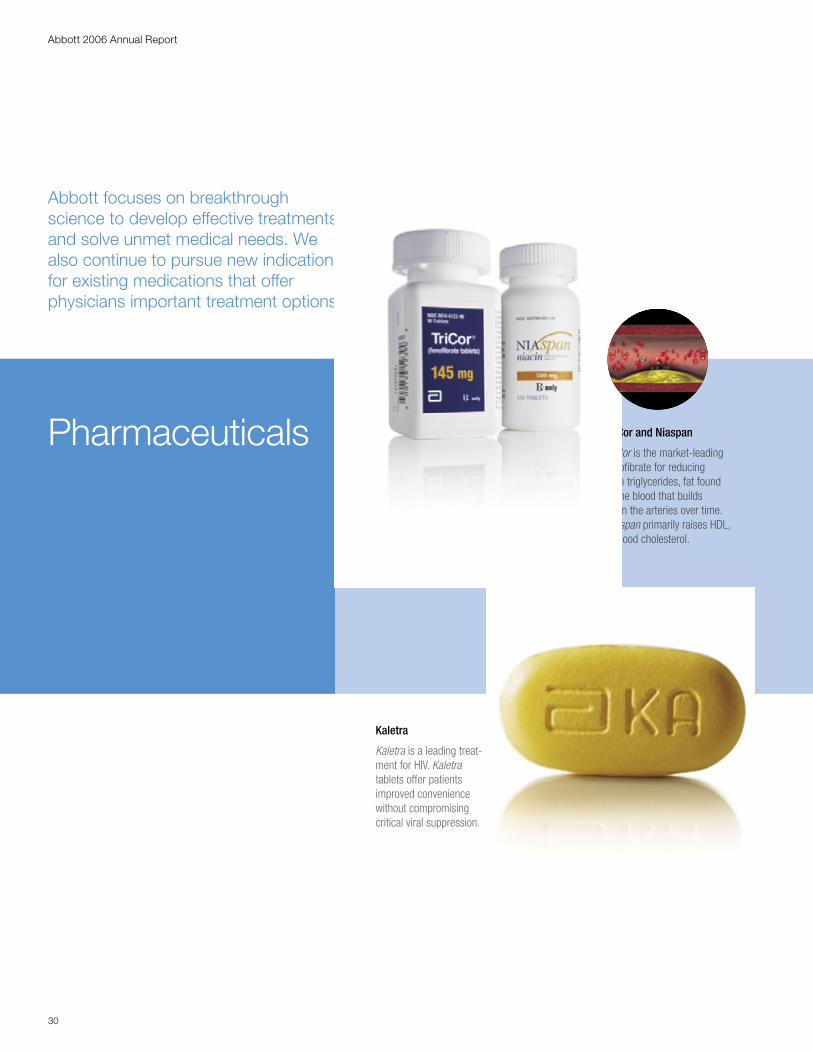
Pharmaceuticals
Abbott focuses on breakthrough science to develop effective treatments and solve unmet medical needs. We also continue to pursue new indications for existing medications that offer physicians important treatment options.
Kaletra
Kaletra is a leading treat-ment for HIV. Kaletra tablets offer patients improved convenience without compromising critical viral suppression.
TriCor and Niaspan
TriCor is the market-leading fenofibrate for reducing high triglycerides, fat found in the blood that builds up in the arteries over time. Niaspan primarily raises HDL, or good cholesterol.

31
Abbott 2006 Annual Report
Zemplar
Zemplar is a leading treatment for secondary hyperparathyroidism, a complication of chronic kidney disease. Zemplar is offered intravenously or in capsule form.
Synthroid
Synthroid is the number-one- prescribed treatment for thyroid disease, in conditions where the thyroid gland does not produce enough thyroid hormone.
Depakote ER
Depakote ER is a once-daily treatment for certain types of epilepsy, mania in bipolar disorder and the prevention of migraine headaches.
Omnicef
Omnicef, a great-tasting oral suspension antibiotic, is offered in a strawberry cream flavor children prefer.
Pharmaceuticals
32
Abbott 2006 Annual Report
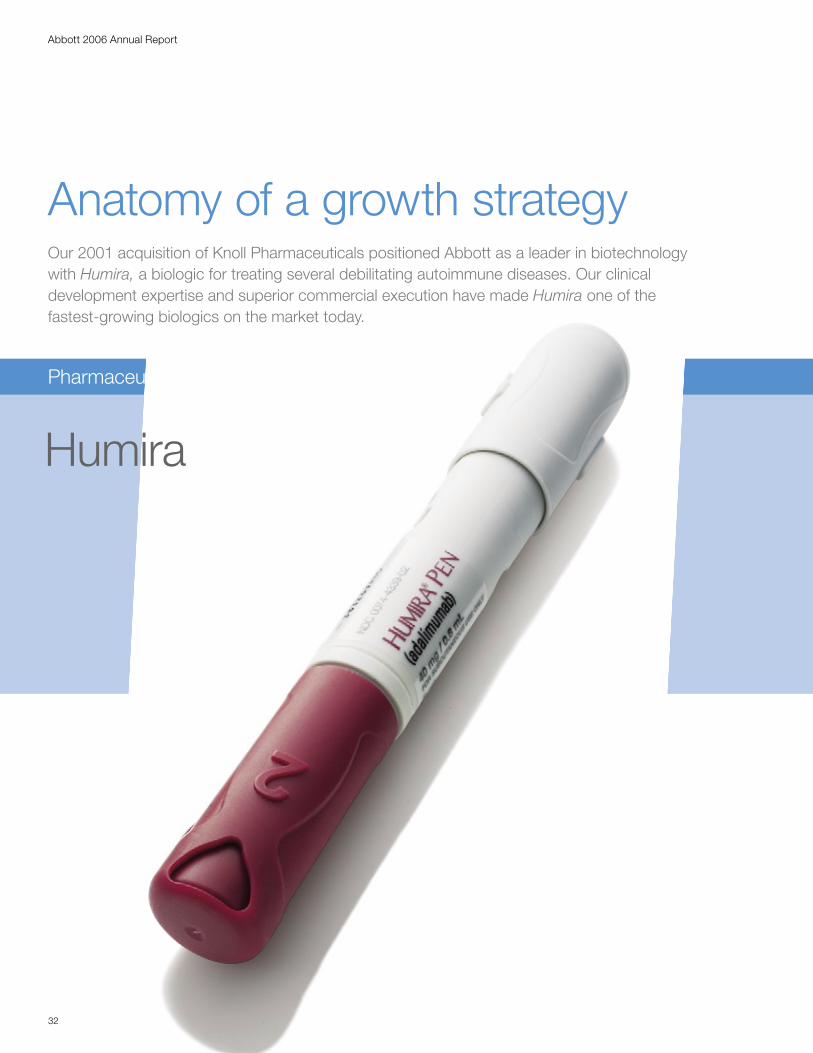
Our 2001 acquisition of Knoll Pharmaceuticals positioned Abbott as a leader in biotechnology with Humira, a biologic for treating several debilitating autoimmune diseases. Our clinical development expertise and superior commercial execution have made Humira one of the fastest-growing biologics on the market today.
Anatomy of a growth strategy
Humira

33
Abbott 2006 Annual Report
Marketed indications:
Rheumatoid arthritis Psoriatic arthritis Ankylosing spondylitis Crohn’s disease
Additional indications in development:
Psoriasis Juvenile rheumatoid
arthritis Ulcerative colitis
Humira blocks a protein called tumor necrosis factor (TNF), which plays a key role in causing inflammation. Excess TNF is associated with the progression of autoimmune diseases, such as RA.
Multipletreatments in 1
Humira represents a pipeline within a product, with the potential to treat multiple autoimmune diseases. It is currently marketed for rheumatoid arthritis (RA), psoriatic arthritis, ankylosing spondylitis (AS) and Crohn’s disease. Since its launch in 2003, Humira has grown to more than $2 billion in annual sales – Abbott’s largest brand ever. With three more indications in development, it will remain an important therapy for years to come.
2001 Acquired Knoll Pharmaceuticals, adding biologics expertise and Humira.
2002 Broke ground on a new state-of-the-art biologics manufacturing facility.
2003 Launched Humira for RA and continued clinical studies for additional indications.
2005 Launched Humira for psoriatic arthritis. Exceeded $1 billion in annual sales for the first time.
2006 Submitted Humira for the Crohn’s disease indication and launched it for AS. Exceeded $2 billion in annual sales.
2007 Launched Humira for Crohn’s disease in the United States.
Building a growth driver:


Abbott 2006 Annual Report
Peter Kahn • California
Years of pain from ankylosing spondylitis prevented Peter Kahn from participating in his favorite adventure sports. Following treatment with Humira, he’s able to resume his active, athletic lifestyle in Los Angeles.
Humira
PharmaceuticalsYear in Review
Pharmaceuticals: building a balanced portfolio
In 2006, we achieved several important milestones in our pharmaceutical
business, with several marketed products exceeding $1 billion in sales.
Humira, our biologic therapy, surpassed the $2 billion annual sales mark
with the launch of its third indication. Expanding our presence in the large
and growing lipid management market, we acquired Kos Pharmaceuticals
Inc. and announced a strategic collaboration with AstraZeneca PLC for the
first statin and fenofibrate combination therapy.
Immunology: expanding treatment options
Humira is Abbott’s flagship biologic for the treatment of rheumatoid
arthritis (RA), psoriatic arthritis, ankylosing spondylitis and Crohn’s dis-
ease — autoimmune disorders in which a human protein, tumor necrosis
factor (TNF), plays a role in disease progression. Humira is a fully human
monoclonal antibody that blocks TNF, reducing inflammation.
In 2007, we launched our fourth Humira indication — Crohn’s disease —
in the United States and also plan to launch Humira for Crohn’s disease
outside of the United States in 2007. Crohn’s disease, a chronic inflammatory
disease of the intestines, is typically diagnosed before age 40. Humira
can be self-administered at home — important for a young and active
patient population. In addition, Humira is in development for ulcerative
colitis, inflammation of the large intestine.
In 2006, we launched Humira for ankylosing spondylitis, an inflammation of
the spine that can result in extreme physical limitation. Humira also treats
RA, a painful joint disease that afflicts more than 5 million people worldwide,
as well as psoriatic arthritis, which is characterized by arthritis and psoriatic
skin disease. In the United States, we improved patient convenience with
the launch of the Humira Pen, a one-touch, easy-to-grasp device that offers
patients an easier way to self-administer Humira.
Immunology Pipeline: advancing multiple medical uses
We made significant advances in developing Humira to treat three addi-
tional indications — psoriasis, juvenile RA and ulcerative colitis. Moderate
to severe psoriasis, characterized by very dry, cracked skin, afflicts 30
million people worldwide. In 2006, we presented data demonstrating the
superiority of Humira to the current standard of care. We expect to submit
a new drug application for psoriasis in 2007.
With a number of pipeline opportunities in a single well-established product,
Humira will continue to bring relief to thousands of people worldwide over
the next several years.
35

36
Abbott 2006 Annual Report
PharmaceuticalsYear in Review
Immunology Pipeline: developing biologics beyond Humira
In our late-stage immunology pipeline, ABT-874 is an investigational
biologic therapy designed to target and neutralize interleukin-12 (IL-12),
a protein that regulates inflammatory response. Phase II outcomes in
psoriasis have shown efficacy results that numerically exceed any Phase
II data available for any other agents. We anticipate initiating our Phase III
clinical program in psoriasis in 2007 and will continue Phase II develop-
ment of ABT-874 for Crohn’s disease.
Cardiovascular: broadening Abbott’s presence in lipid management
Two strategic actions in 2006 allowed us to significantly expand our
presence in the nearly $20 billion lipid management market. Our acquisition
of Kos Pharmaceuticals added the primarily HDL-raising product Niaspan
and several pipeline opportunities. We also initiated a collaboration with
AstraZeneca to develop the first statin and fenofibrate single-pill combina-
tion product to manage lipids. We now have in-house expertise and access
to products for the three major lipid parameters that contribute to cardio-
vascular disease: high triglycerides, low HDL (good cholesterol) and high
LDL (bad cholesterol).
In our cardiovascular pipeline, we are building on the success of TriCor
with ABT-335, our next-generation fenofibrate in late-stage trials. And,
through our collaboration with AstraZeneca, we are codeveloping a
single-pill, fixed-dose combination therapy of AstraZeneca’s Crestor
and either TriCor or ABT-335. We will select one of the two programs
in 2007 for development and commercialization. This combination
therapy would target the treatment of all three blood lipids.
Kos Pharmaceuticals: complementing our cardiovascular portfolio and pipeline
The Kos Pharmaceuticals acquisition complements our existing commercial
expertise, bringing Niaspan and Advicor to Abbott’s on-market product
portfolio. Niaspan, an extended-release prescription niacin product, is
especially effective in raising HDL. Advicor, a Niaspan and lovastatin com-
bination therapy, is for multiple lipid disorders. A new caplet formulation of
Niaspan is under U.S. FDA review, and Simcor, a fixed-dose combination
of Niaspan and simvastatin, is also in late-stage development.
Kos also broadens our R&D capabilities and pipeline. This includes Flutiform,
in Phase III development for asthma. The U.S. market for asthma drugs
exceeds $10 billion. Kos also brought us an innovative inhaled insulin
device in development, complementing our existing presence in the blood
glucose monitoring market.
Brendan Devlin • Illinois
Brendan Devlin, pictured with Aidan, his 5-year-old son, has low HDL (good cholesterol) and elevated triglycerides. His doctor prescribed TriCor to improve his overall lipid profile.
TriCor


39
Abbott 2006 Annual Report
Virology: improving patient convenience
Kaletra remains the world’s leading protease inhibitor for HIV treatment.
Today, HIV can be treated as a chronic disease, making long-term viral
suppression, tolerability and convenience important for patient success.
In 2006, following a successful U.S. launch, we introduced Kaletra tablets
in Europe. The new tablet formulation of Kaletra offers patients improved
convenience with a reduced pill count, no refrigeration requirements and
the option of being taken with or without food.
Abbott Science: growing promise for innovative therapies
We more than doubled our late-stage pipeline with the strategic actions
we took this year with Kos Pharmaceuticals and our collaboration with
AstraZeneca, as well as advanced a number of Humira indications. We
also moved forward several innovative compounds in pain management,
neurological diseases, oncology and infectious diseases.
More than 75 million Americans suffer from chronic or acute pain. Abbott
is developing a more convenient controlled-release form of our pain brand,
Vicodin, to provide a longer duration of pain relief for the management of
moderate to moderately severe pain. We also have compounds in early-
stage development for schizophrenia, Alzheimer’s disease, attention deficit
hyperactivity disorder (ADHD) and pain. This includes compounds that
target receptors in the brain called neuronal nicotinic receptors, which play
a role in regulating pain, mood, memory and other neurological functions.
Abbott scientists are also researching a number of cutting-edge treatments
to fight cancer. One, a Bcl-2 family inhibitor, is designed to restore apoptosis
(the natural process of cell death often inhibited in cancer cells) and kill
tumors, such as lymphomas and small cell lung carcinoma. Another
compound, a multitargeted kinase inhibitor, is designed to disrupt blood
flow to tumors, inhibiting the progression of cancer. Also in development
are PARP (Poly (ADP-ribose) polymerase) inhibitors, which prevent DNA
repair in cancer cells and stop the disease from progressing.
We are conducting early-stage research in infectious diseases, partner-
ing with Enanta Pharmaceuticals Inc. to develop protease inhibitors
for the treatment of hepatitis C, which affects more than 170 million
people worldwide.
TAP, our joint venture with Takeda Pharmaceutical Company Ltd., is
developing two compounds in its digestive disease pipeline: TAK-390MR,
in Phase III for the treatment of acid-related disorders, and ilaprazole, an
investigational proton pump inhibitor. TAP is continuing the development
of febuxostat, a treatment for patients with high serum uric acid levels
associated with gout, and is currently conducting an additional clinical trial.
PharmaceuticalsYear in Review
Diana Irazabal • South America
Kaletra tablets offer improved convenience for patients with HIV, with a reduced pill count and no refrigeration requirements, which help Diana to keep her busy schedule as an HIV educator.
Kaletra

40
Abbott 2006 Annual Report
Advancing Access to Health Care
Throughout our 118-year history, Abbott has been recognized for innovative solutions that have made a lasting impact on the lives of patients. Being a good citizen is an equally important part of who we are today and the type of company we plan to be for generations to come.
The Baylor College of Medicine — Abbott Fund Children’s Clinical Centre of Excellence — Malawi is the country’s first outpatient clinic dedicated to serving children and families living with HIV. Brian is one of many children receiving medical care at the center through a comprehensive program. To date, Abbott and Abbott Fund’s programs have assisted more than 600,000 children and families impacted by HIV/AIDS in the developing world.

41
Abbott 2006 Annual Report
A critical challenge of the global community is the expansion of affordable health care services and needed medicines, particularly for the poor and underserved. In 2006, we implemented several new programs to address health needs in the developing world.
Aluvia: creating broad access to our HIV medicines
Since 2001, Abbott has made our HIV medicines widely
available and among the lowest-priced protease inhibitors
in 69 countries, covering all of Africa and the world’s poor-
est countries. In 2006, we expanded access to Kaletra (also
known as Aluvia in developing countries) from 69 develop-
ing countries to 114 low- and low-middle-income developing
countries. Our program is designed to ensure long-term,
sustainable access to high-quality HIV medicines and includes:
• Sustainable pricing for governments, nongovernmental
organizations and public funders of HIV medicines in
developing countries;
• Broad registration of the new, nonrefrigerated Kaletra
tablet formulation throughout the world, including Africa,
Asia, Latin America and the Caribbean;
• Investment in additional manufacturing capacity to
meet demand for high-quality, second-line HIV
treatments; and
• Development of a pediatric low-dose Kaletra tablet
formulation to meet the treatment needs of HIV-positive
children worldwide.
Pediatric HIV/AIDS treatment in Malawi
Treating children with HIV/AIDS in the developing world is an
enormous challenge, particularly in Africa. Malawi is one
of the countries hardest hit by the HIV/AIDS pandemic, with
an estimated 83,000 children living with the disease.
In partnership with the Baylor College of Medicine and
the government of Malawi, we opened the Baylor College
of Medicine — Abbott Fund Children’s Clinical Centre of
Excellence — Malawi, the country’s first pediatric outpatient
clinic dedicated to the care and treatment of children living
with HIV. This clinic is already treating more than 1,100
children. The program will be expanded to include satellite
clinics throughout the country.
Improving pediatric health in Cambodia
War and civil unrest have left Cambodia with some of the worst
health statistics in Southeast Asia. UNICEF reports that 45
percent of Cambodian children are afflicted with moderate to
severe malnutrition, resulting in child mortality rates among the
highest in Southeast Asia.
Abbott Fund, Direct Relief International and the Angkor
Hospital for Children partnered to improve pediatric nutrition
in Cambodia through treatment, education and training
initiatives. Abbott donated nutritional products and antibiotics,
and Abbott Fund provided a grant to train health care workers,
fund local and regional educational workshops for parents
and furnish materials for the hospital’s family education initiative.
The product contributions and nutrition training will directly
benefit nearly 5,000 children and more than 3,000 mothers.
For a full report on Abbott’s global citizenship initiatives,
view our annual global citizenship report at www.abbott.com/
citizenship.

42
Abbott 2006 Annual Report
2006 Financial Report
Abbott

Abbott 2006 Annual Report
43
44 Consolidated Statement of Earnings
45 Consolidated Statement of Cash Flows
46 Consolidated Balance Sheet
48 Consolidated Statement of Shareholders’ Investment
49 Notes to Consolidated Financial Statements
62 Management Report on Internal Control Over Financial Reporting
63 Reports of Independent Registered Public Accounting Firm
64 Financial Instruments and Risk Management
65 Financial Review
74 Summary of Selected Financial Data
75 Directors and Corporate Officers
76 Shareholder and Corporate Information

Abbott 2006 Annual Report
44
Year Ended December 31 2006 2005 2004
Net Sales $22,476,322 $22,337,808 $19,680,016
Cost of products sold 9,815,147 10,641,111 8,884,157
Research and development 2,255,271 1,821,175 1,696,753
Acquired in-process and collaborations research and development 2,014,000 17,131 279,006
Selling, general and administrative 6,349,685 5,496,123 4,921,780
Total Operating Cost and Expenses 20,434,103 17,975,540 15,781,696
Operating Earnings 2,042,219 4,362,268 3,898,320
Net interest expense 292,347 153,662 149,087
(Income) from TAP Pharmaceutical Products Inc. joint venture (475,811) (441,388) (374,984)
Net foreign exchange (gain) loss 28,441 21,804 29,059
Other (income) expense, net (79,128) 8,270 (30,442)
Earnings from Continuing Operations Before Taxes 2,276,370 4,619,920 4,125,600
Taxes on Earnings from Continuing Operations 559,615 1,247,855 949,764
Earnings from Continuing Operations 1,716,755 3,372,065 3,175,836
Earnings from Discontinued Operations, net of taxes — — 60,015
Net Earnings $ 1,716,755 $ 3,372,065 $ 3,235,851
Basic Earnings Per Common Share —
Continuing Operations $ 1.12 $ 2.17 $ 2.03
Discontinued Operations — — 0.04
Net Earnings $ 1.12 $ 2.17 $ 2.07
Diluted Earnings Per Common Share —
Continuing Operations $ 1.12 $ 2.16 $ 2.02
Discontinued Operations — — 0.04
Net Earnings $ 1.12 $ 2.16 $ 2.06
Average Number of Common Shares Outstanding
Used for Basic Earnings Per Common Share 1,529,848 1,552,457 1,560,557
Dilutive Common Stock Options and Awards 6,876 11,646 10,054
Average Number of Common Shares Outstanding
Plus Dilutive Common Stock Options and Awards 1,536,724 1,564,103 1,570,611
Outstanding Common Stock Options Having No Dilutive Effect 23,567 22,469 44,005
The accompanying notes to consolidated financial statements are an integral part of this statement.
Consolidated Statement of Earnings(dollars and shares in thousands except per share data)

45
Abbott 2006 Annual Report
Year Ended December 31 2006 2005 2004
Cash Flow From (Used in) Operating Activities of Continuing Operations:
Net earnings $ 1,716,755 $ 3,372,065 $ 3,235,851
Less: Earnings from discontinued operations, net of taxes — — 60,015
Earnings from continuing operations 1,716,755 3,372,065 3,175,836
Adjustments to reconcile earnings from continuing operations
to net cash from operating activities of continuing operations —
Depreciation 983,485 868,808 840,591
Amortization of intangible assets 575,265 490,131 448,109
Share-based compensation 329,957 30,140 28,989
Acquired in-process research and development 1,927,300 17,131 279,006
Investing and financing (gains) losses, net 277,388 125,328 47,400
Trade receivables (101,781) (98,216) (588,575)
Inventories 104,653 (88,257) (285,328)
Prepaid expenses and other assets (283,455) (406,858) (431,436)
Trade accounts payable and other liabilities (183,203) 199,703 602,605
Income taxes (84,275) 537,429 188,826
Net Cash From Operating Activities of Continuing Operations 5,262,089 5,047,404 4,306,023
Cash Flow From (Used in) Investing Activities of Continuing Operations:
Acquisitions of businesses and technologies, net of cash acquired (7,923,163) (295,123) (2,327,821)
Investment in Boston Scientific common stock,
note receivable and derivative financial instruments (2,095,780) — —
Acquisitions of property and equipment (1,337,818) (1,207,493) (1,291,633)
Other purchases of investment securities (33,632) (15,670) (543,292)
Proceeds from sales of investment securities 18,476 783,599 224,923
Other (25,712) 14,600 14,433
Net Cash (Used in) Investing Activities of Continuing Operations (11,397,629) (720,087) (3,923,390)
Cash Flow From (Used in) Financing Activities of Continuing Operations:
Proceeds from (repayments of) commercial paper, net 5,004,000 (1,619,000) 813,000
Proceeds from issuance of long-term debt 4,000,000 1,851,013 1,500,000
Repayment of long-term debt (3,532,408) (150,000) (1,650,000)
Other borrowing transactions, net 179,225 90,820 142,998
Purchases of common shares (754,502) (1,302,314) (499,745)
Proceeds from stock options exercised, including income tax benefit 502,782 223,637 155,197
Dividends paid (1,777,170) (1,686,472) (1,599,770)
Net Cash From (Used in) Financing Activities of Continuing Operations 3,621,927 (2,592,316) (1,138,320)
Effect of exchange rate changes on cash and cash equivalents 73,966 (193,954) 184,271
Net cash provided by operating activities of discontinued operations
and cash (used in) from investing and financing activities of
$(59,088) and $700,000 in 2004, respectively 67,152 127,012 801,920
Net (Decrease) Increase in Cash and Cash Equivalents (2,372,495) 1,668,059 230,504
Cash and Cash Equivalents, Beginning of Year 2,893,687 1,225,628 995,124
Cash and Cash Equivalents, End of Year $ 521,192 $ 2,893,687 $ 1,225,628
The accompanying notes to consolidated financial statements are an integral part of this statement.
Consolidated Statement of Cash Flows(dollars in thousands)

Abbott 2006 Annual Report
46
December 31 2006 2005 2004
Assets
Current Assets:
Cash and cash equivalents $ 521,192 $ 2,893,687 $ 1,225,628
Investments 852,243 62,406 833,334
Trade receivables, less allowances of —
2006: $215,443; 2005: $203,683; 2004: $231,704 4,231,142 3,576,794 3,696,115
Inventories:
Finished products 1,338,349 1,203,557 1,488,939
Work in process 686,425 630,267 582,787
Materials 781,647 708,155 548,737
Total inventories 2,806,421 2,541,979 2,620,463
Deferred income taxes 1,716,916 1,248,569 1,031,746
Other prepaid expenses and receivables 1,153,969 932,691 1,080,143
Assets held for sale — 129,902 247,056
Total Current Assets 11,281,883 11,386,028 10,734,485
Investments 1,229,873 134,013 145,849
Property and Equipment, at Cost:
Land 488,342 370,949 338,428
Buildings 3,228,485 2,655,356 2,519,492
Equipment 9,947,503 8,813,517 8,681,655
Construction in progress 737,609 920,599 962,114
14,401,939 12,760,421 12,501,689
Less: accumulated depreciation and amortization 7,455,504 6,757,280 6,493,815
Net Property and Equipment 6,946,435 6,003,141 6,007,874
Intangible Assets, net of amortization 6,403,619 4,741,647 5,171,594
Goodwill 9,449,281 5,219,247 5,685,124
Deferred Income Taxes and Other Assets 867,081 1,624,201 952,929
Assets Held for Sale — 32,926 69,639
$36,178,172 $29,141,203 $28,767,494
The accompanying notes to consolidated financial statements are an integral part of this statement.
Consolidated Balance Sheet(dollars in thousands)
47
Abbott 2006 Annual Report
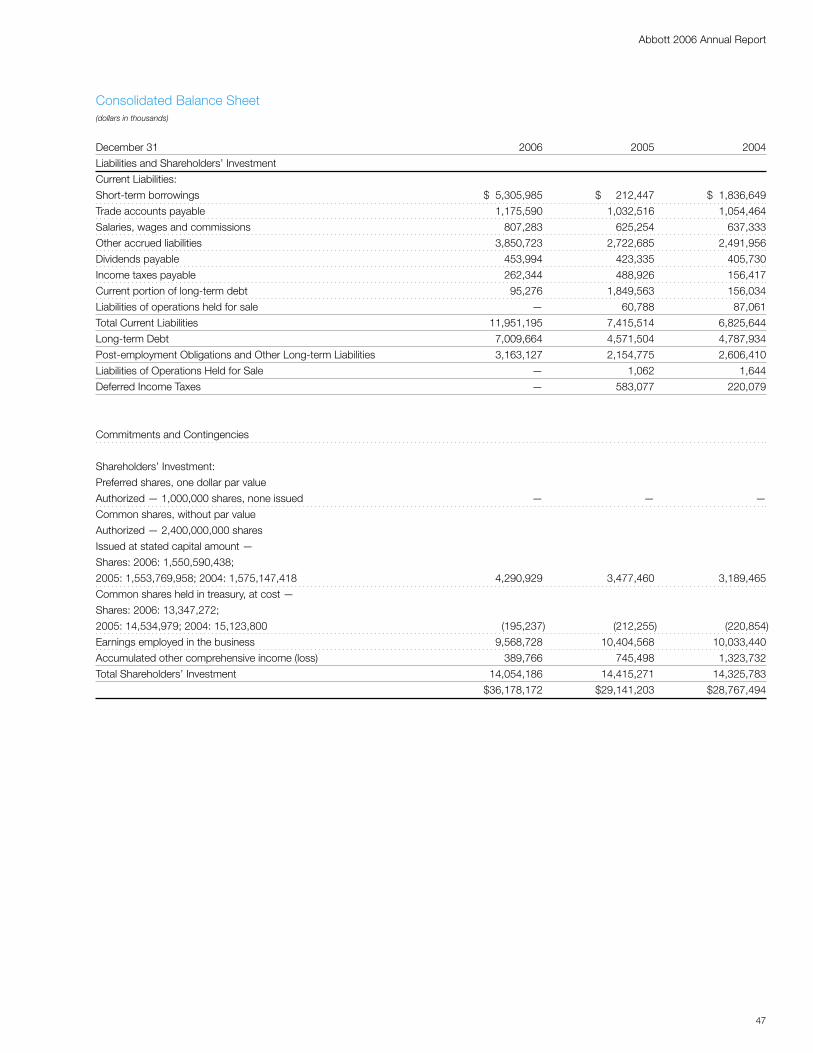
Consolidated Balance Sheet(dollars in thousands)
December 31 2006 2005 2004
Liabilities and Shareholders’ Investment
Current Liabilities:
Short-term borrowings $ 5,305,985 $ 212,447 $ 1,836,649
Trade accounts payable 1,175,590 1,032,516 1,054,464
Salaries, wages and commissions 807,283 625,254 637,333
Other accrued liabilities 3,850,723 2,722,685 2,491,956
Dividends payable 453,994 423,335 405,730
Income taxes payable 262,344 488,926 156,417
Current portion of long-term debt 95,276 1,849,563 156,034
Liabilities of operations held for sale — 60,788 87,061
Total Current Liabilities 11,951,195 7,415,514 6,825,644
Long-term Debt 7,009,664 4,571,504 4,787,934
Post-employment Obligations and Other Long-term Liabilities 3,163,127 2,154,775 2,606,410
Liabilities of Operations Held for Sale — 1,062 1,644
Deferred Income Taxes — 583,077 220,079
Commitments and Contingencies
Shareholders’ Investment:
Preferred shares, one dollar par value
Authorized — 1,000,000 shares, none issued — — —
Common shares, without par value
Authorized — 2,400,000,000 shares
Issued at stated capital amount —
Shares: 2006: 1,550,590,438;
2005: 1,553,769,958; 2004: 1,575,147,418 4,290,929 3,477,460 3,189,465
Common shares held in treasury, at cost —
Shares: 2006: 13,347,272;
2005: 14,534,979; 2004: 15,123,800 (195,237) (212,255) (220,854)
Earnings employed in the business 9,568,728 10,404,568 10,033,440
Accumulated other comprehensive income (loss) 389,766 745,498 1,323,732
Total Shareholders’ Investment 14,054,186 14,415,271 14,325,783
$36,178,172 $29,141,203 $28,767,494

Abbott 2006 Annual Report
48
Year Ended December 31 2006 2005 2004
Common Shares:
Beginning of Year
Shares: 2006: 1,553,769,958; 2005: 1,575,147,418; 2004: 1,580,247,227 $ 3,477,460 $ 3,189,465 $ 2,977,718
Issued under incentive stock programs
Shares: 2006: 14,456,341; 2005: 8,752,085; 2004: 6,811,550 526,435 299,329 208,880
Tax benefit from option shares and vesting of
restricted stock awards (no share effect) 42,062 52,363 22,871
Share-based compensation 337,428 28,731 28,725
Issuance of restricted stock awards (52,392) (27,125) (25,528)
Retired — Shares: 2006: 17,635,861; 2005: 30,129,545; 2004: 11,911,359 (40,064) (65,303) (23,201)
End of Year
Shares: 2006: 1,550,590,438; 2005: 1,553,769,958; 2004: 1,575,147,418 $ 4,290,929 $ 3,477,460 $ 3,189,465
Common Shares Held in Treasury:
Beginning of Year
Shares: 2006: 14,534,979; 2005: 15,123,800; 2004: 15,729,296 $ (212,255) $ (220,854) $ (229,696)
Issued under incentive stock programs
Shares: 2006: 1,197,838; 2005: 588,821; 2004: 605,496 17,492 8,599 8,842
Purchased
Shares: 2006: 10,131 (474) — —
End of Year
Shares: 2006: 13,347,272; 2005: 14,534,979; 2004: 15,123,800 $ (195,237) $ (212,255) $ (220,854)
Earnings Employed in the Business:
Beginning of Year $10,404,568 $10,033,440 $ 9,691,484
Net earnings 1,716,755 3,372,065 3,235,851
Cash dividends declared on common shares
(per share — 2006: $1.18; 2005: $1.10; 2004: $1.04) (1,807,829) (1,704,077) (1,622,148)
Spin-off of Hospira, Inc. — — (761,916)
Cost of common shares retired in excess of stated capital amount (780,152) (1,315,397) (527,197)
Cost of treasury shares issued below market value 35,386 18,537 17,366
End of Year $ 9,568,728 $10,404,568 $10,033,440
Accumulated Other Comprehensive Income (Loss):
Beginning of Year $ 745,498 $ 1,323,732 $ 632,752
Other comprehensive income (loss) and spin-off of Hospira, Inc. 898,266 (578,234) 690,980
End of Year, before adoption of new accounting standard 1,643,764 745,498 1,323,732
Adjustment to recognize net actuarial gain (loss)
and prior service cost as a component of accumulated
other comprehensive income (loss), net of tax (1,253,998) — —
End of Year $ 389,766 $ 745,498 $ 1,323,732
Comprehensive Income $ 2,615,021 $ 2,793,831 $ 3,906,932
The accompanying notes to consolidated financial statements are an integral part of this statement.
Consolidated Statement of Shareholders’ Investment(dollars in thousands except per share data)

49
Abbott 2006 Annual Report
Note 1 — Summary of Significant Accounting Policies
Nature of Business — Abbott’s principal business is the discovery, development, manufacture and sale of a broad line of health care products.
Concentration of Risk and Guarantees — Due to the nature of its operations, Abbott is not subject to significant concentration risks relating to customers, products or geographic locations, except that three U.S. wholesalers accounted for 23 percent, 24 percent and 20 percent of trade receivables as of December 31, 2006, 2005 and 2004, respectively. Product warranties are not significant.
Abbott has no material exposures to off-balance sheet arrangements; no special purpose entities; nor activities that include non-exchange-traded contracts accounted for at fair value, except the derivative financial instruments related to the investment in the Boston Scientific common stock and loan. Abbott has periodically entered into agree-ments in the ordinary course of business, such as assignment of product rights, with other companies which has resulted in Abbott becoming secondarily liable for obligations that Abbott was previously primarily liable. Since Abbott no longer maintains a business relation-ship with the other parties, Abbott is unable to develop an estimate of the maximum potential amount of future payments, if any, under these obligations. Based upon past experience, the likelihood of payments under these agreements is remote. Abbott periodically acquires small companies or product rights in which Abbott agrees to pay contingent consideration based on attaining certain thresholds. In connection with the spin-off of Hospira, Abbott has retained liabilities for taxes on income prior to the spin-off and certain potential liabilities, if any, related to alleged improper pricing practices in connection with federal, state and private reimbursement for certain drugs.
Basis of Consolidation — The consolidated financial statements include the accounts of the parent company and subsidiaries, after elimination of intercompany transactions. The accounts of foreign sub-sidiaries are consolidated as of November 30, due to the time needed to consolidate these subsidiaries. In December 2005, certain foreign subsidiaries borrowed approximately $1.4 billion. These borrowings and related interest expense have been reflected on the December 31, 2005 Consolidated Balance Sheet and 2005 Consolidated Statement of Earnings. No other events occurred related to these foreign subsid-iaries in December 2006, 2005 and 2004 that materially affected the financial position, results of operations or cash flows.
Use of Estimates — The financial statements have been prepared in accordance with generally accepted accounting principles in the United States and necessarily include amounts based on estimates and assumptions by management. Actual results could differ from those amounts. Significant estimates include amounts for sales rebates, income taxes, pension and other post-employment benefits, valuation of intangible assets, litigation, share-based compensation, derivative financial instruments, and inventory and accounts receivable exposures.
Revenue Recognition — Revenue from product sales is recognized upon passage of title and risk of loss to customers. Provisions for discounts, rebates and sales incentives to customers, and returns and other adjustments are provided for in the period the related sales are recorded. Sales incentives to customers are not material. Historical
data is readily available and reliable, and is used for estimating the amount of the reduction in gross sales. Revenue from the launch of a new product, from an improved version of an existing product, or for shipments in excess of a customer’s normal requirements are recorded when the conditions noted above are met. In those situations, management records a returns reserve for such revenue, if necessary. Sales of product rights for marketable products are recorded as revenue upon disposition of the rights. Revenue from license of product rights, or for performance of research or selling activities, is recorded over the periods earned.
Income Taxes — Deferred income taxes are provided for the tax effect of differences between the tax bases of assets and liabilities and their reported amounts in the financial statements at the enacted statutory rate to be in effect when the taxes are paid. U.S. income taxes are provided on those earnings of foreign subsidiaries which are intended to be remitted to the parent company. Except for taxes on dividends that were remitted under the American Jobs Creation Act of 2004, deferred income taxes are not provided on undistributed earnings reinvested indefinitely in foreign subsidiaries as working capital and plant and equipment. Loss contingency provisions are recorded for the estimated amount of audit settlements under the provisions of Statement of Financial Accounting Standards (SFAS) No. 5, “Accounting for Contingencies.”
Pension and Post-Employment Benefits — Abbott accrues for the actuarially determined cost of pension and post-employment benefits over the service attribution periods of the employees. Abbott must develop long-term assumptions, the most significant of which are the health care costs trend rate, discount rate and the expected return on plan assets. Differences between the expected long-term return on plan assets and the actual return are amortized over a five-year period. Actuarial losses and gains are amortized over the remaining service attribution periods of the employees under the corridor method. On December 31, 2006, Abbott adopted the provi-sions of SFAS No. 158, “Employers’ Accounting for Defined Benefit Pension and Other Postretirement Plans.” The new statement requires immediate recognition of the deferrals on the balance sheet with a corresponding charge to Accumulated other comprehensive income (loss). Adoption of this statement on December 31, 2006 resulted in a decrease in Abbott’s shareholders’ equity of approximately $1.3 billion.
Valuation of Intangible Assets — Purchased intangible assets are recorded at fair value. The fair value of significant purchased intangible assets is based on independent appraisals. Abbott uses a discounted cash flow model to value intangible assets. The discounted cash flow model requires assumptions about the timing and amount of future net cash inflows, risk, the cost of capital and terminal values. Intangible assets and goodwill are reviewed for impairment at least on a quarterly and annual basis, respectively.
Share-Based Compensation — Through December 31, 2005, Abbott measured compensation cost using the intrinsic value-based method of accounting for stock options and replacement stock options granted to employees. Restricted stock awards and units have been amortized over their vesting period with a charge to compensa-tion expense. In 2006, Abbott adopted SFAS No. 123 (revised 2004), “Share-Based Payment,” which requires that the fair value of stock options be recorded in the results of operations.
Notes to Consolidated Financial Statements
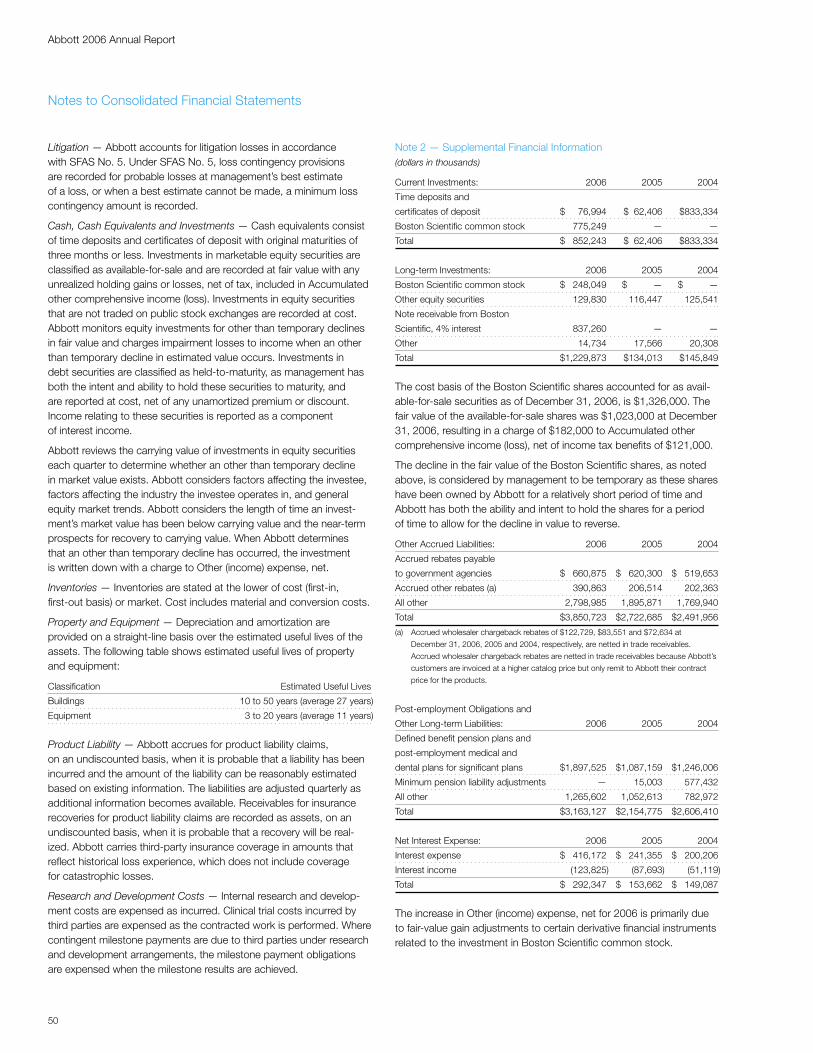
Abbott 2006 Annual Report
50
Litigation — Abbott accounts for litigation losses in accordance with SFAS No. 5. Under SFAS No. 5, loss contingency provisions are recorded for probable losses at management’s best estimate of a loss, or when a best estimate cannot be made, a minimum loss contingency amount is recorded.
Cash, Cash Equivalents and Investments — Cash equivalents consist of time deposits and certificates of deposit with original maturities of three months or less. Investments in marketable equity securities are classified as available-for-sale and are recorded at fair value with any unrealized holding gains or losses, net of tax, included in Accumulated other comprehensive income (loss). Investments in equity securities that are not traded on public stock exchanges are recorded at cost. Abbott monitors equity investments for other than temporary declines in fair value and charges impairment losses to income when an other than temporary decline in estimated value occurs. Investments in debt securities are classified as held-to-maturity, as management has both the intent and ability to hold these securities to maturity, and are reported at cost, net of any unamortized premium or discount. Income relating to these securities is reported as a component of interest income.
Abbott reviews the carrying value of investments in equity securities each quarter to determine whether an other than temporary decline in market value exists. Abbott considers factors affecting the investee, factors affecting the industry the investee operates in, and general equity market trends. Abbott considers the length of time an invest-ment’s market value has been below carrying value and the near-term prospects for recovery to carrying value. When Abbott determines that an other than temporary decline has occurred, the investment is written down with a charge to Other (income) expense, net.
Inventories — Inventories are stated at the lower of cost (first-in, first-out basis) or market. Cost includes material and conversion costs.
Property and Equipment — Depreciation and amortization are provided on a straight-line basis over the estimated useful lives of the assets. The following table shows estimated useful lives of property and equipment:
Classification Estimated Useful Lives
Buildings 10 to 50 years (average 27 years)
Equipment 3 to 20 years (average 11 years)
Product Liability — Abbott accrues for product liability claims, on an undiscounted basis, when it is probable that a liability has been incurred and the amount of the liability can be reasonably estimated based on existing information. The liabilities are adjusted quarterly as additional information becomes available. Receivables for insurance recoveries for product liability claims are recorded as assets, on an undiscounted basis, when it is probable that a recovery will be real-ized. Abbott carries third-party insurance coverage in amounts that reflect historical loss experience, which does not include coverage for catastrophic losses.
Research and Development Costs — Internal research and develop-ment costs are expensed as incurred. Clinical trial costs incurred by third parties are expensed as the contracted work is performed. Where contingent milestone payments are due to third parties under research and development arrangements, the milestone payment obligations are expensed when the milestone results are achieved.
Note 2 — Supplemental Financial Information(dollars in thousands)
Current Investments: 2006 2005 2004
Time deposits and
certificates of deposit $ 76,994 $ 62,406 $833,334
Boston Scientific common stock 775,249 — —
Total $ 852,243 $ 62,406 $833,334
Long-term Investments: 2006 2005 2004
Boston Scientific common stock $ 248,049 $ — $ —
Other equity securities 129,830 116,447 125,541
Note receivable from Boston
Scientific, 4% interest 837,260 — —
Other 14,734 17,566 20,308
Total $1,229,873 $134,013 $145,849
The cost basis of the Boston Scientific shares accounted for as avail-able-for-sale securities as of December 31, 2006, is $1,326,000. The fair value of the available-for-sale shares was $1,023,000 at December 31, 2006, resulting in a charge of $182,000 to Accumulated other comprehensive income (loss), net of income tax benefits of $121,000.
The decline in the fair value of the Boston Scientific shares, as noted above, is considered by management to be temporary as these shares have been owned by Abbott for a relatively short period of time and Abbott has both the ability and intent to hold the shares for a period of time to allow for the decline in value to reverse.
Other Accrued Liabilities: 2006 2005 2004
Accrued rebates payable
to government agencies $ 660,875 $ 620,300 $ 519,653
Accrued other rebates (a) 390,863 206,514 202,363
All other 2,798,985 1,895,871 1,769,940
Total $3,850,723 $2,722,685 $2,491,956
(a) Accrued wholesaler chargeback rebates of $122,729, $83,551 and $72,634 at
December 31, 2006, 2005 and 2004, respectively, are netted in trade receivables.
Accrued wholesaler chargeback rebates are netted in trade receivables because Abbott’s
customers are invoiced at a higher catalog price but only remit to Abbott their contract
price for the products.
Post-employment Obligations and
Other Long-term Liabilities: 2006 2005 2004
Defined benefit pension plans and
post-employment medical and
dental plans for significant plans $1,897,525 $1,087,159 $1,246,006
Minimum pension liability adjustments — 15,003 577,432
All other 1,265,602 1,052,613 782,972
Total $3,163,127 $2,154,775 $2,606,410
Net Interest Expense: 2006 2005 2004
Interest expense $ 416,172 $ 241,355 $ 200,206
Interest income (123,825) (87,693) (51,119)
Total $ 292,347 $ 153,662 $ 149,087
The increase in Other (income) expense, net for 2006 is primarily due to fair-value gain adjustments to certain derivative financial instruments related to the investment in Boston Scientific common stock.
Notes to Consolidated Financial Statements

51
Abbott 2006 Annual Report
Comprehensive Income, net of tax: 2006 2005 2004
Foreign currency gain (loss)
translation adjustments $1,033,968 $ (953,726) $ 861,139
Minimum pension liability adjustments,
net of taxes of $(3,600) in 2006,
$(199,100) in 2005 and $45,700 in 2004 5,361 346,172 (75,947)
Unrealized (losses) on marketable
equity securities, net of income taxes
of $(118,500), $(6,100) and $(29,100)
in 2006, 2005 and 2004, respectively (175,891) (9,219) (43,613)
Net adjustments for derivative
instruments designated as
cash flow hedges 36,659 38,574 (39,951)
Reclassification adjustments
for realized (gains) (1,831) (35) (30,547)
Other comprehensive income (loss) 898,266 (578,234) 671,081
Net Earnings 1,716,755 3,372,065 3,235,851
Comprehensive Income $2,615,021 $2,793,831 $3,906,932
Supplemental Comprehensive
Income Information, net of tax: 2006 2005 2004
Cumulative foreign currency
translation (gain) adjustments $(1,795,143) $(761,175) $(1,714,901)
Cumulative minimum pension
liability adjustments — 8,931 355,103
Net actuarial losses and prior
service cost and credits, net 1,257,568 — —
Cumulative unrealized losses (gains)
on marketable equity securities 169,275 (8,447) (17,701)
Cumulative (gains) losses on derivative
instruments designated as
cash flow hedges (21,466) 15,193 53,767
On December 31, 2006, Abbott adopted the provisions of SFAS No. 158 “Employers’ Accounting for Defined Benefit Pension and Other Postretirement Plans.” Adoption of this statement resulted in a decrease in Abbott’s shareholders’ equity of $1,257,568, net of taxes of approximately $733,000.
Supplemental Cash Flow Information: 2006 2005 2004
Income taxes paid $1,281,711 $746,504 $675,728
Interest paid 428,868 213,067 197,554
Note 3 — Financial Instruments and Derivatives
Certain Abbott foreign subsidiaries enter into foreign currency forward exchange contracts to manage exposures to changes in foreign exchange rates for anticipated intercompany purchases by those subsidiaries whose functional currencies are not the U.S. dollar. These contracts, totaling $768 million, $222 million and $984 million at December 31, 2006, 2005 and 2004, respectively, are designated as cash flow hedges of the variability of the cash flows due to changes in foreign exchange rates. Abbott records the contracts at fair value,
resulting in credits of $15.9 million and $38.6 million to Accumulated other comprehensive income (loss) in 2006 and 2005, respectively, and a charge of $40.0 million in 2004. Ineffectiveness recorded in 2006, 2005 or 2004 was not significant. Accumulated gains and losses as of December 31, 2006 will be included in Cost of products sold at the time the products are sold, generally through the next twelve months.
Abbott enters into foreign currency forward exchange contracts to manage currency exposures for foreign currency denominated third-party trade payables and receivables, and for intercompany loans and trade accounts payable where the receivable or payable is denominated in a currency other than the functional currency of the entity. For intercompany loans, the contracts require Abbott to sell or buy foreign currencies, primarily European currencies and Japanese yen, in exchange for primarily U.S. dollars and other European curren-cies. For intercompany and trade payables and receivables, the currency exposures are primarily the U.S. dollar, European currencies and Japanese yen. These contracts are recorded at fair value, with the resulting gains or losses reflected in income as Net foreign exchange (gain) loss. At December 31, 2006, 2005 and 2004, Abbott held $5.6 billion, $3.9 billion and $3.3 billion, respectively, of such foreign currency forward exchange contracts.
Abbott is a party to interest rate hedge contracts totaling $1.5 billion to manage its exposure to changes in the fair value of $1.5 billion of fixed-rate debt due 2009 through 2014. These contracts are desig-nated as fair value hedges of the variability of the fair value of fixed-rate debt due to changes in the long-term benchmark interest rates. The effect of the hedge is to change a fixed-rate interest obligation to a variable rate for that portion of the debt. Abbott records the contracts at fair value and adjusts the carrying amount of the fixed-rate debt by an offsetting amount. No hedge ineffectiveness was recorded in income in 2006, 2005 and 2004.
In connection with the acquisition of the common shares of Boston Scientific, Boston Scientific is entitled to certain after-tax gains upon Abbott’s sale of the common shares. In addition, Boston Scientific agreed to reimburse Abbott for certain borrowing costs on debt incurred to acquire the Boston Scientific shares.
Gross unrealized holding gains (losses) on available-for-sale equity securities totaled $21,100,000 and $(304,000,000), respectively, at December 31, 2006; $17,700,000 and $(3,500,000), respectively, at December 31, 2005 and $30,800,000 and $(1,100,000), respectively, at December 31, 2004.
The carrying values and fair values of certain financial instruments as of December 31 are shown in the table below. The carrying values of all other financial instruments approximate their estimated fair values. Fair value is the quoted market price of the instrument held or the quoted market price of a similar instrument. The counter parties to financial instruments consist of select major international financial institutions. Abbott does not expect any losses from nonperformance by these counter parties.
Notes to Consolidated Financial Statements
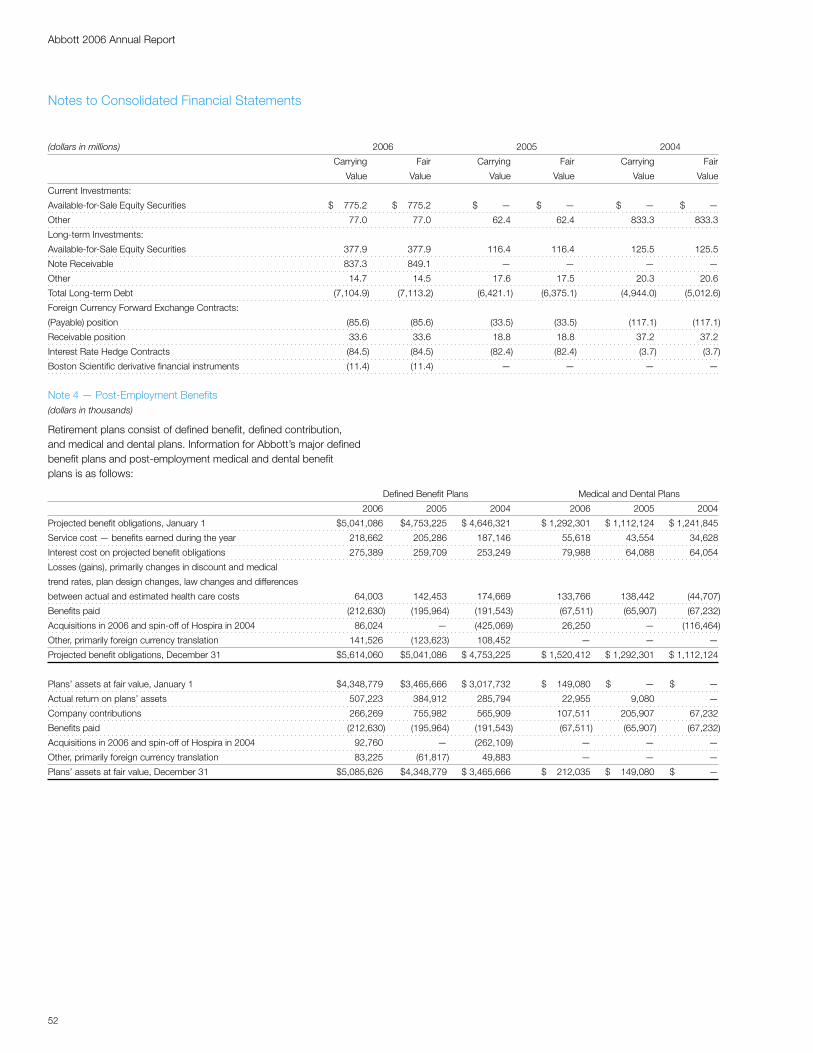
Abbott 2006 Annual Report
52
(dollars in millions) 2006 2005 2004
Carrying Fair Carrying Fair Carrying Fair
Value Value Value Value Value Value
Current Investments:
Available-for-Sale Equity Securities $ 775.2 $ 775.2 $ — $ — $ — $ —
Other 77.0 77.0 62.4 62.4 833.3 833.3
Long-term Investments:
Available-for-Sale Equity Securities 377.9 377.9 116.4 116.4 125.5 125.5
Note Receivable 837.3 849.1 — — — —
Other 14.7 14.5 17.6 17.5 20.3 20.6
Total Long-term Debt (7,104.9) (7,113.2) (6,421.1) (6,375.1) (4,944.0) (5,012.6)
Foreign Currency Forward Exchange Contracts:
(Payable) position (85.6) (85.6) (33.5) (33.5) (117.1) (117.1)
Receivable position 33.6 33.6 18.8 18.8 37.2 37.2
Interest Rate Hedge Contracts (84.5) (84.5) (82.4) (82.4) (3.7) (3.7)
Boston Scientific derivative financial instruments (11.4) (11.4) — — — —
Note 4 — Post-Employment Benefits(dollars in thousands)
Retirement plans consist of defined benefit, defined contribution, and medical and dental plans. Information for Abbott’s major defined benefit plans and post-employment medical and dental benefit plans is as follows:
Defined Benefit Plans Medical and Dental Plans
2006 2005 2004 2006 2005 2004
Projected benefit obligations, January 1 $5,041,086 $4,753,225 $ 4,646,321 $ 1,292,301 $ 1,112,124 $ 1,241,845
Service cost — benefits earned during the year 218,662 205,286 187,146 55,618 43,554 34,628
Interest cost on projected benefit obligations 275,389 259,709 253,249 79,988 64,088 64,054
Losses (gains), primarily changes in discount and medical
trend rates, plan design changes, law changes and differences
between actual and estimated health care costs 64,003 142,453 174,669 133,766 138,442 (44,707)
Benefits paid (212,630) (195,964) (191,543) (67,511) (65,907) (67,232)
Acquisitions in 2006 and spin-off of Hospira in 2004 86,024 — (425,069) 26,250 — (116,464)
Other, primarily foreign currency translation 141,526 (123,623) 108,452 — — —
Projected benefit obligations, December 31 $5,614,060 $5,041,086 $ 4,753,225 $ 1,520,412 $ 1,292,301 $ 1,112,124
Plans’ assets at fair value, January 1 $4,348,779 $3,465,666 $ 3,017,732 $ 149,080 $ — $ —
Actual return on plans’ assets 507,223 384,912 285,794 22,955 9,080 —
Company contributions 266,269 755,982 565,909 107,511 205,907 67,232
Benefits paid (212,630) (195,964) (191,543) (67,511) (65,907) (67,232)
Acquisitions in 2006 and spin-off of Hospira in 2004 92,760 — (262,109) — — —
Other, primarily foreign currency translation 83,225 (61,817) 49,883 — — —
Plans’ assets at fair value, December 31 $5,085,626 $4,348,779 $ 3,465,666 $ 212,035 $ 149,080 $ —
Notes to Consolidated Financial Statements

53
Abbott 2006 Annual Report
The pretax amount of actuarial losses and prior service cost (credits) included in Accumulated other comprehensive income (loss) at December 31, 2006, that is expected to be recognized in the net periodic benefit cost in 2007 is $80,900 and $3,300, respectively, for defined benefit pension plans and $48,500 and $(21,500), respec-tively, for medical and dental plans.
On December 31, 2006, Abbott adopted the provisions of SFAS No. 158, “Employers’ Accounting for Defined Benefit Pension and Other Postretirement Plans.” The provisions of this standard require the immediate recognition of deferrals on the balance sheet with a corresponding charge to Accumulated other comprehensive income (loss). The following table summarizes significant changes in balance sheet line items before and after the adoption of the provisions of this standard.
Balances Balances
Before After
Adoption of Adoption of
Balance Sheet Caption Standard Adjustments Standard
Deferred Income Taxes
and Other Assets $ 1,820,785 $ (953,704) $ 867,081
Post-employment Obligations and
Other Long-term Liabilities 2,450,643 712,484 3,163,127
Deferred income tax liabilities 366,655 (366,655) —
Accumulated Other
Comprehensive Income (loss) 1,643,764 (1,253,998) 389,766
Total Shareholders’ Investment 15,308,184 (1,253,998) 14,054,186
Total Assets and Total Liabilities
and Shareholders’ Investment 37,129,740 (951,568) 36,178,172
The projected benefit obligations for non-U.S. defined benefit plans was $1,483,000, $1,148,000 and $1,132,000 at December 31, 2006, 2005 and 2004, respectively. The accumulated benefit obligations for all defined benefit plans was $4,738,000, $4,158,000 and $3,954,000 at December 31, 2006, 2005 and 2004, respectively. For plans where the accumulated benefit obligations exceeded plan assets at December 31, 2006, 2005 and 2004, the aggregate accumulated
Notes to Consolidated Financial Statements
Defined Benefit Plans Medical and Dental Plans
2006 2005 2004 2006 2005 2004
Projected benefit obligations greater than
plans’ assets, December 31 $ (528,434) $ (692,307) $(1,287,559) $(1,308,377) $(1,143,221) $(1,112,124)
Unrecognized actuarial losses, net 1,501,409 1,494,915 697,717 587,976
Unrecognized prior service cost (credits) 5,004 (5,835) (264,499) (285,659)
Net prepaid (accrued) benefit cost $ 814,106 $ 201,521 $ (710,003) $ (809,807)
Long-term assets $ 84,266 $ —
Short-term liabilities (23,552) —
Long-term liabilities (589,148) (1,308,377)
Net liability $ (528,434) $(1,308,377)
Accrued benefit cost $ (463,789) $ (617,533) $ (710,003) $ (809,807)
Prepaid benefit cost 1,262,892 241,622 — —
Intangible assets 130 17,261 — —
Accumulated other comprehensive income (loss) 14,873 560,171 — —
Net prepaid (accrued) benefit cost $ 814,106 $ 201,521 $ (710,003) $ (809,807)
Amounts Recognized in Accumulated Other
Comprehensive Income (loss):
Actuarial losses, net $1,343,052 $ 785,778
Prior service cost (credits) 42,659 (248,947)
Total $1,385,711 $ 536,831
Service cost — benefits earned during the year $ 218,662 $ 205,286 $ 187,146 $ 55,618 $ 43,554 $ 34,628
Interest cost on projected benefit obligations 275,389 259,709 253,249 79,988 64,088 64,054
Expected return on plans’ assets (382,220) (360,304) (295,294) (16,253) (11,948) —
Amortization of actuarial losses 78,288 65,744 29,776 44,612 31,569 27,453
Amortization of prior service cost (credits) 341 68 1,033 (21,160) (21,160) (21,803)
Total cost 190,460 170,503 175,910 142,805 106,103 104,332
Discontinued operations — — (9,781) — — (14,349)
Net cost of continuing operations $ 190,460 $ 170,503 $ 166,129 $ 142,805 $ 106,103 $ 89,983
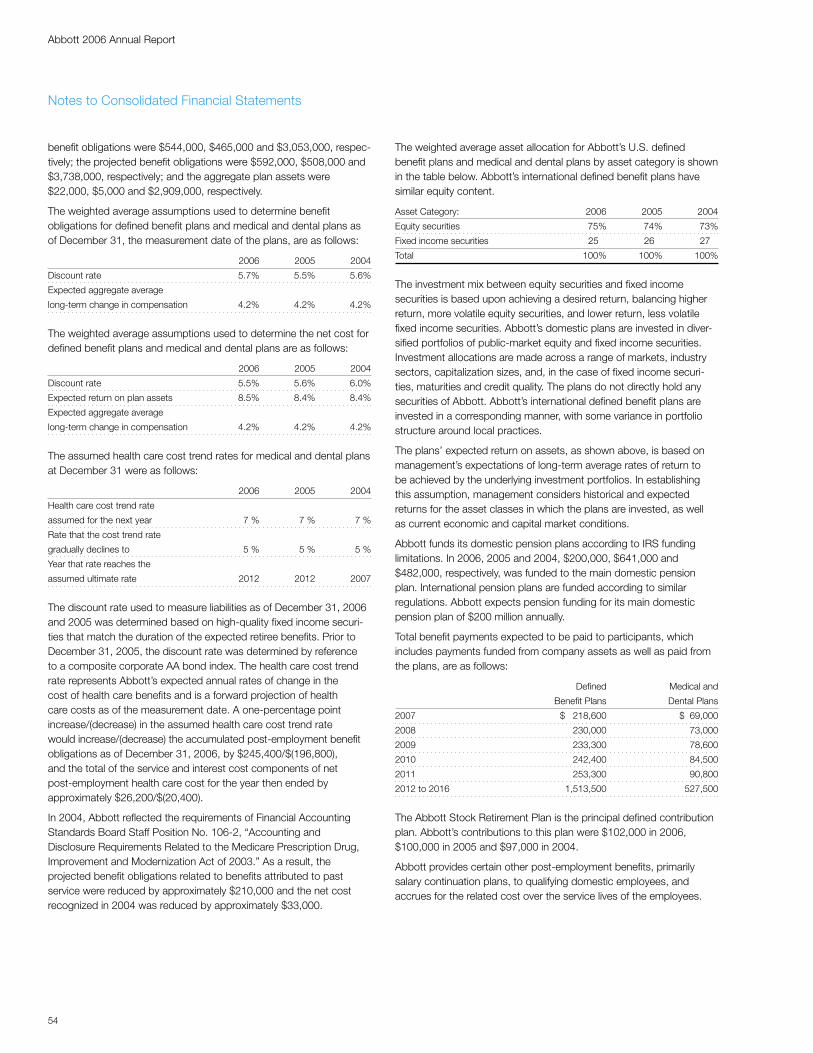
Abbott 2006 Annual Report
54
benefit obligations were $544,000, $465,000 and $3,053,000, respec-tively; the projected benefit obligations were $592,000, $508,000 and $3,738,000, respectively; and the aggregate plan assets were $22,000, $5,000 and $2,909,000, respectively.
The weighted average assumptions used to determine benefit obligations for defined benefit plans and medical and dental plans as of December 31, the measurement date of the plans, are as follows:
2006 2005 2004
Discount rate 5.7% 5.5% 5.6%
Expected aggregate average
long-term change in compensation 4.2% 4.2% 4.2%
The weighted average assumptions used to determine the net cost for defined benefit plans and medical and dental plans are as follows:
2006 2005 2004
Discount rate 5.5% 5.6% 6.0%
Expected return on plan assets 8.5% 8.4% 8.4%
Expected aggregate average
long-term change in compensation 4.2% 4.2% 4.2%
The assumed health care cost trend rates for medical and dental plans at December 31 were as follows:
2006 2005 2004
Health care cost trend rate
assumed for the next year 7 % 7 % 7 %
Rate that the cost trend rate
gradually declines to 5 % 5 % 5 %
Year that rate reaches the
assumed ultimate rate 2012 2012 2007
The discount rate used to measure liabilities as of December 31, 2006 and 2005 was determined based on high-quality fixed income securi-ties that match the duration of the expected retiree benefits. Prior to December 31, 2005, the discount rate was determined by reference to a composite corporate AA bond index. The health care cost trend rate represents Abbott’s expected annual rates of change in the cost of health care benefits and is a forward projection of health care costs as of the measurement date. A one-percentage point increase/(decrease) in the assumed health care cost trend rate would increase/(decrease) the accumulated post-employment benefit obligations as of December 31, 2006, by $245,400/$(196,800), and the total of the service and interest cost components of net post-employment health care cost for the year then ended by approximately $26,200/$(20,400).
In 2004, Abbott reflected the requirements of Financial Accounting Standards Board Staff Position No. 106-2, “Accounting and Disclosure Requirements Related to the Medicare Prescription Drug, Improvement and Modernization Act of 2003.” As a result, the projected benefit obligations related to benefits attributed to past service were reduced by approximately $210,000 and the net cost recognized in 2004 was reduced by approximately $33,000.
The weighted average asset allocation for Abbott’s U.S. defined benefit plans and medical and dental plans by asset category is shown in the table below. Abbott’s international defined benefit plans have similar equity content.
Asset Category: 2006 2005 2004
Equity securities 75% 74% 73%
Fixed income securities 25 26 27
Total 100% 100% 100%
The investment mix between equity securities and fixed income securities is based upon achieving a desired return, balancing higher return, more volatile equity securities, and lower return, less volatile fixed income securities. Abbott’s domestic plans are invested in diver-sified portfolios of public-market equity and fixed income securities. Investment allocations are made across a range of markets, industry sectors, capitalization sizes, and, in the case of fixed income securi-ties, maturities and credit quality. The plans do not directly hold any securities of Abbott. Abbott’s international defined benefit plans are invested in a corresponding manner, with some variance in portfolio structure around local practices.
The plans’ expected return on assets, as shown above, is based on management’s expectations of long-term average rates of return to be achieved by the underlying investment portfolios. In establishing this assumption, management considers historical and expected returns for the asset classes in which the plans are invested, as well as current economic and capital market conditions.
Abbott funds its domestic pension plans according to IRS funding limitations. In 2006, 2005 and 2004, $200,000, $641,000 and $482,000, respectively, was funded to the main domestic pension plan. International pension plans are funded according to similar regulations. Abbott expects pension funding for its main domestic pension plan of $200 million annually.
Total benefit payments expected to be paid to participants, which includes payments funded from company assets as well as paid from the plans, are as follows:
Defined Medical and
Benefit Plans Dental Plans
2007 $ 218,600 $ 69,000
2008 230,000 73,000
2009 233,300 78,600
2010 242,400 84,500
2011 253,300 90,800
2012 to 2016 1,513,500 527,500
The Abbott Stock Retirement Plan is the principal defined contribution plan. Abbott’s contributions to this plan were $102,000 in 2006, $100,000 in 2005 and $97,000 in 2004.
Abbott provides certain other post-employment benefits, primarily salary continuation plans, to qualifying domestic employees, and accrues for the related cost over the service lives of the employees.
Notes to Consolidated Financial Statements

55
Abbott 2006 Annual Report
Note 5 — Taxes on Earnings(dollars in thousands)
Deferred income taxes reflect the tax consequences on future years of differences between the tax bases of assets and liabilities and their financial reporting amounts. U.S. income taxes are provided on those earnings of foreign subsidiaries, which are intended to be remitted to the parent company. Except for taxes on dividends that were remitted under the American Jobs Creation Act of 2004, Abbott does not record deferred income taxes on earnings reinvested indefinitely in foreign subsidiaries. Undistributed earnings reinvested indefinitely in foreign subsidiaries as working capital and plant and equipment aggregated $7,319,000 at December 31, 2006. It is not practicable to determine the amount of deferred income taxes not provided on these earnings. Abbott has recorded reserves for income tax loss contingen-cies in accordance with SFAS No. 5. The maximum possible loss in excess of the recorded reserves is not material. In the U.S., Abbott’s federal income tax returns through 2003 are settled, and the income tax returns for years after 2003 are open.
Earnings from continuing operations before taxes, and the related provisions for taxes on earnings from continuing operations, were as follows:
Earnings From Continuing
Operations Before Taxes 2006 2005 2004
Domestic $ (868,384) $2,068,232 $2,278,180
Foreign 3,144,754 2,551,688 1,847,420
Total $2,276,370 $4,619,920 $4,125,600
Taxes on Earnings From
Continuing Operations 2006 2005 2004
Current:
U.S. Federal and Possessions $ 491,579 $ 526,213 $ 172,322
State 17,352 89,483 43,456
Foreign 633,947 616,118 461,740
Total current 1,142,878 1,231,814 677,518
Deferred:
Domestic (544,678) 4,709 295,030
Foreign (35,564) 17,035 (24,272)
Enacted tax rate changes (3,021) (5,703) 1,488
Total deferred (583,263) 16,041 272,246
Total $ 559,615 $1,247,855 $ 949,764
Differences between the effective income tax rate and the U.S. statutory tax rate were as follows:
2006 2005 2004
Statutory tax rate on earnings
from continuing operations 35.0% 35.0% 35.0%
Benefit of lower tax rates and
tax exemptions in Puerto Rico,
the Netherlands and Ireland (18.4) (6.4) (7.8)
Effect of taxes on remittances of
foreign earnings in connection with
the American Jobs Creation Act of 2004 — 5.3 —
Effect of nondeductible acquired
in-process research and development 19.4 — 2.0
State taxes, net of federal benefit 0.3 1.2 1.1
Adjustments primarily related
to resolution of prior years’
accrual requirements (5.8) (1.8) (3.6)
Domestic dividend exclusion (5.9) (2.7) (2.6)
All other, net — (3.6) (1.1)
Effective tax rate on earnings
from continuing operations 24.6% 27.0% 23.0%
As of December 31, 2006, 2005 and 2004, total deferred tax assets were $3,172,933, $2,040,906 and $2,171,782, respectively, and total deferred tax liabilities were $1,136,964, $1,355,181 and $1,349,972, respectively. Valuation allowances for deferred tax assets were not significant. The tax effect of the differences that give rise to deferred tax assets and liabilities were as follows:
2006 2005 2004
Compensation and employee benefits $ 921,313 $ 37,578 $ 247,885
Trade receivable reserves 236,218 227,251 223,507
Inventory reserves 163,004 161,934 129,052
Deferred intercompany profit 390,144 319,402 379,560
State income taxes 51,494 49,153 (7,336)
Depreciation (134,649) (157,272) (193,224)
Acquired in-process research and
development and other accruals and
reserves not currently deductible 1,268,445 1,132,954 1,111,611
Other, primarily the excess of
book basis over tax basis of
intangible assets (872,334) (1,095,182) (1,079,388)
Total $2,023,635 $ 675,818 $ 811,667
Among the provisions of the American Jobs Creation Act of 2004 was a provision that allows for the exclusion from income of a portion of the remittances of earnings of foreign subsidiaries to U.S. shareholders through December 31, 2005. In 2005, Abbott remitted in accordance with the provisions of the Act approximately $4,300,000 of foreign earnings previously reinvested indefinitely. The additional income tax expense recorded for the remittance was approximately $245,000.
Notes to Consolidated Financial Statements

Abbott 2006 Annual Report
56
Notes to Consolidated Financial Statements
Net Sales to Operating Depreciation Additions to
External Customers (a) Earnings (Loss) (a) and Amortization Long-term Assets Total Assets
2006 2005 2004 2006 2005 2004 2006 2005 2004 2006 2005 2004 2006 2005 2004
Pharmaceuticals (b) (c) $12,395 $13,691 $11,913 $4,522 $4,294 $3,889 $150 $170 $219 $2,615 $389 $317 $ 9,281 $ 6,766 $ 6,517
Diagnostics 3,979 3,756 3,378 431 495 378 277 231 201 435 425 399 4,073 3,742 3,691
Nutritionals 4,313 3,937 3,589 1,206 1,036 1,047 112 99 91 184 81 138 2,467 2,219 1,936
Vascular (c) 1,082 253 221 (115) (136) (104) 157 20 20 3,637 88 16 4,400 290 229
Total Reportable
Segments 21,769 21,637 19,101 $6,044 $5,689 $5,210 $696 $520 $531 $6,871 $983 $870 $20,221 $13,017 $12,373
Other 707 701 579
Net Sales $22,476 $22,338 $19,680
(a) Net sales and operating earnings for 2006 were unfavorably affected by the relatively stronger U.S. dollar and 2005 and 2004 were favorably affected by the relatively weaker U.S. dollar.
(b) The decrease in Pharmaceutical Product segment sales in 2006 is due primarily to the effects of the amendment to the Boehringer Ingelheim distribution agreement.
(c) Additions to long-term assets for the Pharmaceutical Products segment includes goodwill and intangible assets acquired in 2006 of $1,590 and $821, respectively, and the Vascular Products
segment includes goodwill and intangible assets acquired in 2006 of $1,688 and $1,195, respectively.
2006 2005 2004
Total Reportable Segment
Operating Earnings $6,044 $5,689 $5,210
Corporate functions and
benefit plans costs (d) 449 289 341
Non-reportable segments (6) 30 119
Net interest expense 292 154 149
Acquired in-process and collaborations
research and development 2,014 17 279
(Income) from TAP Pharmaceutical
Products Inc. joint venture (476) (441) (375)
Share-based compensation (e) 330 30 29
Other, net (f) 1,165 990 542
Consolidated Earnings from Continuing
Operations Before Taxes $2,276 $4,620 $4,126
(d) Corporate functions and benefit plans costs for 2006, includes a philanthropic
contribution of $70 to the Abbott Fund.
(e) Approximately 40 to 45 percent of the annual cost of share-based awards will typically be
recognized in the first quarter due to the timing of the granting of share-based awards.
(f) Other, net for 2006 includes $281 for restructuring plans as discussed in Note 14;
$220 for acquisition integration and related costs primarily associated with the acquisition
of Guidant’s vascular intervention and endovascular solutions businesses and income
of $91 from fair value adjustments to certain derivative financial instruments related to the
investment in Boston Scientific common stock and note receivable. Other, net for 2005
includes $266 for restructuring and impairment charges as discussed in Note 14.
Note 6 — Segment and Geographic Area Information(dollars in millions)
Revenue Segments — Abbott’s principal business is the discovery, development, manufacture and sale of a broad line of health care products. Abbott’s products are generally sold directly to retailers, wholesalers, hospitals, health care facilities, laboratories, physicians’ offices and government agencies throughout the world. Effective with the acquisition of Guidant’s vascular intervention and endovascular solutions businesses on April 21, 2006, Abbott’s base vascular busi-ness and Guidant’s vascular intervention and endovascular solutions businesses are reported as the Vascular Products segment. Effective January 1, 2006, Abbott’s segments were reorganized to reflect the shift of nutritional products from Abbott’s International division to a newly formed division, Abbott Nutrition International. For segment reporting purposes, Abbott’s Ross Products division and the Abbott Nutrition International division are aggregated and reported as the Nutritional Products segment and the U.S. and international pharma-ceutical products divisions are aggregated and reported as the Pharmaceutical Products segment. The segment information below has been adjusted to reflect the acquisitions and reorganizations. Abbott’s reportable segments are as follows:
Pharmaceutical Products — Worldwide sales of a broad line of pharmaceuticals. For segment reporting purposes, two pharmaceuti-cal divisions are aggregated and reported as the Pharmaceutical Products segment.
Diagnostic Products — Worldwide sales of diagnostic systems and tests for blood banks, hospitals, consumers, commercial laboratories and alternate-care testing sites. For segment reporting purposes, four diagnostic divisions are aggregated and reported as the Diagnostic Products segment.
Nutritional Products — Worldwide sales of a broad line of adult and pediatric nutritional products. For segment reporting purposes, two nutritional products divisions are aggregated and reported as the Nutritional Products segment.
Vascular Products — Worldwide sales of coronary, endovascular and vessel closure products.
Abbott’s underlying accounting records are maintained on a legal entity basis for government and public reporting requirements. Segment disclosures are on a performance basis consistent with inter-nal management reporting. Intersegment transfers of inventory are recorded at standard cost and are not a measure of segment operat-ing earnings. The cost of some corporate functions and the cost of certain employee benefits are charged to segments at predetermined rates that approximate cost. Remaining costs, if any, are not allocated to segments. For acquisitions prior to 2006, substantially all intangible assets and related amortization are not allocated to segments. The following segment information has been prepared in accordance with the internal accounting policies of Abbott, as described above, and are not presented in accordance with generally accepted accounting principles applied to the consolidated financial statements.

57
Abbott 2006 Annual Report
2006 2005 2004
Total Reportable Segment Assets $20,221 $13,017 $12,373
Cash and investments 2,603 3,090 2,205
Current deferred income taxes 1,717 1,249 1,032
Non-reportable segments 1,147 1,031 1,434
Assets held for sale to Hospira — 163 317
All other, net, primarily goodwill
and intangible assets not allocated
to reportable segments 10,490 10,591 11,406
Total Assets $36,178 $29,141 $28,767
Net Sales to
External Customers (g) Long-Term Assets
2006 2005 2004 2006 2005 2004
United States $11,995 $12,707 $11,242 $13,536 $ 7,717 $ 7,293
Japan 1,054 1,027 987 974 935 1,044
Germany 885 992 811 6,154 5,467 6,176
The Netherlands 1,061 899 705 185 156 146
Italy 848 806 745 256 211 234
Canada 762 680 595 74 68 68
France 696 657 587 131 92 94
Spain 583 542 513 283 232 275
United Kingdom 517 504 496 1,446 1,281 1,415
All Other Countries 4,075 3,524 2,999 1,857 1,596 1,288
Consolidated $22,476 $22,338 $19,680 $24,896 $17,755 $18,033
(g) Sales by country are based on the country that sold the product.
Note 7 — Litigation and Environmental Matters
Abbott has been identified as a potentially responsible party for investigation and cleanup costs at a number of locations in the United States and Puerto Rico under federal and state remediation laws and is investigating potential contamination at a number of company-owned locations. Abbott has recorded an estimated cleanup cost for each site for which management believes Abbott has a probable loss exposure. No individual site cleanup exposure is expected to exceed $3 million, and the aggregate cleanup exposure is not expected to exceed $15 million.
There are two patent disputes with third parties who claim Abbott’s products infringe their patents. In the first dispute, Abbott recorded the findings of a binding arbitration and paid the amount in January 2007. In the second dispute, which Abbott assumed as part of the Guidant acquisition, reserves equal to the expected resolution have been recorded.
There are several civil actions pending brought by individuals or entities that allege generally that Abbott and numerous pharmaceutical companies reported false or misleading pricing information relating to the average wholesale price of certain pharmaceutical products in connection with federal, state and private reimbursement. Civil actions have also been brought against Abbott, and in some cases other members of the pharmaceutical industry, by state attorneys general seeking to recover alleged damages on behalf of state Medicaid programs. In May 2006, Abbott was notified that the U.S. Department of Justice intervened in a civil whistle-blower lawsuit alleging that Abbott inflated prices for Medicaid and Medicare reimbursable drugs. The outcome of these investigations and litigation could include the imposition of fines or penalties. Abbott is unable to estimate the
amount of possible loss, and no loss reserves have been recorded for these exposures. Many of the products involved in these cases are Hospira products. Hospira, Abbott’s former hospital products business, was spun off to Abbott’s shareholders in 2004. Abbott retained liability for losses that result from these cases and investiga-tions to the extent any such losses both relate to the sale of Hospira’s products prior to the spin-off of Hospira and relate to allegations that were made in such pending and future cases and investigations that were the same as allegations existing at the date of the spin-off.
Within the next year, legal proceedings may occur that may result in a change in the estimated reserves recorded by Abbott. For its legal proceedings and environmental exposures, excluding the cases and investigations discussed in the third paragraph of this footnote, and excluding the binding arbitration award discussed in the second paragraph, Abbott estimates the range of possible loss to be from approximately $165 million to $295 million. The recorded reserve bal-ance at December 31, 2006 for these proceedings and exposures was approximately $200 million. These reserves represent management’s best estimate of probable loss, as defined by Statement of Financial Accounting Standards No. 5, “Accounting for Contingencies.”
While it is not feasible to predict the outcome of all such proceedings and exposures with certainty, management believes that their ultimate disposition should not have a material adverse effect on Abbott’s financial position, cash flows, or results of operations, except for the cases and investigations discussed in the third paragraph of this foot-note, the resolution of which could be material to cash flows or results of operations for a quarter.
Note 8 — Spin-off of Hospira
In 2004, Abbott’s Board of Directors declared a special dividend distribution of all of the outstanding shares of common stock of Hospira, Inc., payable on April 30, 2004. Hospira included the operations relating to the manufacture and sale of hospital products including specialty injectable pharmaceuticals, medication delivery systems and critical care devices and injectable pharmaceutical contract manufacturing. Hospira included Abbott’s Hospital Products segment, after that segment’s reorganization on January 1, 2004, and portions of the former International segment. The income and cash flows of Hospira and the direct transaction costs of the spin-off have been presented as discontinued operations in the Consolidated Statement of Earnings and Statement of Cash Flows.
Abbott has retained liabilities for taxes on income prior to the spin-off, defined benefit, post-employment medical and dental plan obligations and assets, as of the spin-off, for most of Hospira’s U.S. retired employees and U.S. retirement eligible employees and certain poten-tial liabilities, if any, related to alleged improper pricing practices prior to the spin-off in connection with federal, state and private reimburse-ment for certain drugs.
Note 9 — Incentive Stock Program
The 1996 Incentive Stock Program authorizes the granting of stock options, replacement stock options, stock appreciation rights, limited stock appreciation rights, restricted stock awards, restricted stock units, performance units and foreign qualified benefits. Stock options, replacement stock options and restricted stock awards and units comprise the majority of benefits that have been granted and are currently outstanding under this program and prior programs. In 2006,
Notes to Consolidated Financial Statements

Abbott 2006 Annual Report
58
Abbott granted 25,657,134 stock options, 3,961,376 replacement stock options, 1,088,911 (net of forfeitures of 100,000) restricted stock awards and 949,397 (net of forfeitures of 27,600) restricted stock units under the programs. The purchase price of shares under option must be at least equal to the fair market value of the common stock on the date of grant, and the maximum term of an option is 10 years. Options vest equally over three years except for replacement options, which vest in six months. Most options granted before January 1, 2005 included a replacement feature. When an employee tenders mature shares to Abbott upon exercise of a stock option, a replacement stock option is granted equal to the amount of shares tendered. Replacement options are granted at the then current market price for a term that expires on the date of the underlying option grant. Upon a change in control of Abbott, all outstanding stock options become fully exercisable, and all terms and conditions of all restricted stock awards and units are deemed satisfied. Restricted stock awards granted in 2006 have a 5 year term, with no more than one-third of the award vesting in any one year upon Abbott reaching a minimum return on equity target. Restricted stock units granted in 2006 vest over three years and upon vesting, the recipient receives one share of
Abbott stock for each vested restricted stock unit. The aggregate fair market value of restricted stock awards and units is recognized as expense over the vesting period. Restricted stock awards and settle-ment of vested restricted stock units are issued out of treasury shares. Abbott issued new shares for exercises of stock options. Abbott does not have a policy of purchasing its shares relating to its share-based programs. At January 1, 2007, approximately 49 million shares were reserved for future grants under the 1996 Program. Subsequent to year-end, the Board of Directors granted approximately 20 million stock options and restricted stock awards and units from this reserve.
The number of restricted stock awards and units outstanding and the weighted-average grant-date fair value at December 31, 2005 and December 31, 2006 was 2,381,800 and $50.09 and 3,830,728 and $45.31, respectively. The number of restricted stock awards and units, and the weighted-average grant-date fair value, that were granted, vested and lapsed during 2006 were 2,165,908 and $43.99, 573,019 and $48.74 and 143,961 and $43.93, respectively. The fair value of restricted stock awards and units vested in 2006, 2005 and 2004 was $32,226,000, $12,949,000 and $16,469,000, respectively.
Notes to Consolidated Financial Statements
Options Outstanding Exercisable Options
Weighted Weighted Weighted Weighted
Average Average Average Average
Exercise Remaining Exercise Remaining
Shares Price Life (Years) Shares Price Life (Years)
December 31, 2005 141,122,811 $42.69 6.3 98,328,158 $42.77 5.4
Granted 29,618,510 44.24
Exercised (18,537,136) 35.07
Lapsed (6,143,481) 46.71
December 31, 2006 146,060,704 $43.80 6.2 100,543,786 $43.51 5.1
The aggregate intrinsic value of options outstanding and exercisable at December 31, 2006 was $816 million and $622 million, respectively. The total intrinsic value of options exercised in 2006, 2005 and 2004 was $205 million, $189 million, and $133 million respectively. The total unrecognized compensation cost related to all share-based compensation plans at December 31, 2006 amounted to approxi-mately $235 million which is expected to be recognized over the next three years.
On January 1, 2006, Abbott adopted the provisions of Statement of Financial Accounting Standards No. 123 (revised 2004), “Share-Based Payment,” which requires that the fair value of share-based awards be recorded in the results of operations. Abbott used the modified prospective method of adoption. Under this method, prior years’ financial results do not include the impact of recording stock options using fair value. Under the revised standard, awards issued after 2005 and the remainder of any unrecognized cost for grants issued prior to 2006 are charged to expense. Total non-cash compensation expense charged against income in 2006 for share-based plans totaled approx-imately $330 million and the tax benefit recognized was approximately $78 million. Approximately 40 to 45 percent of the annual net cost of share-based awards will typically be recognized in the first quarter due to the timing of the granting of share-based awards. Compensation cost capitalized as part of inventory is not significant.
Through December 31, 2005, Abbott measured compensation cost using the intrinsic value-based method of accounting for stock options and replacement options granted to employees. Had compensation cost been determined using the fair value-based accounting method in 2005 and 2004, pro forma net income (in billions) and earnings per share (EPS) amounts would have been as follows: 2005 2004
Net income, as reported $ 3.4 $ 3.2
Compensation cost under fair
value-based accounting method,
net of taxes of $0.07 in 2005 and 2004 (0.2) (0.2)
Net income, pro forma $ 3.2 $ 3.0
Basic EPS, as reported $2.17 $2.07
Basic EPS, pro forma 2.04 1.94
Diluted EPS, as reported 2.16 2.06
Diluted EPS, pro forma 2.02 1.94
The weighted average fair value of an option granted in 2006, 2005 and 2004 was $11.72, $12.17 and $11.79, respectively. The fair value of an option grant was estimated using the Black-Scholes option- pricing model with the following assumptions:
2006 2005 2004
Risk-free interest rate 4.6% 3.8% 2.9%
Average life of options (years) 6.1 5.4 5.4
Volatility 28.0% 29.0% 32.0%
Dividend yield 2.7% 2.2% 2.2%

59
Abbott 2006 Annual Report
The risk-free interest rate is based on the rates available at the time of the grant for zero-coupon U.S. government issues with a remaining term equal to the option’s expected life. The average life of an option granted in 2006 is based on both historical and projected exercise and lapsing data. Prior to 2006, the average life of an option granted was based on historical experience. Expected volatility for 2006 option grants is based on implied volatilities from traded options on Abbott’s stock and historical volatility of Abbott’s stock over the expected life of the option. Expected volatility for options granted prior to 2006 was based on historical volatility over a period prior to the option grant equal to the option’s expected life. Dividend yield is based on the option’s exercise price and annual dividend rate at the time of grant.
Note 10 — Debt and Lines of Credit(dollars in thousands)
The following is a summary of long-term debt at December 31:
2006 2005 2004
5.625% debentures, due 2006 $ — $ — $1,600,000
6.4% debentures, due 2006 — — 250,000
0.77% Yen notes, due 2007 — 83,654 97,343
Notes, variable interest
above LIBOR — 770,000 —
Euro notes, variable interest
above LIBOR, due 2008 264,180 638,766 —
British Pound notes,
variable interest above LIBOR — 344,000 —
6.0% debentures, due 2008 200,000 200,000 200,000
5.4% debentures, due 2008 200,000 200,000 200,000
1.05% Yen notes, due 2008 430,775 418,270 486,713
3.5% debentures, due 2009 500,000 500,000 500,000
5.375% debentures, due 2009 500,000 — —
1.51% Yen notes, due 2010 129,232 125,481 146,014
3.75% debentures, due 2011 500,000 500,000 500,000
5.6% debentures, due 2011 1,500,000 — —
1.95% Yen notes, due 2013 215,387 209,135 243,356
4.35% debentures, due 2014 500,000 500,000 500,000
5.875% debentures, due 2016 2,000,000 — —
Other, including fair market value
adjustments relating to interest
rate hedge contracts designated
as fair value hedges 70,090 82,198 64,508
Total, net of current maturities 7,009,664 4,571,504 4,787,934
Current maturities of long-term debt 95,276 1,849,563 156,034
Total carrying amount $7,104,940 $6,421,067 $4,943,968
Principal payments required on long-term debt outstanding at December 31, 2006, are $95,276 in 2007, $1,098,353 in 2008, $1,093,792 in 2009, $130,342 in 2010, $2,000,355 in 2011 and $2,771,336 thereafter.
At December 31, 2006, Abbott had $7,000,000 of unused lines of credit, including a $4,000,000 short-term facility, which supports commercial paper borrowing arrangements. The lines of credit, other than the short-term facility, expire in 2010. Related compensating balances, which are subject to withdrawal by Abbott at its option, and commitment fees are not material. Abbott’s weighted average interest rate on short-term borrowings was 5.0% at December 31, 2006, 1.3% at December 31, 2005 and 2.2% at December 31, 2004.
Note 11 — Business Combinations, Technology Acquisitions and Related Transactions
In December 2006, Abbott acquired Kos Pharmaceuticals Inc. for cash of approximately $3.8 billion, net of cash held by Kos Pharmaceuticals to expand Abbott’s presence in the lipid manage-ment market and to provide several on-market and late-stage pipeline products. Kos Pharmaceuticals Inc. is a specialty pharmaceutical company that develops and markets proprietary medications for the treatment of chronic cardiovascular, metabolic and respiratory diseases. This business was acquired on December 13, 2006 and the financial results of the acquired operations are included in these finan-cial statements beginning on that date. The acquisition was financed primarily with short-term debt. The preliminary allocation of the acqui-sition cost is shown in the table below (in millions of dollars).
Goodwill, primarily non-deductible $1,824
Acquired in-process research and development 1,262
Acquired intangible assets,
primarily product rights for marketed products 821
Acquired net tangible assets 97
Deferred income taxes recorded at acquisition (234)
Total preliminary allocation of acquisition cost $3,770
Acquired intangible assets will be amortized over 1 to 15 years. Non-deductible acquired in-process research and development was charged to income in 2006. The net tangible assets acquired consist primarily of trade accounts receivable, inventories and property and equipment, net of assumed liabilities, primarily accrued salaries and wages and other liabilities.
In order to expand Abbott’s presence in the growing vascular market, Abbott acquired Guidant’s vascular intervention and endovascular solutions businesses for approximately $4.1 billion, in cash, in connec-tion with Boston Scientific’s acquisition of Guidant. These businesses were acquired on April 21, 2006 and the financial results of the acquired operations are included in these financial statements begin-ning on that date. In addition, Abbott will also pay to Boston Scientific $250 million each upon government approvals to market the XIENCE V drug-eluting stent in the U.S. and in Japan. Each $250 million pay-ment will result in the recording of additional goodwill. The preliminary allocation of the acquisition cost is shown in the table below (in millions of dollars). The valuation of intellectual property, including intangible assets and acquired in-process research and development, is sub-stantially complete, but the valuations of the other assets and liabilities are preliminary. The allocation will be finalized when certain information regarding the other assets and liabilities is known.
Goodwill, primarily deductible $1,688
Acquired intangible assets,
primarily product rights for marketed products 1,195
Acquired in-process research and development 665
Acquired net tangible assets 580
Total preliminary allocation of acquisition cost $4,128
Acquired intangible assets will be amortized over 3 to 15 years (average of approximately 10 years). Tax deductible acquired in-pro-cess research and development was charged to income in 2006. The net tangible assets acquired consist primarily of property and equipment of approximately $530 million, trade accounts receivable
Notes to Consolidated Financial Statements

Abbott 2006 Annual Report
60
of approximately $250 million and inventories of approximately $120 million, net of assumed liabilities, primarily trade accounts payable, litigation reserves and other liabilities.
In order to facilitate Boston Scientific’s acquisition of Guidant, Abbott also acquired 64.6 million shares of Boston Scientific common stock directly from Boston Scientific and loaned $900 million to a wholly-owned subsidiary of Boston Scientific. Abbott is required to dispose of the shares by October 2008. Sales of the shares are limited to approxi-mately 5.4 million shares per month until October 2007. The amount recorded upon the acquisition of the shares includes a discount to market, based on an appraisal, to reflect the value of the restrictions on sale. On the date of acquisition, half of the shares were recorded as available for sale in accordance with SFAS No. 115 and the remain-der under the cost method in accordance with APB No. 18. As of December 31, 2006, all of the shares are recorded as available for sale in accordance with SFAS No. 115. The loan, which is due in April 2011, is guaranteed by Boston Scientific and bears a favorable effective interest rate of 4 percent, which is reflected in the valuation of the note receivable. In connection with the acquisition of the shares, Boston Scientific is entitled to certain after-tax gains upon Abbott’s sale of the shares. Abbott would retain any gains on the sale of the Boston Scientific shares up to a sales price of $23.83; Boston Scientific would receive any after-tax gains on the sale of the shares for the portion of the sales price in excess of $23.83 but lower than $26.00; and Boston Scientific would receive one-half of any after-tax gain for the portion of the sales price in excess of $25.99. Based on an appraisal, Abbott recorded approximately $114 million for this gain-sharing derivative financial instrument liability. In addition, Boston Scientific agreed to reimburse Abbott for certain borrowing costs on debt incurred to acquire the Boston Scientific shares. After Abbott incurs the first $10 million of interest cost on debt incurred to acquire the shares, Boston Scientific will reimburse Abbott for the next $60 million of inter-est cost. Reimbursement for the incremental interest cost will be in the form of additional common stock of Boston Scientific, payable 18 months after the acquisition. Abbott recorded approximately $55 mil-lion for this interest derivative financial instrument asset. The effect of recording the shares, the loan to Boston Scientific and the derivative financial instruments at fair value on the date of acquisition resulted in the recording of additional goodwill of approximately $204 million. The financial assets and liability acquired from Boston Scientific were valued and recorded at acquisition as follows (in millions of dollars):
Boston Scientific common stock $1,326
Note receivable 829
Derivative financial instruments, net (59)
Total $2,096
In 2005, Abbott acquired the remaining interest in a small medical products company that was previously accounted for under the equity method of accounting and a less than 50 percent equity interest in a small medical products company. The aggregate cash purchase price was approximately $25 million. Acquisition accounting resulted in the recording of non-tax deductible goodwill of approximately $69 million, intangible assets of approximately $22 million and a charge of approxi-mately $17 million for acquired in-process research and development. In 2005, Abbott acquired additional rights related to HUMIRA for approximately $270 million, which are being amortized over 13 years.
In 2004, Abbott acquired TheraSense, Inc., a leader in the develop-ment, manufacturing and marketing of blood glucose self-monitoring systems, for approximately $1.2 billion in cash; i-STAT Corporation, a manufacturer of point-of-care diagnostic products for blood analysis, for approximately $394 million in cash; EAS, a nutritional company with a portfolio of nationally recognized brands, for approximately $320 million in cash; and Spine Next, a manufacturer of orthopedic spinal implant devices, for approximately $58 million in cash plus additional milestone payments of up to $23 million upon achievement of future targets. Abbott also acquired certain other product technolo-gies for approximately $352 million. These acquisitions resulted in a charge of $271 million for acquired in-process research and development, intangible assets of approximately $1.3 billion, non-tax deductible goodwill of approximately $923 million and deferred income taxes of approximately $406 million. Acquired intangible assets, primarily trade names, are amortized over 5 to 20 years (average of approximately 14 years).
Had the above acquisitions taken place on January 1 of the previous year, consolidated net sales and income would not have been signifi-cantly different from reported amounts.
Note 12 — Goodwill and Intangible Assets(dollars in millions)
Abbott recorded goodwill of $3,721, $69 and $923 in 2006, 2005 and 2004, respectively, related to acquisitions, including acquired goodwill allocated to the Pharmaceutical Products segment of $1,590 and goodwill allocated to the Vascular Products segment of $1,688. Foreign currency translation and other adjustments increased (decreased) goodwill in 2006, 2005 and 2004 by $509, $(535) and $394, respectively. The amount of goodwill related to reportable segments at December 31, 2006 was $5,223 for the Pharmaceutical Products segment, $1,440 for the Diagnostics Products segment, $353 for the Nutritional Products segment and $1,939 for the Vascular Products segment. In connection with the spin-off of Hospira in 2004, Abbott transferred $81 of goodwill to Hospira. There were no other reductions of goodwill relating to impairments or disposal of all or a portion of a business.
The gross amount of amortizable intangible assets, primarily product rights and technology, was $8,988, $6,776 and $6,622 as of December 31, 2006, 2005 and 2004, respectively, and accumulated amortization was $2,602, $2,053 and $1,468 as of December 31, 2006, 2005 and 2004, respectively. Intangible assets with indefinite lives are not significant. The estimated annual amortization expense for intangible assets is $748 in 2007, $708 in 2008, 2009, and 2010 and $690 in 2011. Intangible assets are amortized over 1 to 25 years (average 11 years).
Note 13 — Equity Method Investments(dollars in millions)
Abbott’s 50 percent-owned joint venture, TAP Pharmaceutical Products Inc. (TAP), is accounted for under the equity method of accounting. The investment in TAP was $162, $167 and $76 at December 31, 2006, 2005 and 2004, respectively. Dividends received from TAP were $487, $343 and $638 in 2006, 2005 and 2004, respectively. Abbott performs certain administrative and manufacturing services for TAP at negotiated rates that approximate fair market value.

61
Abbott 2006 Annual Report
Summarized financial information for TAP is as follows:
Year Ended December 31 2006 2005 2004
Net sales $3,362.7 $3,260.0 $3,361.6
Cost of sales 835.8 883.4 990.4
Income before taxes 1,523.8 1,379.3 1,181.1
Net income 951.6 882.8 750.0
December 31 2006 2005 2004
Current assets $1,181.0 $1,339.1 $ 951.7
Total assets 1,333.1 1,470.2 1,176.6
Current liabilities 954.5 1,082.2 976.8
Total liabilities 1,008.8 1,136.2 1,025.2
Undistributed earnings of investments accounted for under the equity method amounted to approximately $140 as of December 31, 2006.
Note 14 — Restructuring Plans(dollars in millions)
In 2006 and 2005, Abbott management approved plans to realign its worldwide pharmaceutical manufacturing operations and selected domestic and international commercial and research and development operations in order to reduce costs. In 2006 and 2005, Abbott recorded pretax charges against earnings of approximately $210 and $256, respectively, reflecting the impairment of manufacturing facilities and other assets, employee severance and other related charges. Approximately $181 and $174, respectively, is classified as cost of products sold, $29 and $10, respectively, as research and development and $72, in 2005, as selling, general and administrative. Fair value for the determination of the amount of asset impairment was primarily determined based on a discounted cash flow method. An additional $70 and $14 were subsequently recorded in 2006 and 2005, respectively, relating to these restructurings, primarily for accelerated depreciation. As a result of product re-registration timelines required under manufacturing regulations in a number of countries, manufacturing related realignments are expected to continue into 2007.
The following summarizes the activity for restructurings:
Employee-
Related Asset
and Other Impairments Total
2005 restructuring charges $191.7 $ 63.8 $ 255.5
Payments and impairments (36.9) (63.8) (100.7)
Accrued balance at December 31, 2005 154.8 — 154.8
2006 restructuring charges 117.7 92.6 210.3
Payments, impairments
and other adjustments (79.2) (92.6) (171.8)
Accrued balance at December 31, 2006 $193.3 $ — $ 193.3
Abbott expects to incur up to an additional $128 in future periods for restructuring plans, primarily for accelerated depreciation.
Note 15 — Subsequent Event
On January 18, 2007, Abbott announced that it had agreed to sell It’s core laboratory diagnostics business, including Abbott Point of Care, to GE for $8.13 billion in cash. In the last decade, the laboratory diag-nostics market has changed considerably. Innovation in this business will be increasingly driven by automation, system integration and a host of skills that Abbott believes GE can better offer. The sale is
expected to close in the first half of 2007 and is subject to customary closing conditions, including regulatory approvals. Net sales for these businesses were approximately $2.7 billion in 2006. The carrying amount of the assets and liabilities included in the sale is estimated to be approximately $2.6 billion, comprised of trade receivables of approximately $750 million, inventories of approximately $650 million, other current assets of approximately $100 million, net property, plant and equipment of approximately $1.3 billion, intangible assets and goodwill of approximately $500 million, current liabilities of approximately $550 million and long-term liabilities of approximately $150 million. Abbott estimates tax expense of approximately $2.0 billion will be recorded on the gain.
Note 16 — Quarterly Results (Unaudited)(dollars in millions except per share data)
2006 2005 2004
First Quarter
Net Sales $5,183.5 $5,382.7 $4,640.9
Gross Profit 3,013.8 2,860.1 2,567.4
Net Earnings 865.0 837.9 822.9
Basic Earnings Per Common Share (a) .57 .54 .53
Diluted Earnings Per Common Share (a) .56 .53 .52
Market Price Per Share-High 45.58 48.16 47.25
Market Price Per Share-Low 39.18 43.34 39.28
Second Quarter
Net Sales $5,501.1 $5,523.8 $4,703.0
Gross Profit 3,112.5 2,892.0 2,634.3
Net Earnings (b) 612.2 877.1 634.3
Basic Earnings Per Common Share (a) (b) .40 .56 .41
Diluted Earnings Per Common Share (a) (b) .40 .56 .40
Market Price Per Share-High 43.61 49.98 44.67
Market Price Per Share-Low 40.55 45.98 39.43
Third Quarter
Net Sales $5,573.8 $5,384.0 $4,681.7
Gross Profit 3,182.5 2,706.8 2,566.8
Net Earnings (c) 715.8 680.7 804.1
Basic Earnings Per Common Share (a) (c) .47 .44 .52
Diluted Earnings Per Common Share (a) (c) .46 .44 .51
Market Price Per Share-High 49.87 50.00 43.20
Market Price Per Share-Low 43.25 41.57 38.26
Fourth Quarter
Net Sales $6,218.0 $6,047.3 $5,654.4
Gross Profit 3,352.4 3,237.8 3,027.3
Net (Loss) Earnings (d) (476.2) 976.4 974.6
Basic (Loss) Earnings
Per Common Share (a) (d) (.31) .63 .62
Diluted (Loss) Earnings
Per Common Share (a) (d) (.31) .63 .62
Market Price Per Share-High 49.10 44.36 47.63
Market Price Per Share-Low 45.41 37.50 40.25
(a) The sum of the quarters’ basic and diluted earnings per share for 2006 and 2004
do not add to the full year earnings per share amounts due to rounding.
(b) Second quarter 2006 includes a pretax charge of $493 for acquired in-process and
collaborations research and development.
(c) Third quarter 2006 includes a pretax charge of $214 for acquired in-process research
and development and 2005 includes pretax restructuring charges of $201.
(d) Fourth quarter 2006 includes a pretax charge of $1,307 for acquired in-process
and collaborations research and development.
Abbott 2006 Annual Report
62
The management of Abbott Laboratories is responsible for estab-lishing and maintaining adequate internal control over financial reporting. Abbott’s internal control system was designed to provide reasonable assurance to the company’s management and board of directors regarding the preparation and fair presentation of published financial statements.
All internal control systems, no matter how well designed, have inherent limitations. Therefore, even those systems determined to be effective can provide only reasonable assurance with respect to financial statement preparation and presentation.
Abbott’s management assessed the effectiveness of the company’s internal control over financial reporting as of December 31, 2006. In making this assessment, it used the criteria set forth in Internal Control—Integrated Framework issued by the Committee of Sponsoring Organizations of the Treadway Commission. As allowed by SEC guidance, management excluded from its assesment the 2006 acquisitions of the Guidant businesses and Kos Pharmaceuticals, which accounted for approximately 20 percent of consolidated total assets and approximately 3 percent of consolidated net sales. Based on our assessment, we believe that, as of December 31, 2006, the company’s internal control over financial reporting was effective based on those criteria.
Abbott’s independent registered public accounting firm has issued an audit report on our assessment of the company’s internal control over financial reporting. This report appears on page 63.
Miles D. WhiteChairman of the Board and Chief Executive Officer
Thomas C. FreymanExecutive Vice President, Finance and Chief Financial Officer
Greg W. LinderVice President and Controller
February 15, 2007
Management Report on Internal Control Over Financial Reporting

63
Abbott 2006 Annual Report
To the Board of Directors and Shareholders of Abbott Laboratories:
We have audited the accompanying consolidated balance sheets of Abbott Laboratories and subsidiaries (the Company) as of December 31, 2006, 2005, and 2004, and the related consolidated statements of earnings, shareholders’ investment, and cash flows for the years then ended. These financial statements are the responsibility of the Company’s management. Our responsibility is to express an opinion on these financial statements based on our audits.
We conducted our audits in accordance with the standards of the Public Company Accounting Oversight Board (United States). Those standards require that we plan and perform the audit to obtain reasonable assurance about whether the financial statements are free of material misstatement. An audit includes examining, on a test basis, evidence supporting the amounts and disclosures in the financial statements. An audit also includes assessing the accounting principles used and significant estimates made by management, as well as evaluating the overall financial statement presenta-tion. We believe that our audits provide a reasonable basis for our opinion.
In our opinion, such consolidated financial statements present fairly, in all material respects, the financial position of Abbott Laboratories and subsid-iaries as of December 31, 2006, 2005, and 2004 and the results of their operations and their cash flows for the years then ended, in conformity with accounting principles generally accepted in the United States of America.
As discussed in Notes 1, 4 and 9 to the consolidated financial statements, the Company changed its method of accounting for pension and other post employment benefits and share-based payments to adopt Statement of Financial Accounting Standards (“SFAS”) No. 158, Employers’ Accounting for Defined Benefit Pension and Other Postretirement Plans, and SFAS No. 123(R), Share-Based Payment.
We have also audited, in accordance with the standards of the Public Company Accounting Oversight Board (United States), the effectiveness of the Company’s internal control over financial reporting as of December 31, 2006, based on the criteria established in Internal Control—Integrated Framework issued by the Committee of Sponsoring Organizations of the Treadway Commission and our report dated February 15, 2007 expressed an unqualified opinion on management’s assessment of the effectiveness of the Company’s internal control over financial reporting and an unqualified opinion on the effectiveness of the Company’s internal control over financial reporting.
Deloitte & Touche LLPChicago, IllinoisFebruary 15, 2007
To the Board of Directors and Shareholders of Abbott Laboratories:
We have audited management’s assessment, included in the accompany-ing Management Report on Internal Control Over Financial Reporting dated February 15, 2007 (Management’s Report), that Abbott Laboratories and subsidiaries (the Company) maintained effective internal control over finan-cial reporting as of December 31, 2006, based on criteria established in Internal Control—Integrated Framework issued by the Committee of Sponsoring Organizations of the Treadway Commission. As described in Management’s Report, management excluded from its assessment the internal control over financial reporting for the 2006 acquisitions of the Guidant businesses (Guidant) and Kos Pharmaceuticals (Kos), which accounted for approximately 20 percent of consolidated total assets and approximately 3 percent of consolidated net sales. Accordingly, our audit did not include the internal control over financial reporting at Guidant or Kos. The Company’s management is responsible for maintaining effective internal control over financial reporting and for its assessment of the effec-tiveness of internal control over financial reporting. Our responsibility is to
express an opinion on management’s assessment and an opinion on the effectiveness of the Company’s internal control over financial reporting based on our audit.
We conducted our audit in accordance with the standards of the Public Company Accounting Oversight Board (United States). Those standards require that we plan and perform the audit to obtain reasonable assurance about whether effective internal control over financial reporting was maintained in all material respects. Our audit included obtaining an understanding of internal control over financial reporting, evaluating man-agement’s assessment, testing and evaluating the design and operating effectiveness of internal control, and performing such other procedures as we considered necessary in the circumstances. We believe that our audit provides a reasonable basis for our opinions.
A company’s internal control over financial reporting is a process designed by, or under the supervision of, the company’s principal executive and prin-cipal financial officers, or persons performing similar functions, and effected by the company’s board of directors, management, and other personnel to provide reasonable assurance regarding the reliability of financial reporting and the preparation of financial statements for external purposes in accor-dance with generally accepted accounting principles. A company’s internal control over financial reporting includes those policies and procedures that (1) pertain to the maintenance of records that, in reasonable detail, accu-rately and fairly reflect the transactions and dispositions of the assets of the company; (2) provide reasonable assurance that transactions are recorded as necessary to permit preparation of financial statements in accordance with generally accepted accounting principles, and that receipts and expenditures of the company are being made only in accor-dance with authorizations of management and directors of the company; and (3) provide reasonable assurance regarding prevention or timely detection of unauthorized acquisition, use, or disposition of the company’s assets that could have a material effect on the financial statements.
Because of the inherent limitations of internal control over financial report-ing, including the possibility of collusion or improper management override of controls, material misstatements due to error or fraud may not be pre-vented or detected on a timely basis. Also, projections of any evaluation of the effectiveness of the internal control over financial reporting to future periods are subject to the risk that the controls may become inadequate because of changes in conditions, or that the degree of compliance with the policies or procedures may deteriorate.
In our opinion, management’s assessment that the Company maintained effective internal control over financial reporting as of December 31, 2006, is fairly stated, in all material respects, based on the criteria established in Internal Control—Integrated Framework issued by the Committee of Sponsoring Organizations of the Treadway Commission. Also in our opin-ion, the Company maintained, in all material respects, effective internal control over financial reporting as of December 31, 2006, based on the criteria established in Internal Control—Integrated Framework issued by the Committee of Sponsoring Organizations of the Treadway Commission.
We have also audited, in accordance with the standards of the Public Company Accounting Oversight Board (United States), the consolidated financial statements of the Company as of and for the year ended December 31, 2006 and our report dated February 15, 2007 expressed an unqualified opinion on those financial statements and included an explanatory paragraph regarding the Company’s adoption of Statement of Financial Accounting Standards (“SFAS”) No. 158, Employers’ Accounting for Defined Benefit Pension and Other Postretirement Plans, and SFAS No. 123(R), Share-Based Payment, in 2006.
Deloitte & Touche LLPChicago, IllinoisFebruary 15, 2007
Reports of Independent Registered Public Accounting Firm
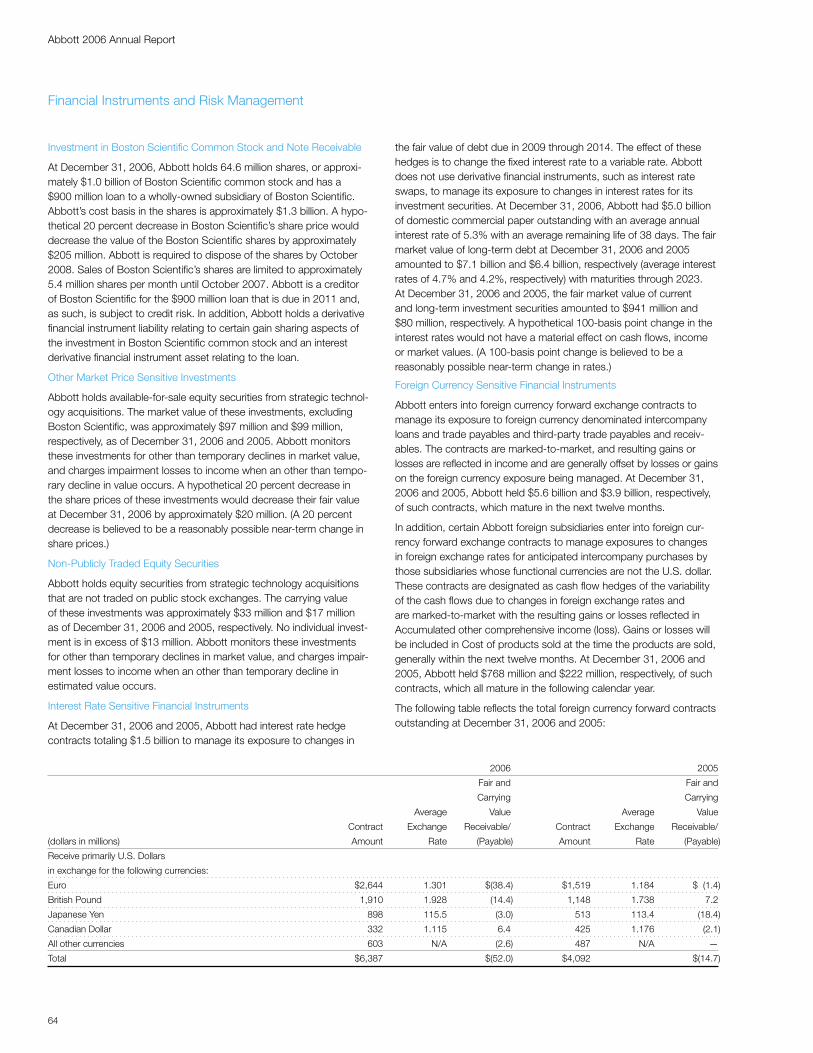
Abbott 2006 Annual Report
64
Investment in Boston Scientific Common Stock and Note Receivable
At December 31, 2006, Abbott holds 64.6 million shares, or approxi-mately $1.0 billion of Boston Scientific common stock and has a $900 million loan to a wholly-owned subsidiary of Boston Scientific. Abbott’s cost basis in the shares is approximately $1.3 billion. A hypo-thetical 20 percent decrease in Boston Scientific’s share price would decrease the value of the Boston Scientific shares by approximately $205 million. Abbott is required to dispose of the shares by October 2008. Sales of Boston Scientific’s shares are limited to approximately 5.4 million shares per month until October 2007. Abbott is a creditor of Boston Scientific for the $900 million loan that is due in 2011 and, as such, is subject to credit risk. In addition, Abbott holds a derivative financial instrument liability relating to certain gain sharing aspects of the investment in Boston Scientific common stock and an interest derivative financial instrument asset relating to the loan.
Other Market Price Sensitive Investments
Abbott holds available-for-sale equity securities from strategic technol-ogy acquisitions. The market value of these investments, excluding Boston Scientific, was approximately $97 million and $99 million, respectively, as of December 31, 2006 and 2005. Abbott monitors these investments for other than temporary declines in market value, and charges impairment losses to income when an other than tempo-rary decline in value occurs. A hypothetical 20 percent decrease in the share prices of these investments would decrease their fair value at December 31, 2006 by approximately $20 million. (A 20 percent decrease is believed to be a reasonably possible near-term change in share prices.)
Non-Publicly Traded Equity Securities
Abbott holds equity securities from strategic technology acquisitions that are not traded on public stock exchanges. The carrying value of these investments was approximately $33 million and $17 million as of December 31, 2006 and 2005, respectively. No individual invest-ment is in excess of $13 million. Abbott monitors these investments for other than temporary declines in market value, and charges impair-ment losses to income when an other than temporary decline in estimated value occurs.
Interest Rate Sensitive Financial Instruments
At December 31, 2006 and 2005, Abbott had interest rate hedge contracts totaling $1.5 billion to manage its exposure to changes in
the fair value of debt due in 2009 through 2014. The effect of these hedges is to change the fixed interest rate to a variable rate. Abbott does not use derivative financial instruments, such as interest rate swaps, to manage its exposure to changes in interest rates for its investment securities. At December 31, 2006, Abbott had $5.0 billion of domestic commercial paper outstanding with an average annual interest rate of 5.3% with an average remaining life of 38 days. The fair market value of long-term debt at December 31, 2006 and 2005 amounted to $7.1 billion and $6.4 billion, respectively (average interest rates of 4.7% and 4.2%, respectively) with maturities through 2023. At December 31, 2006 and 2005, the fair market value of current and long-term investment securities amounted to $941 million and $80 million, respectively. A hypothetical 100-basis point change in the interest rates would not have a material effect on cash flows, income or market values. (A 100-basis point change is believed to be a reasonably possible near-term change in rates.)
Foreign Currency Sensitive Financial Instruments
Abbott enters into foreign currency forward exchange contracts to manage its exposure to foreign currency denominated intercompany loans and trade payables and third-party trade payables and receiv-ables. The contracts are marked-to-market, and resulting gains or losses are reflected in income and are generally offset by losses or gains on the foreign currency exposure being managed. At December 31, 2006 and 2005, Abbott held $5.6 billion and $3.9 billion, respectively, of such contracts, which mature in the next twelve months.
In addition, certain Abbott foreign subsidiaries enter into foreign cur-rency forward exchange contracts to manage exposures to changes in foreign exchange rates for anticipated intercompany purchases by those subsidiaries whose functional currencies are not the U.S. dollar. These contracts are designated as cash flow hedges of the variability of the cash flows due to changes in foreign exchange rates and are marked-to-market with the resulting gains or losses reflected in Accumulated other comprehensive income (loss). Gains or losses will be included in Cost of products sold at the time the products are sold, generally within the next twelve months. At December 31, 2006 and 2005, Abbott held $768 million and $222 million, respectively, of such contracts, which all mature in the following calendar year.
The following table reflects the total foreign currency forward contracts outstanding at December 31, 2006 and 2005:
Financial Instruments and Risk Management
2006 2005
Fair and Fair and
Carrying Carrying
Average Value Average Value
Contract Exchange Receivable/ Contract Exchange Receivable/
(dollars in millions) Amount Rate (Payable) Amount Rate (Payable)
Receive primarily U.S. Dollars
in exchange for the following currencies:
Euro $2,644 1.301 $(38.4) $1,519 1.184 $ (1.4)
British Pound 1,910 1.928 (14.4) 1,148 1.738 7.2
Japanese Yen 898 115.5 (3.0) 513 113.4 (18.4)
Canadian Dollar 332 1.115 6.4 425 1.176 (2.1)
All other currencies 603 N/A (2.6) 487 N/A —
Total $6,387 $(52.0) $4,092 $(14.7)

65
Abbott 2006 Annual Report
Abbott’s revenues are derived primarily from the sale of a broad line of health care products under short-term receivable arrangements. Patent protection and licenses, technological and performance features, and inclusion of Abbott’s products under a contract or by a pharmacy benefit manager most impact which products are sold; price controls, competition and rebates most impact the net selling prices of products; and foreign currency translation impacts the measurement of net sales. Abbott’s primary products are prescription pharmaceuticals, nutritional products, vascular products and diagnostic testing products. Abbott also owns 50 percent of TAP Pharmaceutical Products Inc. that Abbott accounts for on the equity method.
The worldwide launch of HUMIRA, the acquisition of Guidant’s vascular business, the amendment of the Boehringer Ingelheim agreement, and the loss of patent protection for some pharmaceutical products have impacted Abbott’s sales, costs and financial position over the last three years.
Pharmaceutical research and development is focused on therapeutic areas that include immunology, oncology, neuroscience, metabolism, and viral diseases. In 2003, Abbott began the worldwide launch of HUMIRA, which increased its worldwide sales to $2.0 billion in 2006 compared to $1.4 billion in 2005. Substantial research and develop-ment and selling support has been and continues to be dedicated to maximizing the worldwide potential of HUMIRA. In December 2006, Abbott acquired Kos Pharmaceuticals which complements Abbott’s existing franchise in the global dyslipidemia market and strengthens the late-stage and mid-term pharmaceutical pipeline with opportunities in cholesterol management, asthma and inhaled insulin. In 2005, Abbott and Boehringer Ingelheim (BI) amended their agreement whereby Abbott distributed and promoted BI products. Effective January 1, 2006, Abbott no longer distributed or recorded sales for distribution activities for the BI products. Abbott’s gross margins for BI products from the prior agreement in effect through December 31, 2005 were substantially lower than its average gross margins. Sales of BI products were $150 million and $2.3 billion in 2006 and 2005, respectively. In addition, increased generic competition resulted in worldwide sales of clarithromycin declining 23 percent in 2006.
In 2005 and 2006, Abbott’s nutritional products businesses were reorganized into a worldwide business to better leverage the opportunities available for strong nutritional brands. Significant efforts have been focused on capturing those opportunities, particularly in developing markets.
In April 2006, Abbott acquired Guidant’s vascular intervention and endovascular solutions businesses and began to integrate it with Abbott’s vascular business. The acquisition significantly improved Abbott’s competitive position in this business that is characterized by rapid innovation. In 2006, Abbott received European Union approval to market the XIENCE V drug eluting stent.
Abbott’s diagnostic segment is comprised of four separate divisions—immunoassay/hematology, diabetes care, molecular, and point of care. In early 2004, Abbott acquired TheraSense for $1.2 billion, and began to integrate it with Abbott’s diabetes care business. In January 2007, Abbott announced that it had agreed to sell its core laboratory diagnostics business, including Abbott Point of Care, to GE for
$8.13 billion in cash. Abbott expects the sale to close in the first half of 2007. Abbott’s Molecular Diagnostics and Diabetes Care busi-nesses are not part of this transaction and will remain part of Abbott.
Abbott’s short- and long-term debt totaled $12.4 billion at December 31, 2006, largely incurred to finance recent acquisitions. Operating cash flows in excess of capital expenditures and cash dividends have allowed Abbott to fund acquisitions over the last three years. At December 31, 2006, Abbott’s long-term debt rating was AA by Standard and Poor’s Corporation and A1 by Moody’s Investors Service.
In 2007, Abbott will focus on several key initiatives. In the pharma-ceutical business, Abbott will continue the launch of newly approved indications for HUMIRA, and will also focus on the integration of Kos Pharmaceuticals into the Pharmaceutical Products segment. Pharmaceutical research and development efforts will continue to focus on the therapeutic areas noted above with a significant portion of the development expenditures allocated to new HUMIRA indica-tions. Abbott expects to submit additional pharmaceutical regulatory filings in 2007. In the vascular business, Abbott will continue the launch of the XIENCE V drug-eluting stent in Europe, and will launch in the U.S. upon approval by the FDA. For diabetes care, Abbott anticipates the approval of FreeStyle Navigator. Effort will also be required for the sale and separation of Abbott’s core laboratory and point of care diagnostics businesses. In the other business segments, Abbott will focus on developing or acquiring differentiated technologies in higher growth segments of those markets.
Critical Accounting Policies
Sales Rebates — Approximately 40 percent of Abbott’s consolidated gross revenues are subject to various forms of rebates and allowances that Abbott records as reductions of revenues at the time of sale. Most of these rebates and allowances are in the Pharmaceutical Products segment and the Nutritional Products segment. Abbott provides rebates to pharmacy benefit management companies, to state agen-cies that administer the federal Medicaid and Medicare programs and the Special Supplemental Food Program for Women, Infants, and Children (WIC), wholesalers, group purchasing organizations, and other government agencies and private entities. Rebate amounts are usually based upon the volume of purchases using contractual or statutory prices for a product. Factors used in the rebate calculations include the identification of which products have been sold subject to a rebate, which customer or government agency price terms apply, and the estimated lag time between sale and payment of a rebate. Using historical trends, adjusted for current changes, Abbott estimates the amount of the rebate that will be paid, and records the liability as a reduction of gross sales when Abbott records its sale of the product. Settlement of the rebate generally occurs from two to 24 months after sale. Abbott regularly analyzes the historical rebate trends and makes adjustments to reserves for changes in trends and terms of rebate programs. Rebates and chargebacks charged against gross sales in 2006, 2005 and 2004 amounted to approximately $2.6 billion, $2.5 billion and $2.4 billion, respectively, or 23.2 percent, 22.9 percent and 25.6 percent, respectively, based on gross sales of approximately $11.0 billion, $10.9 billion and $9.3 billion, respectively, subject to
Financial Review

Abbott 2006 Annual Report
66
rebate. A one-percentage point increase in the percentage of rebates to related gross sales would decrease net sales and operating earn-ings by approximately $110 million in 2006. Other allowances charged against gross sales were approximately $247 million, $284 million and $233 million for cash discounts in 2006, 2005 and 2004, respectively, and $209 million, $162 million and $163 million for returns in 2006, 2005 and 2004, respectively. Cash discounts are known within 15 to 30 days of sale, and therefore can be reliably estimated. Returns can be reliably estimated because Abbott’s historical returns are low, and because sales returns terms and other sales terms have remained relatively unchanged for several periods.
Management analyzes the adequacy of ending rebate accrual bal-ances each quarter. In the domestic nutritional business, management uses both internal and external data available to estimate the level of inventory in the distribution channel. Management internally estimates the inventory in the retail channel that is not on the retail shelf. A third party continuously measures time on the retail shelf, which is a rela-tively significant portion of the time inventory is in the distribution channel. Except for a transition period before or after a change in the supplier for the WIC business in a state, inventory in the distribution channel does not vary substantially. Management also estimates the states’ processing lag time based on claims data. In addition, internal processing time is a factor in estimating the accrual. In the WIC busi-ness, the state where the sale is made, which is the determining factor for the applicable price, is reliably estimable. Estimates are required for the amount of WIC sales within each state where Abbott has the WIC business. External data sources utilized for that estimate are participant data from the U.S. Department of Agriculture (USDA), which administers the WIC program, participant data from some of the states, and internally administered market surveys. The USDA has been making its data available for many years. Internal data includes historical redemption rates and pricing data. At December 31, 2006, Abbott had the exclusive WIC business in 11 states.
In the domestic pharmaceutical business, the most significant charges against gross sales are for Medicaid and Medicare Rebates, Pharmacy Benefit Manager Rebates and Wholesaler Chargebacks. In order to evaluate the adequacy of the ending accrual balances, management uses both internal and external estimates of the level of inventory in the distribution channel and the rebate claims processing lag time. External data sources used to estimate the inventory in the distribution channel include inventory levels periodically reported by wholesalers and third party market data purchased by Abbott. Management esti-mates the processing lag time based on periodic sampling of claims data. To estimate the price rebate percentage, systems and calcula-tions are used to track sales by product by customer and to estimate the contractual or statutory price. Abbott’s systems and calculations have developed over time as rebates have become more significant, and Abbott believes they are reliable.
The following table is an analysis of the four largest rebate accruals, which comprise approximately 76 percent of the consolidated rebate provisions charged against revenues in 2006. Remaining rebate
provisions charged against gross sales are not significant in the determination of operating earnings. (dollars in thousands)
Domestic Pharmaceutical Products
Domestic Medicaid Pharmacy
Nutritionals and Benefit Wholesaler
WIC Medicare Manager Charge-
Rebates Rebates Rebates backs
Balance at
January 1, 2004 $ 113,362 $ 229,070 $ 145,195 $ 37,093
Provisions 671,817 596,330 279,681 419,486
Payments (687,132) (452,342) (271,078) (412,526)
Balance at
December 31, 2004 98,047 373,058 153,798 44,053
Provisions 641,189 663,043 253,499 450,901
Payments (644,460) (581,098) (273,166) (446,867)
Balance at
December 31, 2005 94,776 455,003 134,131 48,087
Provisions 636,849 527,860 281,221 532,847
Payments (595,477) (533,632) (246,456) (513,905)
Balance at
December 31, 2006 $ 136,148 $ 449,231 $ 168,896 $ 67,029
Adjustments for prior years’ rebate accruals have not been material. Abbott employs various techniques to verify the accuracy of claims submitted to it, and where possible, works with the organizations sub-mitting claims to gain insight into changes that might affect the rebate amounts. For Medicaid, Medicare and other government agency pro-grams, the calculation of a rebate involves interpretations of relevant regulations, which are subject to challenge or change in interpretation.
Income Taxes — Abbott operates in numerous countries where its income tax returns are subject to audits and adjustments. Because Abbott operates globally, the nature of the audit items are often very complex, and the objectives of the government auditors can result in a tax on the same income in more than one country. Abbott employs internal and external tax professionals to minimize audit adjustment amounts where possible. As part of Abbott’s calculation of the provi-sion for taxes on earnings, Abbott records the amount that it expects to incur as a result of audits. Each quarter, Abbott reviews its expo-sures in accordance with Statement of Financial Accounting Standards (SFAS) No. 5, “Accounting for Contingencies.” In the U.S., Abbott’s federal income tax returns through 2003 are settled, and the income tax returns for years after 2003 are open. Except for taxes on divi-dends that were remitted under the American Jobs Creation Act of 2004, Abbott does not record deferred income taxes on earnings reinvested indefinitely in foreign subsidiaries. On January 1, 2007, Abbott must adopt the provisions of FASB Interpretation No. 48 “Accounting for Uncertainty in Income Taxes” which changes the measurement of tax contingencies. Under this Interpretation, in order to recognize an uncertain tax benefit, the taxpayer must be more likely than not of sustaining the position, and the measurement of the benefit is calculated as the largest amount that is more than 50 percent likely to be realized upon resolution of the benefit. This Interpretation will result in significantly more effort to assess tax uncertainties than was required under SFAS No. 5, and may result in initial recording of tax expense that exceeds the expected resolution of tax uncertainties. The adoption of this Interpretation is not expected to have a material effect on Abbott’s January 1, 2007 balance sheet or the 2007 provision for income taxes.
Financial Review

67
Abbott 2006 Annual Report
Pension and Post-Employment Benefits — Abbott offers pension benefits and post-employment health care to many of its employees. Abbott engages outside actuaries to calculate its obligations and costs under these programs. Abbott must develop long-term assumptions, the most significant of which are the health care cost trend rate, dis-count rate and the expected return on plan assets. The discount rates used to measure liabilities as of December 31, 2006 and 2005 were determined based on high-quality fixed income securities that match the duration of the expected retiree benefits. Prior to December 31, 2005, the discount rate was determined by reference to a composite corporate AA bond index. The health care cost trend rate represents Abbott’s expected annual rates of change in the cost of health care benefits and is a forward projection of health care costs as of the measurement date. A difference between the assumed rates and the actual rates, which will not be known for decades, can be significant in relation to the obligations and the annual cost recorded for these programs. Recent low interest rates have significantly increased actuarial losses for these plans. At December 31, 2006, pretax net actuarial losses and prior service costs and (credits) recognized in Accumulated other comprehensive income (loss) for Abbott’s defined benefit plans and medical and dental plans were $1.4 billion and $537 million, respectively. Actuarial losses and gains are amortized over the remaining service periods of the employees under the corridor method, in accordance with the rules for accounting for post-employ-ment benefits. Differences between the expected long-term return on plan assets and the actual annual return are amortized over a five-year period. Footnote 4 to the consolidated financial statements describes the impact of a one-percentage point change in the health care cost trend rate; however, there can be no certainty that a change would be limited to only one percentage point. On December 31, 2006, Abbott adopted the provisions of SFAS No. 158 “Employers’ Accounting for Defined Benefit Pension and Other Postretirement Plans.” The provisions of this statement require the immediate recognition of the deferrals on the balance sheet with a corresponding charge to Accumulated other comprehensive income (loss). Adoption of this statement on December 31, 2006 resulted in a decrease in Abbott’s shareholders’ equity of approximately $1.3 billion.
Valuation of Intangible Assets — Abbott has acquired and continues to acquire significant intangible assets that Abbott records at fair value. Those assets which do not yet have regulatory approval and for which there are no alternative uses are expensed as acquired in-process research and development, and those that have regulatory approval are capitalized. Transactions involving the purchase or sale of intangi-ble assets occur with some frequency between companies in the health care field and valuations are usually based on a discounted cash flow analysis. The discounted cash flow model requires assump-tions about the timing and amount of future net cash inflows, risk, the cost of capital, and terminal values. Each of these factors can signifi-cantly affect the value of the intangible asset. Abbott engages independent valuation experts who review Abbott’s critical assump-tions and calculations for significant acquisitions of intangibles. Abbott reviews intangible assets for impairment each quarter using an undis-counted net cash flows approach. If the undiscounted cash flows of an intangible asset are less than the carrying value of an intangible asset, the intangible asset is written down to its fair value, which is usually the discounted cash flow amount. Where cash flows cannot be identified for an individual asset, the review is applied at the lowest
group level for which cash flows are identifiable. Goodwill is reviewed for impairment annually or when an event that could result in an impairment of goodwill occurs. At December 31, 2006 goodwill and intangibles amounted to $9.4 billion and $6.4 billion, respectively, and amortization expense for intangible assets amounted to $575 million in 2006. There were no impairments of goodwill in 2006, 2005 or 2004. At December 31, 2006 the valuations for the Guidant and Kos acquisi-tions have not been finalized.
Litigation — Abbott accounts for litigation losses in accordance with SFAS No. 5, “Accounting for Contingencies.” Under SFAS No. 5, loss contingency provisions are recorded for probable losses at manage-ment’s best estimate of a loss, or when a best estimate cannot be made, a minimum loss contingency amount is recorded. These esti-mates are often initially developed substantially earlier than the ultimate loss is known, and the estimates are refined each accounting period as additional information becomes known. Accordingly, Abbott is often initially unable to develop a best estimate of loss, and therefore the minimum amount, which could be zero, is recorded. As information becomes known, either the minimum loss amount is increased, result-ing in additional loss provisions, or a best estimate can be made, also resulting in additional loss provisions. Occasionally, a best estimate amount is changed to a lower amount when events result in an expec-tation of a more favorable outcome than previously expected. Except for one group of cases relating to pharmaceutical pricing for which Abbott is unable to estimate a loss, if any, Abbott estimates the range of possible loss to be from approximately $165 million to $295 million for its legal proceedings and environmental exposures. Reserves of approximately $200 million have been recorded at December 31, 2006 for these proceedings and exposures. These reserves represent man-agement’s best estimate of probable loss, as defined by SFAS No. 5.
Stock Compensation — Through December 31, 2005, Abbott mea-sured compensation cost using the intrinsic value-based method of accounting for stock options granted to employees and disclosed the impact of the fair value method in the footnotes to the consolidated financial statements. On January 1, 2006, Abbott adopted SFAS No. 123 (revised 2004), “Share-Based Payment,” which requires that fair value be recorded in the results of operations. Since there is no market for trading employee stock options, management must use a fair value method. There is no certainty that the results of a fair value method would be the value at which employee stock options would be traded for cash. Fair value methods require management to make sev-eral assumptions, the most significant of which are the selection of a fair value model, stock price volatility and the average life of an option. Abbott has readily available grant-by-grant historical activity for several years in its option administration system that it uses in developing some of its assumptions. Abbott uses the Black-Scholes method to value stock options. The results of the Black-Scholes model are peri-odically compared to the binomial model and the results have been comparable. Abbott uses both historical volatility of its stock price and the implied volatility of currently traded options to develop the volatility assumptions. Abbott uses the historical grant activity, combined with expectations about future exercise activity, to develop the average life assumptions. Abbott has also used the historical grant data to evalu-ate whether certain holders of stock options exercised their options differently than other holders and has not found any differentiating pattern among holders. Abbott quantified the additional paid in capital amount available for use in determining tax effects of early exercise for
Financial Review

Abbott 2006 Annual Report
68
measurement of tax expense. Abbott used the modified prospective method of adoption. Under this method, prior years’ financial results do not include the impact of recording stock options using fair value. Footnote 9 quantifies the effect in 2005 and 2004 had compensation cost been determined using the fair value method.
Results of OperationsSales
The following table details the components of sales growth by reportable segment for the last three years:
Total % Components of Change %
Change Price Volume Exchange
Total Net Sales
2006 vs. 2005 0.6 (a) 0.6 0.2 (0.2)
2005 vs. 2004 13.5 0.1 12.1 1.3
2004 vs. 2003 13.9 1.6 9.1 3.2
Total U.S.
2006 vs. 2005 (7.5) (a) 2.4 (9.9) —
2005 vs. 2004 13.0 0.8 12.2 —
2004 vs. 2003 12.8 3.8 9.0 —
Total International
2006 vs. 2005 10.9 (1.3) 12.7 (0.5)
2005 vs. 2004 14.2 (0.7) 12.0 2.9
2004 vs. 2003 15.3 (1.0) 8.9 7.4
Pharmaceutical Products Segment
2006 vs. 2005 (9.5) (a) 1.8 (11.0) (0.3)
2005 vs. 2004 14.9 0.6 13.0 1.3
2004 vs. 2003 16.2 3.2 9.6 3.4
Diagnostic Products Segment
2006 vs. 2005 5.9 (1.7) 8.1 (0.5)
2005 vs. 2004 11.2 (0.7) 9.9 2.0
2004 vs. 2003 11.1 (1.2) 6.9 5.4
Nutritional Products Segment
2006 vs. 2005 9.6 (0.4) 9.7 0.3
2005 vs. 2004 9.7 (0.5) 9.4 0.8
2004 vs. 2003 10.2 (0.1) 8.9 1.4
Vascular Products Segment
2006 vs. 2005 327.7 (4.6) 333.2 (0.9)
2005 vs. 2004 14.7 (0.4) 14.5 0.6
2004 vs. 2003 19.3 (1.7) 21.0 —
(a) The Pharmaceutical Products segment had an agreement with Boehringer Ingelheim (BI)
to co-promote and distribute three of its products in the U.S. In 2005, Abbott and BI
amended the agreement and effective January 1, 2006, Abbott no longer distributed or
recorded sales for distribution activities for the BI products. The increases in sales for
2006 excluding BI products were 11.6 percent for total net sales, 12.3 percent for total
U.S. sales and 7.8 percent for Pharmaceutical Products segment sales.
A comparison of significant product group sales is as follows. Percent changes are versus the prior year and are based on unrounded numbers.
Percent Percent Percent
(dollars in millions) 2006 Change 2005 Change 2004 Change
Pharmaceuticals —
U.S. Specialty $3,505 25 $2,799 16 $2,410 26
U.S. Primary Care 2,505 2 2,463 — 2,466 12
International
Pharmaceuticals 5,157 8 4,776 14 4,202 18
Diagnostics —
Immunoassay 2,272 4 2,187 2 2,141 2
Diabetes Care 1,136 6 1,067 35 791 46
Nutritionals —
U.S. Pediatric
Nutritionals 1,128 3 1,097 (4) 1,146 5
International
Pediatric Nutritionals 899 29 698 17 598 13
U.S. Adult
Nutritionals 1,097 2 1,077 15 934 15
International
Adult Nutritionals 785 10 716 8 665 13
Increased sales volume of HUMIRA and increased volume and price for Kaletra and Depakote favorably impacted U.S. Specialty sales. Increased sales volume for TriCor and Omnicef favorably impacted U.S. Primary Care sales and were partially offset by lower U.S. sales of Biaxin due primarily to generic competition for the immediate-release formulation. U.S. sales of Biaxin were $151 million, $306 million and $458 million in 2006, 2005 and 2004, respectively. Increased sales volume of HUMIRA favorably impacted International Pharmaceuticals sales, partially offset by decreased sales volume in 2006 due to generic competition for clarithromycin. Diabetes Care product sales growth in 2005 and 2004 was favorably impacted by the acquisition of TheraSense in the second quarter of 2004. The decrease in sales of U.S. pediatric nutritionals in 2005 was primarily due to overall infant nutritionals non-WIC category decline and competitive share loss. International Pediatric Nutritionals sales increases were due primarily to volume growth in developing countries. U.S. Adult Nutritionals sales in 2005 and 2004 were favorably impacted by the acquisition of EAS in the fourth quarter of 2004. Abbott has periodically sold product rights to non-strategic products and has recorded the related gains in net sales in accordance with Abbott’s revenue recognition policies as discussed in footnote 1 to the consolidated financial statements. Related net sales were $199 million in 2006, $177 million in 2005 and $144 million in 2004.
Financial Review
69
Abbott 2006 Annual Report
The expiration of licenses, patent protection and generic competition can affect the future revenues and operating income of Abbott. Significant ongoing generic activities, and significant patent and license expirations in the next three years are as follows. The U.S. composi-tion of matter patent for Depakote expires in 2008. Abbott holds non-composition of matter patents on the extended release form of Depakote. U.S. sales of Depakote in 2006 were $1.2 billion. In 2004, the FDA granted approval for generic competition to Synthroid and generic competitors have entered the market. U.S. sales of Synthroid were $470 million in 2006 and $498 million in 2005. Clarithromycin is now subject to generic competition in most European markets. European market sales of clarithromycin in 2006 and 2005 were $329 million and $416 million, respectively. In the U.S., clarithromycin is marketed in two forms, the immediate release and the extended release forms. In May 2005, the composition of matter patent on clar-ithromycin expired, and several immediate release generic products were launched by competitors. Abbott holds non-composition of matter patents for the extended release form of clarithromycin. In December 2006, an extended release generic product was launched by a competitor. The U.S. District Court of the Northern District of Illinois has denied Abbott’s request for grant of a temporary restraining order against the competitor. There may be further generic competition for clarithromycin in other countries in 2007 depending on the results of legal proceedings related to the patents. Upon the December 2005 expiration of a court order related to licenses for sevoflurane, Baxter is now permitted to market a competitive form of sevoflurane. In addi-tion, sevoflurane has been subject to generic competition from other competitors in isolated markets outside of the U.S. and further generic competition in international markets is possible. Worldwide sales of sevoflurane in 2006 and 2005 were $799 million and $874 million, respectively. The composition of matter patent for Omnicef expires in May 2007. Abbott holds an additional non-composition of matter pat-ent for Omnicef. Sales of Omnicef in 2006 and 2005 were $637 million and $495 million, respectively. The Pharmaceutical Products segment markets all of the above products. The patent for Prevacid, which is licensed by TAP Pharmaceuticals (TAP), expires in 2009. Abbott records TAP’s results on the equity method.
Operating Earnings
Gross profit margins were 56.3 percent of net sales in 2006, 52.4 per-cent in 2005 and 54.9 percent in 2004. The increase in the gross profit margin in 2006 was due to favorable product mix, primarily as a result of decreased sales of Boehringer Ingelheim products that have lower margins than for other products in the Pharmaceutical Products seg-ment and the decrease in the gross profit margin in 2005 was due to unfavorable product mix, primarily as a result of increased sales of Boehringer Ingelheim products. Restructuring charges, discussed below, reduced the gross profit margins in 2006 and 2005 by 1.1 per-centage points and 0.8 percentage points, respectively. The gross profit margin in 2004 was impacted by the favorable mix effect of exchange on the gross profit margin and by unfavorable product mix, primarily increased sales of lower margin Boehringer Ingelheim prod-ucts in the Pharmaceutical Products segment. Gross profit margins in all years were also affected by productivity improvements, higher proj-ect expenses for new products, higher manufacturing capacity costs for anticipated unit growth and the effects of inflation.
In the U.S., states receive price rebates from manufacturers of infant formula under the federally subsidized Special Supplemental Food Program for Women, Infants, and Children. There are also rebate pro-grams for pharmaceutical products. These rebate programs continue to have a negative effect on the gross profit margins of the Nutritional and Pharmaceutical Products segments. In addition, pricing pressures unfavorably impacted the gross profit margins for the Nutritional Products segment in 2006, 2005 and 2004.
The gross profit margins for the Pharmaceutical Products segment were favorably impacted in 2006 and unfavorably impacted in 2005 and 2004 by product mix. The favorable product mix in 2006 was due to decreased sales of lower margin Boehringer Ingelheim products and the unfavorable product mix in 2005 and 2004 was due primarily to increased sales of lower margin Boehringer Ingelheim products and higher other manufacturing costs.
Research and development expense, excluding acquired in-process and collaborations research and development, was $2.3 billion in 2006, $1.8 billion in 2005 and $1.7 billion in 2004 and represented increases of 23.8 percent in 2006, 7.3 percent in 2005 and 4.5 per-cent in 2004. The effect of recording compensation expense relating to share-based awards and additional costs associated with Abbott’s decision to discontinue the commercial development of the ZoMaxx drug-eluting stent increased research and development expenses by 6.3 percentage points over 2005. The remaining increase was due to the acquisition of Guidant’s vascular intervention and endovascular solutions businesses and increased spending to support pipeline programs, including follow-on indications for HUMIRA, and other late-stage clinical programs in pharmaceuticals, diabetes care and vascular. The majority of research and development expenditures are concentrated on pharmaceutical products.
Selling, general and administrative expenses increased 15.5 percent in 2006 compared to increases of 11.7 percent in 2005 and 2.4 per-cent in 2004. 2006 includes the effect of recording compensation expense relating to share-based awards, a philanthropic contribution to the Abbott Fund and the acquisition of Guidant’s vascular interven-tion and endovascular solutions businesses. These items increased selling, general and administrative expenses by 8.6 percentage points over 2005. The restructuring charges discussed below and an increase in a bad debt reserve associated with an unfavorable court ruling increased the percent change from 2004 by 2.7 percentage points in 2005. In 2003, Abbott recorded in selling, general and administrative expenses, a pretax charge of $614 million related to a settlement. This 2003 charge reduced the increase in selling, general and administrative expenses by 15.0 percentage points for 2004. The remaining increases in selling, general and administrative expenses were due primarily to increased selling and marketing support for new and existing products, including continued spending for HUMIRA, as well as spending on other marketed pharmaceutical products. These increases also reflect the effects of the acquisitions of TheraSense and EAS in 2004. Increases in all three years also reflect inflation and additional selling and marketing support primarily in the Pharmaceutical Products segment.
Financial Review
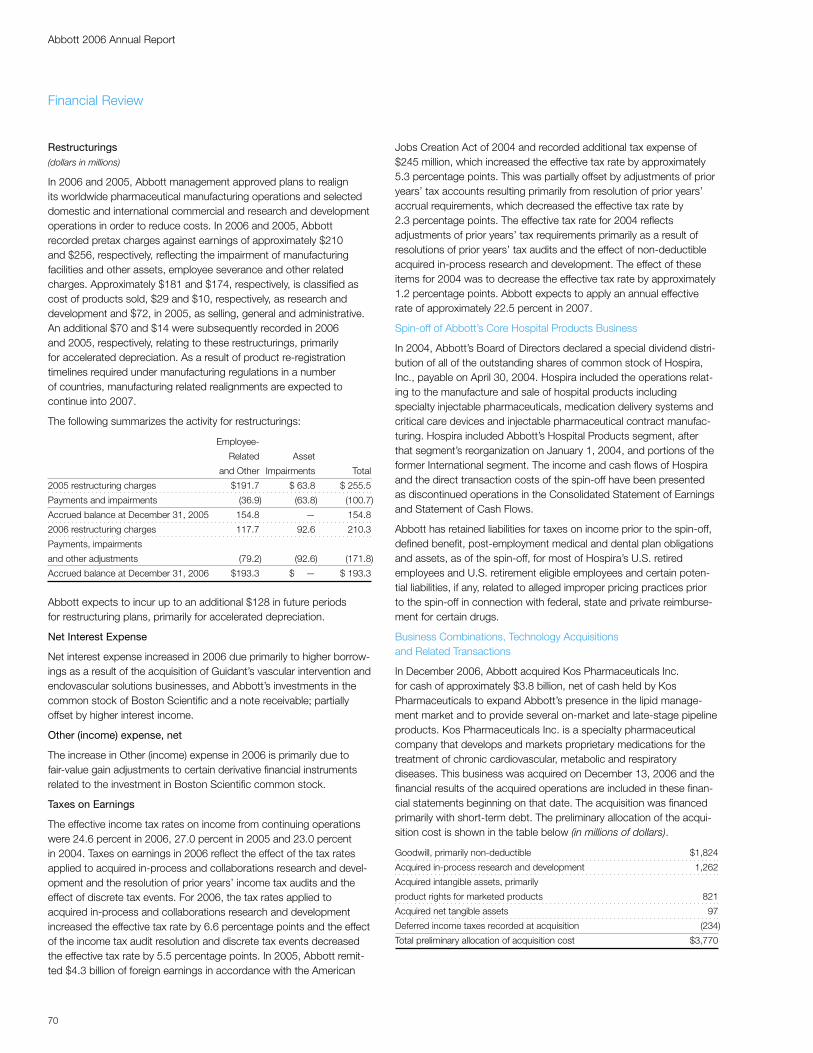
Abbott 2006 Annual Report
70
Restructurings(dollars in millions)
In 2006 and 2005, Abbott management approved plans to realign its worldwide pharmaceutical manufacturing operations and selected domestic and international commercial and research and development operations in order to reduce costs. In 2006 and 2005, Abbott recorded pretax charges against earnings of approximately $210 and $256, respectively, reflecting the impairment of manufacturing facilities and other assets, employee severance and other related charges. Approximately $181 and $174, respectively, is classified as cost of products sold, $29 and $10, respectively, as research and development and $72, in 2005, as selling, general and administrative. An additional $70 and $14 were subsequently recorded in 2006 and 2005, respectively, relating to these restructurings, primarily for accelerated depreciation. As a result of product re-registration timelines required under manufacturing regulations in a number of countries, manufacturing related realignments are expected to continue into 2007.
The following summarizes the activity for restructurings:
Employee-
Related Asset
and Other Impairments Total
2005 restructuring charges $191.7 $ 63.8 $ 255.5
Payments and impairments (36.9) (63.8) (100.7)
Accrued balance at December 31, 2005 154.8 — 154.8
2006 restructuring charges 117.7 92.6 210.3
Payments, impairments
and other adjustments (79.2) (92.6) (171.8)
Accrued balance at December 31, 2006 $193.3 $ — $ 193.3
Abbott expects to incur up to an additional $128 in future periods for restructuring plans, primarily for accelerated depreciation.
Net Interest Expense
Net interest expense increased in 2006 due primarily to higher borrow-ings as a result of the acquisition of Guidant’s vascular intervention and endovascular solutions businesses, and Abbott’s investments in the common stock of Boston Scientific and a note receivable; partially offset by higher interest income.
Other (income) expense, net
The increase in Other (income) expense in 2006 is primarily due to fair-value gain adjustments to certain derivative financial instruments related to the investment in Boston Scientific common stock.
Taxes on Earnings
The effective income tax rates on income from continuing operations were 24.6 percent in 2006, 27.0 percent in 2005 and 23.0 percent in 2004. Taxes on earnings in 2006 reflect the effect of the tax rates applied to acquired in-process and collaborations research and devel-opment and the resolution of prior years’ income tax audits and the effect of discrete tax events. For 2006, the tax rates applied to acquired in-process and collaborations research and development increased the effective tax rate by 6.6 percentage points and the effect of the income tax audit resolution and discrete tax events decreased the effective tax rate by 5.5 percentage points. In 2005, Abbott remit-ted $4.3 billion of foreign earnings in accordance with the American
Jobs Creation Act of 2004 and recorded additional tax expense of $245 million, which increased the effective tax rate by approximately 5.3 percentage points. This was partially offset by adjustments of prior years’ tax accounts resulting primarily from resolution of prior years’ accrual requirements, which decreased the effective tax rate by 2.3 percentage points. The effective tax rate for 2004 reflects adjustments of prior years’ tax requirements primarily as a result of resolutions of prior years’ tax audits and the effect of non-deductible acquired in-process research and development. The effect of these items for 2004 was to decrease the effective tax rate by approximately 1.2 percentage points. Abbott expects to apply an annual effective rate of approximately 22.5 percent in 2007.
Spin-off of Abbott’s Core Hospital Products Business
In 2004, Abbott’s Board of Directors declared a special dividend distri-bution of all of the outstanding shares of common stock of Hospira, Inc., payable on April 30, 2004. Hospira included the operations relat-ing to the manufacture and sale of hospital products including specialty injectable pharmaceuticals, medication delivery systems and critical care devices and injectable pharmaceutical contract manufac-turing. Hospira included Abbott’s Hospital Products segment, after that segment’s reorganization on January 1, 2004, and portions of the former International segment. The income and cash flows of Hospira and the direct transaction costs of the spin-off have been presented as discontinued operations in the Consolidated Statement of Earnings and Statement of Cash Flows.
Abbott has retained liabilities for taxes on income prior to the spin-off, defined benefit, post-employment medical and dental plan obligations and assets, as of the spin-off, for most of Hospira’s U.S. retired employees and U.S. retirement eligible employees and certain poten-tial liabilities, if any, related to alleged improper pricing practices prior to the spin-off in connection with federal, state and private reimburse-ment for certain drugs.
Business Combinations, Technology Acquisitions and Related Transactions
In December 2006, Abbott acquired Kos Pharmaceuticals Inc. for cash of approximately $3.8 billion, net of cash held by Kos Pharmaceuticals to expand Abbott’s presence in the lipid manage-ment market and to provide several on-market and late-stage pipeline products. Kos Pharmaceuticals Inc. is a specialty pharmaceutical company that develops and markets proprietary medications for the treatment of chronic cardiovascular, metabolic and respiratory diseases. This business was acquired on December 13, 2006 and the financial results of the acquired operations are included in these finan-cial statements beginning on that date. The acquisition was financed primarily with short-term debt. The preliminary allocation of the acqui-sition cost is shown in the table below (in millions of dollars).
Goodwill, primarily non-deductible $1,824
Acquired in-process research and development 1,262
Acquired intangible assets, primarily
product rights for marketed products 821
Acquired net tangible assets 97
Deferred income taxes recorded at acquisition (234)
Total preliminary allocation of acquisition cost $3,770
Financial Review

71
Abbott 2006 Annual Report
Acquired intangible assets will be amortized over 1 to 15 years. Non-deductible acquired in-process research and development was charged to income in 2006. The net tangible assets acquired consist primarily of trade accounts receivable, inventories and property and equipment, net of assumed liabilities, primarily accrued salaries and wages and other liabilities.
In order to expand Abbott’s presence in the growing vascular market, Abbott acquired Guidant’s vascular intervention and endovascular solutions businesses for approximately $4.1 billion, in cash, in connec-tion with Boston Scientific’s acquisition of Guidant. These businesses were acquired on April 21, 2006 and the financial results of the acquired operations are included in these financial statements begin-ning on that date. In addition, Abbott will also pay to Boston Scientific $250 million each upon government approvals to market the XIENCE V drug-eluting stent in the U.S. and in Japan. Each $250 million pay-ment will result in the recording of additional goodwill. The preliminary allocation of the acquisition cost is shown in the table below (in millions of dollars). The valuation of intellectual property, including intangible assets and acquired in-process research and development, is sub-stantially complete, but the valuations of the other assets and liabilities are preliminary. The allocation will be finalized when certain information regarding the other assets and liabilities is known.
Goodwill, primarily deductible $1,688
Acquired intangible assets, primarily
product rights for marketed products 1,195
Acquired in-process research and development 665
Acquired net tangible assets 580
Total preliminary allocation of acquisition cost $4,128
Acquired intangible assets will be amortized over 3 to 15 years (average of approximately 10 years). Tax deductible acquired in-pro-cess research and development was charged to income in 2006. The net tangible assets acquired consist primarily of property and equipment of approximately $530 million, trade accounts receivable of approximately $250 million and inventories of approximately $120 million, net of assumed liabilities, primarily trade accounts payable, litigation reserves and other liabilities.
In order to facilitate Boston Scientific’s acquisition of Guidant, Abbott also acquired 64.6 million shares of Boston Scientific common stock directly from Boston Scientific and loaned $900 million to a wholly-owned subsidiary of Boston Scientific. Abbott is required to dispose of the shares by October 2008. Sales of the shares are limited to approximately 5.4 million shares per month until October 2007. The amount recorded upon the acquisition of the shares includes a dis-count to market, based on an appraisal, to reflect the value of the restrictions on sale. On the date of acquisition, half of the shares were recorded as available for sale in accordance with SFAS No. 115 and the remainder under the cost method in accordance with APB No. 18. As of December 31, 2006, all of the shares are recorded as available for sale in accordance with SFAS No. 115. The loan, which is due in April 2011, is guaranteed by Boston Scientific and bears a favorable effective interest rate of 4 percent, which is reflected in the valuation of the note receivable. In connection with the acquisition of the shares, Boston Scientific is entitled to certain after-tax gains upon Abbott’s sale of the shares. Abbott would retain any gains on the sale of the Boston Scientific shares up to a sales price of $23.83; Boston
Scientific would receive any after-tax gains on the sale of the shares for the portion of the sales price in excess of $23.83 but lower than $26.00; and Boston Scientific would receive one-half of any after-tax gain for the portion of the sales price in excess of $25.99. Based on an appraisal, Abbott recorded approximately $114 million for this gain-sharing derivative financial instrument liability. In addition, Boston Scientific agreed to reimburse Abbott for certain borrowing costs on debt incurred to acquire the Boston Scientific shares. After Abbott incurs the first $10 million of interest cost on debt incurred to acquire the shares, Boston Scientific will reimburse Abbott for the next $60 million of interest cost. Reimbursement for the incremental interest cost will be in the form of additional common stock of Boston Scientific, payable 18 months after the acquisition. Abbott recorded approximately $55 million for this interest derivative financial instrument asset. The effect of recording the shares, the loan to Boston Scientific and the derivative financial instruments at fair value on the date of acquisition resulted in the recording of additional goodwill of approxi-mately $204 million. The financial assets and liability acquired from Boston Scientific were valued and recorded at acquisition as follows (in millions of dollars):
Boston Scientific common stock $1,326
Note receivable 829
Derivative financial instruments, net (59)
Total $2,096
In 2005, Abbott acquired the remaining interest in a small medical products company that was previously accounted for under the equity method of accounting and a less than 50 percent equity interest in a small medical products company. The aggregate cash purchase price was approximately $25 million. Acquisition accounting resulted in the recording of non-tax deductible goodwill of approximately $69 million, intangible assets of approximately $22 million and a charge of approxi-mately $17 million for acquired in-process research and development. In 2005, Abbott acquired additional rights related to HUMIRA for approximately $270 million, which are being amortized over 13 years.
In 2004, Abbott acquired TheraSense, Inc., a leader in the develop-ment, manufacturing and marketing of blood glucose self-monitoring systems, for approximately $1.2 billion in cash; i-STAT Corporation, a manufacturer of point-of-care diagnostic products for blood analysis, for approximately $394 million in cash; EAS, a nutritional company with a portfolio of nationally recognized brands, for approximately $320 million in cash; and Spine Next, a manufacturer of orthopedic spinal implant devices, for approximately $58 million in cash plus additional milestone payments of up to $23 million upon achievement of future targets. Abbott also acquired certain other product technolo-gies for approximately $352 million. These acquisitions resulted in a charge of $271 million for acquired in-process research and devel-opment, intangible assets of approximately $1.3 billion, non-tax deductible goodwill of approximately $923 million and deferred income taxes of approximately $406 million. Acquired intangible assets, primarily trade names, are amortized over 5 to 20 years (average of approximately 14 years).
Had the above acquisitions taken place on January 1 of the previous year, consolidated net sales and income would not have been signifi-cantly different from reported amounts.
Financial Review

Abbott 2006 Annual Report
72
Subsequent Event — Announced Sales of Businesses
On January 18, 2007, Abbott announced that it had agreed to sell its core laboratory diagnostics business, including Abbott Point of Care, to GE for $8.13 billion in cash. The sale is expected to close in the first half of 2007 and is subject to customary closing conditions, including regulatory approvals. The carrying amount of the assets and liabilities included in the sale is estimated to be approximately $2.6 billion and net sales for these businesses were approximately $2.7 billion in 2006. Abbott estimates tax expense of approximately $2.0 billion will be recorded on the gain.
Financial ConditionCash Flow
Net cash from operating activities of continuing operations amounted to $5.3 billion, $5.0 billion and $4.3 billion in 2006, 2005 and 2004, respectively. The increase in cash from operating activities in 2006 compared to 2005 is due to higher net earnings adjusted for after-tax non-cash charges for acquired in-process research and development and share-based compensation and higher contributions to retirement benefit plans in 2005 compared to 2006; partially offset by higher income tax payments in 2006, including tax payments related to the 2005 remittances of foreign earnings under the American Jobs Creation Act. In 2006, 2005 and 2004, $200 million, $641 million and $482 million, respectively, was contributed to the main domestic defined benefit plan. Abbott expects pension funding for its main domestic pension plan of $200 million annually. The increased contri-bution in 2005 was due, in part, to the investment of cash remitted under the American Jobs Creation Act of 2004. Abbott expects annual cash flow from operating activities to continue to exceed Abbott’s capital expenditures and cash dividends.
Debt and Capital
At December 31, 2006, Abbott’s long-term debt rating was AA by Standard & Poor’s Corporation and A1 by Moody’s Investors Service. Abbott has readily available financial resources, including unused lines of credit of $7.0 billion, including a $4 billion short-term facility, that support commercial paper borrowing arrangements. Subsequent to the announced potential acquisition of Kos Pharmaceuticals Inc., Standard and Poor’s affirmed its current debt ratings for Abbott and maintained its current “stable” outlook and Moody’s Investors Service affirmed its current debt ratings for Abbott and affirmed its current “negative” outlook.
In October 2006, the board of directors authorized the purchase of $2.5 billion of Abbott’s common shares from time to time and no shares were purchased under this authorization in 2006. In 2006, 2005 and 2004, Abbott purchased approximately 17.3 million, 30.0 million and 11.7 million, respectively, of its common shares under prior authorizations at a cost of approximately $755 million, $1.3 billion and $500 million, respectively.
Under a registration statement filed with the Securities and Exchange Commission in February 2006, Abbott issued $4.0 billion of long-term debt in 2006 that matures in 2009 through 2016 with interest rates ranging from 5.375 percent to 5.875 percent. Proceeds from this debt were used to pay down domestic commercial paper borrowings that were incurred to partially fund the acquisition of Guidant’s vascular intervention and endovascular solutions businesses. The acquisition of Kos Pharmaceuticals was financed primarily with commercial paper borrowings. In addition, commercial paper borrowings were used to repay $1.9 billion of long-term debt in 2006. In 2005, Abbott borrowed $1.9 billion of long-term debt that matures in May 2008 with variable interest rates above LIBOR. In 2006, $1.6 billion of this debt was paid prior to maturity. In 2004, Abbott issued $1.5 billion of long-term debt that matures in 2009 through 2014 with interest rates ranging from 3.5 percent to 4.35 percent.
Working Capital
At December 31, 2006 current liabilities exceeded current assets by approximately $669 million as a result of increased short-term borrowings used to acquire Kos Pharmaceuticals in December 2006. Working capital was $4.0 billion at December 31, 2005 and $3.9 billion at December 31, 2004.
Capital Expenditures
Capital expenditures of $1.3 billion in 2006, $1.2 billion in 2005 and $1.3 billion in 2004 were principally for upgrading and expanding manufacturing, research and development, investments in information technology and administrative support facilities in all segments, and for laboratory instruments placed with customers.
Contractual Obligations
The following table summarizes Abbott’s estimated contractual obligations as of December 31, 2006.
Financial Review
(dollars in millions) Payment Due By Period
2012 and
Total 2007 2008-2009 2010-2011 Thereafter
Long-term debt, including current maturities and future interest payments $ 9,148 $ 432 $2,775 $2,564 $3,377
Operating lease obligations 404 80 121 80 123
Capitalized auto lease obligations 86 28 58 — —
Purchase commitments (a) 2,751 2,574 130 36 11
Other long-term liabilities reflected on the consolidated balance sheet —
Benefit plan obligations 1,964 — 279 312 1,373
Other 1,141 — 558 207 376
Total $15,494 $3,114 $3,921 $3,199 $5,260
(a) Purchase commitments are for purchases made in the normal course of business to meet operational and capital expenditure requirements.
73
Abbott 2006 Annual Report
Contingent Obligations
Abbott has periodically entered into agreements in the ordinary course of business, such as assignment of product rights, with other compa-nies which has resulted in Abbott becoming secondarily liable for obligations that Abbott was previously primarily liable. Since Abbott no longer maintains a business relationship with the other parties, Abbott is unable to develop an estimate of the maximum potential amount of future payments, if any, under these obligations. Based upon past experience, the likelihood of payments under these agree-ments is remote. In addition, Abbott periodically acquires small companies or product rights in which Abbott agrees to pay contingent consideration based on attaining certain thresholds.
In connection with the acquisition of the common shares of Boston Scientific, Boston Scientific is entitled to certain after-tax gains, if any, upon Abbott’s sales of the Boston Scientific shares. In addition, Abbott has retained liabilities for taxes on income prior to the spin-off of Hospira and certain potential liabilities, if any, related to alleged improper pricing practices in connection with federal, state and private reimbursement for certain drugs.
Recently Issued Accounting Standards
In July 2006, the FASB issued Interpretation No. 48, “Accounting for Uncertainty in Income Taxes.” This Interpretation requires that a recorded tax benefit must be more likely than not of being sustained upon examination by tax authorities based upon its technical merits. The amount of benefit recorded is the largest amount of benefit that is greater than 50 percent likely of being realized upon ultimate settle-ment. Upon adoption, any adjustment will be recorded directly to beginning retained earnings. The Interpretation is effective for Abbott beginning no later than January 1, 2007. Abbott has not yet adopted the provisions of this Interpretation. The adoption of this Interpretation is not expected to have a material effect on Abbott’s January 1, 2007 balance sheet or the 2007 provision for income taxes.
In September 2006, the FASB issued Statement of Financial Accounting Standards (SFAS) No. 157, “Fair Value Measurements.” The new statement establishes a framework for measuring fair value in generally accepted accounting principles and expands disclosures about fair value measurements. This statement is effective for fiscal years beginning after November 15, 2007. Adoption of the provisions of this statement is not expected to have a material effect on the results of operations or financial position of Abbott.
Legislative Issues
In August 2006, the President of the United States signed the Pension Protection Act of 2006. Among other things, the Act establishes new minimum funding requirements for plan years beginning in 2008. Abbott does not expect this Act to significantly impact future fundings of its domestic defined benefit pension plans.
Abbott’s primary markets are highly competitive and subject to sub-stantial government regulation throughout the world. Abbott expects debate to continue over the availability, method of delivery, and pay-ment for health care products and services. Abbott believes that if legislation is enacted, it could have the effect of reducing access to health care products and services, or reducing prices or the rate of price increases for health care products and services. It is not possible to predict the extent to which Abbott or the health care industry in general might be adversely affected by these factors in the future. A more complete discussion of these factors is contained in Item 1, Business, and Item 1A, Risk Factors on Form 10-K.
Private Securities Litigation Reform Act of 1995 — A Caution Concerning Forward-Looking Statements
Under the safe harbor provisions of the Private Securities Litigation Reform Act of 1995, Abbott cautions investors that any forward-look-ing statements or projections made by Abbott, including those made in this document, are subject to risks and uncertainties that may cause actual results to differ materially from those projected. Economic, competitive, governmental, technological and other factors that may affect Abbott’s operations are discussed in 1A, Risk Factors, to the Annual Report on Form 10-K.
Financial Review

Abbott 2006 Annual Report
74
Year ended December 31 2006 2005 2004 2003 2002 2001 2000
Summary of Operations:
Net Sales $22,476.3 22,337.8 19,680.0 17,280.3 15,279.5 13,918.5 11,520.6
Cost of products sold $ 9,815.1 10,641.1 8,884.2 7,774.2 6,820.5 6,107.1 4,762.1
Research and development (a) $ 2,255.3 1,821.2 1,696.8 1,623.8 1,474.5 1,491.8 1,245.6
Selling, general and administrative $ 6,349.7 5,496.1 4,921.8 4,808.1 3,724.9 3,491.0 2,669.6
Operating earnings $ 2,042.2 4,362.3 3,898.3 2,974.0 3,151.9 1,498.2 2,981.9
Interest expense $ 416.2 241.4 200.2 188.3 238.9 307.3 113.9
Interest income $ (123.8) (87.7) (51.1) (41.9) (33.5) (71.4) (90.1)
Other (income), net $ (526.5) (411.3) (376.4) (559.5) (374.4) (231.3) (436.9)
Earnings from continuing
operations before taxes $ 2,276.4 4,619.9 4,125.6 3,387.2 3,321.0 1,493.6 3,395.0
Taxes on earnings from
continuing operations $ 559.6 1,247.9 949.8 882.4 774.0 215.9 906.1
Earnings from continuing operations $ 1,716.8 3,372.1 3,175.8 2,504.7 2,547.0 1,277.7 2,488.9
Basic earnings per share
from continuing operations $ 1.12 2.17 2.03 1.60 1.63 0.82 1.61
Diluted earnings per share
from continuing operations $ 1.12 2.16 2.02 1.59 1.62 0.82 1.59
Financial Position:
Working capital $ (669.3) 3,970.5 3,908.8 2,650.9 2,119.6 492.4 3,078.7
Long-term investments $ 1,229.9 134.0 145.8 406.4 250.8 647.2 638.0
Net property and equipment $ 6,946.4 6,003.1 6,007.9 6,281.8 5,828.1 5,551.5 4,816.9
Total assets $36,178.2 29,141.2 28,767.5 26,039.3 23,592.7 22,755.5 14,796.7
Long-term debt $ 7,009.7 4,571.5 4,787.9 3,452.3 4,274.0 4,335.5 1,076.4
Shareholders’ investment $14,054.2 14,415.3 14,325.8 13,072.3 10,664.6 9,059.4 8,570.9
Return on shareholders’ investment
from continuing operations % 12.1 23.5 23.8 22.6 28.0 15.9 34.4
Book value per share $ 9.14 9.37 9.18 8.36 6.82 5.83 5.54
Other Statistics:
Gross profit margin % 56.3 52.4 54.9 55.0 55.4 56.1 58.7
Research and development to net sales % 10.0 8.2 8.6 9.4 9.7 10.7 10.8
Net cash from operating activities
of continuing operations $ 5,262.1 5,047.4 4,306.0 3,385.2 3,653.5 3,083.7 2,780.0
Capital expenditures $ 1,337.8 1,207.5 1,291.6 1,050.1 1,105.4 963.6 836.8
Cash dividends declared per common share $ 1.18 1.10 1.04 0.98 0.94 0.84 0.76
Common shares outstanding (in thousands) 1,537,243 1,539,235 1,560,024 1,564,518 1,563,068 1,554,530 1,545,934
Number of common shareholders 77,727 82,237 88,582 91,212 94,687 97,760 101,272
Number of employees 66,663 59,735 60,617 58,181 57,819 56,426 45,571
Sales per employee (in dollars) $ 337,163 373,948 324,662 297,010 264,265 246,668 252,806
Market price per share – high $ 49.87 50.00 47.63 47.15 58.00 57.17 56.25
Market price per share – low $ 39.18 37.50 38.26 33.75 29.80 42.00 29.375
Market price per share – close $ 48.71 39.43 46.65 46.60 40.00 55.75 48.438(a) In 2006, 2005, 2004, 2003, 2002 and 2001 Abbott also recorded pretax charges of $2,014, $17, $279, $100, $108 and $1,330 for acquired in-process research and development related
to business acquisitions.
Summary of Selected Financial Data(dollars in millions, except per share data)

Directors
Roxanne S. AustinFormer President and Chief Operating Officer,DIRECTV, Inc.El Segundo, Calif.
William M. DaleyChairman of the Midwest, JPMorgan Chase & Co.Chicago, Ill.
W. James Farrell Former Chairman and Chief Executive Officer, Illinois Tool Works, Inc. Glenview, Ill.
H. Laurance FullerRetired Co-Chairman of the Board, BP Amoco, p.l.c. London, United Kingdom
Richard A. GonzalezPresident and Chief Operating Officer,Abbott
Jack M. GreenbergChairman, The Western Union Company, Greenwood Village, Colo.Retired Chairman and Chief Executive Officer, McDonald’s Corp.Oak Brook, Ill.
The Rt. Hon. Lord Owen CHChairman of Europe Steel, p.l.c.London, United Kingdom
Boone Powell, Jr.Retired Chairman,Baylor Health Care SystemDallas, Texas
W. Ann Reynolds, Ph.D.Former President, The University of Alabama at BirminghamBirmingham, Ala.
Roy S. RobertsManaging Director, Reliant Equity InvestorsChicago, Ill. William D. SmithburgRetired Chairman, President and Chief Executive Officer,The Quaker Oats Co.Chicago, Ill.
Miles D. WhiteChairman of the Boardand Chief Executive Officer,Abbott
Senior Management
Miles D. White*Chairman of the Boardand Chief Executive Officer
Richard A. Gonzalez*President and Chief Operating Officer
Thomas C. Freyman*Executive Vice President, Finance and Chief Financial Officer
Richard W. Ashley*Executive Vice President,Corporate Development
William G. Dempsey*Executive Vice President, Pharmaceutical Products Group
Holger Liepmann*Executive Vice President, Global Nutrition
Joseph M. Nemmers, Jr.*Executive Vice President,Diagnostics and Animal Health
Laura J. Schumacher*Executive Vice President,General Counsel and Secretary
Olivier Bohuon*Senior Vice President, International Operations
John M. Capek, Ph.D.*Senior Vice President, Abbott Vascular
Thomas F. Chen*Senior Vice President, Nutrition International Operations
Edward J. Fiorentino Senior Vice President, Abbott and Executive Vice President, TAP
Stephen R. Fussell*Senior Vice President, Human Resources
Robert B. Hance*Senior Vice President, Diabetes Care Operations
John C. Landgraf*Senior Vice President, Global Pharmaceutical Manufacturing and Supply Gary E. McCullough*Senior Vice President, Ross Products
Edward L. Michael*Senior Vice President,Medical Products
James L. Tyree*Senior Vice President,Pharmaceutical Operations
Corporate Vice Presidents
Carlos Alban,Vice President, European Operations
Greg E. ArnsdorffVice President and President,Point of Care
Alejandro A. Aruffo, Ph.D.Vice President, Global Pharmaceutical Development
Catherine V. BabingtonVice President, Public Affairs
Michael G. Beatrice, Ph.D.Vice President, Corporate Regulatory and Quality Science
Charles M. BrockVice President, Chief Ethics and Compliance Officer
William E. Brown III, Ph.D.Vice President, Diagnostic Assays and Systems Development
Douglas C. BryantVice President, Abbott Vascular, Asia/Japan
Jaime ContrerasVice President, Diagnostic Commercial Operations, Europe, Africa and Middle East
Thomas J. DeeVice President, Internal Audit
Charles D. Foltz Vice President, Vascular Solutions
Robert E. FunckVice President and Treasurer
Honey Lynn GoldbergVice President and Associate General Counsel,Medical Products Group
Lawrence E. KrausVice President, Manufacturing,Global Pharmaceutical Operations
Zahir A. LavjiVice President, Global Commercial Operations, Abbott Diabetes Care
Elaine R. LeavenworthVice President, Government Affairs
John M. Leonard, M.D.Vice President, Global Pharmaceutical Research and Development
Greg W. Linder*Vice President and Controller
Richard J. MarascoVice President, Nutrition International, Europe and Canada
Heather L. MasonVice President,International Marketing
Mark MastersonVice President, Pacific, Asiaand Africa Operations
P. Loreen MershimerVice President, Pharmaceutical Products, IntegratedHealthcare Marketing and Policy
Sean E. MurphyVice President, Global Licensing/New Business Development
Daniel W. Norbeck, Ph.D.Vice President, Global Pharmaceutical Discovery
D. Stafford O’KellyVice President, Latin America and Canada
Donald V. Patton, Jr.Vice President, Diagnostic Global Commercial Operations
Kevin P. RhatiganVice President and President, U.S. Cardiovascular Commercial Operations
AJ J. ShoultzVice President, Taxes
Preston T. SimonsVice President, Information Technology
R. Nicholas SpauldingVice President and President, International Cardiovascular Commercial Operations
Eugene Sun, M.D.Vice President, Global PharmaceuticalClinical Development
Mary T. SzelaVice President, Commercial Pharmaceutical Operations
John B. Thomas Vice President, Investor Relations
Michael J. WarmuthVice President, Global Engineering Services
Glenn S. WarnerVice President, Japan Operations
Susan M. WidnerVice President, Corporate Marketing
Directors and Corporate Officers
*Denotes executive officers 75
Abbott 2006 Annual Report

Shareholder and Corporate Information
Stock Listing
The ticker symbol for Abbott’s common stock is ABT. It is listed on the New York, Chicago, London and Swiss exchanges. It is traded on the Boston, Philadelphia and National Stock Exchanges, as well as on the NYSE Arca and NASDAQ iM markets.
Quarterly Dividend Dates
Dividends are expected to be declared and paid on the following schedule in 2007, pending approval by the board of directors:
Quarter Declared Record Paid
First 2/16 4/13 5/15
Second 6/15 7/13 8/15
Third 9/14 10/15 11/15
Fourth 12/14 1/15/08 2/15/08
Tax Information for Shareholders
Abbott is an Illinois High Impact Business and is located in a U.S. federal Foreign Trade Sub-Zone (Sub-Zone 22F). Dividends may be eligible for a subtraction from base income for Illinois income tax purposes.
If you have any questions, please contact your tax advisor.
Dividend Reinvestment Plan
The Abbott Dividend Reinvestment Plan offers registered shareholders an opportunity to purchase additional shares, commission-free, through automatic dividend reinvestment and/or optional cash investments. Interested persons may contact the transfer agent, call Abbott’s Investor Newsline or write Abbott Shareholder Services.
Dividend Direct Deposit
Shareholders may have quarterly dividends deposited directly into a checking or savings account at any financial institution that participates in the Automated Clearing House system. For more information, please contact the transfer agent, call the Investor Newsline or write Abbott Shareholder Services.
Annual Meeting
The annual meeting of shareholders will be held at 9 a.m. on Friday, April 27, 2007, at Abbott’s corporate headquarters. Questions regarding the annual meeting may be directed to the Corporate Secretary.
A copy of Abbott’s 2006 Form 10-K Annual Report, as filed with the Securities and Exchange Commission, is available on the Abbott Web site at www.abbott.com or by contacting the Investor Newsline.
CEO and CFO Certifications
In 2006, Abbott’s chief executive officer (CEO) provided to the New York Stock Exchange the annual CEO certification regarding Abbott’s compliance with the New York Stock Exchange’s corporate governance listing standards. In addition, Abbott’s CEO and chief financial officer filed with the U.S. Securities and Exchange Commission all required certifications regarding the quality of Abbott’s public disclosures in its fiscal 2006 reports.
Investor Newsline(847) 937-7300
Investor RelationsDept. 362, AP6D2
Shareholder ServicesDept. 312, AP6D2
Corporate SecretaryDept. 364, AP6D2
Abbott 100 Abbott Park Road Abbott Park, IL 60064-6400 U.S.A. (847) 937-6100
Web Site
www.abbott.com
Global Citizenship Report
Visit www.abbott.com/citizenship to read Abbott’s current global citizenship report.
Transfer Agent and Registrar
Computershare P.O. Box 43078 Providence, RI 02940-3078 (888) 332-2268 www.computershare.com
Shareholder Information
Shareholders with questions about their accounts may contact the transfer agent, call the Investor Newsline or write Abbott Shareholder Services.
Individuals who would like to receive additional information or have questions regarding Abbott’s business activities may call the Investor Newsline, write Abbott Investor Relations or visit Abbott’s Web site.
Abbott trademarks and products in-licensed by Abbott are shown in italics in the text of this report. Crestor and Herceptin are not trademarks of Abbott Laboratories. © 2007, Abbott Laboratories
Printed on Recycled Paper
Some statements in this annual report may be forward-looking statements for purposes of the Private Securities Litigation Reform Act of 1995. Abbott cautions that these forward-looking statements are subject to risks and uncertainties that may cause actual results to differ materially from those indicated in the forward-looking statements. Economic, competitive, governmental, technological and other factors that may affect Abbott’s operations are discussed in Item 1A, “Risk Factors,” in our Securities and Exchange Commission 2006 Form 10-K and are incorporated by reference. We undertake no obligation to release publicly any revisions to forward-looking statements as the result of subsequent events or developments.
76
Abbott 2006 Annual Report


Abbott100 Abbott Park Road, Abbott Park, IL 60064-6400 U.S.A.(847) 937-6100 www.abbott.com