abbatelli - bb mini-project
TRANSCRIPT

Nick Abbatelli Cal Poly SLO – Business – Industrial Technology
10/14/14 Mini-Project – Abbatelli 1
Lean Six Sigma Black Belt Mini-Project
Extended Education – NCR 9635
Project Title: Setup Time Reduction (Roll)
Prepared by Nick Abbatelli
[email protected] – (408) 838-2097
Company: GM Nameplate (San Jose, CA)
August 29th, 2014

Nick Abbatelli Cal Poly SLO – Business – Industrial Technology
10/14/14 Mini-Project – Abbatelli 2
EXECUTIVE SUMMARY This Mini-Project was conducted at GM Nameplate in San Jose, CA. GM Nameplate specializes in roll products. Some of the processes include: flexographic printing, digital printing, screen printing, laminating and die cutting. The mission was to reduce setup time of certain production areas in the facility, specifically the flexographic printing areas. Flexographic printing involves unwinding and feeding material into the machine, a printing section, a drying section and then feeding it to a re-winder as a finished roll product. The operational tools consist of rollers (Foundation & Anilox), doctor blades and cylinders (Plate & Impression). Running product through a machine from raw material to finish product account for 20% of the total process on average. More than 70% of the time is spent setting up the machine. An order requires a specific anilox roller, print cylinder and impression cylinder. The impression cylinder is unique to the job because it has a plate that has a logo or cutout per requirements of the job. The plate is mounted onto the impression cylinder before the cylinder is installed. GM Nameplate has an inventory of 5,000+ of these rollers and cylinders. One machine accounts for 72% of these tools. Since the project was on a strict and short timeline, it focused its measurements and analysis on that machine: Nilpeter Flexo Press. The team found the setup time was a little over 68 minutes on average. Following the process of the operators we identified a procedure that could be improved upon. Key tooling are being stored in a separate building on account of storage space in the production area. Operators have to walk over to the separate building, identify and bring back the specified tool to the production area before mounting the plate can even begin. The team recommends improving the identification and planning process so GM Nameplate can reduce the setup time of its Nilpeter machine, ultimately producing more jobs annually.

Nick Abbatelli Cal Poly SLO – Business – Industrial Technology
10/14/14 Mini-Project – Abbatelli 3
DEFINE Tool 1: Project Charter
Why Tool Selected: This document reveals the goals of the project. It can be revised and changed but must always be referenced to. GM Nameplate created a charter to make sure tasks was laid out correctly and in a timely matter.
Interpretation: The Project Charter was reviewed weekly by the project Champion. It gave the team organization to stay on track and keep tasks in proper alignment of each other. Although not every task was completed on time, the charter kept the team on track to the ultimate goal.

Nick Abbatelli Cal Poly SLO – Business – Industrial Technology
10/14/14 Mini-Project – Abbatelli 4
DEFINE Tool 2: Process Flow Chart
Why Tool Selected: A Process Flow Chart (or Process Map) is used to give a visual representation of the steps in the process. The team wanted to find what processes happen once a job gets placed in the work-in-progress bin of the Roll Department?
Interpretation: The process flow chart can improve any process improvement project by increasing the understanding of people involved, flow of information and resources. This chart shows three key processes that must be done before the job can even be ran: identification of tooling, pulling of tooling and the setup, which involves mounting of the tooling pulled.

Nick Abbatelli Cal Poly SLO – Business – Industrial Technology
10/14/14 Mini-Project – Abbatelli 5
MEASURE Tool 1: Histogram
Why Tool Selected: Gathering data in a spreadsheet can be overwhelming. A Histogram provides a visual representation of the data. The team took data from 1 production aspect of the Roll Department to get a gauge upon: Nilpeter Room. What were common setup times of the Nilpeter machine? [Twenty-five jobs within the month of August 2014 where used]
Interpretation: The graph shows a positively skewed set of data with the most common setup time between 60 – 80 minutes. [Note: This data only represents 1 machine out of 5 within the Roll Department. Due to time constraints, this machine was the most viable because it is the only machine that runs constantly 8-hours/day. ]
Nick Abbatelli Cal Poly SLO – Business – Industrial Technology
10/14/14 Mini-Project – Abbatelli 6
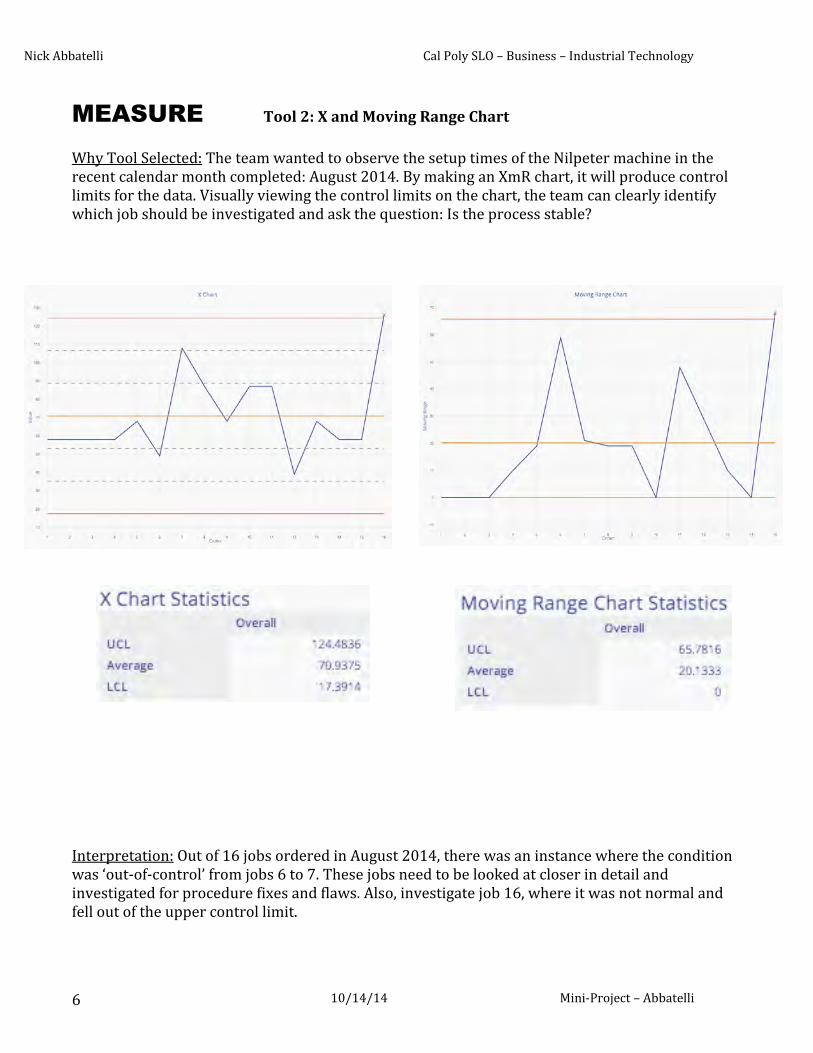
MEASURE Tool 2: X and Moving Range Chart
Why Tool Selected: The team wanted to observe the setup times of the Nilpeter machine in the recent calendar month completed: August 2014. By making an XmR chart, it will produce control limits for the data. Visually viewing the control limits on the chart, the team can clearly identify which job should be investigated and ask the question: Is the process stable?
Interpretation: Out of 16 jobs ordered in August 2014, there was an instance where the condition was ‘out-of-control’ from jobs 6 to 7. These jobs need to be looked at closer in detail and investigated for procedure fixes and flaws. Also, investigate job 16, where it was not normal and fell out of the upper control limit.

Nick Abbatelli Cal Poly SLO – Business – Industrial Technology
10/14/14 Mini-Project – Abbatelli 7
ANALYZE Tool 1: 5 Why Analysis
Why Tool Selected: The team chose to use the 5-Why’s to find a more specific root cause of why roll setup is taking a majority of the roll manufacturing process. The technique proclaims that if you ask “Why?” five times, you can identify an understanding to the ultimate root causes. The team chose to start the ‘Why’ process at, “Why does setup time take so long?”
Nilpeter setup averages over 1 hour
o Why does the setup take so long?
Dies and Tooling are bulky. It takes time to walk over to the next-door building and identify
the die and/or tooling for the specific job
o Why are dies and tooling stored in the next-door building?
Jobs that require previously used dies are warehoused in the building next door because of
its large storage space. Often operators are over there multiple times a day
o Why multiple trips?
Job tickets buildup throughout the day. Operators only see jobs that are progressing
throughout the manufacturing process
o Why don’t operators know of future jobs?
There is no warning system in place to tell operators which dies to pull for future jobs
ahead.
o Why doesn’t Planning Department tell operators the current job schedule?
Interpretation: Root Cause – Planning Department should identify dies & tooling work-in-progress better with the operators to lower the number of trips throughout the day next-door.

Nick Abbatelli Cal Poly SLO – Business – Industrial Technology
10/14/14 Mini-Project – Abbatelli 8
ANALYZE Tool 2: Hypothesis Testing
Why Tool Selected: Operators in the roll department believed setup time takes under an hour. The Six Sigma team decided to use this common estimate as a Null Hypothesis.
Interpretation: Running the numbers in EngineRoom using the Hypothesis Testing tool, the results to reject the Null Hypothesis. The mean of ‘Nilpeter Setup Time’ is greater than 60 minutes,

Nick Abbatelli Cal Poly SLO – Business – Industrial Technology
10/14/14 Mini-Project – Abbatelli 9
IMPROVE Tool 1: 5S
Why Tool Selected: Taking an outsiders perspective inside the Nilpeter Room, it looks dirty and cluttered. There are many distractions inside the room and the 5S tool improves visibility of the process, safety and worker performance. Scan & Sort – Scan the area and sort through unneeded material, equipment, tooling and trash.
Old Material Supply Cabinet Behind Machine Set in Order – Tooling and Instruments should be set in place, easy to find at all times.
Supplies Organized Tooling Organized

Nick Abbatelli Cal Poly SLO – Business – Industrial Technology
10/14/14 Mini-Project – Abbatelli 10
Shine – A clean workspace improves working conditions and the moral of operators.
Clean Aisles
Standardize – Create Shadow Boards for standard tooling and instruments within each working station
Sustain – A 6S board was created within the department for department supervisors to sustain the improvement process. The board also creates friendly departmental competition with audit grades and scores. Interpretation: Although the last 2 S’s could not have been completed due to internship length restrictions, the 5S tool was highly effective within the manufacturing plant. Going through the process with the operators, common remarks were: “I didn’t know when could throw this away,” We can take this out?” and “I haven’t seen anyone use that in a decade.” It proved that taking a simple step back and asking, “Why is this here?” solved many organizational issues.

Nick Abbatelli Cal Poly SLO – Business – Industrial Technology
10/14/14 Mini-Project – Abbatelli 11
IMPROVE Tool 2: Pull Scheduling
Why Tool Selected: Pull Scheduling consist of many aspects: balanced production, quick set-ups, reducing lot size and standardized work to name a few. For this project, the team focused on quick set-ups. How can the operators decrease setup time?
Interpretation: This photo is of the new WIP area for the Nilpeter room. All job orders are looked at, at the beginning of the day and the operators collect plates and cylinders for each job. The red bin is for plates and the bottom shelf is for the cylinders.

Nick Abbatelli Cal Poly SLO – Business – Industrial Technology
10/14/14 Mini-Project – Abbatelli 12
CONTROL Tool 1: CHECK Process
Why Tool Selected: How could GM Nameplate keep operators accountable for their workstations?
Interpretation: This form was created after the 5S activity was completed. It allows supervisors and managers to sustain lean and clean workstations. It also promotes health competition between the production areas amongst the operators.

Nick Abbatelli Cal Poly SLO – Business – Industrial Technology
10/14/14 Mini-Project – Abbatelli 13
CONTROL Tool 2: Standardized Work
Why Tool Selected: How does the operator know which job takes priority?
Interpretation: This photo is of the new WIP area for the Nilpeter room. The metallic bins on the top right of the table consists of 3 staggered bins. The farthest back bin represents job to be completed within the given month. The middle bin represents the weekly job orders. The first bin represents job to be done during the day (top priority).