abb - unizar.es · catalytic mechanism of hydride transfer between nadp+/h and ferredoxin-nadp+...
TRANSCRIPT

www.elsevier.com/locate/yabbi
ABBArchives of Biochemistry and Biophysics 459 (2007) 79–90
Catalytic mechanism of hydride transfer between NADP+/Hand ferredoxin-NADP+ reductase from Anabaena PCC 7119
Jesus Tejero a, Jose Ramon Peregrina a, Marta Martınez-Julvez a, Aldo Gutierrez b,Carlos Gomez-Moreno a, Nigel S. Scrutton b,1, Milagros Medina a,*
a Departamento de Bioquımica y Biologıa Molecular y Celular, Facultad de Ciencias, and Institute of Biocomputation and Physics of Complex
Systems (BIFI), Universidad de Zaragoza, E-50009 Zaragoza, Spainb Department of Biochemistry, University of Leicester, University Road, Leicester LE1 7RH, UK
Received 22 August 2006, and in revised form 20 October 2006Available online 9 November 2006
Abstract
The mechanism of hydride transfer between Anabaena FNR and NADP+/H was analysed using for the first time stopped-flow pho-todiode array detection and global analysis deconvolution. The results indicated that the initial spectral changes, occurring within theinstrumental dead time upon reaction of FNR with NADP+/H, included not only the initial interaction and complex formation, butalso the first subsequent steps of the sequential reactions that involve hydride transfer. Two different charge-transfer complexes formedprior and upon hydride transfer, FNRox-NADPH and FNRrd-NADP+. Detectable amounts of FNRox-NADPH were found at equilib-rium, but FNRrd-NADP+ accumulated to a small extent and quickly evolved. The spectral properties of both charge-transfer complexes,for the first time in Anabaena FNR, as well as the corresponding inter-conversion hydride transfer rates were obtained. The need of anadequate initial interaction between NADP+/H and FNR, and subsequent conformational changes, was also established by studying thereactions of two FNR mutants.� 2006 Elsevier Inc. All rights reserved.
Keywords: Ferredoxin-NADP+ reductase; Hydride transfer; Stopped-flow; Spectra deconvolution
Ferredoxin-NADP+ reductase (FNR2, EC 1.18.1.2) is aFAD-containing enzyme that catalyses electron transfer
0003-9861/$ - see front matter � 2006 Elsevier Inc. All rights reserved.
doi:10.1016/j.abb.2006.10.023
* Corresponding author. Fax: +34 976 762123.E-mail address: [email protected] (M. Medina).
1 Present address: Faculty of Life Sciences and Manchester Interdisci-plinary Biocentre, University of Manchester, Manchester M60 1QD, UK.
2 Abbreviations used: FNR, ferredoxin-NADP+ reductase; FNRox, FNRin the fully oxidised state; FNRrd, FNR in the hydroquinone (fully reduced)state; FNRsq, FNR in the semiquinone state; 2 0-P, 2 0-phosphate group ofNADP+/H; ET, electron transfer; WT, wild-type; CT, charge-transfercomplex; MC, Michaelis–Menten complex; Fd, ferredoxin; Fld, flavodoxin;CT-1, FNRox-NADPH charge-transfer complex; CT-2, FNRrd-NADP+
charge-transfer complex; 2 0-P-AMP, 2 0-P-AMP moiety of the NADP+/H;kA>B, kB>C, apparent rate constants obtained by global analysis of spectralkinetic data; kobs, single-wavelength detected observed rate constant; kHT,kHT-1, hydride transfer first-order rate constants for the direct and reversereactions, respectively; Kd,NADPH, Kd,NADP+, dissociation constants for thereactions of FNR reduction and oxidation, respectively.
(ET) from light reduced ferredoxin (Fd), or flavodoxin(Fld), to NADP+ producing NADPH [1]. This photosyn-thetic role in chloroplasts and cyanobacteria vegetativecells was the first documented physiological function forthis enzyme. Later, flavoproteins with FNR activity werereported in chloroplasts, phototrophic and heterotrophicbacteria, animal and yeast mitochondria and apicoplasts,demonstrating the ubiquity of FNRs among living organ-isms [2]. Photosynthetic FNRs show high specificitytowards NADP+ versus NAD+ [1,3–5]. FNRs from differ-ent organisms, including Anabaena, have been thoroughlycharacterised [6–14]. Moreover, the FNR structure is theprototype of a family of flavin reductases that comprisesNADPH- and NADH-dependent enzymes [15], includingphthalate dioxygenase reductase [16], cytochrome b5 reduc-tase [17], cytochrome P450 reductase [18] or sulphite reduc-tase [19]. All these enzymes contain a flavin-binding

Fig. 1. Environment of the Tyr235 in the Anabaena FNR-NADP+
complex [12]. FAD (orange), NADP+ (yellow), and side-chain of Tyr235(red) are shown as sticks. H-bond interaction between Tyr235 side-chainand the 2 0-P of NADP+ is indicated by a green dashed line. Produced withPyMOL [49].
80 J. Tejero et al. / Archives of Biochemistry and Biophysics 459 (2007) 79–90
domain, which binds a molecule of either FAD or FMN,and a NAD(P)+/H binding domain and, generally operateby using reducing equivalents from the cellular NAD(P)Hpool to provide low-potential electron carriers for oxidore-ductive metabolisms [1,2,20].
Although the main role of FNR in photosyntheticorganisms is reduction of NADP+ by FNRrd, this processis reversible in vivo and in FNRs from different sources [2].Thus, a thorough understanding of FNR catalytic mecha-nism is important owing to its position as prototype for alarge family of enzymes showing similar catalytic mecha-nisms. The mechanism of FNR reduction by NADPHhas been studied [4,5,14,21–30]. In this reaction, oneNADPH molecule reduces the FAD prosthetic group ofthe enzyme to the anionic hydroquinone state by a formalhydride transfer: E-FAD + NADPH � E-FADH� +NADP+. It is commonly accepted [2] that reduction ofFNR by NADPH takes place via a two-step mechanism,in which the first observed process is related to the forma-tion of the FNRox-NADPH (CT-1) charge-transfer com-plex through an intermediate Michaelis–Menten complex(MC-1), followed by hydride transfer to produce an equi-librium mixture of the CT-1 and FNRrd-NADP+ (CT-2)charge-transfer complexes (Scheme 1).
Observed rates for the reaction of FNRox and NADPHhave been estimated to be around 800–500 s�1 for the firststep and 200–100 s�1 for the second one [5,14,26,28,29,31,32]. However, since the first experimentally detect-ed rate is faster than the accurate limit for determinationwith stopped-flow techniques, this model, largely derivedfrom single-wavelength studies at 460 nm and, from studieswhere the spectrum was reconstructed by measurements atdifferent wavelengths [26], might provide inadequate esti-mations of the rate constants and the processes related toeach one. Taking into account that spectral time evolutionhas not been analysed in the case of the Anabaena FNR,that no information about evolution of CT complexeshas been reported for this FNR and, that spinach and Ana-baena FNRs although closely related show differences inthe processes with NADP+/H [14], it appears appropriateto study the reaction of Anabaena FNR with NADP+/Hon the full spectral range.
Thus, we have studied the mechanism of this reaction inAnabaena FNR by using stopped-flow photodiode arrayspectroscopic measurements for the hydride transfer andreduction of the enzyme by NADPH, as well as for thehydride transfer from FNRrd to NADP+. Hydride transfermechanisms were also analysed for two FNR mutants withaltered coenzyme binding properties, Tyr235Ala andTyr235Phe [5]. The Tyr235 side-chain has been shown tostabilize NADP+/H binding through the formation of a
FNRox + NADPH MC-1 CT-1
First step Second st
Scheme
H-bond to the 2 0-P group of the coenzyme and of a stack-ing interaction with the adenine group (Fig. 1) [12].
Materials and methods
Site-directed mutagenesis and protein purification
The Tyr235Phe and Tyr235Ala FNR mutants were produced asdescribed previously [5,32]. The corresponding vectors were used totransform Escherichia coli BL21(DE3) Gold cells (Stratagene). The dif-ferent FNR forms were prepared from E. coli cultures as previouslydescribed [32,33].
Stopped-flow pre-steady-state kinetic measurements
Anaerobic fast kinetic reactions of FNR with either NADPH orNADP+ were followed using an Applied Photophysics SF.17 MV stopped-flow contained within a customized glovebox (Belle Technology) (<5 ppmO2). Under experimental conditions, instrument dead time was �1.8 ms insingle-wavelength mode and �1.28 ms for the photodiode array detector,(for the experiments at 6 �C this instrumental dead time appears toincrease up to �3 ms). All buffers were made oxygen-free prior to intro-duction into the glovebox. Changes in absorbance were used to follow thereaction, either in single-wavelength mode or in a spectral range between290 and 725 nm using a photodiode array detector. In the reactions ofFNRrd with NADP+, 1 mM EDTA and 2 lM 5-deazariboflavin wereadded to the FNR solution in order to photoreduce the enzyme priorinitiating the reaction. Final FNR concentrations used were 25 lM indiode array experiments and 10 lM in single-wavelength ones. A range ofpyridine nucleotide concentrations were used. Multiple wavelengthabsorption data were collected and processed using the X-SCAN software(Applied Photophysics Ltd.). Typically, 400 spectra per second were col-lected for the processes involving WT and Tyr235Phe FNRs and 196 inthe case of the Tyr235Ala FNR. Most of the experiments were carried outat 15 �C in Tris/HCl 50 mM, pH 8.0 (confirmation measurements wererecorded at 6 �C). Photodiode array spectral deconvolution was per-formed by global analysis and numerical integration methods using Pro-K
CT-2 MC-2 FNRrd + NADP+
ep
1.
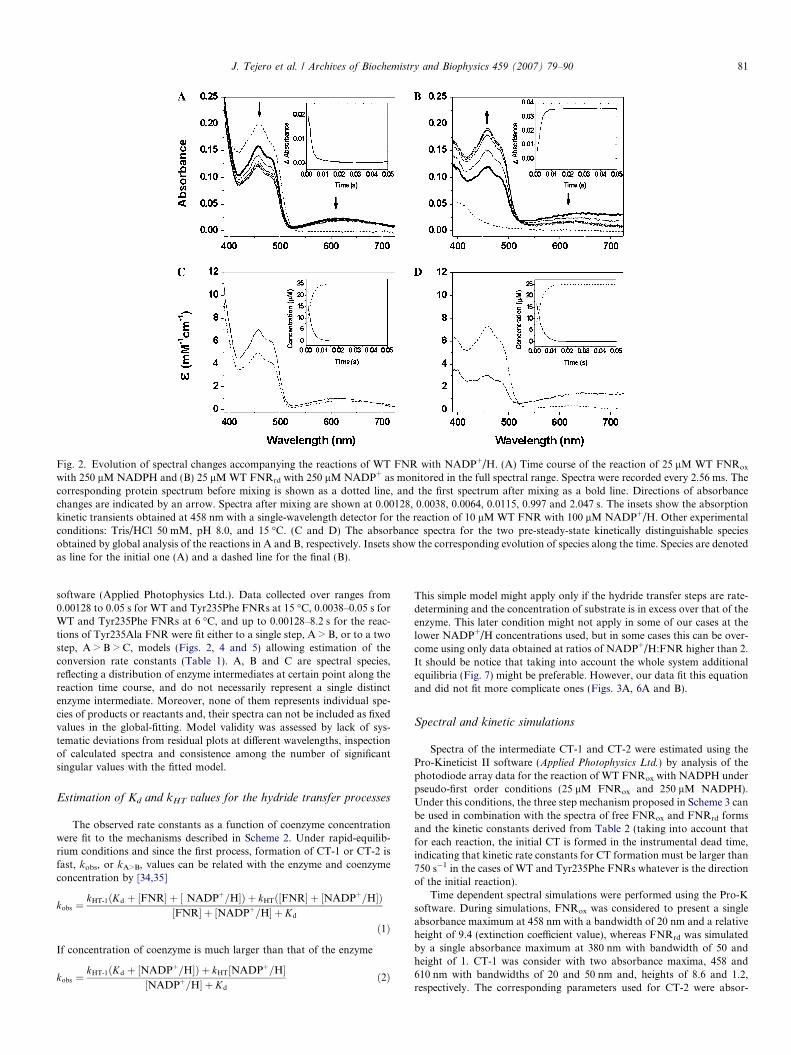
Fig. 2. Evolution of spectral changes accompanying the reactions of WT FNR with NADP+/H. (A) Time course of the reaction of 25 lM WT FNRox
with 250 lM NADPH and (B) 25 lM WT FNRrd with 250 lM NADP+ as monitored in the full spectral range. Spectra were recorded every 2.56 ms. Thecorresponding protein spectrum before mixing is shown as a dotted line, and the first spectrum after mixing as a bold line. Directions of absorbancechanges are indicated by an arrow. Spectra after mixing are shown at 0.00128, 0.0038, 0.0064, 0.0115, 0.997 and 2.047 s. The insets show the absorptionkinetic transients obtained at 458 nm with a single-wavelength detector for the reaction of 10 lM WT FNR with 100 lM NADP+/H. Other experimentalconditions: Tris/HCl 50 mM, pH 8.0, and 15 �C. (C and D) The absorbance spectra for the two pre-steady-state kinetically distinguishable speciesobtained by global analysis of the reactions in A and B, respectively. Insets show the corresponding evolution of species along the time. Species are denotedas line for the initial one (A) and a dashed line for the final (B).
J. Tejero et al. / Archives of Biochemistry and Biophysics 459 (2007) 79–90 81
software (Applied Photophysics Ltd.). Data collected over ranges from0.00128 to 0.05 s for WT and Tyr235Phe FNRs at 15 �C, 0.0038–0.05 s forWT and Tyr235Phe FNRs at 6 �C, and up to 0.00128–8.2 s for the reac-tions of Tyr235Ala FNR were fit either to a single step, A > B, or to a twostep, A > B > C, models (Figs. 2, 4 and 5) allowing estimation of theconversion rate constants (Table 1). A, B and C are spectral species,reflecting a distribution of enzyme intermediates at certain point along thereaction time course, and do not necessarily represent a single distinctenzyme intermediate. Moreover, none of them represents individual spe-cies of products or reactants and, their spectra can not be included as fixedvalues in the global-fitting. Model validity was assessed by lack of sys-tematic deviations from residual plots at different wavelengths, inspectionof calculated spectra and consistence among the number of significantsingular values with the fitted model.
Estimation of Kd and kHT values for the hydride transfer processes
The observed rate constants as a function of coenzyme concentrationwere fit to the mechanisms described in Scheme 2. Under rapid-equilib-rium conditions and since the first process, formation of CT-1 or CT-2 isfast, kobs, or kA>B, values can be related with the enzyme and coenzymeconcentration by [34,35]
kobs ¼kHT-1ðKd þ ½FNR� þ ½ NADPþ=H�Þ þ kHTð½FNR� þ ½NADPþ=H�Þ
½FNR� þ ½NADPþ=H� þ Kd
ð1Þ
If concentration of coenzyme is much larger than that of the enzyme
kobs ¼kHT-1ðKd þ ½NADPþ=H�Þ þ kHT½NADPþ=H�
½NADPþ=H� þ Kd
ð2Þ
This simple model might apply only if the hydride transfer steps are rate-determining and the concentration of substrate is in excess over that of theenzyme. This later condition might not apply in some of our cases at thelower NADP+/H concentrations used, but in some cases this can be over-come using only data obtained at ratios of NADP+/H:FNR higher than 2.It should be notice that taking into account the whole system additionalequilibria (Fig. 7) might be preferable. However, our data fit this equationand did not fit more complicate ones (Figs. 3A, 6A and B).
Spectral and kinetic simulations
Spectra of the intermediate CT-1 and CT-2 were estimated using thePro-Kineticist II software (Applied Photophysics Ltd.) by analysis of thephotodiode array data for the reaction of WT FNRox with NADPH underpseudo-first order conditions (25 lM FNRox and 250 lM NADPH).Under this conditions, the three step mechanism proposed in Scheme 3 canbe used in combination with the spectra of free FNRox and FNRrd formsand the kinetic constants derived from Table 2 (taking into account thatfor each reaction, the initial CT is formed in the instrumental dead time,indicating that kinetic rate constants for CT formation must be larger than750 s�1 in the cases of WT and Tyr235Phe FNRs whatever is the directionof the initial reaction).
Time dependent spectral simulations were performed using the Pro-Ksoftware. During simulations, FNRox was considered to present a singleabsorbance maximum at 458 nm with a bandwidth of 20 nm and a relativeheight of 9.4 (extinction coefficient value), whereas FNRrd was simulatedby a single absorbance maximum at 380 nm with bandwidth of 50 andheight of 1. CT-1 was consider with two absorbance maxima, 458 and610 nm with bandwidths of 20 and 50 nm and, heights of 8.6 and 1.2,respectively. The corresponding parameters used for CT-2 were absor-
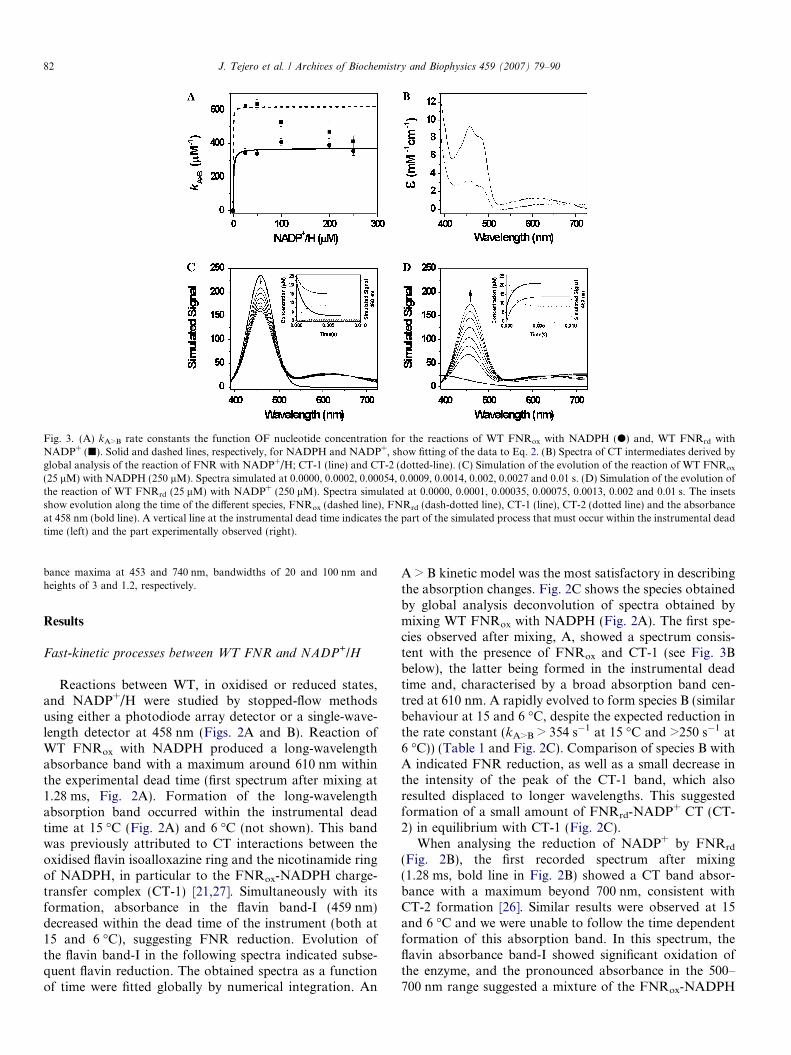
Fig. 3. (A) kA>B rate constants the function OF nucleotide concentration for the reactions of WT FNRox with NADPH (d) and, WT FNRrd withNADP+ (j). Solid and dashed lines, respectively, for NADPH and NADP+, show fitting of the data to Eq. 2. (B) Spectra of CT intermediates derived byglobal analysis of the reaction of FNR with NADP+/H; CT-1 (line) and CT-2 (dotted-line). (C) Simulation of the evolution of the reaction of WT FNRox
(25 lM) with NADPH (250 lM). Spectra simulated at 0.0000, 0.0002, 0.00054, 0.0009, 0.0014, 0.002, 0.0027 and 0.01 s. (D) Simulation of the evolution ofthe reaction of WT FNRrd (25 lM) with NADP+ (250 lM). Spectra simulated at 0.0000, 0.0001, 0.00035, 0.00075, 0.0013, 0.002 and 0.01 s. The insetsshow evolution along the time of the different species, FNRox (dashed line), FNRrd (dash-dotted line), CT-1 (line), CT-2 (dotted line) and the absorbanceat 458 nm (bold line). A vertical line at the instrumental dead time indicates the part of the simulated process that must occur within the instrumental deadtime (left) and the part experimentally observed (right).
82 J. Tejero et al. / Archives of Biochemistry and Biophysics 459 (2007) 79–90
bance maxima at 453 and 740 nm, bandwidths of 20 and 100 nm andheights of 3 and 1.2, respectively.
Results
Fast-kinetic processes between WT FNR and NADP+/H
Reactions between WT, in oxidised or reduced states,and NADP+/H were studied by stopped-flow methodsusing either a photodiode array detector or a single-wave-length detector at 458 nm (Figs. 2A and B). Reaction ofWT FNRox with NADPH produced a long-wavelengthabsorbance band with a maximum around 610 nm withinthe experimental dead time (first spectrum after mixing at1.28 ms, Fig. 2A). Formation of the long-wavelengthabsorption band occurred within the instrumental deadtime at 15 �C (Fig. 2A) and 6 �C (not shown). This bandwas previously attributed to CT interactions between theoxidised flavin isoalloxazine ring and the nicotinamide ringof NADPH, in particular to the FNRox-NADPH charge-transfer complex (CT-1) [21,27]. Simultaneously with itsformation, absorbance in the flavin band-I (459 nm)decreased within the dead time of the instrument (both at15 and 6 �C), suggesting FNR reduction. Evolution ofthe flavin band-I in the following spectra indicated subse-quent flavin reduction. The obtained spectra as a functionof time were fitted globally by numerical integration. An
A > B kinetic model was the most satisfactory in describingthe absorption changes. Fig. 2C shows the species obtainedby global analysis deconvolution of spectra obtained bymixing WT FNRox with NADPH (Fig. 2A). The first spe-cies observed after mixing, A, showed a spectrum consis-tent with the presence of FNRox and CT-1 (see Fig. 3Bbelow), the latter being formed in the instrumental deadtime and, characterised by a broad absorption band cen-tred at 610 nm. A rapidly evolved to form species B (similarbehaviour at 15 and 6 �C, despite the expected reduction inthe rate constant (kA>B > 354 s�1 at 15 �C and >250 s�1 at6 �C)) (Table 1 and Fig. 2C). Comparison of species B withA indicated FNR reduction, as well as a small decrease inthe intensity of the peak of the CT-1 band, which alsoresulted displaced to longer wavelengths. This suggestedformation of a small amount of FNRrd-NADP+ CT (CT-2) in equilibrium with CT-1 (Fig. 2C).
When analysing the reduction of NADP+ by FNRrd
(Fig. 2B), the first recorded spectrum after mixing(1.28 ms, bold line in Fig. 2B) showed a CT band absor-bance with a maximum beyond 700 nm, consistent withCT-2 formation [26]. Similar results were observed at 15and 6 �C and we were unable to follow the time dependentformation of this absorption band. In this spectrum, theflavin absorbance band-I showed significant oxidation ofthe enzyme, and the pronounced absorbance in the 500–700 nm range suggested a mixture of the FNRox-NADPH
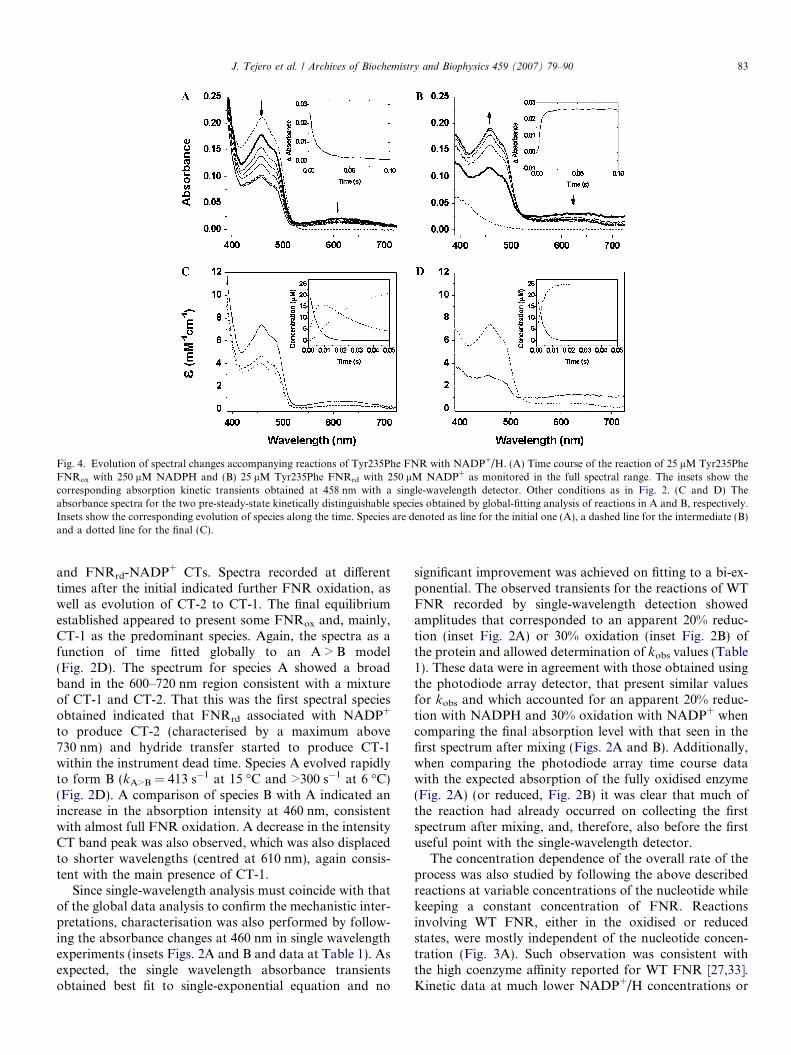
Fig. 4. Evolution of spectral changes accompanying reactions of Tyr235Phe FNR with NADP+/H. (A) Time course of the reaction of 25 lM Tyr235PheFNRox with 250 lM NADPH and (B) 25 lM Tyr235Phe FNRrd with 250 lM NADP+ as monitored in the full spectral range. The insets show thecorresponding absorption kinetic transients obtained at 458 nm with a single-wavelength detector. Other conditions as in Fig. 2. (C and D) Theabsorbance spectra for the two pre-steady-state kinetically distinguishable species obtained by global-fitting analysis of reactions in A and B, respectively.Insets show the corresponding evolution of species along the time. Species are denoted as line for the initial one (A), a dashed line for the intermediate (B)and a dotted line for the final (C).
J. Tejero et al. / Archives of Biochemistry and Biophysics 459 (2007) 79–90 83
and FNRrd-NADP+ CTs. Spectra recorded at differenttimes after the initial indicated further FNR oxidation, aswell as evolution of CT-2 to CT-1. The final equilibriumestablished appeared to present some FNRox and, mainly,CT-1 as the predominant species. Again, the spectra as afunction of time fitted globally to an A > B model(Fig. 2D). The spectrum for species A showed a broadband in the 600–720 nm region consistent with a mixtureof CT-1 and CT-2. That this was the first spectral speciesobtained indicated that FNRrd associated with NADP+
to produce CT-2 (characterised by a maximum above730 nm) and hydride transfer started to produce CT-1within the instrument dead time. Species A evolved rapidlyto form B (kA>B = 413 s�1 at 15 �C and >300 s�1 at 6 �C)(Fig. 2D). A comparison of species B with A indicated anincrease in the absorption intensity at 460 nm, consistentwith almost full FNR oxidation. A decrease in the intensityCT band peak was also observed, which was also displacedto shorter wavelengths (centred at 610 nm), again consis-tent with the main presence of CT-1.
Since single-wavelength analysis must coincide with thatof the global data analysis to confirm the mechanistic inter-pretations, characterisation was also performed by follow-ing the absorbance changes at 460 nm in single wavelengthexperiments (insets Figs. 2A and B and data at Table 1). Asexpected, the single wavelength absorbance transientsobtained best fit to single-exponential equation and no
significant improvement was achieved on fitting to a bi-ex-ponential. The observed transients for the reactions of WTFNR recorded by single-wavelength detection showedamplitudes that corresponded to an apparent 20% reduc-tion (inset Fig. 2A) or 30% oxidation (inset Fig. 2B) ofthe protein and allowed determination of kobs values (Table1). These data were in agreement with those obtained usingthe photodiode array detector, that present similar valuesfor kobs and which accounted for an apparent 20% reduc-tion with NADPH and 30% oxidation with NADP+ whencomparing the final absorption level with that seen in thefirst spectrum after mixing (Figs. 2A and B). Additionally,when comparing the photodiode array time course datawith the expected absorption of the fully oxidised enzyme(Fig. 2A) (or reduced, Fig. 2B) it was clear that much ofthe reaction had already occurred on collecting the firstspectrum after mixing, and, therefore, also before the firstuseful point with the single-wavelength detector.
The concentration dependence of the overall rate of theprocess was also studied by following the above describedreactions at variable concentrations of the nucleotide whilekeeping a constant concentration of FNR. Reactionsinvolving WT FNR, either in the oxidised or reducedstates, were mostly independent of the nucleotide concen-tration (Fig. 3A). Such observation was consistent withthe high coenzyme affinity reported for WT FNR [27,33].Kinetic data at much lower NADP+/H concentrations or

Fig. 5. Evolution of spectral changes accompanying reactions of Tyr235Ala FNR with NADP+/H. (A) Time course of the reaction of 25 lM Tyr235AlaFNRox with 250 lM NADPH. Spectra after mixing are shown at 0.0038, 0.106, 0.214, 0.526, 0.997 and 4.095 s. and (B) Time course of the reaction of25 lM Tyr235Ala FNRrd with 250 lM NADP+ monitored in the full spectral range. Spectra after mixing are shown at 0.0038, 0.055, 0.096, 0.178, 0.243and 4.095 s. Spectra were recorded every 5.1 ms. The insets show the corresponding absorption kinetic transients obtained at 458 nm with a single-wavelength detector. Other conditions as in Fig. 2. (C and D) The absorbance spectra for the three pre-steady-state kinetically distinguishable speciesobtained by global analysis of the reactions in A and B, respectively. Insets show the corresponding evolution of species with time. Species are denoted asline for the initial one (A), a dashed line for the intermediate (B) and a dotted line for the final (C).
84 J. Tejero et al. / Archives of Biochemistry and Biophysics 459 (2007) 79–90
lower temperatures could be helpful, but in this particularcase the kA>B and kobs values under those conditions werestill near the limit for the stopped-flow apparatus, as shownby the experiments recorded at 6 �C. Additionally, a slight
Table 1Kinetic rate constants obtained by stopped-flow for the reaction of FNR with
NADPH
kA>B (s�1) kB>C (s�1)
Rate constants obtained by global analysis deconvolution of spectra obtained bmodela
WT >354b —WT (6 �C) >250Y235F 178 12Y235F (6 �C) 90 5Y235A 4.8 0.4
NADPH
kobs1 (s�1) kobs2 (s�1)
Observed rate constants obtained by fitting-single-wavelength detection data aWT >430b —Y235F 151 18Y235A 3.6 0.28
Data from kinetics obtained at FNR:NADP+/H ratio of 1:10 and 25 �C unlea Errors in the estimated values of kA>B and kB>C were ±15%.b This process fits better to a single A > B model.c Errors in the estimated values of kobs were ±10%.
decrease of the kA>B and kobs values was observed uponincreasing the concentration of the coenzyme. This obser-vation correlated with that reported by Batie and Kamin[27], suggesting the presence of additional equilibria
NADP+/H
NADP+
kA>B (s�1) kB>C (s�1)
etween 390 and 726 nm along reaction to either an A > B or an A > B > C
>413b —>300
309b —14013 0.4
NADP+
kobs1 (s�1) kobs2 (s�1)
t 458 nm to a single-exponential or double-exponential mechanismc
>469b —260b —
9.9 0.89
ss otherwise stated.
FNRox + NADPH
FNRrd + NADP +
[FNRox-NADPH]
[FNRrd-NADP+] [FNRox-NADPH]
[FNRrd-NADP+]
Kd, NADPH kHT1
Kd, NADP+
kHT-1
kHT-1
kHT1
Scheme 2.
J. Tejero et al. / Archives of Biochemistry and Biophysics 459 (2007) 79–90 85
involving the formation of non-productive FNRox-NADP+ and FNRrd-NADPH complexes (see Fig. 7). Thisphenomenon has also been reported in other relatedenzymes [36].
The observed rates as a function of coenzyme concentra-tion might fit the simplest mechanisms describing thestudied processes (Scheme 2).
In Scheme 2, Kd,NADPH and Kd,NADP+ are the dissocia-tion constants for either the CT-1, or CT-2, complex andkHT1 or kHT-1 the corresponding rates of hydride transferfor each direction. Since under our experimental measure-ments, and due to the high affinity of the WT enzyme forboth coenzymes inferred from Fig. 3A, the amount of freeWT FNR was much lower than that of the coenzyme and,upon avoiding the 1:1 ratio, Eq. 2 might be used as anapproximation to determine Kd and kHT values. However,due to the almost independent value of rate constants onnucleotide concentration, fitting of the experimental dataof Fig. 3A to Eq. 2 only provided upper limit values forthe dissociation constants and lower limit values forthe hydride transfer rates (Table 2). The obtainedvalues (Kd,NADPH < 1 lM and Kd,NADP+ < 0.5 lM, for theFNRox-NADPH and the FNRrd-NADP+ complexes,respectively) were considerably lower than the valuereported for the Kd (5.7 lM) of the FNRox-NADP+ com-plex [33], indicating that in Anabaena WT FNR reductionincreased the affinity for the coenzyme. These results arefully consistent with those reported for the spinach enzyme[27].
Spectra of the intermediate CT-1 and CT-2 were esti-mated by analysis of the spectral data along the time forthe reaction of WT FNR with NADPH under pseudo-firstorder conditions (Fig. 3B) taking into account the threestep mechanism proposed in the discussion section (Scheme3) and the kinetic constants derived from Table 2. Thespectrum derived for CT-1 species presented maxima at458 nm and 610 nm with extinction coefficients of8.6 mM�1 cm�1 (slightly smaller than that of free FNRox,9.4 mM�1 cm�1) and 1.2 mM�1 cm�1, respectively, and ashoulder at 480 nm. Apparently, the CT-2 species wascharacterized by maxima at 453 nm and beyond 726 nmwith extinction coefficients of 3.0 mM�1 cm�1 and�0.7 mM�1 cm�1, respectively, and a shoulder at 483 nm.Properties of these CT-1 and CT-2 spectra for Anabaena
PCC 7119 FNR were consistent with those of the equiva-lent complexes reported for the processes of phthalatedioxygenase reductase when reacting with NADH [37].
To validate the estimated Kd (and the kinetic constantsderived from these data) and kHT values (Table 2), as wellas the spectral positions and relative extinction coefficientsderived for CT-1 and CT-2 species, a simulation analysiswas carried out. This simulation took into account the dataobtained in Table 2, the estimated spectral properties ofCT-1 and CT-2 (Fig. 3B) and the fact that for the reactionin both directions the initial CT was formed in the instru-mental dead time. Comparison of the obtained simulatedspectra as a function of time and the evolution of the dif-ferent species (Figs. 3C and D) with the experimental datain Fig. 2 indicated that our model reproduced the experi-mental data. Comparison of simulated evolution of speciesand absorbance at 460 nm (insets Figs. 3C and D) withexperimental absorbance changes at 460 nm (insets Figs.2A and B) were also consistent with the assumption ofsome of the derived kinetic rate constants being just lowerlimit values, especially for those processes involving FNRrd
and NADP+.
Fast-kinetic processes of the Tyr235Phe and Tyr235Ala
Anabaena FNR mutants with NADP+/H
Reduction of Tyr235Phe FNR by NADPH (Fig. 4A)showed features similar to those of WT FNR, with for-mation of the CT-1. However, a concomitant decay ofthe CT band and the flavin absorbance band-I with timewere produced, which was not observed with WT FNR.Both features indicated that when reaching the equilibri-um this reaction presented a larger percentage of FNRrd
and less CT-1. Global analysis deconvolution of spectraobtained for the reaction of Tyr235Phe with NADPH bet-ter fit an A > B > C model (Fig. 4C). The first speciesobserved after mixing (A, similar to WT) showed a spec-trum consistent with the presence of FNRox and CT-1that evolved to form species B, this conversion beingslower than for WT (Table 1 and Fig. 2C) (kA>B �178 s�1 at 15 �C and 90 s�1 at 6 �C). It involved reductionof FNR and, a small decrease in the intensity of the peakof the CT-1 band together with its displacement to longerwavelengths (suggesting production of a small amount ofCT-2). However, B further evolved to form species C(kB>C � 12 s�1), a process that, as shown by the spectraof both species, mainly involved FNR reduction withoutimportant changes in the CT band (Fig. 4C). The reactionof Tyr235Ala FNR with NADPH was a much slowerprocess, in agreement with previous data [5], and theCT character was barely detectable (Fig. 5A). Theobserved spectral changes deconvoluted to produce threedifferent species (Fig. 5C, Table 1). We inferred that spe-cies A represented FNRox and NADPH, which if boundto the enzyme did not produce a CT species and ratherrepresented the MC-1 complex. B mainly consisted ofFNRrd and hardly any CT species had accumulated.Finally, species B converted to C, decreasing further theabsorption of the flavin band-I and showing a very smallamount of a CT interaction.

Fig. 6. kA>B rate constants as a function of nucleotide concentration for the reactions of (A) Tyr235Phe FNRrd with NADP+ (j) and Tyr235Phe FNRox
with NADPH (d) and (B) Tyr235Ala FNRrd with NADP+ (j) and Tyr235Ala FNRox with NADPH (d). Solid and dashed lines, respectively, forNADPH and NADP+, show fitting of the data to either hyperbolic (Eq. 2) or linear equations. (C) Simulation of the evolution of the reaction ofTyr235Phe FNRox (25 lM) with NADPH (250 lM). (D) Simulation of the evolution of the reaction of Tyr235Phe FNRrd (25 lM) with NADP+
(250 lM). Spectra shown were simulated at 0, 0.0005, 0.0012, 0.0021, 0.0032, 0.0045, 0.006, 0.008 and 0.020 s. The insets show evolution along the time ofthe different species, FNRox (dashed line), FNRrd (dash-dotted line), CT-1 (line), CT-2 (dotted line) and the absorbance at 460 nm (bold line). A verticalline at the instrumental dead time indicates the part of the simulated process that must occur within the instrumental dead time (left) and the partexperimentally observed (right).
Fig. 7. Proposed mechanism for the reactions of Anabaena FNR with NADP+/H. At high coenzyme concentrations, or by effect of mutations, the side-reactions to form the unproductive complexes FNRox-NADP+ and/or FNRrd-NADPH become noticeable. Kd,NADPH and Kd,NADP+ denote thedissociation constants for the CT-1 and CT-2 complexes, respectively. Ki,NADPH and Ki,NADP+ are the dissociation constants for the unproductiveinhibitory complexes FNRrd-NADPH and FNRox-NADP+, respectively. kHT1 and kHT-1 are the hydride transfer rates for each direction.
86 J. Tejero et al. / Archives of Biochemistry and Biophysics 459 (2007) 79–90
In the reverse reaction (Fig. 4B) the Tyr235Phe mutantbehaved more similarly to the WT enzyme and only aslightly smaller amount of the CT character was observed.Deconvolution of spectra obtained for this reaction fit anA > B model, with spectral features of species A and B sim-ilar to those found for the reaction of WT enzyme(Fig. 4D) and only showing a reduction in the conversionrate (kA>B = 309 s�1 at 15 �C and 140 s�1 at 6 �C) (Table1). Again, reaction involving the Tyr235Ala FNR andNADP+ (Figs. 5B and D) was considerably slower, andthe CT character was barely detectable. The spectral databest fit a two step (three species) model (Fig. 5D, Table1). From the deconvoluted spectral properties, we inferspecies A represents FNRrd and NADP+ (either bound(MC-2) or free) and the lack of absorbance beyond
700 nm suggested there was no formation of CT-2. B indi-cated formation of FNRox along with CT-1. In the conver-sion of species B to species C, there was a further increasein the absorption of the flavin band-I, suggesting furtheroxidation of FNR.
Single wavelength absorbance transients at 460 nm forprocesses with the Tyr235Phe and Tyr235Ala FNRs (insetsFigs. 4A and B, 5A and B) were fully consistent with pho-todiode array data. Two observed rate constants (kobs1
and kobs2) described the absorption changes for the reactionof Tyr235Phe with NADPH and Tyr235Ala with bothredox states of the coenzyme. In all these cases, the secondphase (slow, kobs2) contributed only a very small change inabsorption (5–7% of the total amplitude change observed,consistent with the small differences observed between spe-

Table 2Kinetic parameters for the hydride transfer processes between FNR and NADP+/H
FNRox and NADPH FNRrd and NADP+
Kd,NADPH (lM�1) kHT1 (s�1) Kd,NADP+ (lM�1) kHT-1 (s�1)
Kinetic parameters derived from kA>B data obtained by global analysis deconvolutiona
WT <1 >370 <0.2 >620Y235F 46 200 >41 �338Y235A >110 6.4 —b —b
Kinetic parameters derived from kobs1 values obtained at 458 nma
WT <0.7 >501 <0.5 >560Y235F >60 �240 >90 �438Y235A >140 6.0 —b —b
a Errors in the estimated values of Kd and kHT values were ±20% and ±15%, respectively.b Linear dependence prevented determination of these values.
J. Tejero et al. / Archives of Biochemistry and Biophysics 459 (2007) 79–90 87
cies B and C when analysing photodiode array data (Figs.4C, 5C and D)). A single-exponential kobs described thereaction between Tyr235Phe FNRrd and NADP+, also con-sistent with global analysis deconvolution (Fig. 4B). kobs
values, especially for Tyr235Ala, were notably slower thanthe ones for the WT enzyme reactions (Table 1). The ampli-tudes observed in single wavelength experiments for theequivalent reactions of WT and Tyr235Phe FNRs were sim-ilar (insets Figs. 2A and B, 4A and B), although, accordingto the diode array data (Figs. 2C and 4C), different ampli-tudes might be expected for the reaction with NADPH.Closer inspection of the spectra showed that reaction ofWT FNRox with NADPH was completed in only 11 ms(Fig. 2A), but in the reaction of Tyr235Phe FNRox withNADPH significant reduction still took place after this time(Figs. 4A and C). Thus, the time scale used in the inset ofFig. 4A only accounted for the fast process of the reactionof Tyr235Phe FNR with NADPH. This observation agreeswith the deviation observed when the kinetic traces were fitto a single-exponential equation. In reactions of Tyr235AlaFNR with either NADPH or NADP+, the kinetic tracesclearly fit a bi-exponential equation and the absorbancechanges observed accounted for the full reactions detectedin the photodiode experiments (Fig. 5, Table 1), since reac-tions were considerably slower than those of WT andTyr235Phe FNRs (Table 2) and followed to their completeextent. The degree of hydride transfer achieved for eachreaction was around 65%, in good agreement single-wave-length and photodiode array detected data.
Reactions of Tyr235Ala and Tyr235Phe FNR withNADP+/H showed an increasing dependence of the kA>B
and kobs1 values with coenzyme concentration. The kA>B
and kobs1 values for the Tyr235Phe mutant suggested ahyperbolic dependence on the coenzyme concentration forboth NADP+ and NADPH, which almost reached satura-tion (Fig. 6A). The calculated Kd,NADPH and Kd,NADP+ val-ues for complexes of the Tyr235Phe FNR (in theappropriate redox state) with both redox states of the coen-zyme were similar between them, but two orders of magni-tude larger than the values for WT (Table 2), indicatingthat replacement of Tyr by Phe at position 235 considerablyhindered the optimal coenzyme binding to the protein. These
values were lower than the value reported for the Tyr235PheFNRox-NADP+ complex (Kd = 200 lM) [5], suggestingthat, as also happens in WT FNR, reduction also increasedthe affinity for the coenzyme. Finally, kHT and kHT-1 valuesindicated that hydride transfer was slower in this mutantthan in the WT FNR (Table 2). The same simulation analysisused for the WT enzyme was used to validate the valuesderived for Tyr235Phe FNR in Table 2. Again, comparisonof simulated (Figs. 6C and D) and experimental data (Fig. 4)validated the procedure and the obtained kinetic parameters.
Reactions involving the Tyr235Ala mutant were signifi-cantly slower. The dependence of kA>B and kobs1 on thecoenzyme concentration for Tyr235Ala FNR suggested ahyperbolic dependence on NADPH concentration,whereas a linear dependence was obtained for NADP+
(Fig. 6B). This is consistent with a much lower affinityfor the coenzyme in this mutant than in Tyr235Phe andWT FNRs [5]. The saturation profile for the reactionbetween FNRox and NADPH was used to estimate limitvalues for Kd and kHT (Table 2). The obtained values sug-gested a weak interaction with NADPH (consistent withthe fact that previous studies did not succeed in determina-tion of the Tyr235Ala FNRox-NADP+ Kd value [5]), anda dramatic decrease in kHT.
Discussion
Kinetic reaction mechanism of Anabaena FNR
and NADP+/H
In the reactions of Anabaena WT FNR with NADP+/H,the photodiode array data were consistent with the forma-tion of two CT species (Fig. 2). Their spectral features weresimilar to those reported for the equivalent complexes ofother related flavoproteins, including FNRs [8,26,37–41].In the reaction of WT FNRox with NADPH, formationof CT-1 as well a hydride transfer took place within theapparatus dead time. However, when reaching the equilib-rium, full FNR reduction was not achieved and the spec-trum of the final equilibrium mixture clearly showed thepresence of CT-1 and FNRrd. It should be noted thatCT-2 showed little accumulation and rapidly evolved to
88 J. Tejero et al. / Archives of Biochemistry and Biophysics 459 (2007) 79–90
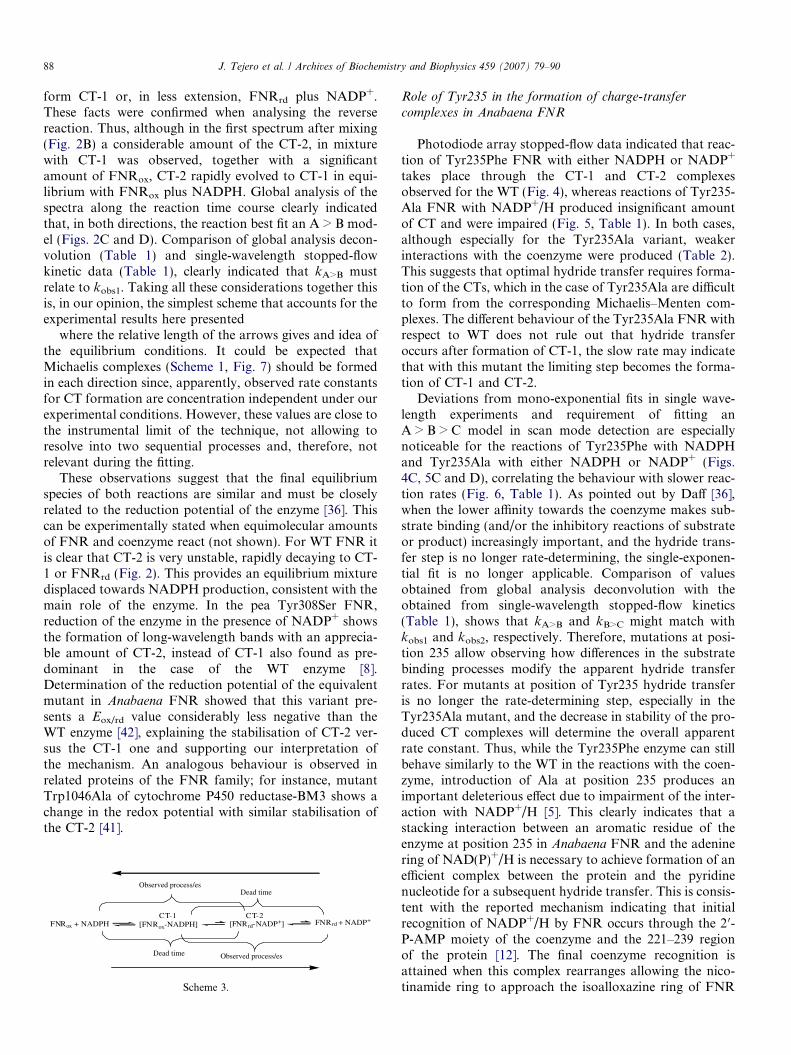
form CT-1 or, in less extension, FNRrd plus NADP+.These facts were confirmed when analysing the reversereaction. Thus, although in the first spectrum after mixing(Fig. 2B) a considerable amount of the CT-2, in mixturewith CT-1 was observed, together with a significantamount of FNRox, CT-2 rapidly evolved to CT-1 in equi-librium with FNRox plus NADPH. Global analysis of thespectra along the reaction time course clearly indicatedthat, in both directions, the reaction best fit an A > B mod-el (Figs. 2C and D). Comparison of global analysis decon-volution (Table 1) and single-wavelength stopped-flowkinetic data (Table 1), clearly indicated that kA>B mustrelate to kobs1. Taking all these considerations together thisis, in our opinion, the simplest scheme that accounts for theexperimental results here presented
where the relative length of the arrows gives and idea ofthe equilibrium conditions. It could be expected thatMichaelis complexes (Scheme 1, Fig. 7) should be formedin each direction since, apparently, observed rate constantsfor CT formation are concentration independent under ourexperimental conditions. However, these values are close tothe instrumental limit of the technique, not allowing toresolve into two sequential processes and, therefore, notrelevant during the fitting.
These observations suggest that the final equilibriumspecies of both reactions are similar and must be closelyrelated to the reduction potential of the enzyme [36]. Thiscan be experimentally stated when equimolecular amountsof FNR and coenzyme react (not shown). For WT FNR itis clear that CT-2 is very unstable, rapidly decaying to CT-1 or FNRrd (Fig. 2). This provides an equilibrium mixturedisplaced towards NADPH production, consistent with themain role of the enzyme. In the pea Tyr308Ser FNR,reduction of the enzyme in the presence of NADP+ showsthe formation of long-wavelength bands with an apprecia-ble amount of CT-2, instead of CT-1 also found as pre-dominant in the case of the WT enzyme [8].Determination of the reduction potential of the equivalentmutant in Anabaena FNR showed that this variant pre-sents a Eox/rd value considerably less negative than theWT enzyme [42], explaining the stabilisation of CT-2 ver-sus the CT-1 one and supporting our interpretation ofthe mechanism. An analogous behaviour is observed inrelated proteins of the FNR family; for instance, mutantTrp1046Ala of cytochrome P450 reductase-BM3 shows achange in the redox potential with similar stabilisation ofthe CT-2 [41].
FNRox + NADPH FNRrd + NADP+
Observed process/es
[FNRox-NADPH] [FNRrd-NADP+]
Dead time
Observed process/esDead time
CT-1 CT-2
Scheme 3.
Role of Tyr235 in the formation of charge-transfer
complexes in Anabaena FNR
Photodiode array stopped-flow data indicated that reac-tion of Tyr235Phe FNR with either NADPH or NADP+
takes place through the CT-1 and CT-2 complexesobserved for the WT (Fig. 4), whereas reactions of Tyr235-Ala FNR with NADP+/H produced insignificant amountof CT and were impaired (Fig. 5, Table 1). In both cases,although especially for the Tyr235Ala variant, weakerinteractions with the coenzyme were produced (Table 2).This suggests that optimal hydride transfer requires forma-tion of the CTs, which in the case of Tyr235Ala are difficultto form from the corresponding Michaelis–Menten com-plexes. The different behaviour of the Tyr235Ala FNR withrespect to WT does not rule out that hydride transferoccurs after formation of CT-1, the slow rate may indicatethat with this mutant the limiting step becomes the forma-tion of CT-1 and CT-2.
Deviations from mono-exponential fits in single wave-length experiments and requirement of fitting anA > B > C model in scan mode detection are especiallynoticeable for the reactions of Tyr235Phe with NADPHand Tyr235Ala with either NADPH or NADP+ (Figs.4C, 5C and D), correlating the behaviour with slower reac-tion rates (Fig. 6, Table 1). As pointed out by Daff [36],when the lower affinity towards the coenzyme makes sub-strate binding (and/or the inhibitory reactions of substrateor product) increasingly important, and the hydride trans-fer step is no longer rate-determining, the single-exponen-tial fit is no longer applicable. Comparison of valuesobtained from global analysis deconvolution with theobtained from single-wavelength stopped-flow kinetics(Table 1), shows that kA>B and kB>C might match withkobs1 and kobs2, respectively. Therefore, mutations at posi-tion 235 allow observing how differences in the substratebinding processes modify the apparent hydride transferrates. For mutants at position of Tyr235 hydride transferis no longer the rate-determining step, especially in theTyr235Ala mutant, and the decrease in stability of the pro-duced CT complexes will determine the overall apparentrate constant. Thus, while the Tyr235Phe enzyme can stillbehave similarly to the WT in the reactions with the coen-zyme, introduction of Ala at position 235 produces animportant deleterious effect due to impairment of the inter-action with NADP+/H [5]. This clearly indicates that astacking interaction between an aromatic residue of theenzyme at position 235 in Anabaena FNR and the adeninering of NAD(P)+/H is necessary to achieve formation of anefficient complex between the protein and the pyridinenucleotide for a subsequent hydride transfer. This is consis-tent with the reported mechanism indicating that initialrecognition of NADP+/H by FNR occurs through the 2 0-P-AMP moiety of the coenzyme and the 221–239 regionof the protein [12]. The final coenzyme recognition isattained when this complex rearranges allowing the nico-tinamide ring to approach the isoalloxazine ring of FNR

J. Tejero et al. / Archives of Biochemistry and Biophysics 459 (2007) 79–90 89
[12]. Replacement of Tyr235 produces disruption of the ini-tial interaction step and might prevent the subsequent con-formational changes required for optimal orientation andsubsequent hydride transfer. Thus, in the case of theTyr235Ala mutation, the important decrease of affinity iseven preventing formation of CT complexes between thenicotinamide and the isoalloxazine. A Tyr at 235 is muchmore efficient than a Phe for NADP+/H binding and orien-tation and, but the lack of a H-bond between Tyr and the2 0-P of NADPH in the Phe mutant still allows NADPHbinding and conformational changes that evolve to CT for-mation. However, the weaker interaction at the initial stepof recognition becomes the limiting-step and slows downthe subsequent induced conformational changes, produc-ing as final result a slower hydride transfer. Our data reflectthe importance of this H-bond between the Tyr-OH andthe 2 0-P of NADP+/H, and especially of the stacking inter-action between the Tyr235 ring and the 2 0-P-AMP ribose.
Role of charge-transfer complexes in fast hydride transfer
Hydride transfer in systems involving flavins and pyri-dine nucleotides is highly dependent on the approach andco-linear orientation of the N-5 of the flavin, the hydrideto be transferred and the C-4 of the nucleotide nicotin-amide ring. Upon production of such approach the nicotin-amide ring can partly overlay the isoalloxazine ring,producing CT interactions. However, CT complexes mightnot be formed if the nicotinamide ring is held in a positionwhere it does not overlap the isoalloxazine ring, but the co-linearity for efficient hydride transfers of C, H and N ismaintained. Thus, significant formation of CT complexesoccurs in systems with relative slow apparent rates[37,38], whereas more efficient hydride transfers have beenreported for systems in which CT formation is not detected[43]. Therefore, although CT interactions suggest closecontact between the reacting rings and might indicate ifthe orientation for efficient hydride transfer is achieved,CT interactions are not absolutely necessary [44]. Never-theless, CT complexes between flavoproteins and pyridinenucleotides have been reported in numerous enzymes,including systems chemically analogous to the photosyn-thetic FNRs [45,46]. The CT band extinctions have beenrelated to the fraction of enzyme molecules that form thecorrect interaction between NADPH and FAD for hydridetransfer to occur at high rates [44] and, small changes in theefficiency of the overlap between the p orbitals of the flavinand the nicotinamide have been shown to cause importantchanges in the hydride transfer rates [47,48]. The kineticdata here presented show a correlation between CT com-plex stability and fast reaction rates. Thus, impairment ofcoenzyme binding in the case of the Tyr235 mutants ham-per CT formation and, consequently, hydride transferrates. This observation is in agreement with that reportedfor the spinach Glu312Leu and Ser96Val FNR mutants,which showed no evidence of CT complex formation andno hydride exchange ability [29,31]. In the presence of sat-
urating amounts of coenzyme it has been shown that only avery small fraction of FNR molecules contain the nicotin-amide ring placed in contact to the flavin, and are thereforecompetent for hydride transfer, since displacement of theC-terminal Tyr from its position appears to be requiredfor the interaction to occur [4,14]. Thus, we can expect thatin the case of FNR catalytic cycle CT interactions mightnot be incidental to a high rate of hydride transfer. Theobserved CT band intensities could be related to the frac-tion of enzyme molecules exhibiting the proposed move-ment of Tyr-terminal side-chain and the correctinteraction with the coenzyme for hydride transfer to occurat high rate [44]. Nevertheless, although a good agreementbetween CT formation and ET rates is apparent from thelimited data set used here for FNR, further work must bedone to prove such hypothesis.
In conclusion, our data indicate that hydride transferbetween Anabaena FNR and NADP+/H occurs throughformation of two CT complexes. Spectroscopic propertiesfor such complexes and the hydride transfer rates forinter-conversion have been estimated. However, whereasFNRox-NADPH accumulates during the reaction and atthe equilibrium point, FNRrd-NADP+ rapidly evolves toother FNR states. Finally, the importance of FNR andNADP+/H conformations and orientation during theenzyme:coenzyme interaction is shown to be critical inthe case of Anabaena FNR formation of CT complexes,which are necessary for an efficient hydride transfer.
Acknowledgment
This work has been supported by Comision Interminis-terial de Ciencia y Tecnologıa (CICYT, Grant BIO2003-00627 to C.G.-M. and Grant BIO2004-00279 to M.M.)and by CONSI+D (DGA, Grant P006/2000 to M.M.).J.T. was recipient of a travel award to the University ofLeicester from Caja de Ahorros de la Inmaculada-ConsejoSuperior de Investigacion y Desarrollo.
References
[1] M. Medina, C. Gomez-Moreno, Photosynth. Res. 79 (2004)113–131.
[2] N. Carrillo, E.A. Ceccarelli, Eur. J. Biochem. 270 (2003)1900–1915.
[3] A.K. Arakaki, E.A. Ceccarelli, N. Carrillo, FASEB J. 11 (1997) 133–140.
[4] L. Piubelli, A. Aliverti, A.K. Arakaki, N. Carrillo, E.A. Ceccarelli,P.A. Karplus, G. Zanetti, J. Biol. Chem. 275 (2000) 10472–10476.
[5] M. Medina, A. Luquita, J. Tejero, J.A. Hermoso, T. Mayoral, J.Sanz-Aparicio, K. Grever, C. Gomez-Moreno, J. Biol. Chem. 276(2001) 11902–11912.
[6] C.M. Bruns, P.A. Karplus, J. Mol. Biol. 247 (1995) 125–145.[7] L. Serre, F.M. Vellieux, M. Medina, C. Gomez-Moreno, J.C.
Fontecilla-Camps, M. Frey, J. Mol. Biol. 263 (1996) 20–39.[8] Z. Deng, A. Aliverti, G. Zanetti, A.K. Arakaki, J. Ottado, E.G.
Orellano, N.B. Calcaterra, E.A. Ceccarelli, N. Carrillo, P.A. Karplus,Nat. Struct. Biol. 6 (1999) 847–853.
[9] A. Dorowski, A. Hofmann, C. Steegborn, M. Boicu, R. Huber, J.Biol. Chem. 276 (2001) 9253–9263.

90 J. Tejero et al. / Archives of Biochemistry and Biophysics 459 (2007) 79–90
[10] A. Aliverti, R. Faber, C.M. Finnerty, C. Ferioli, V. Pandini, A. Negri,P.A. Karplus, G. Zanetti, Biochemistry 40 (2001) 14501–14508.
[11] G. Kurisu, M. Kusunoki, E. Katoh, T. Yamazaki, K. Teshima, Y.Onda, Y. Kimata-Ariga, T. Hase, Nat. Struct. Biol. 8 (2001)117–121.
[12] J.A. Hermoso, T. Mayoral, M. Faro, C. Gomez-Moreno, J. Sanz-Aparicio, M. Medina, J. Mol. Biol. 319 (2002) 1133–1142.
[13] R. Morales, M.-H. Charon, G. Kachalova, L. Serre, M. Medina, C.Gomez-Moreno, M. Frey, EMBO Reports 1 (2000) 271–276.
[14] J. Tejero, I. Perez-Dorado, C. Maya, M. Martınez-Julvez, C. Gomez-Moreno, J.A. Hermoso, M. Medina, Biochemistry 44 (2005) 13477–13490.
[15] P.A. Karplus, C.M. Bruns, J. Bioenerg. Biomembr. 26 (1994) 89–99.[16] C.C. Correll, C.J. Batie, D.P. Ballou, M.L. Ludwig, Science 258
(1992) 1604–1610.[17] M.C. Bewley, C.C. Marohnic, M.J. Barber, Biochemistry 40 (2001)
13574–13582.[18] M. Wang, D.L. Roberts, R. Paschke, T.M. Shea, B.S. Masters, J.J.
Kim, Proc. Natl. Acad. Sci. USA 94 (1997) 8411–8416.[19] A. Gruez, D. Pignol, M. Zeghouf, J. Coves, M. Fontecave, J.L.
Ferrer, J.C. Fontecilla-Camps, J. Mol. Biol. 299 (2000) 199–212.[20] J.K. Hurley, R. Morales, M. Martınez-Julvez, T.B. Brodie, M.
Medina, G. Tollin, C. Gomez-Moreno, Biochim. Biophys. Acta 1554(2002) 5–21.
[21] V. Massey, R.G. Matthews, G.P. Foust, L.G. Howell, C.H. Williams,G. Zanetti, S. Ronchi, in: H. Sund (Ed.), Pyridine NucleotideDependent Dehydrogenases, Springer-Verlag, Heidelberg, 1970, pp.393–409.
[22] S. Nakamura, T. Kimura, J. Biol. Chem. 246 (1971) 6235–6241.[23] J.J. Keirns, J.H. Wang, J. Biol. Chem. 247 (1972) 7374–7382.[24] R. Maskiewicz, B.H.J. Bielski, Biochim. Biophys. Acta 680 (1982)
297–303.[25] R. Masaki, S. Yoshikawa, H. Matsubara, Biochim. Biophys. Acta
700 (1982) 101–109.[26] C.J. Batie, H. Kamin, J. Biol. Chem. 259 (1984) 11976–11985.[27] C.J. Batie, H. Kamin, J. Biol. Chem. 261 (1986) 11214–11223.[28] A. Aliverti, L. Piubelli, G. Zanetti, T. Lubberstedt, R.G. Herrmann,
B. Curti, Biochemistry 32 (1993) 6374–6380.[29] A. Aliverti, C.M. Bruns, V.E. Pandini, P.A. Karplus, M.A. Vanoni,
B. Curti, G. Zanetti, Biochemistry 34 (1995) 8371–8379.
[30] M. Martınez-Julvez, J.A. Hermoso, J.K. Hurley, T. Mayoral, J. Sanz-Aparicio, G. Tollin, C. Gomez-Moreno, M. Medina, Biochemistry 37(1998) 17680–17691.
[31] A. Aliverti, Z. Deng, D. Ravasi, L. Piubelli, P.A. Karplus, G. Zanetti,J. Biol. Chem. 273 (1998) 34008–34015.
[32] J. Tejero, M. Martınez-Julvez, T. Mayoral, A. Luquita, J. Sanz-Aparicio, J.A. Hermoso, J.K. Hurley, G. Tollin, C. Gomez-Moreno,M. Medina, J. Biol. Chem. 278 (2003) 49203–49214.
[33] M. Medina, M. Martınez-Julvez, J.K. Hurley, G. Tollin, C. Gomez-Moreno, Biochemistry 37 (1998) 2715–2728.
[34] S. Strickland, G. Palmer, V. Massey, J. Biol. Chem. 250 (1975) 4048–4052.
[35] A. Fersht, Structure and Mechanism in Protein Science. A Guide toEnzyme Catalysis and Protein Folding, W.H. Freeman, New York,1999.
[36] S. Daff, Biochemistry 43 (2004) 3929–3932.[37] G.T. Gassner, D.P. Ballou, Biochemistry 34 (1995) 13460–
13471.[38] G.T. Gassner, L. Wang, C. Batie, D.P. Ballou, Biochemistry 33
(1994) 12184–12193.[39] G.T. Gassner, D.A. Johnson, H.W. Liu, D.P. Ballou, Biochemistry 35
(1996) 7752–7761.[40] D.W. Konas, K. Zhu, M. Sharma, K.S. Aulak, G.W. Brudvig, D.J.
Stuehr, J. Biol. Chem. 279 (2004) 35412–35425.[41] R. Neeli, O. Roitel, N.S. Scrutton, A.W. Munro, J. Biol. Chem. 280
(2005) 17634–17644.[42] I. Nogues, J. Tejero, J.K. Hurley, D. Paladini, S. Frago, G. Tollin,
S.G. Mayhew, C. Gomez-Moreno, E.A. Ceccarelli, N. Carrillo, M.Medina, Biochemistry 43 (2004) 6127–6137.
[43] V. Favaudon, J.M. Lhoste, Biochemistry 14 (1975) 4731–4738.[44] M. Ortız-Maldonado, B. Entsch, D.P. Ballou, Biochemistry 42 (2003)
11234–11242.[45] I.F. Sevrioukova, T.L. Poulos, J. Biol. Chem. 277 (2002) 25831–
25839.[46] C.C. Marohnic, M.C. Bewley, M.J. Barber, Biochemistry 42 (2003)
11170–11182.[47] G. Blankenhorn, Eur. J. Biochem. 50 (1975) 351–356.[48] G. Blankenhorn, Biochemistry 14 (1975) 3172–3176.[49] W.L. DeLano, The PyMOL Molecular Graphics System DeLano
Scientific, San Carlos, CA, USA, 2002.