abandoned underground mines in ohio – aumira database ... · abandoned underground mines in ohio...
TRANSCRIPT
Abandoned Underground Mines in Ohio – AUMIRA Database Population Project
Eric Kistner and James R. Swindler Jr.Stantec Consulting Services Inc.
August 3-5, 2010Appalachian States Coalition for Geohazards in Transportation
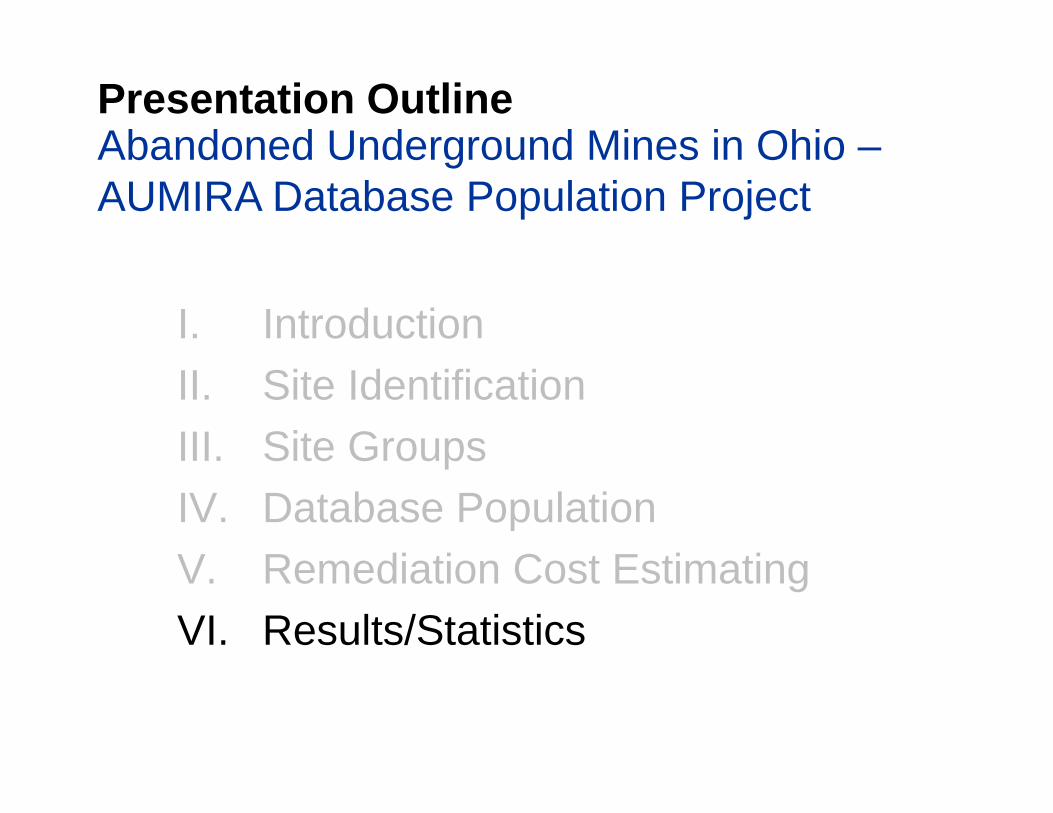
Presentation OutlineAbandoned Underground Mines in Ohio –AUMIRA Database Population Project
I. IntroductionII. Site IdentificationIII. Site GroupsIV. Database PopulationV. Remediation Cost EstimatingVI. Results/Statistics
I. IntroductionODOT Inventory Projects
• Rockfall• Landslides• Karst• Abandoned Mines
– AUMIRA = Abandoned Underground Mine Inventory and Risk Assessment
– Process published in 1998 manual
I. IntroductionWhy was AUMIRA process developed?
• Eastern Ohio mined extensively for coal• Problems with past mine subsidences
– Highway closures– High repair costs
• A need to be proactive– Public Safety– Budgetary Mechanism– Informational Resource
Presentation OutlineAbandoned Underground Mines in Ohio –AUMIRA Database Population Project
I. IntroductionII. Site IdentificationIII. Site GroupsIV. Database PopulationV. Remediation Cost EstimatingVI. Results/Statistics
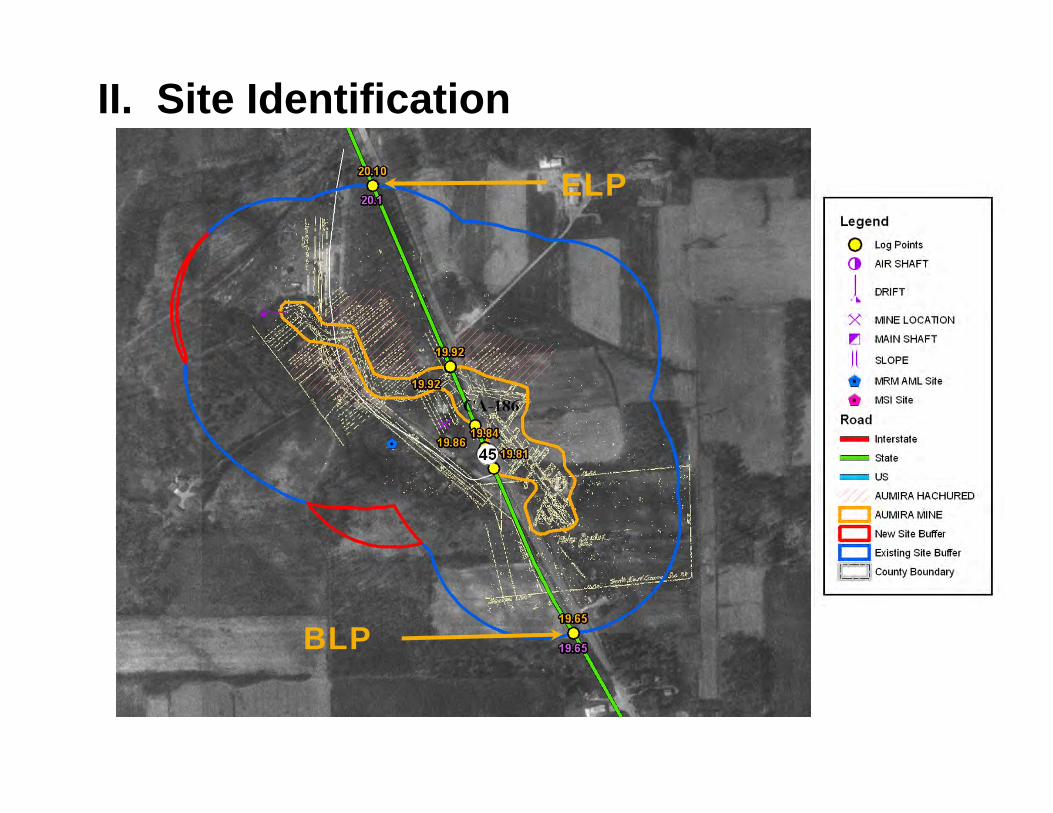
II. Site Identification
ELP
BLP
Presentation OutlineAbandoned Underground Mines in Ohio –AUMIRA Database Population Project
I. IntroductionII. Site IdentificationIII. Site GroupsIV. Database PopulationV. Remediation Cost EstimatingVI. Results/Statistics
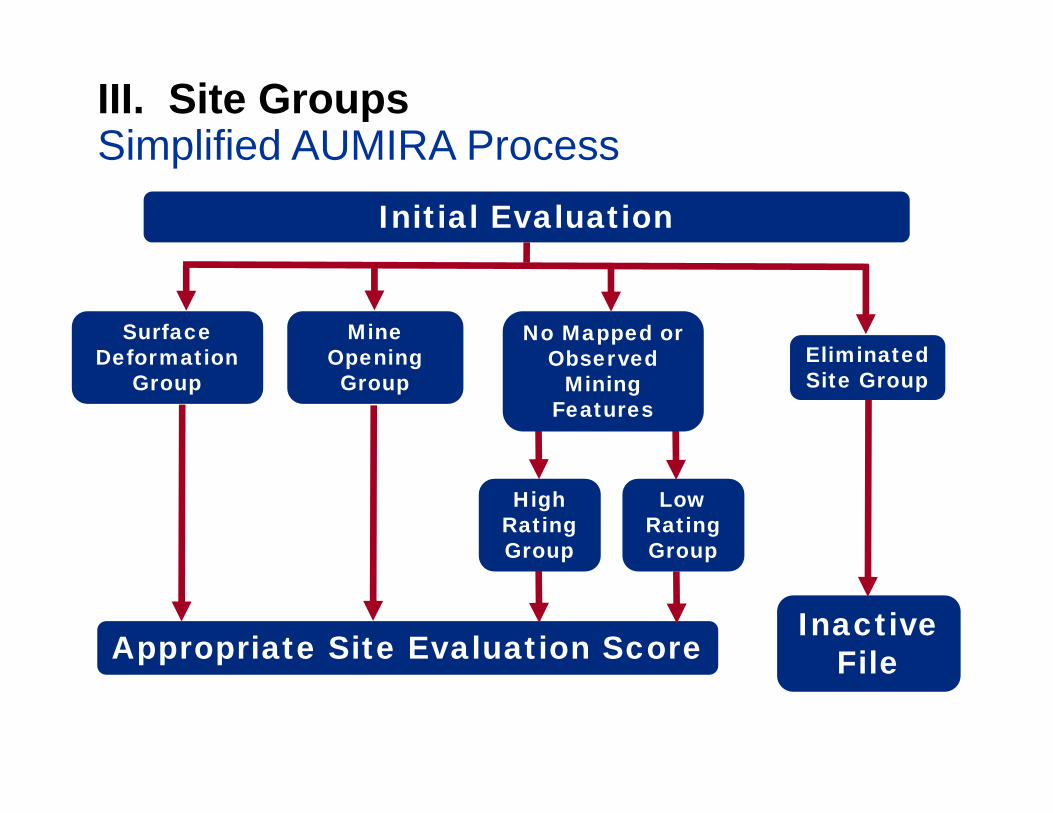
III. Site Groups
Appropriate Site Evaluation ScoreInactive
File
Eliminated Site Group
High Rating Group
Low Rating Group
Surface Deformation
Group
Mine Opening Group
Simplified AUMIRA ProcessInitial Evaluation
No Mapped or Observed
Mining Features
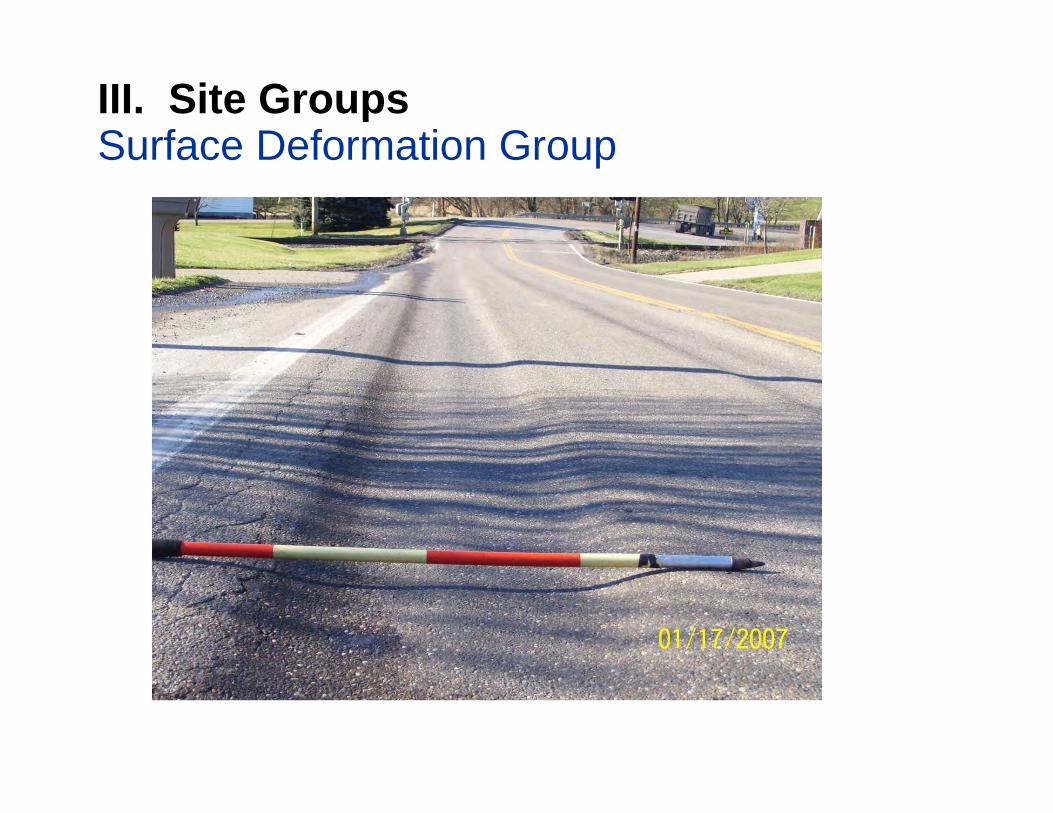
III. Site GroupsSurface Deformation Group
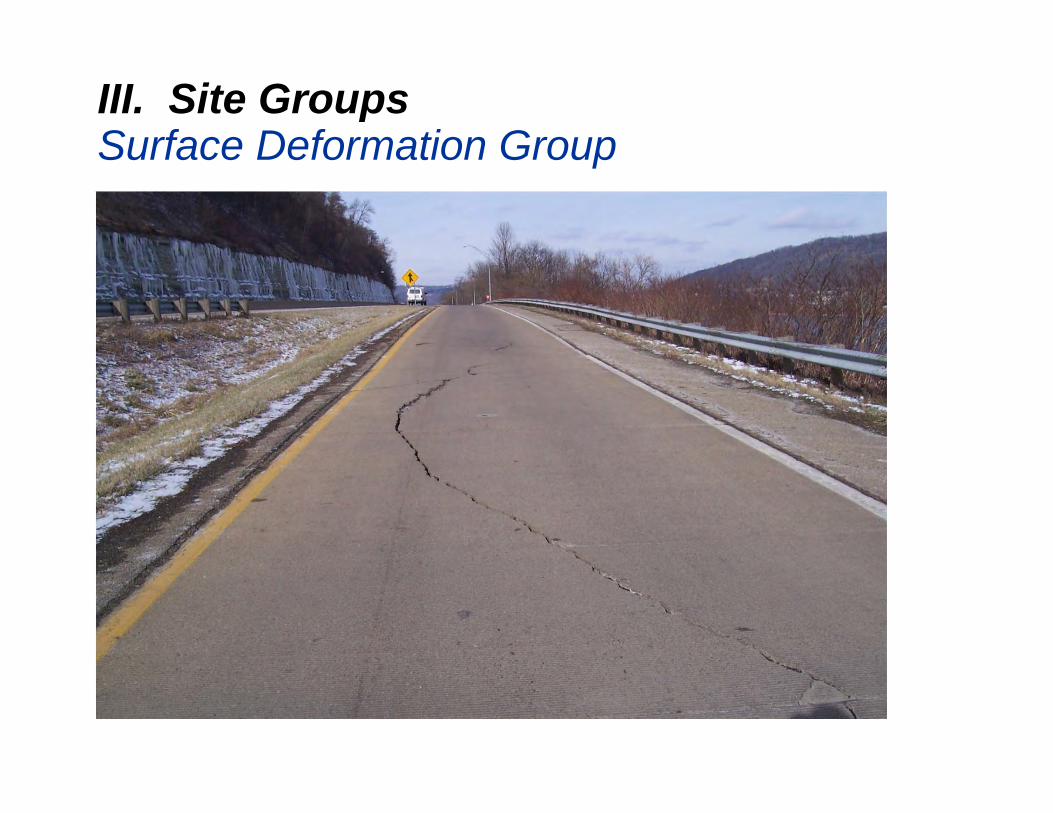
III. Site GroupsSurface Deformation Group
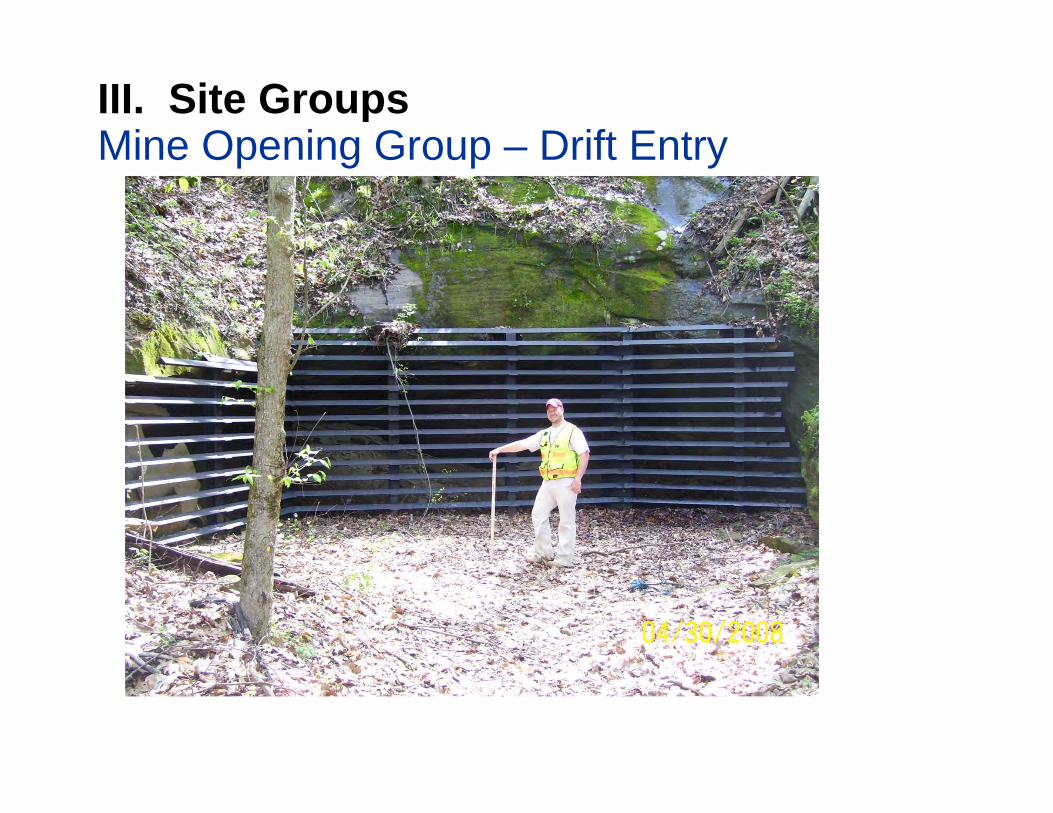
III. Site GroupsMine Opening Group – Drift Entry
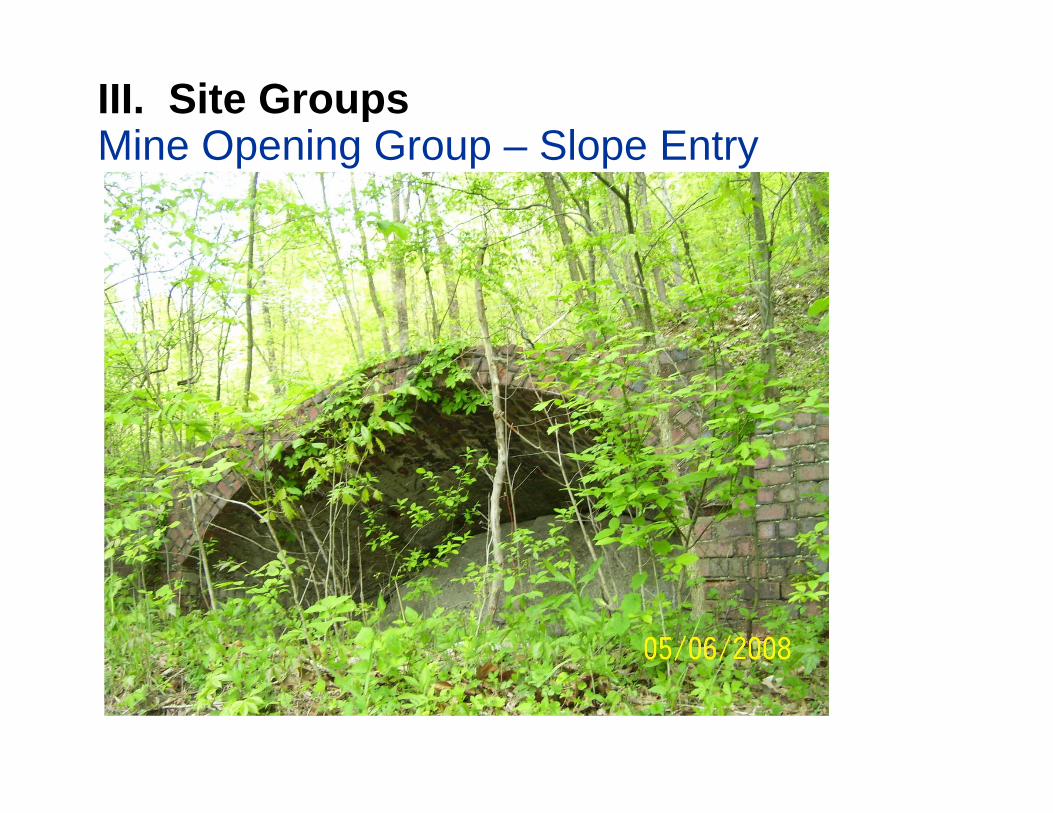
III. Site GroupsMine Opening Group – Slope Entry
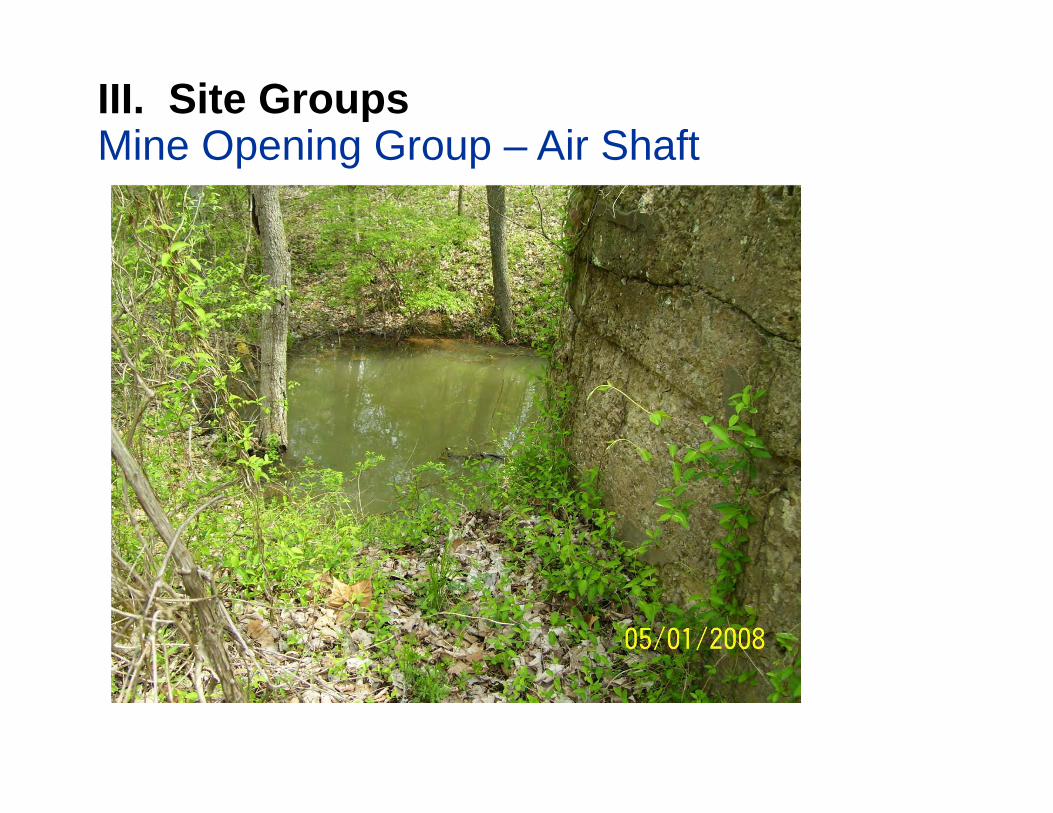
III. Site GroupsMine Opening Group – Air Shaft
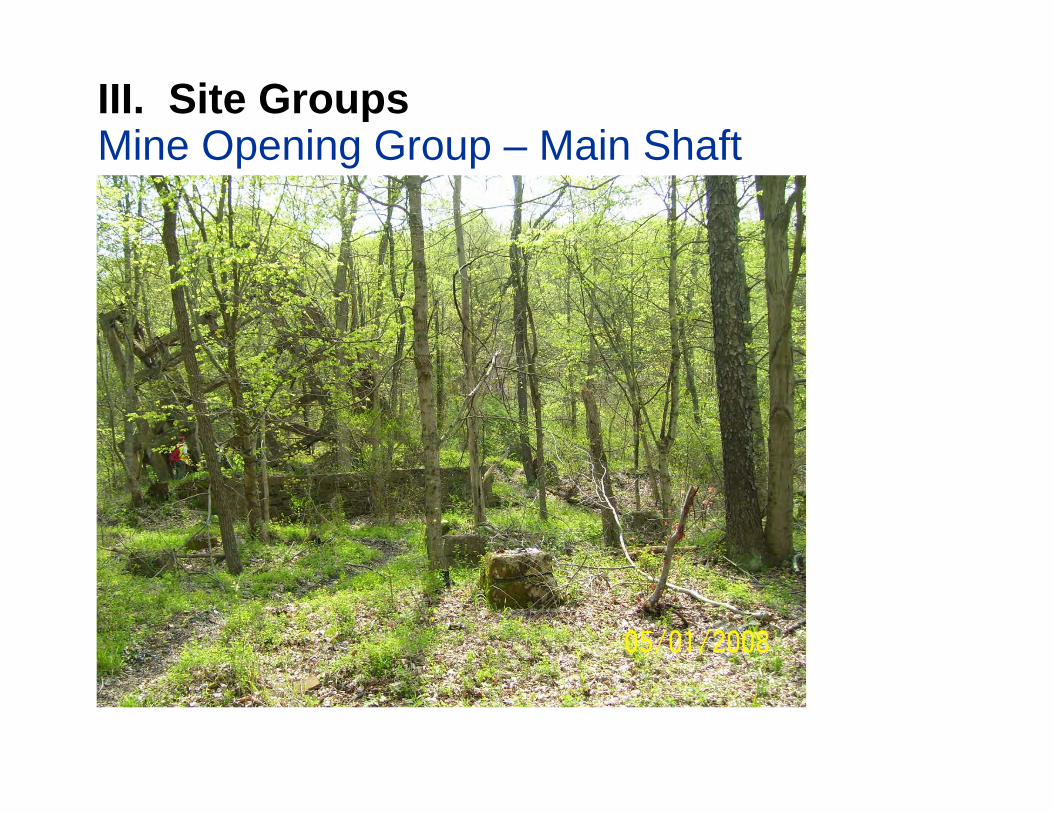
III. Site GroupsMine Opening Group – Main Shaft
Presentation OutlineAbandoned Underground Mines in Ohio –AUMIRA Database Population Project
I. IntroductionII. Site IdentificationIII. Site GroupsIV. Database PopulationV. Remediation Cost EstimatingVI. Results/Statistics
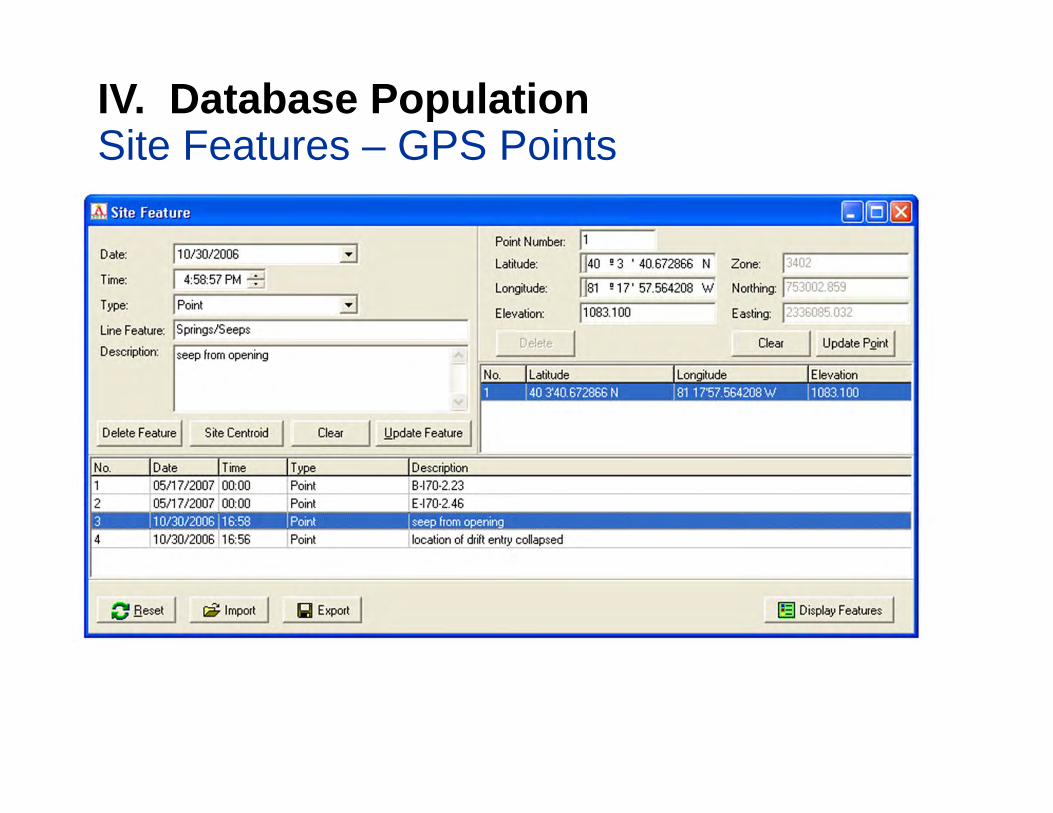
IV. Database PopulationSite Features – GPS Points
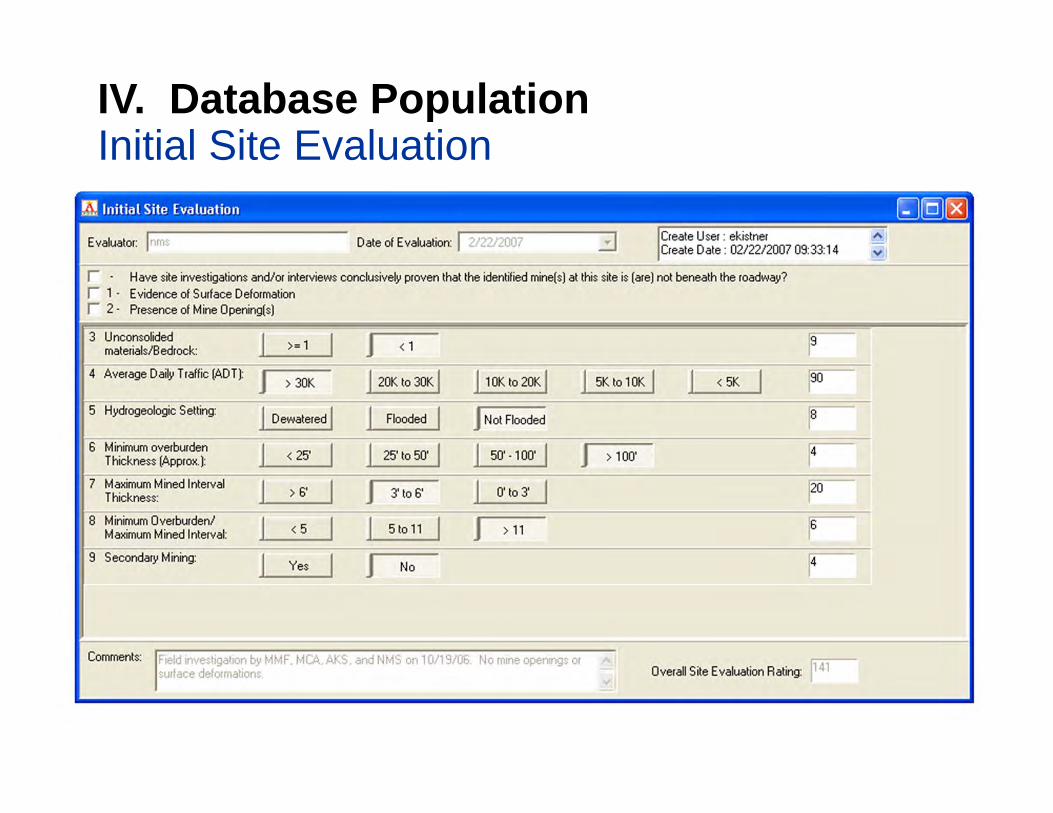
IV. Database PopulationInitial Site Evaluation
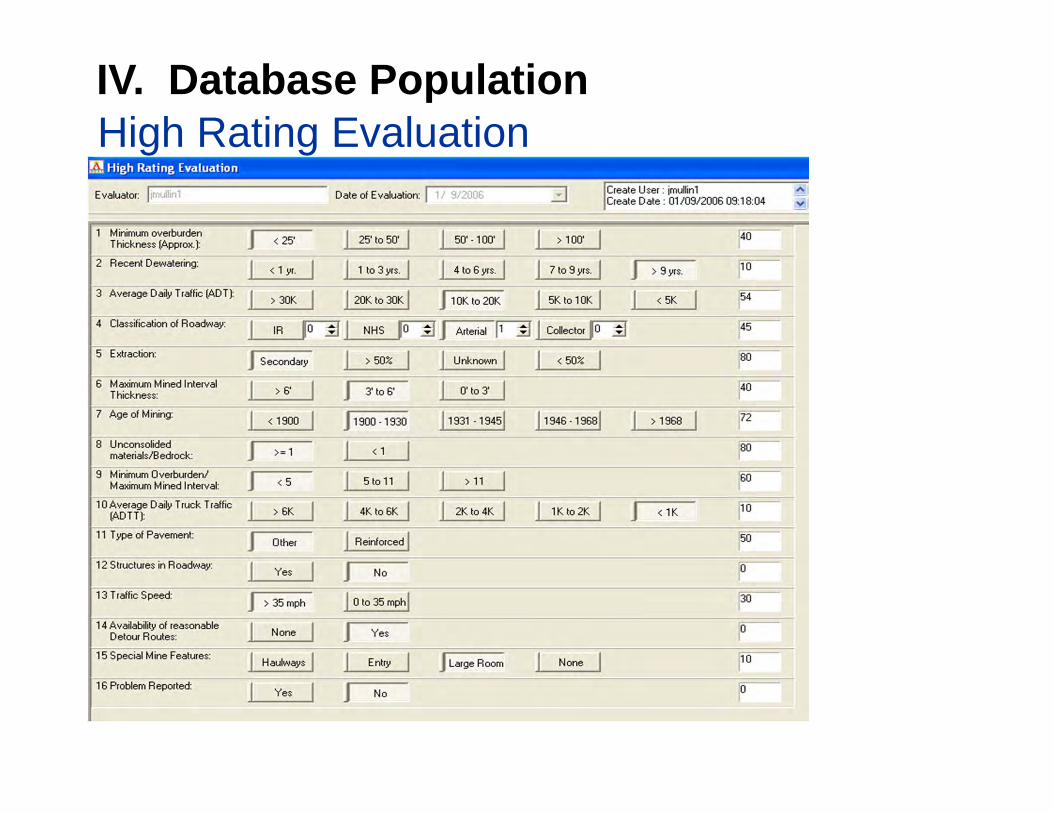
IV. Database PopulationHigh Rating Evaluation
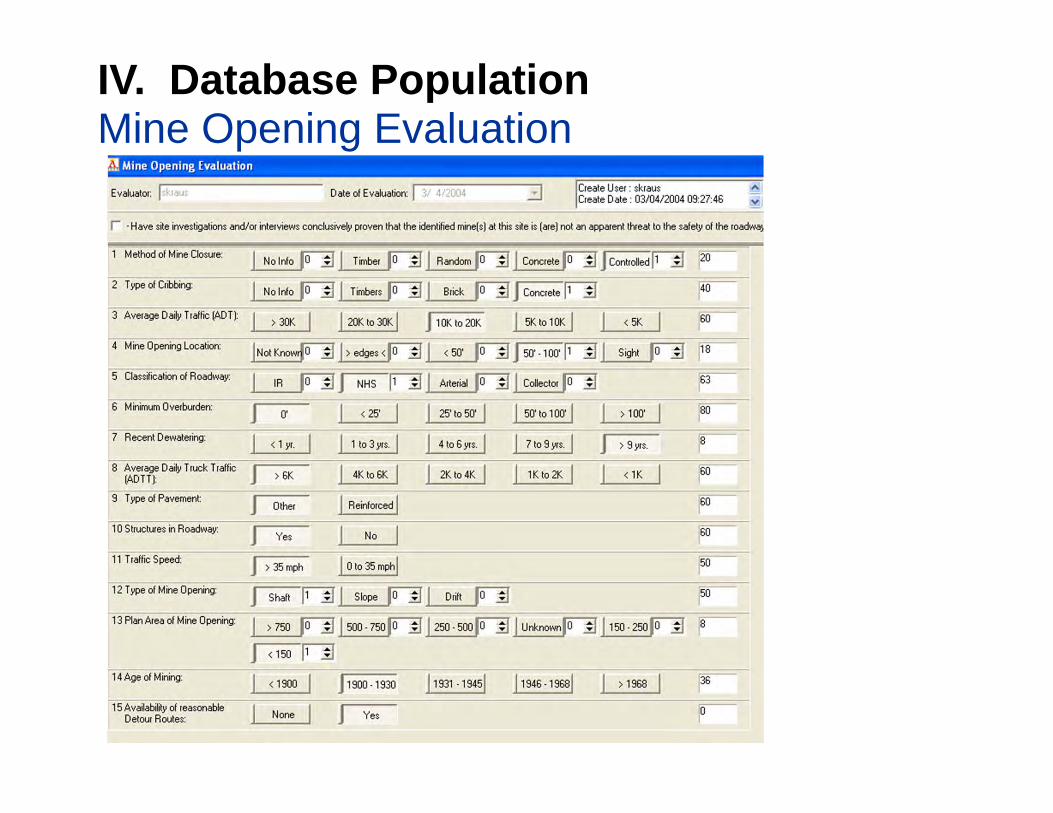
IV. Database PopulationMine Opening Evaluation
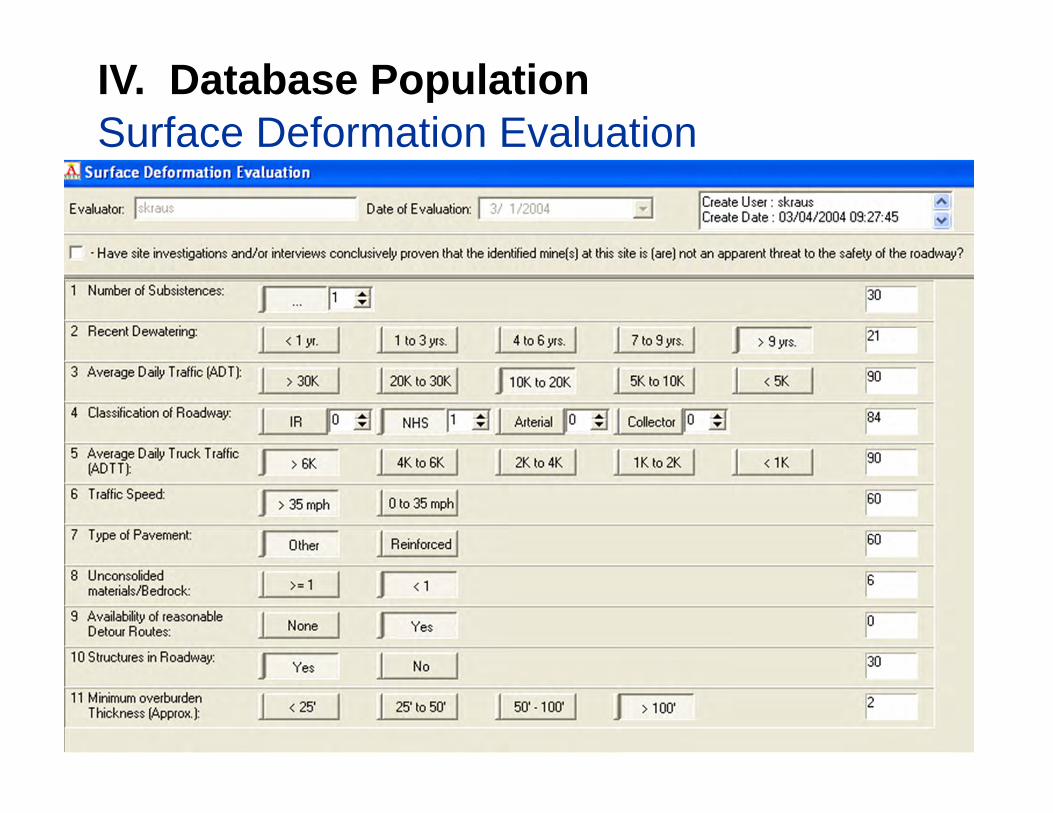
IV. Database PopulationSurface Deformation Evaluation
Presentation OutlineAbandoned Underground Mines in Ohio –AUMIRA Database Population Project
I. IntroductionII. Site IdentificationIII. Site GroupsIV. Database PopulationV. Remediation Cost EstimatingVI. Results/Statistics
V. Remediation Cost Estimating
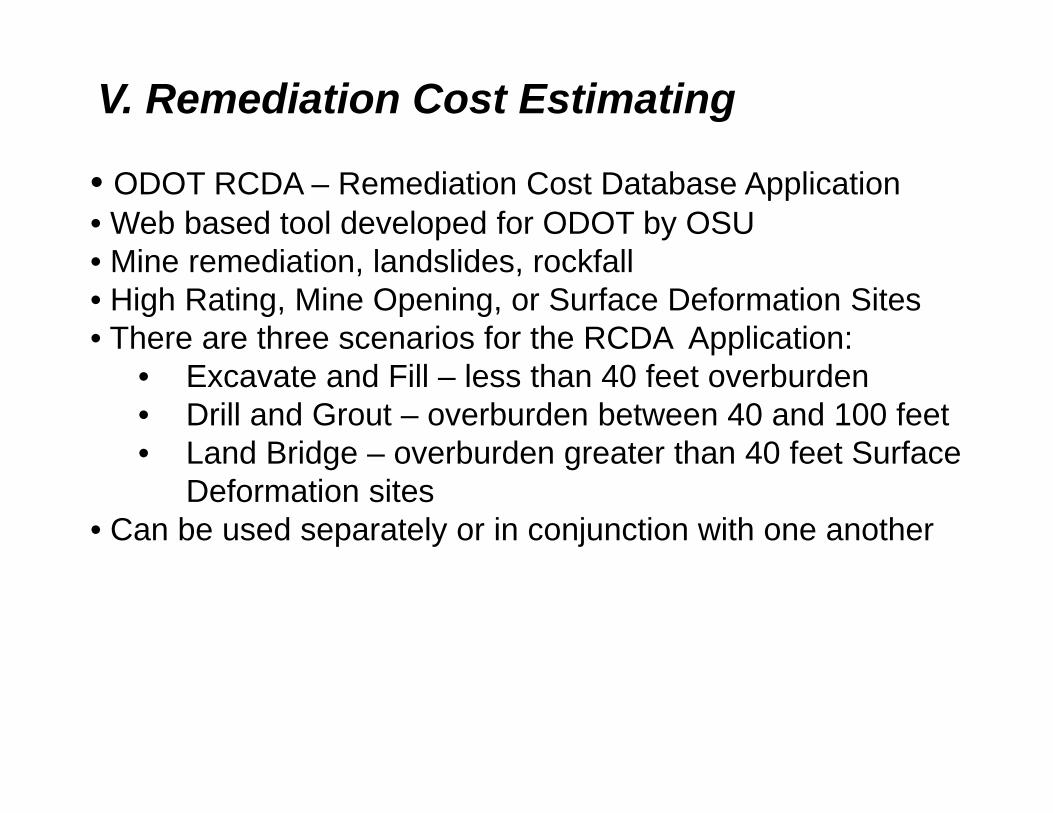
• ODOT RCDA – Remediation Cost Database Application• Web based tool developed for ODOT by OSU• Mine remediation, landslides, rockfall• High Rating, Mine Opening, or Surface Deformation Sites• There are three scenarios for the RCDA Application:
• Excavate and Fill – less than 40 feet overburden• Drill and Grout – overburden between 40 and 100 feet• Land Bridge – overburden greater than 40 feet Surface
Deformation sites• Can be used separately or in conjunction with one another
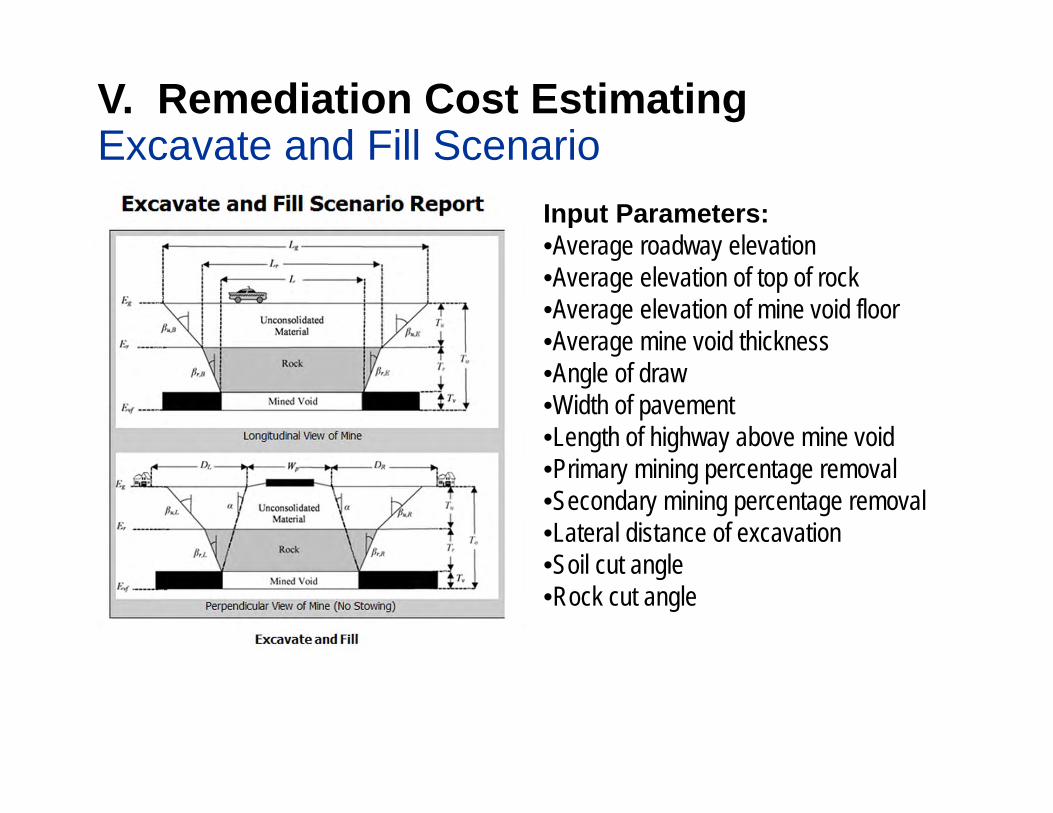
V. Remediation Cost EstimatingExcavate and Fill Scenario
Input Parameters:•Average roadway elevation•Average elevation of top of rock•Average elevation of mine void floor•Average mine void thickness•Angle of draw•Width of pavement•Length of highway above mine void•Primary mining percentage removal•Secondary mining percentage removal•Lateral distance of excavation•Soil cut angle•Rock cut angle
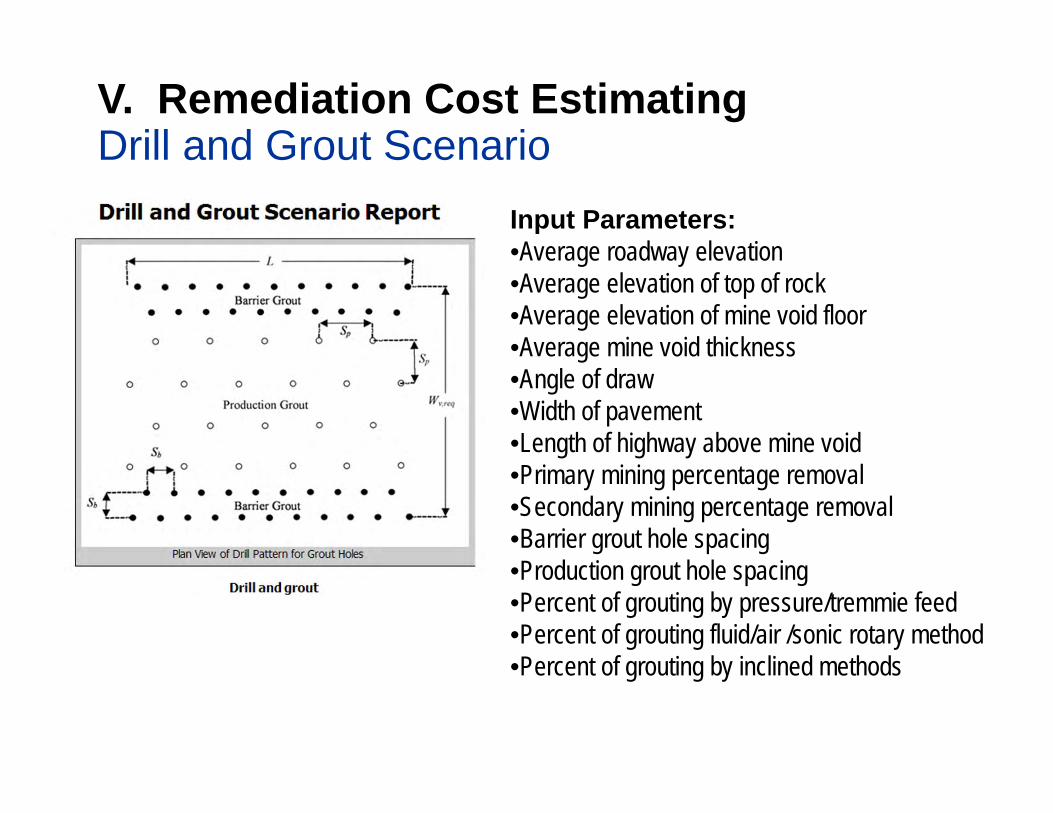
V. Remediation Cost EstimatingDrill and Grout Scenario
Input Parameters:•Average roadway elevation•Average elevation of top of rock•Average elevation of mine void floor•Average mine void thickness•Angle of draw•Width of pavement•Length of highway above mine void•Primary mining percentage removal•Secondary mining percentage removal•Barrier grout hole spacing•Production grout hole spacing•Percent of grouting by pressure/tremmie feed•Percent of grouting fluid/air /sonic rotary method•Percent of grouting by inclined methods
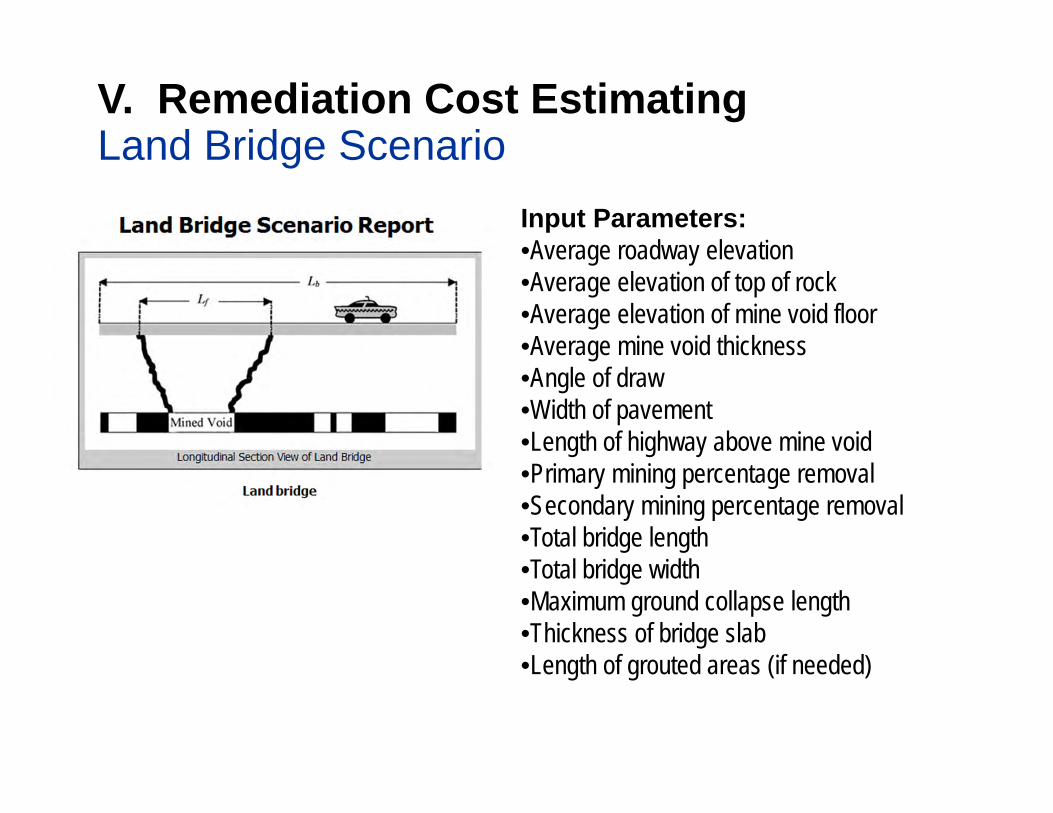
V. Remediation Cost EstimatingLand Bridge Scenario
Input Parameters:•Average roadway elevation•Average elevation of top of rock•Average elevation of mine void floor•Average mine void thickness•Angle of draw•Width of pavement•Length of highway above mine void•Primary mining percentage removal•Secondary mining percentage removal•Total bridge length•Total bridge width•Maximum ground collapse length•Thickness of bridge slab•Length of grouted areas (if needed)
Presentation OutlineAbandoned Underground Mines in Ohio –AUMIRA Database Population Project
I. IntroductionII. Site IdentificationIII. Site GroupsIV. Database PopulationV. Remediation Cost EstimatingVI. Results/Statistics
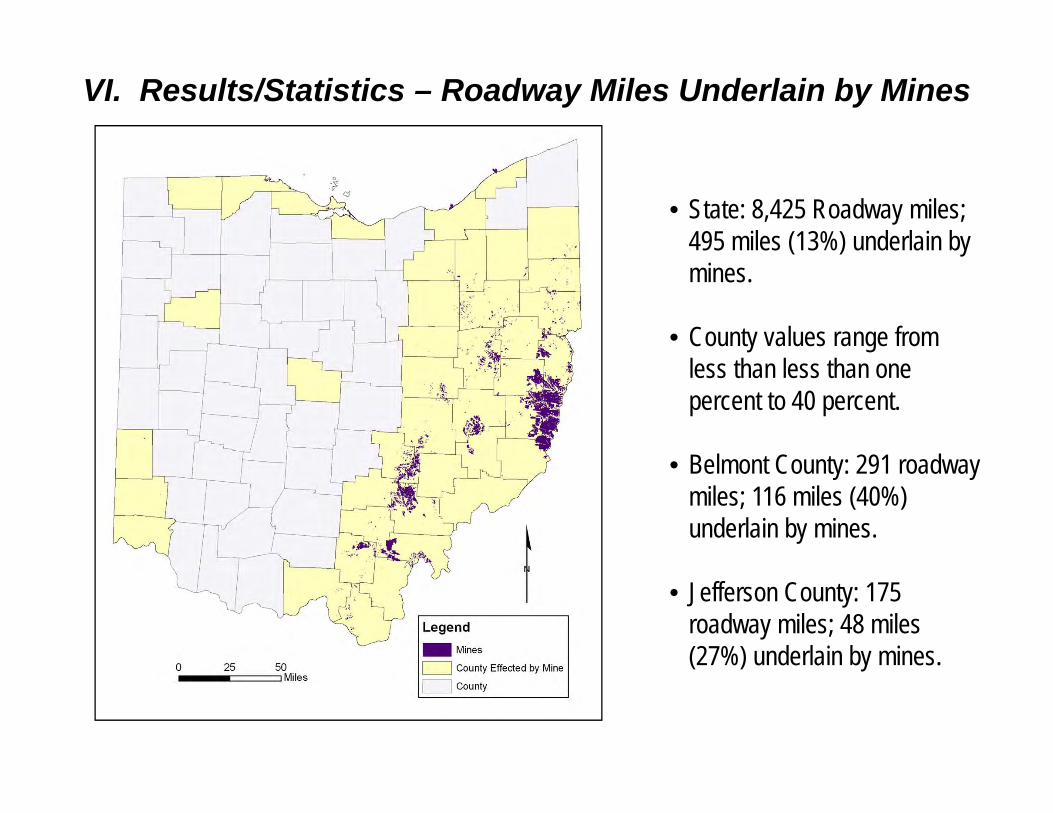
VI. Results/Statistics – Roadway Miles Underlain by Mines
• State: 8,425 Roadway miles;495 miles (13%) underlain bymines.
• County values range fromless than less than onepercent to 40 percent.
• Belmont County: 291 roadwaymiles; 116 miles (40%)underlain by mines.
• Jefferson County: 175roadway miles; 48 miles(27%) underlain by mines.
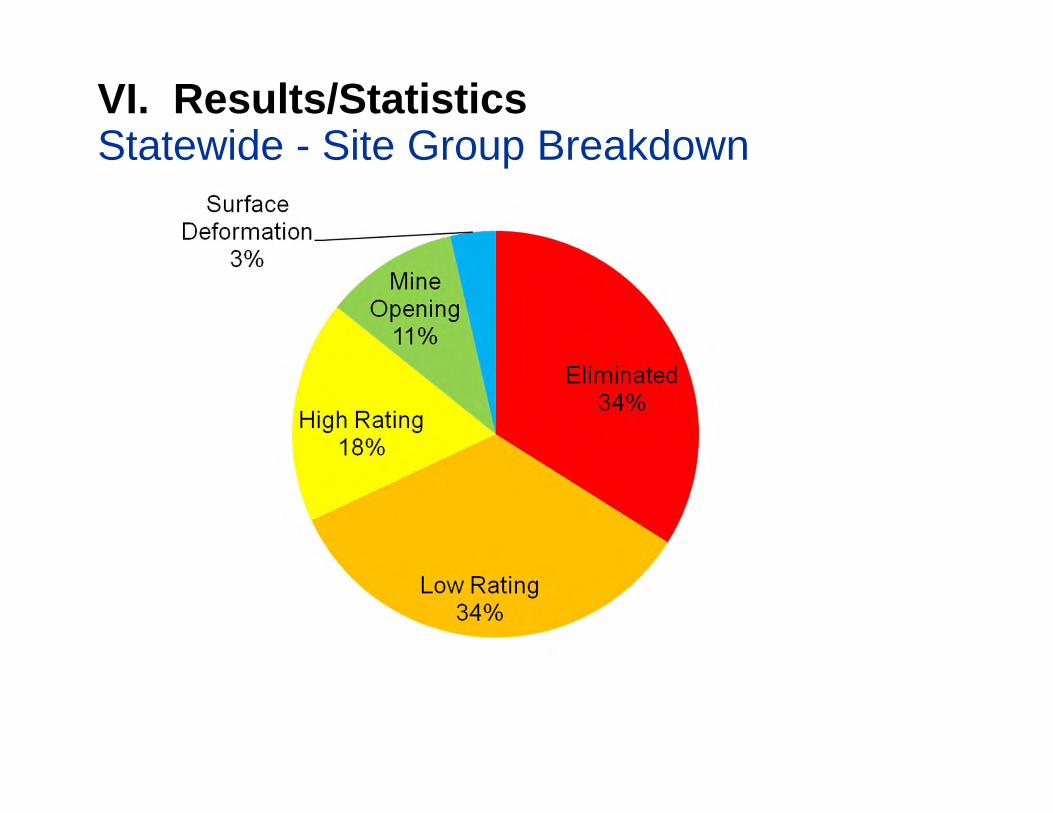
VI. Results/StatisticsStatewide - Site Group Breakdown
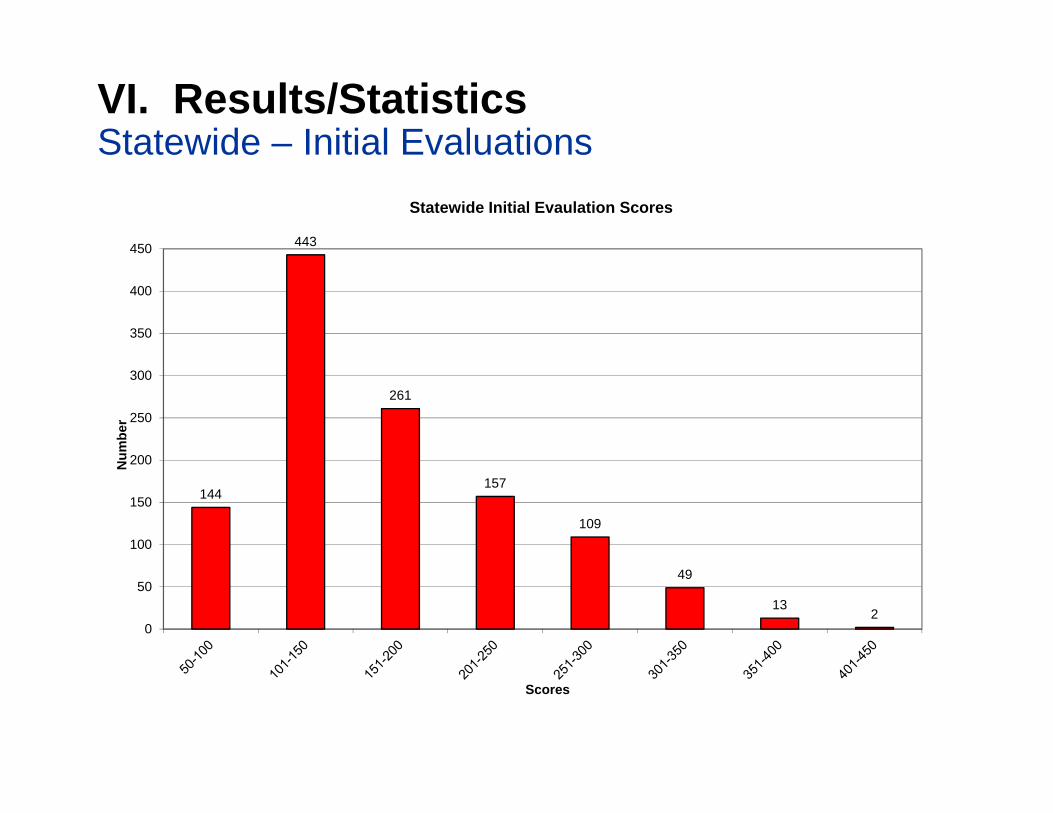
VI. Results/StatisticsStatewide – Initial Evaluations
144
443
261
157
109
49
132
0
50
100
150
200
250
300
350
400
450
Num
ber
Scores
Statewide Initial Evaulation Scores
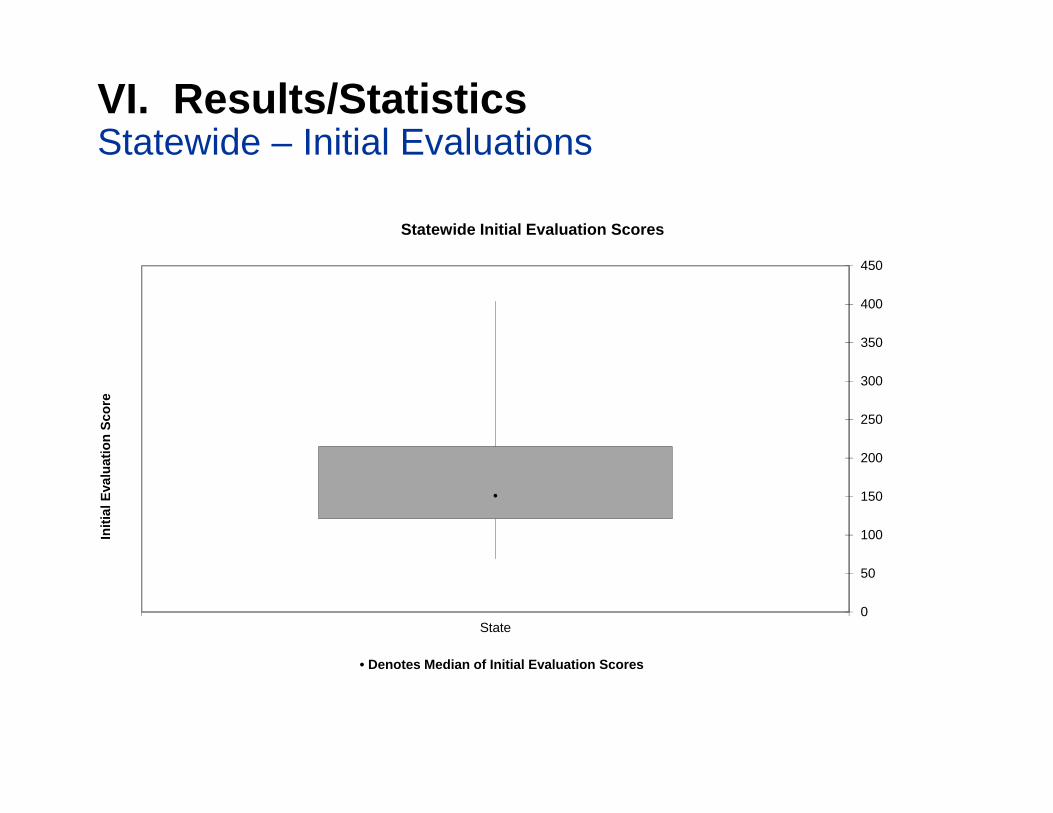
VI. Results/StatisticsStatewide – Initial Evaluations
State0
50
100
150
200
250
300
350
400
450
Initi
al E
valu
atio
n Sc
ore
• Denotes Median of Initial Evaluation Scores
Statewide Initial Evaluation Scores
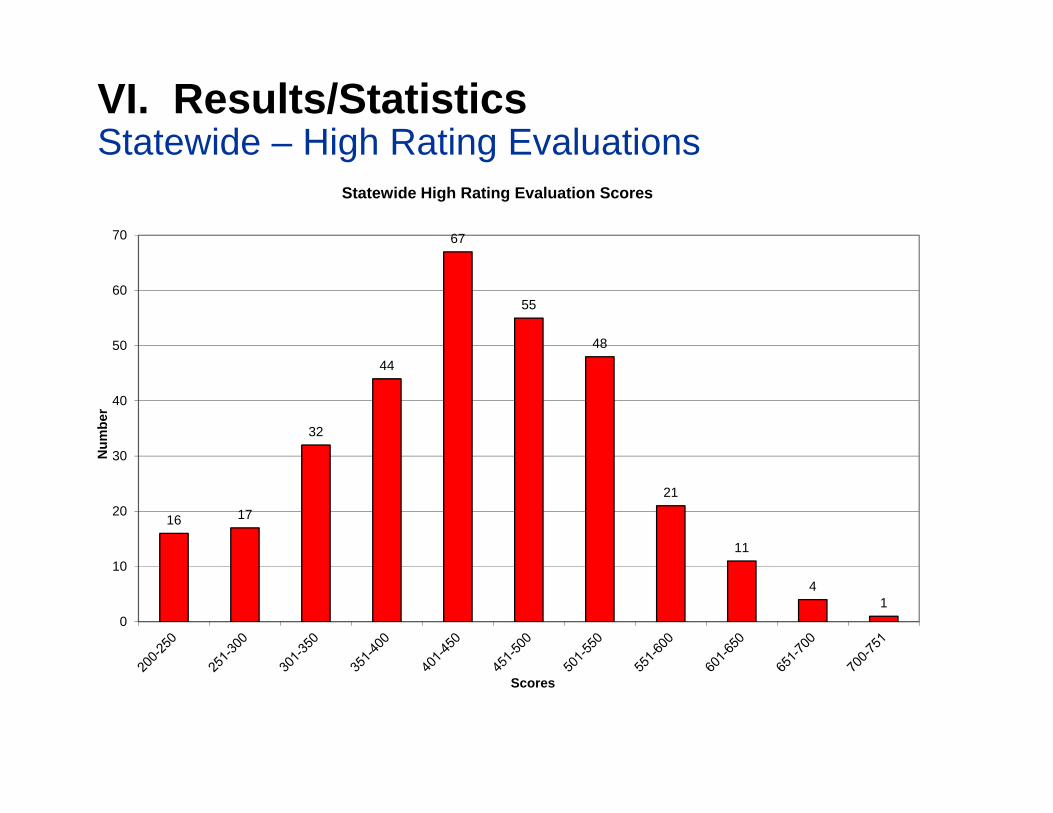
VI. Results/StatisticsStatewide – High Rating Evaluations
16 17
32
44
67
55
48
21
11
41
0
10
20
30
40
50
60
70
Num
ber
Scores
Statewide High Rating Evaluation Scores
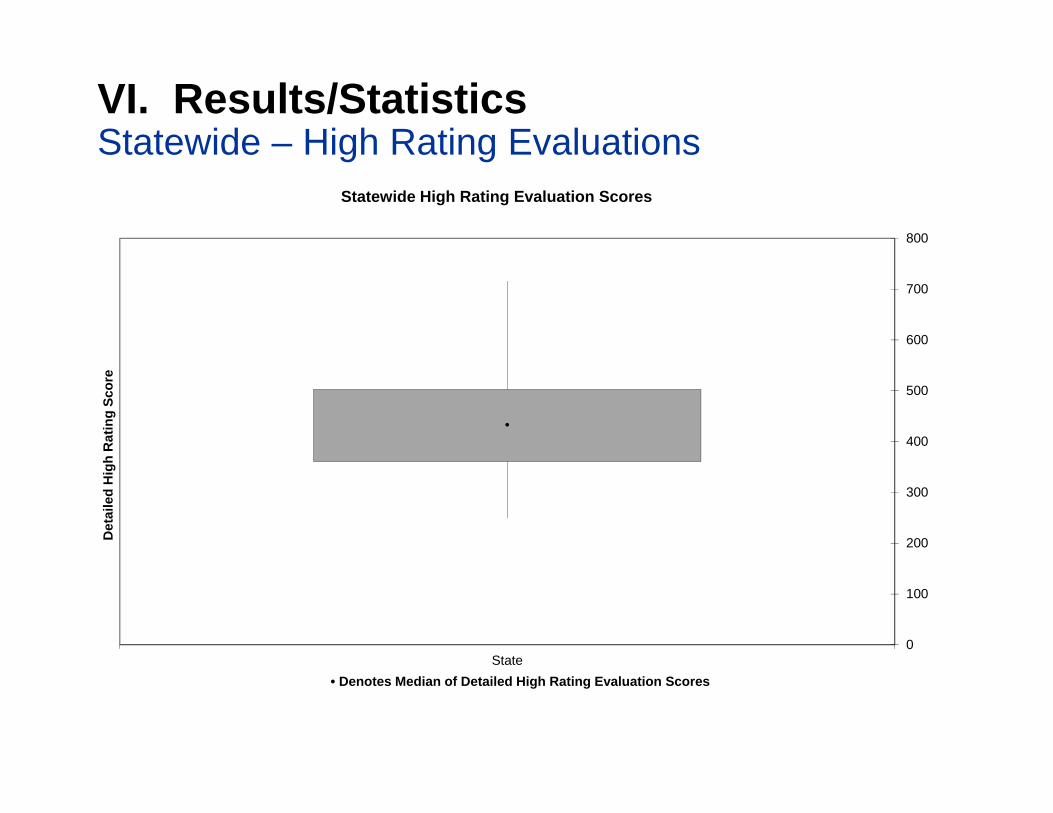
VI. Results/StatisticsStatewide – High Rating Evaluations
State0
100
200
300
400
500
600
700
800
Det
aile
d H
igh
Rat
ing
Scor
e
• Denotes Median of Detailed High Rating Evaluation Scores
Statewide High Rating Evaluation Scores
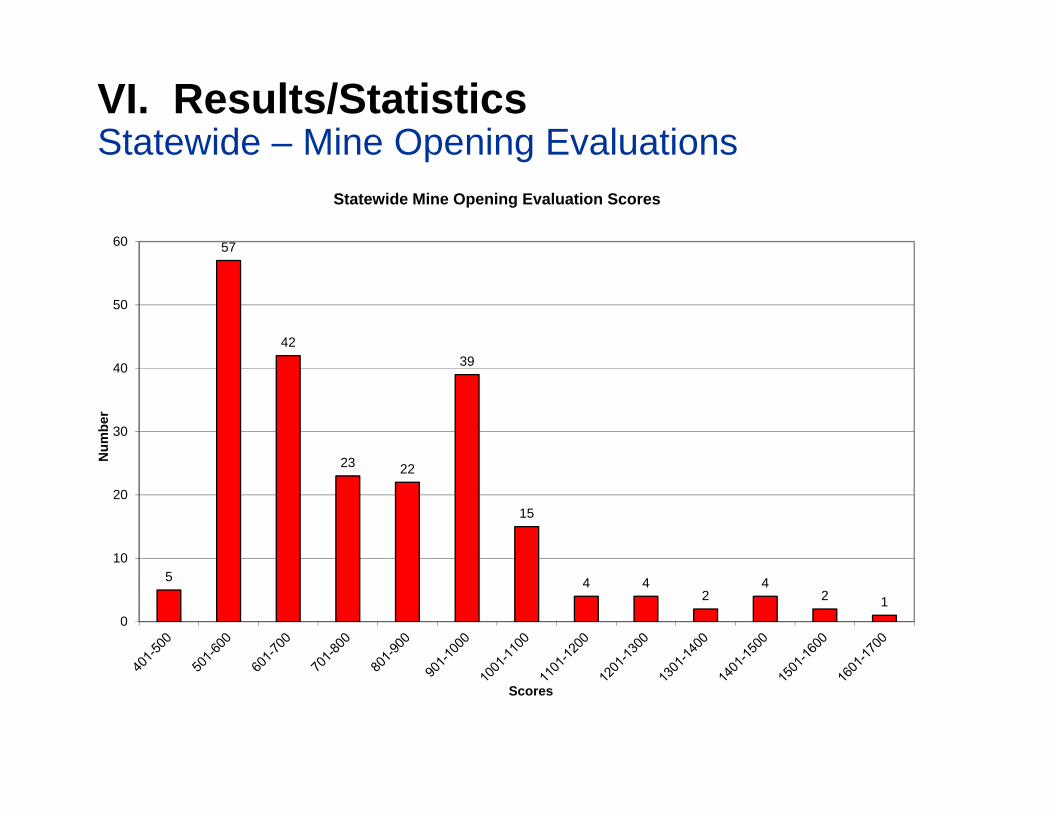
VI. Results/StatisticsStatewide – Mine Opening Evaluations
5
57
42
23 22
39
15
4 42
42 1
0
10
20
30
40
50
60
Num
ber
Scores
Statewide Mine Opening Evaluation Scores
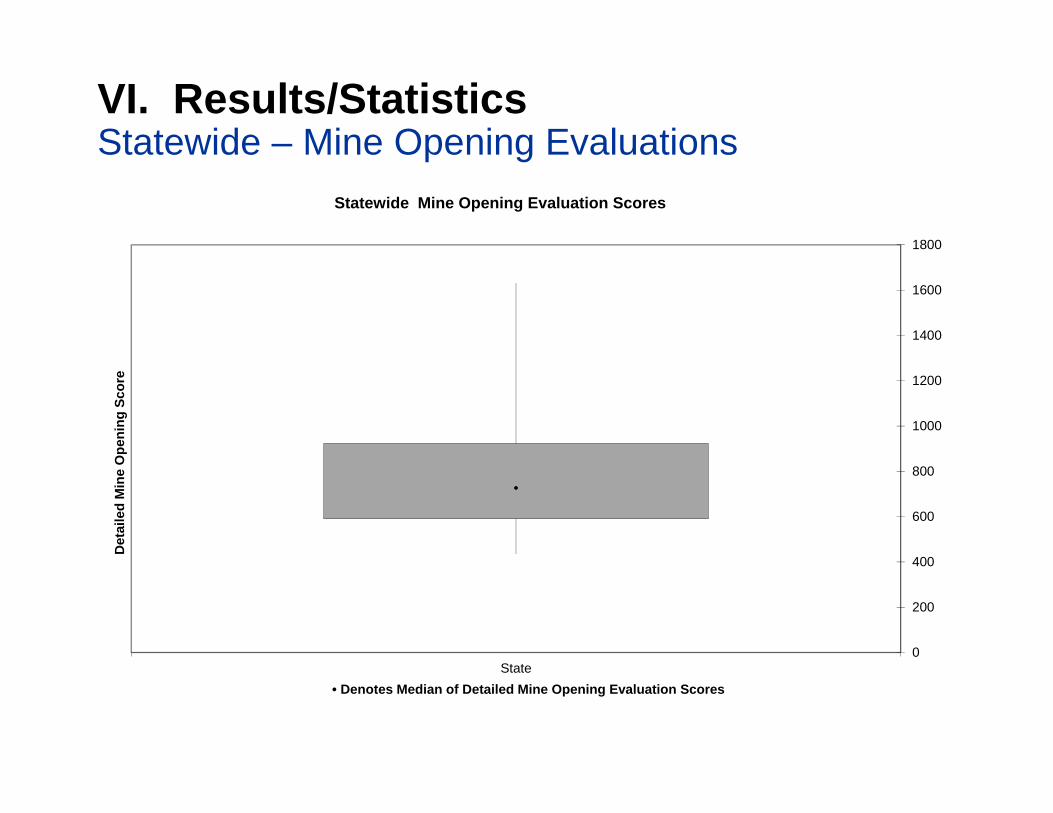
VI. Results/StatisticsStatewide – Mine Opening Evaluations
State0
200
400
600
800
1000
1200
1400
1600
1800
Det
aile
d M
ine
Ope
ning
Sco
re
• Denotes Median of Detailed Mine Opening Evaluation Scores
Statewide Mine Opening Evaluation Scores
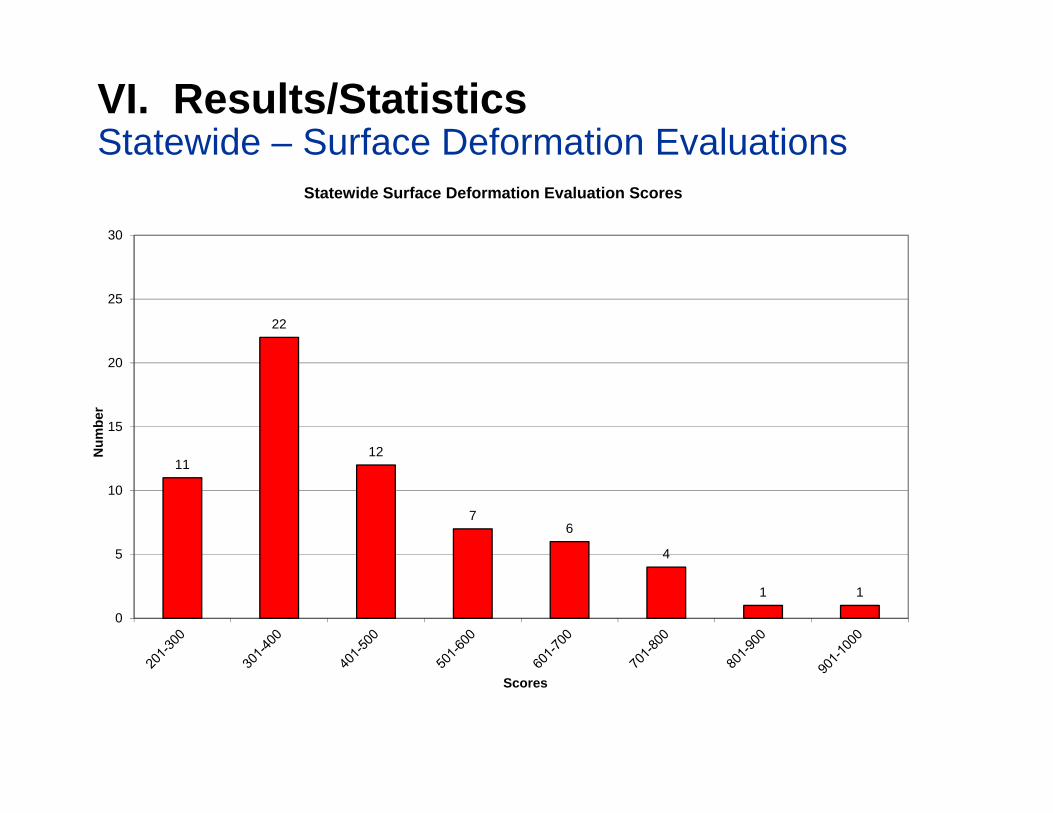
VI. Results/StatisticsStatewide – Surface Deformation Evaluations
11
22
12
76
4
1 1
0
5
10
15
20
25
30
Num
ber
Scores
Statewide Surface Deformation Evaluation Scores
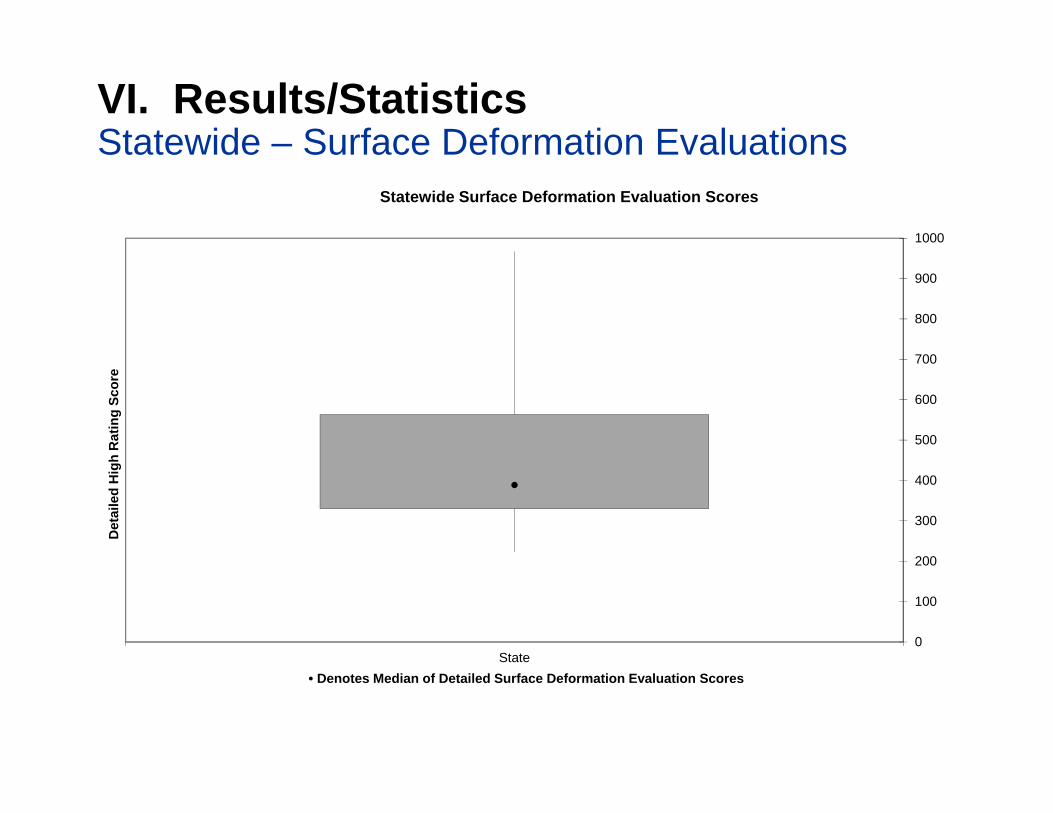
VI. Results/StatisticsStatewide – Surface Deformation Evaluations
State0
100
200
300
400
500
600
700
800
900
1000
Det
aile
d H
igh
Rat
ing
Scor
e
• Denotes Median of Detailed Surface Deformation Evaluation Scores
Statewide Surface Deformation Evaluation Scores
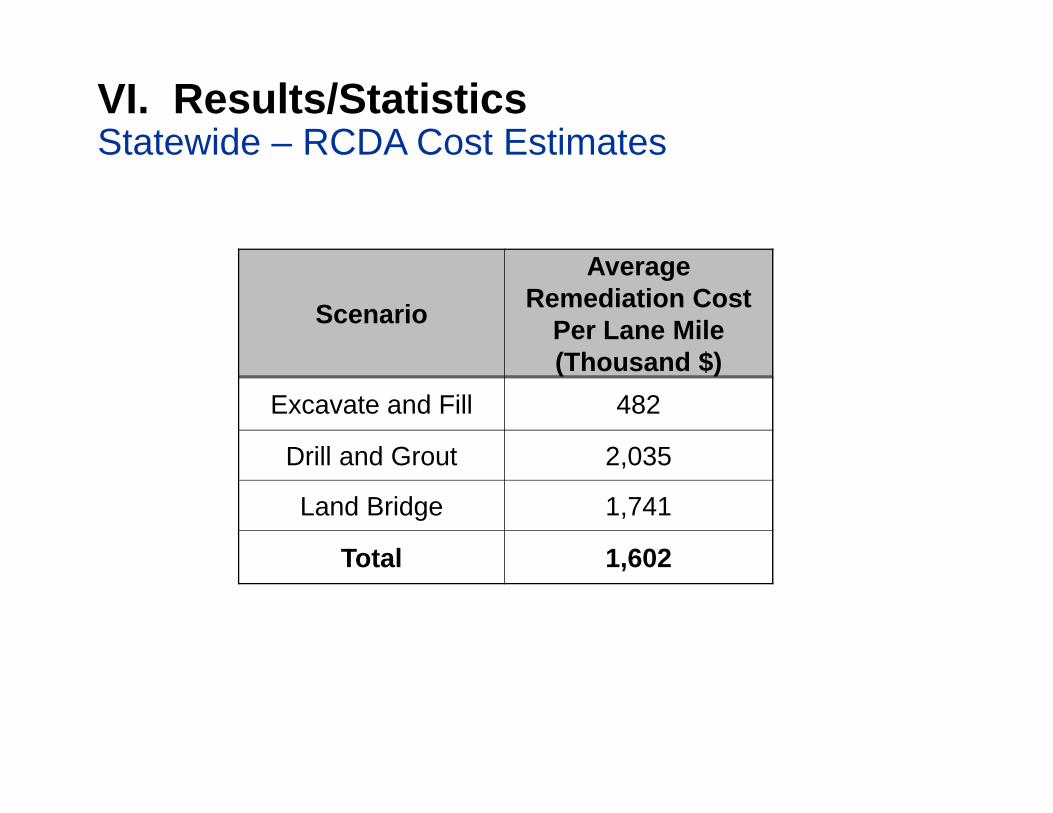
VI. Results/StatisticsStatewide – RCDA Cost Estimates
Scenario
AverageRemediation Cost
Per Lane Mile(Thousand $)
Excavate and Fill 482
Drill and Grout 2,035
Land Bridge 1,741
Total 1,602
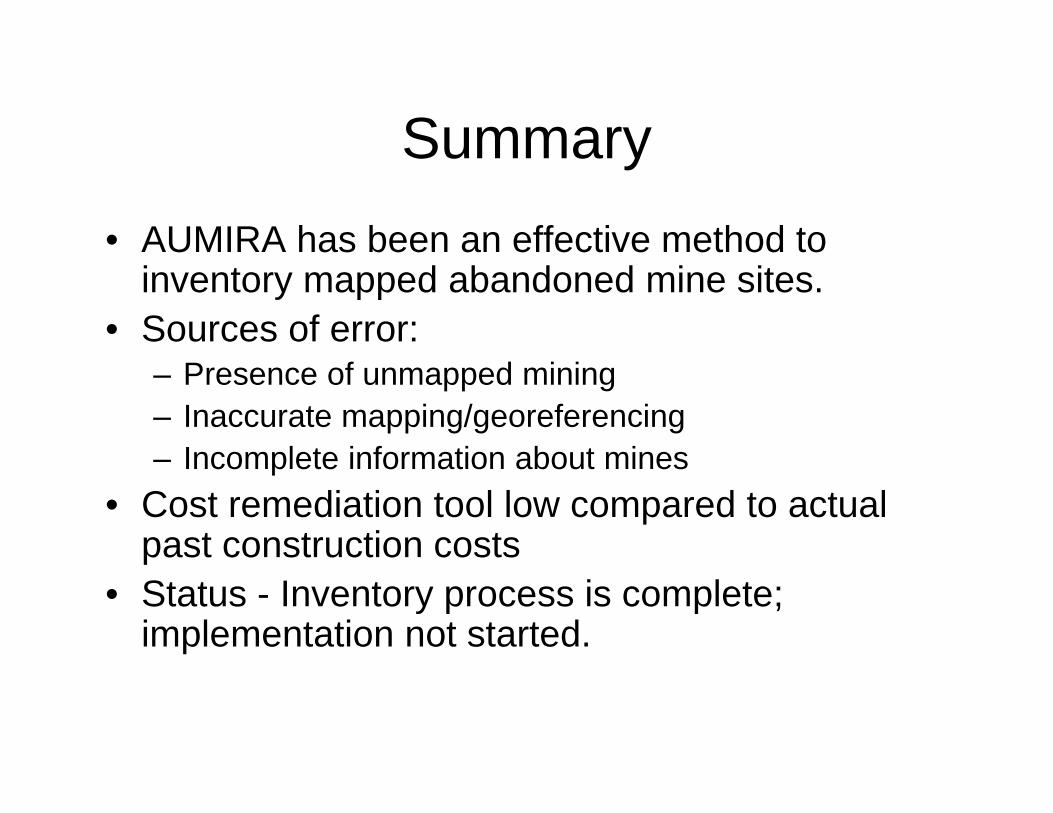
Summary• AUMIRA has been an effective method to
inventory mapped abandoned mine sites.• Sources of error:
– Presence of unmapped mining– Inaccurate mapping/georeferencing– Incomplete information about mines
• Cost remediation tool low compared to actual past construction costs
• Status - Inventory process is complete; implementation not started.
Thank you.Questions?