ab119691 gfp dipstick kit - abcam
TRANSCRIPT

ab119691 –
GFP Dipstick ELISA Kit
Instructions for Use
For rapid determination of GFP protein expression This product is for research use only and is not intended for diagnostic use.

1

2
Table of Contents
1. Introduction 3
2. Assay Summary 5
3. Kit Contents 6
4. Storage and Handling 6
5. Additional Materials Required 7
6. Preparation of Reagents 7
7. Sample Preparation 9
8. Assay Procedure 11
9. Data Analysis 13
10. Specificity 19
11. Troubleshooting 20

1. Introduction
Principle: ab119691 GFP Dipstick ELISA (Enzyme
Immunosorbent Assay) kit is an in vitro lateral flow immunoassay for
the rapid determination of GFP or GFP tagged protein expression in
cell and tissue lysates. The assay employs three antibodies: (1) a
mouse monoclonal antibody (mAb) specific to GFP immobilized on a
nitrocellulose membrane in a thin line perpendicular to the length of
the dipstick, (2) a rabbit polyclonal (pAb) antibody specific to GFP
and (3) a gold-conjugated goat anti-rabbit (GAR) antibody with very
low cross-reactivity against mouse antibodies. Standards and
samples are wicked past the mAb immobilized on the dipstick,
followed by sequential wicking of the pAb and the gold
GAR in a similar fashion. When GFP is present in the sample, a red
line appears at the site of the anti-GFP antibody line. The signal
intensity is directly related to the amount of GFP in the sample. The
signal intensity is best measured by a dipstick reader (MS1000) or
may be analyzed by another imaging system or by simple visual
inspection in the presence of a calibration curve.
3
ab119691 GFP Dipstick ELISA (Enzyme-Linked
Immunosorbent Assay) kit is an in vitro lateral flow immunoassay for
agged protein expression in
cell and tissue lysates. The assay employs three antibodies: (1) a
mouse monoclonal antibody (mAb) specific to GFP immobilized on a
nitrocellulose membrane in a thin line perpendicular to the length of
t polyclonal (pAb) antibody specific to GFP
rabbit (GAR) antibody with very
reactivity against mouse antibodies. Standards and
samples are wicked past the mAb immobilized on the dipstick,
l wicking of the pAb and the gold-conjugated
GAR in a similar fashion. When GFP is present in the sample, a red
GFP antibody line. The signal
intensity is directly related to the amount of GFP in the sample. The
al intensity is best measured by a dipstick reader (MS1000) or
may be analyzed by another imaging system or by simple visual
4
Background: Green fluorescence protein (GFP) is a 27 kDa protein
derived from the jellyfish Aequorea victoria, which emits green light
(emission peak at a wavelenth of 509 nm) when excited by blue light
(excitation peak at a wavelenth of 395 nm). GFP has become an
invaluable tool in cell biology research, since its intrinsic
fluorescence can be visualized in living cells. GFP has been widely
used as a reporter for gene expression, enabling researchers to
visualize and localize GFP-tagged proteins within living cells without
the need for chemical staining.
While GFP expression can sometimes be detected by fluorescence
emission in cells and tissues, determination of very low levels of
expression for optimization of expression is difficult and time
consuming. This GFP Dipstick ELISA Kit is lateral flow
immunoassay developed for an easy, rapid and sensitive detection
of GFP or GFP fusion proteins in cells or tissue samples. GFP may
be accurately quantified with the use of an immunochromato-reader
(MS1000) by comparing the signal from an unknown sample with
that of a known recombinant GFP standard curve. The kit has a
detection sensitivity limit of 50 pg/mL GFP. Each kit provides
sufficient reagents to perform up to 48 assays including standard
curve and GFP samples. Note, it is possible that improper folding of
GFP or the presence of a fusion partner may prevent GFP binding in
this kit.

5
2. Assay Summary
Bring all reagents, samples and dipsticks to room temperature.
Prepare all the reagents, samples, and standards as instructed.
Wick 25 µL of standard or sample on the dipstick (~5 min)
Wick 25 µL of diluted detector antibody on the dipstck (~10 min).
Reconstitute gold conjugated GAR and wick on the dipstick
(~10 min)
Wash dipstick by wicking 50 µL of the wash buffer (~15 min).
Air dry dipsticks (~ 10 min)
Measure signal or visualize against a calibration curve

6
3. Kit Contents
Item Quantity
Dipsticks 48
GFP Microplate (2 x 24 Wells) 48 Wells
10X Detector Antibody 0.14 mL
Extraction Buffer 25 mL
10X Blocking Buffer 1 mL
Wash Buffer 5 mL
GFP Protein Standard (100 ng) 1 vial
4. Storage and Handling
Store all components at 4°C. This kit is stable for 6 months from
receipt. After reconstitution the standard should be stored at -80°C.
10X blocking, dipsticks and gold-conjugated GAR may be stored at
room temperature in the provided containers and out of direct
sunlight.
7
5. Additional Materials Required
• Method for determining protein concentration (BCA assay
recommended)
• Pipetting devices
• Optional: Protease inhibitors
• Optional: Dipstick reader or other imaging system (i.e. flat
bed scanner or blot imaging station)
• Optional: 37ºC incubator/oven for fast drying of the dipstick
6. Preparation of Reagents
6.1. Bring all reagents and dipsticks to room temperature (18-25oC)
before use.
6.2. Prepare 1X Antibody Dilution Buffer by adding 300 µL of 10X
Blocking Buffer + 300 µL of Extraction Buffer + 2.4 mL of Wash
Buffer. After performing the dipstick assay unused 1X
Antibody Dilution Buffer should be stored at -20ºC for 6
months.
6.3. Prepare 1X Sample Dilution Buffer by adding 500 µL of 10X
blocking buffer + 4.5 mL of Extraction Buffer. After performing
the dipstick assay unused 1X Sample Dilution Buffer should be
stored at -20ºC for 6 months.

8
6.4. Dilute the 10X Detector Antibody 10-fold with 1X Antibody
Dilution Buffer immediately before use. Prepare 30 µL per
dipstick.
6.5. Reconstitute the GFP Protein Standard (100 ng) with 1 mL of
1X Sample Dilution buffer by pipetting. Allow to sit for 10
minutes and repeat pipetting to ensure thorough reconstitution.
This 100 ng/mL stock of standard material is then used to
generate a standard curve in labeled tubes as described
below. Any remaining stock material can be stored at -80oC
for 6 months.
6.6. Label tubes #2-7. Label the 100 ng/mL GFP Protein Standard
stock tube #1. Add 150 µL of 1X Incubation buffer to each of
#2 through #7. Transfer 150 µL from tube #1 to tube #2. Mix
thoroughly. With a fresh pipette tip transfer 150 µL from #2 to
#3. Mix thoroughly. Repeat for Tubes #4 through #7. Use 1X
Sample Dilution buffer as the zero standard tube labeled #8.
For accurate quantification of GFP expression, use a freshly
prepared serially diluted standards for each assay. For
qualitative assessment, use 1 standard per kit lot.
9
7. Sample Preparation
Note: Extraction buffer can be supplemented with phosphatase
inhibitors, PMSF and protease inhibitor cocktail prior to use.
Supplements should be used according to manufacturer’s
instructions.
7.1. Cell lysates.
7.1.1 Collect non adherent cells by centrifugation or
scrape to collect adherent cells from the culture
flask. Typical centrifugation conditions for cells are
500 x g for 10 min at 4oC.
7.1.2 Rinse cells twice with PBS.
7.1.3 Solubilize cell pellet at 2x10⁷/mL in Extraction Buffer.
Enough extraction buffer is provided for 40 samples,
each extracted in 500 µL volume.
7.1.4 Incubate on ice for 20 minutes. Centrifuge at 16,000
x g for 20 minutes at 4°C. Transfer the supernatants
into clean tubes and discard the pellets. Assay
samples immediately or aliquot and store at -80°C
for 6 months. The sample protein concentration in
the extract may be quantified using a protein assay.
Note: Do not determine protein concentration by the
A280 method.

10
7.2. Tissue lysates.
7.2.1 Tissue lysates are typically prepared by
homogenization of tissue that is first minced and
thoroughly rinsed in PBS to remove blood (dounce
homogenizer recommended).
7.2.2 Suspend the homogenate to 25 mg/mL in PBS.
7.2.3 Solubilize 100 µL of the homogenate by adding 4
volumes of Extraction Buffer to a sample protein
concentration of 5 mg/mL.
7.2.4 Incubate on ice for 20 minutes. Centrifuge at 16,000
x g for 20 minutes at 4°C. Transfer the supernatants
into clean tubes and discard the pellets. Assay
samples immediately or aliquot and store at -80°C
for 6 months. The sample protein concentration in
the extract may be quantified using a protein assay.
Note: Do not determine protein concentration by the
A280 method.
7.3. Sub-cellular organelle lysates e.g. mitochondria.
7.3.1 Prepare the organelle sample by, for example, sub-
cellular fractionation.
7.3.2 Pellet the sample.
7.3.3 Solubilize the pellet by adding 9 volumes of
Extraction Buffer.

11
7.3.4 Incubate on ice for 20 minutes. Centrifuge at 16,000
x g for 20 minutes at 4°C. Transfer the supernatants
into clean tubes and discard the pellets. Assay
samples immediately or aliquot and store at -80°C
for 6 months. The sample protein concentration in
the extract may be quantified using a protein assay.
8. Assay Procedure
Equilibrate all reagents, samples and dipsticks to room
temperature before use. It is recommended all samples and
standards be assayed in duplicate. Wicking of volume onto the
dipstick should be done until the entire volume has been
absorbed. Do not allow the dipsticks to dry before the wash
step has been completed. Do not handle dipsticks without
gloves.
8.1. Prepare all reagents, working standards, and samples as
directed in the previous sections.
8.2. Remove number of desired dipsticks from the container
and label each dipstick on the whatmann paper (heavy
end) with the sample name. Keep excess dipsticks in the
provided closed container and return to storage.
8.3. Add 25 µL of each diluted standard or sample per well on
an empty well of the provided gold-conjugated antibody

12
plate (i.e. row A or E). It is recommended to include a
dilution series of GFP protein as a reference. Also include
a 1X Sample Dilution Buffer as a zero standard.
8.4. Add 25 µL of the diluted detector antibody on an empty
well of the provided gold-conjugated antibody plate (i.e.
row B or F).
8.5. Reconstitute the gold-conjugated antibody (present in
rows C and G) by adding 25 µL/well of Antibody Dilution
buffer.
8.6. Add 50 µL of Wash buffer on an empty well of the
provided gold-conjugated antibody plate (i.e row D or H).
8.7. Gently add a dipstick to the well with sample (i.e A1) by
placing the thin/nitrocellulose end of the dipstick down.
The dipstick must reach the bottom of the well.
8.8. Allow the entire sample volume in the well to wick up onto
the dipstick.
8.9. Transfer the dipstick to the well containing the detector
antibody (i.e B1). Allow the entire volume in the well to
wick up onto the dipstick.
8.10. Transfer the dipstick to the well containing the
reconstituted gold-conjugated antibody (i.e. C1). Allow the

13
entire volume in the well to wick up onto the dipstick. The
control GAR band should appear in a approximately 2-5
minutes.
8.11. Transfer the dipstick to the well containing the wash buffer.
Allow to the entire volume in the well to wick up onto the
dipstick (i.e D1).
8.12. Air dry dipsticks at room temperature or 37ºC.
8.13. Read dipsticks
9. Data Analysis
9.1 INSTRUMENT-BASED (IMMUNOCHROMATO-READER)
Insert the dipstick (nitrocellulose first) into the housing located inside
the reader’s holder tray. The immunochromato reader will give an
absorbance intensity number based on the intensity of the colored
line. Average the duplicate standard readings and plot against their
concentrations after subtracting the zero standard reading. Draw the
best smooth curve through these points to construct a standard
curve. A four parameter algorithm (4PL) usually provides the best
fit, though other equations can be examined to see which provides
the most accurate (e.g. linear, semi-log, log/log, 4 parameter
logistic). Read GFP protein concentrations for unknown and control
samples from the standard curve plotted. Samples producing
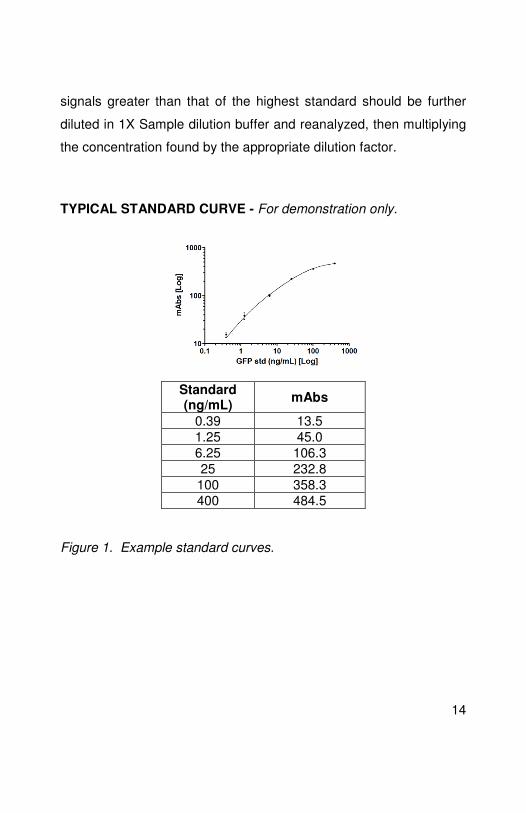
14
signals greater than that of the highest standard should be further
diluted in 1X Sample dilution buffer and reanalyzed, then multiplying
the concentration found by the appropriate dilution factor.
TYPICAL STANDARD CURVE - For demonstration only.
Standard (ng/mL)
mAbs
0.39 13.5
1.25 45.0
6.25 106.3
25 232.8
100 358.3 400 484.5
Figure 1. Example standard curves.

15
TYPICAL SAMPLE RANGE
Sample Range
GFP (pure protein) 0.050 - 400 ng/mL
SENSITIVITY
Calculated minimum detectable dose = 50 pg/mL (zero dose n=8 +2
standard deviations)
LINEARITY OF DILUTION
1 mg/mL Hela spiked with GFP
(ng/mL) % Expected
400 99%
100 80%
25 92%
6.25 112%
1.25 90%
0.39 86%
REPRODUCIBILITY
Parameter %CV
Intra (n= 6) 7.5
Inter (n=3 days) 8.3

16
RECOVERY
Sample Type Average
Recovery % Range
%
Cell Culture Media 164 133 - 200
Figure 2. Example of the recovery with GFP standard spiked into
diluted Hela cell extract.
9.2 INSTRUMENT-FREE, VISUAL READOUT
The calibration curve generated with the standard protein can be
made into a “visual reference card”. The test sample is then
compared against the visual reference card by matching up the
reporter line density of the processed dipstick in the appropriate slot
(See Figure 2). The value (or value range) can then be interpolated
based on the position relative to the antigen levels of the two lines
immediately to the left and to the right. The accuracy of the value
will be inversely proportional to the dilution factor of the calibration
curve.
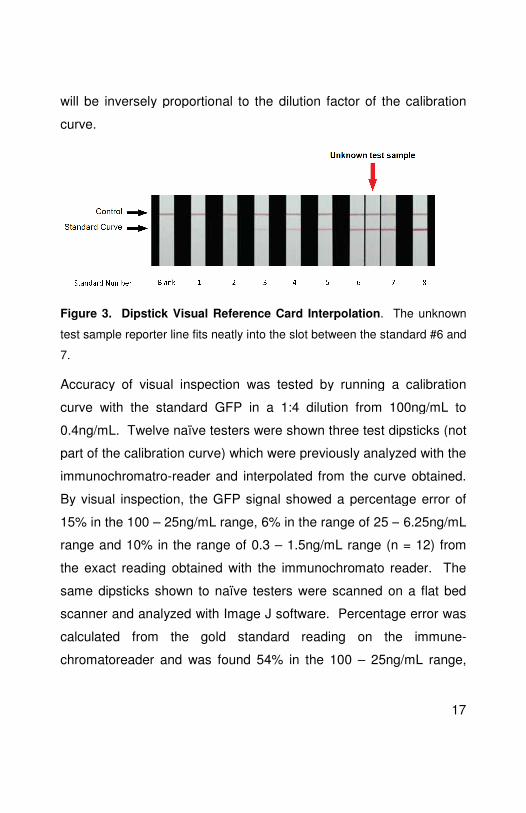
Figure 3. Dipstick Visual Reference Card Interpolation. The unknown
test sample reporter line fits neatly into the slot between the standard #6 and
7.
Accuracy of visual inspection was tested by running a calibration
curve with the standard GFP in a 1:4 dilution from 100ng/mL to
0.4ng/mL. Twelve naïve testers were shown three test dipsticks (not
part of the calibration curve) which were previously analyzed with the
immunochromatro-reader and interpolated from the curve obtained.
By visual inspection, the GFP signal showed a percentage err
15% in the 100 – 25ng/mL range, 6% in the range of 25 –
range and 10% in the range of 0.3 – 1.5ng/mL range (n = 12) from
the exact reading obtained with the immunochromato reader.
same dipsticks shown to naïve testers were scanned on
scanner and analyzed with Image J software. Percentage error was
calculated from the gold standard reading on the immune
chromatoreader and was found 54% in the 100 – 25ng/mL range,
17
will be inversely proportional to the dilution factor of the calibration
. The unknown
test sample reporter line fits neatly into the slot between the standard #6 and
Accuracy of visual inspection was tested by running a calibration
curve with the standard GFP in a 1:4 dilution from 100ng/mL to
Twelve naïve testers were shown three test dipsticks (not
part of the calibration curve) which were previously analyzed with the
reader and interpolated from the curve obtained.
By visual inspection, the GFP signal showed a percentage error of
– 6.25ng/mL
1.5ng/mL range (n = 12) from
the exact reading obtained with the immunochromato reader. The
same dipsticks shown to naïve testers were scanned on a flat bed
. Percentage error was
calculated from the gold standard reading on the immune-
25ng/mL range,

18
22% in the 6.25 – 25ng/mL range and 9% for the 1.5 – 6.25ng/mL
range.
Figure 4. Accuracy of visual
inspection. The X axis shows
the range between the dipsticks
of the calibration curve (graphed
as gray boxes against the Y axis).
The Y axis shows the median
estimated value by 12 naïve
testers. The error shows the 25 –
75 percentiles from the median.
Figure 5. Comparison
between visual inspection
and imaging analysis
method. % Error for each
point is shown on the Y axis.
25 -
100n
g/mL
6.25
- 25
ng/mL
0.39
- 1.
5ng/
mL
0.1
1
10
100
1000
mA
bs [
log
]
0 10 20 30 40 50 60 70 800
20
40
60
80
100Image J
Visual readout
GFP [ng/mL]
% E
rro
r fr
om
Im
mu
no
-c
hro
mato
read
er
ou
tpu
t
19
10. Specificity
This kit is reactive with Aequorea victoria GFP but is untested and
may not react with other fluorescent protein variants (RFP, YFP,
CFP, etc). Also note it is possible that improper folding of GFP or
the presence of a fusion partner may prevent GFP binding in this kit.
20
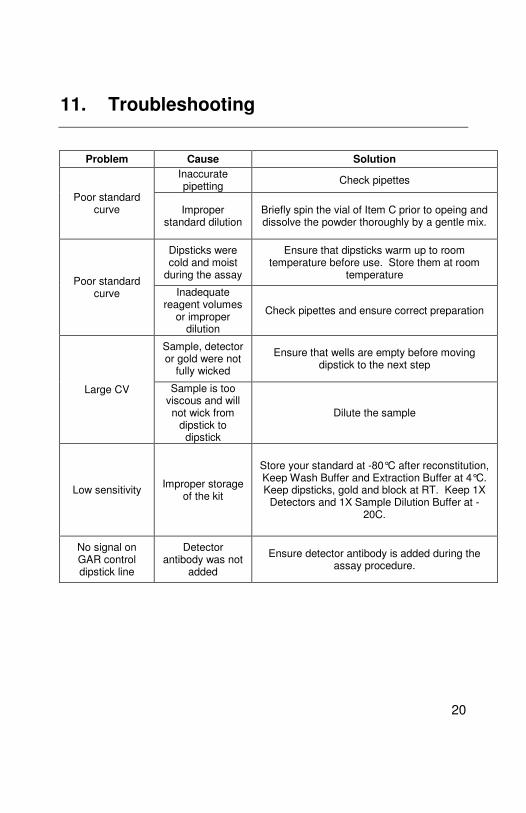
11. Troubleshooting
Problem Cause Solution
Poor standard curve
Inaccurate pipetting
Check pipettes
Improper standard dilution
Briefly spin the vial of Item C prior to opeing and dissolve the powder thoroughly by a gentle mix.
Poor standard curve
Dipsticks were cold and moist
during the assay
Ensure that dipsticks warm up to room temperature before use. Store them at room
temperature
Inadequate reagent volumes
or improper dilution
Check pipettes and ensure correct preparation
Large CV
Sample, detector or gold were not
fully wicked
Ensure that wells are empty before moving dipstick to the next step
Sample is too viscous and will not wick from
dipstick to dipstick
Dilute the sample
Low sensitivity Improper storage
of the kit
Store your standard at -80°C after reconstitution, Keep Wash Buffer and Extraction Buffer at 4°C. Keep dipsticks, gold and block at RT. Keep 1X
Detectors and 1X Sample Dilution Buffer at -20C.
No signal on GAR control dipstick line
Detector antibody was not
added
Ensure detector antibody is added during the assay procedure.

21

22

23
UK, EU and ROW Email: [email protected] Tel: +44 (0)1223 696000 www.abcam.com US, Canada and Latin America Email: [email protected] Tel: 888-77-ABCAM (22226) www.abcam.com China and Asia Pacific Email: [email protected]
Tel: 108008523689 (中國聯通)
www.abcam.cn Japan Email: [email protected] Tel: +81-(0)3-6231-0940 www.abcam.co.jp
Copyright © 2012 Abcam, All Rights Reserved. The Abcam logo is a registered trademark.
All information / detail is correct at time of going to print.