aalto- equalization techniques for dd headphone listening
TRANSCRIPT

9HSTFMG*afihii+
ISBN 978-952-60-5878-8 ISBN 978-952-60-5879-5 (pdf) ISSN-L 1799-4934 ISSN 1799-4934 ISSN 1799-4942 (pdf) Aalto University School of Electrical Engineering Department of Signal Processing and Acoustics www.aalto.fi
BUSINESS + ECONOMY ART + DESIGN + ARCHITECTURE SCIENCE + TECHNOLOGY CROSSOVER DOCTORAL DISSERTATIONS
Aalto-D
D 147
/2014
Jussi Räm
ö E
qualization Techniques for H
eadphone Listening
Aalto
Unive
rsity
Department of Signal Processing and Acoustics
Equalization Techniques for Headphone Listening
Jussi Rämö
DOCTORAL DISSERTATIONS

Aalto University publication series DOCTORAL DISSERTATIONS 147/2014
Equalization Techniques for Headphone Listening
Jussi Rämö
A doctoral dissertation completed for the degree of Doctor of Science (Technology) to be defended, with the permission of the Aalto University School of Electrical Engineering, at a public examination held at the lecture hall S1 of the school on 31 October 2014 at 12.
Aalto University School of Electrical Engineering Department of Signal Processing and Acoustics
Supervising professor Prof. Vesa Välimäki Thesis advisor Prof. Vesa Välimäki Preliminary examiners Dr. Aki Härmä, Philips Research, The Netherlands Dr. Joshua D. Reiss, Queen Mary University of London, UK Opponent Dr. Sean Olive, Harman International, USA
Aalto University publication series DOCTORAL DISSERTATIONS 147/2014 © Jussi Rämö ISBN 978-952-60-5878-8 ISBN 978-952-60-5879-5 (pdf) ISSN-L 1799-4934 ISSN 1799-4934 (printed) ISSN 1799-4942 (pdf) http://urn.fi/URN:ISBN:978-952-60-5879-5 Unigrafia Oy Helsinki 2014 Finland

Abstract Aalto University, P.O. Box 11000, FI-00076 Aalto www.aalto.fi
Author Jussi Rämö Name of the doctoral dissertation Equalization Techniques for Headphone Listening Publisher School of Electrical Engineering Unit Department of Signal Processing and Acoustics
Series Aalto University publication series DOCTORAL DISSERTATIONS 147/2014
Field of research Acoustics and Audio Signal Processing
Manuscript submitted 13 February 2014 Date of the defence 31 October 2014
Permission to publish granted (date) 6 August 2014 Language English
Monograph Article dissertation (summary + original articles)
Abstract The popularity of headphones has increased rapidly along with digital music and mobile
phones. The environment in which headphones are used has also changed quite dramatically from silent to noisy, since people are increasingly using their headphones while commuting and traveling. Ambient noise affects the quality of the perceived music as well as compels people to listen to the music with higher volume levels.
This dissertation explores headphone listening in the presence of ambient sounds. The ambient sounds can be either noise or informative sounds, such as speech. The first portion of this work addresses the first case, where the ambient sounds are undesirable noise that deteriorates the headphone listening experience. The second portion tackles the latter case, in which the ambient sounds are actually informative sounds that the user wants to hear while wearing headphones, such as in an augmented reality system. Regardless of the nature of the ambient sounds, the listening experience can be enhanced with the help of equalization.
This work presents a virtual listening test environment for evaluating headphones in the presence of ambient noise. The simulation of headphones is implemented using digital filters, which enables arbitrary music and noise test signals in the listening test. The disturbing effect of ambient noise is examined with the help of a simulator utilizing an auditory masking model to simulate the timbre changes in music. Another study utilizes the same principles and introduces an adaptive equalizer for mitigation of the masking phenomenon. This psycho- acoustic audio processing system was shown to retain reasonably low sound pressure levels while boosting the music, which is highly important from the viewpoint of hearing protection.
Furthermore, two novel hear-through systems are proposed, the first of which is a digital augmented reality headset substituting and improving a previous analog system. The second system is intended to be worn during loud concerts as a user-controllable hearing protector and mixer. The main problem in both of the systems is the risk of a comb filtering effect, which can deteriorate the sound quality. However, it is shown that the comb filtering effect is not detrimental due to the passive isolation of an in-ear headset.
Finally, an optimization algorithm for high-order graphic equalizer is developed, which optimizes the order of adjacent band filters to reduce ripple around the filter transition bands. Furthermore, a novel high-precision graphic equalizer is introduced based on parallel second- order sections. The novel equalization techniques are intended for use not only in headphone applications, but also in wide range of other audio signal processing applications, which require highly selective equalizers.
Keywords Acoustic signal processing, audio systems, augmented reality, digital filters, psychoacoustics
ISBN (printed) 978-952-60-5878-8 ISBN (pdf) 978-952-60-5879-5
ISSN-L 1799-4934 ISSN (printed) 1799-4934 ISSN (pdf) 1799-4942
Location of publisher Helsinki Location of printing Helsinki Year 2014
Pages 151 urn http://urn.fi/URN:ISBN:978-952-60-5879-5

Tiivistelmä Aalto-yliopisto, PL 11000, 00076 Aalto www.aalto.fi
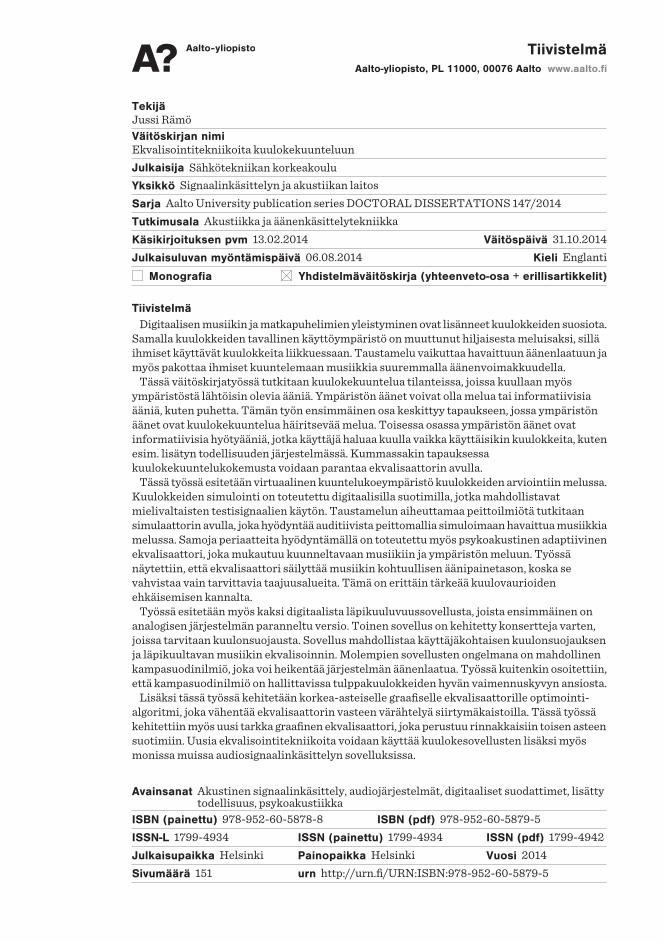
Tekijä Jussi Rämö Väitöskirjan nimi Ekvalisointitekniikoita kuulokekuunteluun Julkaisija Sähkötekniikan korkeakoulu Yksikkö Signaalinkäsittelyn ja akustiikan laitos
Sarja Aalto University publication series DOCTORAL DISSERTATIONS 147/2014
Tutkimusala Akustiikka ja äänenkäsittelytekniikka
Käsikirjoituksen pvm 13.02.2014 Väitöspäivä 31.10.2014
Julkaisuluvan myöntämispäivä 06.08.2014 Kieli Englanti
Monografia Yhdistelmäväitöskirja (yhteenveto-osa + erillisartikkelit)
Tiivistelmä Digitaalisen musiikin ja matkapuhelimien yleistyminen ovat lisänneet kuulokkeiden suosiota.
Samalla kuulokkeiden tavallinen käyttöympäristö on muuttunut hiljaisesta meluisaksi, sillä ihmiset käyttävät kuulokkeita liikkuessaan. Taustamelu vaikuttaa havaittuun äänenlaatuun ja myös pakottaa ihmiset kuuntelemaan musiikkia suuremmalla äänenvoimakkuudella.
Tässä väitöskirjatyössä tutkitaan kuulokekuuntelua tilanteissa, joissa kuullaan myös ympäristöstä lähtöisin olevia ääniä. Ympäristön äänet voivat olla melua tai informatiivisia ääniä, kuten puhetta. Tämän työn ensimmäinen osa keskittyy tapaukseen, jossa ympäristön äänet ovat kuulokekuuntelua häiritsevää melua. Toisessa osassa ympäristön äänet ovat informatiivisia hyötyääniä, jotka käyttäjä haluaa kuulla vaikka käyttäisikin kuulokkeita, kuten esim. lisätyn todellisuuden järjestelmässä. Kummassakin tapauksessa kuulokekuuntelukokemusta voidaan parantaa ekvalisaattorin avulla.
Tässä työssä esitetään virtuaalinen kuuntelukoeympäristö kuulokkeiden arviointiin melussa. Kuulokkeiden simulointi on toteutettu digitaalisilla suotimilla, jotka mahdollistavat mielivaltaisten testisignaalien käytön. Taustamelun aiheuttamaa peittoilmiötä tutkitaan simulaattorin avulla, joka hyödyntää auditiivista peittomallia simuloimaan havaittua musiikkia melussa. Samoja periaatteita hyödyntämällä on toteutettu myös psykoakustinen adaptiivinen ekvalisaattori, joka mukautuu kuunneltavaan musiikiin ja ympäristön meluun. Työssä näytettiin, että ekvalisaattori säilyttää musiikin kohtuullisen äänipainetason, koska se vahvistaa vain tarvittavia taajuusalueita. Tämä on erittäin tärkeää kuulovaurioiden ehkäisemisen kannalta.
Työssä esitetään myös kaksi digitaalista läpikuuluvuussovellusta, joista ensimmäinen on analogisen järjestelmän paranneltu versio. Toinen sovellus on kehitetty konsertteja varten, joissa tarvitaan kuulonsuojausta. Sovellus mahdollistaa käyttäjäkohtaisen kuulonsuojauksen ja läpikuultavan musiikin ekvalisoinnin. Molempien sovellusten ongelmana on mahdollinen kampasuodinilmiö, joka voi heikentää järjestelmän äänenlaatua. Työssä kuitenkin osoitettiin, että kampasuodinilmiö on hallittavissa tulppakuulokkeiden hyvän vaimennuskyvyn ansiosta.
Lisäksi tässä työssä kehitetään korkea-asteiselle graafiselle ekvalisaattorille optimointi-algoritmi, joka vähentää ekvalisaattorin vasteen värähtelyä siirtymäkaistoilla. Tässä työssä kehitettiin myös uusi tarkka graafinen ekvalisaattori, joka perustuu rinnakkaisiin toisen asteen suotimiin. Uusia ekvalisointitekniikoita voidaan käyttää kuulokesovellusten lisäksi myös monissa muissa audiosignaalinkäsittelyn sovelluksissa.
Avainsanat Akustinen signaalinkäsittely, audiojärjestelmät, digitaaliset suodattimet, lisätty todellisuus, psykoakustiikka
ISBN (painettu) 978-952-60-5878-8 ISBN (pdf) 978-952-60-5879-5
ISSN-L 1799-4934 ISSN (painettu) 1799-4934 ISSN (pdf) 1799-4942
Julkaisupaikka Helsinki Painopaikka Helsinki Vuosi 2014
Sivumäärä 151 urn http://urn.fi/URN:ISBN:978-952-60-5879-5

Preface
The work presented in this dissertation was carried out at the Depart-
ment of Signal Processing and Acoustics at Aalto University School of
Electrical Engineering in Espoo, Finland, during the period of September
2009 and October 2014. During this period, I have been lucky to have had
the chance to be involved in various projects with Nokia Gear and Nokia
Research Center. Without these great projects the writing of this thesis
would not have been possible.
I want to express my deepest gratitude to my supervisor Prof. Vesa
Välimäki for all the guidance and support during the writing of this dis-
sertation. Your guidance has been inspiring and invaluable. I am also ex-
tremely grateful to my first supervisor Prof. Matti Karjalainen who origi-
nally believed in me and gave me the chance to work in the acoustics lab
back in 2008.
I wish to thank my co-authors Dr. Miikka Tikander, Mr. Mikko Alanko,
and Prof. Balázs Bank, for all your contributions. We managed to do
pretty cool stuff together. I would also like to thank all the people from
Nokia, with whom I have had the chance to work with during the projects.
I also want to thank Luis Costa for proof-reading my work and constantly
helping me to improve my writing skills.
I would like to thank my pre-examiners Dr. Joshua D. Reiss and Dr. Aki
Härmä, whose comments were valuable in further improving this disser-
tation. Thank you also to Dr. Sean Olive for agreeing to act as my oppo-
nent.
As many have said before, the working environment in the acoustics lab
is absolutely top-notch and I have had the pleasure to work with fan-
tastic colleagues in the lab over the years. I would like to thank my
co-workers: Sami, Julian, Heidi-Maria, Rafael, Stefano, Hannu, Jussi,
Antti, Henkka, Pasi, Ole, Rémi, Jari, Jyri, Heikki T., Fabian, Atakan,
1

Preface
Ville, Magge, Mikkis, Javier, Tapani, Olli, Marko, Ilkka, Tuomo, Teemu,
Okko, Henna, Symeon, Archontis, Julia, Sofoklis, and all the other former
and present people at the acoustics lab I have met during these years.
Of course, I also need to thank all my friends outside the university who
have helped me to maintain the balance between work and free-time.
I am deeply grateful to my parents Arto Rämö and Heli Salmi for al-
ways believing and supporting me and showing pride in the things I do.
I cannot thank you enough for that. Your support has been and still is
extremely important to me. Finally, I would like to say special thanks to
my girlfriend Minna for all the support and love you have shown me over
the years.
Espoo, September 18, 2014,
Jussi Rämö
2
Contents
Preface 1
Contents 3
List of Publications 5
Author’s Contribution 7
List of Symbols 9
List of Abbreviations 11
1. Introduction 13
2. Headset Acoustics and Measurements 17
2.1 Headphone Types . . . . . . . . . . . . . . . . . . . . . . . . . 17
2.2 Headset Acoustics . . . . . . . . . . . . . . . . . . . . . . . . . 18
2.3 Ear Canal Simulators . . . . . . . . . . . . . . . . . . . . . . . 20
2.4 Frequency Response Measurements . . . . . . . . . . . . . . 22
2.5 Headphone Equalization . . . . . . . . . . . . . . . . . . . . . 24
2.6 Ambient Noise Isolation . . . . . . . . . . . . . . . . . . . . . 25
2.7 Occlusion Effect . . . . . . . . . . . . . . . . . . . . . . . . . . 27
3. Augmented Reality Audio and Hear-Through Systems 29
3.1 Active Hearing Protection . . . . . . . . . . . . . . . . . . . . 29
3.2 Augmented Reality Audio . . . . . . . . . . . . . . . . . . . . 30
3.2.1 ARA Applications . . . . . . . . . . . . . . . . . . . . . 31
3.3 Comb-Filtering Effect . . . . . . . . . . . . . . . . . . . . . . . 32
4. Auditory Masking 35
4.1 Critical Bands . . . . . . . . . . . . . . . . . . . . . . . . . . . 35
4.2 Estimation of Masking Threshold . . . . . . . . . . . . . . . . 36
3

Contents
4.3 Partial Masking . . . . . . . . . . . . . . . . . . . . . . . . . . 38
5. Digital Equalizers 39
5.1 Equalizers . . . . . . . . . . . . . . . . . . . . . . . . . . . . . 39
5.2 Parametric Equalizer Design . . . . . . . . . . . . . . . . . . 41
5.3 High-Order Graphic Equalizer Design . . . . . . . . . . . . . 42
5.4 Parallel Equalizer Design . . . . . . . . . . . . . . . . . . . . 44
5.5 Comparison of the Graphic Equalizers . . . . . . . . . . . . . 46
6. Summary of Publications and Main Results 49
7. Conclusions 53
Bibliography 57
Errata 69
Publications 71
4

List of Publications
This thesis consists of an overview and of the following publications which
are referred to in the text by their Roman numerals.
I J. Rämö and V. Välimäki. Signal Processing Framework for Virtual
Headphone Listening Tests in a Noisy Environment. In Proc. AES 132th
Convention, 6 pages, Budapest, Hungary, April 2012.
II J. Rämö, V. Välimäki, M. Alanko, and M. Tikander. Perceptual Fre-
quency Response Simulator for Music in Noisy Environments. In Proc.
AES 45th Int. Conf., 10 pages, Helsinki, Finland, March 2012.
III J. Rämö, V. Välimäki, and M. Tikander. Perceptual Headphone Equal-
ization for Mitigation of Ambient Noise. In Proc. Int. Conf. Acoustics,
Speech, and Signal Processing, pp. 724–728, Vancouver, Canada, May
2013.
IV J. Rämö and V. Välimäki. Digital Augmented Reality Audio Headset.
Journal of Electrical and Computer Engineering, Vol. 2012, Article ID
457374, 13 pages, September 2012.
V J. Rämö, V. Välimäki, and M. Tikander. Live Sound Equalization and
Attenuation with a Headset. In Proc. AES 51st Int. Conf., 8 pages,
Helsinki, Finland, August 2013.
VI J. Rämö and V. Välimäki. Optimizing a High-Order Graphic Equalizer
for Audio Processing. IEEE Signal Processing Letters, Vol. 21, No. 3,
pp. 301–305, March 2014.
5

List of Publications
VII J. Rämö, V. Välimäki, and B. Bank. High-Precision Parallel Graphic
Equalizer. IEEE/ACM Transactions on Audio, Speech and Language
Processing, Vol. 22, No. 12, pp. 1894–1904, December 2014.
6

Author’s Contribution
Publication I: “Signal Processing Framework for Virtual HeadphoneListening Tests in a Noisy Environment”
The author collaborated in the development of the filter design algorithms.
He made the measurements and implemented the whole system by him-
self. He also wrote and presented the entire work.
Publication II: “Perceptual Frequency Response Simulator for Musicin Noisy Environments”
The author conducted the measurements, listening tests, and implemen-
tation of the perceptual frequency response simulator in collaboration
with the co-authors. Furthermore, the author wrote the article and pre-
sented it at the conference.
Publication III: “Perceptual Headphone Equalization for Mitigation ofAmbient Noise”
The author collaborated in the algorithm development. He implemented
the signal processing algorithms for the perceptual headphone equalizer.
Furthermore, the author wrote and presented the entire paper.
Publication IV: “Digital Augmented Reality Audio Headset”
The author collaborated in the signal processing algorithm development.
He implemented and wrote the work in its entirety except for the writing
of abstract and conclusions.
7
Author’s Contribution
Publication V: “Live Sound Equalization and Attenuation with aHeadset”
The author designed the system in collaboration with the co-authors, based
on the original idea of the second author. The author programmed the
Matlab simulator as well as the real-time demonstrator. Furthermore,
the author wrote the article and presented it at the conference.
Publication VI: “Optimizing a High-Order Graphic Equalizer forAudio Processing”
The author discovered, designed, and implemented the optimization algo-
rithm and was the main author of the paper.
Publication VII: “High-Precision Parallel Graphic Equalizer”
The author was responsible for coordinating and editing the work based
on the idea of the co-authors. The author wrote the abstract and Sections
I, IV, and V. He also collaborated in the algorithm design and implemented
most of the new Matlab codes and examples as well as provided all the
figures and tables included in the paper.
8

List of Symbols
A(z) transfer function of an allpass filter
a frequency parameter of the Regalia-Mitra filter
ac frequency parameter of the Regalia-Mitra filter for cut cases
ak,1, ak,2 denominator coefficients of the parallel equalizer
b allpass coefficient of the Regalia-Mitra filter
bk,0, bk,1 numerator coefficients of the parallel equalizer
B two-slope spreading function
c speed of sound
f frequency in Hertz
fr,open first quarter-wavelength resonance of an open ear canal
fr,closed first quarter-wavelength resonance of a closed ear canal
gd gain of direct sound
geq gain of equalized sound
h(t) impulse response of a system
H(z) transfer function of a system
K gain of the Regalia-Mitra filter
L delay in samples
LM sound pressure level of a masker
l length of the ear canal
leff effective length of the ear canal
P number of filter sections
r average radius of the ear canal
U masking energy offset
x(t) input signal (sine sweep)
y(t) output signal (recorded sine sweep)
ν frequency in Bark units
Ω normalized filter bandwidth of the Regalia-Mitra filter
ω0 normalized center frequency of the Regalia-Mitra filter
9

List of Symbols
10
List of Abbreviations
ANC active noise control
ARA augmented reality audio
CPU central processing unit
DRP drum reference point
FIR finite impulse response
FFT fast Fourier transform
GPS Global Positioning System
GPU graphics processing unit
HRTF head-related transfer function
IEC International Electrotechnical Commission
IFFT inverse fast Fourier transform
IIR infinite impulse response
ISO International Organization for Standardization
ITU-T International Telecommunication Union,
Telecommunication Standardization Sector
LPC linear prediction coefficients
NIHL noise-induced hearing loss
PGE parallel graphic equalizer
SPL sound pressure level
11

List of Abbreviations
12

1. Introduction
Nowadays many people listen to music through headphones mostly in
noisy environments due to the widespread use of portable music players,
mobile phones, and smartphones. Gartner Inc. reported that worldwide
mobile phone sales to end users totaled 1.75 billion units in 2012, while
the fourth quarter of 2012 realized a record in smartphone sales totaling
over 207 million units, which was more than a 38 percent increase from
the same quarter of 2011 [1]. However, already in the third quarter of
2013, smartphones sales reached over 250 million units, and the forecast
of global mobile phone sales in 2013 is 1.81 billion units [2]. Almost all
mobile phones, including low-priced budged phones, are capable of play-
ing music and typically come with a stereo headset, which can also be
used as a hands-free device (see Figure 1.1). Thus, basically everybody
who owns a mobile phone is a potential headphone user.
Due to the mobile nature of today’s headphone usage, the listening en-
vironments have also changed quite dramatically from quiet homes and
offices to noisy streets and public transportation vehicles. The increased
ambient noise of the mobile listening environments introduces a problem,
since the noise masks the music by reducing its perceived loudness or by
(a) (b) (c)
Figure 1.1. Different mobile headsets, where (a) shows a smartphone and an in-ear head-set, (b) shows a button-type headset, and (c) shows an on-the-ear headset.
13

Introduction
masking parts of the music completely. This often leads to increased noise
exposure levels, since people try to compensate the masking of the music
by turning up the volume, which can increase the risk of hearing impair-
ment. First, people should use suitable headphones that isolate ambient
sounds well, and secondly, the ‘unmasking’ of the music signal should be
done in a way that the level of the music is increased as little as possible.
Additionally, now that people increasingly use their headphones, it is
necessary to have a hear-through function in the headphones so that com-
munication is easy and enjoyable even without removing the headphones.
This requires built-in microphones and an equalizer to compensate for the
changes that the headphones introduce to our outer ear acoustics. The
ideal hear-through function, which is also the basis in augmented reality
audio (ARA) [3], is to have completely transparent headphones that do
not alter the timbre of the incoming sounds at all.
This work considers how we can devise and assess improved signal pro-
cessing approaches that enhance the experience of listening over head-
phones, including how to implement a psychoacoustically reasonable equal-
izer for headphones, especially for noisy environments, and how to further
immerse headphone usage to be a part of our everyday lives. Thus, the
main objectives of this dissertation are to
1. provide means to demonstrate the sound quality of different headphones
especially in noisy environments,
2. enhance the mobile headphone listening experience using digital signal
processing,
3. improve the precision of graphic equalizers, and
4. develop novel digital methods for hear-through systems.
Objective 1 provides essential results that helps us to understand and
experience how different types of headphones behave in a noisy environ-
ment. After understanding the principles of objective 1, it possible to de-
vise novel signal processing methods, as defined in objective 2, which will
enhance the headphone listening experience, e.g., by adaptively equaliz-
ing the music according to ambient noise. In order to equalize the music
to mitigate the masking caused by ambient noise, it is necessary to satisfy
14

Introduction
objective 3 and to design an equalizer with frequency selectivity similar
to that of a human ear. Finally, to include headphones more into our ev-
eryday lives, the headphones should have a hear-through function that
allows us to wear the headphones during conversations and to use them
with augmented reality audio applications.
The contents of this dissertation consist of this overview part accom-
panied by seven peer-reviewed publications, from which three have been
published in international journals and four in international conferences.
These publications tackle the research questions aiming to satisfy the ob-
jectives. Publications I, II, and III tackle the first objective by explor-
ing headphone listening in noisy environments. Publication I introduces
a test environment for virtual headphone listening tests, which also en-
ables the evaluation of headphones in the presence of virtual ambient
noise, whereas Publication II presents a perceptual frequency response
simulator, which simulates the effect of the auditory masking caused by
the ambient noise.
Objective 2 is addressed especially in Publication III, which introduces
an intelligent adaptive equalizer that is based on psychoacoustic models.
However, the groundwork for Publication III is done in Publications I, II,
and VI. Objective 3 is covered in Publications VI and VII, which present
an optimizing algorithm for a high-order graphic equalizer and a novel
high-precision graphic equalizer implemented with a parallel filter struc-
ture, respectively. The final objective is addressed in Publications IV and
V, where digital hear-through systems are developed and evaluated.
This overview part of this dissertation is organized as follows. Section 2
discusses headset acoustics and their measurement techniques, including
ear canal simulators as well as magnitude frequency response and am-
bient noise isolation measurements. Section 3 introduces hear-through
systems along with the concept and applications of augmented reality au-
dio. Section 4 examines the auditory masking phenomenon, including the
concepts of masking threshold and partial masking. Section 5 introduces
digital equalizers, giving also three examples of digital equalizer filters
used during this work. Section 6 summarizes the publications and their
main results, and Section 7 concludes this overview part.
15

Introduction
16

2. Headset Acoustics andMeasurements
This section introduces basic headset acoustics and their measurement
techniques. The focus is on in-ear headphones, since they are increas-
ingly used in mobile music listening and in hands-free devices. Further-
more, in-ear headphones provide the tightest fit of all headphones, which
leads to excellent ambient noise isolation, but at the same time introduces
problems, such as unnatural ear canal resonances and the occlusion effect,
due to the tightly blocked ear canal. The emphasis on the measurement
techniques is on the frequency response and ambient noise isolation mea-
surements, since they greatly affect the perceived sound quality in noisy
environments.
Section 2.1 provides a brief introduction to different headphone types
and Section 2.2 introduces the basics of headphone acoustics, providing
background information for Publications I through V. Section 2.3 de-
scribes the history and current status of ear canal simulators that are
used in headphone measurements, related to Publications I–V. Sections
2.4 and 2.6 recapitulate frequency response and ambient noise isolation
measurement procedures. Section 2.7 discusses the occlusion effect, which
can easily degrade the user experience of an in-ear headset (Publications
IV and V).
2.1 Headphone Types
There are many different types of headphones, which all have their pros
and cons in divergent listening environments. Furthermore, different ap-
plications set distinct requirements for headphones, such as size, ambient
noise isolation, sound quality, and even cosmetic properties. ITU Telecom-
munication Standardization Sector (ITU-T) categorizes headphones into
four groups: circum-aural, supra-aural, intra-concha, and in-ear/insert
17
Headset Acoustics and Measurements
(b) (a) (c) (d)
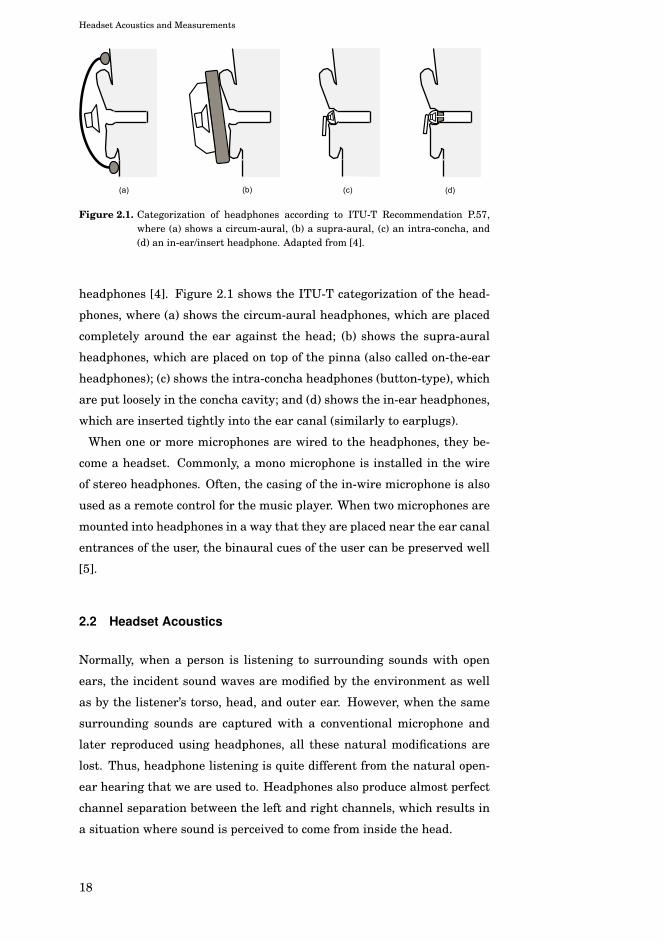
Figure 2.1. Categorization of headphones according to ITU-T Recommendation P.57,where (a) shows a circum-aural, (b) a supra-aural, (c) an intra-concha, and(d) an in-ear/insert headphone. Adapted from [4].
headphones [4]. Figure 2.1 shows the ITU-T categorization of the head-
phones, where (a) shows the circum-aural headphones, which are placed
completely around the ear against the head; (b) shows the supra-aural
headphones, which are placed on top of the pinna (also called on-the-ear
headphones); (c) shows the intra-concha headphones (button-type), which
are put loosely in the concha cavity; and (d) shows the in-ear headphones,
which are inserted tightly into the ear canal (similarly to earplugs).
When one or more microphones are wired to the headphones, they be-
come a headset. Commonly, a mono microphone is installed in the wire
of stereo headphones. Often, the casing of the in-wire microphone is also
used as a remote control for the music player. When two microphones are
mounted into headphones in a way that they are placed near the ear canal
entrances of the user, the binaural cues of the user can be preserved well
[5].
2.2 Headset Acoustics
Normally, when a person is listening to surrounding sounds with open
ears, the incident sound waves are modified by the environment as well
as by the listener’s torso, head, and outer ear. However, when the same
surrounding sounds are captured with a conventional microphone and
later reproduced using headphones, all these natural modifications are
lost. Thus, headphone listening is quite different from the natural open-
ear hearing that we are used to. Headphones also produce almost perfect
channel separation between the left and right channels, which results in
a situation where sound is perceived to come from inside the head.
18
Headset Acoustics and Measurements
Headphones can alter the acoustics of the open ear canal by blocking
it. This happens especially when using in-ear headphones, which tightly
block the entrance of the ear canal. An open ear canal is basically a tube,
which is open at one end and closed at the other by the ear drum. Thus,
the open ear canal acts as a quarter-wavelength resonator, which has it
first resonance at the frequency
fr,open =c
4leff, (2.1)
where c is the speed of sound and leff is the effective length of the ear
canal. The effective length of the ear canal is slightly longer than the
physical length due to the attached-mass effect [6]. The effective length
of the ear canal (as an open-ended tube) can be estimated as
leff = l + 8r/3π, (2.2)
where r is the average radius and l is the physical length of the ear canal
[6, 7].
An average ear canal has a length of approximately 27 mm and a diame-
ter of about 7 mm [8]. When these measures are used in (2.1) and (2.2), the
effective length leff is 30 mm and the first quarter-wavelength resonance
occurs at the frequency of 2890 Hz, when the speed of sound is 346 m/s
(corresponding to 25◦C). Typically, the first resonance of the human ear
is located around 3 kHz with the maximum boost of approximately 20 dB
[9].
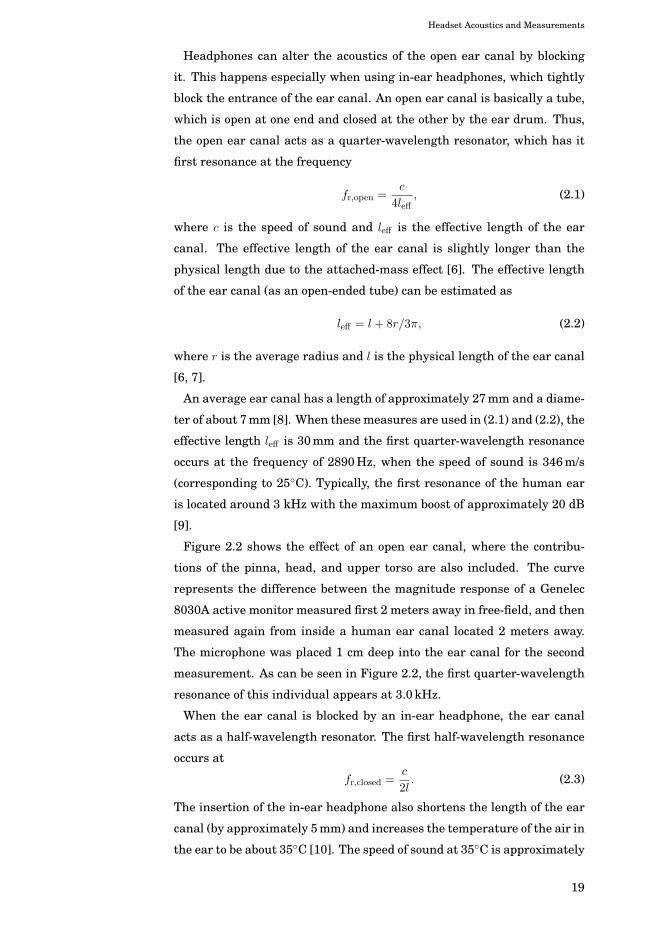
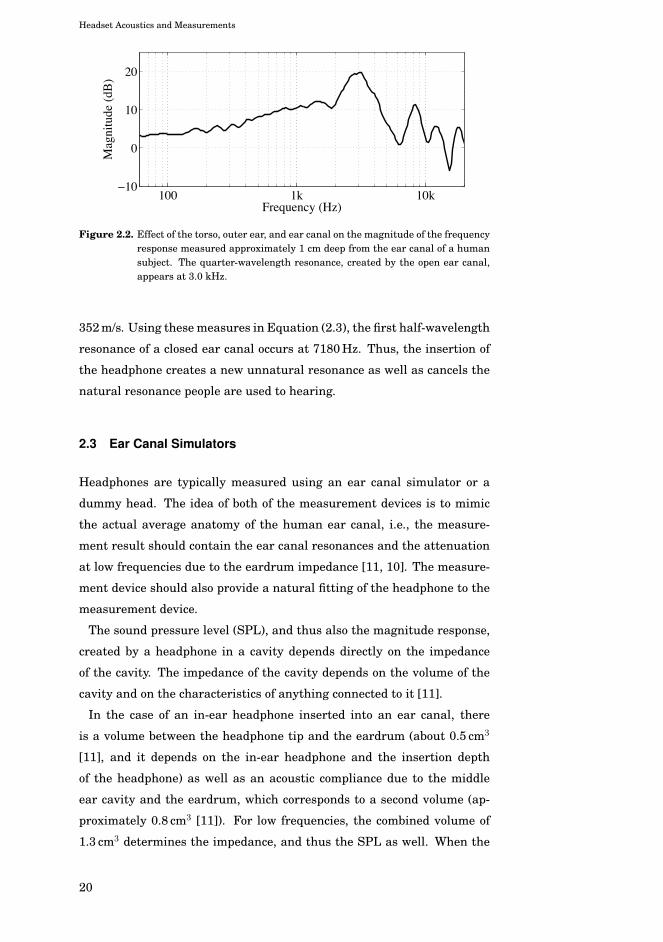
Figure 2.2 shows the effect of an open ear canal, where the contribu-
tions of the pinna, head, and upper torso are also included. The curve
represents the difference between the magnitude response of a Genelec
8030A active monitor measured first 2 meters away in free-field, and then
measured again from inside a human ear canal located 2 meters away.
The microphone was placed 1 cm deep into the ear canal for the second
measurement. As can be seen in Figure 2.2, the first quarter-wavelength
resonance of this individual appears at 3.0 kHz.
When the ear canal is blocked by an in-ear headphone, the ear canal
acts as a half-wavelength resonator. The first half-wavelength resonance
occurs at
fr,closed =c
2l. (2.3)
The insertion of the in-ear headphone also shortens the length of the ear
canal (by approximately 5 mm) and increases the temperature of the air in
the ear to be about 35◦C [10]. The speed of sound at 35◦C is approximately
19
Headset Acoustics and Measurements
100 1k 10k−10
0
10
20
Mag
nitu
de (
dB)
Frequency (Hz)
Figure 2.2. Effect of the torso, outer ear, and ear canal on the magnitude of the frequencyresponse measured approximately 1 cm deep from the ear canal of a humansubject. The quarter-wavelength resonance, created by the open ear canal,appears at 3.0 kHz.
352 m/s. Using these measures in Equation (2.3), the first half-wavelength
resonance of a closed ear canal occurs at 7180 Hz. Thus, the insertion of
the headphone creates a new unnatural resonance as well as cancels the
natural resonance people are used to hearing.
2.3 Ear Canal Simulators
Headphones are typically measured using an ear canal simulator or a
dummy head. The idea of both of the measurement devices is to mimic
the actual average anatomy of the human ear canal, i.e., the measure-
ment result should contain the ear canal resonances and the attenuation
at low frequencies due to the eardrum impedance [11, 10]. The measure-
ment device should also provide a natural fitting of the headphone to the
measurement device.
The sound pressure level (SPL), and thus also the magnitude response,
created by a headphone in a cavity depends directly on the impedance
of the cavity. The impedance of the cavity depends on the volume of the
cavity and on the characteristics of anything connected to it [11].
In the case of an in-ear headphone inserted into an ear canal, there
is a volume between the headphone tip and the eardrum (about 0.5 cm3
[11], and it depends on the in-ear headphone and the insertion depth
of the headphone) as well as an acoustic compliance due to the middle
ear cavity and the eardrum, which corresponds to a second volume (ap-
proximately 0.8 cm3 [11]). For low frequencies, the combined volume of
1.3 cm3 determines the impedance, and thus the SPL as well. When the
20
Headset Acoustics and Measurements
frequency increases, the impedance changes from stiffness-controlled to
mass-controlled as the mass of the eardrum becomes more significant
(around 1.3 kHz) [10]. After that, the impedance corresponds only to that
of the volume between the headphone tip and the eardrum (in this exam-
ple 0.5 cm3), since the mass of the eardrum blocks the impedance of the
middle ear [11, 10]. At higher frequencies, above around 7 kHz, the ear
canal resonances affect the impedance the most [10].
One of the earliest endeavours to build a dummy head, which included a
detailed structure of the pinnae as well as a correct representation of the
ear canal up to the eardrum location, was conducted by Alvar Wilska in
1938 [12]. Wilska was actually a physician, and he had access to a morgue,
where he was able to make a mold of the head of a male corpse. He then
made a gypsum replica of the head with the ear regions formed from gela-
tine. He also built his own microphones (with a membrane diameter of
13 mm) and even installed the microphones at the eardrum location at an
angle, which corresponds to the human anatomy [12].
The first headphone measurement devices were couplers that had a
cylindrical volume and a calibrated microphone [11, 10], which simulated
the acoustical load of an average adult ear. The couplers were mainly
used to measure hearing aids and audiometry headphones. However, the
simple cylindrical volume did not produce satisfactory results, which led
to the development of more ear-like couplers [11, 13].
The pioneer of the modern ear simulator is Joseph Zwislocki, who de-
signed an occluded ear canal simulator, which has a cylindrical cavity
corresponding to the volume of the ear canal, a microphone positioned
at the ear drum location called the drum reference point (DRP) [4], and
a mechanical acoustic network simulating the acoustic impedance of the
ear drum [14].
The acoustic network consists of several small cavities (typically from
two to five), which are all connected to the main cylindrical cavity via a
thin tube [11, 10]. The purpose of these thin tubes and cavities is to simu-
late the effective total volume of the ear, which changes with frequency, as
explained above. As the frequency rises, the impedance of the thin tubes
that connect the small cavities to the main cavity increases, which causes
them to close off, and thus the effective volume of the simulator gradually
falls from 1.3 cm3 to 0.6 cm3, similarly as in the real ear [11].
Sachs and Burkhard [15, 16], Brüel [10], Voss and Allen [17], and Salty-
kov and Gebert [18] have evaluated the performance of the Zwislocki ear
21

Headset Acoustics and Measurements
canal simulator and the previous 2 cm3 headphone couplers (often called
2cc couplers). Their results showed that even though there is a signifi-
cant variability in the magnitude of the impedance for different human
ear canals, the Zwislocki ear simulators produce reasonably accurate re-
sults when compared to real ear measurements, whereas the 2 cm3 cal-
ibration couplers give worse results. Futhermore, Sachs and Burkhard
[15] suggested that better results could be achieved for the 2cc couplers,
if an electronic correction filtering is applied.
Today, the IEC 60318-4 Ed 1.0b:2010 [19] and ANSI S3.25–2009 [20]
standards define the occluded ear simulators that are used to measure
headphones. The occluded ear simulator can be used to measure in-ear
headphones and hearing aids as such, and it can be extended to simulate
the complete ear canal and the outer ear [19, 21, 22]. IEC 60318-4 (2010)
defines the frequency range of the occluded ear canal simulator to be from
100 Hz to 10 kHz, whereas the previous standard IEC 60711, published in
1981, defined an upper frequency limit of 8 kHz. Furthermore, below 100
Hz and above 10 kHz, the simulator can be used as an acoustic coupler
at frequencies down to 20 Hz and up to 16 kHz. However, the occluded
ear simulator does not simulate the human ear accurately in the extended
frequency range.
2.4 Frequency Response Measurements
The frequency response measurement is a good way to study the per-
formance of headphones. The magnitude frequency response shows the
headphones’ ability to reproduce different audible frequencies, which de-
termines the perceived timbral quality of the headphones. A widely used
technique to measure frequency responses is a swept-sine technique. It
has been proposed by Berkhout et al. [23], Griesinger [24, 25], Farina
[26, 27], as well as Müller and Massarani [28]. The swept-sine technique
as well as other measurement techniques are compared by Stan et al. [29].
The basic idea in sweep measurements is to apply a known signal x(t),
which has a sinusoidal shape with exponentially increasing frequency,
through the headphones, which are fitted in an ear canal simulator or
a dummy head, and record the response of the system y(t) at the DRP.
The impulse response of the system h(t) is calculated from the x(t) and
22
Headset Acoustics and Measurements
100 1k 10k−80
−70
−60
−50
−40
−30
−20
Frequency (Hz)
Mag
nitu
de (d
B)
Circum−auralSupra−auralIntra−conchaIn−ear
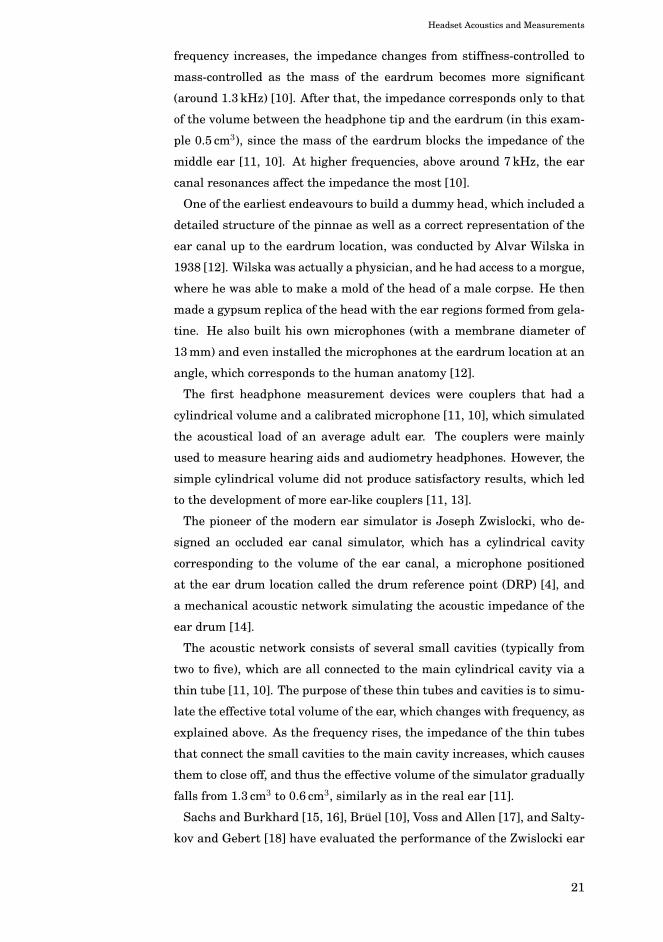
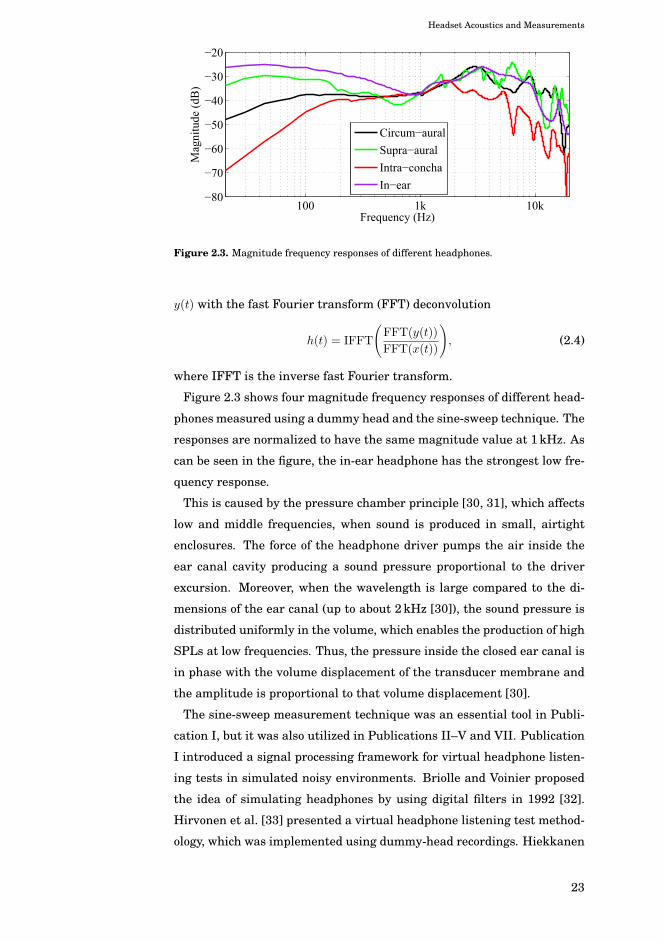
Figure 2.3. Magnitude frequency responses of different headphones.
y(t) with the fast Fourier transform (FFT) deconvolution
h(t) = IFFT
(FFT(y(t))
FFT(x(t))
), (2.4)
where IFFT is the inverse fast Fourier transform.
Figure 2.3 shows four magnitude frequency responses of different head-
phones measured using a dummy head and the sine-sweep technique. The
responses are normalized to have the same magnitude value at 1 kHz. As
can be seen in the figure, the in-ear headphone has the strongest low fre-
quency response.
This is caused by the pressure chamber principle [30, 31], which affects
low and middle frequencies, when sound is produced in small, airtight
enclosures. The force of the headphone driver pumps the air inside the
ear canal cavity producing a sound pressure proportional to the driver
excursion. Moreover, when the wavelength is large compared to the di-
mensions of the ear canal (up to about 2 kHz [30]), the sound pressure is
distributed uniformly in the volume, which enables the production of high
SPLs at low frequencies. Thus, the pressure inside the closed ear canal is
in phase with the volume displacement of the transducer membrane and
the amplitude is proportional to that volume displacement [30].
The sine-sweep measurement technique was an essential tool in Publi-
cation I, but it was also utilized in Publications II–V and VII. Publication
I introduced a signal processing framework for virtual headphone listen-
ing tests in simulated noisy environments. Briolle and Voinier proposed
the idea of simulating headphones by using digital filters in 1992 [32].
Hirvonen et al. [33] presented a virtual headphone listening test method-
ology, which was implemented using dummy-head recordings. Hiekkanen
23
Headset Acoustics and Measurements
et al. [34] have proposed a method to virtually evaluate and compare loud-
speakers using calibrated headphones. Furthermore, a recent publication
by Olive et al. [35] tackles the virtual headphone listening task by us-
ing infinite impulse response (IIR) filters constructed based on headphone
measurements to simulate the headphones.
Similarly as in [35], the main idea in Publication I is to simulate differ-
ent headphones with digital filters, which allows the use of arbitrary mu-
sic, speech, or noise as the source material. Thus, a wide range of impulse
responses of different headphones were measured using the sine-sweep
technique and a standardized head-and-torso simulator. The measured
impulse responses were used as finite impulse response (FIR) filters to
simulate the measured headphones. Furthermore, the ambient noise iso-
lation capabilities of the headphones were also measured and simulated
using FIR filters (see Section 2.6).
2.5 Headphone Equalization
In the simulator of Publication I, all the modeled headphones are listened
to through one pair of calibrated headphones. The pair of headphones
used with the simulator must be compensated so that they introduce as
little timbre coloration to the system as possible. This is done by flattening
or whitening the headphone response.
A typical method to implement the compensation of the headphones
is to use an inverse IIR filter constructed from the magnitude response
measurement of the headphone [33, 35]. Olive et al. [35] used a slightly
smoothed minimum-phase IIR correction filter, which did not apply filter-
ing above 10 kHz. Lorho [36] fitted a smooth curve to the headphone’s
magnitude response to approximate the mean response of his measure-
ments. The fitted curve had a flat low-frequency shape, the most ac-
curate match in the range of 2–4 kHz (around where the first quarter-
wavelength resonance occurs), and a looser fit at high frequencies. Fi-
nally, he designed a linear-phase inverse filter from the smoothed approx-
imation curve.
There can be problems with the inverse filter when the measured mag-
nitude response has deep notches, because they will convert into high
peaks in the inversion. This was the case in [34] and in Publication I of
this work. Hiekkanen et al. [34] first smoothed the measured magnitude
response (with a moving 1/48-octave Hann window) and then inverted
24

Headset Acoustics and Measurements
the smoothed response. They then calculated a reference level based on
the average level of the inverted response (between 40–4000 Hz). After
that, they compressed all the peaks (above 4 kHz) exceeding the reference
level. Finally, they created a minimum-phase impulse response from the
inverted and peak deducted magnitude response.
In Publication I the measured magnitude response of the headphones
was first modeled with linear prediction coefficients (LPC). The LPC tech-
nique results in a minimum-phase all-pole filter, which can easily be in-
verted without any stability issues. A peak reduction (or actually a notch
reduction) technique was also used, and it was implemented by ’filling’
the notch in the measured magnitude response in the frequency domain,
after which the LPC technique was applied to the corrected magnitude
response where the notch was compensated.
2.6 Ambient Noise Isolation
The isolation capabilities of headphones are determined by the physical
structure of the headphones as well as by the coupling of the headphones
to the user’s ears. Circum-aural and supra-aural headphones are typically
coupled tightly against the head and the pinna, respectively. Further-
more, these headphones can have open or closed backs, where the open
back refers to earphone shells with leakage routes intentionally built into
them. Intra-concha headphones usually sit loosely in the concha cavity,
thus providing poor ambient noise isolation for the user. However, in-ear
headphones are used similarly as earplugs, and they are designed to have
good isolation properties.
Figure 2.4 shows the measured isolation curves of four different types of
headphones. In Figure 2.4, zero dB means that there is no attenuation at
all and negative values indicate increasing attenuation. The black curve
illustrates the isolation of open-back circum-aural headphones, the green
curve represents the isolation of closed-back supra-aural headphones, the
red curve shows the isolation of intra-concha headphones, and finally the
purple curve shows the isolation of in-ear headphones. As can be seen,
the in-ear headphones have clearly the best ambient noise isolation ca-
pability of these headphones, while the open-back circum-aural and the
intra-concha headphones have the worst sound isolation, as can be ex-
pected.
The isolation properties of headphones are further explored in Publica-
25

Headset Acoustics and Measurements
100 1k 10k−50
−40
−30
−20
−10
0
10
Frequency (Hz)
Atte
nuat
ion
(dB
)
Circum−auralSupra−auralIntra−conchaIn−ear
Figure 2.4. Measured isolation curves of different headphone types.
tions I–V, where the first three publications estimate and simulate the
amount of ambient noise in the ear canal in a typical music listening and
communication applications and the latter two consider how the leakage
of ambient noise affects the hear-through applications (see Section 3).
The isolation capabilities of headphones can be improved with active
noise control (ANC) [37, 38, 39, 40, 41]. The idea in ANC is to actively
reduce the ambient noise at the ear canal by creating an anti-noise signal,
which has the same sound pressure in magnitude but is opposite in phase
to the noise signal. The utilization of the ANC in headsets dates back
to the 1950s, where Simshauser and Hawley [42] conducted pure-tone
experiments with an ANC headset.
The two basic forms of ANC are feedforward [40] and feedback sys-
tems [41]. The main difference in these systems is the position of the
microphones that are used to capture ambient noise. Adaptive feedfor-
ward ANC uses an external reference microphone outside the headphone
to capture the noise and a microphone inside the headphone to monitor
the error signal. Feedback ANC has only the internal error microphone
that is used to capture the noise and to monitor the error signal. The
feedforward and feedback structures can also be combined to create more
efficient noise attenuation [39, 43].
Figure 2.5 shows the effect of a feedback ANC, measured from a com-
mercial closed-back circum-aural ANC headset. The feedback ANC works
best at low frequencies, while it has a negligible effect at high frequencies.
Furthermore, the feedback ANC typically amplifies the noise at its tran-
sition band, around 1 kHz [39], as shown in Figure 2.5. The transition
band is the frequency band between the low frequencies, where the ANC
26

Headset Acoustics and Measurements
100 1k 10k−50
−40
−30
−20
−10
0
10
Frequency (Hz)A
ttenu
atio
n (d
B)
ANC offANC on
Figure 2.5. Effect of active noise control.
operates efficiently and the high frequencies, where the effect of the ANC
is negligible.
2.7 Occlusion Effect
The occlusion effect refers to a situation where one’s ears are blocked by a
headset or a hearing aid and their own voice sounds loud and hollow. This
effect is due to the bone conducted sounds that are conveyed to the ear
canals [44]. The occlusion effect is experienced as annoying and unnatu-
ral, since the natural perception of one’s own voice is essential to normal
communication [45]. With music listening this is rarely a problem, since
the user rarely talks while listening to music. However, with ARA appli-
cations and hearing aids, the occlusion effect can be a real nuisance.
Normally, when the ear canal is not blocked, the bone-conducted sounds
can escape through the ear canal opening into the environment outside
the ear and no extra sound pressure is generated in the ear canal [30, 46],
as illustrated in Figure 2.6(a). This is the normal situation that people
are used to hear. However, when the entrance of the ear canal is blocked,
the perceived sound of one’s own voice is changed [45]. This is because
the bone-conducted sounds that are now shut in the ear canal obey the
pressure chamber principle, as discussed in Section 2.4. This amplifies
the perception of the bone-conducted sounds when compared to the open
ear case [30, 11, 47, 48, 46], as illustrated in Figure 2.6(b). In addition
to the bone-conducted sounds, the air-conducted sounds are attenuated
when the the ear canal is occluded, which further accentuates the dis-
torted perception of one’s own voice [45].
27

Headset Acoustics and Measurements
Bone conducted sound
Bone conducted sound
p p
(b) (a)
Figure 2.6. Occlusion effect. Diagram (a) illustrates the open ear, where the bone con-ducted sound radiates through the ear canal opening and (b) illustrates theoccluded ear, where the bone conducted sound is amplified inside the earcanal. Adapted from [30].
The occlusion effect can be passively reduced by introducing vents in
the headset casing. However, the vents decrease the ambient noise isola-
tion of the headset, which is usually undesirable. Furthermore, the vents
increase the risk of acoustic feedback when the headset microphone is
placed near the earpiece. The occlusion effect can also be reduced actively,
which typically uses the active feedback cancellation method similarly as
a feedback ANC. That is, there is an internal microphone inside the ear
canal connected to the signal chain with a feedback loop [49]. According
to Meija et al. [49], active occlusion reduction can provide 15 dB of occlu-
sion reduction around 300 Hz, which results in a more natural perception
of one’s own voice and therefore increases the comfort of using a headset.
Furthermore, active occlusion reduction does not deteriorate the ambient
noise isolation capability of a headset, since no additional vents or leakage
paths are needed.
28

3. Augmented Reality Audio andHear-Through Systems
This section presents the concept of ARA as well as touches on the subject
of active hearing protection. According to the World Health Organization
[50], more than 360 million people have disabling hearing loss. The num-
ber is so large that the current production is less than 10 % of the global
need.
It is extremely important to protect one’s hearing, and not only from loud
environmental noises, but also from loud music listening, which can cause
hearing loss as well. Furthermore, it is widely accepted that temporary
hearing impairments can lead to accumulated cellular damage, which can
cause permanent hearing loss [51]. This section provides background in-
formation for Publications III, IV and V.
3.1 Active Hearing Protection
Noise-induced hearing loss (NIHL) occurs when we are exposed to very
loud sounds (over 100 dB) or sounds that are loud (over 85 dB) for a long
period of time. NIHL can be roughly divided into two categories, namely
work-related and self-imposed NIHLs. The first one can be controlled with
regulations, which, e.g., enforce employees to wear hearing protection in
loud working environments. However, laws or regulations cannot prevent
self-imposed NIHL, such as that caused by listening to loud music or live
concerts.
People’s listening habits when using headphones have been studied, e.g.,
in [52, 53], where the highest user-set music levels reached over 100 dB
in the presence of background noise [52]. Studies conducted during live
music concerts [54, 55] indicate that the A-weighted exposure levels can
exceed 100 dB during a concert. Furthermore, Clark et al. [54] discov-
ered that five of the six subjects had significant hearing threshold shifts
29

Augmented Reality Audio and Hear-Through Systems
(< 50 dB) mainly around the 4-kHz region after a rock concert. The hear-
ing of all subjects returned to normal 16 hours after the concert.
A major problem with passive hearing protection is that it impairs speech
intelligibility as well as blocks informative sounds, such as alarms or in-
structions. With active hearing protectors, it is possible to implement
a hear-through function, which lets low-level ambient sounds, such as
speech, through the hearing protector by capturing the sounds with an
included microphone and by reproducing them with a loudspeaker that
is implemented in the hearing protector. When the level of the ambient
sounds increases, the gain of the reproduced ambient sounds is decreased,
and eventually when the gain goes to zero, the harmfully loud sounds are
passively attenuated by the hearing protector [56].
Publications III and V tackle the NIHL problem by offering signal pro-
cessing applications which reduce the noise exposure caused by music.
Publication III introduces an intelligent, perceptually motivated equal-
izer for mobile headphone listening that adapts to different noisy envi-
ronments. The idea is to boost only those frequency regions that actually
need amplification, and in this way minimize the volume increase caused
by the boosting. Publication V presents a hear-through application that
can be used during a loud concert to limit the noise exposure caused by the
live music. The hear-through function is user controllable, which allows
the user to do some mixing of their own during the concert.
Furthermore, the idea to enhance the target signal in the presence of
noise is also used in mobile communication applications [57, 58, 59] as
well as in automotive audio [60, 61]. In mobile communication applica-
tions, the target signal is typically speech, and this technique is called
near-end listening enhancement.
3.2 Augmented Reality Audio
Augmented reality is defined as a real-time combination of real and vir-
tual worlds [3]. In ARA, a person’s natural sound environment is extended
with virtual sounds by mixing the two together so that they are heard si-
multaneously.
The mobile usage of ARA requires a headset with binaural microphones
[62, 63, 64]. A prerequisite of an ARA headset is that it should be able to
relay the natural sound environment captured by the microphones to the
ear canal unaltered, and with minimal latency. This copy of the natural
30

Augmented Reality Audio and Hear-Through Systems
Virtual sounds
Binaural signals to distant user
Figure 3.1. Block diagram of the ARA system.
sound environment that has propagated through the ARA system is called
a pseudoacoustic environment [3].
However, the acoustics of the ARA headset differs from normal open ear
acoustics, and hence, the ARA headset requires equalization in order to
sound natural. The equalization is realized with an ARA mixer [63]. The
sound quality of the pseudoacoustic environment must be good so that
the users can continuously wear the ARA headset without fatigue. The
usability issues of the ARA headset have been studied by Tikander [65].
Because of the low latency requirements, earlier ARA systems were
implemented using analog components [63] in order to avoid the comb-
filtering effect (see Section 3.3) caused by the delayed pseudoacoustic sound.
Publication IV introduces a novel digital version of the ARA system, as
well as analyses how the delay caused by the digital signal processing
affects the perceived signal.
3.2.1 ARA Applications
Figure 3.1 shows the system diagram for ARA applications. Virtual sounds
can be processed, e.g., with head-related transfer functions (HRTF) to
place the virtual sounds into the three dimensional space around the user
[66, 67]. The ARA mixer and equalizer is used for the equalization of the
pseudoacoustic representation as well as for routing and mixing of all the
signals involved in the system. Furthermore, the binaural microphone
signals can be sent to distant users for communication purposes.
The ARA technology enables the implementation of different innova-
tive applications, including applications in communication and informa-
tion services, such as teleconferencing and binaural telephony with good
telepresence [68, 69], since the remote user can hear the same pseudoa-
coustic environment as the near-end user does.
31

Augmented Reality Audio and Hear-Through Systems
There are also many possible application scenarios when the position
and orientation of the user is known, including an eyes-free navigation
system [70, 71], the virtual tourist guide [65], and location-based games
[72]. The positioning of the user can be done using the Global Position-
ing System (GPS) whereas determining of the user’s orientation requires
head tracking [73].
The ARA system can also be used to increase situational awareness [56].
Furthermore, it is possible to estimate different acoustic parameters from
the surrounding environment, such as room reflections [74] and reverber-
ation time [75].
The ARA system could also be used as an assistive listening device.
In Publication V, the hear-through headset is used to attenuate ambi-
ent sounds while the pseudoacoustic representation is made adjustable
for the user. Enhancing ambient sounds would also be possible with cur-
rent technology. The digital ARA technology presented in Publication IV
would enable an adjustable platform for a user-controllable ARA system
that could be individually tuned to the user’s needs.
3.3 Comb-Filtering Effect
In ARA, the pseudoacoustic representation undergoes some amount of de-
lay due to the equalization filters. However, the largest delays are typi-
cally caused by the analog-to-digital and digital-to-analog converters op-
erating before and after the actual equalization, respectively. The delay
of a laptop and an external FireWire audio interface measured in Publica-
tion IV, including both the delays of the analog-to-digital and the digital-
to-analog converter, was 8.6 and 21 ms, respectively. Furthermore, the
delay introduced by the converters of the DSP evaluation board used in
Publication IV was approximately 0.95 ms.
In addition to the pseudoacoustic sound, the ambient sounds leak through
and around the ARA headset. The leaked sound and the delayed pseudoa-
coustic sound are summed at the ear drum of the user, and because of the
delay, it can easily result in a comb-filtering effect [76, 77]. The comb-
filtering effect occurring in a hear-through device can be simulated with
an FIR comb filter:
H(z) = gd + geqz−L, (3.1)
where gd is the gain for the direct leaked sound, geq is the gain for the
equalized pseudoacoustic sound, and L is the delay in samples.
32

Augmented Reality Audio and Hear-Through Systems
100 1k 10k−40
−30
−20
−10
0
10
Frequency (Hz)M
agni
tude
(dB
)
(a)
100 1k 10k−40
−30
−20
−10
0
10
Frequency (Hz)
Mag
nitu
de (d
B)
(b)
Figure 3.2. Magnitude frequency response of the FIR comb filter defined in Equation(3.1), when the delay is 2 ms. In (a) the values of gd and geq = 0.5 and in (b)gd = 0.1 and geq = 0.9.
The worst-case scenario occurs when both of the signals have the same
amount of energy gd = geq. Figure 3.2(a) shows the comb-filtering effect
when the gains are set to gd = geq = 0.5 and the delay is 2 ms. The value
of 0.5 for the gains was chosen because when the sum of the gains is one
the top of the peaks lie at 0 dB.
Figure 3.2(b) shows the magnitude response of an FIR comb filter de-
scribed by Equation (3.1), when the delay between the signals is 2 ms, as
for the filter used to obtain Figure 3.2(a). However, now the direct sound
is attenuated 20 dB, and thus the values of gd and geq are 0.1 and 0.9,
respectively. As can be seen, the dips are at the same frequencies as in
Figure 3.2(a), but their depth is reduced dramatically. In fact, with the
20-dB attenuation, the depth of the dips is only 2 dB.
The audibility of the comb-filtering effect has been previously studied,
e.g., in [78, 79, 76]. The amount of attenuation needed between the di-
rect and delayed sound for the comb-filtering coloration to be inaudible
33

Augmented Reality Audio and Hear-Through Systems
depends on the delay and the type of audio that is listened to. The re-
sult of Schuller and Härmä [79] showed that the level difference between
the direct and delayed sound should be around 26–30 dB in order to be
inaudible. The result was averaged over different audio test material.
Brunner et al. [76] conducted a listening test in order to determine the au-
dibility of the comb-filtering effect for speech, piano, and snare drum test
signals. Their results indicated that when the delay is 0.5–3 ms, which
corresponds to a typical latency of an ARA headset system, the average
level difference needed in order for the comb-filtering effect to be inaudi-
ble was approximately 12 dB for the speech and piano, and 17 dB for the
snare drum sample. The highest required attenuations (based on single
subjects) for the piano, speech, and snare drum samples, were 22, 23, and
27 dB, respectively.
This kind of isolation cannot be accomplished with all headphones, but
with in-ear headphones it is possible, since they can provide more than
20-dB attenuation above 1 kHz, as shown in Figure 2.4. Furthermore, the
idea in the ARA system is to wear the headset continuously and not to
compare the pseudoacoustic representation of the sound directly with the
real-world sounds by removing the headset. This allows the user of the
headset to get accustomed to minor timbral distortions.
34

4. Auditory Masking
Psychoacoustics is aiming to understand and characterize human audi-
tory perception, especially the time-frequency processing of the inner-ear
[80]. Auditory masking is a common psychoacoustic phenomenon that oc-
curs all the time in our hearing system. Auditory masking refers to a
situation where one sound (a masker) affects the perceived loudness of
another sound (a maskee). The maskee can either be completely masked
to be inaudible by the masker or just reduced in loudness. The latter
instance is referred to as partial masking.
Auditory masking has been tackled for quite a long time. Fletcher and
Munson [81] have studied the relation between the loudness of complex
sounds and masking already back in 1937. Despite the long history of
research in the area, the auditory system, including auditory masking
and hearing models, is still an active research topic [82, 83].
Knowledge of auditory masking has also been utilized in audio coding
for 35 years, since Schroeder et al. [84] studied the optimization of speech
codecs by utilizing the knowledge of human auditory masking. The idea
in audio coding is to identify irrelevant information by analyzing the au-
dio signal and then reducing this information from the signal according
to psychoacoustical principles, including the analysis of absolute thresh-
old of hearing, the masking threshold, and the spreading of the masking
across the critical bands [85, 86, 87].
This Section provides the psychoacoustic context for Publications II and
III.
4.1 Critical Bands
The critical band is an important concept when describing the time-fre-
quency resolution of the human auditory system. Basically, it describes
35
Auditory Masking
100 1k 10kFrequency (Hz)
30 300 3k
Figure 4.1. Bark band edges on a logarithmic scale.
how the basilar membrane interprets different frequencies. The mechani-
cal properties of the basilar membrane change as a function of its position.
At the beginning, the membrane is quite narrow and stiff, while at the end
it is wider and less stiff [88]. Every position on the basilar membrane re-
acts differently to different frequencies. In fact, the basilar membrane
conducts a frequency-to-position transformation of sound [89, 90, 91].
The critical bandwidth is based on the frequency-specific positions of
the basilar membrane. The hearing system analyzes wide-band sound in
a way that the sounds within one critical band are analyzed as a whole.
In terms of auditory masking, this means that the level of masking within
a critical band is constant [92].
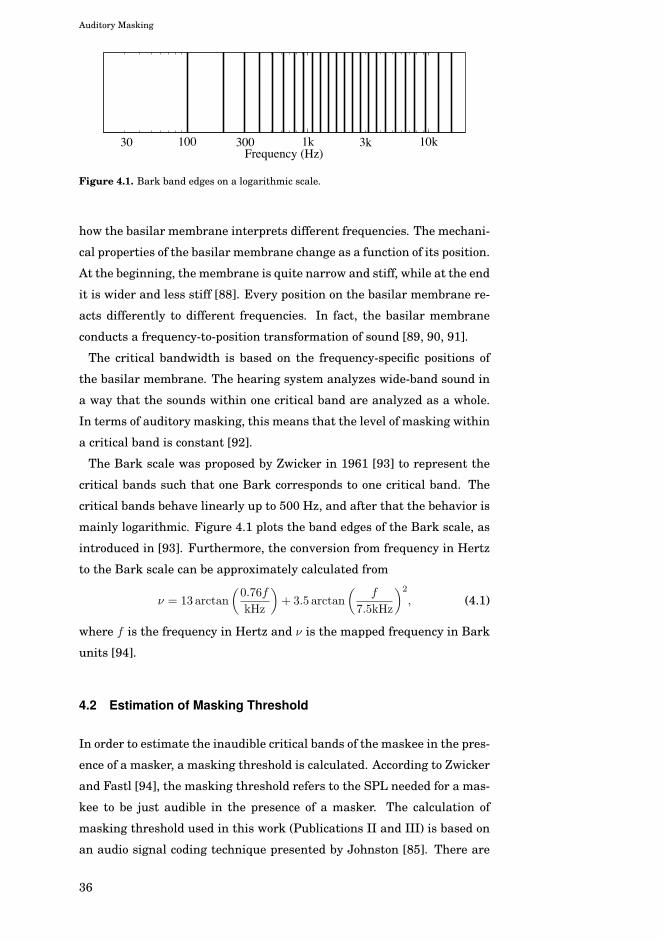
The Bark scale was proposed by Zwicker in 1961 [93] to represent the
critical bands such that one Bark corresponds to one critical band. The
critical bands behave linearly up to 500 Hz, and after that the behavior is
mainly logarithmic. Figure 4.1 plots the band edges of the Bark scale, as
introduced in [93]. Furthermore, the conversion from frequency in Hertz
to the Bark scale can be approximately calculated from
ν = 13 arctan
(0.76f
kHz
)+ 3.5 arctan
(f
7.5kHz
)2
, (4.1)
where f is the frequency in Hertz and ν is the mapped frequency in Bark
units [94].
4.2 Estimation of Masking Threshold
In order to estimate the inaudible critical bands of the maskee in the pres-
ence of a masker, a masking threshold is calculated. According to Zwicker
and Fastl [94], the masking threshold refers to the SPL needed for a mas-
kee to be just audible in the presence of a masker. The calculation of
masking threshold used in this work (Publications II and III) is based on
an audio signal coding technique presented by Johnston [85]. There are
36

Auditory Masking
Critical band (Bark)SP
L (
dB)
SPL of masker (LM)
Sprea
ding f
uncti
on (B
)
Masking energy offset (U)
Figure 4.2. Masking threshold estimation.
more recent and advanced auditory models available as well, e.g., [95, 96].
Nevertheless, the technique by Johnston was chosen, since the applica-
tions in Publications II and III required only an estimate of the masking
threshold and not more complex auditory models or attributes. The John-
ston method provides a straightforward method to calculate the masking
threshold, and it is sufficiently low in complexity to be implemented in
real-time.
The masking threshold is calculated in steps [85], including the follow-
ing: calculating the energy of the masker signal, mapping the frequency
scale onto the Bark scale and calculating the average energy for each crit-
ical band, applying a spreading function to each Bark band, summing the
individual spread masking curves into one overall spread masking thresh-
old, estimating the tonality of the masker and calculating the offset for the
overall spread masking threshold, and finally, accounting for the absolute
threshold of hearing. All the equations needed to calculate the masking
threshold are found in Publications II and III.
Figure 4.2 illustrates the masking threshold estimation of one Bark
band, where LM is the energy of the Bark band, B is the spreading func-
tion, and U is the masking-energy offset. The masking-energy offset is
determined based on the tonality of the masker that can be estimated
using the spectral flatness measure, which is defined as the ratio of the
geometric mean to the arithmetic mean of the power spectrum [85]. A
ratio close to one indicates that the spectrum is flat and the signal has
decorrelated noisy content, whereas a ratio close to zero implies that the
spectrum has narrowband tonal components [80]. The masking energy
offset is required since it is known that a noise-like masker masks more
effectively than a tonal masker [95].
37

Auditory Masking
Critical band (Bark)
SPL
(dB
)
Masking threshold
A
Masker
B
Figure 4.3. Partial masking effect, where two tones (unfilled markers) are in the pres-ence of a masker.
4.3 Partial Masking
The maskee is not necessarily masked completely in the presence of the
masker. When the maskee is just above the masking threshold, it is au-
dible but perceived to be reduced in loudness. In such a case, the mas-
kee is partially masked. Thus, the masker does not only shift the abso-
lute threshold of hearing to the masked threshold, but it also produces a
masked loudness curve [94]. The effect of partial masking is the strongest
near the masking threshold. When the level of the maskee increases, the
effect of the partial masking decreases at a slightly faster rate. As the
level of the maskee increases to a sufficiently high level, the effect of par-
tial masking ends, and the maskee is perceived at the same level in the
presence of the masker as in quiet [97].
Figure 4.3 shows a situation where two tones with the same SPL are in
the presence of a masker, one of which is at slightly higher frequency (B)
than the masker and the other at much lower frequency (A). The thick
stem with the filled marker shows the SPL of the masker, whereas the
two stems with unfilled round markers (A and B) indicate the SPL of the
two tones. The triangle marker is the perceived SPL of the high-frequency
tone. As can be seen in Figure 4.3, the high-frequency tone (B) is above
the masking threshold but still close to it. Thus, the tone is audible but its
perceived SPL is reduced, as indicated by the triangle marker. However,
the low-frequency tone (A) is nowhere near the masking threshold, and
thus, it is not affected by the masker at all. The low-frequency tone is
perceived at the same level as it would be perceived without the masker.
38
5. Digital Equalizers
This section presents the basics of digital equalizers, which are widely
used in this work, as well as a parametric and a graphic equalizer design,
since they are used in Publications II-VII. Furthermore, the concept of
a parallel equalizer is introduced, since Publication VII is based on this
concept.
5.1 Equalizers
Equalizers are often used to correct the performance of audio systems. In
fact, equalization can be said to be one of the most common and impor-
tant audio processing methods. The expression ‘equalize’ originates from
its early application, which was to flatten out a frequency response. How-
ever, nowadays, the objective is not necessarily to flatten out the frequency
response, but to alter it to meet desired requirements.
A certain set of filters is needed in the implementation of an equalizer.
These equalizer filters can be tuned to adjust the equalizer to suit the
given application. Typical equalizer filters are shelving filters and peak
or notch filters. Shelving filters are used to weight low or high frequen-
cies. High-frequency and low-frequency shelving filters boost or attenu-
ate frequencies above or below the selected cut-off frequency, respectively.
Shelving filters are usually found on the treble and bass controls of home
and car audio systems. Shelving filters are useful when adjusting the
overall tonal properties. However, more precise filters are often required.
A peak or notch filter can be targeted to a specific frequency band at any
desired frequency.
The first time that an equalizer was used to improve the quality of repro-
duced sound was in the 1930s, when motion pictures with recorded sound
tracks emerged. Sound recording systems as well as reproduction systems
39

Digital Equalizers
Figure 5.1. Front panel of a graphic equalizer.
that were installed in theaters were poor and thus needed equalization
[98, 99]. The first stand-alone, fully digital equalizer was introduced in
1987 by Yamaha, namely the DEQ7, which included features such as 30
preset equalizer programs and a parametric equalizer [99, 100].
The two most common types of equalizers are the parametric [101, 102,
103, 104, 105] and graphic [106, 107, 108, 109, 110] equalizers. With
a parametric equalizer, the user can control the center frequency, band-
width, and gain of the equalizer filters, whereas with graphic equalizer
the only user-controllable parameter is the gain. The gains are controlled
using sliders that plot the approximate magnitude response of the equal-
izer, as shown in Figure 5.1.
Nowadays equalizers are widely used in audio signal processing, which
include a variety of applications, such as enhancing a loudspeaker re-
sponse [111, 112, 113] as well as the interaction between a loudspeaker
and a room [114, 115, 116, 117, 118], equalization of headphones in order
to provide a natural music listening experience [36, 119, 120, 121, 122] or
a natural hear-through experience [123, 124, 125, 126], and enhancement
of recorded music [127, 128].
Furthermore, an equalizer can be considered to be a filter bank, since
it has an array of bandpass filters that are used to control different sub-
bands of the input signal. However, more advanced filter banks, such as
quadrature mirror filter banks, are often implemented with the analysis-
synthesis system using multirate signal processing [129]. In the analysis
bank, the signal is split into different bands, and the sub-bands are dec-
imated by an appropriate factor. Then, the sub-band signals can be pro-
cessed independently, for example, by using different coding or compress-
ing the sub-bands differently. After that, the signal is reconstructed by
interpolating the sub-band signals [129]. Although multirate filter banks
40

Digital Equalizers
offer a wider range of signal processing possibilities, the advantage of an
equalizer is that it does not require the splitting and reconstruction of the
audio signal.
5.2 Parametric Equalizer Design
Regalia and Mitra [101] introduced a digital parametric equalizer filter,
which is based on an allpass filter structure. The Regalia–Mitra filter
enables gain adjustments at specified frequencies, while it leaves the rest
of the spectrum unaffected. Furthermore, the equalizer parameters can
be individually tuned.
The transfer function of the filter can be expressed as
H(z) =1
2[1 +A(z)] +
K
2[1−A(z)], (5.1)
where K specifies the gain of the filter and A(z) is an allpass filter [101].
When A(z) is a first-order allpass, the filter is a shelving filter. When A(z)
is a second-order allpass, the filter is a peak or notch filter. The second-
order allpass filter commonly used in (5.1) has the transfer function
A(z) =a+ b(1 + a)z−1 + z−2
1 + b(1 + a)z−1 + az−2, (5.2)
where
a =1− tan(Ω/2)
1 + tan(Ω/2), (5.3)
b = − cos(ω0), (5.4)
Ω denotes the normalized filter bandwidth, and ω0 the normalized center
frequency. When K > 1, the filter is a peak filter and when K < 1, it is
notch filter.
The peaks and notches are not symmetric in the original Regalia–Mitra
filter structure, i.e., the bandwidth of the notches is smaller than that of
the peak filters [101]. Figure 5.2(a) shows the asymmetry between the
peak and notch filters. However, Zölzer and Boltze [130] extended the
second-order Regalia-Mitra structure in order to have symmetrical peaks
and notches. The only change to the original structure concerns the fre-
quency parameter a, which becomes
ac =K − tanΩ/2
K + tanΩ/2, when K < 1. (5.5)
Figure 5.2(b) shows the magnitude response of the peak and notch filters,
when ac is used.
41
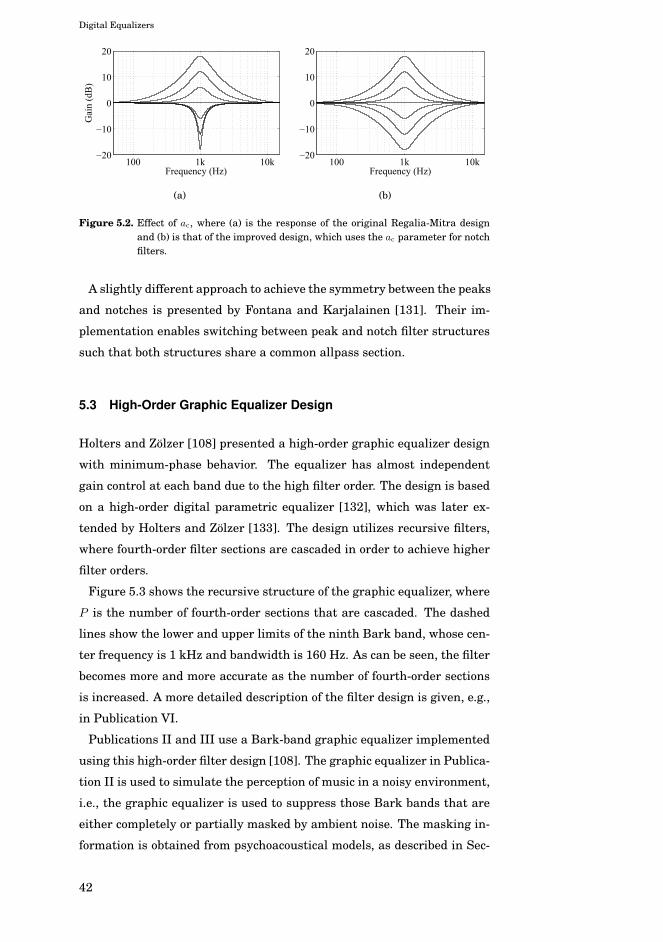
Digital Equalizers
100 1k 10k−20
−10
0
10
20
Frequency (Hz)
Gai
n (d
B)
(a)
100 1k 10k−20
−10
0
10
20
Frequency (Hz)
(b)
Figure 5.2. Effect of ac, where (a) is the response of the original Regalia-Mitra designand (b) is that of the improved design, which uses the ac parameter for notchfilters.
A slightly different approach to achieve the symmetry between the peaks
and notches is presented by Fontana and Karjalainen [131]. Their im-
plementation enables switching between peak and notch filter structures
such that both structures share a common allpass section.
5.3 High-Order Graphic Equalizer Design
Holters and Zölzer [108] presented a high-order graphic equalizer design
with minimum-phase behavior. The equalizer has almost independent
gain control at each band due to the high filter order. The design is based
on a high-order digital parametric equalizer [132], which was later ex-
tended by Holters and Zölzer [133]. The design utilizes recursive filters,
where fourth-order filter sections are cascaded in order to achieve higher
filter orders.
Figure 5.3 shows the recursive structure of the graphic equalizer, where
P is the number of fourth-order sections that are cascaded. The dashed
lines show the lower and upper limits of the ninth Bark band, whose cen-
ter frequency is 1 kHz and bandwidth is 160 Hz. As can be seen, the filter
becomes more and more accurate as the number of fourth-order sections
is increased. A more detailed description of the filter design is given, e.g.,
in Publication VI.
Publications II and III use a Bark-band graphic equalizer implemented
using this high-order filter design [108]. The graphic equalizer in Publica-
tion II is used to simulate the perception of music in a noisy environment,
i.e., the graphic equalizer is used to suppress those Bark bands that are
either completely or partially masked by ambient noise. The masking in-
formation is obtained from psychoacoustical models, as described in Sec-
42
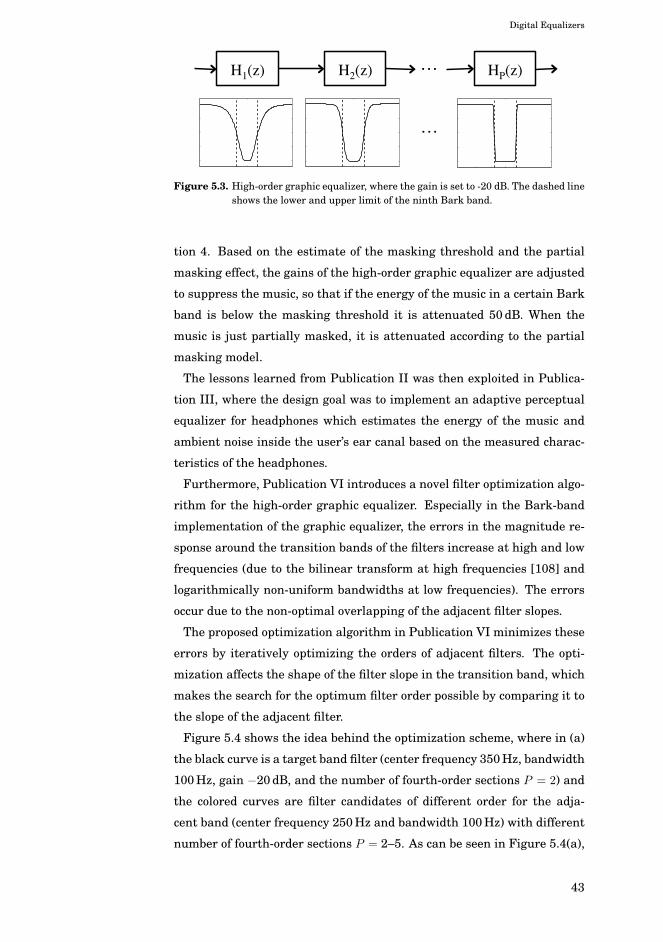
Digital Equalizers
H1(z) H2(z) HP(z)
Figure 5.3. High-order graphic equalizer, where the gain is set to -20 dB. The dashed lineshows the lower and upper limit of the ninth Bark band.
tion 4. Based on the estimate of the masking threshold and the partial
masking effect, the gains of the high-order graphic equalizer are adjusted
to suppress the music, so that if the energy of the music in a certain Bark
band is below the masking threshold it is attenuated 50 dB. When the
music is just partially masked, it is attenuated according to the partial
masking model.
The lessons learned from Publication II was then exploited in Publica-
tion III, where the design goal was to implement an adaptive perceptual
equalizer for headphones which estimates the energy of the music and
ambient noise inside the user’s ear canal based on the measured charac-
teristics of the headphones.
Furthermore, Publication VI introduces a novel filter optimization algo-
rithm for the high-order graphic equalizer. Especially in the Bark-band
implementation of the graphic equalizer, the errors in the magnitude re-
sponse around the transition bands of the filters increase at high and low
frequencies (due to the bilinear transform at high frequencies [108] and
logarithmically non-uniform bandwidths at low frequencies). The errors
occur due to the non-optimal overlapping of the adjacent filter slopes.
The proposed optimization algorithm in Publication VI minimizes these
errors by iteratively optimizing the orders of adjacent filters. The opti-
mization affects the shape of the filter slope in the transition band, which
makes the search for the optimum filter order possible by comparing it to
the slope of the adjacent filter.
Figure 5.4 shows the idea behind the optimization scheme, where in (a)
the black curve is a target band filter (center frequency 350 Hz, bandwidth
100 Hz, gain −20 dB, and the number of fourth-order sections P = 2) and
the colored curves are filter candidates of different order for the adja-
cent band (center frequency 250 Hz and bandwidth 100 Hz) with different
number of fourth-order sections P = 2–5. As can be seen in Figure 5.4(a),
43

Digital Equalizers
200 300 400
−20
−15
−10
−5
0
Frequency (Hz)
Mag
nitu
de (
dB)
P = 2P = 2P = 3P = 4P = 5
(a)
240 260 280 300 320 340 3600
1
2
3
Err
or (
dB)
Frequency (Hz)
P = 2P = 3P = 4P = 5
(b)
Figure 5.4. Example of the interaction occurring around a transition band between twoadjacent band filters, where (a) shows the magnitude response of a targetband filter (black curve, P = 2) and a set of magnitude responses of filtercandidates on the adjacent lower band (colored curves, P = 2, 3, 4, 5), and(b) shows the absolute errors around the transition band for the total filterresponses (target is a flat curve in −20 dB).
the shape of the filter slope changes when the filter order is increased. Fig-
ure 5.4(b) shows the absolute errors around the transition band (300 Hz),
when the filters of different order (colored curves) are summed with the
target filter (black curve). The target curve lies at −20 dB. As can be
seen, the smallest peak error (approx. 1.5 dB, purple curve) occurs when
the lower band filter has three fourth-order sections P = 3. The algorithm
then chooses the number of fourth-order sections that results in the small-
est peak error and moves to the next band and starts optimizing the order
of that band filter by comparing it to the already optimized filter.
5.4 Parallel Equalizer Design
The fixed-pole design of parallel equalizer filters was first introduced by
Bank [134]. Since then, it has been utilized in different applications,
such as magnitude response smoothing [135, 136], equalization of a loud-
speaker-room response [135, 136], and modeling of musical instruments
[134, 137, 138].
The design is based on parallel second-order IIR filters whose poles are
set to predetermined positions according to the desired frequency resolu-
tion, which is directly affected by the pole frequency differences, i.e., the
distance between adjacent poles. This enables a straightforward design
of a logarithmic frequency resolution by placing the poles logarithmically,
which closely corresponds to that of human hearing, and hence, it is of-
44

Digital Equalizers
b1,0
b1,1
-a1,2
-a1,1
In Out
d0
H1(z)
Figure 5.5. Structure of the parallel equalizer.
ten used in audio applications [139, 140]. The accuracy of the equalizer
gets better when the number of the poles is increased. Furthermore, the
accuracy increment can be targeted to a specified frequency area by plac-
ing more poles in that area. The poles can be set manually, as is done in
Publication VII, or automatically, as shown, e.g., in [135, 118].
Other ways to achieve logarithmic frequency resolution include using
warped filters [141] and more generalized Kautz filters [142, 143], where
the frequency resolution can be set arbitrarily through the choice of the
filter poles. Furthermore, Alku and Bäckström [144] introduced a linear
prediction method which gives more accuracy at low frequencies. The
method is based on conventional linear predictors of successive orders
with parallel structures, which consist of symmetric linear predictors and
lowpass and highpass pre-filters.
Figure 5.5 shows the block diagram of the parallel filter structure, which
consists of P parallel second-order sections (H1(z), H2(z), . . . , HP (z)) and
a parallel direct path with a gain d0. Thus, the transfer function of the
parallel filter is
H(z) = d0 +P∑
k=1
bk,0 + bk,1z−1
1 + ak,1z−1 + ak,2z−2, (5.6)
where ak,1 and ak,2 are the denominator coefficients of the kth second-order
section, which are derived based on the predetermined pole positions, and
bk,0 and bk,1 are the numerator coefficients of the kth section, which are
optimized based on the target response.
45

Digital Equalizers
In Publication VII of this work, the filter design is done in the frequency
domain [140, 145], since the parallel filter structure is used to implement
a graphic equalizer, where the gain sliders define the target magnitude
response. The phase of the target magnitude response is then set to be
minimum phase. Furthermore, it is often useful to give different weights
to different frequencies depending on the desired gain, when the mag-
nitude error is minimized on a decibel scale, as discussed in Publication
VII. Once the denominator coefficients and the target response have been
determined, the numerator parameters can be solved using least-squares
error minimization, as shown in Section III-B of Publication VII.
This design is similar to the linear-in-parameter design of Kautz equal-
izers [142, 143]. In fact, the parallel filter structure produces effectively
the same results as the Kautz filter but requires 33 % fewer operations,
and has a fully parallel structure [146]. The benefit of the fully parallel
structure is the possibility to use a graphics processing unit (GPU) instead
of a central processing unit (CPU) to do the filtering [147]. GPUs have a
large number of parallel processors, which can also be used to perform
audio signal processing [148, 149].
5.5 Comparison of the Graphic Equalizers
Figure 5.6 shows the magnitude responses of both of the proposed graphic
equalizers, when they have been configured for Bark-bands (25 bands).
Figure 5.6(a) shows the magnitude response of the optimized high-order
graphic equalizer, and Figure 5.6(b) shows the magnitude response of the
parallel graphic equalizer (PGE). These two Bark-band graphic equaliz-
ers have the same command slider settings (round markers), which were
chosen to have flat regions as well as large gain differences, both of which
are known to be difficult challenges for a graphic equalizer.
The orders of the equalizers differ quite radically. Starting from the first
Bark band of the optimized high-order design shown in Figure 5.6(a), the
number of the fourth-order sections are six, four, and three; bands from 4
to 23 have two fourth-order sections; and the last two bands have three
and five sections, respectively, yielding a total order of 244. The parallel
graphic equalizer shown in Figure 5.6(b) has 50 second-order sections,
resulting in a total order of 100.
Furthermore, the PGE design avoids the problem that typically occurs
in graphic equalizers, where the interaction between the adjacent band
46

Digital Equalizers
100 1k 10k−15
−10
−5
0
5
10
15
Frequency (Hz)M
agni
tude
(dB
)
(a)
100 1k 10k−15
−10
−5
0
5
10
15
Frequency (Hz)
Mag
nitu
de (d
B)
(b)
Figure 5.6. Comparison of two Bark-band graphic equalizers (25 bands). The figuresshow the magnitude response of (a) the optimized high-order equalizer designand (b) the parallel graphic equalizer design with the same command sliderpositions. The round markers indicate the command positions.
filters cause errors in the magnitude response, as shown in the case of
the high-order graphic equalizer in Figure 5.4(b). This problem is avoided
because the parallel second-order sections are jointly optimized, as dis-
cussed in Publication VII. Comparing the PGE to the high-order graphic
equalizer, the main difference between these two equalizers is that the
joint optimization in the PGE enables smaller filter orders than the high-
order graphic equalizer requires.
One downside of the PGE is that every time a command slider position
is altered by the user, the optimization has to be recalculated, whereas in
the optimized high-order equalizer, the optimization is done only once, of-
fline, and when the user changes the command setting of a band, only the
fourth-order sections of that band must be recalculated. However, saving
preset equalizer command settings for the PGE is highly efficient, since
the filter optimization can be precomputed and easily stored in memory.
47
Digital Equalizers
Both of these graphic equalizer designs can be widely used in audio sig-
nal processing applications. The high-order graphic equalizer results in
more brick-wall-like filters than the smoother PGE due to the high filter
order, as can be seen in Figure 5.6, especially around 400–1000 Hz and 2–
3 kHz. This feature makes the high-order graphic equalizer suitable, e.g.,
for the perceptual equalization applications presented in Publications II
and III.
48

6. Summary of Publications and MainResults
This section summarizes the main results presented in the publications.
Publication I: "Signal Processing Framework for Virtual HeadphoneListening Tests in a Noisy Environment"
Publication I describes a signal processing framework that enables vir-
tual listening of different headphones both in quiet and in virtual noisy
environments. Ambient noise isolation of headphones has become an es-
sential design feature, because headphones are increasingly used in noisy
environments when commuting. Thus, it is important to evaluate the per-
formance of the headphones in an authentic listening environment, since
the headphones together with the ambient noise define the actual listen-
ing experience. The proposed framework provides just this by emulating
the characteristics of the headphones, both the frequency response of the
driver and the ambient sound isolation of the headphone, based on actual
measurements. Furthermore, the proposed framework makes otherwise
impractical blind headphone comparisons possible.
Section 3 presents the calibration method of the reference headphones
used during the listening, since the frequency response of the reference
headphones must be compensated. This is done by using linear predic-
tion filter coefficients to invert the measured frequency response of the
reference headphones with the help of a peak reduction technique, also
described in Section 2.5 of this overview part. Section 4 shows how the
proposed framework is implemented using Matlab with Playrec and how
the measured impulse responses are used as FIR filters to simulate the
characteristics of the headphones.
49

Summary of Publications and Main Results
Publication II: "Perceptual Frequency Response Simulator for Musicin Noisy Environments"
Publication II further tackles mobile headphone listening and the difficul-
ties caused by ambient noise. Publication II expands on the fact that the
listening environment drastically affects the headphone listening experi-
ence, as discussed in Publication I. A real-time perceptual simulator for
music listening in noisy environments is presented. The simulator uses
an auditory masking model to simulate how the ambient noise alters the
perceived timbre of music. The auditory masking model is described in
Section 3, which includes a masking threshold calculation (Sec. 3.1) and
a partial masking model (Sec. 3.2) derived from a listening test with com-
plex test sounds resembling musical sounds. Section 4 describes the im-
plementation of the simulator, whose output is a music signal from which
all components masked by the ambient noise as well as the noise itself are
suppressed. This is done with a high-order Bark-band graphic equalizer,
which is controlled by the psychoacoustic masking estimations. Further-
more, Section 5 presents the simulator evaluation results obtained from
a listening test.
Publication III: "Perceptual Headphone Equalization for Mitigation ofAmbient Noise"
Publication III uses the ideas and techniques developed in Publication
II to enhance the listening experience in mobile headphone listening by
equalizing the music. This is achieved by using the same psychoacous-
tic models that were used in Publication II to analyze ambient noise and
music while simultaneously considering the characteristics of the head-
phones. This enables the estimation of the ambient noise and music level
inside the ear canal. The ideal goal is to estimate the level to which the
music should be raised to in order to have the same perceived tonal bal-
ance in a noisy mobile environment as in a quiet one. The same high-order
Bark-band graphic equalizer as used in Publication II was utilized.
Section 3 together with Figures 1 and 2 describe the implementation of
the proposed perceptual headphone equalization. One of the main advan-
tages of the proposed equalizer is that it retains a reasonable SPL after
equalization, since the music is boosted only at those frequencies where
needed. Thus, the system preserves the hearing of the user, when com-
50

Summary of Publications and Main Results
pared to the typical case where the user just raises the volume of the
music. The Matlab/Playrec implementation is also presented in Section 3.
Publication IV: "Digital Augmented Reality Audio Headset"
Publication IV introduces a novel digital design of an ARA headset. The
ARA system has been commonly believed to require the delay in the pro-
cessing chain to be as small as possible, since otherwise the perceived
sound can be colored by the comb-filtering effect. This is the reason why
earlier ARA systems have been implemented with analog components.
However, the in-ear headphones used in this work provide a high isola-
tion of the outside ambient sounds, which is beneficial with regard to the
comb-filtering effect. Section 2 describes the physics behind the ARA tech-
nology as well as introduces possible applications to be used on the ARA
platform. Sectiond 3 and 4 discuss the delays introduced by digital filters
and passive mechanisms. Section 5 introduces the ARA equalizer filter
design, which is implemented using a DSP evaluation board, as discussed
in Section 6. Additionally, Section 6 presents how the measurements of
the properties of the DSP board are made as well as a detailed analysis
of the comb-filtering effect. Moreover, a listening test was conducted to
subjectively evaluate the disturbance of a comb-filtering effect with music
and speech signals. The digital implementation brings several benefits
when compared to the old analog realization, such as the ease of design
and programmability of the equalizer filters.
Publication V: "Live Sound Equalization and Attenuation with aHeadset"
It was possible to implement a novel idea, where the user can control
their surrounding soundscape during a live concert, based on the success-
ful implementation of the digital augmented reality headset presented in
Publication IV. Publication V presents a system, called LiveEQ, which
captures ambient sounds around the user, provides a user-controllable
equalization, and plays back the equalized ambient sounds to the user
with headphones. An important feature of the LiveEQ system is that it
also attenuates the perceived live music, since it exploits the high atten-
uation capability of in-ear headphones to provide hearing protection.
The system was implemented using Matlab with Playrec as well as with
51

Summary of Publications and Main Results
a DSP evaluation board. The Matlab implementation serves as a simu-
lator whereas the DSP board implementation can be used in real time.
Section 4.1 further examines the comb-filtering effect occurring in a hear-
through system that uses attenuative headphones.
Publication VI: "Optimizing a High-Order Graphic Equalizer forAudio Processing"
Publication VI presents a new optimization algorithm for the high-order
graphic equalizer used in Publications II and III. The main idea is to
optimize the filter orders to improve the accuracy and efficiency of the
equalizer. Every practical filter has a transition band, and in the case
of a graphic equalizer, each transition band interacts with its neighbor-
ing filters creating errors in the magnitude response. The proposed it-
erative algorithm minimizes these errors by optimizing the filter orders,
which affects the shape of the transition band. The optimum shape of
the transition band depends on the shape of the adjacent filter. The order
optimization is executed only once offline, and after that, during the op-
eration, only the gains of the graphic equalizer are changed according to
the user’s command settings. The order optimization was shown to reduce
the peak errors around the transition bands while the equalizer still had
a lower filter order than non-optimized equalizers with larger errors.
Publication VII: "High-Precision Graphic Parallel Equalizer"
Publication VII introduces an accurate graphic equalizer whose design
differs from that of the high-order equalizer used in Publication VI. The
novel graphic equalizer is based on the parallel filter structure introduced
in Section 5.4 of this overview. A typical problem with graphic equalizers
is that the interaction between the adjacent filters, which can result in
substantial errors especially with large boost or cut command settings.
The advantage of the parallel design is that the filters are jointly opti-
mized, and thus, the typical errors due to interaction of the filters are
avoided. This enables the implementation of a highly accurate graphic
equalizer. It was discovered that when there are twice as many pole fre-
quencies compared to the number of the equalizer bands, the maximum
error of the magnitude response of the proposed ±12-dB parallel graphic
equalizer is less than 1 dB across the audible frequencies.
52

7. Conclusions
This work explores equalization techniques for mobile headphone usage,
including equalization of typical headphones as well as equalization of a
hear-through headset. The mobile use of headphones has introduced new
problems in music listening by degrading the perceived sound quality of
the music. This is due to the ambient noise that leaks through the head-
phones into the ear canal. The ambient noise masks parts of the music
and thus changes its perceived timbre. This is the reason why a good iso-
lation capability is nowadays an important feature in mobile headphones.
The degrading effect of ambient noise can be mitigated by using an in-
telligent equalization that enhances the music in those frequency regions
where the auditory masking is pronounced.
The ample isolation capability can sometimes be too much, especially
in social situations. An ARA headset is a device that aims to produce
a perfect hear-through experience with the possibility to include virtual
sounds. The ambient sounds are captured with binaural microphones and
reproduced with the headphone drivers. This requires equalization to
compensate the alterations that the headset introduces to the acoustics
of the outer ear.
This overview of the dissertation presented background information that
supports the included publications. The discussed topics include head-
phone acoustics and their measurements, an introduction to hear-through
systems, as well as augmented reality audio and its applications. We also
discussed digital equalizers and the matter of auditory masking, includ-
ing the concepts of masking threshold and partial masking.
Publication I presents a signal processing framework for virtual head-
phone listening tests, which includes the simulation of headphones’ am-
bient noise isolation characteristics. Publication II provides a simulator
tool that helps one understand the auditory masking phenomenon in mo-
53

Conclusions
bile headphone listening. Publication III is a sequel to Publication II,
where the discovered results were utilized in an implementation of a per-
ceptual equalizer for mobile headphone listening. Publications IV and
V concentrate on hear-through applications. Publication IV presents the
digital ARA headset, whereas Publication V presents a user-controllable
hear-through application for equalizing live music and limiting the sound
exposure during live concerts.
The parts related to Publications II–V that could be expanded in the
future are the usability and validation tests. Both of the systems intro-
duced in Publications II and III would probably be more accurate should
they be fine-tuned based on listening tests conducted in laboratory con-
ditions as well as in real-life everyday situations. However, both of the
proposed systems operate well as they are, and the perceptual equalizer
introduced in Publication III provides an enhanced listening experience
in noisy environments, while at the same time sustains restrained SPL.
Moreover, the main issue in hear-through applications presented in Pub-
lications IV and V is the comb-filtering effect. However, it should also be
tested how disturbing the comb-filtering effect actually is, when the user
wears the hear-through system over long, continuous periods of time in
different environments.
Publication VI presents an optimization algorithm for a high-order graph-
ic equalizer that iteratively optimizes the order of adjacent band filters.
Publication VII presents a novel high-precision graphic equalizer, which
is implemented using parallel second-order filters. The optimized high-
order graphic equalizer enables brickwall-like filter responses, as demon-
strated in Figure 5.3, which gives good accuracy for each band filter as
well as for the whole equalizer, since the overlapping of the adjacent band
filters are minimized. However, the filter orders must be quite large in
order to create the brickwall filters. The PGE in Publication VII, on the
other hand, avoids the filter overlapping issue by jointly optimizing the
second-order sections. The resulting total order of the PGE can be sig-
nificantly lower than that of the high-order equalizer; however, the PGE
cannot create as steep band filter responses as the high-order equalizer,
but results in a smoother overall magnitude response. Furthermore, the
parallel structure of the graphic equalizer enables implementations using
a GPU, which can often outperform a CPU in such a parallelizable task.
Future research could address the following aspects and tasks that were
not possible to be included in this work due to the time and space con-
54

Conclusions
straints. First, a mobile implementation of the proposed equalization
techniques and headphone applications would be important in order to al-
low real-life testing of the systems. The problem is the limited computing
power of smartphones as well as the shortage of input channels (typically
only one channel). However, the computing power of smartphones is con-
stantly increasing, and modern smartphones can even be equipped with
a GPU, which can enable utilization of parallel algorithms. Even then,
the low power consumption, and thus low complexity algorithms, is a key
requirement for smartphone applications.
Another future study could include the development of algorithms re-
ducing the comb-filtering effect in hear-through devices, which should be
possible, since the equalized sound can be independently processed from
the leaked sound. Furthermore, different hardware configurations should
also be tested, since low-delay digital signal processors are widely avail-
able and they could reduce the disturbance of the comb-filtering effect.
Of course, the ideal goal would be to implement all the proposed meth-
ods and more into a single pair of headphones. For example, it could
include a user-controllable frequency response (arbitrary or based on ex-
isting measured responses), which could then be enhanced with an intelli-
gent adaptive equalizer that keeps the perceived frequency response con-
stant no matter what kind of noisy environment the user is in. Further-
more, the hear-through function should be fully adjustable from trans-
parent hear-through to amplification and all the way to the most effective
ANC-driven isolation. The adjusting of the hear-through can be auto-
mated based on the ambient noise and the content the user is listening
to. Furthermore, it is possible to utilize other data provided by the user’s
smartphone, such as location, network connections (WIFI and Bluetooth),
time of day, and incoming phone calls, to control the properties of the
headphones.
It would also be useful in the future to measure a vast set of headphones,
build a database, as well as implement and publish a listening test frame-
work on the Internet that would be available to all who are interested in
headphones. Based on the informal feedback from the users of the head-
phone simulator presented in Publication I, this appears to be a highly
desired application for consumers.
In the future, headphones could and probably will be used in assistive
listening applications, where the idea is to improve the hearing of peo-
ple with normal hearing in different situations. I believe that assistive
55

Conclusions
listening applications will also create a need for novel signal processing
methods and increase the usage of headphones in the future.
56

Bibliography
[1] Gartner, Inc., “Gartner says worldwide mobile phone sales declined1.7 percent in 2012,” http://www.gartner.com/newsroom/id/2335616, Feb.2013.
[2] ——, “Gartner says smartphone sales accounted for 55 per-cent of overall mobile phone sales in third quarter of 2013,”http://www.gartner.com/newsroom/id/2623415, Nov. 2013.
[3] A. Härmä, J. Jakka, M. Tikander, M. Karjalainen, T. Lokki, J. Hiipakka,and G. Lorho, “Augmented reality audio for mobile and wearable appli-ances,” J. Audio Eng. Soc., vol. 52, pp. 618–639, Jun. 2004.
[4] ITU-T, “Recommendation P.57, Series P: Telephone transmission quality,objective measuring apparatus - artificial ears,” International Telecommu-nication Union, Telecommunication Standardization Sector, Rec. ITU-TP.57, 2008/1996.
[5] D. Hammershøi, “Fundamental aspects of the binaural recording and syn-thesis techniques,” in Proc. AES 100th Convention, Copenhagen, Den-mark, May 1996.
[6] R. Teranishi and E. A. G. Shaw, “External-ear acoustic models with simplegeometry,” J. Acoust. Soc. Am., vol. 44, no. 1, pp. 257–263, 1968.
[7] D. Raichel, The Science and Applications of Acoustics. New York:Springer-Verlag, 2000.
[8] L. L. Beranek, Acoustics. New York: Acoustical Society of Americathrough the American Institute of Physics, Inc., 1996.
[9] F. M. Wiener and D. A. Ross, “The pressure distribution in the auditorycanal in a progressive sound field,” J. Acoust. Soc. Am., vol. 18, no. 2, pp.401–408, Oct. 1946.
[10] P. Brüel, “Impedance of real and artificial ears,” Brüel & Kjær, ApplicationNote, 1976.
[11] H. Dillion, Hearing Aids. Sydney, Australia: Boomerang Press, 2001.
[12] A. Wilska, “Studies on directional hearing,” Ph.D. dissertation, Englishtranslation, Aalto University School of Science and Technology, Dept. ofSignal Processing and Acoustics, 2010. Ph.D. dissertation originally pub-lished in German as Untersuchungen über das Richtungshören, Universityof Helsinki, 1938.
57

Bibliography
[13] M. D. Burkhard, “Measuring the constants of ear simulators,” J. AudioEng. Soc., vol. 25, no. 12, pp. 1008–1015, Dec. 1977.
[14] J. J. Zwislocki, “An ear-like coupler for calibration of earphones,” J. Acoust.Soc. Am., vol. 50, no. 1A, pp. 110–110, 1971.
[15] R. M. Sachs and M. D. Burkhard, “Earphone pressure response in ears andcouplers,” in Proc. 83rd Meeting of the Acoustical Society of America, Jun.1972.
[16] ——, “Zwislocki coupler evaluation with insert earphones,” Industrial Re-search Products, Inc. for Knowles Electronics, Inc., Tech. Rep., Nov. 1972.
[17] S. E. Voss and J. B. Allen, “Measurement of acoustic impedance and re-flectance in the human ear canal,” J. Acoust. Soc. Am., vol. 95, no. 1, pp.372–384, Jan. 1994.
[18] O. Saltykov and A. Gebert, “Potential errors of real-ear-to-coupler-difference method applied for a prediction of hearing aid performance inan individual ear,” in Proc. AES 47th International Conference, Chicago,USA, Jun. 2012.
[19] IEC, “Electroacoustics—Simulator of human head and ear—Part 4:Occluded-ear simulator for the measurement of earphones coupled to theear by means of ear inserts,” International Electrotechnical Comission, IEC60318-4 Ed. 1.0 b:2010, Jan. 2010.
[20] ANSI, “American national standard for an occluded ear simulator,” ANSIS3.25-2009, 2009.
[21] S. Jønsson, B. Liu, A. Schuhmacher, and L. Nielsen, “Simulation of theIEC 60711 occluded ear simulator,” in Proc. AES 116th Convention, Berlin,Germany, May 2004.
[22] K. Inanaga, T. Hara, G. Rasmussen, and Y. Riko, “Research on a measuringmethod of headphones and earphones using HATS,” in Proc. AES 125thConvention, San Francisco, CA, Oct. 2008.
[23] A. J. Berkhout, D. de Vries, and M. M. Boone, “A new method to acuireimpulse responses in concert halls,” J. Acoust. Soc. Am., vol. 68, no. 1, pp.179–183, Jul. 1980.
[24] D. Griesinger, “Impulse response measurements using all-pass deconvolu-tion,” in Proc. AES 11th International Conference, Portland, Oregon, May1992, pp. 306–321.
[25] ——, “Beyond MLS—Occupied hall measurements with FFT techniques,”in Proc. AES 101st Convention, Los Angeles, California, Nov. 1996.
[26] A. Farina, “Simultaneous measurement of impulse response and distor-tion with a swept-sine technique,” in Proc. AES 108th Convention, Paris,France, Feb. 2000.
[27] ——, “Advancements in impulse response measurements by sine sweeps,”in Proc. AES 122nd Convention, Vienna, Austria, May 2007.
[28] S. Müller and P. Massarani, “Transfer-function measurement withsweeps,” J. Audio Eng. Soc., vol. 49, no. 6, pp. 443–471, Jun. 2001.
58

Bibliography
[29] G.-B. Stan, J.-J. Embrechts, and D. Archambeau, “Comparison of differentimpulse response measurement techniques,” J. Audio Eng. Soc., vol. 50,no. 4, pp. 249–262, Apr. 2002.
[30] C. A. Poldy, “Headphones,” in Loudspeaker and Headphone Handbook,3rd ed., J. Borwick, Ed. Focal Press, New York, 1994, pp. 585–692.
[31] S. P. Gido, R. B. Schulein, and S. D. Ambrose, “Sound reproduction within aclosed ear canal: Acoustical and physiological effects,” in Proc. AES 130thConvention, London, UK, May 2011.
[32] F. Briolle and T. Voinier, “Transfer function and subjective quality of head-phones: Part 2, subjective quality evaluations,” in AES 11th InternationalConference, Portland, OR, May 1992, pp. 254–259.
[33] T. Hirvonen, M. Vaalgamaa, J. Backman, and M. Karjalainen, “Listeningtest methodology for headphone evaluation,” in Proc. AES 114th Conven-tion, Amsterdam, The Netherlands, Mar. 2003.
[34] T. Hiekkanen, A. Mäkivirta, and M. Karjalainen, “Virtualized listeningtests for loudspeakers,” J. Audio Eng. Soc., vol. 57, no. 4, pp. 237–251, Apr.2009.
[35] S. E. Olive, T. Welti, and E. McMullin, “A virtual headphone listening testmethodology,” in Proc. AES 51st International Conference, Helsinki, Fin-land, Aug. 2013.
[36] G. Lorho, “Subjective evaluation of headphone target frequency re-sponses,” in Proc. AES 126th Convention, Munich, Germany, May 2009.
[37] P. A. Nelson and S. J. Elliott, Active Control of Sound. London, UK: Aca-demic Press Limited, 1995.
[38] S. M. Kuo and D. R. Morgan, “Active noise control: A tutorial review,”Proceedings of the IEEE, vol. 87, no. 6, pp. 943–973, Jun. 1999.
[39] B. Rafaely, “Active noise reducing headset—An overview,” in Proc. Interna-tional Congress and Exhibition on Noise Control Engineering, The Hague,The Netherlands, Aug. 2001.
[40] S. Priese, C. Bruhnken, D. Voss, J. Peissig, and E. Reithmeier, “Adap-tive feedforward control for active noise cancellation in-ear headphones,”in Proc. Meeting on Acoustics, Acoustical Society of America, vol. 18, Jan.2013.
[41] C. Bruhnken, S. Priese, H. Foudhaili, J. Peissig, and E. Reithmeier, “Designof feedback controller for active noise control with in-ear headphones,” inProc. Meeting on Acoustics, Acoustical Society of America, Jan. 2013.
[42] E. D. Simshauser and M. E. Hawley, “The noise-cancelling headset—Anactive ear defender,” J. Acoust. Soc. Am., vol. 27, no. 1, pp. 207–207, 1955.
[43] T. Schumacher, H. Krüger, M. Jeub, P. Vary, and C. Beaugeant, “Activenoise control in headsets: A new approach for broadband feedback ANC,”in Proc. International Conference on Acoustics, Speech and Signal Process-ing (ICASSP), Prague, Czech Republic, May 2011, pp. 417–420.
59

Bibliography
[44] G. V. Békésy, “The structure of the middle ear and the hearing of one’s ownvoice by bone conduction,” J. Acoust. Soc. Am., vol. 21, no. 3, pp. 217–232,May 1948.
[45] C. Pörschmann, “One’s own voice in auditory virtual environments,” ActaAcustica united with Acustica, vol. 87, pp. 378–388, 2001.
[46] J. Curran, “A forgotten technique for resolving the occlusion effect,”Starkey Audiology Series reprinted from Innovations, vol. 2, no. 2, 2012.
[47] F. Kuk, D. Keenan, and C.-C. Lau, “Vent configurations on subjective andobjective occlusion effect,” J. Am. Acad. Audiol., vol. 16, no. 9, pp. 747–762,2005.
[48] J. Kiessling, “Open fittings: Something new or old hat?” in HearingCare for Adults First International Conference, (Chapter 17, pp. 217-226),Staefa, Switzerland, 2006.
[49] J. Meija, H. Dillon, and M. Fisher, “Active cancellation of occlusion: Anelectronic vent for hearing aids and hearing protectors,” J. Acoust. Soc.Am., vol. 124, no. 1, pp. 235–240, Jul. 2008.
[50] WHO, “World health organization. millions have hearing loss thatcan be improved or prevented,” Feb. 2013. [Online]. Available:www.who.int/mediacentre/news/notes/2013/hearing_loss_20130227/en/
[51] N. Petrescu, “Loud music listening,” McGill Journal of Medicine, vol. 11,no. 2, pp. 169–176, 2008.
[52] E. Airo, J. Pekkarinen, and P. Olkinuora, “Listening to music with ear-phones: An assessment of noise exposure,” Acta Acustica united with Acus-tica, vol. 82, no. 6, pp. 885–894, Nov./Dec. 1996.
[53] S. Oksanen, M. Hiipakka, and V. Sivonen, “Estimating individual soundpressure levels at the eardrum on music playback over insert headphones,”in Proc. AES 47th International Conference, Chicago, IL, Jun. 2012.
[54] W. W. Clark and B. A. Bohne, “Temporary threshold shifts from attendanceat a rock concert,” J. Acoust. Soc. Am. Suppl. 1, vol. 79, pp. 48–49, 1986.
[55] R. Ordoñes, D. Hammershøi, C. Borg, and J. Voetmann, “A pilot study ofchanges in otoacoustic emissions after exposure to live music,” in Proc.AES 47th International Conference, Chicago, IL, Jun. 2012.
[56] M. C. Killion, T. Monroe, and V. Drambarean, “Better protection fromblasts without sacrificing situational awareness,” International Journal ofAudiology, vol. 50, no. S1, pp. 38–45, Mar. 2011.
[57] B. Sauert and P. Vary, “Recursive closed-form optimization of spectralaudio power allocation for near end listening enhancement,” in ITG-Fachtagung Sprachkommunikation, Bochum, Germany, Oct. 2010.
[58] ——, “Near end listening enhancement concidering thermal limit of mo-bile phone loudspeakers,” in Proc. 22. Konferenz Elektronische Sprachsig-nalverarbeitung, Aachen, Germany, Sept. 2011.
60
Bibliography
[59] C. H. Taal, J. Jensen, and A. Leijon, “On optimal linear filtering of speechfor near-end listening enhancement,” IEEE Signal Processing Letters,vol. 20, no. 3, pp. 225–228, Mar. 2013.
[60] T. E. Miller and J. Barish, “Optimizing sound for listening in the presenceof road noise,” in Proc. AES 95th Convetion, New York, NY, Oct. 1993.
[61] M. Cristoph, “Noise dependent equalization control,” in Proc. AES 48thInternational Conference, Munich, Germany, Sept. 2012.
[62] M. Tikander, M. Karjalainen, and V. Riikonen, “An augmented reality au-dio headset,” in Proc. 11th Int. Conference on Digital Audio Effects (DAFx-08), Espoo, Finland, Sept. 2008.
[63] V. Riikonen, M. Tikander, and M. Karjalainen, “An augmented reality au-dio mixer and equalizer,” in Proc. AES 124th Convention, Amsterdam, TheNetherlands, May 2008.
[64] D. Brungart, A. Kordik, C. Eades, and B. Simpson, “The effect of micro-phone placement on localization accuracy with electronic pass-throughearplugs,” in Proc. IEEE Workshop on Applications of Signal Processingto Audio and Acoustics (WASPAA), New Paltz, NY, Oct. 2003.
[65] M. Tikander, “Usability issues in listening to natural sounds with an aug-mented reality audio headset,” J. Audio Eng. Soc., vol. 57, no. 6, pp. 430–441, Jun. 2009.
[66] H. Møller, M. F. Sørensen, D. Hammershøi, and C. Jensen, “Head-relatedtransfer functions of human subjects,” J. Audio Eng. Soc., vol. 43, no. 5, pp.300–321, May 1995.
[67] J. G. Bolaños and V. Pulkki, “HRIR database with measured actual sourcedirection data,” in Proc. AES 133rd Convention, San Francisco, USA, Oct.2012.
[68] A. Härmä, J. Jakka, M. Tikander, M. Karjalainen, T. Lokki, H. Nironen,and S. Vesa, “Techniques and applications of wearable augmented real-ity audio,” in Proc. AES 114th Convention, Amsterdam, The Netherlands,Mar. 2003.
[69] T. Lokki, H. Nironen, S. Vesa, L. Savioja, A. Härmä, and M. Karjalainen,“Application scenarios of wearable and mobile augmented reality audio,”in Proc. AES 116th Convention, Berlin, Germany, May 2004.
[70] C. Dicke, J. Sodnik, and M. Billinghurst, “Spatial auditory interfaces com-pared to visual interfaces for mobile use in a driving task,” in Proc. NinthInternational Conference on Enterprise Information Systems (ICEIS), Fun-chal, Madeira, Portugal, Jun. 2007, pp. 282–285.
[71] B. F. G. Katz, S. Kammoun, G. Parseihian, O. Gutierrez, A. Brilhault,M. Auvray, P. Truillet, M. Denis, S. Thorpe, and C. Jouffrais, “NAVIG: aug-mented reality guidance system for the visually impaired,” Virtual Reality,vol. 16, pp. 253–269, 2012.
[72] M. Peltola, T. Lokki, and L. Savioja, “Augmented reality audio for location-based games,” in Proc. AES 35th International Conference, London, UK,Feb. 2009.
61

Bibliography
[73] M. Karjalainen, M. Tikander, and A. Härmä, “Head-tracking and subjectpositioning using binaural headset microphones and common modulationanchor sources,” in Proc. International Conference on Acoustics, Speech andSignal Processing (ICASSP), Montreal, Canada, May 2004.
[74] S. Vesa and T. Lokki, “Detection of room reflections from a binaural roomimpulse response,” in Proc. 9th Int. Conference in Digital Audio Effect(DAFx-06), Montreal, Canada, Sept. 2006, pp. 215–220.
[75] S. Vesa and A. Härmä, “Automatic estimation of reverberation time frombinaural signals,” in Proc. IEEE International Conference on Acoustics,Speech, and Signal Processing (ICASSP), Philadelphia, USA, Mar. 2005,pp. 281–284.
[76] S. Brunner, H.-J. Maempel, and S. Weinzierl, “On the audibility of comb-filter distortions,” in Proc. AES 122nd Convention, Vienna, Austria, May2007.
[77] A. Clifford and J. D. Reiss, “Using delay estimation to reduce comb filteringof arbitary musical sources,” J. Audio Eng. Soc., vol. 61, no. 11, pp. 917–927, Nov. 2013.
[78] W. Ahnert, “Comb-filter distortions and their perception in sound rein-forcement systems,” in AES 84th Convention, Paris, France, Mar. 1988.
[79] G. Schuller and A. Härmä, “Low delay audio compression using predictivecoding,” in IEEE Int. Conf. Acoust. Speech Signal Process., Orlando, FL,May 2002, pp. 1853–1856.
[80] A. Spanias, T. Painter, and V. Atti, Audio Signal Processing and Coding.Hoboken, New Jersey: John Wiley & Sons, Inc., 2007.
[81] H. Fletcher and W. A. Munson, “Relation between loudness and masking,”J. Acoust. Soc. Am., vol. 9, no. 1, pp. 1–10, Jul. 1937.
[82] R. F. Lyon, A. G. Katsiamis, and E. M. Drakakis, “History and future ofauditory filter models,” in Proc. IEEE International Symposium on Circuitsand Systems (ISCAS), Paris, France, Jun. 2010, pp. 3809–3812.
[83] J. Blauert, Ed., The Technology of Binaural Listening. New York:Springer-Verlag, 2013.
[84] M. R. Schroeder, B. S. Atal, and J. L. Hall, “Optimizing digital speechcoders by exploiting masking properties of the human ear,” J. Acoust. Soc.Am., vol. 66, no. 6, pp. 1647–1652, Dec. 1979.
[85] J. D. Johnston, “Transform coding of audio signals using perceptual noisecriteria,” IEEE Journal of Selected Areas in Communications, vol. 6, no. 2,pp. 314–323, Feb. 1988.
[86] K. Brandenburg and D. Seitzer, “OCF: Coding high quality audio with datarates of 64 kbit/sec,” in Proc. AES 85th Convention, Los Angeles, CA, Nov.1988.
[87] K. Brandenburg and M. Bosi, “Overview of MPEG audio: Current andfuture standards for low-bit-rate audio coding,” J. Audio Eng. Soc., vol. 45,no. 1/2, pp. 4–21, Feb. 1997.
62

Bibliography
[88] J. O. Pickles, An Introduction to the Physiology of Hearing. London, UK:Academic Press Inc., 1982.
[89] D. D. Greenwood, “Critical bandwidth and the frequency coordinates of thebasilar membrane,” J. Acoust. Soc. Am., vol. 33, no. 10, pp. 1344–1356, Oct.1961.
[90] ——, “A cochlear frequency-position function for several species–29 yearslater,” J. Acoust. Soc. Am., vol. 87, no. 6, pp. 2592–2605, Jun. 1990.
[91] G. V. Békésy, Experiments in Hearing, E. G. Wever, Ed. New York:McGraw–Hill Book Company, Inc., 1960.
[92] M. Bosi and R. E. Goldberg, Introduction to Digital Audio Coding andStandards. Boston, MA: Kluwer Academic, 2003.
[93] E. Zwicker, “Subdivision of the audible frequency range into critical bands(frequenzgruppen),” J. Acoust. Soc. Am., vol. 33, no. 2, p. 248, Feb. 1961.
[94] E. Zwicker and H. Fastl, Psychoacoustics: Facts and Models. New York:Springer-Verlag, 1990.
[95] S. van de Par, A. Kohlrausch, G. Charestan, and R. Heusdens, “A newpsychoacoustical masking model for audio coding applications,” in Proc.IEEE International Conference on Acoustics, Speech, and Signal Process-ing (ICASSP), May 2002, pp. 1805–1808.
[96] M. L. Jepsen, S. D. Ewert, and T. Dau, “A computational model of humanauditory signal processing and perception,” J. Acoust. Soc. Am., vol. 124,no. 1, pp. 422–438, Jul. 2008.
[97] H. Gockel and B. C. J. Moore, “Asymmetry of masking between complextones and noise: Partial loudness,” J. Acoust. Soc. Am., vol. 114, no. 1, pp.349–360, Jul. 2003.
[98] W. C. Miller, “Basis of motion picture sound,” in Motion Picture SoundEngineering, 6th ed. D. Van Nostrand Company, Inc., New York, 1938,ch. 1, pp. 1–10.
[99] D. A. Bohn, “Operator adjustable equalizers: An overview,” in Proc. AES6th International Conference, May 1988, pp. 369–381.
[100] Yamaha, Digital Equalizer DEQ7, Operating Manual. [Online]. Available:http://www2.yamaha.co.jp/manual/pdf/pa/english/signal/DEQ7E.pdf
[101] P. Regalia and S. Mitra, “Tunable digital frequency response equalizationfilters,” IEEE Transactions on Acoustics, Speech, and Signal Processing,vol. 35, no. 1, pp. 118–120, Jan. 1987.
[102] T. van Waterschoot and M. Moonen, “A pole-zero placement technique fordesigning second-order IIR parametric equalizer filters,” IEEE Transac-tions on Audio, Speech, and Language Processing, vol. 15, no. 8, pp. 2561–2565, Nov. 2007.
[103] H. Behrends, A. von dem Knesebeck, W. Bradinal, P. Neumann, andU. Zölzer, “Automatic equalization using parametric IIR filters,” J. AudioEng. Soc., vol. 59, pp. 102–109, Mar. 2011.
63

Bibliography
[104] J. D. Reiss, “Design of audio parametric equalizer filters directly in thedigital domain,” IEEE Transactions on Audio Speech and Language Pro-cessing, vol. 19, no. 6, pp. 1843–1848, Aug. 2011.
[105] S. Särkkä and A. Huovilainen, “Accurate discretization of analog audio fil-ters with application to parametric equalizer design,” IEEE Transactionson Audio, Speech, and Language Processing, vol. 19, no. 8, pp. 2486–2493,Nov. 2011.
[106] D. A. Bohn, “Constant-Q graphic equalizers,” J. Audio Eng. Soc., vol. 34,no. 9, pp. 611–626, Sept. 1986.
[107] S. Azizi, “A new concept of interference compensation for parametric forparametric and graphic equalizer banks,” in Proc. AES 112th Convention,Munich, Germany, May 2002.
[108] M. Holters and U. Zölzer, “Graphic equalizer design using higher-orderrecursive filters,” in Proc. Int. Conf. Digital Audio Effects (DAFx-06), Sept.2006, pp. 37–40.
[109] S. Tassart, “Graphical equalization using interpolated filter banks,” J. Au-dio Eng. Soc., vol. 61, no. 5, pp. 263–279, May 2013.
[110] Z. Chen, G. S. Geng, F. L. Yin, and J. Hao, “A pre-distortion based de-sign method for digital audio graphic equalizer,” Digital Signal Processing,vol. 25, pp. 269–302, Feb. 2014.
[111] M. Karjalainen, E. Piirilä, A. Järvinen, and J. Huopaniemi, “Comparisonof loudspeaker equalization methods based on DSP techniques,” J. AudioEng. Soc., vol. 47, no. 1-2, pp. 15–31, Jan./Feb. 1999.
[112] A. Marques and D. Freitas, “Infinite impulse response (IIR) inverse filterdesign for the equalization of non-minimum phase loudspeaker systems,”in Proc. IEEE Workshop on Applications of Signal Processing to Audio andAcoustics, New Paltz, NY, Oct. 2005, pp. 170–173.
[113] G. Ramos and J. J. López, “Filter design method for loudspeaker equaliza-tion based on IIR parametric filters,” J. Audio Eng. Soc., vol. 54, no. 12, pp.1162–1178, Dec. 2006.
[114] J. N. Mourjopoulos, “Digital equalization of room acoustics,” J. Audio Eng.Soc., vol. 42, no. 11, pp. 884–900, Nov. 1994.
[115] M. Karjalainen, P. A. A. Esquef, P. Antsalo, A. Mäkivirta, and V. Välimäki,“Frequency-zooming ARMA modeling of resonant and reverberant sys-tems,” J. Audio Eng. Soc., vol. 50, no. 12, pp. 1012–1029, Dec. 2002.
[116] A. Mäkivirta, P. Antsalo, M. Karjalainen, and V. Välimäki, “Modal equal-ization of loudspeaker-room responses at low frequencies,” J. Audio Eng.Soc., vol. 51, no. 5, pp. 324–343, May 2003.
[117] A. Carini, S. Cecchi, F. Piazza, I. Omiciuolo, and G. L. Sicuranza, “Multipleposition room response equalization in frequency domain,” IEEE Transac-tions on Audio, Speech, and Language Processing, vol. 20, no. 1, pp. 122–135, Jan. 2012.
64

Bibliography
[118] B. Bank, “Loudspeaker and room equalization using parallel filters: Com-parison of pole positioning strategies,” in Proc. AES 51st InternationalConference, Helsinki, Finland, Aug. 2013.
[119] A. Lindau and F. Brinkmann, “Perceptual evaluation of headphone com-pensation in binaural synthesis based on non-individual recordings,” J.Audio Eng. Soc., vol. 60, no. 1/2, pp. 54–62, Jan./Feb. 2012.
[120] S. E. Olive and T. Welti, “The relationship between perception and mea-surement of headphone sound quality,” in Proc. AES 133rd Convention,San Francisco, CA, Oct. 2012.
[121] S. E. Olive, T. Welti, and E. McMullin, “Listener preference for differentheadphone target response curves,” in Proc. AES 134th Convention, Rome,Italy, May 2013.
[122] ——, “Listener preferences for in-room loudspeaker and headphone targetresponses,” in Proc. AES 135th Convention, New York, NY, Oct. 2013.
[123] M. Tikander, “Usability issues in listening to natural sounds with an aug-mented reality audio headset,” J. Audio Eng. Soc., vol. 57, no. 6, pp. 430–441, Jun. 2009.
[124] D. Hammershøi and P. F. Hoffmann, “Control of earphone produced binau-ral signals,” in Proc. Forum Acousticum, Aalborg, Denmark, Jun. 2011, pp.2235–2239.
[125] P. F. Hoffmann, F. Christensen, and D. Hammershøi, “Quantitative assess-ment of spatial sound distortion by the semi-ideal recording point of hear-through device,” in Proc. Meetings on Acoustics, vol. 19, Montreal, Canada,Jun. 2013.
[126] ——, “Insert earphone calibration for hear-through options,” in Proc. AES51st International Conference, Helsinki, Finland, Aug. 2013.
[127] E. Perez Gonzales and J. Reiss, “Automatic equalization of multi-channelaudio using cross-adaptive methods,” in Proc. AES 127th Convention, NewYork, NY, Oct. 2009.
[128] Z. Ma, J. D. Reiss, and D. A. A. Black, “Implementation of an intelligentequalization tool using Yule-Walker for music mixing and mastering,” inProc. AES 134th Convention, Rome, Italy, May 2013.
[129] P. P. Vaidyanathan, Multirate Systems and Filter Banks. EnglewoodCliffs, New Jersey: Prentice-Hall, Inc., 1993.
[130] U. Zölzer and T. Boltze, “Parametric digital filter structures,” in AES 99thConvention, New York, NY, Oct. 1995.
[131] F. Fontana and M. Karjalainen, “A digital bandpass/bandstop complemen-tary equalization filter with independent tuning characteristics,” IEEESignal Processing Letters, vol. 10, no. 4, pp. 119–112, Apr. 2003.
[132] S. J. Orfanidis, “High-order digital parametric equalizer design,” J. AudioEng. Soc., vol. 53, no. 11, pp. 1026–1046, Nov. 2005.
[133] M. Holters and U. Zölzer, “Parametric recursive high-order shelving fil-ters,” in AES 120th Convention, Paris, France, May 2006.
65

Bibliography
[134] B. Bank, “Direct design of parallel second-order filters for instru-ment body modeling,” in Proc. International Computer Music Con-ference, Copenhagen, Denmark, Aug. 2007, pp. 458–465, URL:http://www.acoustics.hut.fi/go/icmc07-parfilt.
[135] B. Bank and G. Ramos, “Improved pole positioning for parallel filters basedon spectral smoothing and multi-band warping,” IEEE Signal ProcessingLetters, vol. 18, no. 5, pp. 299–302, Mar. 2011.
[136] B. Bank, “Audio equalization with fixed-pole parallel filters: An efficientalternative to complex smoothing,” J. Audio Eng. Soc., vol. 61, no. 1/2, pp.39–49, Jan. 2013.
[137] B. Bank and M. Karjalainen, “Passive admittance synthesis for sound syn-thesis applications,” in Proc. Acoustics’08 Paris International Conference,Paris, France, Jun. 2008.
[138] ——, “Passive admittance matrix modeling for guitar synthesis,” in Proc13th International Conference on Digital Audio Effects (DAFx-10), Graz,Austria, Sept. 2010, pp. 3–7.
[139] A. Härmä and T. Paatero, “Discrete representation of signals on a logarith-mic frequency scale,” in Proc. IEEE Workshop on the Applications of SignalProcessing to Audio and Acoustics, New Paltz, NY, Oct. 2001, pp. 39–42.
[140] B. Bank, “Logarithmic frequency scale parallel filter design with com-plex and magnitude-only specifications,” IEEE Signal Processing Letters,vol. 18, no. 2, pp. 138–141, Feb. 2011.
[141] A. Härmä, M. Karjalainen, L. Savioja, V. Välimäki, U. K. Laine, andJ. Huopaniemi, “Frequency-warped signal processing for audio applica-tions,” J. Audio Eng. Soc., vol. 48, no. 11, pp. 1011–1031, Nov. 2000.
[142] T. Paatero and M. Karjalainen, “Kautz filters and generalized frequencyresolution: Theory and audio applications,” J. Audio Eng. Soc., vol. 51, no.1–2, pp. 27–44, Jan./Feb. 2003.
[143] M. Karjalainen and T. Paatero, “Equalization of loudspeaker and room re-sponses using Kautz filters: Direct least squares design,” EURASIP Jour-nal on Advances in Signal Processing, vol. 2007, 13 pages, Jul. 2007.
[144] P. Alku and T. Bäckström, “Linear predictive method for improved spec-tral modeling of lower frequencies of speech with small prediction errors,”IEEE Trans. Speech and Audio Processing, vol. 12, no. 2, pp. 93–99, Mar.2004.
[145] B. Bank, “Magnitude-priority filter design for audio applications,” in Proc.AES 132nd Convention, Budapest, Hungary, Apr. 2012.
[146] ——, “Perceptually motivated audio equalization using fixed-pole parallelsecond-order filters,” IEEE Signal Processing Letters, vol. 15, pp. 477–480,May 2008, URL: http://www.acoustics.hut.fi/go/spl08-parfilt.
[147] J. A. Belloch, B. Bank, L. Savioja, A. Gonzalez, and V. Välimäki, “Multi-channel IIR filtering of audio signals using a GPU,” in IEEE InternationalConference on Acoustic, Speech and Signal Processing (ICASSP), Florence,Italy, May 2014, pp. 6692–6696.
66

Bibliography
[148] L. Savioja, V. Välimäki, and J. O. Smith, “Audio signal processing usinggraphics processing units,” J. Audio Eng. Soc., vol. 59, no. 1/2, pp. 3–19,Jan./Feb. 2011.
[149] J. A. Belloch, M. Ferrer, A. Gonzalez, F. J. Martinez-Zaldivar, and A. M.Vidal, “Headphone-based virtual spatialization of sound with a GPU ac-celerator,” J. Audio Eng. Soc., vol. 61, no. 7/8, pp. 546–561, Jul./Aug. 2013.
67

9HSTFMG*afihii+
ISBN 978-952-60-5878-8 ISBN 978-952-60-5879-5 (pdf) ISSN-L 1799-4934 ISSN 1799-4934 ISSN 1799-4942 (pdf) Aalto University School of Electrical Engineering Department of Signal Processing and Acoustics www.aalto.fi
BUSINESS + ECONOMY ART + DESIGN + ARCHITECTURE SCIENCE + TECHNOLOGY CROSSOVER DOCTORAL DISSERTATIONS
Aalto-D
D 147
/2014
Jussi Räm
ö E
qualization Techniques for H
eadphone Listening
Aalto
Unive
rsity
Department of Signal Processing and Acoustics
Equalization Techniques for Headphone Listening
Jussi Rämö
DOCTORAL DISSERTATIONS