aalborg universitet quality of packet services in umts and...
TRANSCRIPT

Aalborg Universitet
Quality of Packet Services in UMTS and Heterogeneous Networks - Objective andSubjective EvaluationTeyeb, Oumer Mohammed
Publication date:2006
Document VersionPublisher's PDF, also known as Version of record
Link to publication from Aalborg University
Citation for published version (APA):Teyeb, O. M. (2006). Quality of Packet Services in UMTS and Heterogeneous Networks - Objective andSubjective Evaluation. Aalborg Universitetsforlag. R., No. R06-1003
General rightsCopyright and moral rights for the publications made accessible in the public portal are retained by the authors and/or other copyright ownersand it is a condition of accessing publications that users recognise and abide by the legal requirements associated with these rights.
? Users may download and print one copy of any publication from the public portal for the purpose of private study or research. ? You may not further distribute the material or use it for any profit-making activity or commercial gain ? You may freely distribute the URL identifying the publication in the public portal ?
Take down policyIf you believe that this document breaches copyright please contact us at [email protected] providing details, and we will remove access tothe work immediately and investigate your claim.
Downloaded from vbn.aau.dk on: november 03, 2018
Quality of Packet Services in
UMTS and Heterogeneous
Networks
OBJECTIVE AND SUBJECTIVE EVALUATION
by
OUMER MOHAMMED TEYEB
A dissertation submitted to the Faculty of Engineering, Science and Medicine
of Aalborg University
in partial fulfilment of the requirements for the degree of
Doctor of Philosophy,
Aalborg, Denmark,
March 2007

Supervisors:
Professor Preben Mogensen, PhD.,
Aalborg University, Denmark.
Dr. Jeroen Wigard, PhD.,
Nokia Networks R&D, Aalborg, Denmark.
Associate Professor Troels B. Sørensen, PhD.,
Aalborg University, Denmark.
Meeting Chairman:
Associate Professor Per-Erik Östling, PhD.,
Aalborg University, Denmark.
Opponents:
Associate Professor Laurent Schumacher, PhD.,
University of Namur, Belgium.
Dr. Martin Kristensson, PhD.,
Nokia Networks, Finland.
Associate Professor Hans Peter Schwefel, PhD. (Opponents’Chairman),
Aalborg University, Denmark.
R06-1003
ISSN 0908-1224
ISBN 87-90834-96-8
Copyright c© 2007 by Oumer M. Teyeb. All rights reserved.


Abstract
In this thesis, the performance investigation of packet services in both a stan-
dalone UMTS network and a UMTS network coexisting with othernetworks
is undertaken. The investigations are concerned with the performance of a sin-
gle link. Apart from objective performance metrics such as goodput and delay,
subjective measures of user perceived QoS are also used. A real time emula-
tion platform that uses a combination of simulated and real network protocols
has been developed to enable both subjective and objective investigations from
the user’s perspective.
With regard to a standalone UMTS network, detailed emulation results are
given concerning the performance enhancements due to the several mecha-
nisms that control UMTS link layer retransmissions. The results show that
the maximum number of retransmissions is the most determinant factor, and
setting it to three or more eliminates TCP retransmissions and gives optimal
performance (up to 85% improvement in the goodput). The impact of TCP
spurious retransmissions and the improvements due to several proposed TCP
extensions such as Eifel are also investigated. Eifel leadsto 33% improvement
in the goodput while DSACK improves the performance by only 14% when
out of order delivery is employed at the RLC layer. However, for the delay
spike cases, the improvements are less than 9%.
The impact of inter-system handover and associated buffering techniques,
including a new technique called intermediate buffering, on different TCP
extensions when UMTS coexists with other networks are investigated. Full
buffering during handover can lead to the worst performance, as compared
with no buffering at all, and intermediate buffering gives the best result. Eifel
improves the performance when the handover delay is small and full buffer-
ing is employed, but it causes up to 34% degradation in the goodput when
v

full buffering is not used. SACK has no effect on full buffering and on cases
where timeouts occur. However, it leads to a significant drop(up to 30%) in
the goodput for the upward handover cases, and up to 11% increase in the
goodput for the downward handover cases.
Finally, usability experiments are carried out to see if there is any notice-
able trend in user perceived quality of service and if so, if the subjective mea-
sures are in line with objective measures of quality. The user’s perceived qual-
ity ratings are mostly in line with objective quality measures, justifying the
use of objective measures for quality of service investigations.
This thesis tries to give a holistic view of packet service performance by
considering the impact of different protocol layers and taking the end user into
account. Operators and service providers can make use of theresults within
this thesis to configure their network and enhance the service quality they offer
to their subscribers.
vi

Dansk Resume
Denne afhandling undersøger performance af pakkekoblede services i dels
et isoleret UMTS netværk og hvor UMTS koeksisterer med andrenetværk,
med fokus på den enkelte link. Både objektive performance mål, såsom nyt-
tekapacitet og pakkeforsinkelse på den enkelte link, og subjektive mål for
brugerens oplevelse af servicekvalitet (QoS) indgår i undersøgelsen. Til for-
målet er der udviklet en realtids emuleringsplatform som benytter en kombi-
nation af simulerede og virkelige netværksprotokoller.
For det isolerede UMTS netværk vises der detaljerede emuleringsresultater
for performance forbedringer fra flere forskellige mekanismer der kontrollerer
UMTS data linklags retransmissioner. Resultaterne viser at det maksimale an-
tal retransmissioner er den mest bestemmende faktor, og at et maksimum på tre
og derover eliminerer TCP retransmissioner og fører til optimal performance
(op til 85% forøgelse af nyttekapaciteten). Indvirkningenaf vilkårlige TCP
retransmissioner og forbedringer fra flere anbefalede TCP udvidelser, såsom
Eifel algoritmen, er også undersøgt. Eifel algoritmen fører til 33% forbedring
i nyttekapaciteten hvorimod DSACK kun forbedrer performance med 14% for
“out-of-order delivery” konfigureret i RLC laget. I tilfældet med kortvarige og
store pakkeforsinkelser er forbedringerne imidlertid mindre end 9%.
Et andet undersøgt område er indvirkningen fra intersystemhandover, og
de relaterede buffering teknikker, på de forskellige TCP udvidelser i det til-
fælde UMTS koeksisterer med andre netværk. Specielt er der undersøgt en ny
teknik benævnt “intermediate buffering”. Fuld buffering under handover kan
føre til meget lav performance sammenlignet med fravær af buffering, mens
“intermediate buffering” giver de bedste resultater. Eifel algoritmen forbedrer
performance når handover forsinkelsen er lille og fuld buffering anvendes,
men den forringer nyttekapaciteten med op til 34% når fuld buffering ikke
vii

anvendes. Brugen af SACK har ingen indvirkning på fuld buffering og i de
tilfælde hvor der forekommer TCP timeouts; dog i tilfældet med handover til
større dækning kan der forekomme en væsentlig nedgang i nyttekapaciteten på
op til 30%, og modsat en forøgelse på op til 11% for tilfældet med handover
til mindre dækning.
I tilføjelse til de objektive undersøgelser er der foretaget eksperimenter
omkring såkaldt brugervenlighed for at checke om der er nogen trend i bruger-
ens oplevelse af servicekvalitet, og i så tilfælde hvorvidtde subjektive målinger
er i overensstemmelse med de objektive målinger af kvalitet. Resultaterne
viser at brugerens oplevelse af kvalitet for det meste er i overensstemmelse
med de objektive målinger, hvilket dermed validerer brugenaf objektive må-
linger for undersøgelser af servicekvalitet.
Afhandlingen forsøger at give et holistisk billede af performance for pakke-
koblede services ved at sammenholde indvirkningen af forskellige protokollag
og ved at tage brugeren i betragtning. Operatører og serviceleverandører kan
anvende resultaterne i denne afhandling til konfigurering af deres netværk og
dermed forbedre den servicekvalitet de tilbyder deres abonnenter.
viii
Preface
This PhD. thesis is a result of a three and half years project carried out at
the Cellular Systems (CSys) division, now known as the RATE (Radio Access
Technologies) Section, in the Department of Electronic Systems, Aalborg Uni-
versity, Denmark. The research work has been conducted in parallel with the
mandatory course work, teaching and project work obligations in order to ob-
tain the PhD. Degree. The study has been supervised by Professor Preben E.
Mogensen (Aalborg University), Dr. Jeroen Wigard (Nokia Networks) and
Associate Professor Troels B. Sørensen (Aalborg University).
The research has been co-financed by Nokia Networks Aalborg R&D and
by the Future Adaptive Communication Environment (FACE) and the Center
for TeleInFrastruktur (CTIF) Perceived Quality of Servicein Heterogeneous
networks (POSH) projects at Aalborg University. Specifically, the first half of
the project that mainly deals with stand alone UMTS networksis financed by
Nokia Networks and the FACE project. The second half of the project that
is concerned with UMTS networks in a heterogeneous setting and also user
quality perception is co-financed by Nokia Networks and the POSH project.
The thesis is divided into six main parts, namely Introduction (Part I),
Background Material (Part II), UMTS (Part III), Heterogeneous networks (Part
IV), Subjective Quality (Part V), and Conclusion (Part VI).Part I introduces
the thesis and presents the overall objectives and contributions. Part II intro-
duces basic packet service provision concepts in UMTS and related protocols.
Part III presents performance results that are concerned with a stand alone
UMTS network, while Part IV focuses on results concerning UMTS network
performance in a heterogeneous environment. The impact of anetwork’s be-
haviour on user’s perceived quality of service is the subject of Part V. Finally,
Part VI gives overall concluding remarks.
ix

Throughout this report citations are in the form of “[reference number]”,
where the reference number is an entry in the bibliography which can be found
near the end of the thesis. Multiple references are cited in the form “[reference
1, reference 2;..]”. The availability of all online references has been confirmed
after the compilation of this thesis. A list of the acronyms used in this thesis
is given at the beginning. Five appendices are included at the end to provide
supporting information to the main chapters.
x

Acknowledgements
This dissertation would not have been possible without the support that I re-
ceived from many people. First of all, I would like to expressmy deepest
gratitude to my supervisors, not only for their technical guidance and advice
but also for believing in me during the most difficult parts ofthe project. I also
appreciate their being patient with me when things were not going as planned.
My thanks goes to Troels B. Sørensen, one of my supervisors, for translating
the thesis abstract into Danish.
I would like to thank the members of the assessment committeefor the
interesting discussion during the defence and the detailedcomments they pro-
vided later on which helped me a lot in the writing of this finalthesis.
I would like to thank Lisbeth Schiønning Larsen, for being always willing
to help with administrative issues.
Malek Boussif and Kovarththanan Rajaratnam provided me with valuable
programming support during the second half of this project,and for this I am
greatly indebted to them.
My special thanks goes to Bo Nygaard Bai from the Aalborg University
computer workshop for helping me in configuring the network and computers
that I used for my experiments.
I am grateful to my colleagues from Aalborg University and Nokia Net-
works R&D, Aalborg, for participating in the usability experiments that I con-
ducted during the last part of my PhD study. Specially I wouldlike to thank
Lars Bo Larsen from the speech and multimedia group for not only participat-
ing in the experiments, but also for providing me with books and several ideas
regarding usability experiments.
I would also like to thank current and former PhD students; specially Clau-
dio Rosa, Lars T. Berger, Francesco Calabrese, Mohmmad Anas, Akhilesh,
xi

Pokhariyal, Hanane Fathi, and Guillaume Monghal; for making the student
life at the university more enjoyable.
Special thanks to my friends Heidi Cruse, Michael Nielsen, Chimeg Uv-
gun Hanuscheck, Jørgen Peter Hanuscheck, Bruck Sewnet, Amare Gesesse,
Samuel Kidane, Akmal Amduka, Mammo Muchie and Fantahun Ketema for
the constant support they provided me.
Finally, I would like to thank my family, specially my sisters Kedija and
Muna, my mom “Enate” Shemsia, and my brothers Sadik and Siraj, who have
always been there for me with love and affection despite the physical distance
that separates us.
Oumer M. Teyeb
March 2007
xii
Acronyms
3G Third Generation
3GPP Third Generation Partnership Project
AC Admission Control
ACK Acknowledgement
ACR Absolute Category Rating
AM Acknowledged Mode
ANOVA Analysis of Variance
ARQ Automatic Repeat reQuest
awnd Advertised Window
BDP Bandwidth Delay Product
CCR Comparison Category Rating
CDF Cumulative Distribution Function
CDMA Code Division Multiple Access
C/I Carrier to Interference ratio
CN Core Network
CRC Cyclic Redundancy Check
CS Circuit Switched
CTIF Center for TeleInFrastruktur
cwnd Congestion Window
DCH Dedicated Channel
DCR Degradation Category Rating
DL Down Link
DLL Data Link Layer
DS Direct Sequence
xiii

DSACK Duplicate SACK
E2E End to End
EDGE Enhanced Data Rates for Global Evolution
EUTRAN Evolved UMTS Terrestrial Radio Access Network
FACE Future Adaptive Communication Environment
FACH Forward Access Channel
FACK Forward Acknowledgement
FEC Forward Error Correction
FER Frame Erasure Rate
FIN Finalise
FRTO Forward RTO Recovery
FTP File Transfer Protocol
GGSN Gateway GPRS Support Node
GPRS General Packet Radio Service
GSM Global System for Mobile communications.
H-ARQ Hybrid ARQ
HC Handover Control
HSDPA High Speed Downlink Packet Access
HSPA High Speed Packet Access
HSUPA High Speed Uplink Packet Access
IETF Internet Engineering Task Force
IP Internet Protocol
ITU International Telecommunication Union
Kbps Kilo bits per second
KHz Kilo Hertz
LC Load Control
LLC Logical Link Control
MAC Medium Access Control
Mbps Mega bits per second
MMS Multimedia Messaging
MSS Maximum Segment Size
MTU Maximum Transmission Unit
xiv
NACK Negative Acknowledgement
NodeB Base station
NRT Non Real Time
OSI Open Systems Interconnection
PC Power Control
PDCP Packet Data Convergence Protocol
PDU Protocol Data Unit
PHY Physical
POSH Perceived Quality of Service in Heterogeneous networks
PS Packet Scheduling
PS Packet Switched
QoS Quality of Service
RACH Random Access Channel
RESPECT Real-time Emulator for Service Performance Evalution of CellularneTworks
RLC Radio Link Control
RNC Radio Network Controller
RNS Radio Network Sub-system
RRC Radio Resource Control
RRM Radio Resource Management
RT Real Time
RTO Retransmission Time Out
RTT Round Trip Time
RTTVAR RTT Variation
SACK Selective Acknowledgement
SCC Successful Completion Criteria
SCTP Stream Control Transmission Protocol
SDU Service Data Unit
SIP Session Initiation Protocol
SLA Service Level Agreement
SMS Short Message Service
SN Sequence Number
xv

SNR Signal to Noise Ratio
SR Selective Repeat
SRTT Smoothed RTT
ssthresh Slow Start Threshold
SYN Synchronisation
TCP Transmission Control Protocol
TM Transparent Mode
TTI Transmission Time Interval
UE User Equipment
UL Up Link
UM Unacknowledged Mode
UMTS Universal Mobile Telecommunications System
UTRAN UMTS Terrestrial Radio Access Network
VoIP Voice over IP
WCDMA Wideband CDMA
WLAN Wireless Local Area Network
xvi

Contents
Abstract v
Dansk Resume vii
Preface ix
Acknowledgements xi
Acronyms xiii
I Introduction 1
1 Introduction 3
1.1 Evolution of Radio Access Technologies . . . . . . . . . . . . 4
1.2 Motivation . . . . . . . . . . . . . . . . . . . . . . . . . . . . 6
1.3 Objectives . . . . . . . . . . . . . . . . . . . . . . . . . . . . 9
1.4 Assessment Methodology . . . . . . . . . . . . . . . . . . . . 10
1.5 Contributions . . . . . . . . . . . . . . . . . . . . . . . . . . 12
1.6 Thesis Outline . . . . . . . . . . . . . . . . . . . . . . . . . . 14
II Background Material 17
2 Packet Service Provision in UMTS 19
xvii
2.1 The UMTS System Architecture . . . . . . . . . . . . . . . . 20
2.2 Quality of Service in UMTS . . . . . . . . . . . . . . . . . . 22
2.3 Radio Resource Management . . . . . . . . . . . . . . . . . . 24
2.4 Summary . . . . . . . . . . . . . . . . . . . . . . . . . . . . 31
3 Transmission Control Protocol 33
3.1 TCP Basics . . . . . . . . . . . . . . . . . . . . . . . . . . . 34
3.2 Congestion Control and Reliability . . . . . . . . . . . . . . . 37
3.3 Selective Acknowledgements . . . . . . . . . . . . . . . . . . 41
3.4 TCP Performance in Mobile Networks . . . . . . . . . . . . . 45
3.5 Summary . . . . . . . . . . . . . . . . . . . . . . . . . . . . 47
4 Radio Link Control Protocol 49
4.1 RLC Basics . . . . . . . . . . . . . . . . . . . . . . . . . . . 49
4.2 Reliability Provision Mechanisms in the RLC . . . . . . . . . 51
4.3 Summary . . . . . . . . . . . . . . . . . . . . . . . . . . . . 57
III UMTS 59
5 Packet Service Performance in
UMTS: Impact of RLC Parameters 61
5.1 Related Work . . . . . . . . . . . . . . . . . . . . . . . . . . 62
5.2 Theoretical Analysis . . . . . . . . . . . . . . . . . . . . . . 64
5.3 Emulation Results . . . . . . . . . . . . . . . . . . . . . . . . 76
5.4 Summary . . . . . . . . . . . . . . . . . . . . . . . . . . . . 88
6 Packet Service Performance in
UMTS: Impact of Spurious Retransmissions 91
6.1 Spurious Retransmissions . . . . . . . . . . . . . . . . . . . . 92
6.2 Related Work . . . . . . . . . . . . . . . . . . . . . . . . . . 96
6.3 Investigated Scenarios . . . . . . . . . . . . . . . . . . . . . 97
xviii

6.4 Emulation Results . . . . . . . . . . . . . . . . . . . . . . . . 98
6.5 Summary . . . . . . . . . . . . . . . . . . . . . . . . . . . . 108
IV Heterogeneous Networks 111
7 Packet Service Performance in
Heterogeneous Networks 113
7.1 Heterogeneous Networks . . . . . . . . . . . . . . . . . . . . 114
7.2 Investigated Scenarios . . . . . . . . . . . . . . . . . . . . . 118
7.3 Emulation Results . . . . . . . . . . . . . . . . . . . . . . . . 121
7.4 Summary . . . . . . . . . . . . . . . . . . . . . . . . . . . . 137
V Subjective Quality 141
8 Subjective Evaluation of
Packet Service Performance 143
8.1 Usability Test Design and Setup . . . . . . . . . . . . . . . . 144
8.2 Results . . . . . . . . . . . . . . . . . . . . . . . . . . . . . . 153
8.3 Summary . . . . . . . . . . . . . . . . . . . . . . . . . . . . 162
VI Conclusions 165
9 Conclusions and Discussions 167
9.1 Performance Impact of RLC Reliability Mechanisms on TCP. 167
9.2 Performance Impact of TCP Spurious Retransmissions . . .. 168
9.3 Performance Impact of Vertical Handover . . . . . . . . . . . 169
9.4 User Perceived Quality of Packet Services . . . . . . . . . . . 170
9.5 Future Work . . . . . . . . . . . . . . . . . . . . . . . . . . . 171
Bibliography 173
xix

VII Appendix 185
A Basic Networking Concepts 187
B Real Time Emulation Platform 191
B.1 Core components . . . . . . . . . . . . . . . . . . . . . . . . 191
B.2 Support for Heterogeneous Networks . . . . . . . . . . . . . 196
B.3 Accuracy of Results . . . . . . . . . . . . . . . . . . . . . . . 201
C Setting RLC Polling Parameters, an Example 205
D Usability Experiment Forms 209
D.1 Orientation Script . . . . . . . . . . . . . . . . . . . . . . . . 209
D.2 Questionnaire . . . . . . . . . . . . . . . . . . . . . . . . . . 210
E Example Illustrating Eifel Performance Degradation 213
xx

Part I
Introduction
1

Chapter 1
Introduction
In this thesis we investigate the quality of packet service provision in Universal
Mobile Telecommunications System (UMTS) networks. We willstart with
introductory material as well as a summary of the overall thesis objectives in
this chapter.
The purpose of a data communication network, be it local or wide area,
wired or wireless, is to enable the access of different packet services. And dif-
ferent services are characterised by different requirements in terms of a com-
bination of some key performance parameters. The most important parameters
are the required data rate, maximum tolerable delay (and itsvariation, known
as delay jitter), and the maximum acceptable information loss ratio[1] (please
refer to Appendix A for a definition of some basic networking terms).
The delay and packet loss requirements for some common services is
shown in Figure 1.1. As can be seen from the figure, services such as Voice
over IP (VoIP) are very sensitive to delays but they toleratesome packet loss.
On the other hand, services like File Transfer Protocol (FTP) can not tolerate
packet loss at all but are not that sensitive to delay. Different service categori-
sations exist based on these two basic characteristics (i.e. delay and packet
loss), the simplest being Real Time (RT) or Non Real Time (NRT). NRT ser-
vices can tolerate long delays while RT services are very sensitive to delays.
Other categorisations are described in detail in the comingchapters.
3

4 CHAPTER 1. INTRODUCTION
Com
man
d/C
ontro
l
(e.g
.te
lnet,
inte
ractiv
egam
es)
Co
nvers
atio
na
l
Vo
ice
/V
ideo
Vo
ice/V
ide
o
Messag
ing
Stre
am
ing
Messag
ing
,
Do
wn
loa
ds
(e.g
.
FT
P)
Fax
Backgro
un
d(e
.g.
Use
net)
100 ms 1 sec 10 sec 100 sec
Delay
Tra
nsactio
ns
(e.g
.
e-c
om
merc
e,
bro
wsin
g)
No
Pa
ck
et
Lo
ss
Pa
ck
et
Lo
ss
Figure 1.1: Typical delay and packet loss requirements of common services (adaptedfrom[1]).
The collective effect of service performance that determines the degree of
satisfaction of a user of a service is known as Quality of Service (QoS)[2].
It is an umbrella term that is used to cover several aspects ofthe service such
asavailability, performance, reliability andsecurity. Proper provision of QoS
means the proper matching of the network capabilities, the different require-
ments of several services, and the users (who have differentrequirements and
also different purchasing power). Through proper QoS provision, users will
get a guarantee about the services they access, in accordance with what they
are willing to pay. Operators and service providers will also be able to opti-
mise their systems to users’ need and hence increase their revenue.
1.1 Evolution of Radio Access Technologies
The mobile telecommunication industry has grown rapidly during the past few
decades, specially after the launch of Global System for Mobile Communi-
cations (GSM). GSM enabled voice traffic to go wireless and also provided
limited data services such as Short Message Service (SMS) with data rates up
to 9.6 Kilo bits per second (Kbps). During the same time, the Internet penetra-

1.1. EVOLUTION OF RADIO ACCESS TECHNOLOGIES 5
tion rate has grown tremendously, from a mere 0.4% world-wide penetration
in 1995 to 14.9% in 2005, and over 50% penetration rate in mostEuropean
countries[3]. This widespread use of the Internet has propelled the growth
of multimedia data services such as web browsing, video streaming, video
conferencing and online gaming.
The General Packet Radio Service (GPRS) added a Packet Switched (PS)
core network on GSM Circuit Switched (CS) networks, making some of the
Internet services such as Multimedia Messaging (MMS) and web browsing
accessible via mobile networks. The GPRS air interface offers a peak data
rate of 21.4 Kbps per time slot, and multiple time slots can beused by a given
user. Theoretically, 8 time slots can be used at once giving apeak data rate
of 171 Kbps, but average data rates of GPRS under realistic network load are
in the range of 30-40 Kbps[4]. The Round Trip Time (RTT) experienced by
packets within a GPRS network is in the order of 500 to 700 ms.
Enhanced Data Rates for Global Evolution (EDGE) is an add-onto GPRS
that increases the theoretical peak data rate per time slot up to 59 Kbps (8
time slots per user giving a maximum theoretical peak data rate of 474 Kbps)
using new modulation and coding schemes[5]. Under realistic network load
conditions, the average data rate offered by the EDGE air interface is around
128 Kbps, and typical RTT values range from 200 to 500 ms[6]. EDGE pro-
vides better data rates than GPRS, and hence able to provide more advanced
data services such as video telephony. However, like GPRS, it does not sup-
port multiplexing of services with different quality requirements over a single
connection, e.g. voice, video and packet data.
In order to overcome the limitations of the afore-mentionedsystems, and to
make the data services that are available on the Internet andfurthermore pro-
vide other new services, the Third Generation (3G) systems were proposed.
3G networks provide higher data rates of up to 2 Mega bits per second (Mbps)
(with average user data rates in the range of 200-300 Kbps), lower RTT values
in the range of 150 ms[7] and multiplexing of services with different quality
requirements over a single connection[8]. They offer bandwidth on demand,
and can satisfy the delay requirements from the delay-sensitive real time traf-

6 CHAPTER 1. INTRODUCTION
fic to the best effort packet data. The most widespread 3G standard is UMTS,
which is based on a Wideband CDMA (WCDMA) air interface. UMTSnet-
works are currently deployed in most of western Europe[9]. The Third Gen-
eration Partnership Project (3GPP) is in charge of the standardisation of 3G
and its evolutions.
High Speed Downlink Packet Access (HSDPA) is an evolution ofUMTS
where advanced modulation, coding, and scheduling techniques are used to
optimise the Down Link (DL) air interface utilisation basedon the channel
quality [8]. HSDPA provides lower RTT in the range of 50 ms[10] with
theoretical peak data rates of 14 Mbps, and up to 2 Mbps average data rate
under practical conditions. High Speed Uplink Packet Access (HSUPA) is
the HSDPA equivalent for the Up Link (UL), and it offers theoretical peak
data rates of up to 5.8 Mbps, with realistic average values ofup to 2 Mbps.
The combination of HSDPA and HSUPA is referred to as High Speed Packet
Access (HSPA).
With the goal of achieving a very low RTT of about 10 ms[11; 12] and
ideal peak data rates of up to 100 Mbps in the DL and 50 Mbps in the UL
(corresponding practical values in the range of 2-3 times that of HSPA), the
Evolved UMTS Terrestrial Radio Access Network (EUTRAN) standardisation
process has been started by the 3GPP[13]. The EUTRAN will be a full-
fledged PS network, and currently existing CS services have to be replaced
with their PS equivalents (for example, voice services through VoIP).
Figure 1.2 summarises the peak data rate and RTT offered by the mobile
communication systems described above.
1.2 Motivation
UMTS is one of the first mobile networks that is designed with QoS differ-
entiation in mind, and as such is more flexible towards service provision[8].
The QoS differentiation framework has already been standardised and the de-
ployment of commercial UMTS networks has already started atthe beginning

1.2. MOTIVATION 7
0 100 200 300 400 500 60010
2
103
104
105
RTT [ms]
Peak d
ata
rate
[K
bp
s]
EUTRAN
HSPA
UMTS
EDGE
GPRS
Figure 1.2: Peak DL data rates and average RTT values for different technologies.
of this PhD study[14]. Due to these reasons, the focus of this project has been
put mainly on packet service provision in UMTS rather than the other network
technologies described in the previous section.
Proper packet service provision is an interplay of several networking en-
tities and protocols working together to give the user access to services in a
transparent way. The task is even more complicated in mobilenetworks such
as UMTS as compared with wired networks due to several factors such as
the highly varying characteristics of the wireless channelresulting from inter-
ference and mobility. Packet service performance in UMTS isimproved by
using mechanisms that operate at different layers in the data communication
protocol stack (Appendix A).
At the link layer, Forward Error Correction (FEC) and Automatic Repeat
reQuest (ARQ) mechanisms are used to make the wireless link more reliable[15; 16; 8]. FEC adds redundancy to the packets that are being transmitted so
that the receiver is able to correct errors that might occur while the packet is
traversing the wireless link. ARQ, on the other hand, requests the retransmis-
sion of erroneous packets, in case FEC can not correct the errors. Simulation
based studies conducted in[17; 18; 19; 20] have shown the effectiveness of

8 CHAPTER 1. INTRODUCTION
the ARQ mechanism employed in UMTS. However, previous studies either
did not model the link layer protocol of UMTS in detail or theyused very sim-
plistic modelling for the higher layer protocols and thus protocol interactions
were not properly addressed.
Transmission Control Protocol (TCP)[21] is the most widely used trans-
port protocol in the Internet[22; 23]. Originally designed for wired networks
(based on the main assumption that packets are lost only due to network con-
gestion), TCP’s reliability and congestion control mechanisms are not optimal
for wireless networks[24]. There are several TCP extensions such as TCP
Selective Acknowledgement (SACK)[25], Duplicate SACK (DSACK) and
Eiffel [26] that try to optimise TCP’s performance in a wireless network[27;
28; 29]. Previous studies concerning the evaluation of these different TCP ex-
tensions mostly are based on very simplistic link layer models and also they
used simulated TCP stacks, which might differ considerablyfrom real world
implementations.
UMTS networks are currently (being) deployed in environments where
GPRS networks already exist and Wireless Local Area Networks (WLANs)
are becoming very accessible via WLAN hot spots in public gathering places
such as cafes[30]. Thus, inter-operability issues between UMTS and other
technologies is an area of active research[31; 32; 33; 34]. However, most
of these studies are concerned with the implementation of different handover
mechanisms that try to reduce the handover delay rather thaninvestigate the
impact that handover has on quality of packet services.
Most studies concerning packet service performance are based on simu-
lations where the QoS is identified by objective performancemetrics such as
delay and throughput. However, such studies fail to addressthe end user who
is the final judge of the service quality. And in the few studies where the user’s
subjective quality metrics are assessed, as in[35; 36; 37], the wireless network
is modelled as a simple packet intercepter (delay and/or drop packets).

1.3. OBJECTIVES 9
1.3 Objectives
The main objective of this Ph.D. study is:
"To investigate how network protocols (algorithms + parame-
ters), and network conditions affect the quality of non real time
packet data services over UMTS Release 99 networks, and to do
so from the user’s perspective."
By “user’s perspective” it is meant that the study is concerned with the per-
formance of a single connection and that we also address the user’s perceived
quality.
The objective is addressed through the investigation of:
Link layer issues: The Radio Link Control (RLC) layer of UMTS provides
a versatile ARQ mechanism and our focus is on optimising its perfor-
mance for packet services.
Transport layer issues: The focus here is to optimise the performance of
TCP by investigating TCP extensions proposed to combat performance
degradation in wireless networks, taking the UMTS link layer also into
account.
Inter-System handover: As mentioned previously, inter-operability of UMTS
with other networks is an important aspect of packet serviceperfor-
mance. As such, the focus here is the optimisation of packet service
performance in a heterogeneous network environment in which a user
may be handed over from a UMTS network to another network, or vice
versa, during a certain service session.
Subjective quality: The focus here is the investigation of the impact of the
network behaviour on the user’s perceived QoS and see if the subjective
measures map with objective quality measures.

10 CHAPTER 1. INTRODUCTION
1.4 Assessment Methodology
Evaluation of the performance of different services running over wireless net-
works can be done in several ways: mathematical analysis, simulation, live
testing, emulation or a combination.
Analytical modelling is the most logical step to get some insight on the
service performance aspects. However, it turns out to be complex even for a
network as simple as a tandem network[38]. Due to this, simplified analytical
models are mainly used as the starting point for performing simulation studies.
Simulation offers a simple solution where several scenarios can be inves-
tigated in a relatively short amount of time. Studies that focus on lower layer
issues usually employ detailed modelling of the wireless channel accompa-
nied with simplified models of higher layers, while the opposite is done for
higher layer investigations. However, widely used simulators such as NS-2[39], usually utilise abstract implementations for the whole network protocol
stack, which could differ significantly from real world implementations (e.g.
TCP versions used in NS-2 vs. Linux TCP). On top of that, simulation tools
usually ignore the effects of operating systems, other concurrently running
processes and memory overheads. This could turn out to be thebottleneck
rather than the network protocols themselves[40].
Live tests could be performed either on isolated test-beds or even on a real
network. Though live testing avoids the problem of using abstract network
protocols and entities, the fact that it is almost impossible to change the im-
plementations of the different network protocols or parameter settings just for
studying the performance of services limits the scope of this method. Perform-
ing live tests can also be very expensive1. Results are not reproducible because
of the conditions of the live network could vary considerably from one test run
to another, which makes it difficult to conduct parameter optimisation tests.
1Drive testing, where advanced test phones are driven aroundthe network while measure-ments are made are traditionally used to access quality measurements by operators. However,such tests are undertaken mostly only as a response to negative customer feedback, due to theexpenses incurred[41].

1.4. ASSESSMENT METHODOLOGY 11
Emulation uses a combination of simulated and real network protocols and
components. The parts of the network that are being evaluated are simulated
while the other parts are used as in real systems[42; 43]. The advantage of
emulation over simulation is that real End to End (E2E) QoS studies can be
performed with the aid of end users, and the advantage over live testing is that
it is cheaper, and to some extent, it allows the replication of experiments. For
these reasons, the results in this thesis are generated through emulations.
The general setup under which the results in this thesis are generated from
is shown in Figure 1.3. As can be seen from the figure, two different settings
are used during the experiments. In the first case, objectivestudies are per-
formed without the involvement of the user and in the second case end users
are involved to gather subjective results through their ratings.
Subjective
Evaluation
Objective
Evaluation
Figure 1.3: Assessment scenario.

12 CHAPTER 1. INTRODUCTION
1.5 Contributions
This PhD. study started with the design and implementation of a UMTS net-
work emulation platform using which all the investigationsin this thesis are
performed. The thesis tries to give a holistic view of packetservice perfor-
mance by considering the impact of different protocol layers and taking the
end user into account. Operators and service providers can use the results
presented in this thesis for enhancing the service quality they offer.
The main contributions of this dissertation are:
• Optimised UMTS link layer for TCP performance.The different param-
eters that govern the UMTS RLC protocol’s ARQ mechanism has been
optimised for non real time services that employ TCP. The results show
that RLC’s ARQ is very efficient. The maximum number of retransmis-
sions is the main factor that determines the performance, and setting it
to three or more eliminates TCP timeouts and gives optimal results.
• TCP settings to combat against spurious retransmissions inUMTS.The
new-Reno, SACK, DSACK, Forward Acknowledgement (FACK) and
Eifel extensions of TCP has been compared with regard to performance
in a UMTS network that is prone to spurious retransmissions caused by
packet reordering and delay spikes. Eiffel is found to be very effective
against packet reordering but the improvement against delay spikes are
not as effective.
• Enhanced TCP performance in heterogenous networks.The perfor-
mance of different TCP extensions in UMTS networks when UMTS
coexists with GPRS and WLAN networks has been investigated.A new
buffering scheme called intermediate buffering for handover is proposed
and its performance is compared with no buffering and full buffering
schemes. The results show that intermediate buffering gives the best
performance for most of the investigated cases.
• Understanding of user’s perception of packet service quality. Usability
experiments have been carried out for web browsing and streaming ser-

1.5. CONTRIBUTIONS 13
vices in standalone UMTS network and a heterogenous networkcom-
prised of UMTS and WLAN. The subjective ratings of the test users
were mapped with objective quality measures such as delay and band-
width. It is found that the different user’s ratings mostly agree with each
other, and that the subjective rating are in line with the objective mea-
sures.
The findings from this PhD. study were presented to the research commu-
nity in the following articles:
• O. Teyeb, M. Boussif, T.B. Sørensen, J. Wigard and P.E. Mogensen,
“RESPECT: A Real-time Emulator for Service Performance Evaluation
of Cellular neTworks”, in the 62th IEEE Vehicular Technology Confer-
ence (VTC), September 2005.
• O. Teyeb, M. Boussif, T.B. Sørensen, J. Wigard and P.E. Mogensen,
“Emulation Based Performance Investigation of FTP File Downloads
over UMTS Dedicated Channels”, Lecture Notes in Computer Science
(LNCS) 3420, April 2005.
• O. Teyeb, M. Boussif, T.B. Sørensen, J. Wigard and P.E. Mogensen,
“The Impact of RLC Delivery Sequence on FTP Performance in UMTS”,
the 8th International Symposium on Wireless Personal Multimedia Com-
munications (WPMC), September 2005.
• O. Teyeb, T.B. Sørensen, J. Wigard and P.E. Mogensen, “Subjective
Evaluation of Packet Service Performance in UMTS and Heterogeneous
Networks”, the 2nd ACM International Workshop on QoS and Security
for Wireless and Mobile Networks (Q2SWinet), October 2006.

14 CHAPTER 1. INTRODUCTION
1.6 Thesis Outline
The rest of this thesis is organised as follows:
Chapter 2 presents a general description of packet service provisionin UMTS
networks. Specifically, the UMTS network architecture, QoSdifferentiation,
and Radio Resource Management (RRM) are discussed. Readerswith a strong
background in UMTS could skip this chapter without loss of continuity.
Chapter 3 gives background material on the TCP protocol. The basics of
TCP data flow, reliability mechanisms such as retransmissions and congestion
control, as well as TCP SACK behaviour are given. This chapter could be
skipped by readers familiar with TCP.
Chapter 4 describes the UMTS RLC protocol. Data transmission within the
RLC and the different mechanisms that control RLC’s reliability are discussed.
Chapter 5 evaluates the impact of the RLC protocol on TCP performance.A
detailed emulation study along with a simplified analyticalmodel is presented,
using which optimal RLC parameter settings are suggested.
Chapter 6 evaluates the performance of different TCP extensions withregard
to spurious retransmissions that occur in a UMTS network. The causes of
spurious retransmissions in UMTS networks and TCP extensions that try to
mitigate their impact are discussed. The performance of these extensions are
evaluated through emulation studies.
Chapter 7 investigates the performance of packet services in UMTS when
UMTS coexists with GPRS and WLAN networks. The performance issue of
inter-system handover in heterogeneous networks is discussed. The perfor-
mance of three buffering schemes on different TCP extensions is evaluated
through emulation studies.
Chapter 8 presents the results from usability tests that were conducted to de-
termine the perceived quality of packet services in UMTS andheterogenous
networks. The design of the usability experiments are discussed followed by
the analysis of the user ratings and their mapping with objective quality mea-

1.6. THESIS OUTLINE 15
sures.
Chapter 9 summarises the main findings from this PhD study and gives an
outline of future research topics.


Part II
Background Material
17


Chapter 2
Packet Service Provision in UMTS
WCDMA is a wide band Direct Sequence (DS) Code Division Multiple Access
(CDMA) system, where user information is spread over a wide bandwidth by
multiplying the user data by spreading codes[8]. WCDMA is the air interface
of choice for UMTS. The support for variable bit rates, fast power control and
soft handover makes it possible for UMTS to support a range ofservices with
different QoS requirements.
Since this thesis is concerned about packet service performance in UMTS
Release 99, an understanding of packet service provision inUMTS networks
is pivotal to follow the rest of the report. As such, an overview of some of the
entities, protocols, and mechanisms that are necessary forproper packet ser-
vice provision within a UMTS network is given. Section 2.1 gives an overview
of UMTS system architecture. The basics of QoS differentiation in UMTS is
described in Section 2.2. Section 2.3 is about RRM in UMTS. Finally, the
main points in this chapter are summarised in section 2.4. Readers familiar
with UMTS can skip this chapter without loss of continuity.
19

20 CHAPTER 2. PACKET SERVICE PROVISION IN UMTS
2.1 The UMTS System Architecture
A simplified overview of the architecture of a UMTS network isshown in
Figure 2.1. The system consists of three major parts: User Equipment (UE),
UMTS Terrestrial Radio Access Network (UTRAN) and Core Network (CN).
The UE represents the mobile device. The UTRAN handles radiorelated func-
tions and is comprised of multiple Radio Network Sub-systems (RNSs), each
consisting Base stations (NodeBs) and a Radio Network Controller (RNC).
The NodeB is the access point to the network, and also provides limited RRM
functionality such as fast power control. The RNC, on the other hand, is the
main entity responsible for RRM1. The CN is responsible for the switch-
ing and routing of data connections to external networks andalso for keeping
databases that are used to manage users.
NodeB
NodeB
RNC
NodeB
NodeB
RNC
UTRANUE CN
Uu
IurIub
Iu
RNS
RNS
Figure 2.1: Simplified UMTS architecture[8].
The UE, UTRAN and CN are interconnected via well defined interfaces,
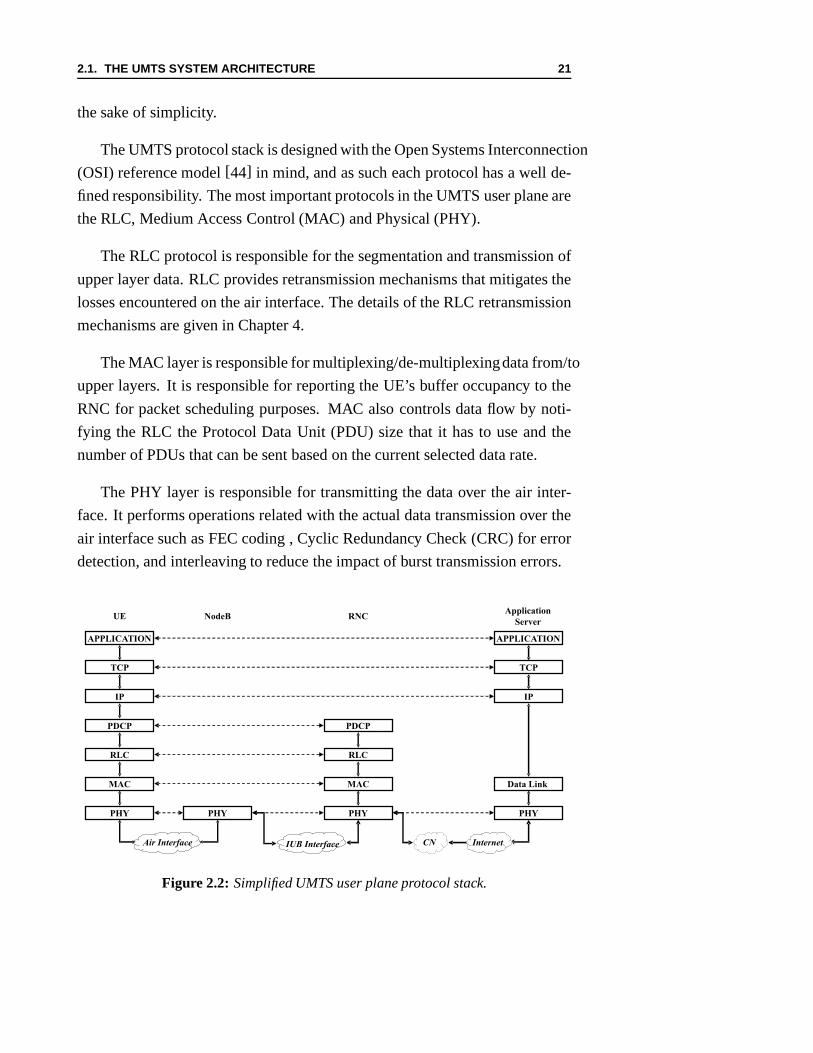
and each entity employs protocol(s) with clearly defined responsibilities. Fig-
ure 2.2 shows a simplified diagram of the protocols involved in providing a
packet service over a UMTS network, and the corresponding entities that ter-
minate these protocols. Note that the CN contains several entities such as
Gateway GPRS Support Node (GGSN) that utilise a protocol stack that can go
up to the Internet Protocol (IP) layer or higher, but they arenot shown here for
1In HSDPA, the NodeB takes over most of the RRM functionality of the RNC.
2.1. THE UMTS SYSTEM ARCHITECTURE 21
the sake of simplicity.
The UMTS protocol stack is designed with the Open Systems Interconnection
(OSI) reference model[44] in mind, and as such each protocol has a well de-
fined responsibility. The most important protocols in the UMTS user plane are
the RLC, Medium Access Control (MAC) and Physical (PHY).
The RLC protocol is responsible for the segmentation and transmission of
upper layer data. RLC provides retransmission mechanisms that mitigates the
losses encountered on the air interface. The details of the RLC retransmission
mechanisms are given in Chapter 4.
The MAC layer is responsible for multiplexing/de-multiplexingdata from/to
upper layers. It is responsible for reporting the UE’s buffer occupancy to the
RNC for packet scheduling purposes. MAC also controls data flow by noti-
fying the RLC the Protocol Data Unit (PDU) size that it has to use and the
number of PDUs that can be sent based on the current selected data rate.
The PHY layer is responsible for transmitting the data over the air inter-
face. It performs operations related with the actual data transmission over the
air interface such as FEC coding , Cyclic Redundancy Check (CRC) for error
detection, and interleaving to reduce the impact of burst transmission errors.
Air Interface
IP
PDCP PDCP
RLC
MAC
PHY
TCP
APPLICATION
UE NodeB RNC
IP
Data Link
PHY
TCP
APPLICATION
Application
Server
RLC
MAC
PHY PHY
IUB Interface CN Internet
Figure 2.2: Simplified UMTS user plane protocol stack.

22 CHAPTER 2. PACKET SERVICE PROVISION IN UMTS
2.2 Quality of Service in UMTS
One of the major advantages of UMTS, as compared to 2G systemslike GSM,
is the extended capability for supporting QoS. QoS is definedas the collective
effect of service performances which determine the degree of satisfaction of
a user[2]. In order to provide users with a given E2E QoS, UMTS uses a
layered bearer service architecture. Abearer is an information transmission
path of defined capacity, delay, bit error rate etc., and abearer serviceis a
type of telecommunication service that provides the capability of transmission
between access points[45]. The UMTS bearer service layered architecture,
as shown in Figure 2.3, consists several layers of services with the E2E ser-
vice being at the top-most layer. This service is realised bythe use of bearer
services which themselves may use underlying bearer services.
Generally, QoS management is needed because different applications have
different traffic characteristics and also differing demands on network perfor-
mance parameters such as bandwidth, delay and error rate. For example, RT
applications are very sensitive to delay, while NRT applications such as file
TE MT RAN CN
Gateway
TE
UMTS
End-to-End Service
UMTS Bearer Service
Radio Access Bearer
Service
CN Bearer
Service
UTRA
FDD/TDD
Service
Physical
Bearer
Service
TE/MT Local
Bearer Service
External
Bearer Service
Radio Bearer
Service
RAN Access
Bearer Service
Backbone
Bearer Service
CN Iu
EDGE
NODE
Figure 2.3: UMTS QoS architecture[46].

2.2. QUALITY OF SERVICE IN UMTS 23
transfer are more sensitive to transmission errors. In addition to this, users
have different quality standards, while some users may regard high resolution
as their main requirement from a video transmission, othersmay regard a high
frame rate as the most important factor. Another important characteristic of
the traffic generated by various applications is the traffic symmetry2.
In 2G systems, such as Global System for Mobile communications (GSM),
the provided QoS is fixed and not negotiable. Thus, a delay insensitive appli-
cation, such as e-mail, would consume the same amount of resources as that of
a delay sensitive voice transmission. This results in some applications having
more than enough resources allocated, while others having too few, creating an
overall inefficient system. UMTS overcomes these deficiencies by grouping
the different services under fourQoS classes(also known astraffic classes)[46; 47]:
Conversational: The conversational class is characterised by bi-directional
and almost symmetric, real-time traffic. This class is the most strin-
gent in terms of delay (max acceptable delay of 400 ms[46; 47]) and
jitter (delay variation) requirements, but it is fairly tolerant to packet
loss[46]. Services under this category include conversational voice and
videophone.
Streaming: The streaming class is characterised by an almost real-timeand
mostly unidirectional DL traffic directed to a human user. Jitter is of
the most importance here, but losses can be tolerated as in the conversa-
tional class. Streaming is also able to tolerate higher startup delays (upto
10 seconds[47]) as long as jitter is compensated through buffering[8].
Audio and video streaming fall under this class.
Interactive: The interactive class carries traffic where the user requests data
from a remote server and the response contains the requesteddata (so
there is more traffic in the UL than in the case of the streamingclass).
Web browsing, voice messaging, and E-mail (server access) fall under
2If an application needs more bandwidth for traffic in one direction than in the other direc-tion, the traffic is said to beasymmetric.

24 CHAPTER 2. PACKET SERVICE PROVISION IN UMTS
this category. Jitter is not that much of a problem in this class as com-
pared with the streaming and conversational classes. Delays of upto few
seconds are also tolerated[47].
Background: If traffic doesn’t have precise delay requirements, it is said to
be of the background class. This is usually a characteristicof applica-
tions where immediate action is not required. E-mail (server-to-server),
SMS, and file download are examples of background traffic. Themajor
requirement of this class is that data should be received without error.
Conversational and streaming traffic are collectively known as RT traffic,
while interactive and background are referred to as NRT traffic. An applica-
tion that is running on a UMTS terminal will have to decide which of these
QoS classes that it needs as well as handle any renegotiationof the QoS if
the need arises3. When a request for a certain quality is made by the user, a
database in the CN which contains user profiles is checked. Ifthe user’s sub-
scription allows the user to access the requested quality, abearer of the given
quality is established. Otherwise, the session has either to be rejected or the
user/application might have to lower its standards and require a lower quality
bearer in order to access the service.
2.3 Radio Resource Management
RRM is the proper utilisation of the radio interface resources, and therefore
plays an important role in proper QoS provision in UMTS. The main RRM
mechanisms in UMTS are[8]:
Power Control (PC): The UL/DL transmission powers are adjusted so that
no more power than the minimum necessary to guarantee the required
3In addition to the traffic class, additional bearer service attributes can be specified such asguaranteed bit rates, delivery order and transfer delay. The details of these attributes can befound in[46].

2.3. RADIO RESOURCE MANAGEMENT 25
Signal to Noise Ratio (SNR) is utilised during transmission, thereby re-
ducing interference. The near-far problem that is prevalent in CDMA
based cellular systems is avoided by using a fast power control that op-
erates at a rate of 1.5 Kilo Hertz (KHz), which is fast enough to com-
pensate fast fading on the radio link.
Handover Control (HC): By selecting the most optimum cell for a UE to
connect with, UMTS’s HC reduce interference. UMTS supportssoft
handover, which allows the UE to have multiple active links to several
NodeBs during handover, thus avoiding breaks on ongoing sessions4.
Admission Control (AC): This is a procedure performed when a UE wants
to start a session. AC checks if the admission of the new call will bring
down the quality of ongoing calls or reduce the planned coverage of the
system. If so, the new session will be rejected or is given a lower quality
than requested.
Load Control (LC): When overload situations occur, it is the responsibility
of the LC to bring the system back to target load conditions. LC ac-
complishes this using several methods such as reducing the throughput
of packet data traffic, handing over to another carrier or even drop some
low priority sessions.
Packet Scheduling (PS):PS is responsible for scheduling already admitted
NRT calls. Since PS is a very important, if not the most important,
aspect of UMTS packet service provision, its details are described in the
next sections.
2.3.1 Packet Scheduling
The core functionality of the PS in UMTS is located at the RNC,while the
NodeB and UE mostly provide measurements that affect the PS functionality.
4In hard handover, on the other hand, the connection from a certain access point has to bebroken before a new connection with another one can be formed. Inter-frequency handover(e.g. between two different cells in GSM) and Inter-system handover (e.g. UMTS to WLAN)require hard handover.

26 CHAPTER 2. PACKET SERVICE PROVISION IN UMTS
Packet scheduling is done both at theuserand thecell level.
2.3.1.1 User Specific PS
The user specific PS is concerned about allocating the propertransport chan-
nel and bit rate for a given user, considering the current traffic volume of the
concerned connection. In UMTS, there are two kinds of channels5:
Common Channels: These are mainly used for signalling but can also carry
small amount of user data. The main advantage of common channels
is that they do not require any setup time. On the downside, they do
not support soft handover (there is a break during cell reselection) and
fast power control (not spectrally efficient for sending large amount of
data). The common channel in the UL is known as Random Access
Channel (RACH), and the DL common channel is called Forward Ac-
cess Channel (FACH).
Dedicated Channel (DCH): These are bidirectional channels, though not nec-
essarily supporting the same data rate in the UL and DL. DCH supports
bit rates ranging from a few Kbps up to 384 Kbps. Fast power control
and soft handover is supported, but a setup time of around 1 second is
required before data can be transmitted on DCH.
Table 2.1 shows RTT traces gathered in January/February 2004 from an
operational UMTS network in Aalborg city using theping program6. During
the process, the UE was moved to see the effects of cell reselection. As can be
seen from the table, while using FACH, there is no setup time involved (i.e. no
substantial difference between the first two ping times in the traces). However,
when cell reselection happens (the bold line in the FACH trace), there is an
5There is also a third kind of channel calledShared Channelbut it is mainly used inHSDPA.
6RTT, as defined in Appendix A, refers to the time it takes for a packet to travel from thesender to the receiver and back, and the ping program measures exactly that. However, RTTis also the term used if the receiver is returning some other response than the original receivedpacket.

2.3. RADIO RESOURCE MANAGEMENT 27
Table 2.1: Ping traces in FACH and DCH modes.
FACH
Pinging trabant.kom.auc.dk [130.225.51.16] with 32 bytesof data:
Reply from 130.225.51.16: bytes=32 time=290 ms TTL=239
Reply from 130.225.51.16: bytes=32 time=270 ms TTL=239
Reply from 130.225.51.16: bytes=32 time=350 ms TTL=239
Reply from 130.225.51.16: bytes=32 time=301 ms TTL=239
...
Reply from 130.225.51.16: bytes=32 time=270 ms TTL=239
Reply from 130.225.51.16: bytes=32 time=1192 ms TTL=239
Reply from 130.225.51.16: bytes=32 time=371 ms TTL=239
Reply from 130.225.51.16: bytes=32 time=270 ms TTL=239
DCH
Pinging www.nokia.com [147.243.3.73] with 128 bytes of data:
Reply from 147.243.3.73: bytes=128 time=1121 ms TTL=242
Reply from 147.243.3.73: bytes=128 time=221 ms TTL=242
Reply from 147.243.3.73: bytes=128 time=190 ms TTL=242
Reply from 147.243.3.73: bytes=128 time=200 ms TTL=242
Reply from 147.243.3.73: bytes=128 time=190 ms TTL=242
increase of around 0.9 seconds, as FACH does not support softhandover (i.e.
data can not be transmitted during the cell reselection). Onthe other hand,
from the DCH traces, it can be seen that there is a setup time of0.9 seconds at
the beginning of the trace. Since there is a support for soft handover in DCH,
the RTT remains fairly constant even during cell reselection.
A UE can be either inidle or connectedmode. In the idle mode, the UE
is able to receive system information and broadcast messages. The Radio Re-
source Control (RRC) protocol is responsible for establishing the connections
between the UE and the UTRAN. The UE enters the connected modewhen
an RRC connection is established, which is basically a logical connection be-
tween the UE and the UTRAN to support data exchange between the higher
layers.

28 CHAPTER 2. PACKET SERVICE PROVISION IN UMTS
IdleMode
Cell PCH
URA PCH Con
nec
ted
mod
e
Cell FACH
Cell DCH
Figure 2.4: UE modes and RRC State Transitions[8] .
Once in connected mode, the RRC can be in different states (see Figure
2.4) depending on the resources available in the network andthe amount and
frequency of data generated from/to the UE. InCELL_DCH state a DCH
is allocated for the UE, while inCELL_FACHno DCH is allocated, and the
UE uses common channels to transmit data. When a long period of inactivity
is detected, the state changes toCELL_PCH or URA_PCH, in which case
the UE is accessible only via paging channels and no data transmission is
possible. Note that the different states are used in order toutilise network and
UE resources efficiently. CELL_PCH and URA_PCH are useful inconserving
the UE’s battery, while CELL_FACH is useful in managing network resources,
as an allocation of DCH reduces the capacity that can be allocated for other
users.
The decision whether to be in CELL_DCH or CELL_FACH state depends
on the activity level of the UE and whether there are enough resources avail-
able to allocate a DCH. Traffic volume measurements are used to decide
the activity level. Figure 2.5 gives one example of a possible implementa-
tion. In the figure, two threshold values are used: a low threshold to trigger
CELL_FACH to CELL_DCH transition and a high threshold to trigger bit rate
upgrade. When the buffer occupancy passes the lower threshold with the UE
in CELL_FACH, a transition to CELL_DCH is made. When the buffer occu-
pancy increases further and passes the upper threshold, thebit rate is upgraded.
Note that we have assumed that there is enough system capacity to allow the
CELL_DCH transition and the bit rate upgrade. When the buffer is empty for a

2.3. RADIO RESOURCE MANAGEMENT 29
Ina
ctiv
e
Bit
Ra
te
time
Bu
ffer High Threshold
FACH DCH FACH
Low Threshold
Figure 2.5: Selection between CELL_FACH and CELL_DCH states.
given period of time, known asInactivity Time, the connection is downgraded
to use the CELL_FACH mode again.
Figure 2.6 demonstrates this concept using measurement results from the
same network that was used to gather the traces in Table 2.1. Ping RTT mea-
surements are performed continuously on a live UMTS networkwhile increas-
ing the packet size from 1 to 400 bytes, and the channel being used is also
logged. From the abrupt reduction in the RTT, it can be concluded that the
CELL_FACH to CELL_DCH buffer threshold used in the network is around
250 bytes.
0
200
400
600
800
1000
1200
1400
1
20
40
60
80
100
120
140
160
180
200
220
240
260
280
300
320
340
360
380
400
Ping packet size [bytes]
RT
T[m
se
c]
Minimum RTTMaximum RTTAverage RTT
FACH DCH
Figure 2.6: Measurement results illustrating CELL_FACH to CELL_DCH transition.

30 CHAPTER 2. PACKET SERVICE PROVISION IN UMTS
2.3.1.2 Cell Specific PS
Cell specific PS deals with the sharing of NRT capacity between multiple
users, while maintaining the interference levels so that RTtraffic is not af-
fected. Basically, the cell specific packet scheduler prioritises the different
traffic in the network. Based on the traffic class,Traffic Handling Priority
(relative importance for handling of Service Data Units (SDUs) of a UMTS
bearer compared to that of other bearers) and theAllocation/Retention Prior-
ity (relative importance compared to other bearers for allocation and retention
of UMTS bearer), different traffic class priorities can be defined7. Based on
these priorities, the bit rate settings, bit rate transitions and ordering of packets
of the users (mainly having NRT traffic) will be affected.
On top of the priorities assigned for a specific traffic, different PS algo-
rithms can be used to distribute the system capacity in an efficient way. Al-
though the UMTS PS algorithms have not been standardised, here are some
well known algorithms from the open literature[48]:
Fair Throughput: Users will have equal throughput wherever they are lo-
cated, i.e. users with low Carrier to Interference ratio (C/I) will get
more resources.
Fair Resource: The same amount of power is allocated to the different users
and same amount of time is given to each user, i.e. each user gets equal
resource.
C/I based: Users with a good C/I get more priority than low C/I users. Max-
imum system capacity is attained at the expense of fairness.
7Traffic handling priority is only relevant to interactive traffic, while allocation/retentionpriority is an optional feature that can be used for all classes. Allocation/retention priority isan issue in admission control while traffic handling priority is relevant during data flow.

2.4. SUMMARY 31
2.4 Summary
This chapter has provided an overview of packet service provision in UMTS.
The UMTS system architecture along with the protocols and mechanisms for
providing proper QoS were described.
Release 99 UMTS uses centralised architecture where NodeBsare used
for accessing the network and RNCs control the radio resources. Link and
physical layer protocols are available that take care of thetransmission and
reliability details of connections. In order to facilitatethe proper provision
of QoS, UMTS allows the differentiation of different flows via traffic classes
and several other bearer parameters, using which the RNC canschedule the
different flows accordingly.
Data transmission in UMTS can be carried using either commonchannels
or dedicated channels. The choice of which channel to use depends on the
amount of data to be transmitted, and the available system capacity. While
common channels are fast and do not require setup time, they are spectrally
inefficient and hence not useful for sending large amount of data. On the other
hand, dedicated channels require a considerable setup timebut are spectrally
efficient, as they support fast power control. Hence, they are most suitable for
transmitting larger amount of data.


Chapter 3
Transmission Control Protocol
More than two decades of ongoing modifications and optimisations have made
TCP the most widespread transport protocol for computer networks. Nowa-
days, most of the Internet traffic is comprised of TCP flows. TCP averages
about 95% of the bytes, 90% of the packets, and 80% of the flows on the
Internet[22; 23]. TCP is intended for use as a highly reliable host-to-host pro-
tocol between hosts in packet switched computer communication networks[21]. TCP works on top of a non-reliable IP and it provides reliability, flow
control and congestion control along with basic data transfer. Though some
reliability can be achieved through link layer retransmissions without using
reliable transport layer protocols, link layers do not offer congestion control
mechanisms, and as such TCP remains the most viable choice for interactive
and background services in 3G and beyond networks.
In this chapter, we discuss TCP and some of its extensions. Section 3.1 de-
scribes the basics of TCP including connection establishment/termination and
data flow. The TCP congestion control mechanisms are described in Section
3.2. Section 3.3 describes the selective acknowledgement extension of TCP.
A brief overview of TCP performance in mobile networks is given in Section
3.4. Finally, Section 3.5 summarises the main points from this chapter.
33

34 CHAPTER 3. TRANSMISSION CONTROL PROTOCOL
3.1 TCP Basics
3.1.1 Connection Establishment and Termination
As mentioned earlier, TCP is intended for use as a reliable transport protocol
between two hosts. A connection has to be established between the two com-
municating hosts before data transfer ensues. Connectionsare also terminated
properly at the end of the data transfer, to make the sending and receiving ports
available for future connections. A pair of sockets, each specified by a combi-
nation of an IP address and port number, uniquely identifies aTCP connection.
A TCP packet is composed of a header and a payload. The header is normally
20 bytes long, but can be as large as 60 bytes if all optional fields are used.
TCP connection establishment is a three-way handshake procedure. Figure
3.1(a) illustrates this handshake. The host that is initiating the connection is
known as theclient and the other host is known as theserver. At the start
of a connection the client sends a Synchronisation (SYN) packet, which is
simply a TCP header with no payload and the SYN flag set. The Maximum
Segment Size (MSS), which is the largest TCP packet, excluding the header,
that the client is willing to accept is also specified in the SYN packet. When the
server receives the SYN packet, it sends its own SYN packet, with additional
information as in the case of the client’s SYN. Additionally, it appends an
Acknowledgement (ACK) to notify the client that the SYN packet that it has
sent has been received properly. The final step in establishing the connection
SYN, MSS:1024
SYN/ACK/MSS:560
ACK
SYN, MSS:1024
SYN/ACK/MSS:560
ACK
(a)Establishment
FIN
ACK
FIN
ACK
FIN
ACK
FIN
ACK
(b)Termination
Figure 3.1: TCP Connection Establishment and Termination.

3.1. TCP BASICS 35
is the client’s acknowledgement of the SYN packet sent from the server. After
this, the connection is ready for data transmission1.
When the data transmission is done, the connection termination procedure
is performed. This is shown in Figure 3.1(b). The host that wants to terminate
the connection (which can be either the client or server) sends a Finalise (FIN)
packet (a TCP header with the FIN flag set) to its peer host. When the other
end receives the FIN, it sends an ACK for the FIN. If this end has no more data
to send and also wants to terminate the connection, it sends aFIN packet (after
sending the ACK, or along with the ACK, as the ACK and FIN are specified
by setting different option fields in the TCP header)2. The first host then sends
an ACK and after some waiting (to make it possible for the ACK to be resent
in case it was lost and the other side has to retransmit the FIN), the connection
is closed.
3.1.2 TCP Data Flow
Once a connection is established properly, and before the connection is termi-
nated, data can flow between the two TCP hosts. When TCP receives data,
it checks the checksum included in the header to see if the data is error free.
If the checksum is valid, it sends an ACK3. If the checksum is not valid, the
packet is discarded. The TCP sender has a timer that it startswhen it sends
a packet; if the timer expires before it receives an ACK for that packet, the
packet is retransmitted. If the receiver gets an out of orderpacket, it resends
the ACK that was sent previously. This is called aduplicate ACKand it is used,
as will be described later, in detecting losses and triggering retransmissions.
When data flows between two communicating points, a flow control mech-
1Common channels can be used for carrying out the connection establishment handshakeas the packets involved are small (only TCP headers), but dedicated channels will be typicallyrequired for the actual data transmission.
2Note that due to the full duplex nature of TCP, a TCP connection can be "half-closed",i.e. one end can close the connection, but the other end couldstill be able to send more data.
3Some TCP implementations delay the ACK for some time. If the receiver has some datato send before this time expires, the ACK is included in that packet. Also, since the ACKs arecumulative, if a new packet is received before this timer expires, the new ACK is sent instead.
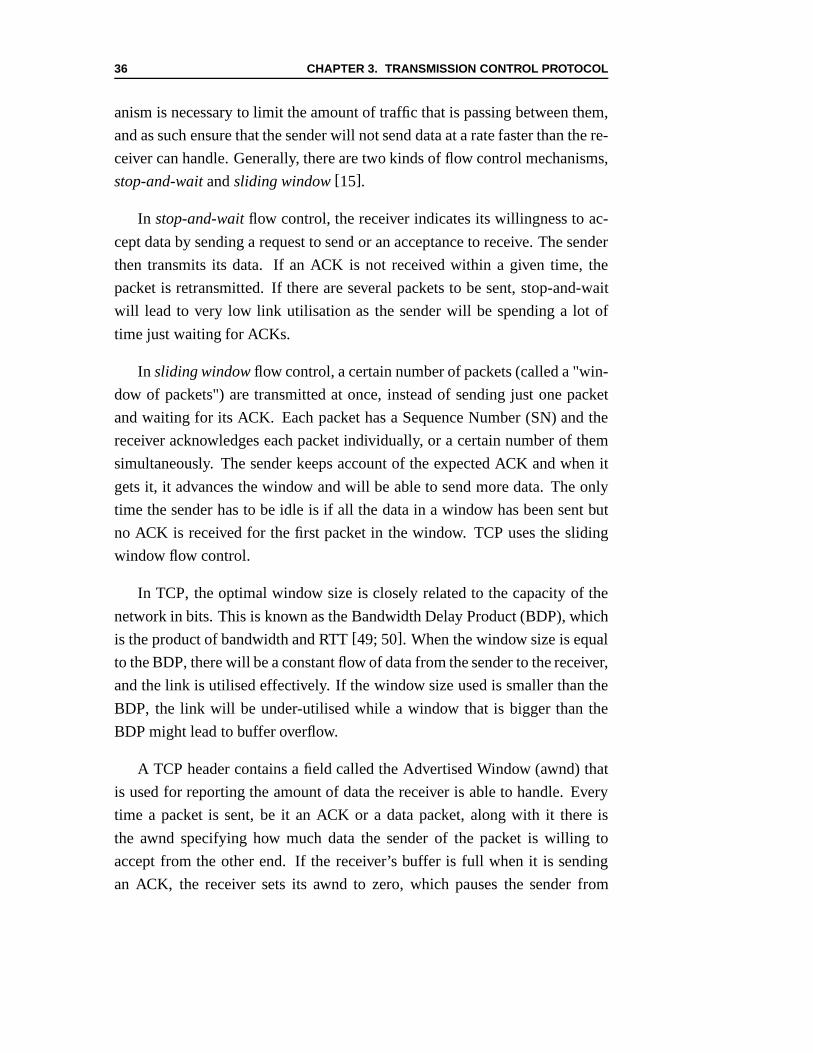
36 CHAPTER 3. TRANSMISSION CONTROL PROTOCOL
anism is necessary to limit the amount of traffic that is passing between them,
and as such ensure that the sender will not send data at a rate faster than the re-
ceiver can handle. Generally, there are two kinds of flow control mechanisms,
stop-and-waitandsliding window[15].
In stop-and-waitflow control, the receiver indicates its willingness to ac-
cept data by sending a request to send or an acceptance to receive. The sender
then transmits its data. If an ACK is not received within a given time, the
packet is retransmitted. If there are several packets to be sent, stop-and-wait
will lead to very low link utilisation as the sender will be spending a lot of
time just waiting for ACKs.
In sliding windowflow control, a certain number of packets (called a "win-
dow of packets") are transmitted at once, instead of sendingjust one packet
and waiting for its ACK. Each packet has a Sequence Number (SN) and the
receiver acknowledges each packet individually, or a certain number of them
simultaneously. The sender keeps account of the expected ACK and when it
gets it, it advances the window and will be able to send more data. The only
time the sender has to be idle is if all the data in a window has been sent but
no ACK is received for the first packet in the window. TCP uses the sliding
window flow control.
In TCP, the optimal window size is closely related to the capacity of the
network in bits. This is known as the Bandwidth Delay Product(BDP), which
is the product of bandwidth and RTT[49; 50]. When the window size is equal
to the BDP, there will be a constant flow of data from the senderto the receiver,
and the link is utilised effectively. If the window size usedis smaller than the
BDP, the link will be under-utilised while a window that is bigger than the
BDP might lead to buffer overflow.
A TCP header contains a field called the Advertised Window (awnd) that
is used for reporting the amount of data the receiver is able to handle. Every
time a packet is sent, be it an ACK or a data packet, along with it there is
the awnd specifying how much data the sender of the packet is willing to
accept from the other end. If the receiver’s buffer is full when it is sending
an ACK, the receiver sets its awnd to zero, which pauses the sender from

3.2. CONGESTION CONTROL AND RELIABILITY 37
sending more data. When more space is available in the receiver’s buffer (for
example, an application layer has finished reading the buffer), the receiver
sends the same ACK as before but with an updated awnd. This ACKis known
aswindow update. The sender resumes the data transfer in response to the
window update.
3.2 Congestion Control and Reliability
Though the sliding window mechanism avoids a fast sender from overwhelm-
ing a slow/busy receiver, it is not concerned with the current network con-
gestion level. Hence, the sender can end up using a window size that is
appropriate for the receiver but that might cause congestion in the network.
TCP uses congestion control mechanisms to make sure the datarate that is
used is within the limits of the current network congestion level [49; 51;
52].
3.2.1 Slow Start
Slow start is a probing algorithm that is used by TCP to measure the link
capacity and network’s congestion state. Basically, it means that TCP starts
sending small amount of data and starts increasing its sending rate based on
the rate of ACK reception. TCP uses a parameter called Congestion Window
(cwnd) to control congestion. In the beginning of slow start, the cwnd is set
to one4, and it is incremented by one whenever an ACK acknowledging the
reception of a new packet is received.
Actually, the term slow start is a misnomer, as slow start leads to expo-
nential increase in the amount of data that is being sent. This is illustrated in
Figure 3.2. The sender uses theminimumof the cwnd and the awnd as the win-
dow size for the sliding window mechanism. The main drawbackto slow start
4In [24], initial window sizes of upto four packets is suggested, butthis has impact onlyon the transfer of small data.

38 CHAPTER 3. TRANSMISSION CONTROL PROTOCOL
0 5 10 15 20 25 30 35 400
5
10
15
20
25
30
35
40
Time [#RTT]
CW
ND
[# P
ackets
]
SS= Slow Start CA= Congestion Avoidance
TO= Time Out TDA= Triple Duplicate ACKs
FR= Fast Retransmit
SSTHRESH
CA
TO
CA
TDA
FR
CA
SSSS
Figure 3.2: TCP Congestion Control.
is the amount of time that is required during start up before full network utili-
sation is reached. If the amount of data that is being transmitted is small, or if
the RTT is large, the effective bandwidth of the link is reduced considerably.
3.2.2 Congestion Avoidance
Congestion avoidance is a congestion control mechanism that is closely inter-
linked with slow start. Congestion avoidance adds another variable called the
Slow Start Threshold (ssthresh). At the start of a TCP connection, cwnd is
set to 1, while ssthresh is set to a high value[49]. Whenever an ACK arrives,
and if the cwnd is less than ssthresh, the TCP connection is still in slow start
phase, and the cwnd is incremented by one. On the other hand, if the cwnd is
larger, TCP enters congestion avoidance phase, which makesthe cwnd’s incre-
ment linear instead of exponential. This is usually accomplished by increasing
the cwnd by one every RTT instead of every time an ACK is received [52;
49]). Several occurrences of congestion avoidance are shown inFigure 3.2.
For example, at the 6th RTT, the cwnd becomes equal to the ssthresh and TCP

3.2. CONGESTION CONTROL AND RELIABILITY 39
enters a congestion avoidance phase.
3.2.3 Retransmissions
Reliability and congestion control are tightly coupled in TCP because TCP
assumes the main reason for packet losses to be congestion and detection of
a loss invokes a congestion control procedure. As mentionedearlier, if an
ACK for a packet is not received within a certain time, TCP retransmits the
packet. The amount of time TCP waits before retransmitting an unacknowl-
edged packet is known as Retransmission Time Out (RTO). The RTO is based
on the RTT. Different networks have different RTT, and even in a given con-
nection, due to the variability of the traffic within the network, the queueing
delay and the variability of the packet sizes used, the RTT varies from time to
time. Therefore, the RTT determination, and hence the RTO should be adap-
tive. The most widely used RTO estimation is the one that is proposed in[53].
The RTO is initially set to 3 seconds, and TCP uses two intermediate vari-
ables known as Smoothed RTT (SRTT) and RTT Variation (RTTVAR) to up-
date it for each RTT sample. When the first RTT sample is gathered, the SRTT
is set to the measured RTT, the RTTVAR is set to half of that, and the RTO is
set to three times the measured RTT. Afterwards, the variables are updated for
each incoming sample (R(i)) using the following equations5:
RT TVAR(i) =34×RTTVAR(i −1)+
14×|SRTT(i −1)−R(i)| (3.1)
SRT T(i) =78×SRTT(i −1)+
18×R(i) (3.2)
RTO(i) = max(SRT T(i)+4×RTTVAR(i),1) (3.3)
5In practice, the RTO is usually not allowed to be lower than a certain value. In manyoperating systems, the lower limit for the RTO is around 1 sec(as shown in Equation 3.3),while Linux allows a 200 ms RTO[54].

40 CHAPTER 3. TRANSMISSION CONTROL PROTOCOL
The ssthresh is set to half the amount of outstanding data (i.e. number
of bytes between the timed out packet and the last transmitted packet) , and
the cwnd is set to 1 after a time out, as shown in Figure 3.2 at the 11th RTT.
This is because TCP assumes a timeout to be a good indication of network
congestion, and starts the probing process all over again.
When a timeout occurs, TCP doubles the RTO before retransmitting the
unacknowledged packet[53]. If a timeout occurs again, the RTO is doubled
again. This continues potentially until the RTO reaches a limit around one
minute in most implementations[49], after which it is kept fixed. This tech-
nique is known asexponential back-offand is essential in keeping the network
stable when sudden overload causes packets to be dropped. Eventually, if there
is still no successful reception after a certain time, 2-9 minutes depending on
the TCP implementations, the connection is reset[49].
3.2.4 Fast Retransmission and Fast Recovery
When TCP receives three or more duplicate ACKs in a row (due topacket
loss or heavy reordering in the path), it assumes that the concerned packet
is lost and it will retransmit it, even if the retransmissiontimer is below the
RTO. This is known asfast retransmission. The basic version of TCP that
implements the functions of slow start, congestion avoidance and fast retrans-
mission is known as TCPTahoe[55]. In Tahoe, the sender acts the same way
after fast retransmission as in the case of a timeout, i.e. slow start after adjust-
ing the ssthresh and cwnd.
A duplicate ACK is an indicator of possible network congestion but it is
not as strict as a timeout. If the receiver is sending duplicate ACKs, it is
because it is getting packets with higher SN than the missingpacket, i.e. there
is still some room in the path for data flow. TCPRenois an improvement of
Tahoe that utilises this fact[55]. After fast retransmit Reno enters congestion
avoidance phase instead of slow start.
Reno also enhances Tahoe by addingFast Recovery. The duration between

3.3. SELECTIVE ACKNOWLEDGEMENTS 41
the retransmission of a packet due to triple duplicate ACKs and the arrival of a
non duplicate ACK signifying the reception of the concernedpacket is known
asrecoveryperiod. On entering the fast recovery phase, Reno sets the ssthresh
to half of the outstanding data, and cwnd is set tossthresh+ 3. The cwnd is
increased by three because each duplicate ACK is interpreted as an indication
of a packet reaching the destination. For each duplicate ACKthat arrives
during the recovery period the cwnd is incremented by one, making Reno’s
cwnd to inflate temporarily. This will make it possible for Reno to send new
data while waiting for an ACK for the retransmitted packet. When a non-
duplicate ACK arrives (i.e. the missing packet is properly received now), cwnd
will be set to ssthresh. In Figure 3.2 at the 25th RTT, triple duplicate ACKs
were received and the sender enters the recovery phase, where the cwnd, is
inflated for a while for each incoming duplicate ACK. When theACK for the
retransmitted packet is received at the 26th RTT, the cwnd is deflated back to
the ssthresh value and congestion avoidance is resumed.
If multiple packets are dropped, TCP Reno leads to multiple fast retrans-
mits (which means a considerable reduction in the cwnd) or even to a timeout
if the multiple losses occur within a window of data[55]. This is because in
Reno, the recovery phase is left by the reception of any ACK that acknowl-
edges new data, even though that does not acknowledge all theoutstanding
packets at the start of the fast recovery. TCPnew-Renois an enhancement of
TCP Reno that avoids this problem by making sure that the recovery phase
is not exited unless all the packets that were outstanding when the recovery
phase is entered are ACKed[55; 56].
3.3 Selective Acknowledgements
As discussed earlier, the original TCP standard ([21]) and the enhancements
Tahoe, Reno and new-Reno use cumulative ACKs, in which only in-sequence
delivered packets are acknowledged, and a packet that is delivered out of se-
quence leads to the generation of a duplicate ACK of the last in-sequence
received packet. When multiple packets are lost within a window of data or

42 CHAPTER 3. TRANSMISSION CONTROL PROTOCOL
when the window size is small, there will not be enough duplicate ACK to
trigger fast retransmission, so TCP has to wait for a timeoutbefore retrans-
mitting a packet. On top of that, already sent packets with higher SN than the
one that caused the timeout are resent, as the TCP sender is not aware of out
of sequence packets that are delivered properly. A retransmission mechanism
is referred to as aGo-back-Nif the loss of packetN will lead to the retrans-
mission of every packet with SN greater than N even if they were properly
received. TCP’s retransmission is not a pure go-back-N as such, since the re-
ceiver keeps the out of sequence packets in its buffer and when the lost packet
is received, it cumulatively acknowledges all the packets.
With SACK [25], the receiver can inform the sender about all packets that
have arrived successfully, whether they are received in or out of sequence. In
this way, the sender have to retransmit only the packets thathave been lost.
SACK uses a TCP option that is comprised of a set of ordered pairs of left and
right edge block numbers that specify the sequence numbers of the packets
that were received properly. One left-right edge pair takes8 bytes (4 bytes for
one sequence number) and there will be an overhead of 2 bytes for identifying
the option is the SACK option. Thus, a maximum of four left-right edge pairs
can be put in a TCP header (4*8 +2 = 34), as the maximum size of TCP options
is 40 bytes in a given TCP header6.
The operation of SACK is better illustrated with an example taken from[25]. Suppose 8 packets were sent, each containing 500 bytes, andthe first
packet has a sequence number of 5000. The second, fourth, sixth and eighth
packets were lost. Table 3.1 shows the resulting SACK blocksunder this con-
dition. When the third packet is received, there is one out oforder received
packet, and this leads to the creation of one SACK block signifying this ac-
cepted packet, while the cumulative ACK remains the same as before. The
situation is similar for the other cases of lost packets, andwhen the seventh
packet is received, there are three SACK blocks signifying the three out of
sequence received packets (i.e. packets 3, 5 and 7). Then thesecond packet
was retransmitted (due to three duplicate ACKs reception),but it was delayed
6There are some proposals to include more than 4 SACK blocks byusing offsets thatrequire less space instead of the full SN[57].

3.3. SELECTIVE ACKNOWLEDGEMENTS 43
Table 3.1: Example of SACK operation ([25]).TriggeringPacket
ACK FirstLeftEdge
FirstRightEdge
SecondLeftEdge
SecondRightEdge
ThirdLeftEdge
ThirdRightEdge
5000 5500
5500 (lost)
6000 5500 6000 6500
6500 (lost)
7000 5500 7000 7500 6000 6500
7500 (lost)
8000 5500 8000 8500 7000 7500 6000 6500
8500 (lost)
5500 (delayed)
6500 5500 6000 7500 8000 8500
5500 7500 8000 8500
7500 8500
8500 9000
in some network element, and the retransmission of the fourth packet reaches
the receiver first. At this point, only two SACK blocks are needed because the
arrival of the fourth packets has made blocks 2 and 3 to be contiguous. The
rest of the table follows a similar pattern.
The congestion control mechanism employed in TCP SACK is similar to
new-Reno’s, the main difference being selective acknowledgements are used
to infer which data should be transmitted[58]. The estimate of the number of
outstanding packets is stored in a variable called apipe, and data can be trans-
mitted only when the cwnd is greater than the pipe. When a triple duplicate
ACK is received the loss recovery state is entered and the packet indicated by
the duplicate ACK is retransmitted. Subsequent retransmission will only be
done for those packets that are not SACKed, and the loss recovery phase is
not left until all packets that were already sent when the recovery phase was
entered are ACKed. In the case of a timeout, SACK informationgathered so
far is purged and a slow start is initiated[58].
Forward Acknowledgements FACK is an extension of SACK where the
sender TCP keeps additional variables that keep track of thetotal number of
outstanding data in the network[59]. By using the SN in the SACK blocks

44 CHAPTER 3. TRANSMISSION CONTROL PROTOCOL
and by counting the retransmitted packets, FACK estimates the total number
of outstanding data as:
outstanding= snd.next−snd. f ack+ retran_data (3.4)
wheresnd.next is the SN of the first packet that is yet to be transmitted
for the first time,snd. f ack is the SN of the packet next to the forward most
acknowledged packet, andretran_data is the number of outstanding retrans-
missions.
Data will be sent while the cwnd is greater than the outstanding data. And
apart from waiting for three duplicate ACKs and timeouts, retransmissions are
triggered also when the reassembly queue is more than 3 packets long, i.e.
there are more than three packets between the one referred bythe snd. f ack
and the one referred by the cumulative ACK.
During recovery period (when the receiver is holding non-contiguous data),
cwnd is kept constant, and when recovery ends, TCP enters congestion avoid-
ance (as described in 3.2.2). Since FACK controls the outstanding data in the
network more accurately, it is less bursty than normal TCP orSACK and can
recover from episodes of heavy loss in a better way[59].
Duplicate SACK In the original SACK specification ([25]), nothing was
specified regarding the action to be taken when duplicate packets are received.
DSACK is an extension of SACK where the first SACK block is usedto report
the SN of duplicated packets[60]. A DSACK enabled TCP sender is then
able to infer that the duplicate ACK is not due to the reception of a new out
of order packet, and hence refrain from mistakenly enteringthe fast retransmit
or fast recovery states. By analysing received DSACK blocks, the sender is
also able to distinguish between different sources of duplicate packets such
as replication by the network, false retransmit due to reordering, retransmit
timeout due to ACK loss, and early retransmit timeout due to asmall RTO
value.

3.4. TCP PERFORMANCE IN MOBILE NETWORKS 45
Table 3.2: DSACK identifying an ACK loss ([60]).Received Packet Acknowledgement Sent First SACK block
5000 5500 (ACK lost) -
5500 6000 (ACK lost) -
6000 6500 (ACK lost) -
6500 7000 (ACK lost) -
timeout
5000 7000 5000-5500
An example illustrating the difference between SACK and DSACK is il-
lustrated in Table 3.2, which is taken from[60]. The packets are of 500 bytes
long, and the first packet has a sequence number of 5000. As canbe seen
the first three ACKs were dropped, and the sender times out andretransmits
the first packet again. DSACK reports this duplicate reception by including
the packet that was duplicated in the first SACK block, even though the cu-
mulative ACK field already included the duplicate packet. Ifno DSACK was
used, only the cumulative ACK will be sent. Since there is a DSACK block
identifying duplicate packet reception after a timeout, the sender is able to find
out that the no data blocks were actually lost. It can use thisinformation, for
example, to undo the reduction of the congestion window due to slow start.
3.4 TCP Performance in Mobile Networks
As described in the previous sections, the main features of TCP are its well-
designed flow and congestion control mechanisms, which operate on top of its
provision of reliability. However, these TCP mechanisms were designed under
the assumption that packet losses are only due to network congestion. This
assumption holds for wired networks, as packet losses are mainly attributed
to buffer overflows caused by congestion. However, in mobilenetworks, the
wireless links are prone to interference which leads to packet corruption. Also,
mobility can cause sudden outages and the need to handover toanother access
point which might lead to loss of packets.
The losses due to interference and mobility are interpretedas congestion

46 CHAPTER 3. TRANSMISSION CONTROL PROTOCOL
losses by TCP and TCP tries to mitigate the problem by reducing the conges-
tion window as described previously. Doing so will lead to under utilisation
of the link bandwidth resulting in significant degradation in the performance.
Figure 3.3 illustrates the performance degradation of TCP due to packet
loss. The result is generated by downloading a 1 Mbyte file several times, and
randomly dropping packets at different rates. It can be seenfrom the figure
that the packet drop rate has a major impact, a 10% rate leading to more than
a 30-fold increase in the download time.
Several methods have been proposed to improve the performance of TCP
over wireless networks. The recommendations usually fall into one of the fol-
lowing three categories (please refer to[27; 28; 29] and the references therein
for a description and comparison of some of the well known methods):
• Link Layer: Recommendations under this category try to make the link
layer more reliable, and thereby reduce packet corruption,through error
recovery mechanisms such as FEC and ARQ.
0 1 5 10 201
10
100
Packet Drop Rate [%]
No
rmalised
Do
wn
load
Tim
e
Figure 3.3: TCP performance in the presence of packet errors.

3.5. SUMMARY 47
• End-to-End: The recommendation under this category are concerned
with modifying the TCP implementation at the sender and/or receiver
and/or intermediate routers, or optimising the parametersused by the
TCP connection.
• Split Connection: The methods under this category try to separate the
TCP running on the wireless link from the one that is running on the
wired link. The optimisation procedure can then be done separately on
the wired and wireless parts.
3.5 Summary
During NRT packet data transmission over UMTS, the transport protocol of
choice is TCP. TCP is a reliable transport layer protocol. Itenforces reliability
by acknowledging properly received data and retransmitting unacknowledged
data. A TCP connection has to be established before data transmission can
ensue and when data transfer is finished, the connection is terminated.
TCP controls the flow of data between the two communicating hosts so
that a fast sender will not overwhelm a slow receiver and the overall network
will not be congested. TCP does so by using the mechanisms of slow start and
congestion avoidance. During the initial stages of data flow, small data will
be sent, and for each acknowledgement that the sender gets, the amount of
data to be sent is increased by one packet. This is known as slow start. When
the sender’s output window reaches a certain threshold level, the congestion
avoidance phase is entered and the exponential increase is slowed to a linear
one.
When a timeout occurs before the reception of an acknowledgement for
a packet, TCP retransmits the packet and the sender’s windowis reduced as
TCP assumes a timeout to be an indication of network congestion. When
multiple duplicate ACKs are received, TCP retransmits the data instead of
waiting for a timeout. By oscillating between higher and lower congestion
window size, TCP is able to maintain the congestion in the communication
48 CHAPTER 3. TRANSMISSION CONTROL PROTOCOL
link at an acceptable level.
Several extensions of the original TCP specification exist,and they mainly
try to optimise TCP’s behaviour during congestion/packet loss recovery. Tahoe,
Reno, new-Reno and SACK are some of the most notable TCP versions.
In wireless networks, TCP’s mistaken inference of packet drops due to
link errors as congestion losses and the subsequent reduction in the congestion
window leads to performance degradation. Adding reliability to the link layer,
modifying the TCP implementation or even using separate TCPconnections
in the wired and wireless part of the network are the main recommendations
to mitigate this problem.

Chapter 4
Radio Link Control Protocol
According to the OSI reference model (Appendix A) the Data Link Layer
(DLL), also known as layer 2, is responsible for providing functional and pro-
cedural means to transfer data between network entities andto detect and pos-
sibly correct errors which may occur in the PHY layer[44]. The DLL is usu-
ally divided into two components: the Logical Link Control (LLC) and MAC.
The LLC is responsible for the reliable transfer of upper layer data between
two directly connected nodes in the network, while the MAC control access to
the media at any given time. In UMTS, the LLC is known as the RLC[61].
This chapter is devoted to the description of RLC and its reliability mech-
anisms. Section 4.1 describes the basics of RLC, mainly focusing on the data
transmission aspects. The different RLC reliability mechanisms are described
in Section 4.2. Finally Section 4.3 summarises the main points from this chap-
ter.
4.1 RLC Basics
The RLC provides segmentation and assembly for variable length upper layer
SDUs. The inter-arrival time between data blocks from the MAC to the PHY
is known as Transmission Time Interval (TTI). On the sender side, during
49
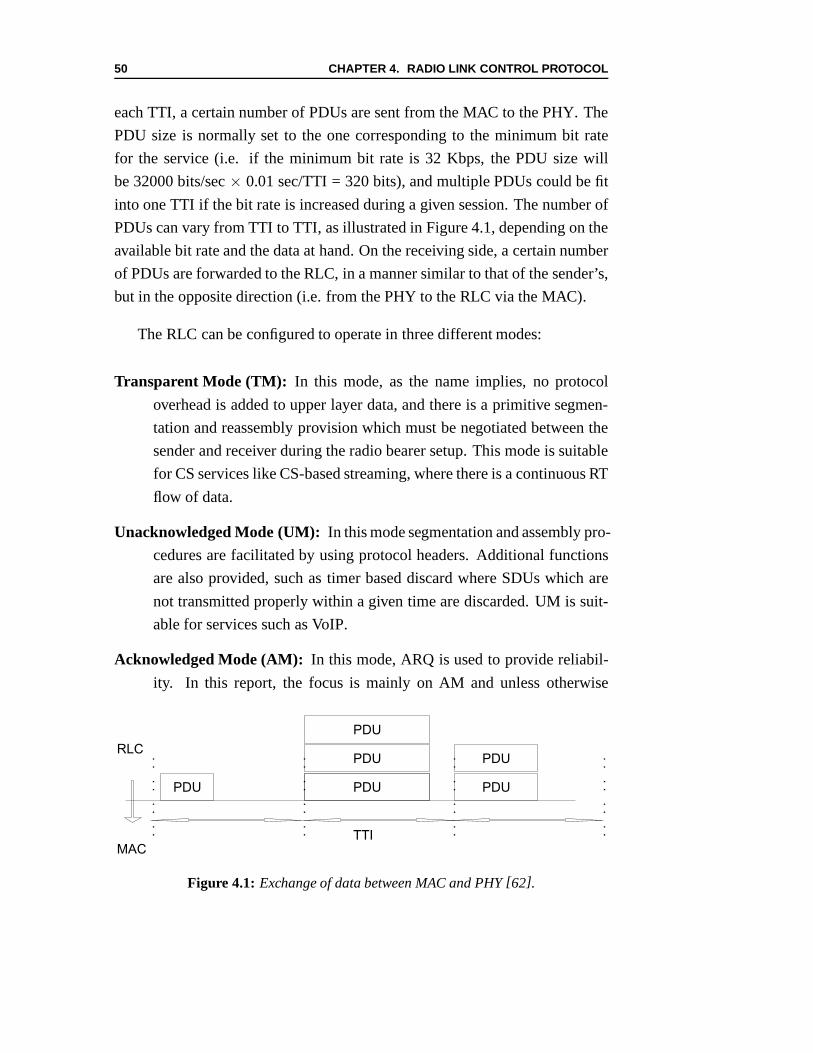
50 CHAPTER 4. RADIO LINK CONTROL PROTOCOL
each TTI, a certain number of PDUs are sent from the MAC to the PHY. The
PDU size is normally set to the one corresponding to the minimum bit rate
for the service (i.e. if the minimum bit rate is 32 Kbps, the PDU size will
be 32000 bits/sec× 0.01 sec/TTI = 320 bits), and multiple PDUs could be fit
into one TTI if the bit rate is increased during a given session. The number of
PDUs can vary from TTI to TTI, as illustrated in Figure 4.1, depending on the
available bit rate and the data at hand. On the receiving side, a certain number
of PDUs are forwarded to the RLC, in a manner similar to that ofthe sender’s,
but in the opposite direction (i.e. from the PHY to the RLC viathe MAC).
The RLC can be configured to operate in three different modes:
Transparent Mode (TM): In this mode, as the name implies, no protocol
overhead is added to upper layer data, and there is a primitive segmen-
tation and reassembly provision which must be negotiated between the
sender and receiver during the radio bearer setup. This modeis suitable
for CS services like CS-based streaming, where there is a continuous RT
flow of data.
Unacknowledged Mode (UM): In this mode segmentation and assembly pro-
cedures are facilitated by using protocol headers. Additional functions
are also provided, such as timer based discard where SDUs which are
not transmitted properly within a given time are discarded.UM is suit-
able for services such as VoIP.
Acknowledged Mode (AM): In this mode, ARQ is used to provide reliabil-
ity. In this report, the focus is mainly on AM and unless otherwise
PDU PDU
PDU
PDU
PDU
PDU
TTI
RLC
MAC
Figure 4.1: Exchange of data between MAC and PHY[62].

4.2. RELIABILITY PROVISION MECHANISMS IN THE RLC 51
specified, by RLC it is meant RLC operating in AM. RLC’s reliability
mechanism is described in the latter sections.
During data transmission, the RLC on the sender side receives SDUs from
the upper layer. Each SDU is segmented into RLC PDUs or concatenated with
others if its size is not big enough to be put into one PDU. EachPDU is given
a unique SN. The PDUs are then put in a transmission buffer andscheduled
for transmission. Each TTI, the MAC specifies the amount of data that can be
sent by the RLC. The RLC complies by sending a given number of PDUs to
the MAC, which are then forwarded to the PHY and to the air interface.
On the receiver side, the RLC receives PDUs from the MAC alongwith
their error status, which is checked by the PHY layer using a CRC. The re-
ceived PDUs are kept in the reception buffer, until all the PDUs that comprise
the whole SDU are received, at which point the SDU is assembled. Assembled
SDUs are forwarded to upper layers depending on the setting of the parameter
in-sequence delivery. If in-sequence delivery is set tof alse, assembled SDUs
are immediately forwarded to upper layers. On the other hand, if in-sequence
delivery is set totrue, the forwarding depends on the order of arrival of the
SDUs, i.e. an SDU that is not assembled sequentially has to wait in the re-
ceive buffer till the intermediate SDUs have been assembledand forwarded
successfully.
4.2 Reliability Provision Mechanisms in the RLC
Depending on the number of different QoS settings during a session, multiple
RLC entities can coexist (e.g. using voice and web sessions simultaneously).
Each RLC entity has a receiving and a sending side. An overview of RLC’s
reliability mechanism is shown in Figure 4.2. When the RLC entity is send-
ing data, the sender side is responsible for transmitting the data, while the
receiver side is responsible for receiving status information regarding the sent
PDUs. During data reception, the receiver side is responsible for receiving
the sent PDUs and the transmitting side sends status information regarding the
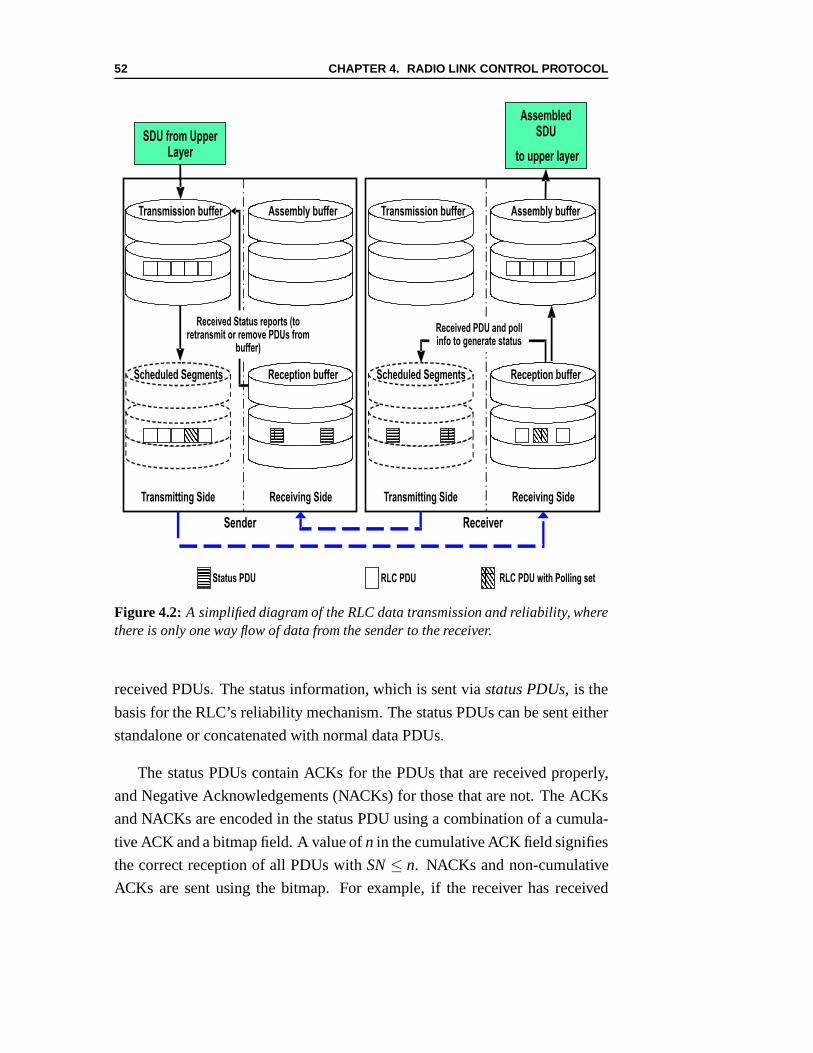
52 CHAPTER 4. RADIO LINK CONTROL PROTOCOL
SDU from UpperLayer
Transmitting Side
Status PDU RLC PDU RLC PDU with Polling set
Receiving Side
AssembledSDU
to upper layer
Assembly bufferAssembly buffer
Reception bufferReception bufferScheduled Segments
Transmission buffer
Received Status reports (toretransmit or remove PDUs from
buffer)
Transmitting Side Receiving Side
Assembly bufferAssembly buffer
Reception bufferReception bufferScheduled Segments
Transmission buffer
Received PDU and pollinfo to generate status
Sender Receiver
Figure 4.2: A simplified diagram of the RLC data transmission and reliability, wherethere is only one way flow of data from the sender to the receiver.
received PDUs. The status information, which is sent viastatus PDUs, is the
basis for the RLC’s reliability mechanism. The status PDUs can be sent either
standalone or concatenated with normal data PDUs.
The status PDUs contain ACKs for the PDUs that are received properly,
and Negative Acknowledgements (NACKs) for those that are not. The ACKs
and NACKs are encoded in the status PDU using a combination ofa cumula-
tive ACK and a bitmap field. A value ofn in the cumulative ACK field signifies
the correct reception of all PDUs withSN≤ n. NACKs and non-cumulative
ACKs are sent using the bitmap. For example, if the receiver has received

4.2. RELIABILITY PROVISION MECHANISMS IN THE RLC 53
PDUs #1,2,4,6 but not PDUs #3 and 5, it will put 2 in the cumulative ACK
field and the values[0,1,0,1] in the bitmap field of the status PDU, where a 0
refers to a NACK and a 1 refers to a non-cumulative ACK. Statusreporting is
triggered by the sender, the receiver or both.
4.2.1 Sender Triggered Status Reporting: Polling
The sender triggers status reporting by setting apolling bit in some of the
PDUs that it sends. Examples demonstrating the different polling mechanisms
in RLC are shown in Figure 4.3. The details of the different polling mecha-
nisms cases illustrated in the figure is given below.
Poll last PDU and Poll last retransmitted PDU If Poll last PDU is set, the
last PDU in the transmission buffer or window that is sent forthe first time
will be polled. In Figure 4.3(a), PDU #4 is the last PDU in the buffer and it is
polled when it is sent at TTI #5.Poll last retransmitted PDUis similar to poll
last PDU, except that it applies only to retransmitted PDUs.At TTI #10, the
sender has received an ACK for all PDUs except for #2, and whenthis PDU is
retransmitted, its poll bit is set.
Poll every poll_PDU When this is configured, the polling bit is set on every
poll_PDUth PDU. For example, in Figure 4.3(b), the poll_PDU value is set
to 4, and at TTI #5, when the 4th PDU is sent, the polling bit is set. At TTI
#10, the sender has received an ACK for PDUs #1,2 and 4, and a NACK for
#3. When #7 is sent along with the retransmission of #3, the polling bit is set,
because it has been four PDUs (#3,5,6, and 7) since the last poll was sent.
Poll every poll_SDU When this is configured, the polling bit is set on the
last PDU of everypoll_SDUth SDU. For example, in Figure 4.3(c), poll_SDU
is set to 1. Two SDUs were received, the first one which is segmented into two
PDUs, and the second one into four PDUs. At TTI #5, when #2 (last PDU of
first SDU) is sent, and at TTI#10, when #6 (last PDU of second SDU) is sent,
the polling bit is also set.
Window based polling With window based polling, a poll is sent when the
percentage of the occupied transmission window reaches a certain threshold.
In Figure 4.3(d), this threshold is set to 60%, and the transmission window

54 CHAPTER 4. RADIO LINK CONTROL PROTOCOL
TTI 1413121110987654321 1413121110987654321
1
2
3
4?
1
2
3
4?
1
2?
3
4
1
2?
3
4
(a) Poll last PDU and Poll last retransmitted PDU.
TTI 1413121110987654321 1413121110987654321
1
2
3
4?
1
2
3
4?
3
5
6
7?
3
5
6
7?
(b) Poll every poll_PDU.
1413121110987654321 1413121110987654321
1
2?
1
2?
3
4
5
6?
3
4
5
6?
TTI
(c) Poll every poll SDU.
TTI 1413121110987654321 1413121110987654321
1
2
3
4
1
2
3
4
1
5
6?
1
5
6?
(d) Window based polling.
TTI 1413121110987654321 1413121110987654321
1
2
3
4
1
2
3
4
4?4?
(e) Periodic polling.
TTI 1413121110987654321 1413121110987654321
1
2
3
4?
1
2
3
4?
4?4?
(f) Timer based polling.
SentSent ? Poll set? Poll set ACKedACKed
Figure 4.3: RLC polling mechanisms. The columns represents the state ofthesender’s window at the time instant indicated by the TTI in the horizontal row. Withthe exception of cases (e) and (f), the temporal spacing between the two instants con-sidered is chosen randomly.

4.2. RELIABILITY PROVISION MECHANISMS IN THE RLC 55
size is set to 10 PDUs. At TTI #10, even though there are only three PDUs
(#1, #5, and 6) that are actually occupying the space in the transmission buffer,
the occupied window is considered to be the spacing between the first and last
non-ACKed PDUs, which will make the percentage occupied window reach
60%, which triggers the sending of a poll along with PDU #6.
Periodic polling If this is configured, a poll is sent regularly at a specified
period. In Figure 4.3(e), the period is set to ten TTIs. When the ten TTIs have
elapsed since the start of the transmission, which is TTI #14in this case, a poll
is triggered. But during this time, there are no PDUs scheduled to be sent, and
as a poll can not be sent without a PDU, one of the PDUs that havenot been
acknowledged yet will be resent.
Timer based polling If this is configured, a timer is started whenever a poll
is sent. When the timer expires, if the sender has not received a NACK or
a cumulative ACK for the PDU with the highest SN that was waiting for an
ACK when the poll was sent, polling will be triggered. In Figure 4.3(f), a poll
was sent at TTI #4 and hence the poll timer, which was set to be 7TTIs, was
started too. When this poll was sent, the last PDU that was expecting an ACK
was #4. The poll timer expires at TTI #11, and by then neither aNACK nor a
cumulative ACK for #4 has been received so a poll will be sent along with the
retransmission of #4.
4.2.2 Receiver Triggered Status Reporting
Status reporting in the receiver side is triggered either due to the reception of
a poll from the sender or other two mechanisms in the receiverRLC. Figure
4.4 illustrates these mechanisms. In Figure 4.4(a), the receiver gets a status
request (i.e. a poll) in PDU #4 at TTI #i. During the next TTI, the receiver
sends a status report. In this case, as everything up to PDU #4is received, the
status contains ACK 4.
The other two mechanisms in RLC that enable the receiver to send a status
report without being explicitly polled by the sender are:
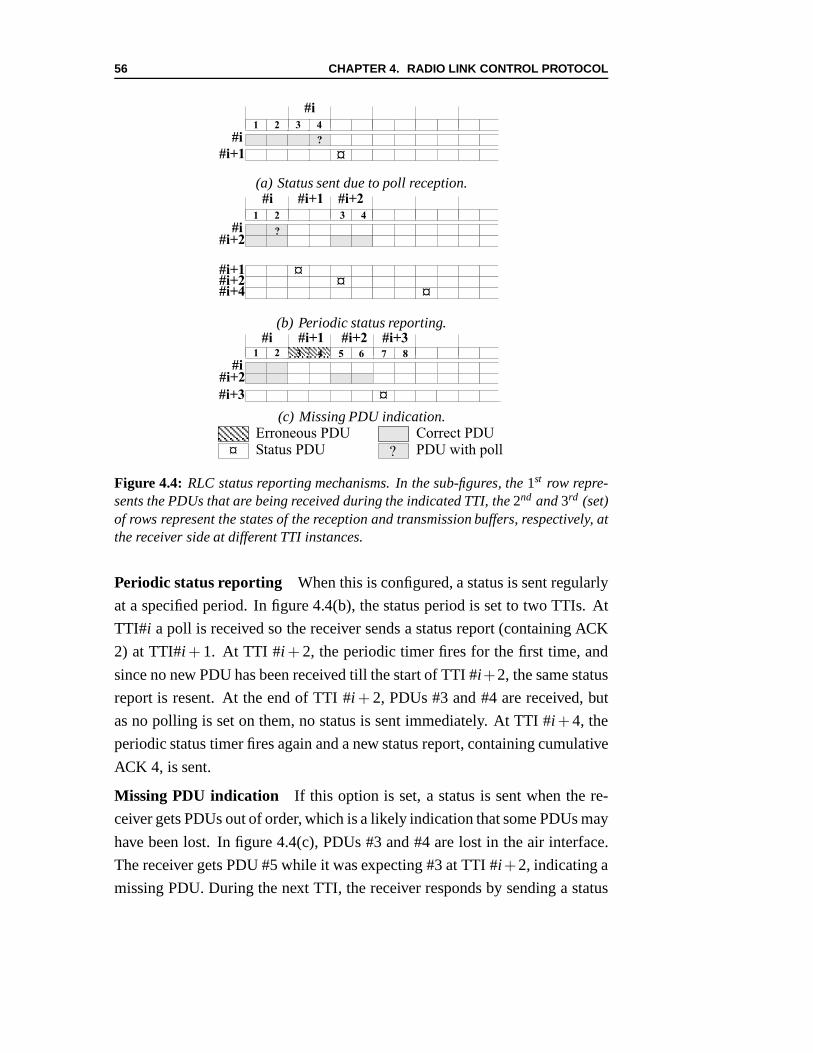
56 CHAPTER 4. RADIO LINK CONTROL PROTOCOL
#i
1 3 42
?
? ¤#i
#i+1
(a) Status sent due to poll reception.#i
1 3 42
?¤
#i
#i+1
#i+1 #i+2
#i+2?
¤#i+2¤#i+4
(b) Periodic status reporting.#i
1 3 42
#i
#i+1
#i+2
? ¤#i+3
7 85 6
#i+2 #i+3
(c) Missing PDU indication.
¤
Erroneous PDU Correct PDUStatus PDU PDU with poll?
Figure 4.4: RLC status reporting mechanisms. In the sub-figures, the1st row repre-sents the PDUs that are being received during the indicated TTI, the2nd and3rd (set)of rows represent the states of the reception and transmission buffers, respectively, atthe receiver side at different TTI instances.
Periodic status reporting When this is configured, a status is sent regularly
at a specified period. In figure 4.4(b), the status period is set to two TTIs. At
TTI#i a poll is received so the receiver sends a status report (containing ACK
2) at TTI#i + 1. At TTI #i + 2, the periodic timer fires for the first time, and
since no new PDU has been received till the start of TTI #i +2, the same status
report is resent. At the end of TTI #i + 2, PDUs #3 and #4 are received, but
as no polling is set on them, no status is sent immediately. AtTTI #i +4, the
periodic status timer fires again and a new status report, containing cumulative
ACK 4, is sent.
Missing PDU indication If this option is set, a status is sent when the re-
ceiver gets PDUs out of order, which is a likely indication that some PDUs may
have been lost. In figure 4.4(c), PDUs #3 and #4 are lost in the air interface.
The receiver gets PDU #5 while it was expecting #3 at TTI #i +2, indicating a
missing PDU. During the next TTI, the receiver responds by sending a status

4.3. SUMMARY 57
PDU, containing cumulative ACK 2, and a[0,0,1,1] bitmap.
The minimum temporal spacing between consecutive polls andstatus re-
ports can be controlled by usingPoll Prohibit andStatus Prohibittimers, re-
spectively. When these are configured, a timer is started whenever a poll/(status
report) is sent, and other polling/(status reporting) triggers that fired while
these timers are active will be deferred.
The number of times that a given PDU can be retransmitted can be speci-
fied using themaxDATparameter. If a PDU has been retransmittedmaxDAT-1
number of times and still has not been received properly, theSDU that this
PDU is part of will be discarded. The sender notifies the receiver when dis-
carding SDUs by sending a status report that contain Move Receiving Window
(MRW) indications, so that the receiver will not stall whilewaiting for parts of
an SDU that are not going to come. SDU discard operation can also be spec-
ified by setting a timeout value, which is started when the SDUis received
from upper layers. If the SDU has not been properly transmitted (i.e. all of
its PDUs have not been ACKed) by the time this timer expires, it will be dis-
carded. In services where the maximum delay is an important aspect, this may
come handy, as it controls the maximum delay experienced by an SDU.
The different RLC polling and status reporting mechanisms are indepen-
dent, i.e. they can be enabled at the same time without affecting their individ-
ual operation. Using a combination of these mechanisms wisely enables us to
avoid deadlock situations that might arise if only one of them is used1.
4.3 Summary
In UMTS, the RLC provides a reliable link layer data transmission by provid-
ing ARQ mechanisms. The RLC receives SDUs from upper layers,segments
them into RLC PDUs, schedules the PDUs for transmission and then stores
1A deadlockis a situation that makes the protocol to stop sending data. Atypical exampleof a deadlock is when a sender is waiting for a status report inorder to continue its transmissionwhile the receiver is at the same time waiting for new data to trigger a status report.
58 CHAPTER 4. RADIO LINK CONTROL PROTOCOL
them in its (re) transmission buffer. Each TTI, the sender transmits a given
number of PDUs depending on the instantaneous allocated bitrate on the air
interface. The receiver uses status messages to send ACKs for the correctly
received PDUs and NACKs for the ones that are not received properly.
There are mechanisms that enable both the sender and the receiver to con-
trol the status reporting process, and hence the RLC retransmission. On the
sender side, a poll bit can be set in some of the PDUs that are sent to indicate
to the receiver that a status report is needed. This polling can be sent either
periodically or using some PDU/SDU counters. When the receiver gets these
polling requests it complies by sending a status message reflecting the status of
its receive buffer. On the other hand, the receiver can control the status report-
ing by using periodic timers or instantaneously when out of order PDUs are
received. In order not to send the polling and status requests at a rate higher
than required, there are timers both at the sender and receiver that control the
temporal spacing between two consecutive polling requestsand status reports,
respectively.

Part III
UMTS
59


Chapter 5
Packet Service Performance in
UMTS: Impact of RLC
Parameters
Provision of packet data services is the main driving force behind the standard-
isation and deployment of 3G networks. The widespread use ofTCP makes
it the transport protocol of choice for providing these services. As described
in Chapter 3, the performance of TCP degrades significantly in mobile net-
works prone to link errors, and there are several mechanismsto mitigate this
problem. The UMTS RLC protocol described in the previous chapter provides
one such mechanism, namely link layer retransmission, thatcan improve TCP
performance in the presence of link errors.
In this chapter, the impact of RLC’s reliability mechanism settings on FTP
services is investigated. A brief survey of related work is given in Section
5.1. Section 5.2 gives a simplified analytical model for evaluating file down-
load times within a UMTS network. Emulation based performance results are
given in Section 5.3. Finally, Section 5.4 summarises the main findings of this
chapter.
61
62CHAPTER 5. PACKET SERVICE PERFORMANCE IN
UMTS: IMPACT OF RLC PARAMETERS
5.1 Related Work
The investigation of link layer ARQ performance is an activeresearch area,
and it can be classified into two broad categories. The first category includes
those that focus on basic ARQ techniques, with the main goal of setting bound-
aries on the expected delay of an SDU. The research in this category relies
heavily on mathematical modelling. The second category contains those stud-
ies that focus on the performance of specific systems that employ link layer
ARQ with higher layer reliability mechanisms, and is usually done using sim-
ulations. A brief survey of related research work is given below. References[63] and[64] fall within the first category, while the rest belong to the second
category.
A delay analysis of Selective Repeat (SR) ARQ is given in[63]. Exact
and approximate expressions are given for the delay experienced by an SDU
in an ARQ channel assuming periodic polling and retransmission timeouts at
the link level. The relationship between the delay and SDU size is shown to be
quadratic for smaller SDUs and linear for larger SDUs. Also correlated errors
are shown to reduce the SDU delay if the error burst length is less than the
RTT.
In [64], a method of estimating the average delay experienced by an IP
packet in a cellular network with a link layer that supports SR ARQ is pre-
sented. Given some statistical parameters such as the radiochannel error rate,
the IP packet size, and average retransmission times, the model is able to es-
timate the delay. The results are similar to that presented in [63], the main
exception being that the model presented here requires an estimate of a radio
block’s retransmission delay as an external input parameter.
In [17], a performance study of TCP over UMTS is given. Under the
assumption that the link layer is operating a simple go-back-N ARQ mecha-
nism, closed form analytic expression is given for the system throughput. It
is shown that TCP performance degrades considerably in a wireless environ-
ment as compared with a wired environment. Fortunately, even the simple
go-back-N ARQ retransmission mechanism is shown to mitigate most of the

5.1. RELATED WORK 63
problems.
In [65], an analytical model for TCP file transfer over UMTS is given,
where emphasis is put on the slow start phase as a considerable percentage of
the file download time can be spent in it for small file downloads. It is shown
that the FER has a considerable impact on the end to end performance. In[66], the analytical model given in[65] is further developed by considering
limitations on the allowed number of retransmissions at thelink layer. The
results show that by increasing the number of link layer retransmissions the
throughput can be increased but doing so increases the RTT.
In [17], a performance study of TCP over UMTS is given. Under the
assumption that the link layer is operating a simple go-back-N ARQ mecha-
nism, closed form analytic expression is given for the system throughput. It
is shown that TCP performance degrades considerably in a wireless environ-
ment as compared with a wired environment. Fortunately, even the simple
go-back-N ARQ retransmission mechanism is shown to mitigate most of the
problems.
An optimisation of the UMTS link layer using simulation studies is per-
formed in[18]. The effect of maxDAT and transmission window sizes on TCP
performance are presented. The results indicate that higher maxDAT is found
to be advantageous and the TCP window size should be set as close as the
bandwidth delay product for optimal performance.
In [67], the evolution of the RLC buffer size during file download sessions
is presented. The buffer occupancy is compared with the progression of the
TCP congestion control stages and the effect of RTT on the buffer size re-
quirements are investigated. The RLC buffer occupancy is shown to reflect
TCP’s slow start and congestion avoidance stages and that smaller RTT leads
to higher buffer occupancy.
In [19], the effect of the different RLC polling mechanisms on the packet
call throughput in a TCP session are investigated. The results show that the
usage of poll last PDU and poll last retransmitted PDU improves the perfor-
mance of the system significantly.

64CHAPTER 5. PACKET SERVICE PERFORMANCE IN
UMTS: IMPACT OF RLC PARAMETERS
In [68], the effect of the different RLC polling mechanisms on throughput
and delay are investigated. Settings that lead to the sending of polls spaced
apart by around the RTT (where the RTT is defined as the round trip time
within UMTS for one radio block) are found to be optimal.
In [20], simulations are performed to find out the effect of different RTT
and error rates on the throughput of a TCP connection operating on top of
UMTS. The results show that the larger the error rate and the RTT, the larger
the TCP window size required for optimal performance.
All the investigations carried out above used either a simplified RLC (for
the sake of mathematical modelling), or utilised a simplified TCP model for
simulation purposes. The study conducted here differs mainly from the ones
mentioned above in that the RLC ARQ mechanism is implementedin detail
as specified by the 3GPP, and that a real world TCP implementation (as im-
plemented in the Linux 2.4 kernel) is employed to generate the results. Due to
these factors, we believe that our results present the performance of link layer
retransmissions in UMTS in a more realistic context.
5.2 Theoretical Analysis
In this section, a simplified theoretical model is developedthat will be used to
compute the delay experienced by IP packets due to link layerretransmissions,
and its effect on the download time. The discussion here is not by any means
exhaustive, due to the inherent complexity of the RLC ARQ mechanism and
its interaction with TCP congestion control algorithms. Itis meant to clarify
some aspects of these interactions and to provide referenceresults that will be
used to verify the emulation results later in this chapter.
First, approximate expression for the average delay experienced by an IP
packet within a UMTS network is derived, and this is used to calculate the time
taken for FTP ([69]) based file downloads. FTP uses two parallel connections,
one for communicating FTP commands between the sender and receiver, and
the other to transfer data packets. In this analysis, only the data channel is

5.2. THEORETICAL ANALYSIS 65
considered and it is assumed that the TCP connection establishment procedure
(as described in Chapter 3) is already performed. Also, due to the fast power
control in UMTS ([8]) we assume a uniform, uncorrelated error in the air
interface[70].
5.2.1 Average IP Packet Delay
Assume an IP packet of sizeZ bits arrives at the RLC (i.e. the impact of
the Packet Data Convergence Protocol (PDCP), which can perform header
compression, is ignored and an RLC SDU is considered to be an IP packet).
Also assume that the RLC PDU size isK bits. That is, there will be⌈Z/K⌉
PDUs for each IP packet, where⌈x⌉ refers to the smallest integer greater than
or equal tox. If the air interface bandwidth isr bps, thenN = ⌈Z/(r ∗T TI)⌉
TTIs (or radio blocks) will be required to transmit all the PDUs at least once.
The probabilityP(1, j) that j blocks will be retransmitted once is given by:
P(1, j) =
(
Nj
)
p j(1− p)N− j (5.1)
wherep is the Frame Erasure Rate (FER).
By doing the above calculation recursively (because a radioblock that is
retransmittedb times must have been retransmittedb−1 times before the last
retransmission), it can be shown that the probability thatj blocks will be re-
transmittedi times is given by (fori ≥ 2):
P(i, j) = p j(1− p)N− jN
∑ai−1= j
N
∑ai−2
=ai−1
...N
∑a1
=a2
{
(
Na1
)(
a1
a2
)
.....
(
ai−1
j
)
p(∑i−1n=1an)}
(5.2)
wheream−1 is an index referring to the number of blocks involved in the
mth retransmission round.

66CHAPTER 5. PACKET SERVICE PERFORMANCE IN
UMTS: IMPACT OF RLC PARAMETERS
From (5.2), the probabilityP(i) of at leasti retransmissions is given by
calculating the marginal probability as:
P(i) = ∑j
P(i, j) (5.3)
Figure 5.1 shows theP(i) values while transmitting a 1500 byte IP packet
under two different conditions, for a 384 and 32 Kbps connection (the corre-
spondingN values being 4 and 38, respectively), with a 10 ms TTI and 10%
FER. As can be seen from the figure,P(i) is negligible, for both cases, for
retransmission counts larger than 3, and can be safely ignored for the purpose
of this discussion because the normal operating FER for UMTSis within this
range[8].
The average delay that an SDU experiences can then be expressed as:
SDU_delay= N+∞
∑i=1
{P(i)R(i)} ≈ N+3
∑i=1
{P(i)R(i)} (5.4)
1 2 3 4 50
0.1
0.2
0.3
0.4
0.5
0.6
0.7
0.8
0.9
1
Number of Retransmissions
Pro
bab
ility
32kbps
384kbps
Figure 5.1: The probability of the least number of retransmissions for a10% FER.

5.2. THEORETICAL ANALYSIS 67
14321 14321
1432x 1432x
ret = 3
(a) First block retransmitted, retransmis-sion delay = 3 TTIs.
34321 34321
34x21 34x21
ret = 3
(b) Third block retransmitted, retransmis-sion delay = 3 TTIs.
14321 14321
432x 432x
ret = 5
(c) First block retransmitted, retransmis-sion delay = 5 TTIs.
34321 34321
34x21 34x21
ret = 5
(d) Third block retransmitted, retransmis-sion delay = 5 TTIs.
Figure 5.2: Illustrations of the effect of the retransmitted block position on the delayexperienced by an SDU which is comprised of four radio blocks.
whereR(i) is the retransmission delay incurred by theith retransmission
round. R(i) is highly dependent on the polling and status reporting mecha-
nisms used.
For the cases of only one retransmission, the position of thelost block is
important. Figure 5.2 illustrates this. If a block at the front is lost (Figure
5.2(a)), its NACK might be received before the rest of the blocks have left the
transmission buffer, and hence an extra delay of only one TTIis experienced.
If the retransmission delay is larger than the number of blocks (as in Figure
5.2(c)), the extra delay could be more than one TTI, even if itis the first block
that is being retransmitted. However, this extra delay is still smaller than the
retransmission delay because other radio blocks are sent while the retransmis-
sion of the first block is pending. On the other hand, when a block near the
back is retransmitted (as in Figures 5.2(b) and 5.2(d)), larger delays are intro-
duced, equalling the maximum value of retransmission delay+ 1 if the last
block is the one that is being retransmitted. This is becausethe air interface
will be idle for the amount of time equal to the retransmission delay1, and one
more TTI is required to send it via the air interface.
1This does not hold when more than one SDU are being processed because blocks rep-resenting PDUs from other SDUs can be transmitted during this "idle" period. However, theanalysis herein assumes there is only one SDU in the transmission buffer.

68CHAPTER 5. PACKET SERVICE PERFORMANCE IN
UMTS: IMPACT OF RLC PARAMETERS
If the retransmission delay of one block isret TTIs, then the average delay
for the case of only one retransmission round (i.e. no block experiences more
than one retransmission) can be calculated as (in terms of TTIs):
R(1) =1N
N
∑j=1
{max(1, ret− (N−1− j))} (5.5)
For cases where the retransmission round is greater than one, the probabil-
ities of having more than one block being involved in this round is very small.
Figure 5.3 demonstrates this for the case whereN = 10 and the error rate is
10%. Thus, the extra delay for such cases can be approximatedby ret (i.e.
assuming only one PDU will experience this retransmission round).
Thus the overall SDU delay, i.e. the time from the reception of the SDU at
the sender till the correct reception of all the PDUs that belongs to the SDU at
the destination, is given by:
12
34
56
78
910
12
34
5
0
0.1
0.2
0.3
0.4
# Frames Involved
Retransmission
Round
Pro
bab
ilit
y
Figure 5.3: The probability of the number of radio blocks involved for each retrans-mission round, for a 10% FER.

5.2. THEORETICAL ANALYSIS 69
0 5 10 15 20 25 30 35 400
10
20
30
40
50
60
Number of blocks per SDU
SD
U D
elay
[T
TIs
]
ret=1
ret=2
ret=4
ret=10
ret=15
ret=20
Full sized IP Packetsent with 384 kbpsconnection
Full sized IP Packetsent with 32kbpsconnection
Figure 5.4: Approximate values for the SDU delay for different number ofretrans-mission times.
SDU_delay≈ N+P(1)R(1)+ ret(P(2)+P(3)) (5.6)
Figure 5.4 shows the SDU delay for different values ofret and number
of blocks per SDU, for a 10% FER. The result shows similar trend to the
one shown in[63] (as can be seen from the figure, for smaller values ofN, the
relationship betweenN and SDU delay is quadratic but it becomes linear when
N is large), though exact comparison between the two is not possible because
of the different assumptions and parameters used in the two cases.
5.2.2 File Transfer
In the previous section an approximate value for the averagedelay experienced
by an SDU was calculated. This value is used in this section todetermine the
average file transfer time.
We assume the connection will always be in slow start, i.e. there are no
packet losses due to errors in the air interface thanks to link layer retransmis-
sions and the cwnd will not reach the ssthresh. This is a validassumption
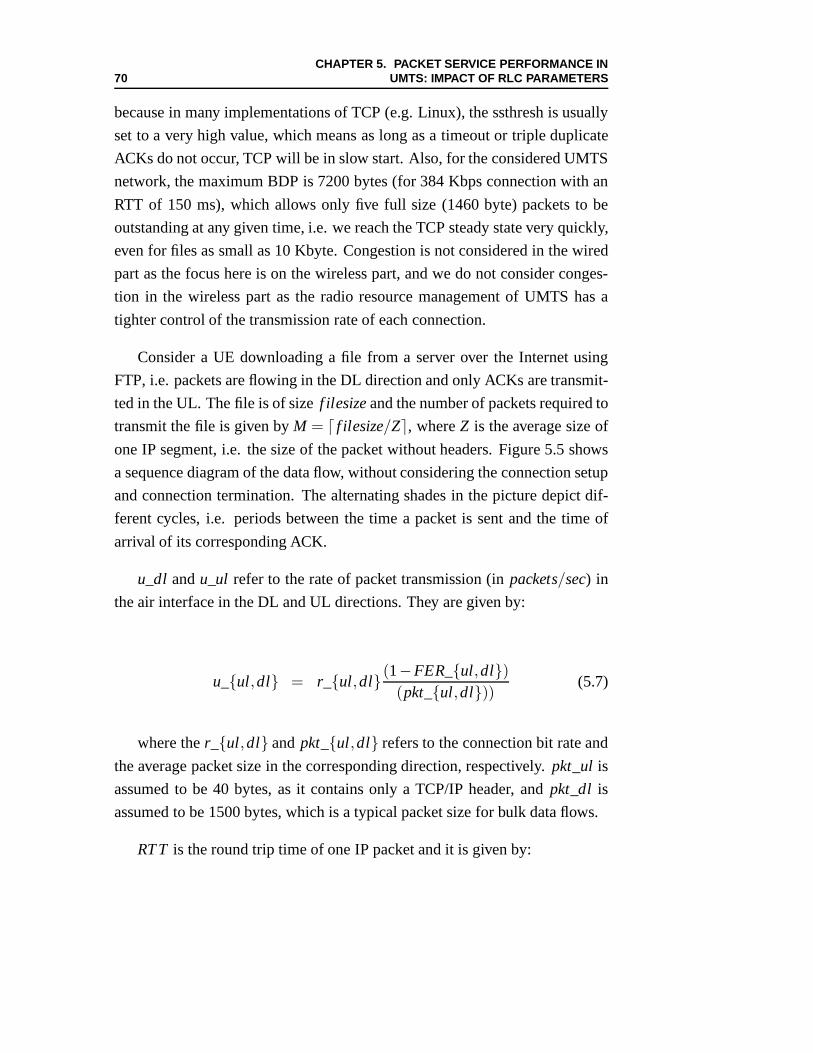
70CHAPTER 5. PACKET SERVICE PERFORMANCE IN
UMTS: IMPACT OF RLC PARAMETERS
because in many implementations of TCP (e.g. Linux), the ssthresh is usually
set to a very high value, which means as long as a timeout or triple duplicate
ACKs do not occur, TCP will be in slow start. Also, for the considered UMTS
network, the maximum BDP is 7200 bytes (for 384 Kbps connection with an
RTT of 150 ms), which allows only five full size (1460 byte) packets to be
outstanding at any given time, i.e. we reach the TCP steady state very quickly,
even for files as small as 10 Kbyte. Congestion is not considered in the wired
part as the focus here is on the wireless part, and we do not consider conges-
tion in the wireless part as the radio resource management ofUMTS has a
tighter control of the transmission rate of each connection.
Consider a UE downloading a file from a server over the Internet using
FTP, i.e. packets are flowing in the DL direction and only ACKsare transmit-
ted in the UL. The file is of sizef ilesizeand the number of packets required to
transmit the file is given byM = ⌈ f ilesize/Z⌉, whereZ is the average size of
one IP segment, i.e. the size of the packet without headers. Figure 5.5 shows
a sequence diagram of the data flow, without considering the connection setup
and connection termination. The alternating shades in the picture depict dif-
ferent cycles, i.e. periods between the time a packet is sentand the time of
arrival of its corresponding ACK.
u_dl andu_ul refer to the rate of packet transmission (inpackets/sec) in
the air interface in the DL and UL directions. They are given by:
u_{ul,dl} = r_{ul,dl}(1−FER_{ul,dl})
(pkt_{ul,dl}))(5.7)
where ther_{ul,dl} andpkt_{ul,dl} refers to the connection bit rate and
the average packet size in the corresponding direction, respectively. pkt_ul is
assumed to be 40 bytes, as it contains only a TCP/IP header, and pkt_dl is
assumed to be 1500 bytes, which is a typical packet size for bulk data flows.
RT T is the round trip time of one IP packet and it is given by:

5.2. THEORETICAL ANALYSIS 71
Cycle=1
Cycle=0
1/u_DL + 1/u_UL
RTT
1/u_DL
1/u_UL
Cycle=3
Cycle=2
Figure 5.5: A sequence diagram showing the first few cycles during an FTP session.
RT T = SDU_delay_dl +SDU_delay_ul +
RT T_UMTS+RT T_Internet (5.8)
whereSDU_delay_dl is the SDU delay (as calculated using 5.6) for a
packet of sizepkt_dl in the DL direction, andSDU_delay_ul is the SDU delay
for one packet of sizepkt_ul (i.e. the ACK for the corresponding DL packet)
in the UL direction.RT T_UMTSis the RTT within the UMTS network (i.e.
the average processing times, independent of the packet size, in the UTRAN
and CN) without considering the air interface transmissiontime (as this is
basicallySDU_delay_ul + SDU_delay_dl), andRT T_Internet corresponds
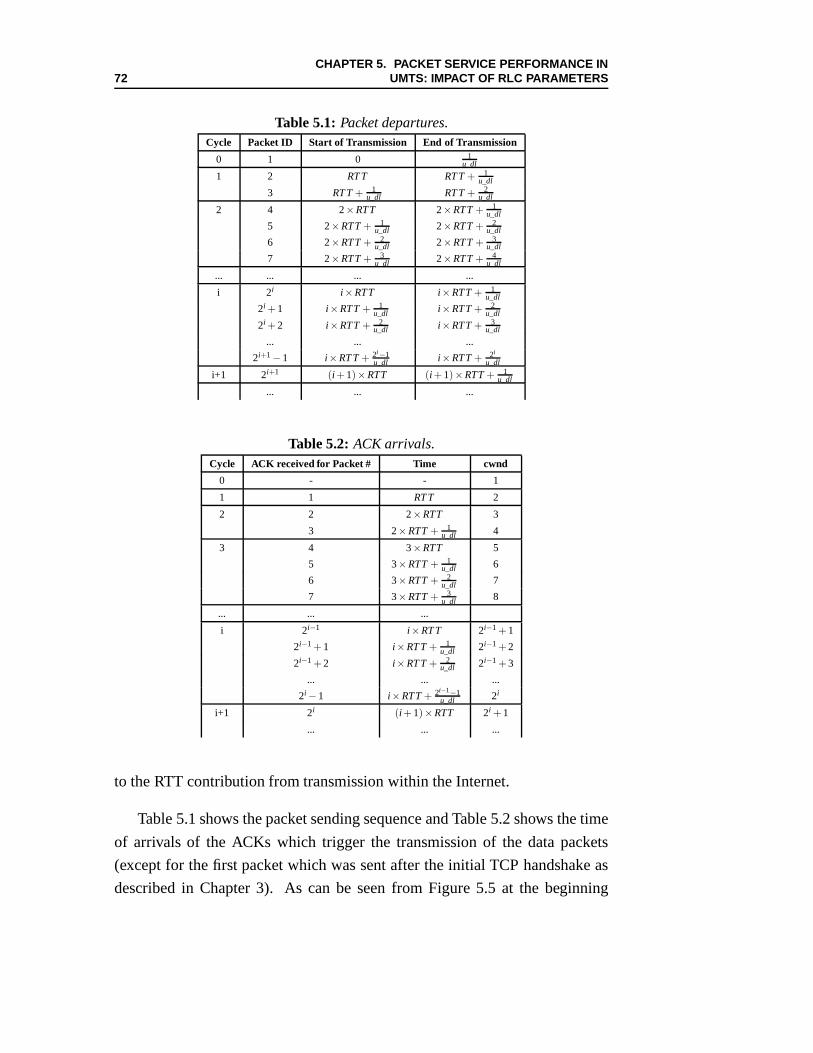
72CHAPTER 5. PACKET SERVICE PERFORMANCE IN
UMTS: IMPACT OF RLC PARAMETERS
Table 5.1: Packet departures.Cycle Packet ID Start of Transmission End of Transmission
0 1 0 1u_dl
1 2 RTT RTT+ 1u_dl
3 RTT+ 1u_dl RTT+ 2
u_dl
2 4 2×RTT 2×RTT+ 1u_dl
5 2×RTT+ 1u_dl 2×RTT+ 2
u_dl
6 2×RTT+ 2u_dl 2×RTT+ 3
u_dl
7 2×RTT+ 3u_dl 2×RTT+ 4
u_dl
... ... ... ...
i 2i i ×RTT i ×RTT+ 1u_dl
2i + 1 i ×RTT+ 1u_dl i ×RTT+ 2
u_dl
2i + 2 i ×RTT+ 2u_dl i ×RTT+ 3
u_dl
... ... ...
2i+1−1 i ×RTT+ 2i−1u_dl i ×RTT+ 2i
u_dl
i+1 2i+1 (i + 1)×RTT (i + 1)×RTT+ 1u_dl
... ... ...
Table 5.2: ACK arrivals.Cycle ACK received for Packet # Time cwnd
0 - - 1
1 1 RTT 2
2 2 2×RTT 3
3 2×RTT+ 1u_dl 4
3 4 3×RTT 5
5 3×RTT+ 1u_dl 6
6 3×RTT+ 2u_dl 7
7 3×RTT+ 3u_dl 8
... ... ...
i 2i−1 i ×RTT 2i−1 + 1
2i−1 + 1 i ×RTT+ 1u_dl 2i−1 + 2
2i−1 + 2 i ×RTT+ 2u_dl 2i−1 + 3
... ... ...
2i −1 i ×RTT+ 2i−1−1u_dl 2i
i+1 2i (i + 1)×RTT 2i + 1
... ... ...
to the RTT contribution from transmission within the Internet.
Table 5.1 shows the packet sending sequence and Table 5.2 shows the time
of arrivals of the ACKs which trigger the transmission of thedata packets
(except for the first packet which was sent after the initial TCP handshake as
described in Chapter 3). As can be seen from Figure 5.5 at the beginning

5.2. THEORETICAL ANALYSIS 73
there are some cycles where there is a transmission gap as thesender waits
for ACKs. However, this gap decreases as the data transmission continues and
a situation will arise where there will be no gap. This happens when the last
packet from a given cycle is not sent yet when a new cycle starts. For example,
if the ACK for packet #4 is received before packet #7 is sent, it means full link
utilisation from then onwards.
Let Cf denote the cycle from which there will be full link utilisation, i.e.
the last transmission gap occurs in cycleCf −1. This means by the time the
last packet in cycleCf is transmitted (which occurs atCf ×RTT+ 2Cf /u_dl
as can be seen from Table 5.1), the ACK for the first packet fromcycleCf is
received (which happens at(Cf + 1)×RT T as can be seen from Table 5.2).
Thus, we have the relation:
Cf ×RTT+2Cf
u_dl≥ (Cf +1)×RTT
⇒Cf = ⌈log2(RT T×u_dl)⌉ (5.9)
the ⌈ ⌉ operator is used, becauseCf is the cycle during which this overlapoccurs for the first time and the cycle number must be an integer.
The total number of cycles needed to transmit the file,Clast, is given by
(using the fact that by the time cyclei has finished, 2i+1−1 packets are sent):
2Clast+1−1≥ M
⇒Clast = ⌈log2(M +1)−1⌉ (5.10)
The total transmission time can be divided into two periods:before and afterfull link utilisation. However, ifClast <Cf , the file download is finished before
full link utilisation is reached, and as such the file transmission time is divided
into two periods: before the last cycle and during the last cycle. The time
spent to reach any cyclei is simply the time spent from 0 toi −1. Thus the
first period is given by:
Tf irst = min(Cf ,Clast)∗RTT (5.11)

74CHAPTER 5. PACKET SERVICE PERFORMANCE IN
UMTS: IMPACT OF RLC PARAMETERS
From Table 5.1 it can be seen that by the time cyclei − 1 has finished,
2i −1 packets are sent. Thus, the number of packets to be sent during the
second period is given by:
remaining= M− (2min(Cf ,Clast)−1) (5.12)
The time required to send the remaining packets is:
Tsecond=remaining
u_dl(5.13)
Thus, the total time required to send the file becomes (i.e. the time from
the transmission of the first packet to the reception of the last packet at the
destination):
Ttotal = Tf irst +Tsecond (5.14)
Figures 5.6, 5.7 and 5.8 show the download time (5.14), the RTT (5.8)
and the link utilisation while downloading a 100 Kbyte file over a 128 Kbps
connection. Based on the values given in[8] and [7], the RT T_UMTS is
taken to be 115 ms . A value of 50 ms is used for theRT T_Internet 2. The
retransmission delay has no effect for the error free connection, as expected,
and the effect becomes more pronounced as the error rate increases as can
be seen from the slopes of the different curves. For the 20% FER case, the
average RTT is almost tripled when the retransmission delayis increased from
1 to 30 TTIs. However, this does not directly translate to similar proportional
increase in the download time because once the full link utilisation cycle has
started (for the considered cases here the maximum value ofCf is 3), the effect
of the RTT is minimal due to the continuous flow of data. For small file sizes
or/and higher values ofCf , the effect of the RTT will be more pronounced as
250 ms was used as it was found to be the average RTT found through ping from wellknown sites such as Google from Aalborg University servers.

5.2. THEORETICAL ANALYSIS 75
1 5 10 15 20 25 306.5
7
7.5
8
8.5
9
9.5
10
Retransmission Delay [TTIs]
Do
wn
load
tim
e [s
ec]
FER=0FER=1%FER=5%FER=10%FER=20%
Figure 5.6: Download times of a 100 Kbyte file under different retransmission delaysand FERs.
that means more time is spent in cycles with transmission gaps. For example,
if the file size is less than 1 Kbyte, the file download time basically maps to
the RTT, as only one packet is necessary to send the whole file.
1 5 10 15 20 25 300.2
0.3
0.4
0.5
0.6
0.7
0.8
0.9
1
Retransmission Delay [TTIs]
RT
T [
sec]
FER=0FER=1%FER=5%FER=10%FER=20%
Figure 5.7: RTT during a download of a 100 Kbyte file under different retransmissiondelays and FERs.

76CHAPTER 5. PACKET SERVICE PERFORMANCE IN
UMTS: IMPACT OF RLC PARAMETERS
1 5 10 15 20 25 30
0.65
0.7
0.75
0.8
0.85
0.9
0.95
1
Retransmission Delay [TTIs]
Ave
rag
e lin
k u
tiliz
atio
n
FER=0FER=1%FER=5%FER=10%FER=20%
Figure 5.8: Link utilisation during a download of a 100 Kbyte file under differentretransmission delays and FERs.
5.3 Emulation Results
As described in section 1.4, the investigations in this thesis are carried out
using emulations. To this end, an emulation platform has been developed.
A brief description of the emulator, a listing of the main assumptions and
parameters, and the emulation results are given in the following sections.
5.3.1 Emulation Tool and Parameter Settings
5.3.2 Emulation Tool
The studies are carried out using Real-time Emulator for Service Performance
Evalution of Cellular neTworks (RESPECT)[71; 72]. RESPECT provides a
link-level, real-time emulation of a UMTS network using free software tools
that are available with standard Linux installations. The emulator’s usage sce-
nario is already described in Chapter 1 (see Figure 1.3). Theemulator runs
on a PC that is also configured to act as a proxy server, and users are con-

5.3. EMULATION RESULTS 77
nected to the application server (possibly via the Internet) through this ma-
chine. Users specify their emulation setup using configuration files, which
includes information such as the data rate, the error rate, processing delays of
different network entities, and the different RLC parameters discussed in the
previous chapter.
The functionality of the emulator, as seen from a protocol point of view,
is depicted in Figure 5.9. The dotted box represents the parts of the protocol
stack in the emulator machine that are relevant to us. In a nutshell, RESPECT
inserts the additional protocol layers that comprise a UMTSnetwork between
the IP and data link layers of a normal TCP/IP protocol stack.In a real UMTS
network these layers are distributed in different network entities, as shown by
the names in italics, such as the UE, NodeB, and RNC. In RESPECT, they
are all lumped together into one entity, and doing so does nothave different
characteristics from that of the real case, as long as the processing delay of the
different network entities are taken into account.
A user starts a network-based application such as a FTP session or video
streaming, which is accessed via the proxy server where the emulator is run-
Application
TCP
IP
Data Link
Physical
Application
TCP
IP
Data Link
Physical
Application
TCP
IP
Data Link
Physical
Application
TCP
IP
Data Link
Physical
Data Link
Physical
EMULATOR
UE SERVER
RLC
MAC
PHY
RLC
MAC
PHY
RLC
MAC
PHY
RLC
MAC
PHYPHY
Air Interface Iub Interface CN
Internet
UE
NodeB
RNC
Figure 5.9: Emulated UMTS protocol stack.

78CHAPTER 5. PACKET SERVICE PERFORMANCE IN
UMTS: IMPACT OF RLC PARAMETERS
ning. The emulator intercepts the packets that are coming into (both UL and
DL packets), processing them according to the specified set up for the con-
nection. Every IP packet that is arriving to the emulator is diverted into the
emulated UMTS protocol stack. The RLC is fully implemented as specified
in [61] by 3GPP. Specifically, IP packets are segmented into RLC PDUs, and
then transmitted depending on the allocated bit rate (the MAC layer is a sim-
plified implementation that regulates the rate of PDU transmission in order to
provide a constant bit rate for the connection). The air interface is modelled to
provide a uniformly distributed frame errors. Retransmissions are controlled
by the polling and status reporting parameter setting specified in the config-
uration file. Properly received PDUs are assembled into an IPpacket and
forwarded to their destination.
To summarise, RESPECT is a platform that emulates a UMTS network
with these main features:
• link layer segmentation, assembly, retransmission, polling and status re-
porting
• constant bit rate
• uniformly distributed frame errors
• processing delays of the different network entities in the E2E path
• one user
• one link
A detailed description of RESPECT, including the accuracy of emulation
results generated using it, is given in Appendix B.
5.3.3 Parameter Settings
A combination of some of the reliability mechanisms described in section 4.2
were used. For the status reporting,missing PDU Indicationis enabled as
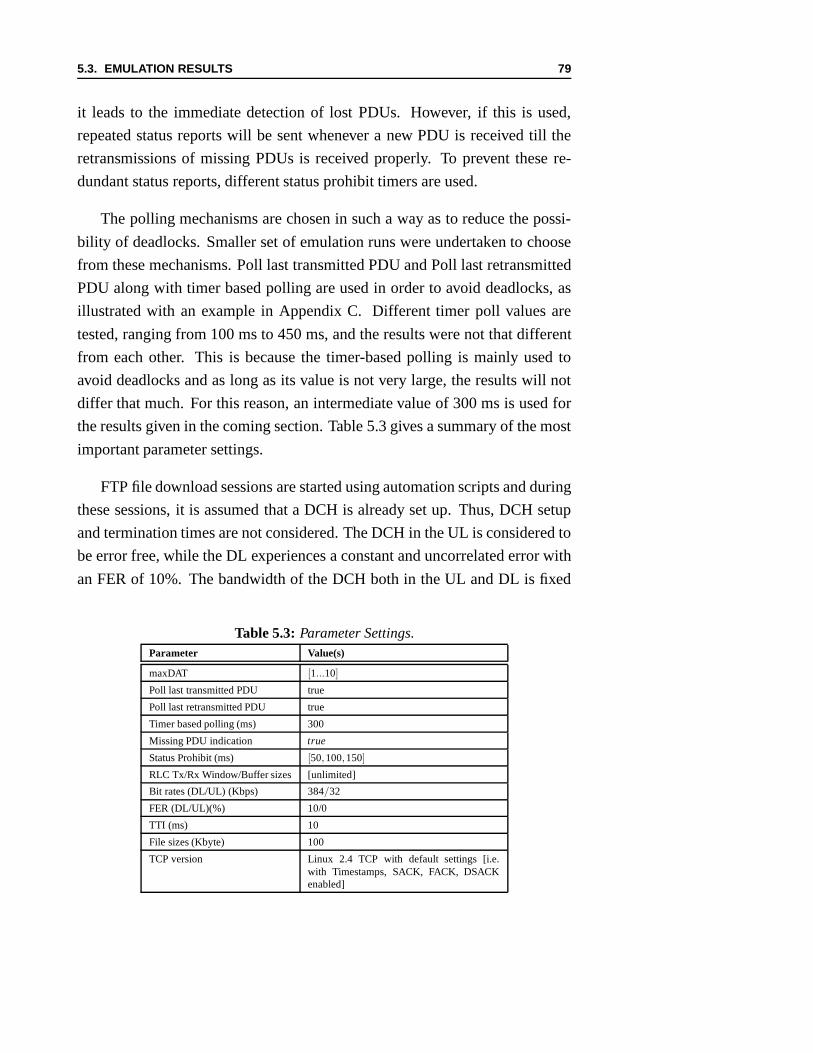
5.3. EMULATION RESULTS 79
it leads to the immediate detection of lost PDUs. However, ifthis is used,
repeated status reports will be sent whenever a new PDU is received till the
retransmissions of missing PDUs is received properly. To prevent these re-
dundant status reports, different status prohibit timers are used.
The polling mechanisms are chosen in such a way as to reduce the possi-
bility of deadlocks. Smaller set of emulation runs were undertaken to choose
from these mechanisms. Poll last transmitted PDU and Poll last retransmitted
PDU along with timer based polling are used in order to avoid deadlocks, as
illustrated with an example in Appendix C. Different timer poll values are
tested, ranging from 100 ms to 450 ms, and the results were notthat different
from each other. This is because the timer-based polling is mainly used to
avoid deadlocks and as long as its value is not very large, theresults will not
differ that much. For this reason, an intermediate value of 300 ms is used for
the results given in the coming section. Table 5.3 gives a summary of the most
important parameter settings.
FTP file download sessions are started using automation scripts and during
these sessions, it is assumed that a DCH is already set up. Thus, DCH setup
and termination times are not considered. The DCH in the UL isconsidered to
be error free, while the DL experiences a constant and uncorrelated error with
an FER of 10%. The bandwidth of the DCH both in the UL and DL is fixed
Table 5.3: Parameter Settings.Parameter Value(s)
maxDAT [1...10]
Poll last transmitted PDU true
Poll last retransmitted PDU true
Timer based polling (ms) 300
Missing PDU indication true
Status Prohibit (ms) [50,100,150]
RLC Tx/Rx Window/Buffer sizes [unlimited]
Bit rates (DL/UL) (Kbps) 384/32
FER (DL/UL)(%) 10/0
TTI (ms) 10
File sizes (Kbyte) 100
TCP version Linux 2.4 TCP with default settings [i.e.with Timestamps, SACK, FACK, DSACKenabled]

80CHAPTER 5. PACKET SERVICE PERFORMANCE IN
UMTS: IMPACT OF RLC PARAMETERS
during a download session.
For each of the considered cases, the file download is repeated 300 times.
The downloads are done in a randomised fashion[73], i.e. a given case is
selected randomly for the next download instead of running each case in se-
quence. This is done in order to distribute some systematic errors that might
arise.
The results from the investigations are evaluated using thefollowing per-
formance metrics:
• Download time: The time taken to download a file. Though an FTP
connection has a control and data channel[69], the time considered here
is the time taken in the data channel, i.e. the time from the sending of
the SYN packet in the data channel till the arrival of the lastdata packet
in the data channel.
• Throughput: Throughput is the average amount of data that is trans-
mitted in a given time, including retransmissions and status reports.
Two different types of throughput measures are used here,Mean peak
throughputandMoving average throughput. The mean peak throughput
is calculated by averaging the throughput during each TTI (i.e bits sent
per TTI divided by one TTI duration). On the other hand, the moving
average throughput is calculated by dividing the total number of bits
sent during that session by the total time spent.
• RTT: The average time elapsed from the arrival of a TCP packet at the
sender till its removal from the transmission buffer due to the reception
of an ACK signifying its complete reception.
• TCP retransmission ratio: The percentage of TCP packets that are
retransmitted.
• Status Overhead:The ratio of status PDUs that are sent in the UL to
the data PDUs that are sent in the DL. This indicates how much penalty
is paid in UL capacity for the sake of reliability in the DL.

5.3. EMULATION RESULTS 81
5.3.4 Results and Discussion
Figure 5.10 shows the dependency of the download time on maxDAT and sta-
tus prohibit. As can be seen from the figure, for a given statusprohibit value,
the download time increases as the maxDAT value decreases. For the status
prohibit values of 50 ms, 100 ms and 150 ms, increasing the maxDAT value
from 1 to 2 leads to a decrease in the download time of 56%, 56% and 79%
respectively3. This is an expected result as the main idea behind link layerre-
transmissions is to decrease the probability of TCP timeouts by retransmitting
a subset of the packet, i.e. RLC PDUs.
This is illustrated in Figure 5.11, which shows the TCP retransmission ra-
tio. It can be seen that, the download times follow the same pattern as the TCP
retransmission rate for maxDAT values less than 4. The TCP retransmission
ratio is around 33%, even though the FER is only 10%, for all the three cases
when maxDAT is 1. This is because for a bit rate of 384 Kbps, a 1500 byte IP
packet needs:
1500∗8 bitspacket
384000bitssec∗0.01 sec
block
= 3.12
radio blocks to be transmitted, and if any one of this gets lost the packet is
also lost as there is no retransmission, hence raising the TCP retransmission
ratio to approximately three times that of the FER. For maxDAT values greater
than or equal to 4, TCP timeouts are prevented almost completely.
The effect of maxDAT becomes marginal when its value is greater than 4,
because the probability of having more than 3 retransmissions is negligible (as
shown in Figure 5.1 in Section 5.2.1). For lower values of maxDAT, status
prohibit has an important effect on the download time: smaller status prohibit
values lead to longer download times, and vice versa. This isbecause, lower
3Setting maxDAT to 1 is equivalent to disabling retransmission, and hence nullifying theRLC reliability mechanism

82CHAPTER 5. PACKET SERVICE PERFORMANCE IN
UMTS: IMPACT OF RLC PARAMETERS
1 2 3 4 5 8 100
5
10
15
20
25
30
35
maxDAT [# Transmissions]
Do
wn
load
Tim
e [s
]
StatusProhibit=50ms
StatusProhibit=100ms
StatusProhibit=150ms
Figure 5.10: Mean file download times for different maxDAT and status prohibitvalues, for a 100 Kbyte file.
status prohibit timers mean higher status reporting frequency, increasing the
probability that a PDU is retransmitted. An increase in the retransmission
ratio will make the retransmission count reach the maxDAT faster, and the
SDU will be discarded. The SDU discard will lead to TCP timeouts, and hence
1 2 3 4 5 8 100
5
10
15
20
25
30
35
maxDAT [# Transmissions]
TC
P R
etra
nsm
issi
on
Rat
io [
%]
StatusProhibit=50ms
StatusProhibit=100ms
StatusProhibit=150ms
Figure 5.11:Mean TCP retransmissionratio for different maxDAT and status prohibitvalues, for a 100 Kbyte file.

5.3. EMULATION RESULTS 83
decrease the link efficiency. However, for larger maxDAT values (≥ 4), even
though smaller status prohibit values lead to spurious RLC retransmissions as
too many status reports arrive due to missing PDU detection,maxDAT is high
enough to prevent the untimely discard of an SDU. Actually, there is even a
slight improvement in the download time (in the range of 0.4 seconds) when
the status prohibit is reduced from 150 to 50 ms for larger values of maxDAT.
Though lower status prohibit values lead to lower download times when
the maxDAT is high enough, the down side is that more status reports will
be sent in the UL direction, i.e there is an increase in statusoverhead for low
status prohibit values. This is illustrated in Figure 5.12.The values are shown
starting from a maxDAT value of 2 because when maxDAT is 1, there is no
retransmissions (except for the sake of polling), and the status reporting is
not useful at all. As shown in the figure, the status overhead decreases with
maxDAT because the chances that a status report is wasted (i.e. a status report
asking a retransmission is sent by the UE but no retransmission results out of
it) becomes smaller with increasing maxDAT.
A higher status overhead is a disadvantage as it means that more UL ca-
pacity is required. For example for maxDAT value of 2 and a status prohibit
value of 50 ms, the status overhead is around 5% (the maximum value for all
the cases shown), which means approximately 19.2 Kbps (384×0.05) UL ca-
2 3 4 5 8 101
1.5
2
2.5
3
3.5
4
4.5
5
5.5
maxDAT [# Transmissions]
Sta
tus O
verh
ead
[%
]
StatusProhibit=50ms
StatusProhibit=100ms
StatusProhibit=150ms
Figure 5.12: Mean Status Overhead for different maxDAT and status prohibit values,for a 100 Kbyte file.

84CHAPTER 5. PACKET SERVICE PERFORMANCE IN
UMTS: IMPACT OF RLC PARAMETERS
pacity is required. Fortunately, only 10.2 Kbps (384×401500 ) is required for sending
ACKs at the TCP level if the maximum throughput is reached. Thus, even in
the worst scenario of requiring 19.2 Kbps for status reporting, 32 Kbps is still
enough to provide the maximum 10.2 Kbps required for ACKs.
Figure 5.13 shows the mean RTT for the different cases. As canbe seen
from the figure, the RTT is very low for small values of maxDAT.This is
because when maxDAT is very low, there are a lot of SDUs that are discarded
and the only SDUs that will contribute to the mean RTT calculation are the
ones that are completed with fewer PDU being retransmitted.For example,
for the maxDAT value of 1, the only SDUs that are taken into account for the
RTT calculation are the ones that are received without any oftheir PDUs being
retransmitted. When maxDAT increase, so does the RTT as moreand more
SDUs are being received properly, mostly with some of their PDUs having
being retransmitted. After maxDAT reaches 4, the RTT value remains stable.
With low status prohibit values, retransmission requests arrive to the sender in
a quick succession, increasing the rate of retransmission of PDUs, and hence
decreasing the total time required to transmit a given SDU.
Figures 5.14 and 5.15 show the mean peak and average throughput, respec-
tively. From the figures it can be seen that the throughput follows a trend sim-
ilar to the download time shown in Figure 5.10. That is, lowerstatus prohibit
1 2 3 4 5 8 10
200
250
300
350
400
maxDAT [#Transmissions]
RT
T [
ms]
StatusProhibit=50ms
StatusProhibit=100ms
StatusProhibit=150ms
Figure 5.13: Mean RTT for different maxDAT and status prohibit values, for a 100Kbyte file.

5.3. EMULATION RESULTS 85
1 2 3 4 5 8 10
240
260
280
300
320
340
240
260
280
Mea
n P
eak
Th
rou
gh
pu
t [k
bp
s]
StatusProhibit=50ms
StatusProhibit=100ms
StatusProhibit=150ms
Figure 5.14: Mean peak throughput for different maxDAT and status prohibit values,for a 100 Kbyte file.
values work better at larger maxDAT and vice versa, and also that performance
improves with increasing maxDAT. It should be noted that thedirect parallel
that is found here between download time and throughput is not a necessity,
because theoretically it is possible to have a high throughput that also leads to
1 2 3 4 5 8 1040
60
80
100
120
140
160
180
200
maxDAT [# Transmissions]
Th
rou
gh
pu
t (M
ovi
ng
Ave
rag
e) [
kbp
s]
StatusProhibit=50ms
StatusProhibit=100ms
StatusProhibit=150ms
Figure 5.15: Mean moving average throughput for different maxDAT and status pro-hibit values, for a 100 Kbyte file.
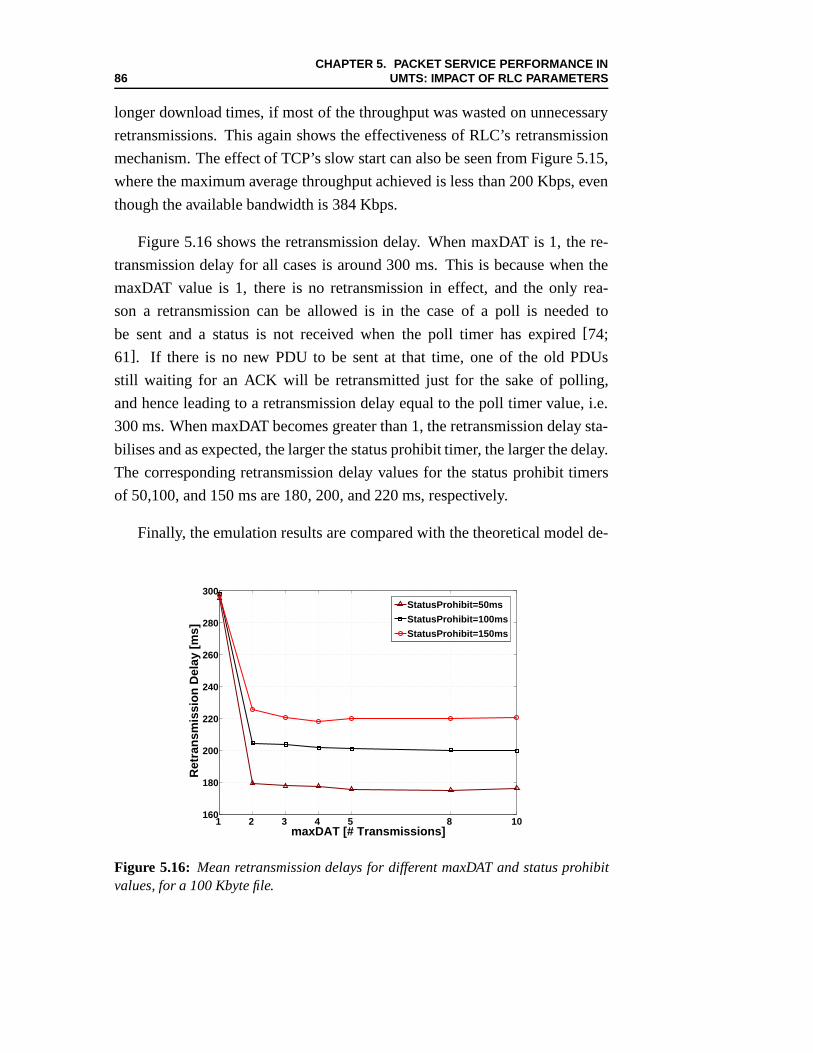
86CHAPTER 5. PACKET SERVICE PERFORMANCE IN
UMTS: IMPACT OF RLC PARAMETERS
longer download times, if most of the throughput was wasted on unnecessary
retransmissions. This again shows the effectiveness of RLC’s retransmission
mechanism. The effect of TCP’s slow start can also be seen from Figure 5.15,
where the maximum average throughput achieved is less than 200 Kbps, even
though the available bandwidth is 384 Kbps.
Figure 5.16 shows the retransmission delay. When maxDAT is 1, the re-
transmission delay for all cases is around 300 ms. This is because when the
maxDAT value is 1, there is no retransmission in effect, and the only rea-
son a retransmission can be allowed is in the case of a poll is needed to
be sent and a status is not received when the poll timer has expired [74;
61]. If there is no new PDU to be sent at that time, one of the old PDUs
still waiting for an ACK will be retransmitted just for the sake of polling,
and hence leading to a retransmission delay equal to the polltimer value, i.e.
300 ms. When maxDAT becomes greater than 1, the retransmission delay sta-
bilises and as expected, the larger the status prohibit timer, the larger the delay.
The corresponding retransmission delay values for the status prohibit timers
of 50,100, and 150 ms are 180, 200, and 220 ms, respectively.
Finally, the emulation results are compared with the theoretical model de-
1 2 3 4 5 8 10160
180
200
220
240
260
280
300
maxDAT [# Transmissions]
Ret
ran
smis
sio
n D
elay
[m
s]
StatusProhibit=50ms
StatusProhibit=100ms
StatusProhibit=150ms
Figure 5.16: Mean retransmission delays for different maxDAT and statusprohibitvalues, for a 100 Kbyte file.

5.3. EMULATION RESULTS 87
veloped at the beginning of this chapter in order to validatethe emulations.
Figure 5.17 shows the comparison between the actual download times from
the emulation results and the theoretical values evaluatedusing (5.14) in Sec-
tion 5.2.2. Since the theoretical analysis did not considerthe TCP connection
setup and termination times for the data channel, the valuesare adjusted here
to include the time taken for this procedure by adding 2×RT T, one for the
connection setup and one for the termination. An RTT is addedinstead of
1.5×RTT (as discussed in Chapter 3) for the connection setup and termina-
tion because the data channel setup procedure is initiated by the server and
hence, the data will start flowing immediately after the server receives the
ACK for the SYN. The maximum relative error between the theoretical and
actual values is within 9%.
Figure 5.18 shows the comparison between the actual RTT fromthe emu-
lation results and the theoretical values evaluated using (5.8) in Section 5.2.2.
As can be seen there is more difference between the theoretical and emulation
RTT values (up to 17%) as compared with the download time comparison.
This is because in the theoretical estimation, the impact ofqueueing was not
considered.
50 100 1503
3.2
3.4
3.6
3.8
4
4.2
4.4
4.6
Status Prohibit [ms]
Do
wn
load
Tim
e [s
ec]
Emulation
Theoretical
Theoretical (Adjusted)
Figure 5.17: Comparison of actual and theoretical download times.

88CHAPTER 5. PACKET SERVICE PERFORMANCE IN
UMTS: IMPACT OF RLC PARAMETERS
50 100 150
310
320
330
340
350
360
370
380
390
Status Prohibit [ms]
RT
T [
ms]
Emulation
Theoretical
Figure 5.18: Comparison of actual and theoretical RTT.
All the results shown in this chapter were generated for a 100Kbyte file
download. The performance impact on larger files will be similar to the 100
Kbyte case because, as discussed in Section 5.2.2, TCP reaches its steady state
for the considered settings very quickly. If very small file sizes are considered
the performance trend will still remain the same but the differences will be
more pronounced. For example, if a 1 Kbyte file is considered,only one packet
is needed to transfer the file and using a maxDAT configurationthat might
result in a TCP timeout could increase the download time significantly.
5.4 Summary
In this chapter, the performance of FTP file download over a UMTS dedicated
channel, under the assumptions of constant bit rate and uncorrelated errors
has been investigated. The investigations has been carriedout using simplified
analytical modelling and detailed real time emulations using a standard TCP
implementation and a UMTS network emulator.
It is found that the main factor determining the performanceis the maxDAT

5.4. SUMMARY 89
value, higher values giving the best goodput. The only downside of increased
maxDAT is increased RTT, but for the FTP service considered here that is
not an issue. However, for services such as web browsing where the RTT
is also an important performance metric, intermediate values of maxDAT are
recommended.
Status prohibit plays a significant role when the maxDAT is not large
enough, values closer to the RTT of the UMTS network giving better per-
formance. When the maxDAT is sufficiently large (≥ 4), status prohibit has
minor influence on performance: lower status prohibit values leading to per-
formance improvement. However, the improvement is inefficient because the
big throughput increase contributes only marginally to thegoodput.
The status overhead is shown to be very low, with a maximum value of
around 5%. In other words, the UL capacity required to accommodate status
reporting is small, showing that the retransmission mechanism employed by
RLC is very efficient.


Chapter 6
Packet Service Performance in
UMTS: Impact of Spurious
Retransmissions
In the previous chapter, the impact of different RLC parameters on the perfor-
mance of an FTP download session was discussed. The default TCP settings
of the Linux operating system were used, as the focus was solely on the RLC
protocol. In this and the next chapter, the focus shifts to TCP.
As discussed in the previous chapter, TCP’s performance in UMTS can
be improved by enabling persistent link layer retransmissions. The link layer
retransmissions were shown to transform the unreliable wireless channel into
a reliable one with variable delay. Unfortunately, higher channel errors is not
the only problem, and wireless networks can suffer more thanwired networks
from spurious retransmissions which are caused by several factors such as
a sudden increase of delay in the communication path. In thischapter we
investigate the impact of these spurious retransmissions on TCP performance.
The chapter is organised as follows. We start by discussing the causes
of spurious retransmissions in UMTS and some recommended solutions in
Section 6.1. Section 6.2 gives a brief survey of related work. The investigated
91

92CHAPTER 6. PACKET SERVICE PERFORMANCE INUMTS: IMPACT OF SPURIOUS RETRANSMISSIONS
cases and evaluation results are discussed in Sections 6.3 and 6.4, respectively.
Finally, Section 6.5 summarises the main findings from the investigations.
6.1 Spurious Retransmissions
6.1.1 Causes of Spurious Retransmission
A spurious retransmissionis an unnecessary retransmission that is performed
by TCP due to a mistaken inference of packet loss. The main causes of spuri-
ous retransmissions arepacket reorderinganddelay spikes.
Packet Reordering In wired networks, as different packets can traverse the
network via different paths, packets may be out of sequence when they reach
the receiver. As mentioned in Chapter 3, TCP responds to out of order re-
ception by sending duplicate ACKs, which might trigger aspurious fast re-
transmit. Measurements performed in[75], [76] and[77] show that packet
reordering is not uncommon on the Internet, and the probability of a reorder-
ing happening in a TCP session can be as high as 90%, dependingon the
network load.
As mentioned in the previous chapter, the RLC receiver in UMTS assem-
bles SDUs and sends them to upper layers in or out of sequence depending on
the setting of thein-sequence deliveryoption. Thus, on top of the reordering
that might happen in the wired part of the E2E path, RLC out of sequence
delivery will result in reordering at the TCP level as demonstrated in Figure
6.1.
Delay Spike A delay spikeis a sudden increase in the latency of a link and
it is more prevalent in wireless networks than in wired ones.The main causes
of delay spikes are bandwidth downgrade, link outage that ismasked through
persistent link layer retransmission, handover, and blockage by high priority
traffic [24; 78]. The packets that were delayed will arrive after the delay spike,

6.1. SPURIOUS RETRANSMISSIONS 93
out-of-sequence deliveryin-sequence delivery
Sent IP Packets
Sender Receiver
RLC RLC
33
Received IP Packets
Figure 6.1: Out of sequence delivery of RLC leading to packet reorderingat TCPlevel.
but TCP might have already timed out (spurious timeout) and retransmitted
the packets.
6.1.2 Impact on Performance
In [75], and [76], investigations were carried out on the impact of packet
reordering on TCP performance, the results showing that reordering leads
to performance degradation by making TCP resort to too many fast retrans-
mit/recovery invocations. Duplicate reception of retransmitted packets can
also further trigger spurious fast retransmissions due to the reception of mul-
tiple duplicate ACKs. Thus, spurious fast retransmissionslead to bandwidth
under-utilisation due to unnecessary retransmissions andunnecessary reduc-
tion of the congestion window.
Figure 6.2 illustrates the impact of spurious timeouts froma trace of a TCP
connection. Around 1.5 seconds after the connection has started, a delay spike
of 4 seconds was artificially introduced. The packet that caused the timeout
was retransmitted twice, first at around 2.8 seconds, and a second time at 5.4
seconds (due to the exponential back-off procedure described in Chapter 3).
The delay spike is finished at around 5.5 seconds, and the receiver starts send-
ing an ACK for the reception of the original transmissions. In ordinary TCP1,
1In this report, the term “ordinary TCP” refers to a non SACK new-Reno implementationof TCP.

94CHAPTER 6. PACKET SERVICE PERFORMANCE INUMTS: IMPACT OF SPURIOUS RETRANSMISSIONS
0 1 2 3 4 5 6 70
2
4
6
8
10
12x 10
4
Time [sec]
Seq
uen
ce #
of
sen
t p
acke
t [b
ytes
] Unecessary retransmissionof whole window
Figure 6.2: Example trace showing unnecessary retransmission of the whole windowof outstanding data due to TCP’s RTO recovery.
there is no way to distinguish between an ACK that is due to retransmissions
from an ACK that is acknowledging original transmission[79]. This is known
as theretransmission ambiguityproblem of TCP. Therefore, TCP can not tell
whether the retransmission it is performing are valid or redundant and it as-
sumes the incoming ACKs are in response to the retransmissions and will keep
on retransmitting the rest of the window.
6.1.3 Possible Solutions
The timing out of the retransmission timer due to delay spikes is hard to pre-
vent, as the sender is not aware of the delay spikes in the communication path.
In [80], a scheme is introduced where delays are artificially injected on the
communication path in a certain fashion to increase the RTT variance estimate
and hence avoid timeouts due to delay spikes. However, this scheme is not
effective if the delay spikes are long.
Fortunately, something can be done after the delay spike is over and the
ACKs for the original transmissions start to arrive. A solution for the spurious
retransmission problem has first to detect if the retransmissions are spurious,
6.1. SPURIOUS RETRANSMISSIONS 95
and if so revert unnecessary congestion control phases suchas slow start that
the sender have mistakenly entered after the spurious retransmission.
Some of the well known proposals for detecting and responding to spurious
TCP retransmissions are:
Eifel Algorithm: The timestamps option[50] can be used to detect spurious
retransmissions. When the timestamp option is used, the TCPsender inserts
the time of the packet generation in the TCP header and when ACKs are gen-
erated for these packets, the timestamps are echoed back. Thus, TCP will be
able to know whether incoming ACKs are due to first transmissions or retrans-
missions. TheEifel algorithm proposed in[26; 81] uses the timestamp for the
detection of spurious retransmissions2. When a congestion is detected (either
through triple duplicate ACKs or a timeout), Eifel saves thecongestion pa-
rameters along with the timestamp of the retransmission sent out. If the ACK
received later on for the concerned packet echoes back an older timestamp
than the saved one, the retransmission was a spurious one andEifel undoes
the congestion procedure and reverts to the state just before the spurious re-
transmission.
DSACK: As described in Section 3.3, TCP DSACK provides a possibility
to report duplicate reception of data and this can be used to detect spurious
retransmissions. In[82; 83; 84] a detailed description of how DSACK can
be used to detect spurious retransmissions is given. When congestion is de-
tected, the current congestion parameters are saved and thenormal congestion
procedure is undertaken. If a DSACK arrives signifying duplicate reception,
the congestion control procedure is undone by restoring thesaved parameters.
Note that Eifel and DSACK can coexist in the same TCP stack andbe en-
abled at the same time (this is the case in Linux TCP) as their operations are
independent from each other.
2Instead of using timestamps, a reserved bit in the TCP headercan also be used in Eifel assuggested in[26].

96CHAPTER 6. PACKET SERVICE PERFORMANCE INUMTS: IMPACT OF SPURIOUS RETRANSMISSIONS
Forward RTO Recovery (FRTO): Spurious retransmissions can also be
detected without using DSACK or timestamps. FRTO is one suchTCP en-
hancement[85; 86]. When a retransmission timeout occurs, FRTO retransmits
the packet without going into slow start (the ssthresh is, however, set to half
of the outstanding packets). If the first ACK after the timeout advances the
window, FRTO transmits two new packets instead of retransmitting the other
packets in the same window and enters congestion avoidance (i.e cwnd is set
to ssthresh). If the second ACK also advances the window, theretransmission
was most likely spurious because the second ACK is triggeredby an originally
transmitted packet. Otherwise, if either of the first or the second ACK is a du-
plicate ACK, this is an indication of a correct retransmission and FRTO will
go into slow start and continue as in ordinary TCP.
6.2 Related Work
Previous studies with regards to spurious retransmissionsin wireless networks
mainly dealt with delay spikes only. In[87], the Eifel algorithm is evaluated
in a simulated GPRS network with frequent cell re-selections occurring that
cause delay spikes. It is shown that Eifel can reduce the download time by up
to 12%. It is also shown that Eifel can lead to performance degradation when
real losses occur during the delay spike.
In [88], it is shown that Eifel performs better than TCP Reno in low band-
width links with no packet loss, while its performance worsens for high band-
widths with packet loss. Similar results are reported in thestudies carried out
in [89].
In [90], an enhanced version of the Eifel algorithm3 is suggested and its
performance is evaluated in a high bandwidth (2 Mbps) wired link that suffers
from frequent delay spikes during a 5 Mbyte file download session. It is shown
that Eifel can increase throughput by up to 240% in a non congested link, but
3The enhancements include restoring the congestion window even during multiple time-outs, and complex RTO calculation that takes the frequency of RTT samples into considera-tion.

6.3. INVESTIGATED SCENARIOS 97
can lead to performance degradation if a congestion is also occurring along
with the delay spikes.
Previous packet reordering studies mostly are concerned with wired net-
works. The author is aware of only one published work, described in[91], that
dealt with reordering due to link layer ARQ and its impact on TCP. Therein,
the simulations with TCP new Reno showed that using out of sequence deliv-
ery can lead upto 50% reduction in the throughput.
The studies carried out in this chapter differ from the ones mentioned
above in three main aspects, apart from issues of the realistic context of the
settings mentioned in Section 5.1. First, the focus here is mainly on packet
reordering though delay spikes are also considered. Secondly, a combination
of several TCP versions are studied. Finally, short-lived flows are investigated
instead of the bulk file downloads4.
6.3 Investigated Scenarios
As in Chapter 5, RESPECT is the tool used here to perform the investigations
(Appendix B). The investigations are divided into two parts: effect of out
of sequence delivery and delay spikes5. For both cases, the performance of
different TCP extensions are investigated.
The RLC parameters that deal with retransmissions are fixed based on the
results from the previous chapter, and the only RLC parameter that is inves-
tigated here is the in-sequence delivery. Though there are several TCP exten-
sions and optimisation proposals, only a few of them are wellaccepted by the
research community to be standardised by organisations such as the Internet
Engineering Task Force (IETF). Apart from that, many of the proposals that
are targeted to wireless networks assume a non reliable link, which does not
4Studies carried out in[92] indicate that most Internet flows are short lived (ranging fromfew seconds to few minutes), and we assume the traffic in the mobile Internet will be evenshorter due to cost and bandwidth limitations.
5For the delay spike investigations, RESPECT was slightlymodified to be able to introducearbitrary delays at any time during a TCP connection.

98CHAPTER 6. PACKET SERVICE PERFORMANCE INUMTS: IMPACT OF SPURIOUS RETRANSMISSIONS
apply to UMTS as the RLC protocol provides reliability. Mostof the standard-
ised extensions/options are not even used in many hosts on the Internet[93;
94]. In [94] investigations were carried out where some of the most widely ac-
cessed web servers were probed to find out their TCP capabilities. The results
showed that except for SACK, which more than 70% of the servers were found
to support, most of the other TCP extensions like limited retransmit have very
low deployment. In[95], it is found that 76% of the major Internet web servers
use the timestamp option.
With this in mind, we limit our focus here to those options/extensions that
have impact on spurious retransmissions and which are currently being stan-
dardised. Also, from these we consider only the ones that arecurrently avail-
able in Linux, as Linux is the most widely used operating system for hosting
web servers[96]. In Linux, the concept of spurious retransmission detection
is built in the TCP implementation[54]. Spurious retransmissions are de-
tected either through timestamps or DSACK. Once a spurious retransmission
is detected, congestion parameters are reverted to the state just before the re-
transmission.
FTP file download sessions were started using automated scripts under the
assumption that a DCH is already setup. For each of the considered cases, the
file download is repeated 300 times, and as in the previous chapter, the down-
loads are done in a randomised fashion. Table 6.1 summarisesthe different
settings used for the investigations in this chapter6.
6.4 Emulation Results
6.4.1 Impact of Delivery Order
Figure 6.3 shows the impact of the RLC delivery order on the download time
under different TCP settings. As can be seen from the figure, when in-sequence
delivery is used, there is no significant difference (< 1%) in the download
6Note that FRTO is not considered, as the Linux implementation of FRTO was found outto have bugs[97].

6.4. EMULATION RESULTS 99
Table 6.1: Parameter Settings for reordering and delay spike investigations.Parameter Value(s)
Common Settings
maxDAT 10
Poll last transmitted PDU true
Poll last retransmitted PDU true
Timer based polling (ms) 300
Missing PDU indication true
Status Prohibit (ms) 100
Bit rates (DL/UL) (Kbps) 384/32
TTI (ms) 10
File sizes (Kbyte) 100
Eifel (Timestamps) on/off
TCP SACK on/off
TCP FACK on/off
TCP DSACK on/off
TCP FRTO off
File Size [Kbyte] 100
FER (DL/UL)(%) 10/0
Reordering Investigations
RLC delivery order in sequence, out of sequence
Delay Spike Investigations
RLC delivery order in sequence
Extra delay duration (sec) [0.5, 1, 2, 3, 5]
Extra delay location (sec) [0, 0.5, 1, 2]
times between the different TCP settings. This is because nopackets are deliv-
ered out of order, i.e. no fast retransmissions due to tripleduplicate ACKs. The
small differences between the Eifel and non-Eifel cases forthe in-sequence de-
livery is due to the overhead of including the timestamps in the TCP header,
which requires 10 additional bytes in the TCP header[50]. Henceforth in this
section, unless otherwise specified, the discussions referto the out of sequence
cases.
For out-of-sequence delivery, when no SACK or its enhancements are
used, using Eifel decreases the download time by 33%, which translates to
a 68 Kbps increase in the goodput. The use of SACK/FACK increases the
download time, for both the Eifel and non Eifel cases, but by no more than 5%
(< 10 Kbps). When Eifel is not used, the use of DSACK decreasesthe down-
load time by 14%, corresponding to a 20 Kbps improvement in the goodput.

100CHAPTER 6. PACKET SERVICE PERFORMANCE INUMTS: IMPACT OF SPURIOUS RETRANSMISSIONS
NO SACK SACK FACK DSACK FACK+DSACK
3.5
4
4.5
5
5.5
6
6.5
Do
wn
load
Tim
e [
s]
No Eifel, Out of Sequence
No Eifel, In Sequence
Eifel, Out of Sequence
Eifel, In Sequence
Figure 6.3: Impact of RLC delivery order: Mean download times.
In order to understand these differences, the TCP retransmission ratio is
plotted in Figure 6.4. When Eifel is not used, using SACK reduces the re-
transmission ratio from 13% to 9% while it increases the download time from
6.0 seconds to 6.12 seconds. The reason why SACK leads to less retransmis-
sions is because the sender will not retransmit already received packets (as
NO SACK SACK FACK DSACK FACK+DSACK0
2
4
6
8
10
12
14
TC
PR
etr
an
sm
issio
n R
ati
o [
%]
No Eifel, Out of Sequence
No Eifel, In Sequence
Eifel, Out of Sequence
Eifel, In Sequence
Figure 6.4: Impact of RLC delivery order: Mean retransmission ratios.

6.4. EMULATION RESULTS 101
they are indicated in the SACK blocks), while it might do so inthe non SACK
case. The fact that download time is increasing while the retransmission ratio
is decreasing looks contradictory at first look, but it becomes clear when we
consider not only the number of retransmissions but also thetime when these
retransmissions occur.
In Figure 6.5, the Cumulative Distribution Function (CDF) of the time
instant at which the first retransmissions were sent for the SACK and no SACK
cases are shown. As can be seen from the figure, using SACK, regardless of
the Eifel setting, leads to the first retransmission to happen earlier.
The reason for this earlier retransmission behaviour of SACK is because
Linux’s implementation of SACK TCP is more aggressive than non SACK
TCP when it comes to entering fast retransmit and recovery phase. In non
SACK TCP fast retransmission is performed only when a certain number of
(usually three) duplicate ACKs are received, while in SACK TCP fast retrans-
mission can be performed if a SACK block arrives that acknowledges a packet
that is three or more packets away from the last packet that was cumulatively
0.5 1 1.5 2 2.5 3 3.5 4 4.50
0.1
0.2
0.3
0.4
0.5
0.6
0.7
0.8
0.9
1
Time of first retransmission [sec]
No SACK, No Eifel
No SACK, Eifel
SACK, No Eifel
SACK, Eifel
Figure 6.5: Impact of RLC delivery order: CDF of the time of the first TCP retrans-mission.

102CHAPTER 6. PACKET SERVICE PERFORMANCE INUMTS: IMPACT OF SPURIOUS RETRANSMISSIONS
ACKed7.
This is illustrated in Figure 6.6. The figure shows the trace of the sent
packets (the small rectangles), and ACKs received (solid curve representing
cumulative ACKs and vertical bars representing the start and end of the SACK
blocks) at the sender. Retransmissions are represented by across. At around
0.8 seconds, there is a retransmission because three duplicate ACKs are re-
ceived. However, at around 1.1 seconds, there is a retransmission even though
only one duplicate ACK is received because the SACK block that was re-
ceived (acknowledging bytes 29524-30984) along with the duplicate ACK was
4 packets (4*1460 bytes) away from the duplicate ACK (acknowledging byte
number 23684). Thus, TCP SACK in Linux acts like TCP FACK (described
in Section 3.3) when it comes to triggering fast retransmissions8 [98].
0 0.2 0.4 0.6 0.8 1
0.5
1
1.5
2
2.5
3
3.5
Time [sec]
Seq
uen
ce #
[b
ytes
]
Sent data
ACK received
Retransmission
SACK received
x 104
Figure 6.6: Time sequence graph illustrating Linux TCP SACK’s fast retransmissionbehaviour.
7In Linux, the initial value of the number of duplicate ACKs required to trigger fast re-transmission is three. However, when reordering is detected, this threshold is updated to thenumber of packets between the highest acknowledged packet so far and the currently acknowl-edged packet that was found to be duplicated[54].
8However, the behaviour is different during recovery because TCP FACK assumes theholes between the SACK blocks as lost, while in SACK they are assumed to be lost only ifthree discontiguous blocks are SACKed above the concerned packet or if a packet more thanthree packets away from the concerned packet is SACKed[58].

6.4. EMULATION RESULTS 103
The earlier fast retransmissions would have been beneficialif there was
actual data loss, but there is none as persistent RLC link layer retransmission
is employed. The end result of the earlier fast retransmits is to drive TCP into
congestion avoidance earlier than non-SACK TCP. Hence, thereason for the
increase in the download time despite the decrease in the retransmission ratio
when using SACK without Eifel.
Returning to Figure 6.3 and 6.4, it can be seen that when Eifelis used,
SACK leads to an increase in the download time and also the retransmission
ratio. Actually, the retransmission ratio is almost the same for the SACK/FACK
case regardless of the Eifel setting. This is because the retransmission be-
haviour of TCP SACK described earlier is prevalent. However, in the no
SACK case, TCP is able to detect unnecessary retransmissions with the help
of timestamps and stop from further unnecessary retransmissions of the whole
window. Thus, there is a reduction in the retransmission ratio when Eifel is
used without SACK as compared with the case when it is used with SACK.
FACK performs basically the same as in SACK because the earlyfast retrans-
mit behaviour is the same and also the FACK algorithm is disabled in Linux
TCP if reordering is detected[54].
Figures 6.3 also shows that for the case where Eifel is not used, DSACK
leads to a 13% improvement in the download time. The reason for the de-
crease in the download time is obvious, because with DSACK, spurious re-
transmissions can be detected and hence, unnecessary fast recovery phases are
reverted. However, the improvement is less than the one we can get from us-
ing Eifel because a DSACK block is sent in response to the reception of the
unnecessary retransmission while an ACK arriving with a timestamp earlier
than the retransmission’s timestamps immediately after the retransmission is
sent out will give the same information. Thus, Eifel is able to recover from
spurious retransmissions faster than DSACK.
Using FACK on top of DSACK, when Eifel is not used, leads to around
5% further decrease in the download time. This is because FACK is aggressive
when it comes to retransmissions during fast recovery, as itconsiders all the
holes between the SACKed blocks as lost. This increases the possibility of

104CHAPTER 6. PACKET SERVICE PERFORMANCE INUMTS: IMPACT OF SPURIOUS RETRANSMISSIONS
duplicate packet reception in the case of spurious retransmissions, and as such
decreases the wait time for a DSACK block, which shortens theunnecessary
fast recovery period.
Figure 6.7 shows the RTT for the different cases. As expected, the out of
sequence delivery cases lead to lower RTT as a packet is released immediately
after it is assembled properly by the RLC, while in the in sequence delivery
cases there is a re-sequencing delay. Also, note that Eifel leads to increased
RTT for both cases, leading to a 42% increase, on the average,for the out
of sequence cases and only a 3% increase for the in sequence cases. The
reason for this increase is due to the retransmission ambiguity mentioned in
Section 6.1.2. That is, when timestamps are not used, it is not possible to know
whether incoming ACKs are for original packets or for retransmissions and
thus they are not considered in the RTT statistics. And for the cases considered
here, as there were no packet drops, retransmitted packets are the ones that
were delayed due to out of sequence delivery, and as such are the ones with
the highest RTT value.
As all the results presented so far in this section show, out of sequence
delivery leads to performance degradation in terms of download times, but it
No SACK SACK FACK DSACK DSACK+FACK
250
300
350
400
450
500
550
600
650
700
RT
T [
ms]
No Eifel, Out of Sequence
No Eifel, In Sequence
Eifel, Out of Sequence
Eifel, In Sequence
Figure 6.7: Impact of RLC delivery order: Mean RTT.

6.4. EMULATION RESULTS 105
leads to a lower RTT. Another advantage of out of sequence delivery is the
lower memory requirement for buffering. Figure 6.8 shows the CDF of the
maximum buffer occupancy experienced at the UE during a download ses-
sion. As can be seen from the figure, the buffering requirement of in sequence
delivery is roughly twice that of out of sequence delivery. The absolute buffer-
ing requirement is not that much considering that even GPRS phones such as
the Nokia 6600TM come with megabytes of built-in memory and the price of
flash memory is becoming very cheap[99].
6.4.2 Impact of Delay Spikes
Figure 6.9(a) shows the TCP retransmission ratio for delay spikes of different
durations averaged over the different delay locations listed in Table 6.1. As ex-
pected, as the delay duration increases, so does the number of retransmissions.
However, the percentage increase decreases for larger delay values mainly due
to the exponential back-off mechanism of TCP described in Section 3.2.3. For
example, if a timeout occurs when the RTO is 3 seconds, the RTOwill be
doubled and the next retransmission will occur after 6 seconds. For example,
0 5 10 15 20 25 300
0.1
0.2
0.3
0.4
0.5
0.6
0.7
0.8
0.9
1
Buffer Occupancy [Kbytes]
Pro
b (
Ma
xim
um
Bu
ffe
r O
cc
up
an
cy
<
= a
bs
cis
sa
)
Out of Sequence
In Sequence
Figure 6.8: Impact of RLC delivery order: CDF of maximum buffer occupancies atthe UE.
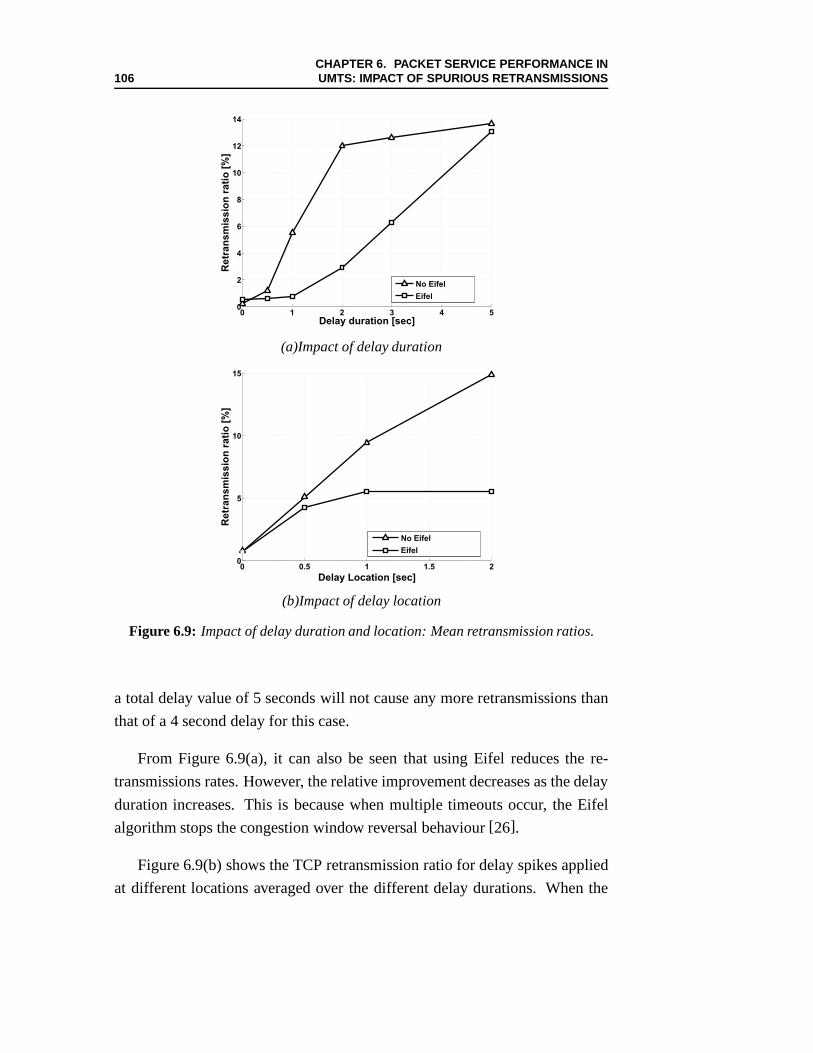
106CHAPTER 6. PACKET SERVICE PERFORMANCE INUMTS: IMPACT OF SPURIOUS RETRANSMISSIONS
0 1 2 3 4 50
2
4
6
8
10
12
14
Delay duration [sec]
Retr
an
sm
issio
n r
ati
o [
%]
No Eifel
Eifel
(a)Impact of delay duration
0 0.5 1 1.5 20
5
10
15
Delay Location [sec]
Retr
an
sm
issio
n r
ati
o [
%]
No Eifel
Eifel
(b)Impact of delay location
Figure 6.9: Impact of delay duration and location: Mean retransmissionratios.
a total delay value of 5 seconds will not cause any more retransmissions than
that of a 4 second delay for this case.
From Figure 6.9(a), it can also be seen that using Eifel reduces the re-
transmissions rates. However, the relative improvement decreases as the delay
duration increases. This is because when multiple timeoutsoccur, the Eifel
algorithm stops the congestion window reversal behaviour[26].
Figure 6.9(b) shows the TCP retransmission ratio for delay spikes applied
at different locations averaged over the different delay durations. When the

6.4. EMULATION RESULTS 107
delay is applied at 0 seconds, the SYN packet is the one that isaffected, and the
RTO estimator will not get any RTT samples to calculate the next estimate and
the RTO stays at 3 seconds. So delay values less than 3 secondsdo not trigger
any retransmissions, hence the average number of retransmissions when the
different delays are applied at the beginning of the connection is very low.
From Figure 6.9(b) it can also be seen that when the delay location in-
creases, so does the retransmission rate, but the percentage increase decreases.
This is because when the delays are applied earlier, even small delay durations
can cause a timeout. This is better understood by looking at sample traces,
shown in Figure 6.10. The RTO curves are generated by using the RTO esti-
mation algorithm employed in Linux[100]. Since the initial RTT experienced
by the first few packets is very low compared to the 3 second initial RTO, the
0 2 4 6 8 10 12 14 16 18 200
0.5
1
1.5
2
2.5
3
RTT Samples
RT
T/R
TO
[sec]
RTO
RTT
Timeout
(a)Delay location = 0.5 sec
0 5 10 15 20 25 30 35 400
0.5
1
1.5
2
2.5
3
3.5
4
4.5
5
RTT Samples
RT
T/R
TO
[sec]
RTO
RTT
Timeout
(b)Delay location = 2 sec
Figure 6.10: Example traces showing RTO and RTT evolution.

108CHAPTER 6. PACKET SERVICE PERFORMANCE INUMTS: IMPACT OF SPURIOUS RETRANSMISSIONS
RTO quickly drops at the beginning of a connection. Hence, a small delay
spike is able to trigger a retransmission when the delay is applied earlier. On
the other hand, as more and more packets are being transmitted, the queueing
delay gradually increases the RTT and TCP increases its RTO value. Thus,
a larger delay spike is required to trigger a timeout when thedelay occurs
later during the connection. However, when timeouts occur later during the
connection, the congestion window size is large, and more packets will be
retransmitted than the case of earlier timeouts. Hence, even though the possi-
bility of a timeout is reduced, the absolute retransmissionratio increases with
the delay location.
Figure 6.11(a) shows the download times for delay spikes of different du-
rations averaged over the different delay locations. It canbe seen that the
use of Eifel leads to up to 0.4 seconds improvement in the download time
(which corresponds to a 9% decrease in the download time or a 13 Kbps in-
crease in the goodput). When the delay duration is very low, Eifel performs
almost the same as the non Eifel case because the number of retransmissions
is small. For intermediate delay values, Eifel performs better. However, the
performance degrades as the delay duration increases sincethe probability of
multiple timeouts occurring increases, which disables Eifel’s congestion win-
dow reversal[26].
Figure 6.11(b) shows the download times for delay spikes applied at differ-
ent locations averaged over the different delay durations.The download time
is the highest for all the considered cases when the delays are applied at 0.5
seconds. As mentioned earlier, for lower delay location (with the exception
of delay location of 0 sec), the possibility of a timeout occurring is very high,
even for low delay durations, and hence the increase in the download time.
6.5 Summary
In this chapter the impact of spurious retransmissions on the performance of
FTP file download sessions over a UMTS network has been investigated. The

6.5. SUMMARY 109
0 1 2 3 4 5
4
5
6
7
8
9
10
Delay Durations [sec]
Do
wn
load
Tim
e [s
ec]
No Eifel
Eifel
(a)Impact of delay duration
0 0.5 1 1.5 25.6
5.7
5.8
5.9
6
6.1
6.2
6.3
6.4
Delay location [sec]
Do
wn
load
tim
e [s
ec]
No Eifel
Eifel
(b)Impact of delay location
Figure 6.11: Impact of delay duration and location: Mean download times.
causes of spurious retransmissions considered were reordering caused by us-
ing RLC out of sequence delivery and delay spikes caused by many factors
such as bandwidth downgrades or link outages that are maskedthrough per-
sistent link layer retransmissions.
Eifel is very effective in mitigating the problem of reordering caused by the
RLC out of sequence delivery option, increasing the goodputby up to 33%.
The use of SACK, however, causes performance degradation whether used
with Eifel or not. This is because there is a higher probability of entering the
fast retransmission phase earlier when using SACK as the sender does not have
110CHAPTER 6. PACKET SERVICE PERFORMANCE INUMTS: IMPACT OF SPURIOUS RETRANSMISSIONS
to wait for triple duplicate ACK. Using DSACK also improves performance
but the improvement in the goodput is not more than 14%.
From the delay spikes investigations it is found that although the use of
Eifel improves performance, the improvement is not as noticeable as in the
reordering cases (less than 9% improvement in the goodput).The reason for
this is that higher delay values trigger multiple retransmissions, in which case
the Eifel algorithm acts conservatively in the same way as ina normal slow
start. Delays applied at different locations also have different impacts on per-
formance. Lower delay values during the earlier stages of the FTP session are
able to cause timeouts, while higher delay values are required when the delays
are applied later.
The results show that for background services such as FTP, the use of in-
sequence delivery gives optimal results. However, out-of-sequence delivery
outperforms in-sequence delivery in terms of RTT and using Eifel lessens the
goodput degradation of out-of-sequence delivery. Thus, werecommend the
use of out-of-sequence delivery along with Eifel for interactive services such
as web browsing where both the goodput and the RTT are important perfor-
mance metrics.

Part IV
Heterogeneous Networks
111


Chapter 7
Packet Service Performance in
Heterogeneous Networks
Several wireless technologies exist, each one with its own advantages and
limitations. For example, GPRS/UMTS provide high mobilitywith limited
bandwidth while WLAN provides higher bandwidth with restricted mobility.
Thus, the current trend in mobile communications is not one network technol-
ogy replacing another, but rather the inter-operability between different net-
works [101; 102]. Thus, the investigation of packet service performance in
UMTS will not be complete without considering scenarios where UMTS co-
exists with other technologies, which is the rule rather than the exception[33;
103; 104].
In this chapter, the performance of packet services in UMTS when UMTS
coexists with GPRS and WLAN networks is investigated. As in the previous
chapter, the focus is on TCP and some of its extensions. The chapter is organ-
ised as follows. Section 7.1 gives an overview of heterogenous networks and
the main issues that impact performance in such networks. The investigated
cases are described in Section 7.2. Section 7.3 gives the investigation results.
Finally, Section 7.4 summarises the main findings from the investigations.
113
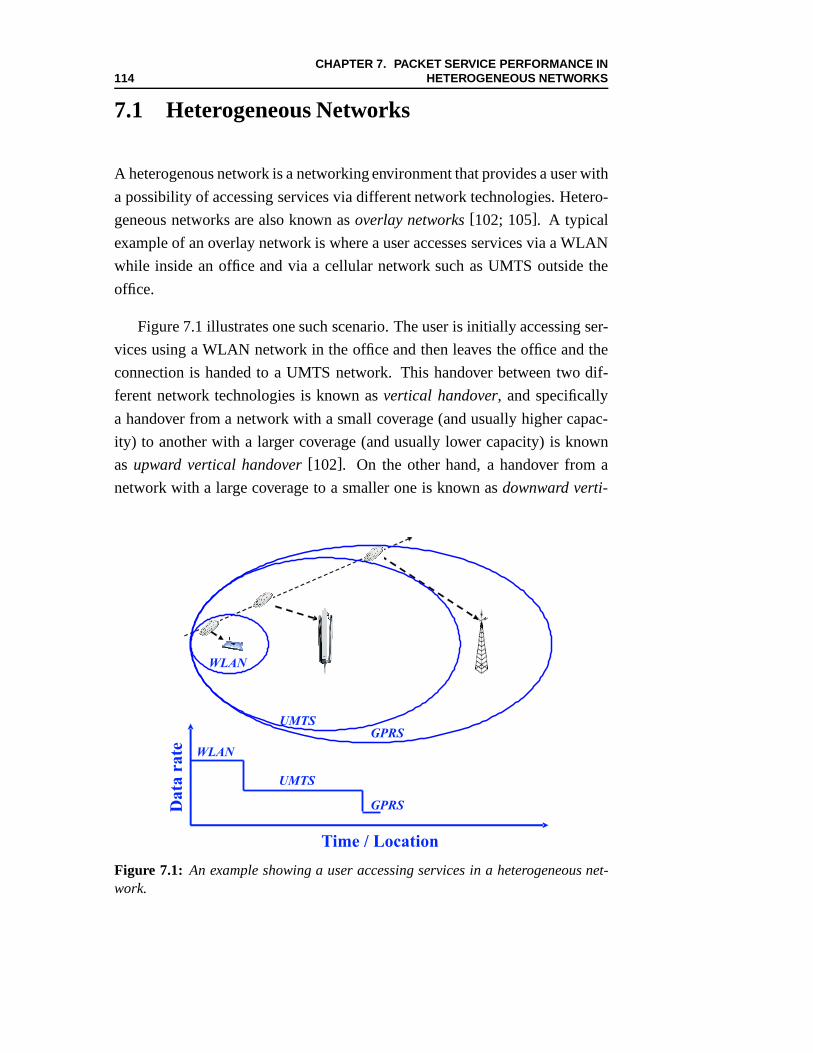
114CHAPTER 7. PACKET SERVICE PERFORMANCE IN
HETEROGENEOUS NETWORKS
7.1 Heterogeneous Networks
A heterogenous network is a networking environment that provides a user with
a possibility of accessing services via different network technologies. Hetero-
geneous networks are also known asoverlay networks[102; 105]. A typical
example of an overlay network is where a user accesses services via a WLAN
while inside an office and via a cellular network such as UMTS outside the
office.
Figure 7.1 illustrates one such scenario. The user is initially accessing ser-
vices using a WLAN network in the office and then leaves the office and the
connection is handed to a UMTS network. This handover between two dif-
ferent network technologies is known asvertical handover, and specifically
a handover from a network with a small coverage (and usually higher capac-
ity) to another with a larger coverage (and usually lower capacity) is known
as upward vertical handover[102]. On the other hand, a handover from a
network with a large coverage to a smaller one is known asdownward verti-
Time / Location
Data
rate WLAN
UMTS
GPRS
WLAN
UMTSGPRS
Figure 7.1: An example showing a user accessing services in a heterogeneous net-work.

7.1. HETEROGENEOUS NETWORKS 115
cal handover. After a while, the user leaves the coverage area of the UMTS
network and the connection is handed over to a GPRS network. Asimple han-
dover decision algorithm is one that lets the user get connected to the lowest
overlay network, i.e the one with highest capacity, as long as it is within the
range of the user, the network is not overloaded and the user’s mobility is not
leading to frequent handovers[102]. However, handover algorithms should
also consider several other factors such as service cost, security and power
consumption[106].
Vertical handovers can also be classified further ashard andsoft [105]. In
hard vertical handover, the user is connected to only one network at a time, i.e.
the connection with the previous network has to be broken before the new one
can be used. In soft handover, simultaneous connections with the concerned
networks can be made and data can be sent/received simultaneously to/from
the two network access points (see[103] and[104] for the issues concerning
soft vertical handover implementation).
When it comes to handling mobility and associated vertical handover, sev-
eral proposals exist that operate at the network (e.g. Mobile IP[107]), trans-
port (e.g. using Stream Control Transmission Protocol (SCTP) [31]) or even
application layer (e.g. using Session Initiation Protocol(SIP)[108]). The fo-
cus of this chapter is on the impact of vertical handover on TCP performance
rather than the mechanisms for implementing handover. The reader is referred
to [105; 109] and the references therein for the details of different handover
management techniques.
7.1.1 Performance Issues and Suggested Solutions
When a vertical handover occurs1, the data and ACK packets that are already
in flight will be lost, unless some buffering mechanism is used to tunnel the
data from the old connection to the new one when the handover is finished.
This data loss will trigger TCP retransmissions and possibly slow start that
1From here onwards, unless otherwise specified, by vertical handover it is meant hardvertical handover.

116CHAPTER 7. PACKET SERVICE PERFORMANCE IN
HETEROGENEOUS NETWORKS
will degrade the performance of the connection. Not only that, if the handover
period is long enough, multiple timeouts will occur, and theRTO is doubled
each time due to the exponential back-off behaviour described in Section 3.2.3.
This might lead to a long idle period after the handover is finished where TCP
waits for the RTO to expire.
Another effect of vertical handover that can lead to performance degra-
dation is the change in the BDP[110; 111]. As described in Section 3.1.2,
a window size equal to the BDP is ideal for a TCP connection because that
guarantees full link utilisation. If a handover is made froma large BDP net-
work to a small BDP network, even assuming ideal handover with no delay
or loss, congestion will occur as TCP will keep on using the larger window
size until congestion forces it to reduce it. On the other hand, a handover
from a small BDP to a large BDP network will not take advantageof the large
BDP and leads to lower utilisation for some time. Over-buffering (i.e. all
transmission queues are set to the largest possible BDP the connection can
be made through) is suggested to combat the impact of changing BDP [110;
111]. However, it is hard to find out the right buffer size beforehand, and also
it might lead to congestion after handover as mentioned before[111].
If the UE2 is equipped with a multi-mode interface that can simultaneously
transmit/receive using multiple networks technologies, soft handover can be
performed, basically eliminating the handover loss and delay. However, other
handover associated problems arise in this case. If a handover is being made
from a low bandwidth network to a higher one, reordering can result as the new
packets are received/transmitted through the new interface, which will lead to
performance degradation as described in the previous chapter. Similarly, ACK
reordering can also occur, where ACKs for higher sequence numbers sent over
the new link arrive before ACKs for older sequence numbers that are sent over
the old link. This ACK reordering will lead to a more bursty transmission
if the sender is increasing its window based on the amount of bytes ACKed,
instead of just the number of ACKs received[111].
2Although mobility is not part of the definition of a UE as givenin [45], in this report theUE is assumed to be mobile.

7.1. HETEROGENEOUS NETWORKS 117
In [112; 113] the problem of slow start due to lost packets during handover
and the impact of exponential back-off were addressed. In order to mitigate
packet loss, the solution suggested was to buffer data that is arriving in the old
access points and tunnel it to the new access point. This solution requires a
high buffering capability at the base stations if they are serving several users.
Also it was suggested that the UE sends a number of duplicate ACKs once the
handover is over to trigger fast retransmissions and thereby lessen the impact
of exponential back-off. However, this solution requires acommunication
between the link and transport layer in the UE in order to notify the transport
layer when the handover is finalised.
Solutions that are based on splitting (or proxying) the TCP connection
between the UE and the server at the access point exist and themost represen-
tative of these is I-TCP3 [114]. In I-TCP, when a UE wishes to communicate
with some fixed server, a request is sent to the current accesspoint to open a
TCP connection with the server on behalf of the UE. The UE communicates
with its access point on a separate connection using a variation of TCP that
is tuned for wireless links and is also aware of mobility. TheUE TCP only
sees an image of its peer TCP that in fact resides on the accesspoint. It is this
image that is handed over to the new access point in case the UEis handed
over to another cell or network. The main drawback of I-TCP isthat end-to-
end semantics of TCP are not preserved, i.e. the access pointsends ACKs to
the server when it gets data, disregarding the fact that the packet might get
lost during the transition between the access point and the UE. Also, long and
frequent handovers demand large buffering requirements atthe access point[115].
3As mentioned briefly in Chapter 5, split connection proposals are also applicable to stan-dalone wireless networks as they can mask wireless channel errors.

118CHAPTER 7. PACKET SERVICE PERFORMANCE IN
HETEROGENEOUS NETWORKS
7.2 Investigated Scenarios
7.2.1 Handover Buffering Mechanisms
Most of the methods mentioned in the previous section rely onbuffering data
during handover4. Thus, we focus our study to a general case where the con-
cern is mainly on different buffering mechanisms and their impact on TCP
performance.
Three different buffering mechanisms are considered:
• No Buffering (NB): All packets that were in flight when the handover
is started and also the ones that arrive during handover are dropped.
• Full Buffering (FB): All packets that were in flight when the handover
is started and also those that arrive during handover are queued. Most
existing buffering schemes for vertical handover use full buffering.
• Intermediate Buffering (IB): This is a buffering scheme that we pro-
pose where all packets that were in flight when the handover isstarted
are dropped but the ones that arrive during handover are queued.
We use Figure 7.2 to illustrate the three buffering mechanisms. For sim-
plicity, only data packets are shown. First the UE is accessing the packets from
the old access point, and since the wireless link has lower bandwidth a queue
will develop at the access point. Immediately after the arrival of packet 8, a
vertical handover is initiated, at which point there are four packets (packets 5–
8) in the access point’s buffer. Two more packets (9 & 10) arrive at the access
point during handover, and after a while there is a retransmission (packet R)
as the server is not getting any ACKs.
4There are also methods like M-TCP ([116]) and Freeze-TCP ([117]) that employ tech-niques to make the server aware of the handover and pause the transmission. However theyrequire a prediction of handover and/or need a communication framework between the UE’slink and TCP layers.

7.2. INVESTIGATED SCENARIOS 119
1
2
3
4
5
6
7
8
1
2
3
4
9
10
R
ServerOld Access
PointUE
Handover
Duration
New Access
Point
Figure 7.2: Figure used to illustrate the different buffering mechanisms.
If NB is employed, packets (5–10) will be flushed as well as theretrans-
mitted packet. With FB, immediately after handover is finished, packets 5–10
as well as the retransmitted packet are forwarded to the new access point and
then to the UE. With IB, packets 5–8 will be flushed while packets 9, 10 and
the retransmitted packet are stored in the old access point and forwarded to the
new access point and subsequently to the UE immediately after handover is
finished.
For the IB and FB cases we assume that there is a handover protocol/
mechanism that enables the forwarding between the access points. IB is easier
to implement (and requires less memory) than FB because the access point has
to buffer the packets only after a handover is initiated, while in the FB case the
non ACKed packets have to be buffered even before handover isinitiated after
they are transmitted to the UE.
7.2.2 Emulation Tool
As in the previous chapters, the RESPECT emulator is used. However consid-
erable modifications have been made to the emulator for the handover studies
(see Appendix B for the details). The main modification is that the network

120CHAPTER 7. PACKET SERVICE PERFORMANCE IN
HETEROGENEOUS NETWORKS
behaviour is described as a state machine (with states representing different
networks and sub-states defining the state within each network) instead of the
implementation of the protocol stack in the original RESPECT.
Each sub-state of a network is characterised by a given bandwidth and
latency. When a packet arrives at the emulator, if no handover is going on, the
delay the packet is going to experience (di) is calculated as:
di = (si
BWi)+Li +qi (7.1)
wheresi is the size of the packet,BWi is the currently allocated bandwidth
when packeti arrives,Li is the link latency (propagation delay + processing
delay), andqi is the queueing delay which depends on the number packets that
are currently on transit. A timer is started for each packet which has this value
and the concerned packet leaves the emulator when the timer expires.
A time limit or amount of data transmitted can be used to specify when a
transition should be made between networks or within the sub-states of a given
network. Also, the three different buffering mechanisms mentioned above
are implemented. No packet leaves the emulator during the handover period.
When the handover is over, if there are any queued packets (i.e if IB or FB
were used), the new delay that the packets are going to experience will be
updated using (7.1) as if each queued packet is arriving at that instant. Note
that this ensures that no reordering will occur when a handover is made from a
slow link to a faster one, and we assume that no soft vertical handover is going
on, i.e. data can not be sent using the two networks simultaneously.
7.2.3 Parameter Settings
Two different heterogenous network scenarios are investigated, one comprised
of UMTS and WLAN, and another comprised of UMTS and GPRS. Both
upward and downward vertical handover are investigated forthe two scenarios.
A 1 Mbyte file is downloaded, and handover is initiated immediately after half

7.3. EMULATION RESULTS 121
of the file has been downloaded. These values for the file size and the handover
initiation time are used to ensure that TCP has reached its steady state when
the handover starts. The link layers of the concerned mobilenetworks are
assumed to employ a reliability mechanism to mitigate wireless channel errors,
i.e. packet losses, if any, are only due handover. DifferentTCP extensions
which are available on the Linux platform are tested, for thesame reason as in
the previous chapter. Table 7.1 summarises the main parameters.
Table 7.1: Summary of main parameter settings.Parameter Value(s)
UMTS Bit rates (DL/UL) (Kbps) 384/32
UMTS one way latency (ms) 75
GPRS Bit rates (DL/UL) (Kbps) 32/32
GPRS one way latency (ms) 350
WLAN Bit rates (DL/UL) (Kbps) 1000/64
WLAN one way latency (ms) 5
File sizes (Mbyte) 1
Eifel (Timestamps) on/off
TCP SACK on/off
TCP DSACK on/off
Handover delay duration (sec) [0, 2, 5, 10]
7.3 Emulation Results
In this section, the results from the emulation runs are presented. First, the
results from WLAN to UMTS upward handover case are presented. Particular
results from the downward handover case and handover between UMTS and
GPRS are presented later on.
7.3.1 WLAN to UMTS Upward Handover
7.3.1.1 Ordinary TCP
Figure 7.3 shows the download times when a file download that started during
a WLAN connection is handed over to a UMTS connection midway through

122CHAPTER 7. PACKET SERVICE PERFORMANCE IN
HETEROGENEOUS NETWORKS
the download session. Linux TCP with SACK and Eifel disabledwas used for
the file downloads.
Notice that even when there is no handover delay, all the packets in flight
are dropped with NB and IB. This, combined with the fact that no data will
arrive during handover as the handover delay is zero, is the reason why the two
buffering mechanisms perform exactly the same when there isno handover
delay. FB in this case results in a 2 seconds decrease in the download time
(from 17.8 to 15.8 seconds), which translates to a 13% (60 Kbps) improvement
in the average goodput (from 471 Kbps to 531 Kbps).
When the handover delay is increased to 2 seconds, the use of IB leads to
a slight improvement in the download time (from 18.5 to 18 seconds, which
translates to a 13 Kbps or 3% improvement in terms of goodput)while FB
leads to performance degradation, increasing the downloadtime by 0.6 sec-
onds, and this is equivalent to a 14 Kbps or 3% decrease in the goodput. The
trend is similar for the 5 seconds delay case. This seems strange at first look,
but the TCP sequence traces reveal the reason behind this result.
Figures 7.4 - 7.6 show the TCP sender’s behaviour during handover for the
None Intermediate Full
16
18
20
22
24
26
28
Buffering Mode
Do
wn
load
Tim
e [s
ec]
HO delay = 0 sec
HO delay = 2 sec
HO delay = 5 sec
HO delay = 10 sec
Figure 7.3: Mean download times: WLAN to UMTS handover, SACK and Eifel dis-abled.

7.3. EMULATION RESULTS 123
4 5 6 7 8 9 10 11 12
4.6
4.8
5
5.2
5.4
5.6
5.8
6
6.2
6.4x 10
5
Time [sec]
Seq
uen
ce #
[b
yte
s]
Sent data
ACK received
Retransmission
Figure 7.4: Time sequence graph: WLAN to UMTS handover, 5 seconds handoverdelay, SACK and Eifel disabled, No buffering.
three different buffering schemes when the handover delay is 5 seconds. The
vertical dotted lines in the figures indicate the start and end of the handover
period.
Figure 7.4 shows that during handover, at 5.14 seconds, there is a timeout
(the RTO at this time was 770 ms) and the concerned packet is retransmitted.
A second and third timeout occur at 6.7 and 9.7 seconds, owingto TCP’s
4 5 6 7 8 9 10 11 12
4.6
4.8
5
5.2
5.4
5.6
5.8
6
6.2
6.4
6.6x 10
5
Time [sec]
Seq
uen
ce #
[b
yte
s]
Sent data
ACK received
Retransmission
Figure 7.5: Time sequence graph: WLAN to UMTS handover, 5 seconds handoverdelay, SACK and Eifel disabled, Intermediate buffering.

124CHAPTER 7. PACKET SERVICE PERFORMANCE IN
HETEROGENEOUS NETWORKS
4 5 6 7 8 9 10 11 12 13
4.6
4.8
5
5.2
5.4
5.6
5.8
6
6.2
6.4
6.6x 10
5
Time [sec]
Seq
uen
ce #
[b
yte
s]
Sent data
ACK received
Retransmission
Figure 7.6: Time sequence graph: WLAN to UMTS handover, 5 seconds handoverdelay, SACK and Eifel disabled, Full buffering.
exponential back-off mechanism. The first two retransmissions are lost since
nothing is buffered. The receiver will get only the third retransmission, and
when the ACK for this packet arrives, the rest of the packets that were lost are
retransmitted (as can be seen in the figure between around 10 to 11 seconds).
Figure 7.5 is similar to Figure 7.4 during the handover period, but as the
retransmissions are buffered, the receiver will get them immediately after the
handover, and it responds with an ACK. Thus, IB saves the sender from the
impact of exponential back-off, which was the cause of the wait after the han-
dover is finished for NB.
In Figure 7.6, the impact of exponential back-off is also reduced but this
time, not only the retransmission is buffered but also the whole window of data
that was lost at the start of handover for the other two buffering modes. When
the receiver starts getting the buffered data, it sends ACKsand the sender as-
sumes these ACKs correspond to the retransmissions and keeps sending the
rest of the window. After that, the retransmitted packets actually start arriving
at the receiver, and the receiver responds by sending duplicate ACKs. Fortu-
nately, thanks to the new-reno modification of TCP congestion control, these
duplicate ACKs will not drive the sender into fast retransmission. However,
the sender will have to stay idle for about 1.4 seconds while waiting for a new
7.3. EMULATION RESULTS 125
ACK to advance its window, and hence the performance degradation due to
FB.
From Figure 7.3 it can also be seen that as the handover delay increases, the
degradation due to FB decreases and it improves the performance as compared
with NB. This is because a larger handover delay increases the impact of the
exponential back-off as the RTO is doubled for each retransmission. Thus,
with NB, the idle time between the end of the handover and the reception
of the next retransmission (which can be seen in Figure 7.4) also increases,
worsening its performance. As the exponential back-off does not affect IB
and FB, any kind of buffering leads to improvement for large handover delays,
but still IB performs better (6% improvement in goodput for the 10 seconds
handover) than FB (2% improvement).
7.3.1.2 Eifel
Figure 7.7 shows the download times when Eifel is enabled. Comparing the
values from this figure with that of Figure 7.3 shows that for handover delay
values of 0 and FB, the performance is the same regardless of the Eifel set-
ting, while for NB and IB, the performance worsens with Eifel(additional 1.1
seconds in the download time).
Figure 7.8 shows the time sequence graph for the case of Eifelused along
with NB when the handover delay is zero. As can be seen from thefigure, after
the handover is finished (there is only one vertical bar because the handover
delay is zero), there is a timeout and a retransmission at around 5.2 seconds.
An ACK is received after a small delay5 and this ACK contains a timestamp
earlier than the retransmitted packet. This is because the original transmis-
sion of the retransmitted packet was received properly, butthe corresponding
ACK was dropped due to handover. Thus, Eifel finds out that particular re-
transmission was erroneous, reverts the congestion windowand transmits two
new packets. The reception of these new packets generates only a duplicate
5Linux employs delayed ACKs (except for the first few packets)and one ACK is sentfor every two packet received or after the reception of one packet if nothing is received aftercertain delay.

126CHAPTER 7. PACKET SERVICE PERFORMANCE IN
HETEROGENEOUS NETWORKS
None Intermediate Full
16
18
20
22
24
26
28
30
Buffering Mode
Do
wn
load
Tim
e [s
ec]
HO delay = 0 secHO delay = 2 secHO delay = 5 secHO delay = 10 sec
Figure 7.7: Mean download times: WLAN to UMTS handover, Eifel enabled, SACKdisabled.
ACK. Although the decision that the retransmission of that particular packet
was spurious is right, it leads to performance degradation.The sender has to
wait for another timeout (at around 7 seconds), thus becoming idle for 1.3 sec-
onds before it starts retransmitting the packets that are actually lost. Please
refer to Appendix E for a detailed analysis of this behaviour.
Comparing Figures 7.3 and 7.7 again, it can be seen that when the handover
4 4.5 5 5.5 6 6.5 7 7.5 8 8.5
4.6
4.8
5
5.2
5.4
5.6
5.8
6
6.2x 10
5
Time [sec]
Seq
uen
ce #
[b
yte
s]
Sent data
ACK received
Retransmission
Figure 7.8: Time sequence graph: WLAN to UMTS handover, no handover delay,Eifel enabled, No buffering.

7.3. EMULATION RESULTS 127
delay is increased to 2 seconds, the result is the same for NB,but using Eifel
leads to performance degradation with IB (a 3.4 seconds increase in the down-
load time, equivalent to 16% or 73 Kbps decrease in the goodput). For FB,
Eifel leads to a 1.2 seconds improvement in the download time, corresponding
to 6% or 26 Kbps increase in the goodput. Figures 7.9 - 7.11 illustrate this
behaviour.
As can be seen from Figure 7.9, when NB is used, there is a timeout during
handover and since nothing is buffered, there is another timeout after handover,
and after that the rest of the window is retransmitted. The behaviour is differ-
ent from that of Figure 7.8 because, as discussed in the previous chapter, Eifel
becomes more conservative and stops reverting the congestion window when
multiple timeouts occur for a given packet[26].
In Figure 7.10 a similar effect to that of Figure 7.8 can be seen, because
multiple timeouts are avoided due to the buffered retransmission. Thus, Eifel
finds that particular retransmission was spurious and starts sending new data.
As in Figure 7.8, another timeout is required to detect the loss of the other
packets. The performance degradation is clearly visible asonly 600000 bytes
are sent by 11 seconds in this case, while more than 700000 bytes are sent out
at the same time for NB.
4 5 6 7 8 9 10 11
4.6
5
5.4
5.8
6.2
6.6
7x 10
5
Time [sec]
Se
qu
en
ce
# [
by
tes
]
Sent data
ACK received
Retransmission
Figure 7.9: Time sequence graph: WLAN to UMTS handover, 2 seconds handoverdelay, Eifel enabled, No buffering.

128CHAPTER 7. PACKET SERVICE PERFORMANCE IN
HETEROGENEOUS NETWORKS
4 5 6 7 8 9 10 11
4.6
4.8
5
5.2
5.4
5.6
5.8
6
6.2
6.4
6.6x 10
5
Time [sec]
Se
qu
en
ce
# [
by
tes
]
Sent data
ACK received
Retransmission
Figure 7.10: Time sequence graph: WLAN to UMTS handover, 2 seconds handoverdelay, Eifel enabled, Intermediate buffering.
In Figure 7.11, there is only one retransmission, which is buffered during
handover and sent out immediately after. As there was only one timeout, the
Eifel algorithm is in full operation. It detects the retransmission was spurious
and reverts the congestion windows back to the state just before the handover,
and transmission of new data is resumed. Since all the packets were queued,
this decision will lead to performance improvement as compared with the pre-
vious case. The sender is able to send around 800000 bytes by 11 seconds.
4 5 6 7 8 9 10 114.5
5
5.5
6
6.5
7
7.5
8x 10
5
Time [sec]
Se
qu
en
ce
# [
by
tes
]
Sent data
ACK received
Retransmission
Figure 7.11: Time sequence graph: WLAN to UMTS handover, 2 seconds handoverdelay, Eifel enabled, Full buffering.
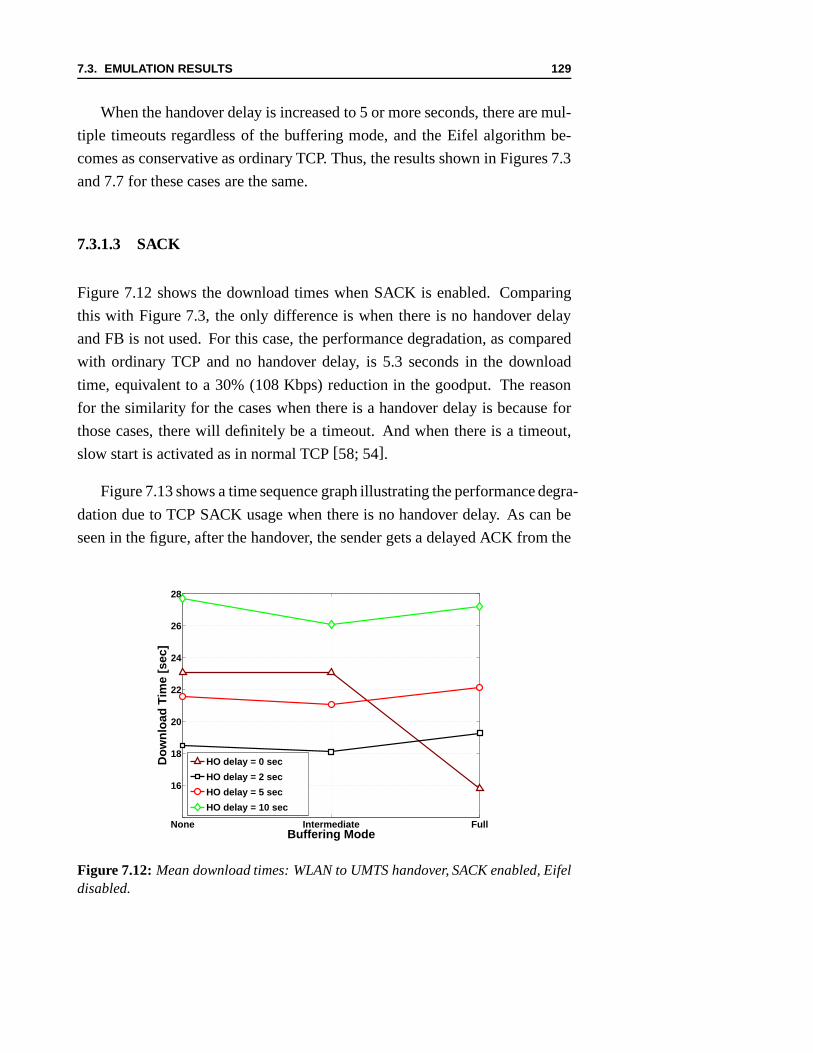
7.3. EMULATION RESULTS 129
When the handover delay is increased to 5 or more seconds, there are mul-
tiple timeouts regardless of the buffering mode, and the Eifel algorithm be-
comes as conservative as ordinary TCP. Thus, the results shown in Figures 7.3
and 7.7 for these cases are the same.
7.3.1.3 SACK
Figure 7.12 shows the download times when SACK is enabled. Comparing
this with Figure 7.3, the only difference is when there is no handover delay
and FB is not used. For this case, the performance degradation, as compared
with ordinary TCP and no handover delay, is 5.3 seconds in thedownload
time, equivalent to a 30% (108 Kbps) reduction in the goodput. The reason
for the similarity for the cases when there is a handover delay is because for
those cases, there will definitely be a timeout. And when there is a timeout,
slow start is activated as in normal TCP[58; 54].
Figure 7.13 shows a time sequence graph illustrating the performance degra-
dation due to TCP SACK usage when there is no handover delay. As can be
seen in the figure, after the handover, the sender gets a delayed ACK from the
None Intermediate Full
16
18
20
22
24
26
28
Buffering Mode
Do
wn
load
Tim
e [s
ec]
HO delay = 0 sec
HO delay = 2 sec
HO delay = 5 sec
HO delay = 10 sec
Figure 7.12: Mean download times: WLAN to UMTS handover, SACK enabled, Eifeldisabled.

130CHAPTER 7. PACKET SERVICE PERFORMANCE IN
HETEROGENEOUS NETWORKS
4 5 6 7 8 9 10 11 12 13 14
4.6
4.8
5
5.2
5.4
5.6
5.8
6
6.2
6.4
6.6x 10
5
Time [sec]
Seq
uen
ce #
[b
yte
s]
Sent data
ACK
Retransmission
SACK
Figure 7.13: Time sequence graph: WLAN to UMTS handover, no handover delay,SACK enabled, No buffering.
receiver. This delayed ACK results in the retransmission oftwo new packets.
When the receiver gets these packets, it responds by sendingduplicate ACKs
with SACK information. As the SACKed block is several packets above the
packet acknowledged by the duplicate ACK, TCP SACK immediately retrans-
mits the concerned packet. This particular step is advantageous as compared
with the no SACK case, because there is no waiting for a timeout or a triple
duplicate ACK. However, due to the conservative SACK based recovery em-
ployed by Linux[58; 54], the TCP sender will retransmit one packet at a time
when an ACK with a SACK block arrives. It takes more than 7 seconds for the
sender to recover from the packet losses. If SACK was not used, the sender
would have waited for a timeout. However, after that the retransmission of
all the lost data would have taken a shorter time because it would have been
done in slow start mode where two retransmissions are sent for every incoming
ACK.
The results when SACK is enabled along with Eifel follow the same pat-
tern as the non-Eifel case, i.e. the zero handover delay caseleads to perfor-
mance degradation while the other cases perform the same.

7.3. EMULATION RESULTS 131
7.3.1.4 DSACK
The results when DSACK is enabled show the same behaviour as in SACK be-
cause when the DSACK blocks arrive it is already too late, andthe bandwidth
is already wasted through unnecessary retransmissions. Anexample illustrat-
ing this is shown in Figure 7.14. Comparing this with Figure 7.6, it can be
seen that the only difference is that the receiver sends a DSACK block when-
ever it gets a duplicate segment, i.e. when the unnecessary retransmissions are
received. Unfortunately, the sender is not able to make proper use of this in-
formation because all the unnecessary retransmissions have already been sent
out.
7.3.2 Other Results
7.3.2.1 UMTS to WLAN Downward Handover
The upward and downward handover results are basically the same except for
these three notable exceptions. First, for the 2 seconds and10 seconds han-
dover delays, FB performs better than NB when ordinary TCP isused. The
4 5 6 7 8 9 10 11 12 13
4.6
4.8
5
5.2
5.4
5.6
5.8
6
6.2
6.4
6.6x 10
5
Time [sec]
Seq
uen
ce #
[b
yte
s]
DSACKblocks
Sent data
ACK received
Retransmission
Figure 7.14: Time sequence graph: WLAN to UMTS handover, 5 seconds handoverdelay, DSACK enabled, Full buffering.

132CHAPTER 7. PACKET SERVICE PERFORMANCE IN
HETEROGENEOUS NETWORKS
RTT of the packets just before handover in this case is around1.4 seconds
while it was 0.52 seconds for the upward handover case. The corresponding
RTO value is around 1.8 seconds. Thus, after the first timeout, for the 2 sec-
onds delay and NB case, additional 3.4 seconds have to elapsebefore there is
another timeout and the lost data can be retransmitted6. Redundant retransmis-
sion is performed as before for the FB case, but still it takesless than the 3.4
seconds that the sender has to wait for the NB case. The 10 seconds handover
delay case follows a similar pattern.
Secondly, the SACK effect discussed in Section 7.3.1.3 for the zero han-
dover case leads to performance improvement instead (a 1.1 seconds decrease
in the download time, equivalent to a 6% (30 Kbps) increase inthe goodput as
compared with the no SACK case) because the retransmissionsare sent over a
WLAN link that has a smaller RTT and higher bandwidth. Figure7.15 shows
the time sequence plot illustrating this. Comparing this with Figure 7.13, the
recovery took only 2.4 seconds, which is one third of the timeit took for the
upward handover case (roughly equal to the ratio between thedata rates of the
two networks).
11 12 13 14 14.5
5
5.2
5.4
5.6
5.8
6
6.2
6.4
Time [sec]
Seq
uen
ce #
[b
yte
s]
Sent data
ACK
Retransmission
SACK
x 105
Figure 7.15: Time sequence graph: UMTS to WLAN handover, no handover delay,SACK enabled, No buffering.
6The first timeout will occur after 1.8 seconds, and due to exponential back off the secondtimeout will occur 3.6 seconds after the first timeout, i.e. 5.4 seconds from the start of thehandover. The handover is finished 2 - 1.8 = 0.2 seconds after this second timeout period isstarted. Thus the sender remains idle for 3.6 - 0.2 = 3.4 seconds.

7.3. EMULATION RESULTS 133
The third major change that is noticed between the upward anddownward
handover cases is when Eifel is used. This is because during ahandover delay
of 5 seconds, there will be only one timeout since a second timeout will require
5.4 seconds. This means that the Eifel algorithm will be fully operational for
IB and, making the same decision as described in section 7.3.1.2, will lead to
performance degradation. On the other hand, FB gives the best performance
for all handover cases except the 10 seconds handover.
7.3.2.2 Handover between UMTS and GPRS
The results for the UMTS to GPRS upward handover follow the same trend as
that of the upward handover between WLAN and GPRS, i.e. IB gives the best
performance for most of the cases. However, the results werequite different
for the downward handover between GPRS and UMTS.
Figure 7.16 shows the results for this case. As can be seen from the figure,
IB degrades performance for all the cases except when there is no handover
delay, increasing the download time by up to 20 seconds for the 10 seconds
handover delay case (equivalent to 12% (5 Kbps) decrease in goodput). Fig-
None Intermediate Full145
150
155
160
165
170
175
180
185
190
Buffering Mode
Do
wn
load
Tim
e [s
ec]
HO delay = 0 sec
HO delay = 2 sec
HO delay = 5 sec
HO delay = 10 sec
Figure 7.16: Mean download times: GPRS to UMTS handover, Eifel and SACK dis-abled.

134CHAPTER 7. PACKET SERVICE PERFORMANCE IN
HETEROGENEOUS NETWORKS
ures 7.17 and 7.18 show the traces for the case of 10 seconds handover delay
for the NB and IB, respectively, to illustrate the differences.
In Figure 7.17, a timeout occurs around 8 seconds after the handover is
finished, and the retransmission of the lost packets resumes. On the other
hand, in Figure 7.18, immediately after handover, the buffered ACKs that were
saved during handover arrive at the sender and they cause theretransmission
of new data. Since an extra 10 seconds was introduced in the RTT of the
packets that just got ACKed, the RTO is also increased to reflect this change.
Hence, the sender waits an extra 17 seconds after handover before starting
retransmissions.
Returning to Figure 7.16, it can also be seen that when NB is used the
results are the same regardless of the four different handover delay cases con-
sidered. Also FB performs better for all the considered cases. This is due to
the RTT value when handover starts. The RTT values for the case of 10 sec-
onds handover delay for the different buffering schemes is shown in Figure
7.19. When the handover is started the RTT is more than 15 seconds, which is
well over the maximum handover delay considered, i.e. only one timeout will
occur because of handover for NB and IB and there will be none for FB. The
figure also shows the increase in the RTT due to buffering immediately after
handover for IB and FB.
130 135 140 145 150 155
5
5.2
5.4
5.6
5.8
6
6.2
6.4x 10
5
Time [sec]
Se
qu
en
ce
# [
by
tes
]
Sent data
ACK received
Retransmission
Figure 7.17: Time sequence graph: GPRS to UMTS handover, 10 seconds handoverdelay, Eifel and SACK disabled, No buffering.

7.3. EMULATION RESULTS 135
130 135 140 145 150 155 160 165 170 175
5
5.2
5.4
5.6
5.8
6
6.2
6.4x 10
5
Time [sec]
Se
qu
en
ce
# [
by
tes
]
Sent data
ACK received
Retransmission
Figure 7.18: Time sequence graph: GPRS to UMTS handover, 10 seconds handoverdelay, Eifel and SACK disabled, Intermediate buffering.
Figure 7.20 shows the download times for the GPRS to UMTS handover
case when Eifel is enabled. Comparing this with Figure 7.16 it can be seen
that the use of Eifel has an impact for non zero handover delays when NB is
used, while the rest of the cases are almost the same as before.
When there is no handover delay, immediately after handovera delayed
ACK is received, which properly acknowledged everything the receiver has
got. So when a timeout occurs for the cases of NB and IB, it willbe for an
0 50 100 150 2000
5
10
15
20
25
Time [sec]
RT
T [
sec]
No buffering
Intermediate buffering
Full buffering
Figure 7.19:RTT progression: GPRS to UMTS handover, 10 seconds handoverdelay,Eifel and SACK disabled.
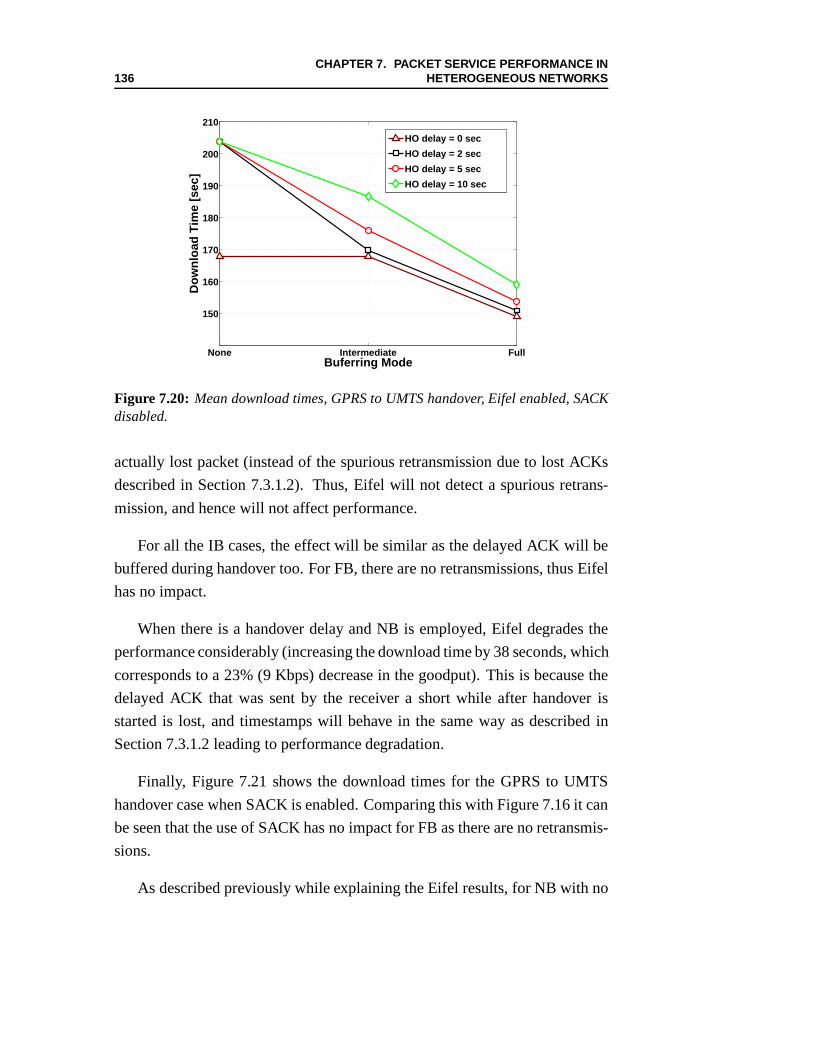
136CHAPTER 7. PACKET SERVICE PERFORMANCE IN
HETEROGENEOUS NETWORKS
None Intermediate Full
150
160
170
180
190
200
210
Buferring Mode
Do
wn
load
Tim
e [s
ec]
HO delay = 0 sec
HO delay = 2 sec
HO delay = 5 sec
HO delay = 10 sec
Figure 7.20: Mean download times, GPRS to UMTS handover, Eifel enabled, SACKdisabled.
actually lost packet (instead of the spurious retransmission due to lost ACKs
described in Section 7.3.1.2). Thus, Eifel will not detect aspurious retrans-
mission, and hence will not affect performance.
For all the IB cases, the effect will be similar as the delayedACK will be
buffered during handover too. For FB, there are no retransmissions, thus Eifel
has no impact.
When there is a handover delay and NB is employed, Eifel degrades the
performance considerably (increasing the download time by38 seconds, which
corresponds to a 23% (9 Kbps) decrease in the goodput). This is because the
delayed ACK that was sent by the receiver a short while after handover is
started is lost, and timestamps will behave in the same way asdescribed in
Section 7.3.1.2 leading to performance degradation.
Finally, Figure 7.21 shows the download times for the GPRS toUMTS
handover case when SACK is enabled. Comparing this with Figure 7.16 it can
be seen that the use of SACK has no impact for FB as there are no retransmis-
sions.
As described previously while explaining the Eifel results, for NB with no

7.4. SUMMARY 137
None Intermediate Full
148
150
152
154
156
158
160
162
164
166
Buffering Mode
Do
wn
load
Tim
e [s
ec]
HO delay = 0 sec
HO delay = 2 sec
HO delay = 5 sec
HO delay = 10 sec
Figure 7.21: Mean download times, GPRS to UMTS handover, SACK enabled.
handover delay and for all the IB cases, a delayed ACK will be received by the
sender, which responds by sending new packets. The reception of these new
packets will cause the generation of SACK blocks, which results in immediate
retransmission (in a similar fashion to that shown in Figure7.13). This avoids
the waiting for the timeout, which was around 20 seconds. Thus, even though
only one packet is sent per round trip time due to SACK recovery, this is still
much faster than waiting for a timeout and using slow start for the retransmis-
sions. The performance improvement is up to 20 seconds in download time or
11% (5.5 Kbps) as compared with the no SACK case.
When NB is employed and the handover delay is not zero, the performance
remains the same as in Figure 7.16. This is because the delayed ACK will be
lost and no new data will be sent. Thus, no SACK blocks will be sent by the
receiver and the sender has to wait for a timeout before retransmitting the lost
packets.
7.4 Summary
In this chapter, the performance of packet services in a heterogenous network
comprised of UMTS, WLAN and GPRS has been investigated. The behaviour

138CHAPTER 7. PACKET SERVICE PERFORMANCE IN
HETEROGENEOUS NETWORKS
of ordinary TCP, Eifel and SACK under different handover conditions has
been studied. A new buffering scheme called Intermediate buffering (IB),
where only packets that arrive during handover are buffered, is proposed. The
performance of IB is compared with Full buffering (FB), where all the packets
in-flight when the handover is started are buffered in addition to the packets
that arrive during the handover, and also with No buffering (NB) schemes.
Table 7.2 summarises the results for all the cases considered in this chapter. In
the table, the comparisons are made row wise. The signs “+ +”,“+”, “-” and “-
-” refer to the best, better (more than average), worse (lessthan average) and
worst performers for the concerned handover case, respectively.
Table 7.2: Summary of performance results for the different handover cases, bufferingschemes and TCP extensions considered.
No Handover Delay
No Buffering Intermediate Buffering Full Buffering
Ordinary Eifel SACK Ordinary Eifel SACK Ordinary Eifel SACK
WLAN-UMTS + - - - + - - - + + + + + +
UMTS-WLAN - - - + - - - + + + + + + +
UMTS-GPRS + - - - + - - - + + + + + +
GPRS-UMTS - - - + - - - + + + + + + +
Small Handover Delay (2 seconds)
No Buffering Intermediate Buffering Full Buffering
Ordinary Eifel SACK Ordinary Eifel SACK Ordinary Eifel SACK
WLAN-UMTS + + + + + - - + + - + + -
UMTS-WLAN - - - + + - - + + + + + +
UMTS-GPRS + + + + + - + + - - + + - -
GPRS-UMTS - - - - - - + + + + + + +
Medium Handover Delay (5 seconds)
No Buffering Intermediate Buffering Full Buffering
Ordinary Eifel SACK Ordinary Eifel SACK Ordinary Eifel SACK
WLAN-UMTS + - + + + + + + + - - - - - -
UMTS-WLAN + + + + + - - + + + + + +
UMTS-GPRS + + + + + + + + + + - - - - -
GPRS-UMTS + - - + - - + + + + + + +
Large Handover Delay (10 seconds)
No Buffering Intermediate Buffering Full Buffering
Ordinary Eifel SACK Ordinary Eifel SACK Ordinary Eifel SACK
WLAN-UMTS - - - - + + + + + + - - -
UMTS-WLAN - - - - + + + + + + + + +
UMTS-GPRS + + + + + + + + - - - - -
GPRS-UMTS + - - + - - + + + + + + +
7.4. SUMMARY 139
For the no handover delay cases, FB performs the best. For nonzero han-
dover delay cases and ordinary TCP, IB is the best performer.The only excep-
tion is the GPRS to UMTS downward handover, where a delayed ACK that
was buffered during handover made TCP to overestimate the RTT, and TCP
timeout took a longer time. FB performs even worse than NB forthe upward
handover cases because the whole window of lost data is retransmitted even
though it was buffered. For downward handover cases, FB performs better
than NB as the impact of exponential back-off is more severe due to the larger
RTT in the first (slower) network in which the file download is started from.
Eifel degrades the performance of IB for the cases where a single timeout
occurs. This is because there is actual data loss but Eifel detects a spurious
retransmission when a delayed ACK that was buffered during handover arrives
at the sender immediately after handover and the sender has to wait for another
timeout to detect that actual data loss has occurred. For NB,the performance
also becomes worse with Eifel for most of the cases because a delayed ACK
is lost instead and there will be a retransmission later on. Eifel detects this
retransmission is spurious when an ACK is received, and thusthe sender has
to wait for yet another timeout to retransmit the lost data. Eifel improves the
performance of FB because there is no actual data loss in thiscase, and Eifel
detects spurious retransmissions, if any, and avoid unnecessary retransmission
of the whole window of data and also reverts the congestion window.
SACK has no effect on the performance of FB as there is no data loss, and
hence no SACK blocks are generated. For IB, SACK has a positive impact
on the performance in the downward handover from GPRS to UMTSbecause
the lower RTT in UMTS makes the one packet per RTT recovery employed
by SACK to be more effective than waiting for a timeout with the RTO of
a GPRS network. There is no change in performance due to SACK in the
upward handover case between UMTS and GPRS (and also for bothvertical
and downward handover cases between UMTS and WLAN) because atimeout
occurs and slow start is activated instead of SACK based recovery. For NB, if
there is a handover delay, everything is lost, so there is also no SACK blocks
generated. However, when there is no handover delay, SACK has a positive
impact for the downward handover cases and a negative impactfor the upward

140CHAPTER 7. PACKET SERVICE PERFORMANCE IN
HETEROGENEOUS NETWORKS
case, for the same reasons as in IB.

Part V
Subjective Quality
141


Chapter 8
Subjective Evaluation of
Packet Service Performance
QoS is usually identified by some basic performance metrics such as delay,
throughput and jitter. In the previous chapters, the performance investigations
were carried out based on these objective measures. As the main impact of
QoS provision is on the end user, a detailed study on QoS should involve the
end user. So in this chapter, a different approach is taken where the perfor-
mance is evaluated using subjective measures that are acquired through us-
ability testing. The purpose of this testing is twofold: to find out if there is any
noticeable trend in users’ perceived QoS and if so, if the subjective measures
are in line with objective measures of quality.
The termusability testingis broadly defined in[118] as"a process that em-
ploys participants who are representative of the target population to evaluate
the degree to which a product meets specific usability criteria". The usability
criteria is a combination of many factors such as learnability, efficiency, ease
of use, error proneness, and overall satisfaction[119]. In this chapter, the only
usability criteria of interest is the general user satisfaction as we are not con-
cerned about new services but only about the network throughwhich they are
provided.
The chapter is organised as follows. Section 8.1 describes the usability test
143

144CHAPTER 8. SUBJECTIVE EVALUATION OF
PACKET SERVICE PERFORMANCE
design and setup. The results from the experiments are analysed in Section 8.2.
Finally, Section 8.3 summarises the findings from this chapter.
8.1 Usability Test Design and Setup
The main concern while designing a usability test is to make sure that the
test isreliable andvalid [119; 120]. Reliability addresses the issue whether
the results will be similar if the test is to be repeated several times. On the
other hand,validity is concerned with whether the result actually reflects the
usability issues that are being tested.
Usability tests can be made more reliable by making sure thatthe condi-
tions under which the tests are carried out are similar for each test user. How-
ever, due to the inherent differences (in terms of experience, taste, mood, etc...)
between the test users, assuring reliability is not always so easy. Reliability
can be improved by testing as many users as possible and analysing the results
using standard statistical methods such as Analysis of Variance (ANOVA)1.
Validity is a more subtle issue because it is mainly dependent on the test
methodology and not only the variability of test users. The major validity
problems arise due to:
• choice of the wrong group of users, for example, users to which the
product or service may not be relevant to in real life
• choosing the wrong tasks, for example, asking users to deal with very
simplified tasks as compared to real tasks
• confounding effects, for example, inadvertently changinga parameter
that is not being tested along with a parameter that is being tested
A usability test has to be designed properly before being carried out to
1ANOVA is a statistical method that can be used to check if there is a significant differencebetween the means of multiple sets of data by splitting the overall observed variance intowithin-conditions and between-conditions variances[73; 121].

8.1. USABILITY TEST DESIGN AND SETUP 145
ensure that it is as valid and reliable as possible. A proper test design should
specify thepurposeof the experiment,user profiles, test methodology, test
environment, task lists, andevaluation measures[118; 120]. In the follow-
ing sections each of these facets of the usability test design process for the
experiments carried out in this chapter are described.
8.1.1 Purpose
The overall goal of the usability experiment conducted hereis to find out the
effect of network characteristics on users’ perception of quality of web brows-
ing and streaming services in mobile networks, and to see if the users’ percep-
tion matches with objective quality measures. Web browsingand streaming
are chosen not only because they are widely used on the Internet, but also
because they are already available in many recent mobile devices. For web
browsing, the considered environment is a UMTS network, andthe test inves-
tigates the impact of FER, bandwidth, and RTT. For the streaming services,
the environment is a heterogeneous network comprised of UMTS and WLAN,
and the test investigates the impact of handover-induced bandwidth upgrades
and downgrades.
The results of this evaluation can be useful for operators, service providers,
network equipment manufactures and researchers in the telecom area. The
findings will help to indicate which factors have a major impact on the per-
ceived QoS when it comes to web browsing and streaming services. Based on
the results, the concerned stakeholders will be able to optimise their network
to bring more satisfaction to the end user and as a consequence increase their
revenue.
8.1.2 User Profile
According to[119] at least 30 users are required to get acceptable statistics
for a usability experiment if the results are gathered through questionnaires.
Thus, a total of 40 participants, of which 8 are female, are tested during the

146CHAPTER 8. SUBJECTIVE EVALUATION OF
PACKET SERVICE PERFORMANCE
first two weeks of April, 2006 at Aalborg University. Due to time and resource
limitations most of the participants are colleagues and friends from and around
the university. All of the participants are above the age of 23, and ten are above
the age of 40. All the participants are mobile phone users. Figures 8.1(a)
and 8.1(b) show the experience of users with regard to services on the wired
Internet and via their mobile devices, respectively. All the users have access
to high speed fixed Internet (10 Mbps+) connection at work/school, and they
used the Internet on a daily basis. All users but one also havea fixed Internet
connection of 500 Kbps+ at home.
0
5
10
15
20
25
30
35
40
Us
ers
Email WebBrowsing
AudioStreaming
VideoStreaming
OnlineGaming
VoIP
Used at least once
Used frequently
(a) Internet service usage
0
5
10
15
20
25
30
35
40
Users
VoiceCalls
SMS Email WebBrowsing
AudioStreaming
VideoStreaming
Used at least once
Used frequently
(b) Mobile service usage
Figure 8.1: Users’ service experience.
8.1. USABILITY TEST DESIGN AND SETUP 147
8.1.3 Methodology
Usability tests can be conducted using eitherindependent groupsor within-
subjectsdesign[118; 120]. In independent groups design, subjects are as-
signed to different experimental conditions, while in within-subjects design
(also known asrepeated measures) all subjects experience all the experimen-
tal conditions.
Within-subjects design is preferable when there is a shortage of test users,
but it has the disadvantage that the results may be biased if there is any possi-
bility of learning during the experiment which can affect the conditions to be
tested later on during a given session. Also, if the time required for testing is
substantial, independent grouping is preferred, as user tiredness can influence
the end result.
Within-subjects design is used in the usability tests conducted here be-
cause of the limited number of subjects available. There is aminimal risk of
learnability in the usability tests conducted here, because all the users are al-
ready aware of the services under investigation. There is, however, a risk of
bias depending on the order of the conditions being tested. For example, if the
first network condition being tested is the best one, the user’s expectation can
become very high and the latter conditions might end up beingrated very low.
This bias was mitigated by using randomised testing, where the different test
conditions were presented in a random fashion to each user. The test session is
also designed to last only 40 minutes in order to avoid the bias due to tiredness,
albeit this means a reduction in the number of conditions to be tested.
The different test sessions have to be conducted in a consistent manner, i.e.
keep all the conditions apart from the ones being tested as constant as possible.
In order to insure consistency, all the test sessions are moderated by one test
conductor and written instructions are provided to the subjects as well as oral
ones to avoid the risk of leaving out some details. At the beginning of each
session, each subject is given an orientation to the experiment being conducted
which clearly specifies the purpose of the experiment and what is expected
from them. The instructions are read off from a script (whichis shown in

148CHAPTER 8. SUBJECTIVE EVALUATION OF
PACKET SERVICE PERFORMANCE
Appendix D.1) in order to make sure each subject gets the sameinformation.
The instruction basically tells the subjects the purpose ofthe experiment is to
test the effect of different network conditions on perceived QoS and that they
have to assume that they are accessing the services through amobile network.
8.1.4 Test Environment
The test environment has to be as realistic as possible. Also, the environment
should be consistent from one subject to another. Taking these two factors
(i.e. consistency and realism) into account, the test environment is setup as
shown in Figure 8.2. As can be seen from the figure, the browsing and stream-
ing services are provided through a local server instead of the Internet. This
ensures that results from the different users will not be affected by external
factors such as network congestion, i.e. ensure consistency. Internet Infor-
mation Server (IIS)TM from Microsoft Cooperation and HelixTM streaming
server from Real Networks are used for hosting the web pages and the stream-
ing videos, respectively. Internet ExplorerTM with disabled caching is used
for browsing, while Real PlayerTM is used as the streaming client application.
The services are accessed through a Fujitsu-SiemensTM LT P-600 tablet
PC connected via a stable 54 Mbps WLAN to a network emulator. The WLAN
link to the emulator is used only to make the setup more realistic as the subjects
are told that they have to assume that the services were accessed via a mobile
Test Subject Test Conductor
Server (http &
streaming)Emulator
Access point
Tablet PC
Figure 8.2: Usability test setup.
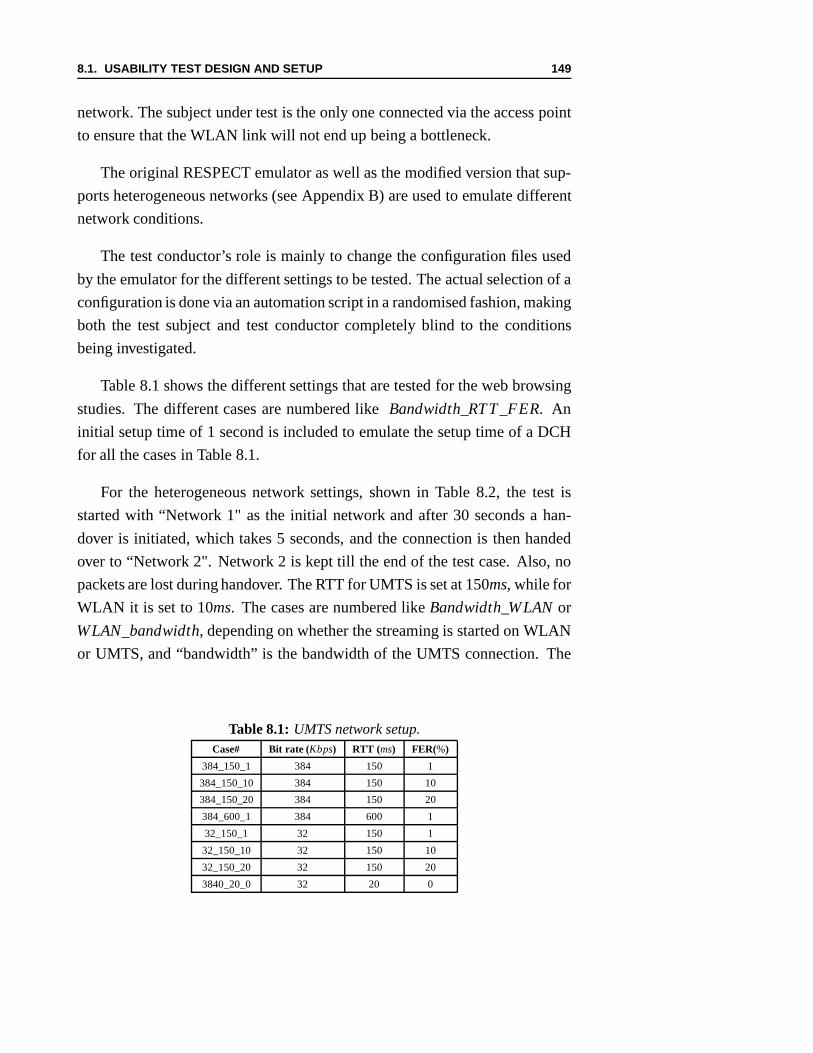
8.1. USABILITY TEST DESIGN AND SETUP 149
network. The subject under test is the only one connected viathe access point
to ensure that the WLAN link will not end up being a bottleneck.
The original RESPECT emulator as well as the modified versionthat sup-
ports heterogeneous networks (see Appendix B) are used to emulate different
network conditions.
The test conductor’s role is mainly to change the configuration files used
by the emulator for the different settings to be tested. The actual selection of a
configuration is done via an automation script in a randomised fashion, making
both the test subject and test conductor completely blind tothe conditions
being investigated.
Table 8.1 shows the different settings that are tested for the web browsing
studies. The different cases are numbered likeBandwidth_RTT_FER. An
initial setup time of 1 second is included to emulate the setup time of a DCH
for all the cases in Table 8.1.
For the heterogeneous network settings, shown in Table 8.2,the test is
started with “Network 1" as the initial network and after 30 seconds a han-
dover is initiated, which takes 5 seconds, and the connection is then handed
over to “Network 2". Network 2 is kept till the end of the test case. Also, no
packets are lost during handover. The RTT for UMTS is set at 150ms, while for
WLAN it is set to 10ms. The cases are numbered likeBandwidth_WLANor
WLAN_bandwidth, depending on whether the streaming is started on WLAN
or UMTS, and “bandwidth” is the bandwidth of the UMTS connection. The
Table 8.1: UMTS network setup.Case# Bit rate (Kbps) RTT (ms) FER(%)
384_150_1 384 150 1
384_150_10 384 150 10
384_150_20 384 150 20
384_600_1 384 600 1
32_150_1 32 150 1
32_150_10 32 150 10
32_150_20 32 150 20
3840_20_0 32 20 0
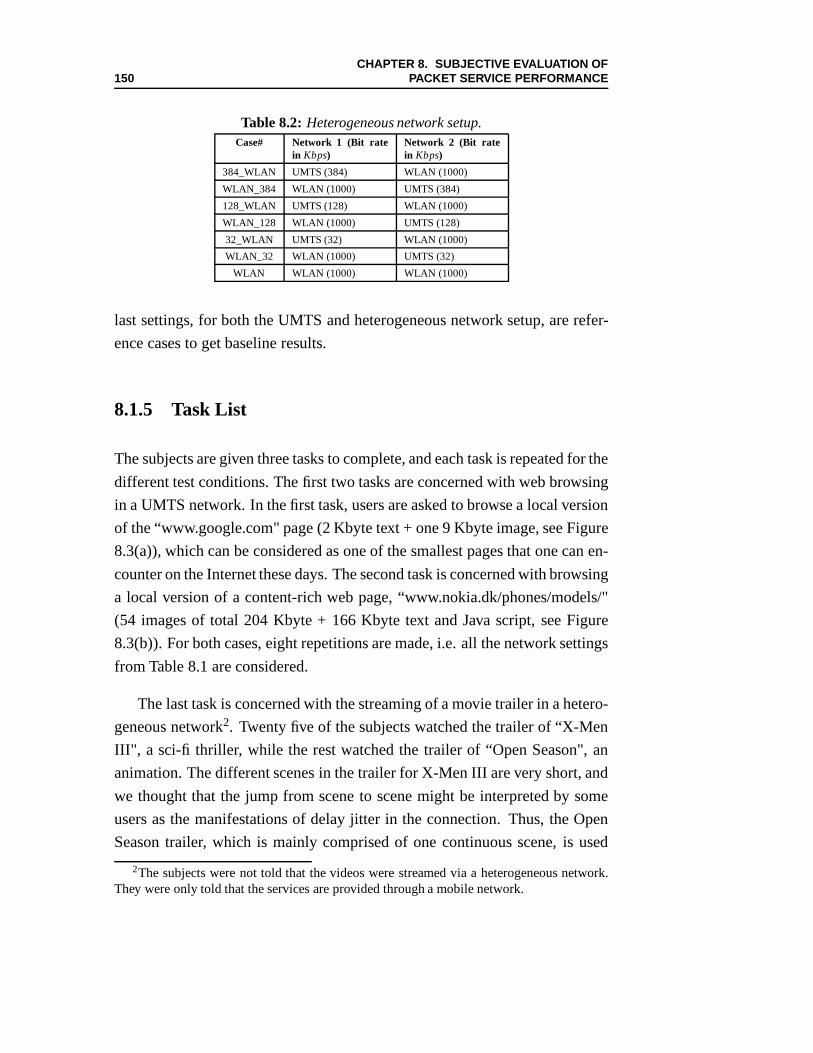
150CHAPTER 8. SUBJECTIVE EVALUATION OF
PACKET SERVICE PERFORMANCE
Table 8.2: Heterogeneous network setup.Case# Network 1 (Bit rate
in Kbps)Network 2 (Bit ratein Kbps)
384_WLAN UMTS (384) WLAN (1000)
WLAN_384 WLAN (1000) UMTS (384)
128_WLAN UMTS (128) WLAN (1000)
WLAN_128 WLAN (1000) UMTS (128)
32_WLAN UMTS (32) WLAN (1000)
WLAN_32 WLAN (1000) UMTS (32)
WLAN WLAN (1000) WLAN (1000)
last settings, for both the UMTS and heterogeneous network setup, are refer-
ence cases to get baseline results.
8.1.5 Task List
The subjects are given three tasks to complete, and each taskis repeated for the
different test conditions. The first two tasks are concernedwith web browsing
in a UMTS network. In the first task, users are asked to browse alocal version
of the “www.google.com" page (2 Kbyte text + one 9 Kbyte image, see Figure
8.3(a)), which can be considered as one of the smallest pagesthat one can en-
counter on the Internet these days. The second task is concerned with browsing
a local version of a content-rich web page, “www.nokia.dk/phones/models/"
(54 images of total 204 Kbyte + 166 Kbyte text and Java script,see Figure
8.3(b)). For both cases, eight repetitions are made, i.e. all the network settings
from Table 8.1 are considered.
The last task is concerned with the streaming of a movie trailer in a hetero-
geneous network2. Twenty five of the subjects watched the trailer of “X-Men
III", a sci-fi thriller, while the rest watched the trailer of“Open Season", an
animation. The different scenes in the trailer for X-Men IIIare very short, and
we thought that the jump from scene to scene might be interpreted by some
users as the manifestations of delay jitter in the connection. Thus, the Open
Season trailer, which is mainly comprised of one continuousscene, is used
2The subjects were not told that the videos were streamed via aheterogeneous network.They were only told that the services are provided through a mobile network.

8.1. USABILITY TEST DESIGN AND SETUP 151
(a) Google page
(b) Part of the Nokia page
Figure 8.3: Web pages used for the web browsing experiments.
for control purposes. Both trailers are one and a half minutes long, and they
are encoded into a SureStreamTM file [122; 123] for 350 Kbps and 100 Kbps
connections, so that an encoding rate that is appropriate for the connection can
be chosen dynamically by the streaming client and server. The users watched
the movie trailer seven times, each corresponding to a setting from Table 8.2.
In order for the users to be sure a given task is complete, an explicit Suc-
cessful Completion Criteria (SCC) is required[118]. For the web browsing
sessions, since the connection parameters are kept constant for a given test
case, the subjects are told that they can stop the session anytime if they have

152CHAPTER 8. SUBJECTIVE EVALUATION OF
PACKET SERVICE PERFORMANCE
already decided about the connection’s quality. This reduces the duration of
each experiment because for some of the cases, the web page download can
take considerable time. For the streaming services, the SCCis defined as the
time when the movie stream finishes playing.
8.1.6 Evaluation Measures
The subjective satisfaction is measured by a questionnairethat the subjects
filled during the test. The International Telecommunication Union (ITU) rec-
ommends three main ways of determining perceived quality[124] 3:
• Absolute Category Rating (ACR): The subject rates each test case one
at a time based on a certain scale.
• Degradation Category Rating (DCR): The (expected) best test case is
shown to the user and the user is asked to compare and rate another case
based on the best case.
• Comparison Category Rating (CCR): This is similar to DCR but in
this case, pairwise comparison is made in no particular order, i.e. the
first test case the user experiences can be better or worse than the second
one.
ACR leads to shorter test durations than DCR and CCR, as no pairwise
comparison is involved. Also, it is less biased than DCR because the user is
not aware whether conditions are improving or worsening beforehand. Due
to these reasons, ACR is used for most of the test subjects. However, for the
streaming tests, eight of the subjects performed a combination of ACR and
DCR, where they are shown the trailer on the server machine (i.e. showing
them the maximum quality they could expect based on the encoding) before
they began rating the different cases. This is done as a control case, to see if
3The categories were originally defined for determining perceived acoustic quality of voicecalls over a CS telephone network, but they are equally applicable here.

8.2. RESULTS 153
other factors such as original encoding quality and frame rate were biasing all
the results.
Based on the recommendations in[124; 118], a scale from one (“Unaccept-
able") to five (“Excellent") is used to rate the quality of each repetition of the
three different tasks. The questionnaire used is shown in Appendix D.2. The
test conductor changes the settings and tells the subject togo ahead with the
next task. The user performs the task and grades the case thatwas just tested.
The process is repeated till all the cases are dealt with. Table 8.3 summarises
the main parameters used in the usability experiments.
Table 8.3: Main parameter settings for usability investigations.Parameter Value(s)
Common Settings
# users 40
Services Web browsing, Streaming
Web browsing settings
Web pages Google (2 Kbyte text + 9 Kbyte image (1 image file))
Nokia (166 Kbyte text + 204 Kbyte image (54 files)
Initial setup time (sec) 1
Bit rates (Kbps) 384, 32
RTT (ms) 150, 600
FER (%) 1, 10, 20
Streaming settings
Video Clips (Trailers) X-Men III, Open Season
RTT (ms) 150 (UMTS), 10 (WLAN)
FER (%) 0
Clip duration (sec) 90
Encoding rate (Kbps) 350 + 100 (SureStream)
Initial buffering (sec) 10
Handover cases UMTS (384, 128, 32 Kbps) <–> WLAN (1000 Kbps)
Handover delay (sec) 5
8.2 Results
8.2.1 Web Browsing
Figure 8.4 is a box plot that shows the distribution of the ACRresults of all
the eight different settings for the part of the test concerned with browsing (for
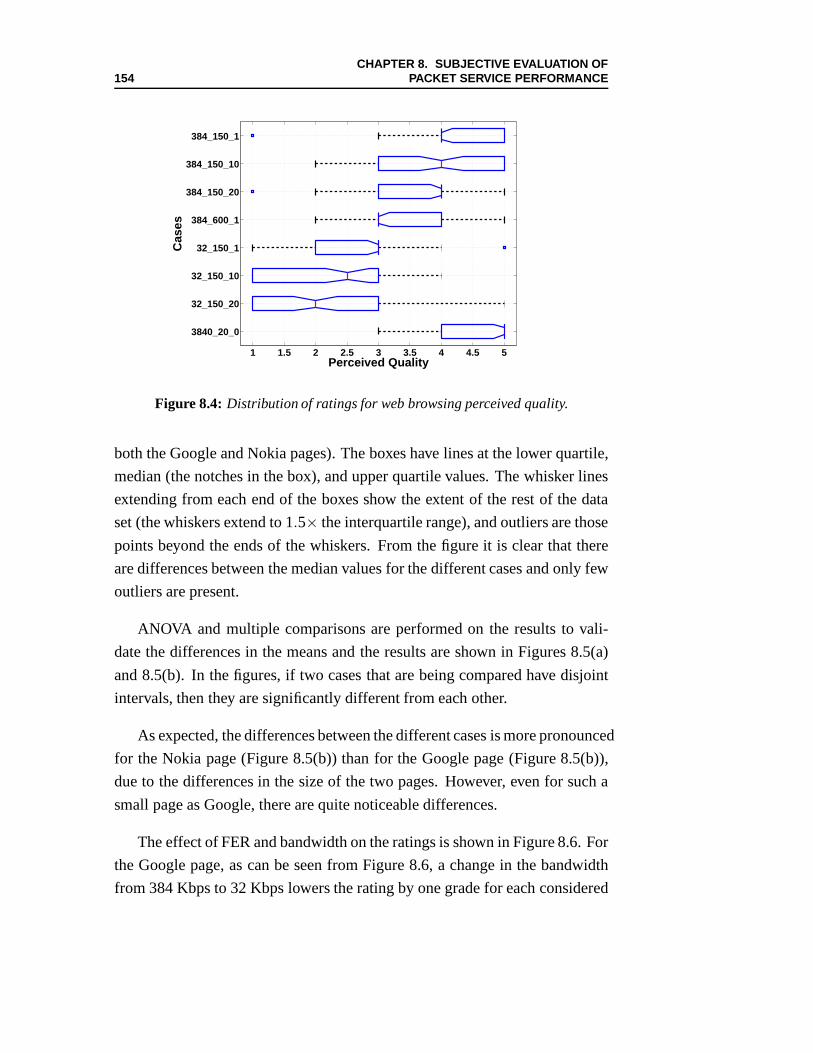
154CHAPTER 8. SUBJECTIVE EVALUATION OF
PACKET SERVICE PERFORMANCE
1 1.5 2 2.5 3 3.5 4 4.5 5
3840_20_0
32_150_20
32_150_10
32_150_1
384_600_1
384_150_20
384_150_10
384_150_1
Perceived Quality
Cas
es
Figure 8.4: Distribution of ratings for web browsing perceived quality.
both the Google and Nokia pages). The boxes have lines at the lower quartile,
median (the notches in the box), and upper quartile values. The whisker lines
extending from each end of the boxes show the extent of the rest of the data
set (the whiskers extend to 1.5× the interquartile range), and outliers are those
points beyond the ends of the whiskers. From the figure it is clear that there
are differences between the median values for the differentcases and only few
outliers are present.
ANOVA and multiple comparisons are performed on the resultsto vali-
date the differences in the means and the results are shown inFigures 8.5(a)
and 8.5(b). In the figures, if two cases that are being compared have disjoint
intervals, then they are significantly different from each other.
As expected, the differences between the different cases ismore pronounced
for the Nokia page (Figure 8.5(b)) than for the Google page (Figure 8.5(b)),
due to the differences in the size of the two pages. However, even for such a
small page as Google, there are quite noticeable differences.
The effect of FER and bandwidth on the ratings is shown in Figure 8.6. For
the Google page, as can be seen from Figure 8.6, a change in thebandwidth
from 384 Kbps to 32 Kbps lowers the rating by one grade for eachconsidered

8.2. RESULTS 155
1 1.5 2 2.5 3 3.5 4 4.5 5
3840_20_0
32_150_20
32_150_10
32_150_1
384_600_1
384_150_20
384_150_10
384_150_1
Cas
es
Perceived Quality
(a)Google page
1 1.5 2 2.5 3 3.5 4 4.5 5
3840_20_0
32_150_20
32_150_10
32_150_1
384_600_1
384_150_20
384_150_10
384_150_1
Cas
es
Perceived Quality
(b)Nokia page
Figure 8.5: Confidence intervals for the perceived quality of the web browsing exper-iments.
FER. On the other hand, the Nokia page ratings are lowered by two grades for
the same changes. For a given bandwidth, higher FER values lead to lower
grades for both pages. However, the differences are not thatsignificant for the
Google page as can be seen from the overlap in the multiple comparison plots
of Figure 8.5(a). For the Nokia page, the FER differences also do not lead to
significant rating differences except between FER values of1% and 20% for
the 384 Kbps case.

156CHAPTER 8. SUBJECTIVE EVALUATION OF
PACKET SERVICE PERFORMANCE
1 10 201.5
2
2.5
3
3.5
4
4.5
FER (%)
Per
ceiv
ed Q
ual
ity
Google at 384kbps
Google at 32kbps
Nokia at 384kbps
Nokia at 32kbps
Figure 8.6: Effect of FER and bandwidth on perceived QoS.
Figure 8.7 shows the effect of RTT on the ratings, for a bandwidth of 384
Kbps and an FER of 1%. As can be seen from the figure, the RTT variation
causes noticeable difference in the ratings for both pages.The reason for this is
that even for the small Google page, there is a noticeable delay at the beginning
for high RTT values.
150 600
2.8
3
3.2
3.4
3.6
3.8
4
4.2
4.4
RTT [ms]
Per
ceiv
ed Q
ual
ity
Nokia
Figure 8.7: Effect of RTT on perceived QoS.

8.2. RESULTS 157
Table 8.4: Initial and total delays vs perceived quality.Case Initial Delay
(seconds)Total Delay(seconds)
PerceivedQoS
3840_20_0 1.1 1.8 4.6
384_150_1 1.4 2.4 4.3
384_150_10 1.8 3 4.1
384_150_20 1.9 3.4 3.9
384_600_1 2.4 5.8 3.5
32_150_1 2 5.2 3.3
32_150_10 2.2 6.2 3.1
32_150_20 2.6 6.8 2.9
Nokia
3840_20_0 4.6 13.6 4.6
384_150_1 6.6 19.2 4
384_150_10 8.8 24.2 3.9
384_150_20 10.4 28.6 3.4
384_600_1 15.4 49.4 2.9
32_150_1 38 99 1.8
32_150_10 45 121.8 1.6
32_150_20 53.8 144 1.5
A closer look at the results is done by using the objective measures of
initial and total delay for the different cases, as shown in Table 8.4. Initial
delay refers to the time before the skeleton of the page is downloaded (i.e. text
and place holders for images), while total delay is the totaldownload time. As
can be seen from the table, the lower the initial delay and thetotal delay, the
better the rating. The only exception are the384_600_1and32_150_1cases
for the Google page.
Though the two cases are not significantly different from each other as can
be seen from Figure 8.5(a), one would have expected the32_150_1case to
be rated a bit higher than384_600_1, due to its lower initial and total delay
values, but the reverse is true. It is found that for the384_600_1case, although
the total and initial times are longer owing to the larger RTT, the Google logo
comes in one go, while for the384_150_1case, the logo (which was not in
interlaced format)4 becomes visible gradually from top to bottom, owing to
the slow speed of the connection. This small difference is the most probable
4Interlaced images appear on-screen by first displaying a lower resolution of the imageand gradually showing the high resolution version.
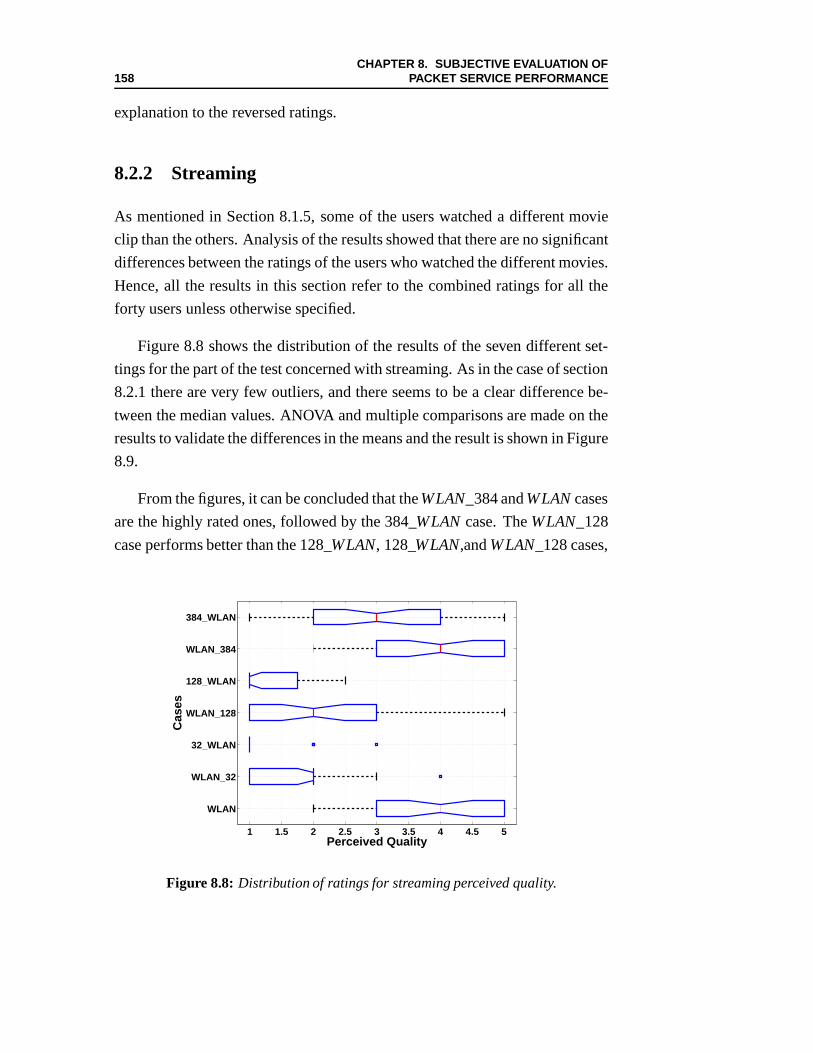
158CHAPTER 8. SUBJECTIVE EVALUATION OF
PACKET SERVICE PERFORMANCE
explanation to the reversed ratings.
8.2.2 Streaming
As mentioned in Section 8.1.5, some of the users watched a different movie
clip than the others. Analysis of the results showed that there are no significant
differences between the ratings of the users who watched thedifferent movies.
Hence, all the results in this section refer to the combined ratings for all the
forty users unless otherwise specified.
Figure 8.8 shows the distribution of the results of the sevendifferent set-
tings for the part of the test concerned with streaming. As inthe case of section
8.2.1 there are very few outliers, and there seems to be a clear difference be-
tween the median values. ANOVA and multiple comparisons aremade on the
results to validate the differences in the means and the result is shown in Figure
8.9.
From the figures, it can be concluded that theWLAN_384 andWLANcases
are the highly rated ones, followed by the 384_WLANcase. TheWLAN_128
case performs better than the 128_WLAN, 128_WLAN,andWLAN_128 cases,
1 1.5 2 2.5 3 3.5 4 4.5 5
WLAN
WLAN_32
32_WLAN
WLAN_128
128_WLAN
WLAN_384
384_WLAN
Perceived Quality
Cas
es
Figure 8.8: Distribution of ratings for streaming perceived quality.

8.2. RESULTS 159
0.5 1 1.5 2 2.5 3 3.5 4 4.5
WLAN
WLAN_32
32_WLAN
WLAN_128
128_WLAN
WLAN_384
384_WLANC
ases
Perceived Quality
Figure 8.9: Confidence intervals for the streaming video perceived quality.
with no significant difference between the latter ones.
The 384_WLANcase is rated around one grade lower than theWLAN_384
case mainly due to the startup buffering time required. In the former case, it
takes around 10 seconds before the first frames are shown, followed by around
10 seconds of buffering before the movie starts to be streamed continuously. In
the latter case, the movie starts in around 10 seconds of buffering. Apart from
this initial startup buffering differences, the two cases are the same because
a 384 Kbps connection is able to support the maximum encodingrate of the
stream. This is also the reason why theWLAN_384 andWLANcases are rated
the same.
A similar pattern is observed between theWLAN_128 and 128_WLAN
cases, where the latter is rated a grade below the former. Apart from the startup
buffering differences, the fact that 128 Kbps is not able to support the maxi-
mum encoding rate also plays a part to the observed quality ofthe two cases.
For theWLAN_128 case, a good video quality is observed for the first half of
the clip and then (after the handover), re-buffering is initiated. After the re-
buffering is finalised, the streaming continues with the same video quality but
it is soon interrupted again after 15 seconds for another re-buffering. After this

160CHAPTER 8. SUBJECTIVE EVALUATION OF
PACKET SERVICE PERFORMANCE
re-buffering, the clip is completed without interruption.According to[123],
real player and Helix server are capable of detecting bit rate downgrade and
stream the appropriate sub-stream from a SureStream file. However, for the
WLAN_128 case, the duration of the movie was not long enough to seethis at
work.
For the 128_WLANcase, to begin with, it takes around 28 seconds before
the movie starts and after 8 seconds of streaming at high quality, there is a very
brief re-buffering and the stream continues with the downgraded bit rate of 100
Kbps, which is more of a slide show than a movie stream. It was not possible
to get the description of the algorithms behind real player’s and Helix server’s
adaptation to bit rate upgrade and downgrades, but from the results described
here (detection in the 128_WLANand no detection in case theWLAN_128), it
can be concluded that they use a time weighted moving averageof the bit rate
to decide which sub-stream to use.
TheWLAN_32 case is rated higher than the 128_WLANcase, though the
differences are not significant. This small difference can be attributed not
only to the initial startup buffering time, but also to the streaming encoding
and bandwidth detection behaviour of real player and Helix server. For the
WLAN_32 case, after the handover, the streaming bit rate is also not down-
graded. However, due to the very low available bandwidth, a slide show effect
similar to that of the 128_WLANcase is seen (albeit with a lower frame rate)
immediately after the first re-buffering.
As mentioned in Section 8.1.6, eight of the subjects watchedthe original
video on the server before rating the seven different cases.Figures 8.10(a)
and 8.10(b) show the results categorised based on whether the subjects have
seen the preview or not, respectively. The differences between the upgrade and
downgrade cases for each bit rate are also not significant anymore. It can also
be seen that the subjects who have seen the preview rated the different cases,
on the average, lower than the ones who have not seen the previews. However,
a pair by pair ANOVA analysis showed that the differences arenot significant.
The reason for this trend in lower grades for the preview cases can be
attributed to some extent to the fact that the previews were shown on the server

8.2. RESULTS 161
0 1 2 3 4 5
WLAN
WLAN_32
32_WLAN
WLAN_128
128_WLAN
WLAN_384
384_WLAN
Perceived Quality
Cas
es
(a)Without preview
0 1 2 3 4 5
WLAN
WLAN_32
32_WLAN
WLAN_128
128_WLAN
WLAN_384
384_WLAN
Cas
es
Perceived Quality
(b)With preview
Figure 8.10: Confidence intervals for the streaming video perceived quality, for sub-jects who have seen a preview and for those who have not.
machine, which has a larger screen and better colour depth than that of the
tablet computer. Thus, the differences are mainly due to theexperimental
design (showing the preview video on the server rather than on the tablet PC)
rather than user behaviour. This also shows how sensitive the results could be
depending upon the experiment design.
The results are also analysed to see the impact of user experience in video
streaming on the perceived quality. As can be seen from Figure 8.1(b) in Sec-
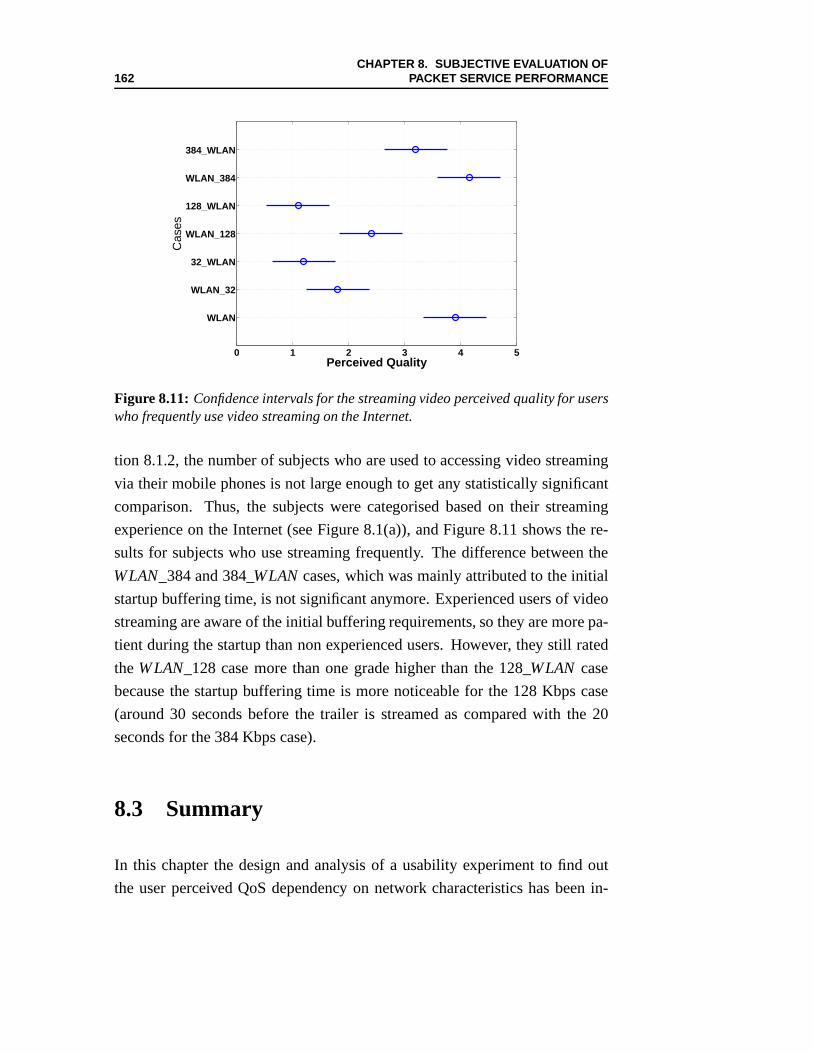
162CHAPTER 8. SUBJECTIVE EVALUATION OF
PACKET SERVICE PERFORMANCE
0 1 2 3 4 5
WLAN
WLAN_32
32_WLAN
WLAN_128
128_WLAN
WLAN_384
384_WLAN
Cas
es
Perceived Quality
Figure 8.11: Confidence intervals for the streaming video perceived quality for userswho frequently use video streaming on the Internet.
tion 8.1.2, the number of subjects who are used to accessing video streaming
via their mobile phones is not large enough to get any statistically significant
comparison. Thus, the subjects were categorised based on their streaming
experience on the Internet (see Figure 8.1(a)), and Figure 8.11 shows the re-
sults for subjects who use streaming frequently. The difference between the
WLAN_384 and 384_WLANcases, which was mainly attributed to the initial
startup buffering time, is not significant anymore. Experienced users of video
streaming are aware of the initial buffering requirements,so they are more pa-
tient during the startup than non experienced users. However, they still rated
theWLAN_128 case more than one grade higher than the 128_WLAN case
because the startup buffering time is more noticeable for the 128 Kbps case
(around 30 seconds before the trailer is streamed as compared with the 20
seconds for the 384 Kbps case).
8.3 Summary
In this chapter the design and analysis of a usability experiment to find out
the user perceived QoS dependency on network characteristics has been in-

8.3. SUMMARY 163
vestigated. Experiments have been carried out on the impactof bit rate, FER
and RTT on web browsing performance in UMTS and the impact of handover
associated bit rate downgrade and upgrade in a heterogeneous network com-
prised of UMTS and WLAN. The results are gathered through theratings of
forty users and are analysed to spot trends in user quality perception and the
relationship between users’ ratings and objective qualitymeasures. It is found
that it is possible to get meaningful results from the experiment even though
only forty users are used. For both the web browsing and streaming services
the ratings of the users showed a clear trend and were mostly in line with
objective quality measures.
For the web browsing experiments, the effect of the RTT is very perceiv-
able by the subjects, regardless of the web page size. On the other hand, the
effect of FER is found to be significant only for larger pages.
The streaming experiments showed that the initial startup buffering time
of the video is very important for the users, no matter what the quality of
the streaming is once it has started. Users are also very sensitive to any re-
buffering that occurs after the streaming has started, and they rated the overall
quality regardless of the video quality after the re-buffering interruption. Users
who are experienced in video streaming are found to be less critical of the start
up time than users who are not used to the service.


Part VI
Conclusions
165


Chapter 9
Conclusions and Discussions
The overall goal of this PhD study has been the investigationof packet ser-
vice performance in UMTS networks, both in standalone and heterogeneous
settings. We have looked into the problem from several aspects to get a holis-
tic view. Specifically, the impact of transport and link layer protocols, ver-
tical handover and perceived service quality has been the main focus of the
investigation. The performance results have been generated using analytical
modelling, emulations and usability experiments.
In the following sections, a summary of the whole thesis is given, drawing
the main findings from the most relevant topics investigated. Finally, some
pointers regarding future work are given.
9.1 Performance Impact of RLC Reliability Mech-
anisms on TCP
The impact of the different parameters that control the UMTSRLC protocol’s
reliability has been investigated using analytical modelling and emulations. It
has been shown that by using only a subset of these parametersa deadlock free
link layer communication can be set up.
167

168 CHAPTER 9. CONCLUSIONS AND DISCUSSIONS
The maximum number of RLC retransmissions is the main factorthat de-
termines the performance. When the operating FER is 10%, setting the maxi-
mum number of retransmissions to three or more eliminates TCP timeouts and
gives optimal performance, decreasing the file download time by around 85%
as compared with the case with no link layer retransmission.RLC’s retrans-
mission mechanism is also very efficient, with an overhead ofless than 5% for
status reporting.
Though allowing higher number of RLC retransmissions leadsto higher
RTT, it is no disadvantage for the cases investigated here asthe main perfor-
mance metric of FTP is the total file download time. Also TCP timeouts are
prevented. Even for services such as web browsing where the RTT matters
more, the increase in RTT due to many RLC retransmissions is not a problem
as long as TCP timeouts do not occur. However, allowing higher number of
RLC retransmissions can be a disadvantage if the FER is high.This is because
TCP can timeout before the RLC manages to recover the errors.In this case,
valuable bandwidth is wasted due to redundant RLC retransmissions.
9.2 Performance Impact of TCP Spurious Retrans-
missions
The impact of spurious TCP retransmissions caused by packetreordering and
delay spikes and the performance enhancements due to the Eifel and DSACK
TCP enhancements has been investigated.
Eifel is very effective in mitigating spurious retransmissions due to packet
reordering, increasing the goodput by up to 33%. DSACK also shows perfor-
mance improvement against packet reordering but the goodput improvement
is not more than 14%. The usage of SACK (without DSACK) causesperfor-
mance degradation because there is a higher probability of entering the TCP
fast retransmission phase earlier when using SACK as the sender does not
have to wait for triple duplicate ACKs. Eifel also improves performance in the
case of spurious retransmissions caused by delay spikes butthe improvement

9.3. PERFORMANCE IMPACT OF VERTICAL HANDOVER 169
in this case is not more than 9%. The reason for this is that higher delay values
trigger multiple timeouts, in which case the Eifel algorithm acts conservatively
in the same way as a normal slow start.
The Eifel algorithm is currently being standardised by the IETF [81; 125]
and the TCP timestamp option, which is the recommended way toenable the
Eifel algorithm, is already widely deployed in the Internet[95]. Eifel is also
part of the Linux TCP, which is the most widely used operatingsystem for web
servers[96]. On top of this, Eifel is a sender side algorithm, the only require-
ment on the receiver being enabling the TCP timestamp option. Considering
these factors, Eifel is a very practical solution to cope with TCP spurious re-
transmissions due to packet reordering. Thus combining RLCout of sequence
delivery with Eifel is a suitable setting for services such as web browsing
where RTT is an important performance metric. With regard toEifel’s rela-
tively poorer performance against delay spikes, an enhancement where slow
start phase is not entered even after multiple timeouts is already proposed in[90].
9.3 Performance Impact of Vertical Handover
UMTS networks are currently deployed in environments wherea GPRS net-
work already exists and WLAN is becoming very accessible viaWLAN hot
spots. Thus, the performance of FTP file downloads in a heterogeneous net-
work comprised of UMTS, WLAN and GPRS has been investigated.The
behaviour of ordinary TCP (new-Reno), Eifel, and SACK underdifferent han-
dover conditions is studied and a new buffering scheme called intermediate
buffering, where only packets that arrive during handover are buffered, is pro-
posed. This buffering scheme is compared with full buffering, where all the
packets in-flight when the handover is started are buffered in addition to the
packets that arrive during the handover, and also with no buffering schemes.
For the no handover delay cases, full buffering performs thebest. For non
zero handover delay cases and ordinary TCP, intermediate buffering is the best

170 CHAPTER 9. CONCLUSIONS AND DISCUSSIONS
performer (goodput improvement in the range of 15%), exceptin the case of
a handover from GPRS to UMTS (goodput decreased by up to 12% for this
case). Full buffering performs even worse than no bufferingfor the upward
handover (handover from a small coverage to a larger coverage network, e.g.
UMTS to GPRS) cases, decreasing the goodput by up to 15%. However, it
performs better than no buffering for upward handover cases, with up to 13%
improvement in the goodput.
Eifel degrades the performance of intermediate and no buffering, decreas-
ing the goodput by up to 34% for the UMTS to WLAN handover case.How-
ever, Eifel improves the performance of full buffering, with up to 12% im-
provement in the goodput.
SACK has no effect on full buffering. If there is a handover delay, SACK
also has no effect on no buffering. However, when there is no handover delay,
SACK has a positive impact (up to 7% improvement in goodput) for the down-
ward handover cases and negative impact (up to 30% decrease in goodput) for
the upward handover cases. For intermediate buffering, SACK has a positive
impact on the performance in the downward handover from GPRSto UMTS,
increasing the goodput by up to 11%.
From the results it can be seen that there is no buffering mechanism or TCP
extension that is optimal for all the considered cases. However, we recommend
the use of intermediate buffering as it gives the best resultin the most realistic
cases, i.e. all except the no handover delay case. It also places less memory
requirements on the access points as compared with the full buffering scheme.
9.4 User Perceived Quality of Packet Services
Quality of service in mobile telecommunication systems is usually identified
by some basic performance metrics such as delay, throughputand jitter. How-
ever, the main impact of service quality is on the end user, and thus we found
it important to undertake a detailed study of service performance using usabil-
ity experiments. Experiments have been carried out on the impact of bit rate,

9.5. FUTURE WORK 171
FER and RTT on web browsing performance in UMTS and the impactof han-
dover associated bit rate downgrade and upgrade in a heterogeneous network
comprised of UMTS and WLAN.
Meaningful results have been found from the experiments even though
only forty test subjects were used and the subjective results are in line with the
objective measures of quality. For the web browsing experiments, the effect of
the RTT is very perceivable by the subjects, regardless of the size of the web
page. On the other hand, the effect of FER is significant only for larger pages.
The streaming experiments showed that the initial start up buffering time of
the video is very important, no matter what the quality of thestreaming is
once it has started.
Results that are based on objective performance quality metrics can be
augmented with subjective evaluations to decide on whetherto use a certain
network/protocol optimisation or not. For example, by looking at the results
from the packet reordering studies (Figure 6.7) and the web browsing quality
vs. RTT results (Figure 8.7), the recommendation to use Eifel with RLC out
of sequence delivery is reinforced.
9.5 Future Work
This thesis has provided the evaluation of packet service performance in a
standalone UMTS network and a UMTS network coexisting with WLAN and
GPRS. It would be quite interesting to extend the performance investigations
for UMTS evolutions such as HSDPA whose technology has become mature
enough to be deployed. This requires the enhancement of the emulation plat-
form used in this PhD study to support HSDPA functionalitiessuch as Hybrid
ARQ (H-ARQ) and link adaptation.
TCP was designed for wired networks where congestion is the major per-
formance bottleneck. Though there have been tens (if not hundreds) of ex-
tensions to optimise TCP performance in wireless networks,apart from the
ones discussed in this thesis, there seems to be no consensusin the network-

172 CHAPTER 9. CONCLUSIONS AND DISCUSSIONS
ing community regarding which ones to adopt. Not only that, what one pro-
posal improves might be already undone by another proposal,because there
is no standardised way of joint comparison. Thus, it would beof utmost im-
portance to have a standardised way of testing new protocol enhancements.
Such a platform should consider the different aspects of thenetwork, through
which researchers can test if their new protocol enhancements are perform-
ing as expected in different scenarios and if they conflict with other existing
enhancements.
In the context of vertical handover, current research is mostly concerned
with network level optimisations, e.g. handing over to the network with the
best signal strength. However, these network level and system level enhance-
ments may not directly translate to user satisfaction. Thus, it would be in-
teresting to investigate utility functions that also consider the user (in terms of
several factors such as cost, mobility and urgency of the task being performed)
and the service at hand (service delay and bandwidth requirements, for exam-
ple). An enhanced system level usability testbed could be very useful for such
investigations. We envision a usability test setup which provides the test sub-
jects with a dynamic interface, instead of the fixed network setup used in the
usability experiments conducted in this PhD study, where they can change the
network behaviour such as the bit rate, depending on their preference in terms
of cost and quality. Multiple test users can be assessed concurrently and an
invaluable information regarding users’ cost-quality trade off can be gathered,
which then can be used for defining optimal utility functionsfor handover
decisions.
Throughout the study, we assumed a congestion free environment, as the
focus was solely on the wireless network. However, if the application servers
reside in the wired Internet domain, congestion is imminentand future investi-
gations should also consider the impact of congestion in addition to the impact
of the wireless network.

Bibliography
[1] ITU, “End-user Multimedia QoS Categories”, ITU-T Recommendation
G.1010, August 2001.
[2] ITU, “Terms and Definitions Related to Quality of Service andNetwork Per-
formance Including Dependability”,ITU-T Recommendation E.800, August
1994.
[3] Miniwatts International, Ltd., “Internet Usage Stats: Usage and Population
Statistics”,http://www.internetworldstats.com/, 2005.
[4] M. Eriksson, D. Turina, H. Arslan, K. Balachandran, and J. Cheng, “System
Performance with Higher Level Modulation in the GSM/EDGE Radio Access
Network”, in IEEE Global Telecommunications Conference (GLOBECOM)
’01, November 2001.
[5] Ericsson, “EDGE: Introduction of High-speed Data in GSM/GPRS Net-
works”, http://www.ericsson.com/products/white_papers_
pdf/edge_wp_technical.pdf, 2003.
[6] T. Halonen, J. Romero, and J. Melero,GSM, GPRS and EDGE Performance:
Evolution Toward 3G/UMTS, John Wiley & Sons, 2002.
[7] 3GPP, “Delay Budget within the Access Stratum”,3GPP TR 25.853 v4.0.0,
March 2001.
[8] H. Holma and A. Toskala,WCDMA for UMTS, Radio Access for Third Gener-
ation Mobile Communications, John Wiley & Sons, 2004.
[9] UMTS Forum, “3G/UMTS Commercial Deployments”,http:
//www.umts-forum.org/servlet/dycon/ztumts/umts/Live/
en/umts/Resources_Deployment_index, 2006.
173

174 BIBLIOGRAPHY
[10] J. Bienaimé, “3G/UMTS and HSPA: A Market Perspective”,
http://www.umts-forum.org/servlet/dycon/ztumts/
umts/Live/en/umts/MultiMedia_Presentations_
Planning-and-Deploying-HSDPA-JPB-09-05.pdf, Septem-
ber 2005.
[11] P. Rysavy, “Mobile Broadband: EDGE, HSPA and LTE”,http:
//focus.ti.com/pdfs/wtbu/2006_Rysavy_Data_Paper_
FINAL_09.12.06.pdf, September 2006.
[12] 3GPP, “Requirements for Evolved UTRA (E-UTRA) and Evolved UTRAN
(E-UTRAN)”, 3GPP TR 25.913 v7.3.0, March 2006.
[13] 3GPP, “Proposed 3GPP TSG RAN process for Evolved UTRA & UTRAN”,
3GGP RP-040502, December 2004.
[14] UMTS Forum, “UMTS/3G History and Future Milestones”,http://www.
umtsworld.com/umts/history.htm, 2006.
[15] W. Stallings, Data and Computer Communications, Macmillan Publishing,
1984.
[16] D. Bertsekas and D. Gallager,Data Networks, Prentice Hall, 1992.
[17] A. Canton and T. Chahed, “End-to-end Reliability in UMTS: TCP over ARQ”,
in IEEE Global Telecommunications Conference (GLOBECOM) ’01, Novem-
ber 2001.
[18] F. Lefevre and G. Vivier, “Optimizing UMTS Link Layer Parameters for a
TCP Connection”, in53rd IEEE Vehicular Technology Conference (VTC), May
2001.
[19] Q. Zhang and H.-J. Su, “Performance of UMTS Radio Link Control”, in IEEE
International Conference on Communications (ICC) ’02), May 2002.
[20] H. Xu, Y.-C. Chen, X. Xu, E.Gonen, and P. Liu, “Performance Analysis on
the Radio Link Control Protocol of UMTS System”, in56th IEEE Vehicular
Technology Conference (VTC)), September 2002.
[21] J. Postel,RFC 793: Transmission Control Protocol, September 1981.
[22] Internet2, “Internet2 Netflow weekly reports”,http://netflow.
internet2.edu/weekly/, 2006.

BIBLIOGRAPHY 175
[23] G. Miller and K. Thompson, “The Nature of the Beast: recent Traffic
Measurements from an Internet Backbone”,http://www.caida.org/
outreach/papers/1998/Inet98/Inet98.html.
[24] H. Inamura, G. Montenegro, R. Ludwig, and F. K. A. Gurtov,RFC 3481: TCP
Over Second (2.5G) and Third (3G) Generation Wireless Networks, February
2003.
[25] M. Mathis, J. Mahdavi, S. Floyd, and A. Romanow,RFC 2018: TCP Selective
Acknowledgment Options, October 1996.
[26] R. Ludwig and R. Katz, “The Eifel Algorithm: Making TCP Robust Against
Spurious Retransmissions”,ACM Computer Communication Review (CCR),
January 2000.
[27] O. Teyeb and J. Wigard, “Emulation of TCP Performance over WCDMA”,
Tech. Rep., Aalborg University, June 2003.
[28] H. Balakrishnan, V. N. Padmanabhan, S. Seshan, and R. H. Katz, “A Com-
parison of Mechanisms for Improving TCP Performance over Wireless Links”,
IEEE/ACM Transactions on Networking, December 1997.
[29] H. Elaarag, “Improving TCP Performance over Mobile Networks”, ACM Com-
puting Surveys, September 2002.
[30] HotSpot Locations, “WLAN Hotspot Directory”, http://www.
hotspot-locations.com/, 2006.
[31] L. Ma, V. L. F. Yu, and T. Randhawa, “A New Method to Support
UMTS/WLAN Vertical Handover Using SCTP”,IEEE Wireless Communi-
cations, August 2004.
[32] T. Al-Gizawi, K. Peppas, D. Axiotis, E. Protonotarios, and F. Lazarakis, “Inter-
operability Criteria, Mechanisms, and Evaluation of System Performance for
Transparently Interoperating WLAN and UMTS-HSDPA Networks”, IEEE
Network, July 2005.
[33] M. Buddhikot, G. Chandranmenon, S. Han, Y.W.Lee, S. Miller,and L. Salgar-
elli, “Integration of 802.11 and Third-Generation Wireless Data Networks”,
in 22nd Annual Joint Conference of the IEEE Computer and Communications
Societies (INFOCOM), March 2003.

176 BIBLIOGRAPHY
[34] A. Doufexi, E. Tameh, A. Nix, S. Armour, and A. Molina, “Hotspot Wireless
LANs to Enhance the Performance of 3G and Beyond Cellular Networks”,
IEEE Communications Magazaine, July 2003.
[35] A. Bouch and N. B. A. Kuchinsky, “Quality is in the Eye of the Beholder:
Meeting Users’ Requirements for Internet Quality of Service”, in Conference
on Human Factors in Computing Systems, April 2000.
[36] C. Schaefer, T. Enderes, H. Ritter, and M. Zitterbart, “Subjective Quality As-
sessment for Multiplayer RealTime Games”, inWorkshop on Network and
System Support for Games, April 2002.
[37] N. Sheldon, E. Girard, S. Borg, M. Claypool, and E. Agu, “The Effect of
Latency on User Performance in Warcraft III”, in2nd Workshop on Network
and System Support for Games, May 2003.
[38] Leonard Kleinrock,Communication Nets: Stochastic Message Flow and De-
lay, Mc-Graw-Hill, 1964.
[39] I. S. I. (ISI), “The NS-2 etwork Simulator”,http://www.isi.edu/
nsnam/ns/.
[40] D. D. Clark, V. Jacobson, J. Romkey, and H. Salwen, “An Analysis of TCP
Processing Overhead”,IEEE Communications Magazine, May 2002.
[41] R. Burton, “Voice Quality Must Be Measured Where It Counts”,Wireless
Europe Magazine, June 2005.
[42] X. Revés, A. Umbert, R. Ferrús, A. Gelonch, and F. Casadevall, “Real-Time
Demonstrator for QoS testing in 3G/4G mobile networks with IP Multimedia
Applications”, in5thth European Wireless Conference, February 2004.
[43] O. Sallent, J. Perez-Romero, F. Casadevall, and R. Augsti, “An Emulator
Framework for a New Radio Resource Management for QoS Guaranteed Ser-
vices in W-CDMA Systems”,IEEE Journal on Selected Areas in Communica-
tions (JSAC), October 2001.
[44] J. D. Day and H. Zimmerman, “The OSI Reference Model”,Proceedings of
the IEEE, December 1983.
[45] 3GPP, “Vocabulary for 3GPP Specification”,3GPP TR 21.905 v7.2.0, June
2006.

BIBLIOGRAPHY 177
[46] 3GPP, “Quality of Service (QoS) concept and architecture”,3GPP TS 23.107
v6.4.0, March 2006.
[47] 3GPP, “Service aspects: Services and Service Capabilities”, 3GPP TS 22.105
V8.1.0, September 2006.
[48] H. Holma and A. Toskala,WCDMA for UMTS, Radio Access for Third Gener-
ation Mobile Communications, John Wiley & Sons, 2002.
[49] W. R. Stevens,TCP/IP Illustrated Vol 1: The Protocols, Addison Wesley,
1994.
[50] V. Jacobson, R. Branden, and D.Borman,RFC 1323: TCP Extensions for High
Performance, May 1992.
[51] V. Jacobson and M. J. Karels, “Congestion Avoidance and Control”, ACM
Computer Communication Review (CCR), August 1988.
[52] M. Allman, V. Paxson, and W. Stevens,RFC 2581: TCP Congestion Control,
April 1999.
[53] V. Paxson and M. Allman, RFC 2988: Computing TCP’s Retransmission
Timer, November 2000.
[54] P. Sarolahti and A. Kuznetsov, “Congestion control in linuxTCP”, in USENIX
Annual Technical Conference ’02, June 2002.
[55] K. Fall and S. Floyd, “Simulation-based Comparisons of Tahoe, Reno and
SACK TCP”, ACM Computer Communication Review (CCR), July 1996.
[56] S. Floyd and T. Henderson and A. Gurtov,RFC 3782: The NewReno Modifi-
cation to TCP’s Fast Recovery Algorithm, April 2004.
[57] K. Srijith, L. Jacob, and A. Ananda, “Worst-Case Performance Limitations
of TCP SACK and a Feasible Solution”, in8th International Conference on
Communication Systems (ICCS), November 2002.
[58] E. Blanton, M. Allman, K. Fall, and L. Wang,RFC 3517: A Conservative
Selective Acknowledgment (SACK)-based Loss Recovery Algorithm for TCP,
April 2003.

178 BIBLIOGRAPHY
[59] M. Mathis and J. Mahdavi, “Forward Acknowledgement: Refining TCP Con-
gestion Control”, inACM Conference of the Special Interest Group on Data
Communication (SIGCOMM) ’96, August 1996.
[60] S. Floyd, J. Mahdavi, M. Mathis, and M. Podolsky,RFC 2883: An Extenstion
to the Selective Acknowledgement (SACK) Option for TCP, July 2000.
[61] 3GPP, “RLC Protocol Specification”,3GPP TS 25.322 v5.4.0, March 2003.
[62] 3GPP, “Services provided by the physical layer”,3GPP TS 25.302 v6.5.0,
September 2005.
[63] W. Luo, K. Balachandran, S. Nanda, and K. Chang, “Delay Analysis of
Selective-repeat ARQ with Applications to Link Adaptationin Wireless Packet
Data Systems”,IEEE Transaction on Wireless Communications, May 2005.
[64] H. Graja, P. Perry, and J. Murphy, “A Statistical Estimationof Average IP
Packet Delay in Cellular Data Networks”, inWireless Communications and
Networking Conference (WCNC) ’05, March 2005.
[65] J. Peisa and M. Meyer, “Analytical Model for TCP. File Transfers over UMTS”,
in International Conference on Third Generation Wireless andBeyond, May
2001.
[66] O. D. Mey, L. Schumacher, and X. Dubois, “Optimum Number of RLC Re-
transmissions for Best TCP Performance in UTRAN”, in16th IEEE Inter-
national Symposium on Personal, Indoor and Mobile Radio Communications
(PIMRC), September 2005.
[67] R. Bestak, P. Godlewski, and P. Martins, “RLC Buffer Occupancy when us-
ing a TCP Connection over UMTS”, in13th IEEE International Symposium
on Personal, Indoor and Mobile Radio Communications (PIMRC), September
2002.
[68] X. Xu, Y.-C. Chen, H. Xu, E.Gonen, and P. Liu, “Simulation Analysis of RLC
Timers in UMTS Systems”, inWinter Simulation Conference ’02, December
2002.
[69] J. Postel and J. Reynolds,RFC 959: File Transfer Protocol, October 1985.
[70] M. Necker and S. Saur, “Statistical Properties of Fading Processes in WCDMA
Systems”, in2nd International Symposium on Wireless Communication Sys-
tems, September 2005.

BIBLIOGRAPHY 179
[71] O. Teyeb, M. Boussif, T. Sørensen, J. Wigard, and P. Mogensen, “RESPECT:
A Real-time Emulator for Service Performance Evaluation inCellular neT-
works”, in 62nd IEEE Vehicular Technology Conference (VTC), September
2005.
[72] O. Teyeb, “Design and Implementation of a UMTS Emulation Platform”, Tech.
Rep., Aalborg University, March 2004.
[73] D. C. Montgomery,Design and Analysis of Experiments, John Wiley & Sons,
2000.
[74] Q. Zhang and H.-J. Su, “Methods for Preventing Protocol Stalling in UMTS
Radio Link Control”, inIEEE International Conference on Communications
(ICC) ’03, May 2003.
[75] J. C. R. Bennett, C. Partridge, and N. Shectman, “Packet Reordering is not
Pathological Network Behavior”, IEEE/ACM Transactions on Networking
(TON), December 1999.
[76] M. Laor and L. Gendel, “The Effect of Packet Reordering in a Backbone Link
on Application Throughput”,IEEE Networks, September 2002.
[77] X. Zhou and P. Mieghem, “Reordering of IP Packets in Internet”, Lecture
Notes in Computer Science, vol. 3015, April 2004.
[78] A. Gurtov, “Effect of Delays on TCP Performance”, inIFIP Personal Wireless
Communications ’01, August 2001.
[79] P. Karn and C. Partridge, “Improving Round-Trip Time Estimates in Reli-
able Transport Protocols”,ACM Transactions on Computer Systems (TOCS),
November 1991.
[80] T. Klein, K. Leung, R. Parkinson, and L. Samuel, “Avoiding Spurious TCP
Timeouts in Wireless Networks by Delay Injection”, inIEEE Global Telecom-
munications Conference (GLOBECOM) ’04, November 2004.
[81] R. Ludwig and M. Meyer,RFC 3522: The Eifel Detection Algorithm for TCP,
April 2003.
[82] E. Blanton and M. Allman,RFC 3708: Using TCP Duplicate Selective Ac-
knowledgement (DSACKs) and Stream Control Transmission Protocol (SCTP)

180 BIBLIOGRAPHY
Duplicate TransmissionSequence Numbers (TSNs) to Detect Spurious Retrans-
missions, February 2004.
[83] E. Blanton and M. Allman, “On Making TCP More Robust to PacketReorder-
ing”, ACM Computer Communications Review (CCR), January 2002.
[84] M. Zhang, B. Karp, S. Floyd, and L. Peterson, “RR-TCP: A Reordering-robust
TCP with DSACK”, in11th IEEE International Conference on Network Pro-
tocols, November 2003.
[85] P. Sarolahti, M. Kojo, and K. Raatikainen, “F-RTO: an Enhanced Recovery Al-
gorithm for TCP Retransmission Timeouts”,ACM Computer Communication
Review (CCR), April 2003.
[86] P. Sarolahti and M. Kojo,RFC 4138: Forward RTO-Recovery (F-RTO): An
Algorithm for Detecting Spurious Retransmission Timeoutswith TCP and the
Stream Control Transmission Protocol (SCTP), August 2005.
[87] A. Gurtov and R. Ludwig, “Evaluating the Eifel Algorithm forTCP in a GPRS
Network”, in European Wireless Conference ’02, February 2002.
[88] S. Fu, M. Atiquzzaman, and W. Ivancic, “Effect of Delay Spikeon SCTP,
TCP Reno, and Eifel in a Wireless Mobile Environment”, in11th International
Conference on Computer Communications and Networks, October 2002.
[89] T. Diab, P. Martins, P. Godlewski, and N. Puech, “The Eifel TCP Extension
over GPRS RLC: Effects of Long Radio Blackouts”, in58th IEEE Vehicular
Technology Conference (VTC), October 2003.
[90] A. Gurtov and R. Ludwig, “Responding to Spurious Timeouts inTCP”, in22nd
Annual Joint Conference of the IEEE Computer and Communications Societies
(INFOCOM), Apr 2003.
[91] H. Koga, T. Ikenaga, Y. Hori, and Y. Oie, “Out-of-sequence Packet Arrivals
due to Layer 2 ARQ and its Impact on TCP Performance in W-CDMA Net-
works”, in International Symposium on Applications and the Internet (SAINT)
’03, January 2003.
[92] N. Brownlee and K. Claffy, “Understanding Internet Traffic Streams: Dragon-
flies and Tortoises”,IEEE Communications Magazine, October 2002.
BIBLIOGRAPHY 181
[93] A. Mdina, M. Allman, and S. Floyd, “Measuring the evolution of transport
protocols in the internet”, ACM Computer Communication Review (CCR),
April 2005.
[94] S. Ladha, P. D. Amer, A. C. Jr., and J. R. Iyengar, “On the Prevalence and
Evaluation of Recent TCP Enhancements”, inIEEE Global Telecommunica-
tions Conference (GLOBECOM) ’04, November 2004.
[95] D. L. B. Veal, K. Li, “New Methods for Passive Estimation of TCP Round-
Trip Times”, in 6th International Workshop on Passive and Active Network
Measurement, April 2005.
[96] NetCraft, “The Net Craft Web Server Survey”,"http://www.netcraft.
com/", 2006.
[97] I. Jarvinen, “Linux TCP in the presence of delays or drops (dis-
cussion thread).”,http://www.mail-archive.com/netdev@vger.
kernel.org/msg17533.html, 2006.
[98] A. Kuznetsov, “TCP SACK Problem in Linux (discussion thread)”,
http://www.mail-archive.com/[email protected]/
msg16653.html, 2006.
[99] Nokia, “Nokia 6600 Specificiation”,http://europe.nokia.com/
A4145111, 2006.
[100] J. Crowfort and I. Phillips,TCP/IP and Linux Protocol Implementation, John
Wiley & Sons, 2002.
[101] R. Berezdivin, R. Breinig, and R. Topp, “Next Generation Wireless Communi-
cations Concepts and Technologies”,IEEE Communications Magazine, March
2002.
[102] M. Stemm and R. H. Katz, “Vertical Handoffs in Wireless Overlay Networks”,
Mobile Networks and Applications, December 1999.
[103] L. Ivrissimtzis, “Multimode Terminals Link Cellular and WLAN Services”,
Wireless Europe Magazine, June 2005.
[104] S. McCann, W. Groting, A. Pandolfi, and E. Hepworth, “Next Generation Mul-
timode Terminals”,5th IEEE International Conference on 3G Mobile Commu-
nication Technologies, 2004.

182 BIBLIOGRAPHY
[105] F. Siddiqui and S. Zeadally, “Mobility Management Across Hybrid Wireless
Networks:Trends and Challenges”,Computer Communications, September
2005.
[106] N. Nasser, A. Hasswa, and H. Hassanein, “Handoffs in Fourth Generation
Heterogeneous Networks”,IEEE Communications Magazaine, October 2006.
[107] C. Perkins,RFC 3344: IP Mobility Support for IPv4, August 2002.
[108] N. Banerjee, W. Wu, K. Basu, and S. K. Das, “Analysis of SIP-based mobil-
ity management in 4G wireless networks”,Computer Communications, May
2004.
[109] I. Akyildiz, X. Jiang, and S. Mohanty, “A Survey of Mobility Management in
Next-Generation All-IP-based Wireless Systems”,IEEE Wireless Communi-
cations, August 2004.
[110] A. Gurtov and J. Korhonen, “Effect of Vertical Handovers on Performance of
TCP-friendly Rate Control”,ACM Mobile Computing and Communications
Review, July 2004.
[111] W. Hansmann and M. Frank, “On Things to Happen During a TCP Handover”,
28thIEEE International Conference on Local Computer Networks (LCN), Oc-
tober 2003.
[112] R. Caceres and L. Iftode, “Improving the Performance of Reliable Transport
Protocols in Mobile Computing Environments”,IEEE Journal on Selected
Areas in Communications (JSAC), June 1995.
[113] A. Fladenmuller and R. De Silva, “The Effect of Mobile IP Handoffs on the
Performance of TCP”,Mobile Networks and Applications, May 1999.
[114] A. Bakre and B. Badrinath, “I-TCP: Indirect TCP for Mobile Hosts”, Interna-
tional Conference on Distributed Computing Systems, May 1995.
[115] R. Chakravorty, S. Katti, J. Crowcroft, and I. Pratt, “Flow Aggregation for
Enhanced TCP over Wide-area Wireless”, in22nd Annual Joint Conference of
the IEEE Computer and Communications Societies (INFOCOM), March 2003.
[116] K. Brown and S. Singh, “M-TCP: TCP for Mobile Cellular Networks”, ACM
Computer Communication Review (CCR), October 1997.

BIBLIOGRAPHY 183
[117] T. Goff, J. Moronski, D. Phatak, and V. Gupta, “Freeze-TCP: ATrue End-to-
End TCP Enhancement Mechanism for Mobile Environments”, in19th Annual
Joint Conference of the IEEE Computer and Communications Societies (IN-
FOCOM), March 2000.
[118] J. Rubin,Handbook of Usability Testing, John Wiley & Sons, 1994.
[119] J. Nielsen,Usability Enginnering, Acadamic Press, 1993.
[120] ETSI, “Human Factors (HF):Usability Evaluation for the Design of Telecom-
munication Systems, Services and Terminals”,ETSI EG 201.472 v1.1.1, Febru-
ary 2002.
[121] S. Dowdy and S. Wearden,Statistics for Research, John Wiley & Sons, 2004.
[122] Real Networks, “Choosing SureStream or Single Rate Encoding”,
http://service.real.com/help/library/blueprints/
7codecs/htmfiles/produce1.htm, 2000.
[123] Real Networks, “Real System Production Guide”,http://www17.real.
com/help/library/guides/ProductionGuide/prodguide/
htmfiles/realsys.htm, 2004.
[124] ITU, “Methods for Subjective Determination of Transmission Quality”, ITU-T
Recommendation P.800, August 1996.
[125] R. Ludwig and A. Gurtov,RFC 4015: The Eifel Response Algorithm for TCP,
February 2005.
[126] M. Schwartz,Telecommunication Networks: Protocols, Modelling and Analy-
sis, Addison Wesley, 1988.
[127] B. A. Forouzan,Data Communications and Networking, McGraw-Hill, 2000.
[128] P. Molinero-Fernandez and N. McKeown, “TCP Switching: Exposing Circuits
to IP”, IEEE Micro, January 2002.
[129] Netfilter, “The Netfilter/Iptalbes Project”,http://www.netfilter.
org/.
[130] S. Ostermann, “The TCPtrace Project”,http://www.tcptrace.org/.
184 BIBLIOGRAPHY
[131] A. Battou, B. Khan, D. C. Lee, S. Marsh, S. Mountcastle, and D.Talmage,
“CASiNO: Component Architecture for Simulating Network Objects”, Soft-
ware: Practices and Experience, September 2002.
[132] Naval Research Laboratory, “CASINO Documentation”,http://www.
nrl.navy.mil/ccs/project/public/casino, 2004.
[133] F. Calabresse, “Heterogeneous Network Modelling”, M.S. thesis, Aalborg
University, September 2005.
[134] K. Pawlikowski, H. Jeong, and J. Lee, “On Credibility of Simulation Studies
of Telecommunication Networks”,IEEE Communications Magazine, January
2002.

Part VII
Appendix
185

Appendix A
Basic Networking Concepts
A data communication network is an interlinked system of devices, also known
as nodes, that is used to transfer data from a sender to a receiver(s).Data
communication can be realised in either a Circuit Switched (CS) or Packet
Switched (PS) fashion, or their combination[126; 127].
In CS, a path from source to destination is selected when the data session
is started, and it is kept throughout the session. However, the links can be
shared by several connection with a multiplexing scheme. Traditional fixed
telephone networks employ CS. On the other hand, in PS, the data is di-
vided into discrete, potentially of varying length, blockscalledpacketsand the
route is dynamically selected, possibly for each packet. Each packet contains a
header, which is a control information regarding source/destination addresses,
and possibly additional information such as priority. The packets are routed at
each node in the End to End (E2E) path based on the header information. The
Internet mainly employs PS1.
Due to their complex nature (the different types of media such as wired
and wireless, different application types etc.), networksare usually designed
in a layered architecture that divides functionality into manageable units called
1PS was originally suggested for the Internet due to its bandwidth efficiency and robust-ness. However, recent studies have shown that PS is inefficient in high speed Internet back-bones, and CS alternatives are being proposed[128].
187

188 APPENDIX A. BASIC NETWORKING CONCEPTS
protocol layers. The most widely used layered protocol architecture is the
Open Systems Interconnection (OSI) reference model[44].
Figure A.1 illustrates the OSI model. Each layer utilises the services of the
layer just below it, according to some definedinterface. A transmitting proto-
col entity receives data units, known as Service Data Units (SDUs) from the
layer above it. The SDUs are then processed and passed on to the underlying
layer in a modified format (the most common changes being segmentation and
the addition of header information) called Protocol Data Units (PDUs). The
transmitted PDUs are identical to the SDUs expected at the underlying layer
and thus a PDU transmitted from layerN become an SDU in layerN−1. The
receiving entity converts one or more PDUs into an SDU and passes the SDU
to the layer just above it.
The bottom three layers (physical, data link and network, also known as
layer 1, layer 2 and layer 3) are concerned with network services, i.e. mov-
ing data from one device to another[126; 127]. For this reason, they are
commonly referred to uslower layers. The physical layer is responsible for
Application
Presentation
Session
Transport
Network
Data Link
Physical
Application
Presentation
Session
Transport
Network
Data Link
Physical
Network
Data Link
Physical
Data Link
Physical
Network
Data Link
Physical
Data Link
Physical
Application
Presentation
Session
Transport
Network
Data Link
Physical
Application
Presentation
Session
Transport
Network
Data Link
Physical
Physical Communication Physical Communication
Intermediate
NodeLink Link
Figure A.1: The OSI reference model (adapted from[127]).
189
transmitting bits over the physical medium. The data link layer, by utilising
the services provided by the physical layer, coordinates the transfer of frames
of data between directly connected nodes. Most link layers also provide error
detection and correction schemes. The network layer is responsible for routing
packets from source to destination, often through multiplelinks, and possibly
across several networks.
The upper four layers (transport, session, presentation and application,
also known as layers 4-7) are concerned with providing services to the end
user and thus not concerned with the network2 [126]. They are commonly
referred to ashigher layers. The transport layer is concerned with E2E deliv-
ery of entire messages (as compared with the network layer, which treats each
packets independently). The session, presentation and application layers are
usually lumped into one in many implementations (such as in the TCP/IP pro-
tocol stack implementation that the Internet is based on[49]) and they provide
the functionalities of service session management and application interface
through which a user can access the services provided through the network.
The performance of networks, the links connecting nodes within the net-
work and also those that interconnect several networks are usually specified
with some key performance parameters. The most important ones are thedata
rateanddelay. Other parameters such as number of hops, load, reliability, and
Maximum Transmission Unit (MTU) (which is the maximum packet size that
can traverse a link/network) are also used to characterise alink/network.
The data rate, also referred to asbandwidthor bit rate, is the maximum
amount of bits that can be put over a link in a given time3. The delay (also
known aslatency), on the other hand, specifies how long it takes for a certain
packet to traverse from the source to the destination and it is composed of
propagation delay (which is negligible in most terrestrialnetworks), queueing
delay, processing delay (such as framing, compression and error detection),
2This classification is a little bit blurred, specially when it comes to the transport layer,because some transport layers are optimised for a specific networks.
3Note that a given interface to a link can support multiple data rates and a given data rateis selected depending on several factors such as the load in the system and the user’s ServiceLevel Agreement (SLA) with the network provider.

190 APPENDIX A. BASIC NETWORKING CONCEPTS
and transmission time. The transmission time depends on thedata rate and
packet size and it is simply the packet size divided by the data rate.
Several other parameters, most of which derived from the data rate and
delay, are also commonly used to characterise network performance. The most
notable ones are:
• RTT: This refers to the time it takes for a packet to travel from the
sender to the receiver and back, not necessarily using the same path. If
the path and the packet size used in both direction are the same, then the
RTT is simply twice the latency.
• Packet loss ratio: This refers to the percentage of packets that are re-
ceived erroneously or not received at all. Several factors such as corrup-
tion in the transmission media (specially wireless links) and congestion
cause packet loss.
• Throughput: This refers to the total number of bits transferred over the
network in a given time. Note that the difference with the data rate is
that throughput is the actual rate of transfer, not the maximum possible.
Apart from the data rate and amount of data available to be sent, the
throughput also depends on the behaviour of protocols, suchas transport
layer protocols that provide congestion control mechanisms.
• Goodput: This is similar to the throughput, but it refers only to actual
transfer rate of user data (i.e. excludes overheads such as packet headers,
signalling packets and retransmissions).

Appendix B
Real Time Emulation Platform
As mentioned throughout the report, the results in this thesis are generated us-
ing Real-time Emulator for Service Performance Evalution of Cellular neTworks
(RESPECT). The following sections describe the design and implementation
of RESPECT, and its extended version that also supports heterogenous net-
work emulations. For a detailed description of RESPECT, thereader is re-
ferred to[72].
B.1 Core components
RESPECT is composed of four core modules, each module containing a set of
interrelated classes. The four different modules are called Common, Frame-
work, SnifferandEmulator. The Common, Framework and Sniffer modules
are generic modules that can be used to extend the emulator torepresent other
networks. The Emulator module is a collection of classes, mostly inherited
from the Framework and Common modules, that specifically model the UMTS
protocols.
191
192 APPENDIX B. REAL TIME EMULATION PLATFORM
B.1.1 Common Module
The common module provides base classes that are used to define interfaces
for the different parts of the system. This module contains five main classes,
namelyData_Handler, Data_Source_Sink, Thread, Configuration_Readerand
Logger. Data_Source_Sink provides an interface for entities thatact as sources
or sinks of data. The Data_Handler class, on the other hand, provides an inter-
face for those entities that are responsible for handling data. The Data_Handler
and Data_Source_Sink are associated 1-to-1, i.e. every source/sink should
have a handler that handles its data, and every handler should have an associ-
ated source/sink where it gets its data and where it passes the data after it has
processed it. The Configuration_Reader is a simple parser that handles pa-
rameter files. Thread is an abstract class that provides a wrapper for creating
and configuring the priority levels and the scheduling policies of threads using
C++ classes. The Logger class is used for logging data, such as results from
emulation runs and debugging information about the emulator operation.
If extensive logging to the hard disk is to be done at the same time as
the emulation process, timing requirements might not be met, as writing to the
hard disk is very slow and takes a considerable amount of CPU time compared
to emulation event periods. The logger mitigates this drawback of logging us-
ing remote logging (all logging is done via a TCP connection on a remote
server, i.e. no local hard disk access), accompanied by priority scheduling
(where the logging activities are set to the lowest priority) and voluntary pro-
cessor yielding.
Figure B.1 shows the impact of remote logging and prioritisation. When
the logging is done directly to the hard disk (Figure B.1(a)), deadlines can be
missed by hundreds of milliseconds, even though the mean time difference is
very small. Such rare but high delays can have a big impact forhigh bit rate
connections. By performing the logging remotely, the maximum timing mis-
match was reduced to a large extent, as shown in Figure B.1(b). The mean
time difference is higher than the previous case, but as the mean times in both
cases are very small, the outliers are the ones that affect the system perfor-
mance the most. When remote logging is combined with the aforementioned

B.1. CORE COMPONENTS 193
Tim
e D
iffe
re
nc
e [
ms
]
0 2 4 6 8 10 12 X 1040
200
400Mean=0.09ms; Std=2.7ms; Max=325.5ms
0 2 4 6 8 100
50
100Mean=0.75ms; Std=2.5ms; Max=66.9ms
12 X 104
Sample #0 2 4 6 8 10
0
5
10Mean=0.03ms; Std=0.07ms; Max=6.6ms
12 X 104
a) No priority, local logging
b) Priority enabled, local logging
c) Priority enabled, remote logging
Figure B.1: The impact of prioritisation and remote logging on meeting time expira-tion deadlines. The Y axis shows the difference between the actual time an action wastaken and the scheduled time.
priority scheduling scheme, the timing mismatches, in terms of the mean, stan-
dard deviation and the maximum values are improved tremendously, as shown
in Figure B.1(c).
B.1.2 Sniffer Module
The Sniffermodule provides the functionality of intercepting incoming/out-
going packets from/into the network on a real-time basis andsupplies the data

194 APPENDIX B. REAL TIME EMULATION PLATFORM
to the emulator module, which handles the packets and gives adecision on
what is to be done. The interception and re-injection of packets is done using
the Netfilter/Iptables packet handling framework[129]. Using this framework,
it is possible to drop, accept or queue packets based on criteria such as IP
addresses, port number or packet sizes.
During its setup, the Sniffer initialises the Netfilter packet filtering rules
for queueing the concerned packets. When a packet arrives atthe IP layer in
the emulator, the Sniffer raises an event to its associated data handler, which
is the emulator, letting it know that new data has been received. This event
includes information such as the size, identification and the direction of flow
of the packet, i.e. whether it is incoming or outgoing. The packet will be
kept inside the queue till the Sniffer receives a verdict to discard or release
the packet from the emulator. The Sniffer also logs the header information of
every incoming/outgoing packet in apcapfile format so that the connection
could be analysed further by using powerful tools such astcptrace[130].
B.1.3 Framework Module
The core protocol components of the emulator are designed based on CASINO
(Component Architecture for Simulating Network Objects)[131]. CASINO is
an object-oriented protocol development platform that is targeted for develop-
ing network communication protocol stacks. A scaled-down version of the
CASINO framework, with some modifications to fit the needs of RESPECT,
was re-implemented, based mainly on the design specifications of CASINO[132]. TheFrameworkmodule provides generic classes that implement basic
functionalities of protocols, packets, events, and timer handler that control the
events.
B.1.4 Emulator Module
This is the module that actually performs the UMTS emulationprocess. The
main class in the emulator module, known asEmulator, initialises the different

B.1. CORE COMPONENTS 195
RLC
MAC
PHY
RLC
MAC
PHY
MAC
PHY
Air Interface Iub InterfaceUE
NodeB
RNC
New packet event (coming from Sniffer)
Outgoing Incoming
PHY
RLC
Verdict (sent to Sniffer)
PASS (SDU assembled) or DROP (due to SDU discard)
Figure B.2: Communication between Emulator and Sniffer.
protocols and network entities and interconnects them for proper packet flow.
To get the emulation process started, the initial timers that would keep on firing
every Transmission Time Interval (TTI) are started. The Emulator accepts
packet from the Sniffer, propagates them down the protocol stack and also
notifies the Sniffer on behalf of its components when packetsare dealt with,
i.e. when it has passed through the whole protocol stack and ready to be
released back to the network or when a drop decision is made due to errors
in the air interface or buffer overflows. Figure B.2 shows this communication
process between the Sniffer and Emulator.
Apart from the Emulator class, the other main classes in thismodule are the
RLC, Medium Access Control (MAC), Physical (PHY) and Air Interface. The
RLC is implemented following the 3GPP RLC specifications[61], with full
support of the retransmission facilities described in the specification. Figure
B.3 summarises the RLC procedures and the details of each subtask is given
in detail in Figures B.4 - B.6.
The MAC layer is the one that determines the rate of information flow and
the granularity of the emulation process. Every TTI, the MACsends informa-
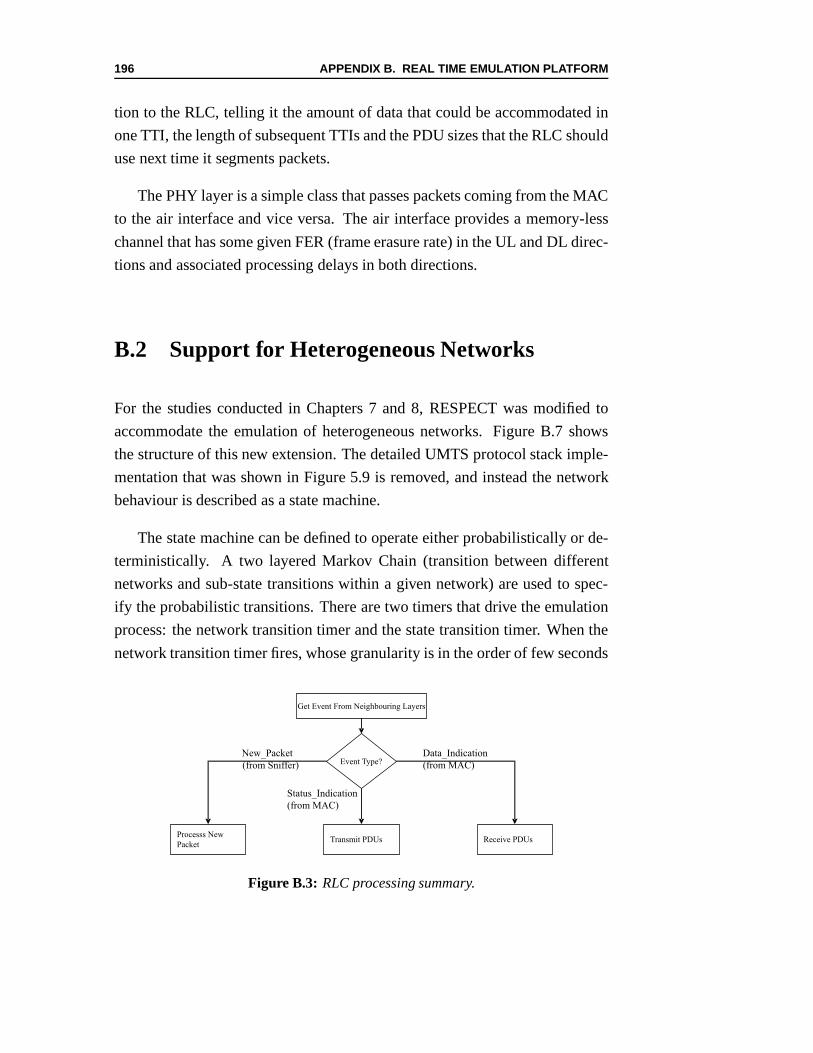
196 APPENDIX B. REAL TIME EMULATION PLATFORM
tion to the RLC, telling it the amount of data that could be accommodated in
one TTI, the length of subsequent TTIs and the PDU sizes that the RLC should
use next time it segments packets.
The PHY layer is a simple class that passes packets coming from the MAC
to the air interface and vice versa. The air interface provides a memory-less
channel that has some given FER (frame erasure rate) in the ULand DL direc-
tions and associated processing delays in both directions.
B.2 Support for Heterogeneous Networks
For the studies conducted in Chapters 7 and 8, RESPECT was modified to
accommodate the emulation of heterogeneous networks. Figure B.7 shows
the structure of this new extension. The detailed UMTS protocol stack imple-
mentation that was shown in Figure 5.9 is removed, and instead the network
behaviour is described as a state machine.
The state machine can be defined to operate either probabilistically or de-
terministically. A two layered Markov Chain (transition between different
networks and sub-state transitions within a given network)are used to spec-
ify the probabilistic transitions. There are two timers that drive the emulation
process: the network transition timer and the state transition timer. When the
network transition timer fires, whose granularity is in the order of few seconds
Event Type?
Get Event From Neighbouring Layers
Processs New
PacketTransmit PDUs Receive PDUs
New_Packet
(from Sniffer)
Data_Indication
(from MAC)
Status_Indication
(from MAC)
Figure B.3: RLC processing summary.

B.2. SUPPORT FOR HETEROGENEOUS NETWORKS 197
New packet from Sniffer
Buffer Available?
Segment packet
into RLC PDUS
Schedule PDUs
for transmission
Set timer for timer
based discard, if
configured
Send a buffer
Overflow message
to Sniffer
Done
Figure B.4: Arrival of new packets.

198 APPENDIX B. REAL TIME EMULATION PLATFORM
Put data PDU in
assembly buffer
PDUs left?
PDU type?
The only remaining
PDU of an SDU?
PDUs from MAC
Store ACK for the
PDU for status
reporting
Assemble the SDU
and send a notification
to the Sniffer
Piggybacked
Status?
Reschedule PDUs that
are NACKED from
transmit buffer
Remove the PDUs that
are ACKED from the
transmit buffer
Remove parts of SDUS
that are DISCARDED
from the receive buffer
Done
NoYes
Data PDU Status PDU
YesNo
YesNo
Get Next PDU
Figure B.5: Reception of PDUs.

B.2. SUPPORT FOR HETEROGENEOUS NETWORKS 199
Status Indication from MAC
Store bits per TTI to be used for next
transmission, and PDU size that would
be used to segment for new packets
Add list of discarded SDUs, if any, to
the status PDU
Need to send
status?
Put ACK information about the last
insequence received PDU in the status
PDU
Add a bitmap list for each PDU
between the last insequence PDU and
the highest PDU received
Polling required?
Set poll bit of the
first data PDU to be
transmitted
Restart any relevant timers
Can status be piggybacked
in first pdu from the
scheduled list?
Piggyback status at
the
end of the PDU
Put sandalone status
PDU to the front of
the scheduled list
Free space = bits per TTI;
Frame_to_send=empty
Append PDU into
frame to send
Get next Scheduled
PDU
Free_space = Free_space –
PDU_size
Scheduled PDUs
empty?
Free_space >0
Remove PDU from
the scheduled
Send frame to MAC
No
Yes
Yes
No
NoYes
Yes
No
Yes
No
Figure B.6: Transmission of PDUs.

200 APPENDIX B. REAL TIME EMULATION PLATFORM
Application
TCP
IP
Data Link
Physical
Application
TCP
IP
Data Link
Physical
Application
TCP
IP
Data Link
Physical
Data Link
Physical
EMULATOR
UE SERVER
Internet
WLANWLAN
UMTSUMTS
WLANGPRS
Data Link
Physical
IP
Data Link
Physical
IP
State1 State2 State3
Figure B.7: RESPECT extended for heterogeneous networks.
B.3. ACCURACY OF RESULTS 201
(which depends on the user’s mobility, fast movement resulting in lower timer
values), decisions will be taken whether to remain on the same network, or
handover to another network, based on the network transition probabilities.
On the other hand, the state transition timer, with finer granularity than that of
the network transition timer, specifies when to check for transitions between
the states of a given network (basically bit rate downgradesand upgrades).
A time limit or amount of data transmitted can also be used to specify
when a transition should be made between networks or within the sub-states
of a given network. Since the aim of this project is on link level studies and as
recent studies have found that Markov chains have low accuracy in capturing
network transition and sub-state transitions[133], the deterministic way of
specifying network transitions was used for the investigations carried out in
this thesis.
As shown in Figure B.7, the emulator intercepts packets at the IP level.
Based on the current network condition (current bit rate, delay distribution,
other temporary conditions such as handover and outage), packets will be
marked with a timestamp and they will be queued. The timestamp specifies at
what time the packets should be released to their destination. When handover
takes place between different networks, there is a possibility of just pausing
the connection (not the source traffic flow, as the emulator istransparent to the
application) or flushing the queued IP packets.
B.3 Accuracy of Results
Network simulations are commonly divided into two categories finite time
horizon(also called terminating) andsteady state[134]. In finite time hori-
zon the interest is in the behaviour of the network within a well specified pe-
riod. On the other hand, in steady state simulations the stable behaviour of the
network is the main interest. While it can be quite complicated to verify the
accuracy of steady state simulations, a terminating simulation’s accuracy can
easily be guaranteed by repeating the simulation with different seeds and stop

202 APPENDIX B. REAL TIME EMULATION PLATFORM
0 50 100 150 200 250 3005.6
5.7
5.8
5.9
6
6.1
6.2
6.3
6.4
6.5
6.6
Number of runs
Mea
n d
ow
nlo
ad t
ime
[sec
]
Figure B.8: Evolution of the mean download time with the number of runs.
when the accuracy is enough for the task at hand[134].
RESPECT is intended to be used in finite time horizon cases where the
interest is the performance of the link during a given duration that it takes to
perform a certain task (for example, file download). And as such, for the ex-
periments carried out in this thesis, the file downloads wererepeated several
times, each with a different random seed, until the mean value of the perfor-
mance metric considered stabilises.
0 50 100 150 200 250 3000
0.1
0.2
0.3
0.4
0.5
0.6
0.7
Number of runs
std
of
mea
n d
ow
nlo
ad t
ime
[sec
]
Figure B.9: Evolution of the standard deviation of the mean download time with thenumber of runs.

B.3. ACCURACY OF RESULTS 203
Figures B.8 and B.9 show the evolution of the mean download time and
its standard deviation for one of the cases investigated in Section 6.4.1 (the
No Eifel, out of order delivery sample in Figure 6.3). As can be seen from
the figures, the mean stabilises for a hundred or more number of simulations,
and its standard deviation decreases very fast with the number of samples,
becoming less than 0.1 seconds when the number of runs is morethan 150.
Figure B.10 shows the box plot of the normalised mean download time
for different number of simulation runs. As can be seen from the figure, even
with 10 simulations, for 50% of the cases (i.e. the ones in theinter-quantile
range) the error is less than 2%. The errors become marginal as the number of
simulation runs is increased, reaching below 0.5% for 300 simulations. The
result is similar for the other cases investigated in Chapters 5 and 6.
10 50 100 150 3000.9
0.910.920.930.940.950.960.970.980.99
11.011.021.031.041.051.061.071.08
Mea
n d
ow
nlo
ad t
ime
no
rmal
ised
to
sam
ple
mea
n
Number of runs
Figure B.10: Box plot of the mean download time normalised over the samplemean.


Appendix C
Setting RLC Polling Parameters,
an Example
In this appendix, an example illustrating a deadlock occurring in the RLC, and
how it can be corrected is given.
A 100 Kbyte file was being downloaded several times, for a 384 Kbps
connection with an average FER of 10%, to get some statistical averages on the
file download times.Poll last PDU, Poll last retransmitted PDU, andmissing
PDU indicationare all enabled to control polling and status reporting. It was
noticed that some of the values were quite large (in the orderof ten times the
mean). Tables C.1 and C.2 show the traces from the RLC and TCP layers at
the UE side, for one such case (the negative ID numbers refer to status PDUs).
From Table C.1 it can be seen that PDUs #1 & #2 of SDU# 15 were er-
roneous when they were received at TTI #488. So the polling request by the
sender, as identified by the polling bit of PDU #1 is lost alongwith it. Nothing
was being received between TTIs #497 and #787, that is for 2.9 seconds, as
each TTI represents 10 ms. This is confirmed by the TCP trace where there is
also no activity for almost 3 seconds (time difference between rows #2 and #3
in table C.2).
This idle period starts after the transmission of the SYN packet (which
205

206 APPENDIX C. SETTING RLC POLLING PARAMETERS, AN EXAMPLE
Table C.1: Traces from RLC layer.
TTI (SDU#, PDU#) #Transmission Polled Erroneous
469 (14, 2) 1 0 0
487 (-1, 15) 1 0 0
488 (15, 0) 1 1 1
488 (15, 1) 1 0 1
786 (-1, 16) 1 0 1
787 (16, 0) 1 1 0
787 (16, 1) 1 0 0
802 (15, 0) 2 1 1
802 (15, 1) 2 0 1
887 (17, 0) 1 1 0
887 (17, 1) 1 0 0
901 (15, 0) 3 1 0
901 (15, 1) 3 0 0
918 (-1, 17) 1 0 0
corresponds with SDU# 15 at the RLC layer) of the TCP connection setup
procedure. The deadlock occurred because the SYN packet wasthe last packet
in the window on the sender’s side and the sender TCP will not be transmitting
any data packets till it is done with the connection setup process, i.e. an ACK
for the SYN is received from the other side. The loss would nothave caused
a major drawback if the packet that was lost laid somewhere inthe middle
Table C.2: Traces from TCP layer.
1 14:57:10.209868 UE> SERVER: S 1736209341:1736209341(0)
2 14:57:10.210397 SERVER> UE: S 2037954080:2037954080(0)
ack 1736209342
3 14:57:13.202027 UE> SERVER: S 1736209341:1736209341(0)
4 14:57:13.202560 SERVER> UE: S 2037954080:2037954080(0)
ack 1736209342
5 14:57:14.212273 SERVER> UE. S 2037954080:2037954080(0)
ack 1736209342
6 14:57:14.523085 UE> SERVER: . ack 1
7 14:57:14.544901 SERVER> UE: . 1:1449(1448) ack 1

207
of the transmission window, as missing PDU indication wouldhave triggered
status reports when a higher sequence numbered PDU is received. Finally,
TCP times out and there is a TCP retransmission. The retransmitted SYN
corresponds to SDU# 16.
Apart from this deadlock, it can also be seen that the RLC keeps trying
to send SDU# 15 even though TCP has given up waiting for an ACK and re-
transmitted the packet. When the receiver gets the PDUs corresponding to the
retransmitted SYN packet at TTI #787, the missing PDU indication triggers
the transmission of a status report. The sender responds by retransmitting the
PDUs that were lost, which are unfortunately received erroneously once again
at TTI #802. This shows that the deadlock not only slowed the connection by
preventing the sender from transmitting for 3 seconds, but also led to the si-
multaneous retransmission of a packet at the TCP and RLC layers, and hence
wasting the precious wireless bandwidth.
Using a timer based polling resolved this deadlock that happens when the
last PDU in the transmission buffers is lost. This is becausethe sender starts a
timer when the last PDU is sent as a polling bit is set along with it due to the
poll last transmitted PDU setting. If no ACK or NACK regarding this PDU
is not received when this timer expires, the sender retransmits the last PDU in
order to resend the lost poll. Hence there is no need to wait for a TCP timeout
to continue data transmission.

Appendix D
Usability Experiment Forms
In this appendix, the orientation script and questionnaires used in the usability
experiments are given.
D.1 Orientation Script
This orientation script was read out at the beginning of eachexperiment ses-
sion to ensure that all users get the same information regarding the experiment.
“Hi, I am Oumer Teyeb. Welcome to this usability testing session and
thanks for taking the time.
We will be testing the effect of a mobile network’s characteristics on the
perceived quality of services of web browsing and video streaming services.
You will be accessing the services using a tablet PC, but you have to assume
that you are accessing the services over your mobile device.
In order to make the results of your observations as unbiasedas possible,
we will be conducting blind tests, i.e. you will not be told the different network
settings that will be tested.
While performing the tests, you will also be filling a questionnaire. After
209

210 APPENDIX D. USABILITY EXPERIMENT FORMS
each task, you will give a score regarding the quality of the service you just
experienced. There is also a space for putting additional comments for each
task.
I will be sitting next to you and we will conduct the tests together. I will
change the network settings, you perform the correspondingtask, grade the
quality you just experienced, and then we go to the next item to test and so on.
Do you have any questions?"
D.2 Questionnaire
A snippet of the questionnaire that the users filled while performing the differ-
ent tasks during the usability experiment is given below.
TASK 1: When the test conductor asks you to do so, click on the shortcut inthe desktop named “Google". If you are not sure how the download went, press“ctrl+F5" to force a refresh. Notice how the overall web pageis loaded. After thepage has loaded you can press the “search" button to go to the next page. Once thisis done, close the Internet Explorer window, grade the quality of the download youjust experienced and wait for the test conductor’s instruction to repeat the sameprocedure. A total of eight repetitions are made.
Run # Experienced Quality Any additional comments1 A. Excellent
B. GoodC. AcceptableD. PoorE. Unacceptable
.. .. ..
.. .. ..
.. .. ..8 A. Excellent
B. GoodC. AcceptableD. PoorE. Unacceptable
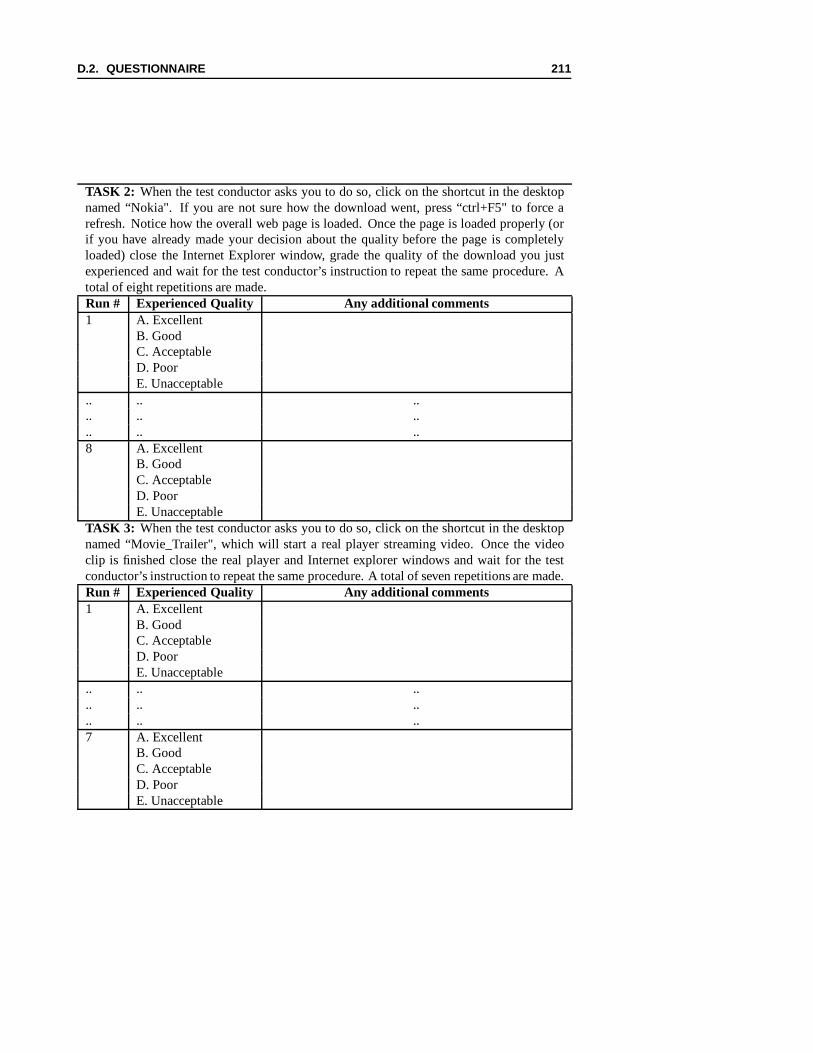
D.2. QUESTIONNAIRE 211
TASK 2: When the test conductor asks you to do so, click on the shortcut in the desktopnamed “Nokia". If you are not sure how the download went, press “ctrl+F5" to force arefresh. Notice how the overall web page is loaded. Once the page is loaded properly (orif you have already made your decision about the quality before the page is completelyloaded) close the Internet Explorer window, grade the quality of the download you justexperienced and wait for the test conductor’s instruction to repeat the same procedure. Atotal of eight repetitions are made.Run # Experienced Quality Any additional comments1 A. Excellent
B. GoodC. AcceptableD. PoorE. Unacceptable
.. .. ..
.. .. ..
.. .. ..8 A. Excellent
B. GoodC. AcceptableD. PoorE. Unacceptable
TASK 3: When the test conductor asks you to do so, click on the shortcut in the desktopnamed “Movie_Trailer", which will start a real player streaming video. Once the videoclip is finished close the real player and Internet explorer windows and wait for the testconductor’s instruction to repeat the same procedure. A total of seven repetitions are made.Run # Experienced Quality Any additional comments1 A. Excellent
B. GoodC. AcceptableD. PoorE. Unacceptable
.. .. ..
.. .. ..
.. .. ..7 A. Excellent
B. GoodC. AcceptableD. PoorE. Unacceptable


Appendix E
Example Illustrating Eifel
Performance Degradation
This appendix describes in detail the behaviour of the Eifelalgorithm as shown
in Figure 7.7 of Section 7.3.1.2. The figure, which shows the time sequence
graph where Eifel is used with no buffering and no handover delay, is shown
here again for convenience.
As can be seen from the figure, after the handover is finished there is a
4 4.5 5 5.5 6 6.5 7 7.5 8 8.5
4.6
4.8
5
5.2
5.4
5.6
5.8
6
6.2x 10
5
Time [sec]
Seq
uen
ce #
[b
yte
s]
Sent data
ACK received
Retransmission
Figure E.1: Time sequence graph: no handover delay, Eifel enabled, No buffering.
213

214 APPENDIX E. EXAMPLE ILLUSTRATING EIFEL PERFORMANCE DEGRADATION
Table E.1: TCP traces illustrating timestamps spurious retransmission detection thatleads to timeout.
Sender Side
1 4.453809 <– ack 519425 <timestamp 586403007/535598120>
2 4.456609 –> 580241:581689(1448) ack 1 <timestamp 535598173/586403007>
3 4.457840 –> 581689:583137(1448) ack 1 <timestamp 535598173/586403007>
4 5.232270 –> 519425:520873(1448) ack 1 <timestamp 535598251/586403007>
5 5.426615 <– ack 525217 <timestamp 586403098/535598125>
6 5.429447 –> 583137:584585(1448) ack 1 <timestamp 535598270/586403098>
7 5.430678 –> 584585:586033(1448) ack 1 <timestamp 535598270/586403098>
8 5.431980 –> 586033:587481(1448) ack 1 <timestamp 535598270/586403098>
9 5.623774 <– ack 525217 <timestamp 586403118/535598125>
10 5.655029 <– ack 525217 <timestamp 586403121/535598125>
11 5.686278 <– ack 525217 <timestamp 586403124/535598125>
12 7.011958 –> 525217:526665(1448) ack 1 <timestamp 535598429/586403124>
Receiver Side
1 4.427181 <– 517977:519425(1448) ack 1 <timestamp 535598120/586402954>
2 4.427265 –> ack 519425 <timestamp 586403007/535598120>
3 4.439181 <– 519425:520873(1448) ack 1 <timestamp 535598123/586402957>
4 4.451181 <– 520873:522321(1448) ack 1 <timestamp 535598123/586402957>
5 4.451265 –> ack 522321 <timestamp 586403009/535598123>
6 4.463181 <– 522321:523769(1448) ack 1 <timestamp 535598125/586402959>
7 4.475180 <– 523769:525217(1448) ack 1 <timestamp 535598125/586402959>
8 4.475274 –> ack 525217 <timestamp 586403012/535598125>
9 5.338559 <– 519425:520873(1448) ack 1 <timestamp 535598251/586403007>
10 5.338571 –> ack 525217 <timestamp 586403098/535598125>
11 5.535728 <– 583137:584585(1448) ack 1 <timestamp 535598270/586403098>
12 5.535740 –> ack 525217 <timestamp 586403118/535598125>
13 5.566978 <– 584585:586033(1448) ack 1 <timestamp 535598270/586403098>
timeout and a retransmission occurs at around 5.2 seconds. An ACK is re-
ceived a while after and instead of continuing with the retransmission of the
other lost packets, a couple of new packets are transmitted at around 5.4 sec-
onds. The reason for this behaviour is illustrated further in Table E.1 which
shows the traces of the TCP packets captured at the sender andreceiver just
before and after the handover. Arrows pointing to the left and right indicate
incoming and outgoing packets, respectively, at the machine where the packets
are captured.
Just before the handover the receiver gets the packet with sequence number
523769, at time 4.475180 (receiver trace line #7), and it sends an ACK request-
ing the next packet at time instant 4.475274 (receiver traceline #8). However,
215
this ACK (and also the previous ACK) are dropped as they were in flight at
the time of the handover. Thus, the last ACK received by the sender before the
handover is at 4.453809 (sender trace line #1) and this ACK was requesting
packet with sequence number of 519425. When the RTO expires at 5.232270
(sender trace line #4), the packet with sequence number 519425 is retransmit-
ted, even though it was correctly received, as the ACK signifying that was lost.
This retransmitted packet has a timestamp value of <535598251/586403007>,
where the first part is the current time at the sender, and the second one is the
timestamp of the last ACK received signifying the receipt ofthe packet just
before the retransmitted packet.
The receiver gets this retransmission at time instant 5.338559 seconds (re-
ceiver trace line #9) and it sends an ACK requesting for packet number 525217
(receiver trace line #10), as that is the next packet expected at the receiver.
Note that this ACK has the timestamp value <586403098/ 535598125>, where
the first part is the current time at the receiver and the second one is the times-
tamp of the packet that generated this ACK. When the sender gets this ACK
(sender trace line #5), it compares the replied timestamp (535598125) with the
timestamp sent with the retransmission (535598251) and finding out that it is
smaller, concludes that the retransmission of the concerned packet was spuri-
ous and leaves the recovery stage, restores the congestion window and starts
sending new data.
Although the decision that the retransmission of that particular packet was
spurious is right, it creates a problem because we have to wait for another
timeout (at time instant 7.011958), and hence an extra idle time of 1.3 seconds,
before we start retransmitting the packets that are actually lost.
