aalborg universitet boundary detection and enhancement...
TRANSCRIPT

Aalborg Universitet
Boundary detection and enhancement strategy for power system bus bar stabilization
investigation under fault conditions for islanding operation
Pouryekta, Aref; Ramachandaramurthy, Vigna K.; Sanjeevikumar, Padmanaban; Blåbjerg,Frede; Zapata, Josep Maria GuerreroPublished in:Energies
DOI (link to publication from Publisher):10.3390/en11040889
Creative Commons LicenseCC BY 4.0
Publication date:2018
Document VersionPublisher's PDF, also known as Version of record
Link to publication from Aalborg University
Citation for published version (APA):Pouryekta, A., Ramachandaramurthy, V. K., Padmanaban, S., Blaabjerg, F., & Guerrero, J. M. (2018). Boundarydetection and enhancement strategy for power system bus bar stabilization: investigation under fault conditionsfor islanding operation. Energies, 11(4), 1-22. [889]. https://doi.org/10.3390/en11040889
General rightsCopyright and moral rights for the publications made accessible in the public portal are retained by the authors and/or other copyright ownersand it is a condition of accessing publications that users recognise and abide by the legal requirements associated with these rights.
? Users may download and print one copy of any publication from the public portal for the purpose of private study or research. ? You may not further distribute the material or use it for any profit-making activity or commercial gain ? You may freely distribute the URL identifying the publication in the public portal ?
Take down policyIf you believe that this document breaches copyright please contact us at [email protected] providing details, and we will remove access tothe work immediately and investigate your claim.
Downloaded from vbn.aau.dk on: januar 21, 2019
energies
Article
Boundary Detection and Enhancement Strategy forPower System Bus Bar Stabilization—Investigationunder Fault Conditions for Islanding Operation
Aref Pouryekta 1, Vigna K. Ramachandaramurthy 1 ID , Sanjeevikumar Padmanaban 2,* ID ,Frede Blaabjerg 3 ID and Josep M. Guerrero 4 ID
1 Institute of Power Engineering, Department of Electrical Power Engineering, Universiti Tenaga Nasional,Kajang 43000, Malaysia; [email protected] (A.P.); [email protected] (V.K.R.)
2 Department of Energy Technology, Aalborg University, 6700 Esbjerg, Denmark3 Centre for Reliable Power Electronics, Department of Energy Technology, Aalborg University,
9000 Aalborg, Denmark; [email protected] Department of Energy Technology, Aalborg University, 9000 Aalborg, Denmark; [email protected]* Correspondence: [email protected]; Tel.: +91-984-310-8228
Received: 9 December 2017; Accepted: 4 January 2018; Published: 11 April 2018�����������������
Abstract: Distribution systems can form islands when faults occur. Each island represents a subsectionwith variable boundaries subject to the location of fault(s) in the system. A subsection with variableboundaries is referred to as an island in this paper. For operation in autonomous mode, it is imperativeto detect the island configurations and stabilize these subsections. This paper presents a novel schemefor the detection of island boundaries and stabilizing the system during autonomous operation.In the first stage, a boundary detection method is proposed to detect the configuration of the island.In the second stage, a dynamic voltage sensitivity factor (DVSF) is proposed to assess the dynamicperformance of the system. In the third stage, a wide area load shedding program is adoptedbased on DVSF to shed the load in weak bus-bars and stabilize the system. The proposed schemeis validated and tested on a generic 18-bus system using a combination of EMTDC/PSCAD andMATLAB software’s.
Keywords: islanding; load management; power distribution; voltage fluctuations
1. Introduction
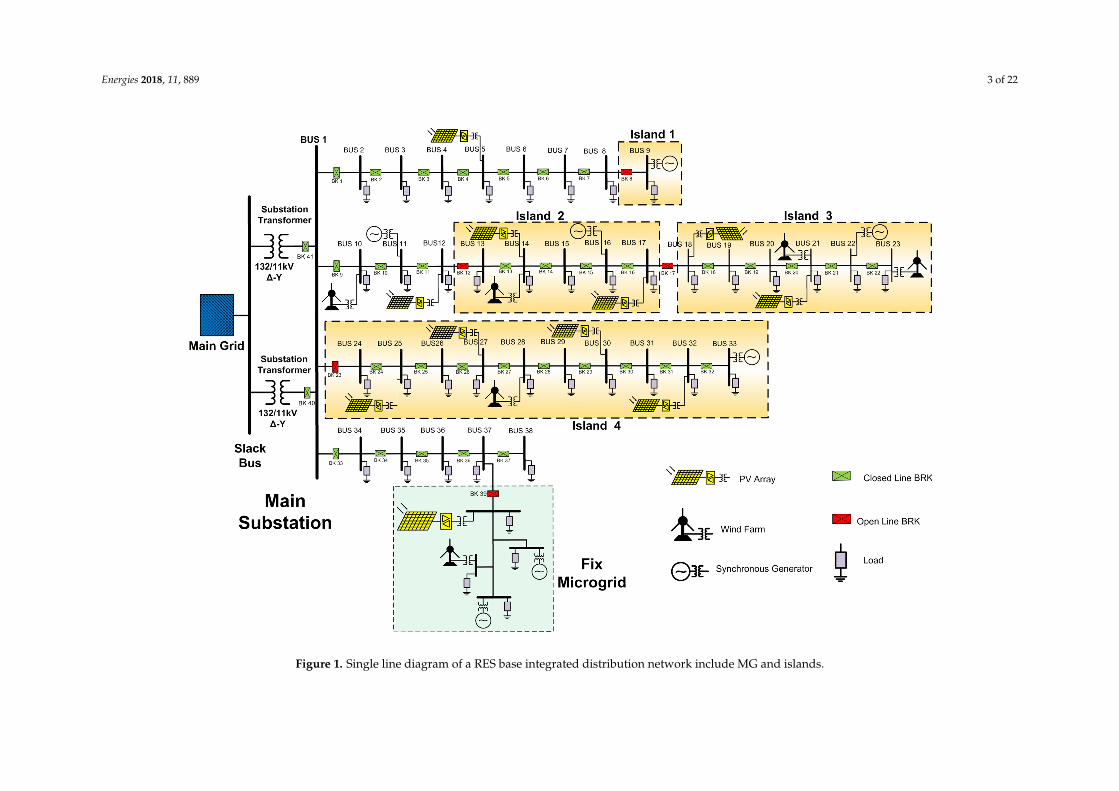
In recent decades, environmental concerns about greenhouse gases and global warming causedby fossil fuels have attracted many countries to adopt renewable energy sources (RES). RES-basedmicro grids are new structures in modern electrical distribution networks. Predefined clusters ofdispersed generator (DG) units associated with their vicinity loads provide the opportunity to form amicro grid (MG), which functions as a subsystem in the distribution network. Two operation modescan be defined for micro grids: grid-connected mode and autonomous mode. In a grid-connectedmode, MGs are able to exchange the energy with the upstream network. For the autonomous mode,during a grid failure or islanding, MG assures continues power supply to local loads and increasessystem reliability. A schematic diagram of a radial distribution network with MG and islands is shownin Figure 1.
Electrical connections between unspecified number of bus-bars and main grid can be lost due tofaults in the electrical distribution system. Hence, provided that at least one DG unit remains in theseparated section, an active island can be formed. Based on IEEE-Standard 1547, islanding should bedetected and DG units must cease to supply within 2 s.
Energies 2018, 11, 889; doi:10.3390/en11040889 www.mdpi.com/journal/energies

Energies 2018, 11, 889 2 of 22
Due to the high penetration of RES in distribution systems, islanded operation mode for DG unitsare considered by many utility providers as a suitable approach to maintain continuity and reliabilityof supply. However, as faults can occur at any point in a distribution system, the configuration ofthe active subsections formed is unpredictable. As shown in Figure 1, there are several possibilitiesto form islands via opening breakers BK1-BK37. The identification of the island configuration is oneof the important requirements for the power system analysis. Moreover, in order to stabilize thesystem and to conduct a voltage stability study, it is important to detect new system configuration(s)immediately after removing the faulty section. Furthermore, the new topology of the system is vitalfor triggering the self-healing scenarios including load and generator tripping, generation controls,intentional islanding and system reconfiguration.
Once islanding takes place, if the generation does not meet the load demand, load shedding isunavoidable to prevent voltage collapse. In order to enhance the voltage stability of the island, lessstable bus-bars can be chosen for load shedding. Thus, different voltage stability indices (VSI) can beused based on the system characteristics to determine weak bus-bars in the system. VSIs indicate thestability status of the bus-bars and line sections. When islanding takes place in the system, an onlinevoltage stability index can be utilized based on the new system structure results to determine theweakest bus-bars for load shedding. In order to detect islanding, three islanding detection methods(IDMs) [1–9] have been developed; Active Detection Method (ADM) [1,8–20], Passive DetectionMethod (PDM) and Remote Detection Method (RDM) [8,13,14,21–26].
The philosophy of the PDM is to measure the variables at PCC and compare with the referencevalues to detect the islanding. The advantages of these methods include simplicity and low cost toimplement as they use conventional metering and protection devices to detect islanding. There arealso several passive methods such as over/under voltage/frequency ones [1–7,27,28]. The over/undervoltage and frequency detection methods are easy to implement but their speed is unpredictable,moreover, they don’t have a detrimental impact on power quality [3–6]. The ROCOF detection methodis discussed in [8,9]. The ROCOF detection method is able to detect islanding in balanced conditionsand it does not have negative impact on power quality, however, any disturbance can result inmisdetection of islanding as well as it is hard to choose thresholds. The ROCOF Over Power detectionmethod is discussed in [9]. The ROCOF over Power method can detect islanding effectively whenthe power imbalance is small and has a small non-detection zone. The characteristics of Phase JumpDetection (PJD) are presented in [3,9]. PJD is difficult to implement and the threshold is hard to adjust.The main drawback is that the PDMs have a large non-detection zone (NDZ), which leads to failurein islanding detection when the load and power generation are balanced [29]. The performance ofADM is based on the perturbation and observation concept. A DG parameter is chosen to be distortedby injecting a perturbation. In a stiff grid, the amplitude of the variations at the DG unit terminal isnegligible since the grid parameters are dominant. However, injecting a disturbance into the terminalresults in a significant variation of the DG parameters during islanding phenomena.
The Impedance Measurement detection method [8,10–13] has a low performance in the presence ofmultiple DG units, introduces harmonics and it is hard to adjust the thresholds. For Active FrequencyDrift (AFD), NDZ is decreased as well as the error ratio and it is sensitive to the load [1,8,14–16].The Frequency Jump (FJ) detection method also is unable to detect the islanding in the presenceof multiple DG units [8]. The Negative Sequence Current Injection Method is not sensitive to loadchanges and has a better performance in the presence of multiple DG units [8,9,18–20]. There areseveral drawbacks for ADMs such as reduction in power quality via the injection of distortion into thesystem and the possibility of interfering distortion signals in the presence of multiple DG units.
Energies 2018, 11, 889 3 of 22
Energies 2018, 11, x FOR PEER REVIEW 3 of 22
Figure 1. Single line diagram of a RES base integrated distribution network include MG and islands.
Figure 1. Single line diagram of a RES base integrated distribution network include MG and islands.

Energies 2018, 11, 889 4 of 22
Remote detection methods (RDMs) were developed to overcome the problems faced by existingmethods. The RDMs employ a communication pattern between DG units and the main grid to alertand disconnect the DG units once unintentional islanding occurs. The Supervisory Control andData Acquisition (SCADA) detection method provides more control signals to control DG units, aswell as detection speed dependent on the system characteristics [8,14,21,22]. Power Line CarrierSignaling (PLCS) is applicable for both DG types, and uses the existing electrical network as a path forsignaling. The PLCS method is suitable for large networks with high penetration of DG units since itis costly [8,23–25]. RDMs are applicable to the systems with multiple DG units which include bothinverter-based sources and synchronous generators.
In [30–36], different load shedding methods have been developed for micro grids. Measurementof the system parameters such as voltages, frequency and rate of change of frequency reveals theimbalance between generation and load demand. Hence, the load shedding method would assure thestable operation. However, not all these methods are able to do the load shedding for the islands sincethe bus-bars for load shedding cannot be predefined.
Since these IDMs monitor voltage, current, etc. at the point of common coupling (PCC), theycan detect the islanding of DG units. However, these methods are not capable of identifying theboundary of the island. The method proposed here is able to detect the boundary of the island anddetermine the available generation and load in each island. Moreover, the proposed method can beapplied on meshed networks. The proposed method is also applicable to systems with non-consecutivebus-bar numbering.
In order to determine the system voltage stability status, various indices have beendeveloped [37–39]. Voltage stability analysis can be categorized as dynamic analysis and static analysisand uses static voltage stability indices (SVSIs). Pre-islanding information or micro grid information isused to assess the voltage stability of the system using SVSIs. Hence, SVSIs do not reflect the dynamicoperation of the power system during contingencies. However, dynamic analysis identifies the systemparameters during transient and steady state conditions. Thus, an index is required to identify dynamicperformance and system stability.
Modified graph theory is utilized to detect the boundary of each island. In the second step, inorder to perform a wide area load shedding, a dynamic voltage sensitivity factor (DVSF) is proposedto specify the weak bus-bars in the system. The proposed DVSF shows the relevancy of reactive powerand voltage at each bus-bar. Thus, the most sensitive bus-bars based on new configuration of thesystem are chosen for load shedding.
This paper is organized as follows: Section 2 explains the methodology of the proposed algorithm.Section 3 presents the boundary detection method for islands. Section 4 elaborates the calculation ofdynamic sensitivity factor for the islands. In Section 5, a practical test network is utilized to validatethe proposed scheme. Simulation results are investigated in Section 6 and the conclusion is presentedin Section 7.
2. Proposed Scheme to Stabilize the System
The proposed scheme assumes that voltage and current measurements are available at eachbus-bar. When islanding occurs in the system, the number of islands is identified using the proposeddetection method. The proposed algorithm also specifies the bus-bars belonging to each island.A power system with many bus-bars can be divided into several active and reactive islands dependingon the availability of generation in islanded sections. The islands topology is not predictable due tothe nature of the fault. In Figure 2, an islanded network is shown. The main idea of this method is todetermine the configuration of the islands and maintain system stability. When island configuration isdetermined, the amount of available generation and load demand are disclosed. Load shedding in theweakest bus-bar prevents voltage collapse in the system.

Energies 2018, 11, 889 5 of 22
Energies 2018, 11, x FOR PEER REVIEW 5 of 22
Figure 2. A Power system with four islands.
Weak bus-bars are chosen based on the dynamic voltage sensitivity factor. In order to conform to IEEE-1547 standard, after the first round of load shedding, if the system frequency division exceeds the ±1% of its rating, further load shedding will be done at the next weak bus-bar based on the new DVSF. This procedure is repeated until a stable operation point for all islands is gained. A flowchart of the proposed algorithm is depicted in Figure 3.
Figure 2. A Power system with four islands.
Weak bus-bars are chosen based on the dynamic voltage sensitivity factor. In order to conform toIEEE-1547 standard, after the first round of load shedding, if the system frequency division exceedsthe ±1% of its rating, further load shedding will be done at the next weak bus-bar based on the newDVSF. This procedure is repeated until a stable operation point for all islands is gained. A flowchart ofthe proposed algorithm is depicted in Figure 3.
Energies 2018, 11, x FOR PEER REVIEW 5 of 22
Figure 2. A Power system with four islands.
Weak bus-bars are chosen based on the dynamic voltage sensitivity factor. In order to conform to IEEE-1547 standard, after the first round of load shedding, if the system frequency division exceeds the ±1% of its rating, further load shedding will be done at the next weak bus-bar based on the new DVSF. This procedure is repeated until a stable operation point for all islands is gained. A flowchart of the proposed algorithm is depicted in Figure 3.
Figure 3. Flowchart of the proposed scheme to stabilize a system after islanding.
Energies 2018, 11, 889 6 of 22
3. Boundary Detection Using Graph Model
The focus of existing detection methods is to detect the islanding at PCC. However, in this paper,a boundary detection algorithm based on modified graph theory is proposed to identify the islandstopology once they are formed. A simplified graph theory is utilized for different purposes such asmicro grid reconfiguration [40] and load flow calculation [41].
3.1. Node Integration Matrix
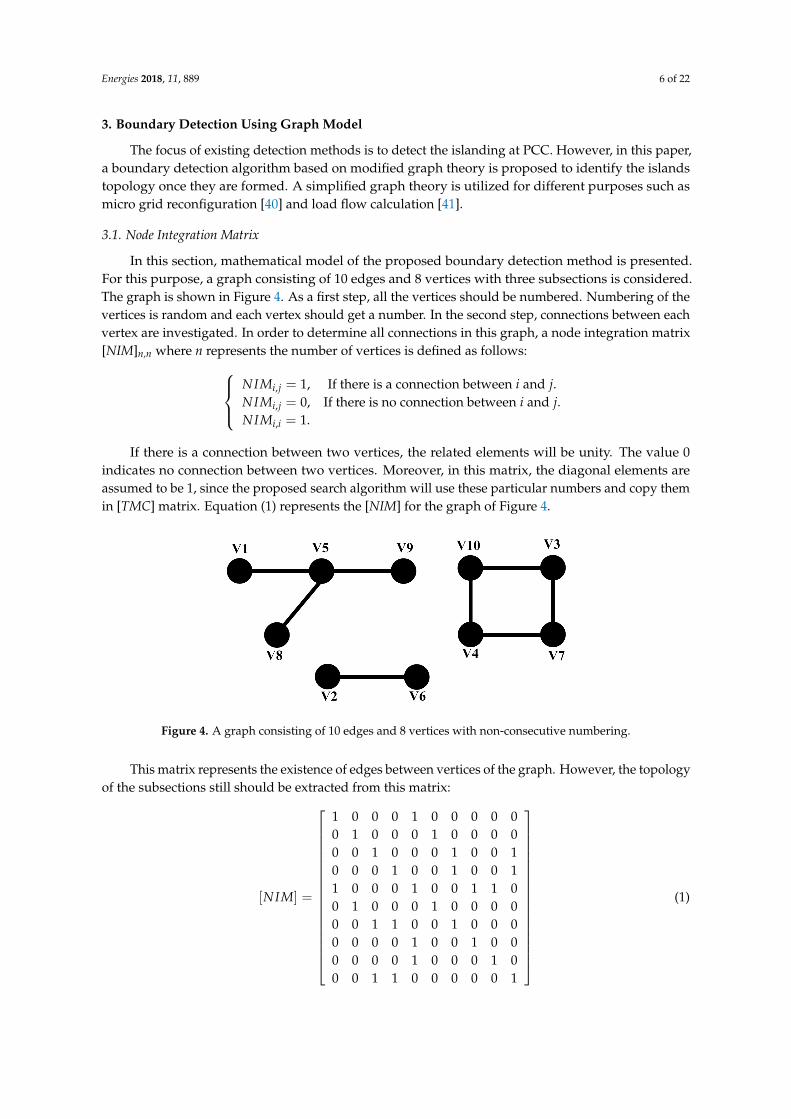
In this section, mathematical model of the proposed boundary detection method is presented.For this purpose, a graph consisting of 10 edges and 8 vertices with three subsections is considered.The graph is shown in Figure 4. As a first step, all the vertices should be numbered. Numbering of thevertices is random and each vertex should get a number. In the second step, connections between eachvertex are investigated. In order to determine all connections in this graph, a node integration matrix[NIM]n,n where n represents the number of vertices is defined as follows:
NIMi,j = 1, If there is a connection between i and j.NIMi,j = 0, If there is no connection between i and j.NIMi,i = 1.
If there is a connection between two vertices, the related elements will be unity. The value 0indicates no connection between two vertices. Moreover, in this matrix, the diagonal elements areassumed to be 1, since the proposed search algorithm will use these particular numbers and copy themin [TMC] matrix. Equation (1) represents the [NIM] for the graph of Figure 4.
Energies 2018, 11, x FOR PEER REVIEW 6 of 22
Figure 3. Flowchart of the proposed scheme to stabilize a system after islanding.
3. Boundary Detection Using Graph Model
The focus of existing detection methods is to detect the islanding at PCC. However, in this paper, a boundary detection algorithm based on modified graph theory is proposed to identify the islands topology once they are formed. A simplified graph theory is utilized for different purposes such as micro grid reconfiguration [40] and load flow calculation [41].
3.1. Node Integration Matrix
In this section, mathematical model of the proposed boundary detection method is presented. For this purpose, a graph consisting of 10 edges and 8 vertices with three subsections is considered. The graph is shown in Figure 4. As a first step, all the vertices should be numbered. Numbering of the vertices is random and each vertex should get a number. In the second step, connections between each vertex are investigated. In order to determine all connections in this graph, a node integration matrix [NIM]n,n where n represents the number of vertices is defined as follows:
1 If
0
there is a connection between and
there is no connection between anIf
1
d
=
= =
i , j
i , j
i ,i
i j.
i j.
NIM ,
NIM ,
NIM
If there is a connection between two vertices, the related elements will be unity. The value 0 indicates no connection between two vertices. Moreover, in this matrix, the diagonal elements are assumed to be 1, since the proposed search algorithm will use these particular numbers and copy them in [TMC] matrix. Equation (1) represents the [NIM] for the graph of Figure 4.
Figure 4. A graph consisting of 10 edges and 8 vertices with non-consecutive numbering.
This matrix represents the existence of edges between vertices of the graph. However, the topology of the subsections still should be extracted from this matrix:
=
1000001100010001000000100100000001001100000010001001100100011001001000100100010000001000100000010001
][NIM (1)
Figure 4. A graph consisting of 10 edges and 8 vertices with non-consecutive numbering.
This matrix represents the existence of edges between vertices of the graph. However, the topologyof the subsections still should be extracted from this matrix:
[NIM] =
1 0 0 0 1 0 0 0 0 00 1 0 0 0 1 0 0 0 00 0 1 0 0 0 1 0 0 10 0 0 1 0 0 1 0 0 11 0 0 0 1 0 0 1 1 00 1 0 0 0 1 0 0 0 00 0 1 1 0 0 1 0 0 00 0 0 0 1 0 0 1 0 00 0 0 0 1 0 0 0 1 00 0 1 1 0 0 0 0 0 1
(1)

Energies 2018, 11, 889 7 of 22
3.2. Topology Connection Matrix
Once the node integration matrix is calculated, the topology Connection Matrix [TCM]n,n is carriedout. The topology connection matrix represents the subsections and the vertices in each subsection.The flowchart to calculate the [TCM] is depicted in Figure 5. Like the node integration matrix, [TCM] isa square matrix and the number of rows and columns depends on the number of vertices. The [NIM]is utilized to determine all routes in the system. The steps of determining the subsection is as follows:
(a) As a first step, vertex V1 is chosen and the route starting from this vertex to other vertices isdetermined. For this purpose, existence of any edge between V2 and V1 is investigated. If anyconnection is found between V2 and V1, then connection between V3 and V2 will be checkedand this will continue for the next vertex. Using this method, the route starts from V1 canbe determined.
(b) In the second step, since there is a possibility of more than one edge connected to V1, theconnection between other unchecked vertices and V1 should be investigated. This step isrepeated to find a link between all other vertices and V1.
The same steps are applied to the rest of the vertices to determine all the subsections. In Figure 5,the flowchart for calculating the [TCM] is depicted. According to this flowchart, the following are thesteps to determine the island’s boundary:
(1) For a graph with n vertices, an identity square matrix is formed.(2) Start to build the ith row.(3) If NIMj,k = 1, there is a connection between jth vertex and upstream kth vertices. Then, set the
TCMi,j = TCMi,k.
(4) Repeat the procedure from step (2) to build the next row of [TCM] for all the vertices.
The proposed algorithm in Figure 5 is used to determine the routes connecting two or morevertices. As explained above, the connectivity of each vertex with all upstream vertices is examined.Using this method, all the routes connecting the examined vertices can be detected.
Since the connection between one vertex to other vertices is checked just once by this algorithm,time will be saved. Moreover, since all the routes are determined using the above procedures, thisalgorithm can be applied on graphs with loops as well. Equation (2) represents the [TCM] matrix forthe graph of Figure 4. When a consecutive numbering for vertices is used, The [TMC] can be calculatedusing Equation (2):
[TCM] =
1 0 0 0 1 0 0 1 1 00 1 0 0 0 1 0 0 0 00 0 1 1 0 0 1 0 0 10 0 1 1 0 0 1 0 0 11 0 0 0 1 0 0 1 1 00 1 0 0 0 1 0 0 0 00 0 1 1 0 0 1 0 0 11 0 0 0 1 0 0 1 1 01 0 0 0 1 0 0 1 1 00 0 1 1 0 0 1 0 0 1
(2)

Energies 2018, 11, 889 8 of 22
Energies 2018, 11, x FOR PEER REVIEW 8 of 22
Figure 5. Flowchart for [TCM] calculation.
3.3. Boundary Detection Matrix
In the previous section, the topology connection matrix is formed and the subsections are marked. In this step, vertices in each subsection are extracted and Boundary Detection Matrix , is formed. In this matrix, ns represents the number of subsections and nv represents the number of vertices in the largest subsection. The maximum ns are equal to n when all the vertices are separated and no edge in the graph. In contrast, the maximum value for nv is obtained for integrated graphs without any subsection. As shown in Equation (2), each row indicates one subsection. The steps for extracting the vertices and determining the boundary of each subsection are as follows:
(a) First, in the first row of [TCM], the column numbers of those elements that are equal to 1 are taken to the [BDM].
(b) Second, when column numbers (for example: column 1 and column 2) has been taken to [BDM], all the elements in the in the [TCM] rows with same number (row 1 and row2) have been changed to 0.
Figure 5. Flowchart for [TCM] calculation.
3.3. Boundary Detection Matrix
In the previous section, the topology connection matrix is formed and the subsections are marked.In this step, vertices in each subsection are extracted and Boundary Detection Matrix [BDM]ns ,nv
isformed. In this matrix, ns represents the number of subsections and nv represents the number ofvertices in the largest subsection. The maximum ns are equal to n when all the vertices are separatedand no edge in the graph. In contrast, the maximum value for nv is obtained for integrated graphswithout any subsection. As shown in Equation (2), each row indicates one subsection. The steps forextracting the vertices and determining the boundary of each subsection are as follows:
(a) First, in the first row of [TCM], the column numbers of those elements that are equal to 1 aretaken to the [BDM].

Energies 2018, 11, 889 9 of 22
(b) Second, when column numbers (for example: column 1 and column 2) has been taken to [BDM],all the elements in the in the [TCM] rows with same number (row 1 and row2) have been changedto 0.
(c) Third, the next row with non-zero elements is checked with the same procedure that explainedin (a).
When the entire rows of the [TCM] are checked, the [BDM] matrix will be completed.The flowchart to identify the subsections and vertices in each section is depicted in Figure 6.The following are the steps to calculate [BDM]:
(1) Start with mth row of [TMC] to find if there is 1 in this row.(2) Set the BDMi,j to m (ith is based on number of subsections).
(3) Set entire mth row of [TMC] to zero and go to step 1.
Energies 2018, 11, x FOR PEER REVIEW 9 of 22
(c) Third, the next row with non-zero elements is checked with the same procedure that explained in (a).
When the entire rows of the [TCM] are checked, the [BDM] matrix will be completed. The flowchart to identify the subsections and vertices in each section is depicted in Figure 6. The following are the steps to calculate [BDM]:
(1) Start with mth row of [TMC] to find if there is 1 in this row. (2) Set the BDMi,j to m (ith is based on number of subsections). (3) Set entire mth row of [TMC] to zero and go to step 1.
Equation (3) shows the [BDM] matrix calculated using the procedures mentioned previously. Three different subsections including the number of vertices in each section are shown using Equation (3). One important advantage of the proposed method is the ability to detect the boundaries in meshed networks with various loops and non-consecutive bus-bar numbering.
1 2 3 4 56 7 8 9 0
10 11 12 0 0
=
BDM (3)
Figure 6. Procedure to extract subsections and bus-bars. Figure 6. Procedure to extract subsections and bus-bars.

Energies 2018, 11, 889 10 of 22
Equation (3) shows the [BDM] matrix calculated using the procedures mentioned previously.Three different subsections including the number of vertices in each section are shown usingEquation (3). One important advantage of the proposed method is the ability to detect the boundariesin meshed networks with various loops and non-consecutive bus-bar numbering.
[BDM] =
1 2 3 4 56 7 8 9 0
10 11 12 0 0
(3)
4. Dynamic Voltage Sensitivity
In this paper, a novel dynamic voltage sensitivity factor is proposed to provide useful informationabout the system’s dynamic performance during islanding. Online calculation of instantaneous staticvoltage stability provides a pattern of points, which can be used as a dynamic index to determinethe system voltage stability for each bus-bar. The DVSF reflects the influence of changes in systemparameters on each bus-bar’s stability status and determines the weak bus-bar before and afterislanding. A conventional load flow Jacobian matrix is used to determine the DVSF. In order tocalculate the DVSF, bus-bar admittance matrix [Ybus] and the Jacobian matrix is re-calculated based onthe system configuration. A three-dimensional [Ybus] is defined according to the new configuration ofthe system. Figure 7 demonstrates the [Ybus] for a system with ns islands. The size of the new [Ybus] is(nv, nv, ns). In this matrix, mth layer represents the calculated elements for mth island.
Energies 2018, 11, x FOR PEER REVIEW 10 of 22
4. Dynamic Voltage Sensitivity
In this paper, a novel dynamic voltage sensitivity factor is proposed to provide useful information about the system’s dynamic performance during islanding. Online calculation of instantaneous static voltage stability provides a pattern of points, which can be used as a dynamic index to determine the system voltage stability for each bus-bar. The DVSF reflects the influence of changes in system parameters on each bus-bar’s stability status and determines the weak bus-bar before and after islanding. A conventional load flow Jacobian matrix is used to determine the DVSF. In order to calculate the DVSF, bus-bar admittance matrix [Ybus] and the Jacobian matrix is re-calculated based on the system configuration. A three-dimensional [Ybus] is defined according to the new configuration of the system. Figure 7 demonstrates the [Ybus] for a system with ns islands. The size of the new [Ybus] is (nv, nv, ns). In this matrix, mth layer represents the calculated elements for mth island.
(nv,n1,ns)
)1,,()1,1,(
)1,,1()1,1,1(
vvv
v
nnbusnbus
nbusbus
YY
YY
),,(),1,(
),,1(),1,1(
svvsv
svs
nnnbusnnbus
nnbusnbus
YY
YY
Figure 7. Three-dimensional admittance matrix.
Similarly, a new Jacobian matrix according to the new system configuration is calculated. The dimensions of the new Jacobian matrix are (2nv × 2nv × 2ns). Equations (4)–(8) represents the mth layer of the Jacobian matrix calculated for the mth island in the system:
[ ]1 2
3 4
= − − − − − −
m m
( m )
m m
J | J
J
J | J
(4)
( )
( )
≠∀+−−=∂∂
+−=∂∂
=
≠
ijYVVP
YVVP
J
mjmimjimjimjmimj
mi
ijmjmimjimjimjmi
mi
mi
m
,,,,,,,,,
,
,,,,,,,,,
,
1
sin
sin
δδθδ
δδθδ (5)
( ) ( )
( )
≠∀+−=∂
∂
+−++−=∂
∂
=
≠
ijYVV
P
YVYVV
P
J
mjmimjimjimi
mj
mi
ijmjmimjimjimjmjmimjimiimi
mi
mi
m
,,,,,,,,
,
,,,,,,,,,,,,,,,
,
2
cos
coscos2
δδθ
δδθδδθ (6)
Figure 7. Three-dimensional admittance matrix.
Similarly, a new Jacobian matrix according to the new system configuration is calculated.The dimensions of the new Jacobian matrix are (2nv × 2nv × 2ns). Equations (4)–(8) representsthe mth layer of the Jacobian matrix calculated for the mth island in the system:
[J](m) =
Jm1 | Jm
2−− −− −−Jm3 | Jm
4
(4)
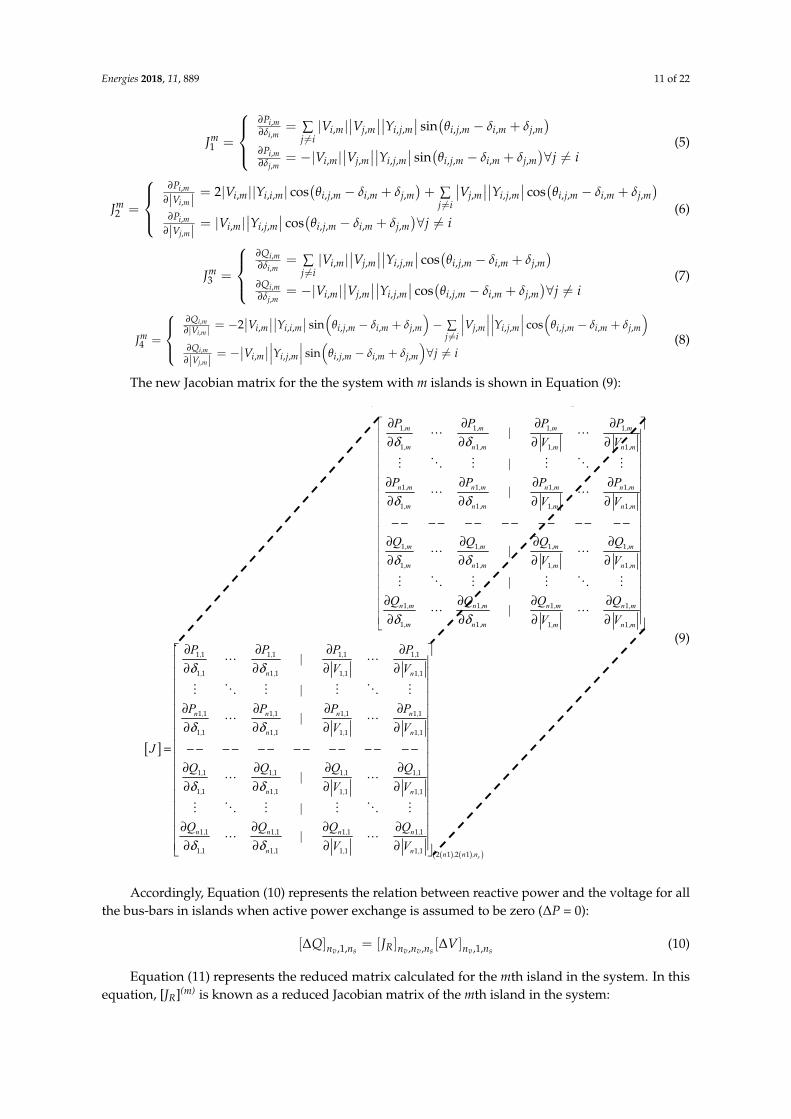
Energies 2018, 11, 889 11 of 22
Jm1 =
∂Pi,m∂δi,m
= ∑j 6=i|Vi,m|
∣∣Vj,m∣∣∣∣Yi,j,m
∣∣ sin(θi,j,m − δi,m + δj,m
)∂Pi,m∂δj,m
= −|Vi,m|∣∣Vj,m
∣∣∣∣Yi,j,m∣∣ sin
(θi,j,m − δi,m + δj,m
)∀j 6= i
(5)
Jm2 =
∂Pi,m
∂|Vi,m| = 2|Vi,m||Yi,i,m| cos(θi,j,m − δi,m + δj,m
)+ ∑
j 6=i
∣∣Vj,m∣∣∣∣Yi,j,m
∣∣ cos(θi,j,m − δi,m + δj,m
)∂Pi,m
∂|Vj,m| = |Vi,m|∣∣Yi,j,m
∣∣ cos(θi,j,m − δi,m + δj,m
)∀j 6= i
(6)
Jm3 =
∂Qi,m∂δi,m
= ∑j 6=i|Vi,m|
∣∣Vj,m∣∣∣∣Yi,j,m
∣∣ cos(θi,j,m − δi,m + δj,m
)∂Qi,m∂δj,m
= −|Vi,m|∣∣Vj,m
∣∣∣∣Yi,j,m∣∣ cos
(θi,j,m − δi,m + δj,m
)∀j 6= i
(7)
Jm4 =
∂Qi,m∂|Vi,m | = −2
∣∣Vi,m∣∣∣∣Yi,i,m
∣∣ sin(
θi,j,m − δi,m + δj,m
)− ∑
j 6=i
∣∣∣Vj,m
∣∣∣∣∣∣Yi,j,m
∣∣∣ cos(
θi,j,m − δi,m + δj,m
)∂Qi,m
∂|Vj,m| = −∣∣Vi,m
∣∣∣∣∣Yi,j,m
∣∣∣ sin(
θi,j,m − δi,m + δj,m
)∀j 6= i
(8)
The new Jacobian matrix for the the system with m islands is shown in Equation (9):
Energies 2018, 11, x FOR PEER REVIEW 11 of 22
( )
( )
≠∀+−−=∂∂
+−=∂∂
=
≠
ijYVVQ
YVVQ
J
mjmimjimjimjmimj
mi
ijmjmimjimjimjmi
mi
mi
m
,,,,,,,,,
,
,,,,,,,,,
,
3
cos
cos
δδθδ
δδθδ (7)
( ) ( )
( )
≠∀+−−=∂∂
+−−+−−=∂∂
=
≠
ijYVV
Q
YVYVV
Q
J
mjmimjimjimi
mj
mi
ijmjmimjimjimjmjmimjimiimi
mi
mi
m
,,,,,,,,
,
,,,,,,,,,,,,,,,
,
4
sin
cossin2
δδθ
δδθδδθ (8)
The new Jacobian matrix for the the system with m islands is shown in Equation (9):
,m ,m ,m ,m
,m n ,m ,m n ,m
n ,m n ,m n ,m n ,m
,m n ,m ,m n ,m
,m ,m ,m ,m
,m n ,m ,m n ,m
n ,m n ,m n ,m
,m n ,m
P P P P|
V V
|
P P P P|
V V
Q Q Q Q|
V V
|
Q Q Q|
V
δ δ
δ δ
δ δ
δ δ
∂ ∂ ∂ ∂∂ ∂ ∂ ∂
∂ ∂ ∂ ∂∂ ∂ ∂ ∂
− − − − − − − − − − − − − −∂ ∂ ∂ ∂∂ ∂ ∂ ∂
∂ ∂ ∂∂ ∂ ∂
1 1 1 1
1 1 1 1
1 1 1 1
1 1 1 1
1 1 1 1
1 1 1 1
1 1 1
1 1
n ,m
,m n ,m
Q
V
∂ ∂
1
1 1
[ ]
, , , ,
, n , , n ,
n , n , n , n ,
, n , , n ,
, , , ,
, n , , n ,
n , n , n ,
, n ,
P P P P|
V V
|
P P P P|
V V
J
Q Q Q Q|
V V
|
Q Q Q|
δ δ
δ δ
δ δ
δ δ
∂ ∂ ∂ ∂∂ ∂ ∂ ∂
∂ ∂ ∂ ∂∂ ∂ ∂ ∂
= − − − − − − − − − − − − − −∂ ∂ ∂ ∂∂ ∂ ∂ ∂
∂ ∂ ∂∂ ∂
1 1 1 1 1 1 1 1
1 1 1 1 1 1 1 1
1 1 1 1 1 1 1 1
1 1 1 1 1 1 1 1
1 1 1 1 1 1 1 1
1 1 1 1 1 1 1 1
1 1 1 1 1 1
1 1 1 1 ( ) ( )( )s
n ,
, n , n , n ,n
Q
V V
∂ ∂ ∂
1 1
1 1 1 1 2 1 2 1
(9)
Accordingly, Equation (10) represents the relation between reactive power and the voltage for all the bus-bars in islands when active power exchange is assumed to be zero (ΔP = 0):
, , , , , ,[ ] [ ] [ ]1 1Δ = Δv s v v s v sn n R n n n n nQ J V (10)
Equation (11) represents the reduced matrix calculated for the mth island in the system. In this equation, [JR](m) is known as a reduced Jacobian matrix of the mth island in the system:
[ ]( ) ( ) ( ) ( ) ( )14 3 1 2
− = − m m m m m
RJ J J J J (11)
Change in voltage with regards to the injected reactive power for the mth island can be defined by Equation (12):
[ ] [ ]( )( ) ( )1− Δ = Δ mm m
RV J Q (12)
(9)
Accordingly, Equation (10) represents the relation between reactive power and the voltage for allthe bus-bars in islands when active power exchange is assumed to be zero (∆P = 0):
[∆Q]nv ,1,ns= [JR]nv ,nv ,ns
[∆V]nv ,1,ns(10)
Equation (11) represents the reduced matrix calculated for the mth island in the system. In thisequation, [JR](m) is known as a reduced Jacobian matrix of the mth island in the system:

Energies 2018, 11, 889 12 of 22
[JR](m) =
[J4(m) − J3
(m) J−11
(m) J2(m)]
(11)
Change in voltage with regards to the injected reactive power for the mth island can be definedby Equation (12):
[∆V](m) =[
J−1R
](m)[∆Q](m) (12)
Diagonal values of the[
J−1R
](m), represents the voltage sensitivity for each bus-bar of the mth
island in the system. DVSF is defined individually for each bus-bar. Positive and small values forDVSF indicate stable operation. On the contrary, high values for sensitivity factor are obtained whenthe system is near its stability margins. Negative values represent unstable operation and very smallnegative values represent very unstable operation. Since the relation between voltage and reactivepower is nonlinear, the magnitude of the sensitivity factor in different operating conditions does notprovide the degree of the stability [42].
5. Generic Test Distribution System
A modified 11 kV, 50 Hz generic network from a Malaysian electrical distribution utility wasmodeled using EMTDC/PSCAD in order to investigate the proposed boundary detection method anddynamic voltage sensitivity factor. The single line diagram of this network is presented in Figure 8.The network has 18 bus-bars and 17 overhead lines. Both transformers in the main substation are132/11 kV, ∆-Yg, rated at 30 MVA and impedance 10%. Fault level at 132 kV bus-bar is 14 kA and at11 kV is 17.8 kA. Three 2 MVA synchronous generators were used as DG units as shown in Figure 8.The DG units are equipped with droop control to adjust the voltage and frequency after islanding.Each generator is connected to the distribution network via 0.4/11 kV, 3 MVA Yg-Yg transformer with5% impedance. Simulation results are discussed in detail in the next section.
6. Results and Discussion
A case study with three islands was investigated to verify the performance of the proposedmethods. In order to model the system, PSCAD/EMTDC and MATLAB were utilized. The networkwas modeled in PSCAD and the proposed algorithms were analyzed in MATLAB. A user definedblock was used as an interface to exchange the data between the software’s and to send the widearea load shedding commands from MATLAB to PSCAD. Synchronous generator ‘start event’ wassimulated via releasing the rotor at 2 s. Intentional islanding was initiated in the system after 15 s viaopening the line sections L1, L9 and L13 as in Figure 8. The opening of three line sections split thenetwork to four subsystems. In the first step, results for the island boundary detection method wereinvestigated. In the second step, DVSFs were shown for one island. In the third step, the wide areaload shedding results based on dynamic voltage sensitivity factor were presented.

Energies 2018, 11, 889 13 of 22
Energies 2018, 11, x FOR PEER REVIEW 13 of 22
Figure 8. A single line diagram for a practical 18-bus-bar distribution network.
Bus1
Bus2 Bus3 Bus4 Bus6
Bus7 Bus9 Bus10 Bus11 Bus12
Bus14 Bus15 Bus16 Bus18Bus17
Bus8 Bus13
Bus5
L27 km
L42.65 km
L52.85 km
L6 12.07 km
L72.5 km
L91.1 km
L80.55 km
L101 km
L112.3 km
L121.8 km
L132.03 km
L141 km
L151.2 km
L171 km
L13.3 km
Feeder 3
Feeder 2
Main Grid
30MVA132/11 kV
30MVA132/11 kV L16
1 km
Main Substation
L35.8 km
Feeder 1
Δ -Yg
Δ -YgDG-2
2MVA
~
Yg-Yg11/0.4 kV
DG-12MVA
~
Yg-Yg11/0.4 kV
~
Yg-Yg11/0.4 kV
DG-32MVA
Figure 8. A single line diagram for a practical 18-bus-bar distribution network.

Energies 2018, 11, 889 14 of 22
6.1. Island Boundary Detection Results
The equivalent graph for the given test system is shown in Figure 9. It was assumed that thevoltage and current measurements were available in each bus-bar. After the tie line breakers opened,current would be reduced to zero in that line section. Hence, all downstream bus-bars were consideredas an island, provided that a source existed. As explained in section (II), the node integration matrix[NIM]18 × 18 was calculated as follows:
[NIM] =
1 0 0 0 0 0 1 0 0 0 0 0 0 0 0 0 0 00 1 1 0 0 0 0 0 0 0 0 0 0 0 0 0 0 00 1 1 1 0 0 0 0 0 0 0 0 0 0 0 0 0 00 0 1 1 1 0 0 0 0 0 0 0 0 0 0 0 0 00 0 0 1 1 1 0 0 0 0 0 0 0 0 0 0 0 00 0 0 0 1 1 0 0 0 0 0 0 0 0 0 0 0 01 0 0 0 0 0 1 1 0 0 0 0 0 0 0 0 0 00 0 0 0 0 0 0 1 1 0 0 0 0 0 0 0 0 00 0 0 0 0 0 0 1 1 0 0 0 0 0 0 0 0 00 0 0 0 0 0 0 0 0 1 1 0 0 0 0 0 0 00 0 0 0 0 0 0 0 0 1 1 1 0 0 0 0 0 00 0 0 0 0 0 0 0 0 0 1 1 1 0 0 0 0 00 0 0 0 0 0 0 0 0 0 0 1 1 0 0 0 0 00 0 0 0 0 0 0 0 0 0 0 0 0 1 1 0 0 00 0 0 0 0 0 0 0 0 0 0 0 0 1 1 1 0 00 0 0 0 0 0 0 0 0 0 0 0 0 0 1 1 1 00 0 0 0 0 0 0 0 0 0 0 0 0 0 0 1 1 10 0 0 0 0 0 0 0 0 0 0 0 0 0 0 0 1 1
(13)
Energies 2018, 11, x FOR PEER REVIEW 14 of 22
6.1. Island Boundary Detection Results
The equivalent graph for the given test system is shown in Figure 9. It was assumed that the voltage and current measurements were available in each bus-bar. After the tie line breakers opened, current would be reduced to zero in that line section. Hence, all downstream bus-bars were considered as an island, provided that a source existed. As explained in section (II), the node integration matrix [NIM]18 × 18 was calculated as follows:
[ ]
1 0 0 0 0 0 1 0 0 0 0 0 0 0 0 0 0 00 1 1 0 0 0 0 0 0 0 0 0 0 0 0 0 0 00 1 1 1 0 0 0 0 0 0 0 0 0 0 0 0 0 00 0 1 1 1 0 0 0 0 0 0 0 0 0 0 0 0 00 0 0 1 1 1 0 0 0 0 0 0 0 0 0 0 0 00 0 0 0 1 1 0 0 0 0 0 0 0 0 0 0 0 01 0 0 0 0 0 1 1 0 0 0 0 0 0 0 0 0 00 0 0 0 0 0 0 1 1 0 0 0 0 0 0 0 0 00 0 0 0 0 0 0 1 1 0 0 0 0 0 0 0 0 00 0 0 0 0 0 0 0 0 1 1 0 0 0 0 0 0 00 0 0 0 0 0 0 0 0 1 1 1 0 0
=NIM
0 0 0 00 0 0 0 0 0 0 0 0 0 1 1 1 0 0 0 0 00 0 0 0 0 0 0 0 0 0 0 1 1 0 0 0 0 00 0 0 0 0 0 0 0 0 0 0 0 0 1 1 0 0 00 0 0 0 0 0 0 0 0 0 0 0 0 1 1 1 0 00 0 0 0 0 0 0 0 0 0 0 0 0 0 1 1 1 00 0 0 0 0 0 0 0 0 0 0 0 0 0 0 1 1 10 0 0 0 0 0 0 0 0 0 0 0 0 0 0 0 1 1
(13)
Figure 9. Equivalent graph for the test system with four subsections.
In order to form the node integration matrix [NIM], the system topology was monitored using current measurements. The line section with none zero current was considered as a closed line. Using the procedure explained in Section 2, the calculated [TCM]18 × 18 is shown in Equation (14) for the test distribution network. To extract the number of bus-bars and corresponding Islands, the procedure, which is depicted in Figure 6, was applied on the calculated topology connection matrix. The calculated topology matrix [TCM] for the test network is shown in Equation (14):
Figure 9. Equivalent graph for the test system with four subsections.
In order to form the node integration matrix [NIM], the system topology was monitored usingcurrent measurements. The line section with none zero current was considered as a closed line.Using the procedure explained in Section 2, the calculated [TCM]18×18 is shown in Equation (14)for the test distribution network. To extract the number of bus-bars and corresponding Islands, theprocedure, which is depicted in Figure 6, was applied on the calculated topology connection matrix.The calculated topology matrix [TCM] for the test network is shown in Equation (14):

Energies 2018, 11, 889 15 of 22
[TCM] =
1 0 0 0 0 0 1 1 1 0 0 0 0 0 0 0 0 00 1 1 1 1 1 0 0 0 0 0 0 0 0 0 0 0 00 0 1 1 1 1 0 0 0 0 0 0 0 0 0 0 0 00 0 0 1 1 1 0 0 0 0 0 0 0 0 0 0 0 00 0 0 0 1 1 0 0 0 0 0 0 0 0 0 0 0 00 0 0 0 0 1 0 0 0 0 0 0 0 0 0 0 0 00 0 0 0 0 0 1 1 1 0 0 0 0 0 0 0 0 00 0 0 0 0 0 0 1 1 0 0 0 0 0 0 0 0 00 0 0 0 0 0 0 0 1 0 0 0 0 0 0 0 0 00 0 0 0 0 0 0 0 0 1 1 1 1 0 0 0 0 00 0 0 0 0 0 0 0 0 0 1 1 1 0 0 0 0 00 0 0 0 0 0 0 0 0 0 0 1 1 0 0 0 0 00 0 0 0 0 0 0 0 0 0 0 0 1 0 0 0 0 00 0 0 0 0 0 0 0 0 0 0 0 0 1 1 1 1 10 0 0 0 0 0 0 0 0 0 0 0 0 0 1 1 1 10 0 0 0 0 0 0 0 0 0 0 0 0 0 0 1 1 10 0 0 0 0 0 0 0 0 0 0 0 0 0 0 0 1 10 0 0 0 0 0 0 0 0 0 0 0 0 0 0 0 0 1
(14)
[BDM] =
1 7 8 9 02 3 4 5 6
10 11 12 13 014 15 16 17 18
(15)
The boundary detection matrix [BDM] shows that the system is divided into four subsystems.The system with bus-bar (1) is not considered as an island as it is connected to the main grid.As shown in the results, the proposed method is capable of detecting the configuration of Islands in thedistribution network. Moreover, the proposed method is capable of tracking any changes in the islandconfiguration. If the island’s configuration changed due to any reason such as faults in the system orself-healing strategies, the proposed method can detect the new configuration without applying anyfurther modification.
6.2. Dynamic Voltage Sensitivity Factor
When intentional islanding event is initiated via opening the line sections L1, L9 and L13, thestable operation of each island should be assured. The remaining generation and load in each islandshould be balanced to avoid voltage collapse. A proposed dynamic voltage sensitivity factor is used toidentify weak bus-bars in each island. In Island-2, total available generation is 2 MVA while Table 1shows the load demand in Island-2 bus-bars. In Table 1, the load consumption in each bus-bar ispresented. The total active load in island-2 is equal to 3.5 MW and total reactive load is equal to 1MVAr. Hence, 1.5 MW of additional load should be shedded to maintain the stability of Island-2.
Table 1. Load demand in island-2.
Bus-bar Active Power (MW) Reactive Power (MVar)
Bus10 1.055 0.2842bus11 0.5916 0.2615Bus12 0.9267 0.2255Bus13 0.9268 0.2278
Since the Island-2 is not stable due to lack of generation, the Island-2 was used to validate theproposed DVSF. The bus-bar voltages for Island-2 are shown in Figure 10. As shown in Figure 10, the

Energies 2018, 11, 889 16 of 22
bus-bar voltages collapsed after islanding because the generation is not enough to cover the loadsin the vicinity. Similarly, generator angular velocity and system frequency as shown in Figures 10and 11a also collapses. As seen in Figures 10 and 11, generator stalls due to heavy load in the system.Hence, it is vital to identify the unstable bus-bars to perform the wide area load shedding.
Energies 2018, 11, x FOR PEER REVIEW 16 of 22
bus-bar voltages collapsed after islanding because the generation is not enough to cover the loads in the vicinity. Similarly, generator angular velocity and system frequency as shown in Figures 10 and 11a also collapses. As seen in Figures 10 and 11, generator stalls due to heavy load in the system. Hence, it is vital to identify the unstable bus-bars to perform the wide area load shedding.
Figure 10. Voltage collapse in the island-2 after intentional islanding event.
Figure 11. System parameters (a) synchronous generator angular velocity, (b) island-2 frequency.
The full window of the calculated conventional voltage sensitivity index using pre-islanding data is shown in Figure 12a and the expanded window during the islanding is demonstrated in Figure 12b. With reference to the results, the most stable bus-bar is Bus11, since it has the lowest sensitivity index and the most sensitive bus-bar is Bus13. Hence, according to results calculated using conventional method, load-shedding program should start with Bus13 by virtue of being the weakest bus-bar and proceed to Bus10, 12 and 11. However, in the proposed scheme, once islanding occurs, the new system topology is used to calculate the DVSF. The calculated DVSF for Island-2 is illustrated in Figure 13. According to these results, once islanding takes place, the sensitivity of Bus13 is higher compared to the other bus-bars. Hence, it can be concluded that Bus13 is still the weakest bus-bar followed by Bus10, Bus11 and Bus12.
-202468
101214
0 5 10 15 20 25 30 35
Vol
tage
(k
V)
Time (sec)
Bus10 Bus11
Bus12 Bus13
Start Event Intentional Islanding Event
Voltage Collapse
00.10.20.30.40.50.60.70.80.9
11.1
0 5 10 15 20 25 30 35
An
gula
r V
eloc
ity
(pu
)
(a)
Start Event Intentional Islanding Event
05
10152025303540455055
0 5 10 15 20 25 30 35
Fre
qu
ency
(H
z)
(b)Time (sec)
Start Event Intentional Islanding Event
Figure 10. Voltage collapse in the island-2 after intentional islanding event.
Energies 2018, 11, x FOR PEER REVIEW 16 of 22
bus-bar voltages collapsed after islanding because the generation is not enough to cover the loads in the vicinity. Similarly, generator angular velocity and system frequency as shown in Figures 10 and 11a also collapses. As seen in Figures 10 and 11, generator stalls due to heavy load in the system. Hence, it is vital to identify the unstable bus-bars to perform the wide area load shedding.
Figure 10. Voltage collapse in the island-2 after intentional islanding event.
Figure 11. System parameters (a) synchronous generator angular velocity, (b) island-2 frequency.
The full window of the calculated conventional voltage sensitivity index using pre-islanding data is shown in Figure 12a and the expanded window during the islanding is demonstrated in Figure 12b. With reference to the results, the most stable bus-bar is Bus11, since it has the lowest sensitivity index and the most sensitive bus-bar is Bus13. Hence, according to results calculated using conventional method, load-shedding program should start with Bus13 by virtue of being the weakest bus-bar and proceed to Bus10, 12 and 11. However, in the proposed scheme, once islanding occurs, the new system topology is used to calculate the DVSF. The calculated DVSF for Island-2 is illustrated in Figure 13. According to these results, once islanding takes place, the sensitivity of Bus13 is higher compared to the other bus-bars. Hence, it can be concluded that Bus13 is still the weakest bus-bar followed by Bus10, Bus11 and Bus12.
-202468
101214
0 5 10 15 20 25 30 35
Vol
tage
(k
V)
Time (sec)
Bus10 Bus11
Bus12 Bus13
Start Event Intentional Islanding Event
Voltage Collapse
00.10.20.30.40.50.60.70.80.9
11.1
0 5 10 15 20 25 30 35
An
gula
r V
eloc
ity
(pu
)
(a)
Start Event Intentional Islanding Event
05
10152025303540455055
0 5 10 15 20 25 30 35
Fre
qu
ency
(H
z)
(b)Time (sec)
Start Event Intentional Islanding Event
Figure 11. System parameters (a) synchronous generator angular velocity, (b) island-2 frequency.
The full window of the calculated conventional voltage sensitivity index using pre-islanding datais shown in Figure 12a and the expanded window during the islanding is demonstrated in Figure 12b.With reference to the results, the most stable bus-bar is Bus11, since it has the lowest sensitivity indexand the most sensitive bus-bar is Bus13. Hence, according to results calculated using conventionalmethod, load-shedding program should start with Bus13 by virtue of being the weakest bus-bar andproceed to Bus10, 12 and 11. However, in the proposed scheme, once islanding occurs, the new systemtopology is used to calculate the DVSF. The calculated DVSF for Island-2 is illustrated in Figure 13.According to these results, once islanding takes place, the sensitivity of Bus13 is higher compared tothe other bus-bars. Hence, it can be concluded that Bus13 is still the weakest bus-bar followed byBus10, Bus11 and Bus12.

Energies 2018, 11, 889 17 of 22
Energies 2018, 11, x FOR PEER REVIEW 17 of 22
Figure 12. Dynamic Voltage Sensitivity Factor (a) full window of DVSF for bus-bars in the island-2 (b) expanded window for DVSF during ‘Intentional Islanding Event’.
Figure 13. Voltage sensitivity indices using proposed boundary detection method.
6.3. Wide Area Load Shedding
In this section, Island-2 was used to verify the robustness of the proposed wide area load shedding to improve the voltage profile of the micro grid. Once the weak bus-bars were identified, the load shedding was performed to prevent voltage collapse. The amount of load shedding is related to the system frequency. Moreover, the DG unit should be able to work ±10% of its rated value for 20–30 min [23].
In order to control the voltage of the system, the power factor of the DG unit was varied between 0.85 lagging to 0.9 leading. According to the IEEE-Standard 1547, the system should be capable of operating for 300 s when frequency deviation was less than ±5% of the rated value.
For the new topology, there is 1.82 MW of excess load in island-2. Thus, according to the previous section, Bus13 as the weakest bus-bar and Bus10 as the second weakest bus-bar were chosen
-0.1
0
0.1
0.2
0.3
0.4
0.5
0.6
0.7
0.8
0 5 10 15 20 25 30 35
DV
SF
(a)
Bus10 Bus11Bus12 Bus13
Intentional Islanding Event
Start Event
0.0002
0.0004
0.0006
0.0008
0.001
14.9 14.95 15 15.05 15.1 15.15 15.2 15.25 15.3 15.35 15.4
DV
SF
Time (sec)
Bus10 Bus11
Bus12 Bus13
Intentional IslandingEvent
(b)
0
0.0002
0.0004
0.0006
0.0008
0.001
0.0012
0.0014
14.9 15 15.1 15.2 15.3 15.4
DV
SF
Time (sec)
Bus10 Bus11 Bus12 Bus13
Intentional IslandingEvent
Figure 12. Dynamic Voltage Sensitivity Factor (a) full window of DVSF for bus-bars in the island-2 (b)expanded window for DVSF during ‘Intentional Islanding Event’.
Energies 2018, 11, x FOR PEER REVIEW 17 of 22
Figure 12. Dynamic Voltage Sensitivity Factor (a) full window of DVSF for bus-bars in the island-2 (b) expanded window for DVSF during ‘Intentional Islanding Event’.
Figure 13. Voltage sensitivity indices using proposed boundary detection method.
6.3. Wide Area Load Shedding
In this section, Island-2 was used to verify the robustness of the proposed wide area load shedding to improve the voltage profile of the micro grid. Once the weak bus-bars were identified, the load shedding was performed to prevent voltage collapse. The amount of load shedding is related to the system frequency. Moreover, the DG unit should be able to work ±10% of its rated value for 20–30 min [23].
In order to control the voltage of the system, the power factor of the DG unit was varied between 0.85 lagging to 0.9 leading. According to the IEEE-Standard 1547, the system should be capable of operating for 300 s when frequency deviation was less than ±5% of the rated value.
For the new topology, there is 1.82 MW of excess load in island-2. Thus, according to the previous section, Bus13 as the weakest bus-bar and Bus10 as the second weakest bus-bar were chosen
-0.1
0
0.1
0.2
0.3
0.4
0.5
0.6
0.7
0.8
0 5 10 15 20 25 30 35
DV
SF
(a)
Bus10 Bus11Bus12 Bus13
Intentional Islanding Event
Start Event
0.0002
0.0004
0.0006
0.0008
0.001
14.9 14.95 15 15.05 15.1 15.15 15.2 15.25 15.3 15.35 15.4
DV
SF
Time (sec)
Bus10 Bus11
Bus12 Bus13
Intentional IslandingEvent
(b)
0
0.0002
0.0004
0.0006
0.0008
0.001
0.0012
0.0014
14.9 15 15.1 15.2 15.3 15.4
DV
SF
Time (sec)
Bus10 Bus11 Bus12 Bus13
Intentional IslandingEvent
Figure 13. Voltage sensitivity indices using proposed boundary detection method.
6.3. Wide Area Load Shedding
In this section, Island-2 was used to verify the robustness of the proposed wide area load sheddingto improve the voltage profile of the micro grid. Once the weak bus-bars were identified, the loadshedding was performed to prevent voltage collapse. The amount of load shedding is related tothe system frequency. Moreover, the DG unit should be able to work ±10% of its rated value for20–30 min [23].
Energies 2018, 11, 889 18 of 22
In order to control the voltage of the system, the power factor of the DG unit was varied between0.85 lagging to 0.9 leading. According to the IEEE-Standard 1547, the system should be capable ofoperating for 300 s when frequency deviation was less than ±5% of the rated value.
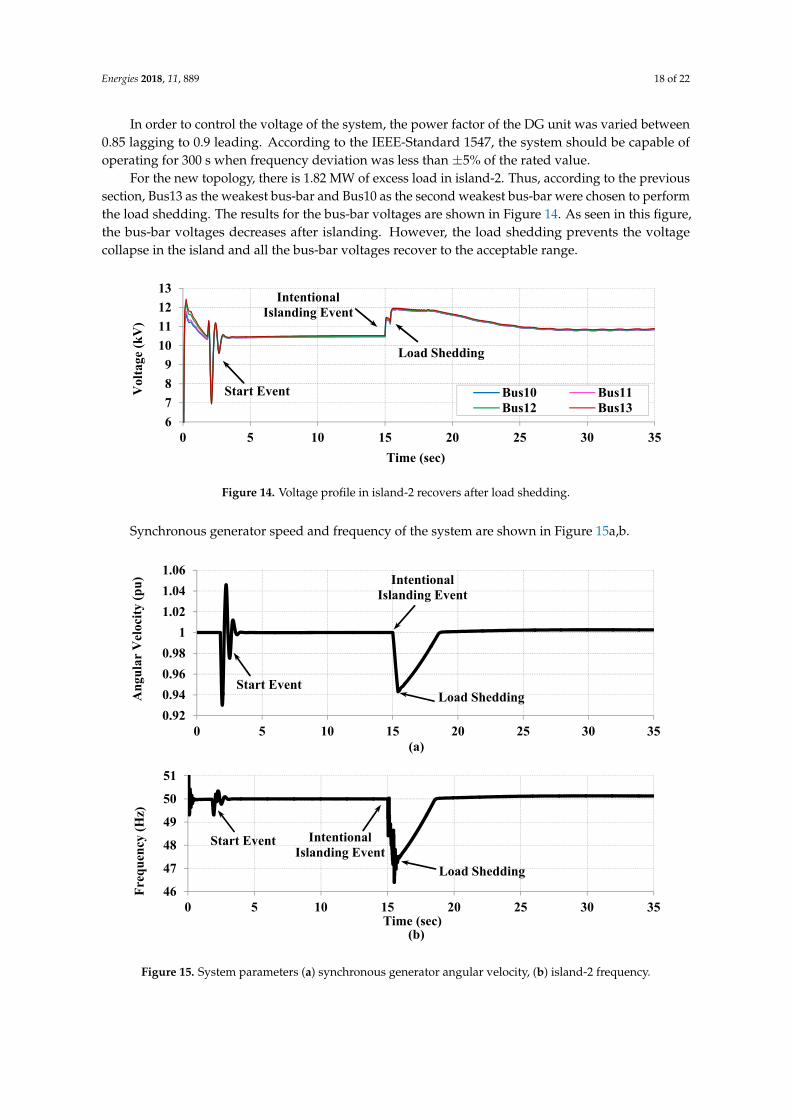
For the new topology, there is 1.82 MW of excess load in island-2. Thus, according to the previoussection, Bus13 as the weakest bus-bar and Bus10 as the second weakest bus-bar were chosen to performthe load shedding. The results for the bus-bar voltages are shown in Figure 14. As seen in this figure,the bus-bar voltages decreases after islanding. However, the load shedding prevents the voltagecollapse in the island and all the bus-bar voltages recover to the acceptable range.
Energies 2018, 11, x FOR PEER REVIEW 18 of 22
to perform the load shedding. The results for the bus-bar voltages are shown in Figure 14. As seen in this figure, the bus-bar voltages decreases after islanding. However, the load shedding prevents the voltage collapse in the island and all the bus-bar voltages recover to the acceptable range.
Figure 14. Voltage profile in island-2 recovers after load shedding.
Synchronous generator speed and frequency of the system are shown in Figure 15a,b.
Figure 15. System parameters (a) synchronous generator angular velocity, (b) island-2 frequency.
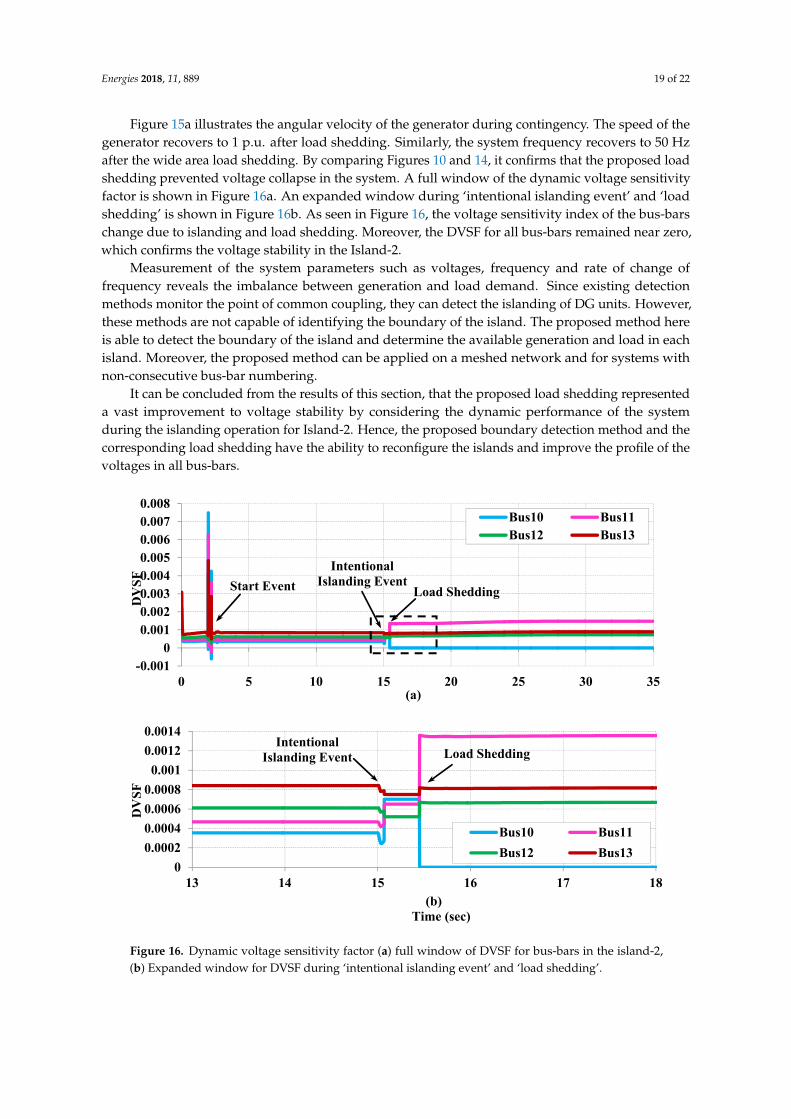
Figure 15a illustrates the angular velocity of the generator during contingency. The speed of the generator recovers to 1 p.u. after load shedding. Similarly, the system frequency recovers to 50 Hz after the wide area load shedding. By comparing Figures 10 and 14, it confirms that the proposed load shedding prevented voltage collapse in the system. A full window of the dynamic voltage sensitivity factor is shown in Figure 16a. An expanded window during ‘intentional islanding event’ and ‘load shedding’ is shown in Figure 16b. As seen in Figure 16, the voltage sensitivity index of the bus-bars change due to islanding and load shedding. Moreover, the DVSF for all bus-bars remained near zero, which confirms the voltage stability in the Island-2.
Measurement of the system parameters such as voltages, frequency and rate of change of frequency reveals the imbalance between generation and load demand. Since existing detection
6
7
8
9
10
11
12
13
0 5 10 15 20 25 30 35
Vol
tage
(k
V)
Time (sec)
Bus10 Bus11Bus12 Bus13
Intentional Islanding Event
Start Event
Load Shedding
0.92
0.94
0.96
0.98
1
1.02
1.04
1.06
0 5 10 15 20 25 30 35
An
gula
r V
eloc
ity
(pu
)
(a)
Intentional Islanding Event
Start EventLoad Shedding
46
47
48
49
50
51
0 5 10 15 20 25 30 35
Fre
qu
ency
(H
z)
(b)Time (sec)
Intentional Islanding Event
Start Event
Load Shedding
Figure 14. Voltage profile in island-2 recovers after load shedding.
Synchronous generator speed and frequency of the system are shown in Figure 15a,b.
Energies 2018, 11, x FOR PEER REVIEW 18 of 22
to perform the load shedding. The results for the bus-bar voltages are shown in Figure 14. As seen in this figure, the bus-bar voltages decreases after islanding. However, the load shedding prevents the voltage collapse in the island and all the bus-bar voltages recover to the acceptable range.
Figure 14. Voltage profile in island-2 recovers after load shedding.
Synchronous generator speed and frequency of the system are shown in Figure 15a,b.
Figure 15. System parameters (a) synchronous generator angular velocity, (b) island-2 frequency.
Figure 15a illustrates the angular velocity of the generator during contingency. The speed of the generator recovers to 1 p.u. after load shedding. Similarly, the system frequency recovers to 50 Hz after the wide area load shedding. By comparing Figures 10 and 14, it confirms that the proposed load shedding prevented voltage collapse in the system. A full window of the dynamic voltage sensitivity factor is shown in Figure 16a. An expanded window during ‘intentional islanding event’ and ‘load shedding’ is shown in Figure 16b. As seen in Figure 16, the voltage sensitivity index of the bus-bars change due to islanding and load shedding. Moreover, the DVSF for all bus-bars remained near zero, which confirms the voltage stability in the Island-2.
Measurement of the system parameters such as voltages, frequency and rate of change of frequency reveals the imbalance between generation and load demand. Since existing detection
6
7
8
9
10
11
12
13
0 5 10 15 20 25 30 35
Vol
tage
(k
V)
Time (sec)
Bus10 Bus11Bus12 Bus13
Intentional Islanding Event
Start Event
Load Shedding
0.92
0.94
0.96
0.98
1
1.02
1.04
1.06
0 5 10 15 20 25 30 35
An
gula
r V
eloc
ity
(pu
)
(a)
Intentional Islanding Event
Start EventLoad Shedding
46
47
48
49
50
51
0 5 10 15 20 25 30 35
Fre
qu
ency
(H
z)
(b)Time (sec)
Intentional Islanding Event
Start Event
Load Shedding
Figure 15. System parameters (a) synchronous generator angular velocity, (b) island-2 frequency.
Energies 2018, 11, 889 19 of 22
Figure 15a illustrates the angular velocity of the generator during contingency. The speed of thegenerator recovers to 1 p.u. after load shedding. Similarly, the system frequency recovers to 50 Hzafter the wide area load shedding. By comparing Figures 10 and 14, it confirms that the proposed loadshedding prevented voltage collapse in the system. A full window of the dynamic voltage sensitivityfactor is shown in Figure 16a. An expanded window during ‘intentional islanding event’ and ‘loadshedding’ is shown in Figure 16b. As seen in Figure 16, the voltage sensitivity index of the bus-barschange due to islanding and load shedding. Moreover, the DVSF for all bus-bars remained near zero,which confirms the voltage stability in the Island-2.
Measurement of the system parameters such as voltages, frequency and rate of change offrequency reveals the imbalance between generation and load demand. Since existing detectionmethods monitor the point of common coupling, they can detect the islanding of DG units. However,these methods are not capable of identifying the boundary of the island. The proposed method hereis able to detect the boundary of the island and determine the available generation and load in eachisland. Moreover, the proposed method can be applied on a meshed network and for systems withnon-consecutive bus-bar numbering.
It can be concluded from the results of this section, that the proposed load shedding representeda vast improvement to voltage stability by considering the dynamic performance of the systemduring the islanding operation for Island-2. Hence, the proposed boundary detection method and thecorresponding load shedding have the ability to reconfigure the islands and improve the profile of thevoltages in all bus-bars.
Energies 2018, 11, x FOR PEER REVIEW 19 of 22
methods monitor the point of common coupling, they can detect the islanding of DG units. However, these methods are not capable of identifying the boundary of the island. The proposed method here is able to detect the boundary of the island and determine the available generation and load in each island. Moreover, the proposed method can be applied on a meshed network and for systems with non-consecutive bus-bar numbering.
It can be concluded from the results of this section, that the proposed load shedding represented a vast improvement to voltage stability by considering the dynamic performance of the system during the islanding operation for Island-2. Hence, the proposed boundary detection method and the corresponding load shedding have the ability to reconfigure the islands and improve the profile of the voltages in all bus-bars.
Figure 16. Dynamic voltage sensitivity factor (a) full window of DVSF for bus-bars in the island-2, (b) Expanded window for DVSF during ‘intentional islanding event’ and ‘load shedding’.
7. Conclusions
This paper presents a novel scheme to detect the configuration of islands in a power system. The results show that the proposed boundary detection method is capable of accurately identifying the system topology. Thus, the available generation and loads in each island can be calculated to ensure the available generation meets the load demand in the islanded subsections. Furthermore, the proposed dynamic sensitivity factor is calculated for all bus-bars in every island to determine the weak bus-bars. The obtained results prove that the DVSF reflects the system’s dynamic performance and can be used to detect the weakest bus-bar in the system. Wide area load shedding was performed on weak bus-bars and the results conform to the IEEE-1547 standard in terms of voltage and frequency in the islands. Accordingly, the proposed scheme assures stable operation of the islands using boundary detection along with wide area load shedding during autonomous mode. The proposed method can be used to reconfigure the islands to get an optimized operating condition.
-0.0010
0.0010.0020.0030.0040.0050.0060.0070.008
0 5 10 15 20 25 30 35
DV
SF
(a)
Bus10 Bus11Bus12 Bus13
Intentional Islanding EventStart Event Load Shedding
0
0.0002
0.0004
0.0006
0.0008
0.001
0.0012
0.0014
13 14 15 16 17 18
DV
SF
Time (sec)
Bus10 Bus11
Bus12 Bus13
Intentional Islanding Event Load Shedding
(b)
Figure 16. Dynamic voltage sensitivity factor (a) full window of DVSF for bus-bars in the island-2,(b) Expanded window for DVSF during ‘intentional islanding event’ and ‘load shedding’.

Energies 2018, 11, 889 20 of 22
7. Conclusions
This paper presents a novel scheme to detect the configuration of islands in a power system.The results show that the proposed boundary detection method is capable of accurately identifyingthe system topology. Thus, the available generation and loads in each island can be calculated toensure the available generation meets the load demand in the islanded subsections. Furthermore, theproposed dynamic sensitivity factor is calculated for all bus-bars in every island to determine the weakbus-bars. The obtained results prove that the DVSF reflects the system’s dynamic performance andcan be used to detect the weakest bus-bar in the system. Wide area load shedding was performed onweak bus-bars and the results conform to the IEEE-1547 standard in terms of voltage and frequency inthe islands. Accordingly, the proposed scheme assures stable operation of the islands using boundarydetection along with wide area load shedding during autonomous mode. The proposed method canbe used to reconfigure the islands to get an optimized operating condition.
Acknowledgments: The authors would like to thank the Power Quality Research Group, Universiti TenagaNasional, Malaysia for providing the funding resources and laboratory facilities.
Author Contributions: Aref Pouryekta, Vigna K. Ramachandaramurthy, Sanjeevikumar Padmanaban,Frede Blaabjerg and Josep M. Guerrero developed the original research work and contributed their experience inboundary detection and power systems stability.
Conflicts of Interest: The authors declare no conflict of interest.
References
1. Yu, B.; Matsui, M.; Yu, G. A review of current anti-islanding methods for photovoltaic power system.Sol. Energy 2010, 84, 745–754. [CrossRef]
2. Zeineldin, H.; Kirtley, J.L., Jr. A simple technique for islanding detection with negligible nondetection zone.IEEE Trans. Power Deliv. 2009, 24, 779–786. [CrossRef]
3. Khamis, A.; Shareef, H.; Bizkevelci, E.; Khatib, T. A review of islanding detection techniques for renewabledistributed generation systems. Renew. Sustain. Energy Rev. 2013, 28, 483–493. [CrossRef]
4. Syamsuddin, S.; Rahim, N.; Selvaraj, J. Implementation of TMS320F2812 in islanding detection forPhotovoltaic Grid Connected Inverter. In Proceedings of the 2009 International Conference for TechnicalPostgraduates (TECHPOS), Kuala Lumpur, Malaysia, 14–15 December 2009.
5. Lidula, N.; Rajapakse, A. A pattern recognition approach for detecting power islands using transientsignals—Part I: Design and implementation. IEEE Trans. Power Deliv. 2010, 25, 3070–3077. [CrossRef]
6. Laghari, J.; Mokhlis, H.; Karimi, M.; Bakar, A.; Mohamad, H. Computational Intelligence based techniquesfor islanding detection of distributed generation in distribution network: A review. Energy Convers. Manag.2014, 88, 139–152. [CrossRef]
7. Zeineldin, H.; El-Saadany, E.F.; Salama, M. Impact of DG interface control on islanding detection andnondetection zones. IEEE Trans. Power Deliv. 2006, 21, 1515–1523. [CrossRef]
8. Li, C.; Cao, C.; Cao, Y.; Kuang, Y.; Zeng, L.; Fang, B. A review of islanding detection methods for microgrid.Renew. Sustain. Energy Rev. 2014, 35, 211–220. [CrossRef]
9. Raza, S.; Mokhlis, H.; Arof, H.; Laghari, J.; Wang, L. Application of signal processing techniques for islandingdetection of distributed generation in distribution network: A review. Energy Convers. Manag. 2015, 96,613–624. [CrossRef]
10. Ropp, M.; Ginn, J.; Stevens, J.; Bower, W.; Gonzalez, S. Simulation and Experimental Study of the ImpedanceDetection Anti-Islanding Method in the Single-Inverter Case. In Proceedings of the Conference Record of the2006 IEEE 4th World Conference on Photovoltaic Energy Conversion, Waikoloa, HI, USA, 7–12 May 2006;Volume 2, pp. 2379–2382.
11. O’Kane, P.; Fox, B. Loss of mains detection for embedded generation by system impedance monitoring.In Proceedings of the Sixth International Conference on (Conf. Publ. No. 434) Developments in PowerSystem Protection, Nottingham, UK, 25–27 March 1997; pp. 95–98.
12. Mohamad, H.; Mokhlis, H.; Ping, H.W. A review on islanding operation and control for distribution networkconnected with small hydro power plant. Renew. Sustain. Energy Rev. 2011, 15, 3952–3962. [CrossRef]

Energies 2018, 11, 889 21 of 22
13. Ahmad, K.N.E.K.; Selvaraj, J.; Rahim, N.A. A review of the islanding detection methods in grid-connectedPV inverters. Renew. Sustain. Energy Rev. 2013, 21, 756–766. [CrossRef]
14. Balaguer-Alvarez, I.J.; Ortiz-Rivera, E.I. Survey of Distributed Generation Islanding Detection Methods.IEEE Lat. Am. Trans. 2010, 8, 565–570. [CrossRef]
15. Hanif, M.; Basu, M.; Gaughan, K. A discussion of anti-islanding protection schemes incorporated in a inverterbased DG. In Proceedings of the 10th International Conference on Environment and Electrical Engineering(EEEIC), Rome, Italy, 8–11 May 2011; pp. 1–5.
16. Ropp, M.; Begovic, M.; Rohatgi, A. Analysis and performance assessment of the active frequency driftmethod of islanding prevention. IEEE Trans. Energy Convers. 1999, 14, 810–816. [CrossRef]
17. Kim, B.; Sul, S.; Lim, C. Anti-islanding detection method using Negative Sequence Voltage. In Proceedingsof the 7th IEEE International Power Electronics and Motion Control Conference (IPEMC), Harbin, China,2–5 June 2012; Volume 1, pp. 604–608.
18. Karimi, H.; Yazdani, A.; Iravani, R. Negative-Sequence Current Injection for Fast Islanding Detection of aDistributed Resource Unit. IEEE Trans. Power Electron. 2008, 23, 298–307. [CrossRef]
19. Bahrani, B.; Karimi, H.; Iravani, R. Nondetection Zone Assessment of an Active Islanding Detection Methodand its Experimental Evaluation. IEEE Trans. Power Deliv. 2011, 26, 517–525. [CrossRef]
20. Tuyen, N.D.; Fujita, G. Negative-sequence Current Injection of Dispersed Generation for IslandingDetection and Unbalanced Fault Ride-through. In Proceedings of the 46th International Universities’ PowerEngineering Conference (UPEC), Berlin, Germany, 5–8 September 2011; pp. 1–6.
21. Yin, J.; Chang, L.; Diduch, C. Recent developments in islanding detection for distributed power generation.In Proceedings of the IEEE Large Engineering systems Conference on Power Engineering, LESCOPE-04,Halifax, NS, Canada, 28–30 July 2004; pp. 124–128.
22. Gao, W. Comparison and review of islanding detection techniques for distributed energy resources.In Proceedings of the 40th North American Power Symposium, Calgary, AB, Canada, 28–30 September 2008;pp. 1–8.
23. Xu, W.; Zhang, G.; Li, C.; Wang, W.; Wang, G.; Kliber, J. A power line signaling based technique foranti-islanding protection of distributed generators—Part I: Scheme and analysis. IEEE Trans. Power Deliv.2007, 22, 1758–1766. [CrossRef]
24. Wang, W.; Kliber, J.; Zhang, G.; Xu, W.; Howell, B.; Palladino, T. A power line signaling based scheme foranti-islanding protection of distributed generators—Part II: Field test results. IEEE Trans. Power Deliv. 2007,22, 1767–1772. [CrossRef]
25. De Mango, F.; Liserre, M.; Aquila, A.D. Overview of anti-islanding algorithms for pv systems. part ii:Activemethods. In Proceedings of the 12th IEEE International Power Electronics and Motion ControlConference, EPE-PEMC 2006, Portoroz, Slovenia, 30 August–1 September 2006; pp. 1884–1889.
26. Velasco, D.; Trujillo, C.; Garcerá, G.; Figueres, E. Review of anti-islanding techniques in distributed generators.Renew. Sustain. Energy Rev. 2010, 14, 1608–1614. [CrossRef]
27. Zhihong, Y.; Kolwalkar, A.; Zhang, Y.; Pengwei, D.; Walling, R. Evaluation of anti-islanding schemes based onnondetection zone concept. In Proceedings of the 34th IEEE Annual Power Electronics Specialist Conference,Acapulco, Mexico, 15–19 June 2003; Volume 4, pp. 1735–1741.
28. Wang, F.; Mi, Z. Notice of Retraction Passive Islanding Detection Method for Grid Connected PV System.In Proceedings of the IEEE International Conference on Industrial and Information Systems, Haikou, China,24–25 April 2009; pp. 409–412.
29. Raipala, O.; Makinen, A.; Repo, S.; Jarventausta, P. The effect of different control modes and mixed types ofDG on the non-detection zones of islanding detection. In Proceedings of the Integration of Renewables intothe Distribution Grid, CIRED 2012 Workshop, Lisbon, Portuga, 29–30 May 2012; pp. 1–4.
30. Lin, Z.; Xia, T.; Ye, Y.; Zhang, Y.; Chen, L.; Liu, Y.; Tomsovic, K.; Bilke, T.; Wen, F. Application of widearea measurement systems to islanding detection of bulk power systems. IEEE Trans. Power Syst. 2013, 28,2006–2015. [CrossRef]
31. Lei, D.; Zhencun, P.; Wei, C.; Jianye, P. An Integrated Automatic Control System for Distributed GenerationHierarchical Islanding. In Proceedings of the PowerCon 2006, International Conference on Power SystemTechnology, Chongqing, China, 22–26 October 2006; pp. 1–6.

Energies 2018, 11, 889 22 of 22
32. Qin, L.; Peng, F.Z.; Balaguer, I.J. Islanding control of DG in microgrids. In Proceedings of the IEEE6th International Power Electronics and Motion Control Conference, Wuhan, China, 17–20 May 2009;pp. 450–455.
33. You, H.; Vittal, V.; Zhong, Y. Self-healing in power systems: An approach using islanding and rate offrequency decline-based load shedding. IEEE Trans. Power Syst. 2003, 18, 174–181. [CrossRef]
34. Zadeh, S.G.; Madani, R.; Seyedi, H.; Mokari, A.; Zadeh, M.B. New approaches to load shedding problemin islanding situation in distribution networks with distributed generation. In Proceedings of the CIRED2012 Workshop: Integration of Renewables into the Distribution Grid, Lisbon, Portugal, 29–30 May 2012.[CrossRef]
35. Zahidi, R.A.; Abidin, I.Z.; Hashim, H.; Omar, Y.R.; Ahmad, N.; Ali, A.M. Study of static voltage stabilityindex as an indicator for Under Voltage Load Shedding schemes. In Proceedings of the 3rd InternationalConference on Energy and Environment, Malacca, Malaysia, 7–8 December 2009; pp. 256–261.
36. Gu, W.; Liu, W.; Zhu, J.; Zhao, B.; Wu, Z.; Luo, Z.; Yu, J. Adaptive Decentralized Under-Frequency LoadShedding for Islanded Smart Distribution Networks. IEEE Trans. Sustain. Energy 2014, 5, 886–895. [CrossRef]
37. Arya, L.; Choube, S.; Shrivastava, M. Technique for voltage stability assessment using newly developed linevoltage stability index. Energy Convers. Manag. 2008, 49, 267–275. [CrossRef]
38. Wang, Y.; Li, W.; Lu, J. A new node voltage stability index based on local voltage phasors. Electr. PowerSyst. Res. 2009, 79, 265–271. [CrossRef]
39. Sinha, A.; Hazarika, D. A comparative study of voltage stability indices in a power system. Int. J. Electr.Power Energy Syst. 2000, 22, 589–596. [CrossRef]
40. Shariatzadeh, F.; Vellaithurai, C.B.; Biswas, S.S.; Zamora, R.; Srivastava, A.K. Real-Time Implementation ofIntelligent Reconfiguration Algorithm for Microgrid. IEEE Trans. Sustain. Energy 2014, 5, 598–607. [CrossRef]
41. Alwash, S.F.; Ramachandaramurthy, V.K.; Mithulananthan, N. Fault-Location Scheme for Power DistributionSystem with Distributed Generation. IEEE Trans. Power Deliv. 2015, 30, 1187–1195. [CrossRef]
42. Kundur, P.; Balu, N.J.; Lauby, M.G. Power System Stability and Control; McGraw-Hill: New York, NY,USA, 1994.
© 2018 by the authors. Licensee MDPI, Basel, Switzerland. This article is an open accessarticle distributed under the terms and conditions of the Creative Commons Attribution(CC BY) license (http://creativecommons.org/licenses/by/4.0/).