บทน า - file.siam2web.comfile.siam2web.com/natcha/631/2009118_27182.pdf ·...
TRANSCRIPT

1
บทน า คณรสกกดดนจากนายจางหรอเพอนรวมงานของคณหรอไม เมอคณปวยดวยโรคไขหวด
ใหญแตยงตองมาทางานหรอวาพวกเขามนาใจและสนบสนนและไมรสกกดดน การสารวจตวอยางในครงนม 38 % ของผตอบแบบสอบถามทกลาววา พวกเขารสกกดดนเมอพวกเขามาทางานในขณะมอาการเปนไขแตสวนใหญ 61% กลาววาพวกเขาไมรสกกดดนทเหลอ1%ไมแนใจ (ดกรณศกษา 1-2)
ดงนนการศกษาสถตจงกลายเปนทนยมมากกวาสทศวรรษทผานมา มการเพมคอมพวเตอรและชดซอฟตแวรทางสถต ไดขยายบทบาทของสถตเพอเปนเครองมอสาหรบการวจยเชงประจกษ เปนผลใหมการใชสถตเพอการวจยในเกอบทกอาชพตงแตการแพทยจนถงการกฬา ทกวนนนกศกษาในเกอบทกสาขาจะตองใชเวลาอยางนอยหนงหลกสตรในการศกษาสถต ทกวนนหนงสอพมพและนตยสารเกอบทกฉบบมกราฟและเรองทเกยวกบการศกษาสถต หลงจากการอานหนงสอเลมนแลวกคงจะเขาใจเกยวกบกราฟเหลาน
ทกสาขาการศกษามนยามเปนของตนเองยกเวนสถต บทนอธบายคาศพทพนฐานของสถต คาเหลานจะเปนแนวทางนาไปสความเขาใจของแนวคดและเทคนคทนาเสนอในบทถดไป
1.1 สถตคออะไร สถตมสองความหมาย ในการใชงานทวไปสถตหมายถงขอเทจจรง ตวเลข เชน จานวนท
แสดงรายไดของครอบครว อายของนกเรยน รอยละของผสอบผานในตาแหนงกองหลงของทมฟตบอลและเงนเดอนเรมตนของบณฑตวทยาลย นเปนตวอยางของสถตในความหมายของคาน ในป ค.ศ. 1988 บทความขาวและรายงานโลกในสหรฐอเมรกา แถลงวา "สถตเปนภาวะทชาวอเมรกาถกครอบงา" ไมวาจะทาอะไรกจะมสถตมาเกยวของเสมอ
ตารางตอไปนเปรยบเทยบขอเทจจรงตางๆสาหรบ ป ค .ศ. 1918 และป ค .ศ. 2004 ตวเลขทระบในตารางนจะเรยกวาสถต
รายการ 1918 2004 ราคาตว 3.30 ดอลลาร 140 ดอลลาร ประชากรในสหรฐ (ลาน) 106 คน 294 คน ราคานม 14 เซนต 1.09 ดอลลาร ราคากอนของขนมปง 10 เซนต 2.19 ดอลลาร
ทมา: USA TODAY 28 ตลาคม 2004
ความหมายทสองของสถตหมายถงระเบยบวธการทางสถต ในความหมายของคานสถตหมายถง

2
ความหมาย สถตเปนกลมวธการทใชในการเกบรวบรวม นาเสนอ วเคราะหและตความขอมลรวมถงการ
ตดสนใจ บางครงวนทเราตดสนใจอาจเกยวของกบธรกจของบคคลประเภทอนๆ การตดสนใจเหลาน
มกทาภายใตเงอนไขของความไมแนนอน หล ายครงสถานการณหรอปญหาทเราเผชญ ขอสรปทไดในโลกแหงความเปนจรงไมมความแมนยาหรอแนนอน วธการทางสถตชวยเราใหมความรทางวทยาศาสตรและการตดสนใจในสถานการณ เชน การตดสนใจโดยใชวธการทางสถตทเรยกวาการศกษาความนาจะเปน การตดสนใจทาโดยไมใชสถต (หรอวทยาศาสตร) วธการเปนคาดเดาแบบบรสทธและจากนอาจพสจนดวยวธการทเชอถอไมได เชน ในการเปดรานคาขนาดใหญในพนทมหรอไมมการประเมนความจาเปนอาจมผลตอความสาเรจของงาน
สถตมสองดานคอ ดานทฤษฎและการประยกต ดานทฤษฎหรอขอคณตศาสตรคอสถตทเกยวกบการพฒนาทมาและหลกฐานทางทฤษฎ เปนสถตทเปนสตร สถตประยกตเกยวกบการนาทฤษฎนนมาใชงาน เพอแกปญหาในโลกแหงความเปนจรง ขอความนเกยวของกบสถตทใชและไม ใชทฤษฎ เมออานหนงสอนจบแลวคณจะเรยนรวธคดทางสถตและวธการใหการศกษาการคาดคะเน
1.2 ประเภทของสถต 1.2.1 สถตพรรณนา สมมตวาเรามขอมลสถตเกยวกบคะแนนสอบของนกเรยนทเขาเรยนในชนเรยนในสาขาสถต
หมายเลขทแสดงคะแนนของนกเรยนเรยกวาการกาหนดขอมล ชอของนกเรยนแตละคนเรยกวาองคประกอบ และคะแนนของนกเรยนแตละคนจะเรยกวาคาการสงเกต (คาเหลานมการกาหนดในรายละเอยดในหวขอท 1.4)
ปกตขอมลมกจะมจานวนมาก เนองจากบางชดขอมลไมเปนประโยชนในการเขยนบทสรปหรอตดสนใจ เพอใหเราลดขนาดขอมลทจดการเพอใหงายตอการเขยนบทสรปจากตารางและภาพจากรปแบบตนฉบบของชดขอมล โดยสรางตาราง กราฟ ภาพวาดหรอคานวณการสรป เชน คาเฉลย สวนของสถตทชวยใหเราเขาใจขอมลประเภทนเรยกวาการวเคราะหขอมลสถตเชงพรรณนา
ความหมาย สถตพรรณนาประกอบดวยวธการจดแสดงและอธบายขอมลโดยใชตารางกราฟและการสรป
ทงบทท 2 และ 3 เปนวธการทางสถตพรรณนา ในบทท 2 เราเรยนรวธการสรางตารางและวธการใชขอมลสรางกราฟ ในบทท 3 เราเรยนการคานวณการสรป เชน คาเฉลย
1.2.2 สถตเชงอนมาน ในทางสถต การเกบองคประกอบทงหมดทสนใจเรยกวาประชากรการ เลอกองคประกอบ
ไมกรปแบบจากประชากรนเรยกวาตวอยาง

3
สวนใหญของสถตจะเกยวของกบการตดสนใจ การสรป การคาดการณและพยากรณเกยวกบประชากรตามผลลพธทไดจากตวอยาง เชน เรามการตดสนใจเกยวกบมมมองทางการเมองของนกศกษาในวทยาลยและมหาวทยาลย จงเลอกตวอยางมา 1,000 คน จากนกศกษาในวทยาลยและมหาวทยาลยดงกลาว นอกจากนม ตวอยางอกมากมาย เชน เราตองการหาเงนเดอนเรมตนของบณฑตวทยาลย โดยเราเลอกจานวนบณฑตมา 2,000 คน เพอหา เงนเดอนเรมตนของพวกเขาและตดสนใจตามขอมลน การศกษาบางสวนของประชากรแลวอางถงประชากรทงหมดเชนนหมายถงสถตอนมาน ในสาขาสถตนจะมความเกยวของกบการตดสนใจหรออทธพลในทางสถต
ความหมาย สถตเชงอนมาน ประกอบดวย วธการศกษาเพยงบางสวนของประชากรและผลทไดใชเพอ
ชวยในการตดสนใจหรอการคาดการณเกยวกบประชากร
1.3 ตวอยางและประชากร เราจะพบคาวาประชากรและกลมตวอยางในเกอบทกหนาของหนงสอเลมน เราจงตองเขาใจ
ความหมายของสองคานและความแตกตางระหวางคาสองคานเปนสาคญ สมมตสถตทสนใจ
1. เปอรเซนตของจานวนผลงคะแนนทงหมดในเมองใหผสมครในการเลอกตง 2. ยอดขายรวมของบรษททงหมดในเมอง New York ป 2005 3. ราคาบานในแคลฟอรเนยทงหมด ในตวอยางนเราจะสนใจผลงคะแนนทงหมด บรษททงหมดและบานทงหมด แตละกลมเหลาน
เรยกวาตวอยางของแตละประชากรในสถตประชากรไมไดหมายถงคนเพยงอยางเดยวเทานนในความเปนจรงแลวประชากรเปนกลมคนหรอประเภทรายการใดๆ เชน บาน หนงสอ โทรทศนหรอรถยนต ประชากรทเราสนใจเรยกวาประชากรเปาหมาย
ความหมาย ประชากรหรอประชากรเปาหมาย ประชากรประกอบดวยลกษณะทมการศกษาทงหมด เชน
บคคล รายการหรอวตถ ประชากรทตองการศกษาเรยกวาประชากรเปาหมาย สวนใหญเวลาตดสนใจเราจะทาตามสวนหนงของประชากร เชน ในการสารวจเปอรเซนต
ความชอบ ของผสมคร เลอกตงในสหรฐอเมรกาของผสมครตางๆ ในการเลอกตงประธานาธบดทจะใชเพยงไมกรอยหรอกพนลงคะแนนเลอกจากทวประเทศ ในกรณนประชากรประกอบดวยผทมสทธลงคะแนนทงหมดทจดทะเบยนในประเทศสหรฐอเมรกา ตวอยางประกอบดวยไมกรอยหรอกพนทลงคะแนนทจะรวมอยในการสารวจความคดเหนน กลมคนทเลอกจากประชากรจะเรยกวาตวอยาง

4
ความหมาย ตวอยาง หมายถงสวนของประชากรทเลอกมาใชในการศกษา
รปท 1.1 แสดงการเลอกตวอยางจากประชากร
ประชากร ตวอยาง
การเกบขอมลจากองคประกอบของประชากรหรอตวอยางเรยกวาการสารวจ การสารวจทม
องคประกอบของประชากรกลมเปาหมายทกคนเรยกวาการสามะโนประชากร ประชากรเปาหมายมกมขนาดใหญมาก ดงนนในทางปฏบตการสามะโนประชากรจะทาไดไมบอยนกเพราะเสยเวลาและคาใชจายเปนจานวนมาก ในหลายกรณกยงไมไดระบองคประกอบของแตละประชากรเปาหมาย เรามกจะดาเนนการสารวจจากกลมตวอยางและรวบรวมขอมลทจาเปนจากตวอยางทไดจากการเลอกมา จากนนเราตดสนใจตามขอมลตวอยางน การสารวจทกระทาบนตวอยางเรยกวาการสารวจตวอยาง ตวอยาง เชน หากเราเกบรวบรวมขอมลรายไดของครอบครวทงหมดในป ค .ศ. 2005 จะเรยกวาสามะโนประชากร ในทางกลบกนหากเราเกบรวบรวมขอมลรายไดของครอบครวใน ป ค .ศ. 2005 จาก 50 ครอบครว จะเรยกวาการสารวจตวอยาง
ความหมาย การสามะโนประชากรและการสารวจ การสารวจจากตวอยางทมสมาชกของประชากรทก
คนเรยกวาการสามะโนประชากร การเกบรวบรวมขอมลจากบางสวนของประชากรเราเรยกวาการสารวจตวอยาง
ความหมาย กลมตวอยาง หมายถง ตวอยางทแสดงถงลกษณะของประชากรมากทสดเรยกวากลมตวอยาง
ตวอยางทไดอาจจะมาจากการสมหรอไมไดมาจากการสมกได ในตวอยางทสมเปนองคประกอบของประชากรจะมโอกาสของการถกเลอกเทากน แตในตวอยางทไมไดมาจากการสมนอาจมไมเทากน
ความหมาย ตวอยางสม เชน ในวธการทองคประกอบของประชากรจะมโอกาสถกเลอกจะถกเรยกวา
ตวอยางสม ถาตวอยางทกขนาดทเลอกจากประชากรมโอกาสเทากนในการถกเลอกเราเรยกวาการสมตวอยางแบบงาย

5
การจบสลากเปนหนงในวธการเลอกตวอยางสมแบบงาย ตวอยาง เชน ถาเลอกนกเรยน 5 คน จากนกเรยนทงหมด 50 คน เราเขยนชอของนกเรยนทง 50 คน ลง ในกระดาษ แลวเรา นาชอทเขยนทงหมด 50 ชอ ใสในกลองและเขยา สดทายเราสมหยบชอจากกลองขนมาหาชอ
ตวอยางอาจจะมการเลอกแบบแทนทหรอไมมการแทนท ในตวอยางทมการแทนท เวลาเราเลอกองคประกอบจากแตละประชากร เรานากลบเขาไปไดในประชากรเดมกอนทเราจะเลอกตวอยางถดไป ดงนนในตวอยางทมการแทนทประชากรทถกเลอกอาจมหมายเลขเดยวกนในแตละครงทเลอก เนองจากเราอาจเลอกรายการเดยวกนมากกวาหนงครงในดงตวอยาง พจารณากลองทมลกบอล 25 ลก มสทแตกตางกน สมมตวาเราเลอกลกบอลมาสหนงจากกลองและใสกลบในกลองกอนทจะเลอกลกถดไป เวลาเลอกลกบอลจากกลองนทกครงทเลอกจะมลกบอล 25 ลก เทากน นเปนตวอยางของการสมตวอยางทมการแทนท
การสมตวอยางโดยไมมการแทนท เมอองคประกอบทเลอกไมเปลยนในประชากร ในกรณนเวลาเราเลอกรายการจานวนของประชากรแตละครงจะลดหนงองคประกอบ ดงนนเราไมสามารถเลอกรายการเดยวกนมากกวาหนงครงในประเภทตวอยางน สวนมากเวลาทาการสมตวอยางในสถตจะไมมการแทนท พจารณาสารวจความคดเหนตามจานวนหนงของผลงคะแนนเลอกจากประชากรทมสทธลงคะแนนทงหมด ในกรณนผมสทธเลอกตงคนเดยวกนไมสามารถเลอกมากกวาหนงครงได ดงนนนเปนตวอยางของการสมตวอยางโดยไมมการแทนท
1.4 ค าพนฐาน มนสาคญมากทตองเขาใจความหมายของคาพนฐานทจะใชบอยในเรองน ในหวขอนจะอธบาย
ความหมายขององคประกอบของสมาชก ตวแปร การสงเกตและกลมของขอมล องคประกอบและชดขอมลไดกาหนดไวโดยสงเขปในหวขอ1.2 หวขอนจะกาหนดขอตกลงทเปนทางการและเพอใหเขาใจเกยวกบตวอยาง
ตาราง 1.1 เปนขอมลแสดงผลกาไรในป ค .ศ. 2004 (ลานดอลลารสหรฐ) ของบรษท 7 แหงในสหรฐอเมรกาเราสามารถเรยกบรษทนวากลมตวอยาง หรอสมาชกของตวอยาง ตาราง 1.1 มขอมลตางๆของทง 7 บรษททเรยกวาองคประกอบซงเปนคาทไดจากการสงเกต
ความหมาย องคประกอบ หรอองคประกอบของสมาชกหรอสมาชกของกลมตวอยางหรอกลมประชากร
เปาหมาย (เชน บคคล บรษท รายการ เมองหรอประเทศ) ทเกยวกบขอมลทเกบรวบรวม

6
ตารางท 1.1 แสดงผลก าไรของบรษท 7 บรษทในสหรฐอเมรกาป 2004
ชอบรษท ผลกาไร (ลานดอลลาร) ตวแปร Wal-Mart Stores 10,267 Exxon 25,330
General Electrical 16,593 Citigroup 17,046 Home Depot 5001 Pfizer 11,361 Target 3189
ผลกาไรในป ค .ศ. 2004 เปนตวอยางทเราเรยกวาตวแปร ผลกาไรของบรษทเปนสงทเรา
จะตองตรวจสอบหรอศกษา
ความหมาย ตวแปร ตวแปร คอลกษณะภายใตการศกษาทถอวามคาทแตกตางกนสาหรบองคประกอบอน
คาทตรงกนขามกบตวแปรคอคาคงท ตวอยางอนๆของตวแปร เชน รายไดของครวเรอน จานวนบานทสรางขนในเมองตอเดอนใน
ปทผานมา จานวนรถยนตทมเจาของ กาไรรวมของบรษทและจานวนนโยบายการประกนราคาขายของพนกงานขายตอวนในเดอนทผานมา
โดยทวไปตวแปรจะถอวามคาทแตกตางกนสาหรบองคประกอบตางๆ ใน ตารางท 1.1 แสดงกาไรของบรษท 7 บรษท สาหรบองคประกอบบางสวนในขอมลชดน แตอยางไรกตามคาของตวแปรอาจจะเหมอนกนกได ตวอยางเชน หากเราจะเกบขอมลเกยวกบรายไดของครวเรอน ครวเรอนเหลานคาดวาจะมรายไดแตกตางกนครอบครวอาจมรายไดเทากน
เราใชสญลกษณแทนตวแปรโดย x , y หรอ z เชนในตารางท 1.1 ผลกาไรของบรษทในป ค.ศ. 2004 อาจจะแสดงโดยหนงในตวอกษรเหลานตวใดตวหนง ในหวขอ 1.8 เราจะเรมใชตวอกษรเหลานแสดงแทนคาตวแปร แตละคาทแสดงถงผลกาไรของในบรษท 7 แหง ในตาราง 1.1 เรยกวาการสงเกตหรอการวด
ความหมาย การสงเกตหรอการวดคาของตวแปรสาหรบองคประกอบเรยกวาการสงเกตหรอการวด
จากตารางท 1.1 แสดงผลกาไรของบรษท General Electric ทคา 16,593 ลานดอลลาร มลคา 16,593 ลานดอลลารจะเปนคาสงเกตหรอการวด ตาราง ท 1.1 สาหรบแตละบรษทจะมหนงคาสงเกตจงมเจดคาสงเกต ขอมลทระบในตารางท 1.1 แสดงผลกาไรของบรษทจะเรยกวาขอมลหรอชดขอมล
องคประกอบ หรอสมาชก
คาทไดจากการสงเกตหรอคาจากการวด

7
ความหมาย ชดขอมล คอกลมของคาสงเกตทไดหนงตวแปรหรอหลายตวแปร ตวอยางของชดขอมลเชน
ราคาบานทเพงขายได 25 หลง เมอเรวๆน คะแนนของนกเรยน 15 คน ความคดเหนของคน 100 คน และวยของพนกงานทงหมดของบรษท
1.5 ประเภทของตวแปร ในสวนท 1.4 เรารวาตวแปรคอลกษณะทแตกตางกนสาหรบองคประกอบตางๆ เชน รายได
ของครอบครว สวนสง ยอดขายรวมของบรษท ราคาหนงสอในวทยาลย จานวนรถยนตในครอบครว จานวนอบตเหตและสถานะของนกเรยนทเขาเรยนในมหาวทยาลย (รนนอง ปทสอง ปทสาม ปทส) นเปนตวอยางของตวแปร
ตวแปรอาจจะจดเปนปรมาณหรอคณภาพ ทงสองประเภทของตวแปรจะอธบายตอไปน 1.5.1 ตวแปรเชงปรมาณ ตวแปรบางตว(เชนราคาบาน)สามารถวดคาออกมาเปนตวเลขได ในขณะทบางตวไมสามารถ
วดได (เชนผมส) อยางแรกเปนตวอยางของตวแปรเชงปรมาณและอยางทสองเปนตวอยางของตวแปรเชงคณภาพ ความหมาย
ตวแปรเชงปรมาณ คอ ตวแปรทสามารถวดคาออกมาเปนตวเลขได ขอมลทเกบจากตวแปรเชงปรมาณเรยกวาขอมลเชงปรมาณ เชน รายได สวนสง ยอดขายรวม ราคาบาน จานวน รถยนตทมเจาของและจานวนอบตเหต นเปนตวอยางของตวแปรเชงปรมาณ เนองจากแตละตวแปรดงกลาวสามารถแสดงออกมาเปนตวเลขได เชน รายไดของครอบครวอาจเปน 41,520.75 ดอลลาร ตอป ยอดขายรวมของบรษทอาจเปน 567 ลานดอลลาร ใน ปทผานมา ตวแปรเชงปรมาณดงกลาวอาจจะจดเปนตวแปรไมตอเนองหรอตวแปรตอเนอง
ตวแปร Discrete คาของตวแปรเชงปรมาณบางตวสามารถจะนบไดหรอนบไมได ตวอยาง เชน เราสามารถนบ
จานวนรถยนตของครอบครวได แตเราไมสามารถนบความสงของสมาชกในครอบครวได ตวแปรทถอวาคานบไดเรยกวาตวแปรไมตอเนอง คอตวแปรท ไมมคาระหวางกลางของคาทเปนไปไดเปนตวแปรไมตอเนอง
ความหมาย ตวแปรไมตอเนอง คอ คาตวแปรทจะนบไดแตระหวางคาของจานวนนนไมมคาอน เชน
จานวนรถยนตทขายไดในวนหนงๆ จานวนรถเปนตวแปรไมตอเนอง เนองจากจานวนรถทขายตองม 0, 1, 2, 3,... และเราสามารถนบได จานวนรถยนตทขายไดระหวาง 0 และ 1 หรอระหวาง 1 และ 2

8
ไมม ตวอยางอนๆ ทเปนตวแปรไมตอเนอง เชน จานวนคนไปทธนาคารในวนหนงๆ จานวนรถยนตในทจอดรถ จานวนสตวเลยงทเปนของเกษตรกรและจานวนนกเรยนในชนเรยน
ตวแปรตอเนอง ตวแปรบางตวไมสามารถนบไดแตสามารถวดคาเปนตวเลขไดและระหวางสองจานวนนนม
คาอก ตวแปรดงกลาวเรยกวาตวแปรตอเนอง ความหมาย ตวแปรตอเนอง คอ ตวแปรทสามารถมคาระหวางตวเลขนนๆไดอก เรยกวาตวแปรตอเนอง
เวลาในการดาเนนการเพอการตรวจสอบเปนตวอยางของตวแปรตอเนอง เพราะระหวางเวลา 30 และ 60 นาท เวลาอาจจะเปน 42.6 นาท 42.67 นาท หรอ 42.674 นาท ( ตามเหตผลเราสามารถวดเวลาอยางแมนยาทเราตองการ) ในทานองเดยวกนความสงของบคคลสามารถวดไดหนงในสบของนวหรอหนงในรอยของนว แตเวลาและความสงไมสามารถนบไดจงไมใชตวแปรไมตอเนอง ตวอยางอนๆของตวแปรตอเนอง เชน นาหนกของคน ปรมาณโซดาใน 12 ออนซ (ทราบวาจะไมมตรง 12 ออนซ ) ผลผลตของมนฝรง (ปอนด) ตอพนท ตวแปรทเกยวของกบเงนถอเปนตวแปรตอเนอง
1.5.2 ตวแปรเชงคณภาพ ตวแปรทไมสามารถวดคาเปนตวเลขได แตสามารถแบงเปนประเภทตางๆ เรยกวาตวแปรเชง
คณภาพ ความหมาย ตวแปรเชงคณภาพ คอ ตวแปรทไมสามารถวดคาเปนตวเลขแตสามารถแบงแยกประเภทได
เรยกวาตวแปรเชงคณภาพ ขอมลทเกบในตวแปรดงกลาวเรยกวาขอมลเชงคณภาพ เชน สถานะของนกศกษาในวทยาลยระดบปรญญาตรเปนตวแปรเชงคณภาพ เนองจากนกเรยนสามารถอยในหนงในสประเภทดงน คอ นกเรยนชนปทหนง นกเรยนชนปทสอง นกเรยนชนปทสาม นกเรยนชนปทส นอกจากนตวอยางของตวแปรคณภาพมเพศของบคคล สผมและสของรถยนต
รปท 1.2 แสดงประเภทของตวแปร
ตวแปร
ตวแปรเชงปรมาณ ตวแปรเชงคณภาพ
ตวแปรไมตอเนอง เชน จานวนบาน , รถยนต, อบตเหต
ตวแปรตอเนอง เชน ความยาว, นาหนก,
อาย,สวนสง, เวลา
เชน สผม, เพศ, สวนประกอบคอม

9
1.6 ขอมลภาคตดขวางและอนกรมเวลา 1.6.1 ขอมลภาคตดขวาง ขอมลภาคตดขวาง คอ ขอมลเกยวกบองคประกอบทแตกตางกนของประชากรหรอตวอยาง
สาหรบงวดของเวลาเดยวกน เชนขอมลเกยวกบรายได 100 ครอบครว ในป ค.ศ. 2005 เปนตวอยางของขอมลภาคตดขวาง ตวอยางขอมลทงหมดทนาเสนอแลวในบทนบางสวนเปนขอมลภาคตดขวาง
ความหมาย ขอมลภาคตดขวาง คอ ขอมลทเกบในองคประกอบทแตกตางกนทจดเดยวกนในชวงเวลา
เดยวกนเรยกวาขอมลภาคตดขวาง ตาราง 1.2 แสดงจานวนเฉลยของผเขาชมการพดในตอนกลางวนเดอนกนยายน ป ค .ศ. 2003
ถงเดอนกรกฎาคม ป ค .ศ. 2004 เนองจากตารางนนาเสนอขอมลทผชมเฉลยรายวนของเจดนกพดสาหรบงวดเดยวกน (กนยายน 2003 ถงกรกฎาคม 2004) เปนตวอยางของขอมลภาคตดขวาง
ตาราง 1.2 แสดงจ านวนเฉลยของผเขาชมการพดในตอนกลางวน
Talk Show ผเขาชมการพดเฉลยตอวน (ลานคน) The Oprah Winfrey Show 8.6 Dr. Phil 6.5 Live With Regis and Kelly 4.7 Maury 4.1 Jerry Springer 3.3 Montel Williams 3.2 Ellen 2.2
ทมา: การวจยเกยวกบสอ; ขอมลทปรากฏใน New York Times การจดสงเนอหาเครอขายโทรทศน 23 สงหาคม 2004
1.6.2 อนกรมเวลา อนกรมเวลา ขอมลชดหนงมขอมลเกยวกบองคประกอบเดยวกนในชวงเวลาทแตกตางกน
เชน ขอมลการสงออกของสหรฐป 1983 ถง 2005 เปนตวอยางของขอมลอนกรมเวลา ความหมาย อนกรมเวลา คอ ขอมลทมองคประกอบเดยวกนของตวแปรเดยวกนในจดตางๆ ในเวลาหรอ
ชวงเวลาทแตกตางกนเรยกวาขอมลอนกรมเวลา ขอมลทระบในตารางท 1.3 เปนตวอยางของขอมลอนกรมเวลา ตารางนแสดงจานวนการ
ปะทะกนระหวางสตวปา (สวนใหญเปนนก) และเครองบนพลเรอนทบนสารวจสาหรบป ค .ศ. 1990 ป ค.ศ. 1995 ป ค.ศ. 2000 และ ป ค.ศ. 2002

10
ตาราง 1.3 จ านวนการปะทะกนระหวางสตวปาและเครองบนพลเรอน
ป ค.ศ. Number of Collisions 1990 1990 1995 2775 2000 6323 2002 6556
ทมา: กองทพอากาศสหรฐอเมรกา 15 ตลาคม 2003
1.7 แหลงขอมล ขอมลมความถกตองและเหมาะสมเปนสงสาคญททาใหขอมลมความนาชอถอ ขอมลอาจได
จากแหลงภายในหรอแหลงภายนอกหรอการสารวจและการทดสอบ หลายครงขอมลมาจากแหลงภายใน เชน แฟมประวตบคคลของบรษทหรอบนทกทางบญช
เชนบรษททตองการพยากรณการขายผลตภณฑในอนาคตของตน สวนใหญใชขอมลของระยะเวลาทผานมาจากบนทก แตขอมลทงหมดทจาเปนมกจะไมไดจากแหลงภายใน ในกรณเชนนสงหนงอาจจะตองขนอยกบแหลงภายนอกทขอรบขอมล แหลงเหลานเรยกวาแหลงภายนอก เชน นโยบายแหงสหรฐอเมรกา (เผยแพรเปนประจาทกป) ซงมหลายชนด ขอมลในประเทศสหรฐอเมรกาเปนแหลงขอมลภายนอก
สงพมพสามารถใชเปนแหลงขอมลภายนอกของภาครฐบาลและเอกชนไดเปนจานวนมาก ตอไปนคอรายการบางสงพมพของรฐบาล 1. นโยบายแหงสหรฐอเมรกา 2. รายไดและการจางงาน 3. คมอแรงงานสถต 4. หนงสอกฎหมายทางอาญา 5. รายงานทางเศรษฐกจของกรรมการผจดการใหญ 6. หนงสอขอมลเกยวกบเมองและประเทศ 7. หนงสอรฐและเขตขอมล
8. ขาวสารทางการศกษา 9. สขภาพของชาวสหรฐอเมรกา 10. สถตการเกษตร
11
ขอมลทปรากฏในหนงสอเหลานสามารถเขาถงไดในเวบไซตอนเตอรเนต เชน - www.census.gov (สามะโนประชากรสานก) - www.bls.gov (สานกแรงงานสถต) - www.ojp.usdoj.gov/bjs (สานกงานยตธรรมโครงการสหรฐของกระทรวงยตธรรมสานก
สถตยตธรรม) - www.os.dhhs.gov (กรมอนามยและมนษยบรการในสหรฐ) - www.suda.gov/nass/pubs/agstats.htm (กรมการเกษตรในสหรฐอเมรกา) นอกจากสงพมพรฐบาลและสงพมพเอกชนเหลานจานวนมาก (เชนมาตรฐานและคมอหน
สาหรบเจารานรกษาความปลอดภยและปฏทนโลกสาหรบไกดและหนงสอเหตการณ) และระยะ (เชน วารสาร Wall Street USA TODAY หนงสอโชคชะตาและธรกจรายสปดาห) สามารถใชเปนแหลงขอมลภายนอก
บางครงขอมลทจาเปนอาจไมสามารถใชไดทงจากแหลงภายในหรอภายนอก ในกรณเชนนผสมภาษณอาจจะตองดาเนนการสารวจหรอการทดสอบเพอขอรบขอมลทจาเปน รายละเอยดการสารวจและการทดสอบทกลาวถงดไดจากภาคผนวก
1.8 เครองหมายบวก บางครงการบนทกทางคณตศาสตรสนๆชวยแสดงความสมพนธทางคณตศาสตร สวนน
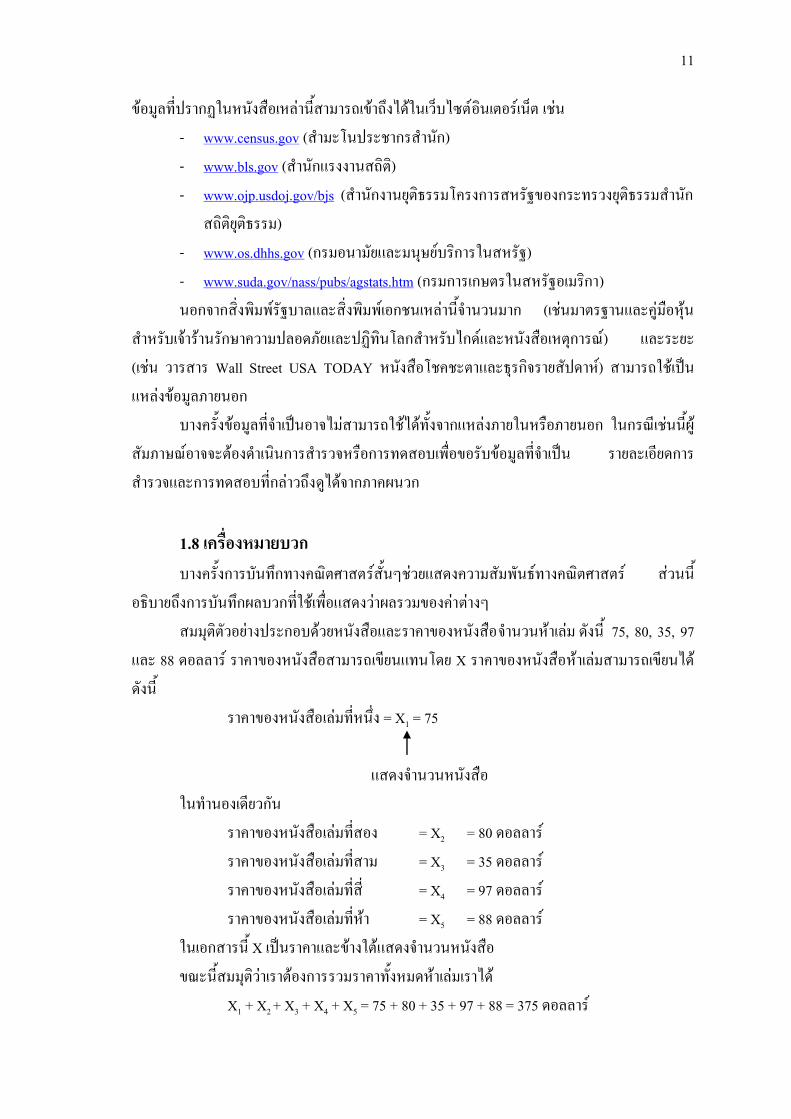
อธบายถงการบนทกผลบวกทใชเพอแสดงวาผลรวมของคาตางๆ สมมตตวอยางประกอบดวยหนงสอและราคาของหนงสอจานวนหาเลม ดงน 75, 80, 35, 97
และ 88 ดอลลาร ราคาของหนงสอสามารถเขยนแทนโดย X ราคาของหนงสอหาเลมสามารถเขยนไดดงน
ราคาของหนงสอเลมทหนง = X1 = 75
แสดงจานวนหนงสอ ในทานองเดยวกน
ราคาของหนงสอเลมทสอง = X2 = 80 ดอลลาร ราคาของหนงสอเลมทสาม = X3 = 35 ดอลลาร ราคาของหนงสอเลมทส = X4 = 97 ดอลลาร ราคาของหนงสอเลมทหา = X5 = 88 ดอลลาร
ในเอกสารน X เปนราคาและขางใตแสดงจานวนหนงสอ ขณะนสมมตวาเราตองการรวมราคาทงหมดหาเลมเราได
X1 + X2 + X3 + X4 + X5 = 75 + 80 + 35 + 97 + 88 = 375 ดอลลาร

12
ตวอกษรพมพใหญภาษากรก (ซกมา) จะใชเพอแสดงวาผลรวมของคาทงหมด
ใชเครองหมาย เราสามารถเขยนรวมมากอนดงน
X1 + X2 + X3 + X4 + X5 = 375 ดอลลาร ในเอกสารการแสดงนเปนผลรวมของทกคาของ X และถกอานวาซกมา "X" หรอ "รวม" คาทงหมดของ “X”
ตวอยาง 1.1 เงนเดอนในหนงปของพนกงานสคนเปนดงน 75, 42, 125 และ 61 (พนดอลลาร) จงหา a. X
b. 2)( X
c. 2X
วธท า ให X1 , X2 , X3 และ X4 เงนเดอน (พนดอลลาร)ในหนงปของพนกงานคนท 1,2,3 และ 4 จะได X1 = 75, X2 = 42, X3 =125, และ X4 = 61
a. X = X1 + X2 + X3 + X4
= 75 + 42 + 125 + 61 = 303 หรอ 303,000 ดอลลาร b. 2)( X เปนการยกกาลงสองของผลรวมของ X
ดงนน 2)( X = (303)2
= 91,809 c. การหาคาของ 2X เปนการหาคาผลรวมกาลงสองของ X ม 2 ขนตอนคอ
นาคาของ X แตละตว มายกกาลงสอง หลงจากนนกหาผลรวมของคาดงกลาว 2X = (75)2 + (42)2 + (125)2 + (61)2
= 5625 + 1764 + 15,625 + 3721 = 26,735
13
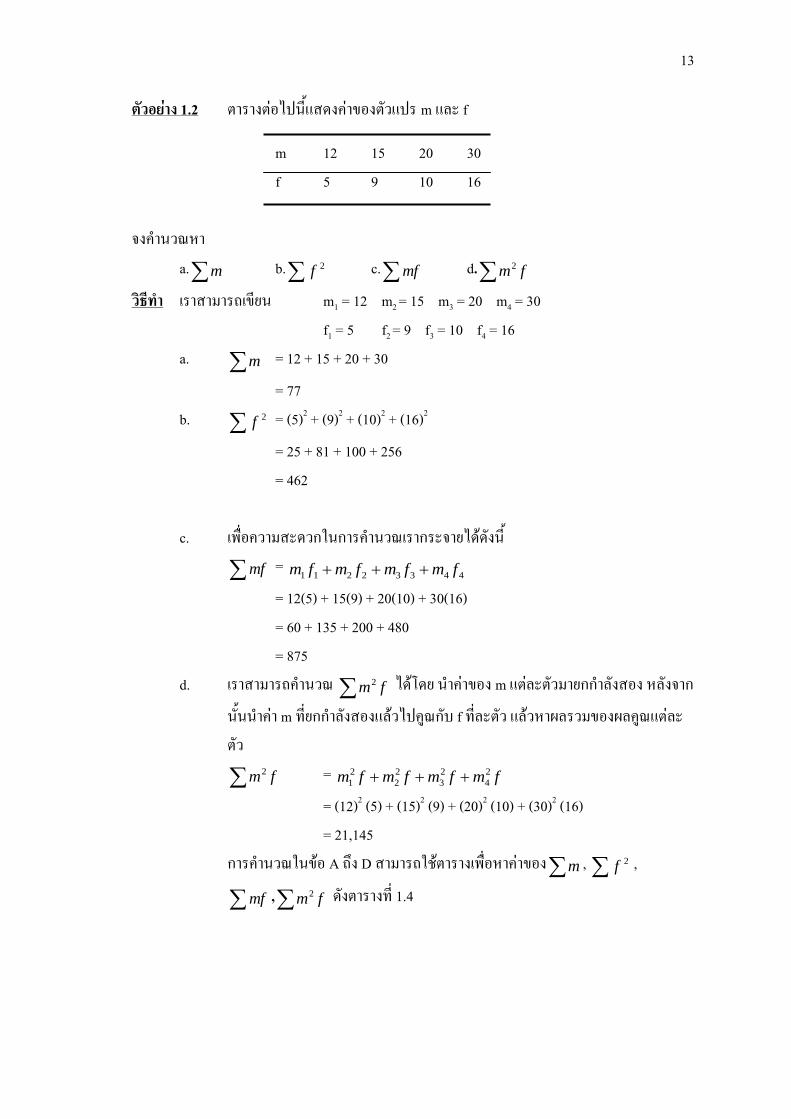
ตวอยาง 1.2 ตารางตอไปนแสดงคาของตวแปร m และ f
m 12 15 20 30 f 5 9 10 16 จงคานวณหา
a.m b. 2f c.mf d. fm2
วธท า เราสามารถเขยน m1 = 12 m2 = 15 m3 = 20 m4 = 30 f1 = 5 f2 = 9 f3 = 10 f4 = 16 a. m = 12 + 15 + 20 + 30
= 77 b. 2f = (5)2 + (9)2 + (10)2 + (16)2
= 25 + 81 + 100 + 256 = 462
c. เพอความสะดวกในการคานวณเรากระจายไดดงน
mf = 44332211 fmfmfmfm
= 12(5) + 15(9) + 20(10) + 30(16) = 60 + 135 + 200 + 480 = 875
d. เราสามารถคานวณ fm2 ไดโดย นาคาของ m แตละตวมายกกาลงสอง หลงจาก
นนนาคา m ทยกกาลงสองแลวไปคณกบ f ทละตว แลวหาผลรวมของผลคณแตละตว
fm2 = fmfmfmfm 2
4
2
3
2
2
2
1
= (12)2 (5) + (15)2 (9) + (20)2 (10) + (30)2 (16) = 21,145 การคานวณในขอ A ถง D สามารถใชตารางเพอหาคาของm , 2f ,
mf , fm2 ดงตารางท 1.4

14
ตารางท 1.4
m f 2f mf fm2 12 5 (5)2 = 25 12(5) = 60 (12)2(5) = 720 15 9 (9)2 = 81 15(9) = 135 (15)2(9) = 2025 20 10 (10)2 = 100 20(10) = 200 (20)2 (10) = 4000 30 16 (16)2 = 256 30(16) = 60 (30)2 (16) = 14,400
m = 77 f = 40 2f = 462 mf = 875 fm2 = 21,145
ตารางท 1.4 สามารถอธบายไดดงน 1. คอลมนแรกแสดงคาของ ตวแปร m ผลรวมของคาเหลานเทากบ 77 2. คอลมนทสองแสดงคาของ ตวแปร f ผลรวมของคอลมนนเทากบ 40 3. คอลมนทสามนาคาของ f มายกกาลงสอง เชน คาแรกคอ 25เปนการนา 5 ยกกาลงสอง
ผลรวมของคาในคอลมนนเทากบ 462 4. สคอลมนทสนาคาของ m และคา f ตรงกน เชนคาแรก 60 ในคอลมนนไดโดยนา 12 และ 5
คณกน ผลรวมของคาในคอลมนนเทากบ 875 5. ถดไปนาคา m ทยกกาลงสองแลวคณดวยคา f ทตรงกน ผลทไดนาไปบนทกในคอลมนทหา
เชนคาแรก 720 เปนคาทไดโดย 12 ทยกกาลงสองแลวคณดวย 5 ผลรวมของคาในคอลมนนใหเทากบ 21,145

15
ส ามะโนประชากร คอ การสารวจทมสมาชกทงหมดของประชากร
ตวแปรตวแปรตอเนอง (เชงปรมาณ) คอตวแปรทมคาระหวางตวเลขนนๆ
ขอมลภาคตดขวาง คอ สวนขอมลทเกบในองคประกอบทแตกตางกนทจดเดยวกนในเวลาเดยวกน
ขอมลหรอชดขอมล คอ การ สงเกตการเกบรวบรวมหรอการวดในตวแปร
สถตเชงพรรณนา คอ การ อธบายวธการเกบรวบรวมเพอจดแสดงและอธบายขอมลโดยใชตารางกราฟและการสรป
ตวแปรไมตอเนอง (เชงปรมาณ) คอ ตวแปรทมคาสมารถจะนบได
องคประกอบหรอสมาชก คอ ขอมล หรอรายละเอยดทอยในตวอยางหรอประชากร
สถตอนมาน คอ วธการตดสนใจเกยวกบประชากรตามผลของตวอยาง
การสงเกตหรอการวดคา คอ คา ของตวแปรสาหรบองคประกอบทไดจากการวดหรอสงเกต
ประชากรหรอประชากรเปาหมาย คอ จานวนลกษณะองคประกอบทงหมดทสนใจศกษา
ขอมลเชงคณภาพ คอ ขอมลทเกบไดโดยตวแปรคณภาพ
ตวแปรเชงคณภาพ คอ ตวแปรทไมสามารถวดคาเปนตวเลขไดแตแบงเปนกลมได
ขอมลเชงปรมาณ คอ ขอมลทเกบไดโดยตวแปรเชงปรมาณ
ตวแปรเชงปรมาณ คอ ตวแปรทสามารถวดคาเปนตวเลขได
ตวอยางสม คอ วธการทองคประกอบของประชากรจะมโอกาสถกเลอก
กลมตวอยาง คอ ตวอยางทมลกษณะเดยวกบประชากรทเกยวของ
ตวอยาง คอ สวนหนงของประชากรทเราสนใจ
การส ารวจตวอยาง คอ การเกบขอมล ทมองคประกอบของตวอยาง
การสมตวอยางอยางงาย คอ การ เลอกตวอยางจากประชากรมโอกาสถกเลอกเทากน
สถต คอ กลมของวธการทใชในการรวบรวมวเคราะหและตความขอมลรวมถงการตดสนใจ
การส ารวจ คอ การเกบรวบรวมขอมลเกยวกบองคประกอบของประชากรหรอตวอยาง
อนกรมเวลา คอ ขอมลทมองคประกอบเดยวกนของตวแปรเดยวกนในจดตางๆ ในเวลาหรอชวงเวลาทแตกตางกน
ตวแปร คอ ลกษณะหรอคาทแตกตางกนสาหรบองคประกอบตางๆ
อภธานศพท

16
1.1 อธบายความหมายของสถตทงสองความหมายมาพอเขาใจ 1.2 อธบายประเภทของสถตมาพอเขาใจ 1.3 อธบายความหมายคาวาประชากร, ตวอยาง, กลมตวอยาง, ตวอยางสม, การสมตวอยางดวยการ
แทนทและการสมตวอยางโดยไมมการแทนท 1.4 ใหยกตวอยางแตละตวอยางของการสมแบบแทนทและการสมตวอยางโดยไมมการแทนท 1.5 อธบายความแตกตางระหวางการสามะโนและการสารวจตวอยางพอสงเขป และทาไมมการ
สารวจตวอยางมากกวาการทาสามะโน 1.6 อธบายวาแตละขอตอไปนถอเปนการประชากรหรอตวอยาง
a. นาหนกทงหมด(ปอนด)ของปลาทตกไดโดยผเขารวมตกปลา b. หนบตรเครดต 100 ครอบครวทเลอกออกจากเมอง c. จานวนการตลกทงหมดของผเลนในทมเบสบอลในฤดกาล ป 2005 d. จานวนขอการละเมดทถกทาทณฑบนของผทถกปลอยออกจากคกทงหมด 2,147 คน e. จานวนเงนทใชในใบสงยาจากผสงอาย 200 คน ในเมองใหญ
1.7 อธบายวาแตละขอตอไปนถอเปนการประชากรหรอตวอยาง a. จานวนผเลนทผดกตกาทงหมดทเลน NBC ในชวงฤดกาล 2005-2006 b. ผลผลตของมนฝรงตอเอเคอรสาหรบ 10 ชนในพนท c. เงนเดอนประจาสปดาหของพนกงานทงหมดของบรษท d. สตวเลยงทเปนของเกษตรกร 100 คน ในไอโอวา e. จานวนคอมพวเตอรทขายในชวงสปดาหทผานมาททกรานคอมพวเตอรใน Los Angeles
1.8 อธบายความหมายขององคประกอบ, ตวแปร, การสงเกตและชดขอมล
1.9 ตารางตอไปนแสดงจานวนสนขกดทแจงใหตารวจในปทผานมาในหกเมอง
เมอง จ านวนครงทสนขกด Center City 47 Elm Grove 32 Franklin 51 Bay City 44 Oakdale 12 Sand Point 3
อธบายความหมายของสมาชก, ตวแปร, การวดและชดขอมลทมการอางองถงตารางนพอสงเขป
แบบฝกหด

17
1.10 ตารางตอไปนแสดงนามนดบสารอง (พนลานบารเรล) สาหรบหกประเทศทสารองไวทใหญทสดในเดอนมถนายน 2004
ประเทศ น ามน ซาอดอาระเบย 261.7 อรก 112.0 คเวต 97.7 อหราน 94.4 อาหรบเอมเรท 80.3 เวเนซเอลา 64.0
อธบายความหมายของสมาชก, ตวแปร, การวดและชดขอมลทมการอางองถงตารางนพอสงเขป
1.11 ดขอมลทกาหนดในขอ 1.9
a. สาหรบขอมลนตวแปรคออะไร b. คาสงเกตในขอมลเปนเทาไร c. มสมาชกในขอมลเปนเทาไร
1.12 ดขอมลทกาหนดในขอ 1.10 a. สาหรบขอมลนตวแปรคออะไร b. คาสงเกตในขอมลเปนเทาไร c. มสมาชกในขอมลเปนเทาไร
1.13 อธบายความหมายของคาตอไปน a. ตวแปรเชงปรมาณ b. ตวแปรเชงคณภาพ c. ตวแปรไมตอเนอง d. ตวแปรตอเนอง e. ขอมลเชงปรมาณ f. ขอมลเชงคณภาพ

18
1.14 ตวแปรตอไปนเปนเชงปรมาณหรอเชงคณภาพ a. จานวนคนในครอบครว b. สรถยนต c. สถานภาพการสมรสของคน d. ระยะเวลาของการกระโดดของกบ e. จานวนขอผดพลาดทรายงานในเครดตของบคคล
1.15 ตวแปรตอไปนเปนเชงปรมาณหรอเชงคณภาพ a. จานวนขอผดพลาดจากการพมพในหนงสอพมพ b. คาเคเบลทวรายเดอน c. สถานทพกผอนฤดใบไมผลโดยนกศกษา d. จานวนรถยนตของครอบครว e. รายไดจากสลากกนแบงของรฐ
1.16 แบงประเภทตวแปรเชงปรมาณในขอ 1.14 เปนตวแปรไมตอเนองหรอตอเนอง 1.17 แบงประเภทตวแปรเชงปรมาณในขอ 1.15 เปนตวแปรไมตอเนองหรอตอเนอง 1.18 อธบายความแตกตางระหวางขอมลภาคตดขวางและขอมลอนกรมเวลาพรอมทงยกตวอยาง
ของขอมลแตละประเภท 1.19 อธบายแหลงขอมลภายในและภายนอกพอสงเขป 1.20 ขอมลดงตอไปนเปนขอมลภาคตดขวางหรอขอมลอนกรมเวลา
a. คาสราของแตละครอบครวในแตละเดอนป 2005 b. จานวนการโจรกรรมดวยอาวธในแตละปของเมองDallas ในชวง 1992-2005 c. จานวนการฆาตกรรมใน 40 เมองระหวางป 2005 d. ยอดขายรวมของรานไอศครม 200 ราน ในกรกฎาคม 2005
1.21 ขอมลดงตอไปนเปนขอมลภาคตดขวางหรอขอมลอนกรมเวลา a. ราคาเฉลยของบานใน 100 เมอง b. เงนเดอนพนกงาน 50 คน c. จานวนรถยนตทขายโดยทวไปในแตละปในระหวาง 1980-2005 d. จานวนพนกงานงานของบรษทในแตละป 1985-2005

19
1.22 ตารางตอไปนแสดงหาคของ m และคา f
m 5 10 17 20 25 f 12 8 6 16 4
คานวณคาของแตละรายการตอไปน: a.m b. 2f c.mf d. fm2
1.23 ตารางตอไปนแสดงคาของ m และ f หาค
m 3 6 25 12 15 18 f 16 11 16 8 4 14
คานวณคาของแตละรายการตอไปน: a.m b. 2f c.mf d. fm2
1.24 ตารางตอไปนแสดงคาของ x และ y หาค
x 15 22 11 8 5 y 10 12 14 9 18
คานวณ a. x b. y c. xy d. 2x e. 2y
1.25 ตารางตอไปนแสดงคาของ x และ y หาค
x 4 8 25 9 12 20 y 12 5 14 7 12 8
คานวณ a. x b. y c. xy d. 2x e. 2y
1.26 เงนรางวลของหกคนทจบสลากในเดอนทผานมาคอ 20, 14, 57, 23, 7 และ 102 (ดอลลาร) ให
y เงนรางวล จงหา a. y b. 2)( y c. 2y

20
1.27 คาโทรศพทในเดอนมกราคม 2006 ของสครอบครวคอ 83, 205, 87 และ 154 ให y เปนคาโทรศพทในเดอนมกราคม 2006 ของสครอบครว จงหา
a. y b. 2)( y c. 2y
1.28 ราคา (พนดอลลาร) ของรถใหมหาคนคอ 28, 35, 29, 54, และ 18 ให x เปนราคารถใหมใน
ตวอยางน จงหา a. x b. 2)( x c. 2x
1.29 จานวนนกเรยน (กลมทอยใกลกน) ปจจบนเรยนทมหาวทยาลยเจดแหง 7, 39, 21, 16, 3, 43
และ 19 ให x เปนจานวนนกเรยนทเรยนอยทมหาวทยาลย จงหา a. x b. 2)( x c. 2x
1.30 ตารางตอไปนเปนการเขารวมประชมโดยเฉลยทสโมสรกฬาบาสเกตบอล ลกใหญสาหรบ ป
1999-2004 ฤดกาล การเขารวมประชม 1999 33,352 2000 33,212 2001 33,692 2002 31,921 2003 30,894 2004 32,976 Source: USA TODAY, July 8, 2004
จงอธบายความหมายของตวแปร การวดและชดขอมลทมการอางองถงในตารางน

21
1.31 ตารางตอไปนแสดงจานวนของชาวอเมรกนทชนะในการแขงเรอระหวาง 1995-2004 Total
Year (millions) 1995 4.4 1996 4.7 1997 5.1 1998 5.4 1999 5.9 2000 6.9 2001 6.9 2002 7.6 2003 8.2 2004 9.0 ทมา: Cruise Lines International Association. USA TODAY, February 2, 2005
จงอธบายความหมายของตวแปร การวดและชดขอมลทมการอางองถงในตารางน 1.32 จากแบบฝกหดขอ 1.30 และ 1.31. แบงประเภทขอมลเหลานกาหนดเปนขอมลภาคตดขวาง
หรออนกรมเวลา 1.33 ระบวาแตละตวอยางตอไปนหมายถงประชากรหรอตวอยาง
a. เลอกกลมผปวย 25 คนมาทดสอบยาใหม b. รายการผลตเครองจกรทงหมดสาหรบป 1995-2005 c. คาใชจายรายปในการซอเสอผาของ 50 คน d. จานวนบานทขายโดยพนกงาน 10 คน ของหนวยงานอสงหารมทรพยในระหวางป 2005
1.34 ระบวาแตละตวอยางตอไปนหมายถงประชากรหรอตวอยาง
a. เงนเดอนของผบรหารระดบสงของบรษททงหมดใน New York City b. เงนคาใชจายของนกเรยน ป. 6 เลอกมา 1500 คนจากโอไฮโอ c. ยอดขายรวมของอาหารจานดวนสอยางสาหรบป 2005 d. รายไดประจาปของพนกงานของรานอาหารทงหมด 33 คน
22
1.35 ตอไปนเปนตวอยางของการสมตวอยางทมการแทนทหรอทเปนตวอยางของการสมตวอยางโดยไมมการแทนท a. เลอกผปวย 10 ตน จาก 100 คน ไปทดสอบยาใหม b. การเลอกอาจารยเปนสมาชกของวฒสภามหาวทยาลยแลวเลอกอาจารยจากกลมเดยวกน
เปนสมาชกของคณะกรรมการหลกสตร
1.36 ตอไปนเปนตวอยางของการสมตวอยางทมการแทนทหรอทเปนตวอยางของการสมตวอยางโดยไมมการแทนท a. เลอกเมองเจดเมองเพอขายสารดบกลนตวใหม b. เลอกครโรงเรยนมธยมใหนกเรยนเรยนเรยนทฤษฎในเดอนมนาคมจากนนเลอกอาจารย
จากกลมเดยวกนเพอเปนพเลยงในการเตนราในเดอนเมษายน
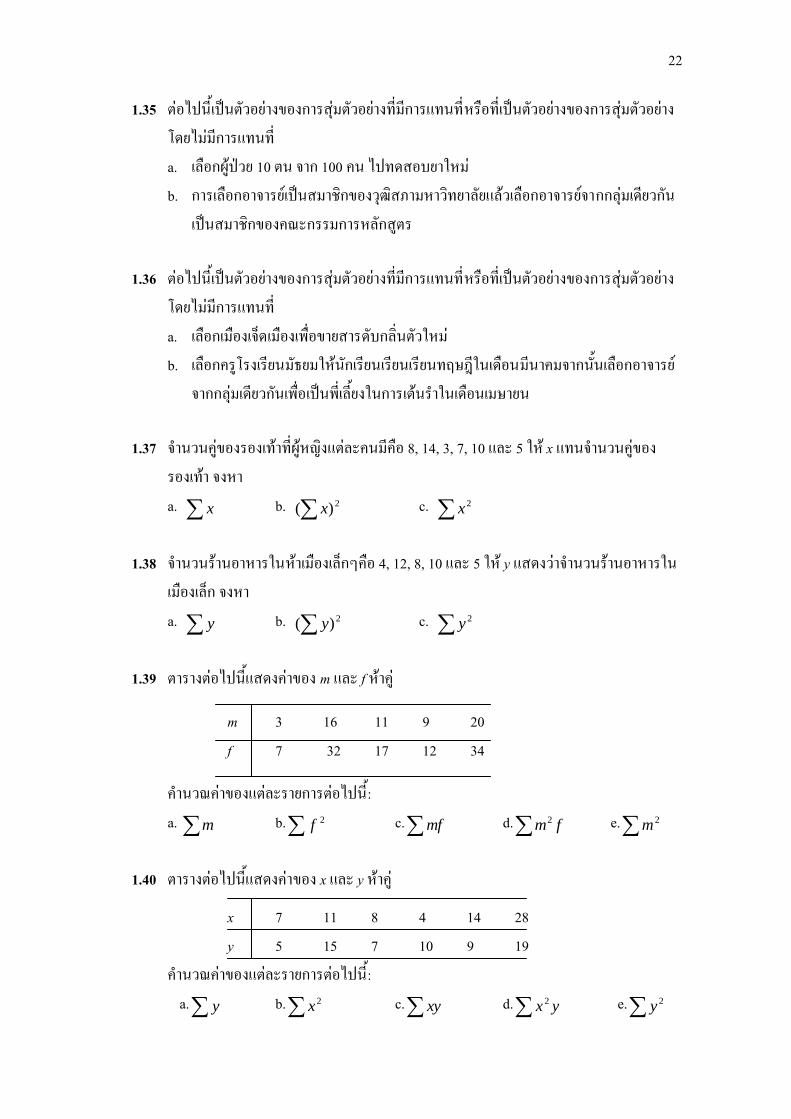
1.37 จานวนคของรองเทาทผหญงแตละคนมคอ 8, 14, 3, 7, 10 และ 5 ให x แทนจานวนคของรองเทา จงหา a. x b. 2)( x c. 2x
1.38 จานวนรานอาหารในหาเมองเลกๆคอ 4, 12, 8, 10 และ 5 ให y แสดงวาจานวนรานอาหารในเมองเลก จงหา a. y b. 2)( y c. 2y
1.39 ตารางตอไปนแสดงคาของ m และ f หาค
m 3 16 11 9 20 f 7 32 17 12 34
คานวณคาของแตละรายการตอไปน: a. m b. 2f c.mf d. fm2 e. 2m
1.40 ตารางตอไปนแสดงคาของ x และ y หาค
x 7 11 8 4 14 28 y 5 15 7 10 9 19
คานวณคาของแตละรายการตอไปน: a. y b. 2x c. xy d. yx 2 e. 2y

23
1. ในสถตประชากรหมายถง
a. ชายและหญง b. หวขอหรอวตถทนาสนใจ c. คนทอาศยอยในประเทศ
2. ตวอยางในสถตหมายถงสวนของอะไร a. คนทเลอกออกจากประชากรของประเทศ b. คนทเลอกออกจากประชากรของพนท c. ประชากรทนาสนใจ
3. ตอไปนเปนตวอยางทมการแทนทหรอเปนตวอยางทไมมการแทนท a. เพอนหาคนเลอกชดขมาของตนและเลอกมาหาตวมาข(ตองเลอกมาทแตกตางกน) b. กลองหนงมลกบอลหาลกทมสแตกตางกน หยบลกบอลจากชองและสของมนจะถก
บนทกไวหลงจากนนจะนากลบเขากลองกอนทจะหยบลกถดไป การทดสอบนทาซา 12 ครง
4. ตอไปนเปนตวแปเชงปรมาณหรอเชงคณภาพและทเปนตวแปรเชงปรมาณเปนตวแปร
ตอเนองหรอไมตอเนอง a. ผหญงทมชอเสยงในรายการทว b. เงนเดอนของผเลนฟตบอล c. จานวนของสตวเลยงของครอบครว d. สายพนธสนขทชนชอบของเดก 20 คน
แบบทดสอบ

24
5. ตารางตอไปนแสดงการลงแขงในการแขงขนฟตบอลนานาชาตประจาวนท 4 กมภาพนธ 2005
Player Yards Emmitt Smith 18,355 Walter Payton 16,726 Barry Sanders 15,269 Curits Martin 13,336 Jerome Bettis 13,294 Eric Dickerson 13,259 Tony Dorsett 12,739 Jim Brown 12,312 Marcus Allen 12,243 Franco Harris 12,120 Source: USA TODAY, February 4, 2005.
อธบายความหมายของสมาชกตวแปรการวดและชดขอมลทมการอางองถงตารางน 6. จานวนบตรเครดตของแตละครอบครว 2, 5, 3, 12, และ 7 ให x เปนจานวนบตรเครดต จง
หา a. x b. 2)( x c. 2x
7. ตารางตอไปนแสดงคาของ m และ f หาค
m 3 6 9 12 15 f 15 25 40 20 12
คานวณ a.m b. f c. 2m d.mf e. fm2
f. 2f

25
อางอง Prem s.mann.(2007). INTRODUCTORY STATISTICS. Copyriht 2007 John Wiley & Sons
(Asia) Pte Ltd

26
Introduction to Statistics
Do you feel pressured by your boss or co-workers to come to work when you are sick with the flu? Or are they more considerate and supportive and do not feel this pressure? In a sample survey, 38% of the respondents said they feel pressured to come to work when they have the flu. However, a larger majority, 61%, said that they do not feel pressured. The remaining 1% were not sure. (See Case Study 1-2.) The study of statistics has become more popular than ever over the past four decades or so. The increasing availability of computers and statistical software packages has enlarged the role of statistics as a tool for empirical research. As a result, statistics is used for research in almost all professions, from medicine to sports. Today, college students in almost all disciplines are required to take at least one statistics course. Almost all newspapers and magazines these days contain graphs and stories on statistical studies. After you finish reading this book, it should be much easier to understand these graphs and stories. Every field of study has its own terminology. Statistics is no exception. This introductory chapter explains the basic terms of statistics. These terms will bridge our understanding of the concepts and techniques presented in subsequent chapters. 1.1 What is Statistics ?
The word statistics has two meanings. In the more common usage, statistics refers to numerical facts. The numbers that represent the income of a family, the age of a student the percentage of passes completed by the quarterback of a football team, and the starting salary of a typical college graduate are examples of statistics in this sense of the word. A 1988 article in U.S. News & World Report declared “statistics are an American obsession.” During the 1988 baseball Word Series between the Los Angeles Dodgers and the Oakland A’s, the then NBC commentator Joe Garagiola reported to the viewers numerical facts about the players’ performances. In response, fellow commentator Vin Scully said, “I love it when you talk statistics.” In these examples, the word statistics refers to numbers.
After winning the World Series in 1918, the Boston Red Sox did not win the World Series again until 2004. The following table compares a few facts for the years 1918 and 2004. The numbers given in this table can be referred to as statistics.

27
Item 1918 2004 Price of a World Series Ticket $3.30 $140 U.S. population (in Millions) 106 294 Price of a Quart of Milk 14 Cents $1.09 Price of a Loaf of Bread 10 Cents $2.19
Source: USA TODAY, October 28, 2004.
The second meaning of statistics refers to the field or discipline of study. In this sense of the word, statistics is defined as follows
Definition Statistics Statistics is a group of methods used to collect, analyze, present, and interpret
data and to make decisions.
Every day we make decisions that may be personal, business related, or of some other kind. Usually these decisions are made under conditions of uncertainty. Many times, the situations or problems we face in the real world have no precise or definite solution. Statistical methods help us make scientific and intelligent decisions in such situations. Decisions made by using statistical methods are called educated guesses. Decisions made without using statistical (or scientific) methods are pure guesses and, hence, may prove to be unreliable. For example, opening a large store in an area with or without assessing the need for it may affect its success. Like almost all fields or study, statistical has two aspects: theoretical and applied. Theoretical or mathematical statistics deals with the development, derivation, and proof of statistical theorems, formulas, rules, and laws. Applied statistics involves the applications of those theorems, formulas, rules, and laws to solve real-world problems. This text is concerned with applied statistics and not with theoretical statistics. By the time you finish studying this book, you will learn how to think statistically and how to make educated guesses.
1.2 Types of Statistics 1.2.1 Descriptive Statistics Suppose we have information on the test score of students enrolled in a statistics class. In
statistical terminology, the whole set of numbers that represents the scores of students is called a
28
data set, the name of each student is called an element, and the score of each student is called an observation. (These terms are defined in more detail in Section 1.4.) A data set in its original form is usually very large. Consequently, such a data set is not very helpful in drawing conclusions or making decisions. It is easier to draw conclusions from summary tables and diagrams than form the original version of a data set. So, we reduce data to a manageable size by constructing table, drawing graphs, or calculating summary measures such as averages. The portion of statistics that helps us do this type of statistical analysis is called descriptive statistics.
Definition Descriptive Statistics Descriptive Statistics consists of methods for organizing,
displaying, and describing data by using table, graph, and summary measures. Both Chapters 2 and 3 discuss descriptive statistical methods. In Chapter 2, we learn how to construct table and how to graph data. In Chapter 3, we learn calculate numerical summary measures, such as averages. 1.2.2 Inferential Statistics
In statistics, the collection of all elements of interest is called a population. The selection of a few elements form this population is called a sample. (Population and sample are discussed in more detail in Section 1.3.) A major portion of statistics deals with making decision, inferences, predictions, and forecasts about populations based on results obtained from samples. For example, we many make some decisions about the political views of all college and university students based on the political views of 1000 students selected from a few colleges and universities. As another example, we many want to find the starting salary of a typical college graduate. To do so, we many select 2000 recent college graduates, find their starting salaries, and make a decision based on this information. The area of statistics that deals with such decision-making procedures is referred to as inferential statistics. This branch of statistics is also called inductive reasoning or inductive statistics.
Definition Inferential Statistics Inferential Statistics consists of methods that use sample results to
help make decisions or predictions about a population.

29
1.3 Population Versus Sample
We will encounter the terms population and sample on almost every page of this text. Consequently, understanding the meaning of each of these two terms and the difference between them is crucial. Suppose a statistician is interested in knowing 1. the percentage of all voters in a city who will vote for a particular candidate in an election 2. The 2005 gross sales of all companies in New York City 3. the prices of all house in California
In this examples, the statistician is interested in all voters, all companies, and all houses. Each of these groups is called the population for the respective example. In statistics, a population dose not necessarily mean a collection of people. It can, in fact, be a collection of people or of any kind of item such as houses, books, television sets, or cars. The population of interest is usually called the target population.
Definition Population or target population A population consists of all elements – individuals,
items, or objects – whose characteristics are being studied. The population that is being studied is also called the target population.
Most of the time, decisions are made based on portions of populations. For example, the election polls conducted in the United States to estimate the percentages of voters who favor various candidates in any presidential election are based on only a few hundred or a few thousand voters selected from across the country. In this case, the population consists of all registered voters in the United States. The sample is made up of a few hundred or few thousand voters who are included in an opinion poll. Thus, the collection of a few elements selected from a population is called a sample.
Definition Sample A portion of the population selected for study is referred to as a sample.

30
Figure 1.1 illustrates the selection of a sample from a population.
Population Sample
The collection of in formation from the elements of a population or a sample is called a survey. A survey that includes every element of the target population is called a census. Often the target population is very large. Hence, in practice, a census is rarely taken because it is expensive and time-consuming. In many cases, it is even impossible to identify each element of the target population. Usually, to conduct a survey, we select a sample and collect the required information from the elements included in that sample. We then make decisions based on this sample information. Such a survey conducted on a sample is called a sample survey. As an example, if we collect information on the 2005 incomes of all families in Connecticut, it will be referred to as a census. On the other hand, if we collect information on the 2005 incomes of 50 families from Connecticut, it will be called a sample survey.
Definition Census and Sample Survey A survey that includes every member of the population is
called a census. The technique of collecting information from a portion of the population is called a sample survey.
Definition Representative Sample A sample that represents the characteristics of the population as
closely as possible is called a representative Sample.
A sample may be random or nonrandom. In a random sample, each element of the population has a chance of being included in the sample. However, in a nonrandom sample this may not be the case.

31
Definition Random Sample A sample drawn in such a way that each element of the population has
a chance of being selected is called a random Sample. If all samples of the same size selected from a population have the same chance of being selected, we call it simple random sampling. Such a sample is called a simple random sampling.
One way to select a random sample is by lottery or draw. For example, if we are to select 5 students from a class of 50, we write of the 50 names on a separate piece of paper. Then we place all 50 slips in a box and mix them thoroughly. Finally, we randomly draw five slips from the box. The five names drawn give a random sample. On the other hand, if we arrange all 50 names alphabetically and then select the first 5 names on the list, it a nonrandom sample because the students listed sixth to fiftieth have no chance of being included in the sample. A sample may be selected with or without replacement. In sampling with replacement, each time we select an element from the population, we put it back in the population before we select the next element. Thus, in sampling with replacement, the population contains the same number of items each time a selection is made. As result, we may select the same item more than once in such a sample. Consider a box that contains 25 balls of different colors. Suppose we draw a ball, record its color, and put it back in the box before drawing the next ball. Every time we draw a ball from this box, the box contains 25 balls. This is an example of sampling with replacement. Sampling without replacement occurs when the selected element is not replaced in the population. In this case, each time we select an item, the size of the population is reduced by one element. Thus, we cannot select the same item more than once in this type of sampling. Most of the time, sample taken in statistics are without replacement. Consider an opinion poll based on a certain number of voters selected from the population of all eligible voters. In this case, the same voter is not selected more than once. Therefore, this is an example of sampling without replacement.

32
1.4 Basic Terms It is very important to understand the meaning of some basic terms that will be used frequently in this text. This section explains the meaning of an element (or member), a variable, an observation, and a data set. An element and a data set were briefly defined in Section 1.2. This section defines these terms formally and illustrates them with the help of an example. Table 1.1 gives information on the 2004 profits (in millions of U.S. dollars) of seven U.S. companies. We can call this group of companies. Each company listed in this table is calls an element or a member of the sample. Table 1.1 contains information on seven elements. Note that elements are also called observational units.
Definition Element or Member An element or member of a sample or population is specific
subject or object (for example, a person, firm, item, state, or country) about which the information is collected.
Table 1.1 2004 Profits of Seven U.S. Companies
2004 Profits Variable
Company (millions of dollars) Wal-Mart Stores 10,267 Exxon 25,330
General Electrical Engineering 16,593 Citigroup 17,046 Home Depot 5001 Pfizer 11,361 Target 3189
The 2004 profits in our example is called a variable. The 2004 profits is a characteristic of companies that we are investigating or studying.
Definition Variable A variable is a characteristic under study that assumes different values for
different elements. In contrast to a variable, the value of a constant is fixed.
An element or a member
An observation or measurement

33
A few other examples of variables are the incomes of households, the number of houses built in a city per month during the past year, the makes of cars owned by people, the gross profits of companies, and the number of insurance policies sold by a salesperson per day during the past month. In general, a variable assumes different values for different elements, as does the 2004 profits of the seven companies in Table 1.1. For some elements in a data set, however, the value of the variable may be the some. For example, if we collect information on incomes of households, these households are expected to have different incomes, although some of them may have the same income. A variable is often denoted by x, y, or z. For instance, in Table 1.1, the 2004 profits of companies may be denoted by any one of these letters. Starting with Section 1.8, we will begin to use these letters to denote variables. Each of the values representing the 2004 profits of the seven companies in Table 1.1 is called an observation or measurement.
Definition Observation or Measurement The value of a variable for an element is called an
observation or measurement.
From Table 1.1, the 2004 profits of General Electric were $16,593 million. The value $16,593 million is an observation or measurement. Table 1.1 contains seven observations, one for each of the seven companies. The information given in Table 1.1 on 2004 profits of companies is called the data or a data set.
Definition Data Set A data set is a collection of observations on one or move variables.
Other examples of data sets are list of the prices of 25 recently sold homes, scores of 15 students, opinions of 100 voters, and ages of all employees of a company.

34
1.5 Types of Variables In Section 1.4, we learned that a variable is a characteristic under investigation that
assumes different values for different elements. The incomes of families, heights of persons, gross sales of companies, prices of college textbooks, makes of cars owned by families, number of accidents, and status (freshman, sophomore, junior, or senior) of students enrolled at university are a few examples of variables. A variable may be classified as quantitative or qualitative. These two types of variables are explained next.
1.5.1 Quantitative variables Some variable (such as the price of a home) can be measured numerically, whereas
others (such as hair color) cannot. The first is an example of a quantitative variable and second that of a qualitative variable.
Definition Quantitative variable A variable that can be measured numerically is called a
quantitative variable. The data collected on a quantitative variable are called quantitative data.
Incomes, heights, gross sales, prices of homes, number of cars owned, and number of accidents are examples of quantitative variables because each of them can be expressed numerically. For instance, the income of a family may be $41,520.75 per year, the gross sales for a company may be $567 million for the past year, and so forth. Such quantitative variables may be classified as either discrete variables or continuous variables.
Discrete variables The values that a certain quantitative variable can assume may be countable or
noncountable. For example, we can count the number of cars owned by a family, but we cannot count the height of a family member. A variable that assumes countable values is called a discrete variable. Note that there are no possible intermediate values between consecutive values of a discrete variable.
Definition Discrete variables A variable whose values are countable is called a discrete variable.
In other words, a discrete variable can assume only certain values with no intermediate values.

35
For example, the number of cars sold on any day at a car dealership is a discrete variable because the number of cars sold must be 0, 1, 2, 3,… and we can count it. The number of cars sold cannot be between 0 and 1, or between 1 and 2, A few other examples of discrete variables are the number of people visiting a bank on any day, the number of cars in a parking lot, the number of cattle owned by a farmer, and the number of students in a class.
Continuous Variable Some variables cannot be counted, and they can assume any numerical value between
two numbers. Such variables are called continuous variables.
Definition Continuous Variable A variable that can assume any numerical value over a certain
interval or intervals is called a continuous variable.
The time taken to complete an examination is an example of a continuous variable because it can assume any value, let us say, between 30 and 60 minutes. The time taken may be 42.6 minutes, 42.67 minutes, or 42.674 minutes. (Theoretically, we can measure time as precisely as we want) Similarly, the height of a person can be measured to the tenth of an inch or to the hundredth of an inch. However, neither time nor height can be counted in discrete fashion. A few other examples of continuous variables are weights of people, amount of soda in a 12-ounce can (note that a can does not contain exactly 12 ounces of soda), any yield of potatoes (in pounds) per acre. Note that any variable that involves money is considered a continuous variable.
1.5.2 Qualitative or Categorical Variables Variables that cannot be measured numerically but can be divided into different
categories are called qualitative or categorical variables. Definition Qualitative or Categorical Variable A variable that cannot assume a numerical value
but can be classified into two or more nonnumeric categories is called a qualitative or categorical variable. The data collected on such a variable are called qualitative data. For example, the status of an undergraduate college student is a qualitative variable because a student can fall into any one of four categories: freshman sophomore, junior, or senior. Other examples of qualitative variables are the gender of a person, hair color, and the make of a car.

36
Figure 1.2 illustrates the types of variable Variable
Quantitative Qualitative or categorical
(e.g., make of a computer, Discrete Continuous hair color, gender) (e.g., number of (e.g., length, age, houses, cars, height, weight, accidents) time) 1.6 Cross-Section Versus Time-Series Data
Based on the time over which they are collected, data can be classified as ether cross-section or time- series data.
1.6.1 Cross-Section Data Cross-section data contain information on different elements of population or sample
for the same period of time. The information on incomes of 100 families for 2005 is an example of cross-section data. All examples of data already presented in this chapter have been cross-section data.
Definition Cross-section data Data collected on different elements at the same point in time or for
the same period of time are called cross-section data.
Table 1.2 shows the leading daytime talk shows based on the average daily number of viewers from September 2003 to July 2004. Because this table presents data on the average daily viewers for seven shows for the same period (September 2003 to July 2004), it is an example of cross-section data.

37
Table 1.2 Leading Daytime Talk Shows Average Daily Viewers
Talk Show (millions) The Oprah Winfrey Show 8.6 Dr. Phil 6.5
Live With Regis and Kelly 4.7 Maury 4.1 Jerry Springer 3.3 Montel Williams 3.2 Ellen 2.2
Source: Neilsen Media Research; Syndicated Network Television. Data appeared in the New York Times. August 23, 2004.
1.6.2 Time-Series Data Time-series data contain information on the same element for different period of time.
Information on U.S. exports for the year 1983 to 2005 is an example of time-series data. Definition Time-Series Data Data colleted on same element for the same variable at different
points in time or for different periods of time are called time-series data.
The data given in Table 1.3 are an example of time-series data. This table lists the number of collisions between wildlife (mostly birds) and civilian aircraft that were reported for the years 1990, 1995, 2000, and 2002.
Table 1.3 Number of Collisions Between Wildlife and Civilian Aircraft
Year Number of Collisions 1990 1990 1995 2775 2000 6323 2002 6556 Source: U.S. Air Force, Federal Aviation Administration.
USA Today, October 15, 2003

38
1.7 Sources of Data The availability of accurate and appropriate data is essential for deriving reliable results.
Data may be obtained from internal sources, external sources, or surveys and experiments. Many times data come from internal sources, such as a company’s own personnel files or accounting records. For example, a company that wants to forecast the future sales of its product may use the data of past periods from its own records. For most studies, however, all the data that are needed are not usually available from internal sources. In such cases, one may have to depend on outside sources to obtain data. These sources are called external sources. For instance, the Statistical Abstract of the United States (published annually), which contains various kinds of data on the United States, is an external source of data. A large number of government and private publications can be used as external sources of data. The following is a list of some the government publications. 1. Statistical Abstract of the United States 2. Employment and Earnings 3. Handbook of Labor Statistics 4. Source Book of Criminal Justice Statistics 5. Economic Report of the President 6. County & City Data Book 7. State & Metropolitan Area Data Book 8. Digest of Education Statistics 9. Health United States 10. Agricultural Statistics Most of the data contained in these books can be accessed on Internet sites such as www.census.gov (Census Bureau), www.bls.gov (Bureau of Labor Statistics), www.ojp.usdoj.gov/bjs (Office of Justice Program, U.S. Department of Justice, Bureau of Justice Statistics), www.os.dhhs.gov (United States Department of Health and Human Services), and www.suda.gov/nass/pubs/agstats.htm (U.S. Department of Agriculture, Agricultural Statistics). Besides these government publications, a large number of private publications (e.g., Standard & Poors’ Security Owner’s Stock Guide and World Almanac and Book of Facts) and periodicals (e.g., The Wall Street Journal, USA TODAY, Fortune, Forbes, and Business Week) can be used as external data sources.

39
Sometimes the needed data may not be available from either internal or external sources. In such cases, the investigator may have to conduct a survey or experiment to obtain the required data. Appendix A discusses surveys and experiments in detail. 1.8 Summation Notation
Sometimes mathematical notation helps express a mathematical relationship concisely. This section describes the summation notation that is used to denote the sum of values. Suppose a sample consists of five books and the prices of these five books are $75, $80, $35, $97, and $88. The variable price of a book can be denoted by x. The prices of the five books can be written as follows: Prices of the first book = x1 = $75
Subscript of x denote the number of the book
Similarly, Prices of the second book = x2 = $80 Prices of the third book = x3 = $35 Prices of the fourth book = x4 = $97 Prices of the fifth book = x5 = $88
In this notation, x represents the price, and the subscript denotes a particular book. Now, suppose we want to add the prices of all five books. We have
x1 + x2 + x3 + x4 + x5 = 75 + 80 + 35 + 97 + 88 = $ 375 The uppercase Greek letter (pronounced sigma) is used to denote the sum of all values.
Using notation, we can write the foregoing sum as follows: x = x1 + x2 + x3 + x4 + x5 = $ 375
The notation x in this expression represents the sum of all the values of x and is read as “sigma x” or “sum of all values of x”.

40
Example 1-1
Annual salaries (in thousands of dollars) of four workers are 75 , 42 , 125 , and 61. Find
a. X b. 2)( X c.
2X Solution Let X1 , X2 , X3 , and X4 be the annual salaries (in thousands of dollars) of the first, second, third, and fourth worker, respectively. Then,
a. X = X1 + X2 + X3 + X4 = 75 + 42 + 125 + 61 = 303 หรอ 303,000 ดอลลาร
b. Note that 2)( X is the square of the sum of all X value. Thus
2)( X = (303)2= 91,809
c. The expression 2X is the sum of the squares of X values. To calculate
2X , we first square each of the X value and then sum these square values. Thus 2X = (75)2 + (42)2 + (125)2 + (61)2
= 5625 + 1764 + 15,625 + 3721 = 26,735

41
Example 1-2
The following table lists four pairs of m and f values.
m 12 15 20 30 f 5 9 10 16 Compute the following
a. m b. 2f c. mf d. fm2
Solution We can write m1 = 12 m2 = 15 m3 = 20 m4 = 30 f1 = 5 f2 = 9 f3 = 10 f4 = 16
a. m = 12 + 15 + 20 + 30 = 77
b. 2f = (5)2 + (9)2 + (10)2 + (16)2 = 25 + 81 + 100 + 256 = 462
c. To compute mf , we multiple the corresponding value of m and f and then add the products as follows:
mf = 44332211 fmfmfmfm = 12(5) + 15(9) + 20(10) + 30(16) = 60 + 135 + 200 + 480 = 875
d. To calculate fm2
, we square each m value, then multiply the corresponding 2m and f values, and add the products. Thus
fm2
= fmfmfmfm 2
4
2
3
2
2
2
1 = (12)2 (5) + (15)2 (9) + (20)2 (10) + (30)2 (16) = 21,145
The calculations done in parts (a) through (d) to find the values ofm ,2f ,
mf , fm2
can be performed in tabular form, as show in table 1.4.

42
Table 1.4
m f 2f mf fm2
12 5 (5)2 = 25 12(5) = 60 (12)2(5) = 720 15 9 (9)2 = 81 15(9) = 135 (15)2(9) = 2025 20 10 (10)2 = 100 20(10) = 200 (20)2 (10) = 4000 30 16 (16)2 = 256 30(16) = 60 (30)2 (16) = 14,400
m = 77 f = 40 2f = 462 mf = 875 fm2
= 21,145
The columns of Table 1.4 can be explained as follows:
1. The first column lists the values of m. The sum of these values gives m = 77.
2. The second column lists the value of f. The sum of this column gives f = 40. 3. The third column lists the squares of the f values. For example, the first value, 25, is the
square of 5. The sum of the values in this column gives 2f = 462.
4. The fourth column records products of the corresponding m and f values. For example, the first value, 60, in this column is obtained by multiplying 12 by 5. The sum of the
values in this column gives fm = 875. 5. Next, the m values are squared and multiplied by the corresponding f values. The
resulting products, denoted by fm2
, are recorded in the fifth column. For example, the first value, 720, is obtained by squaring 12 and multiplying this result by 5. The sum of
the values in this column gives fm2
= 21,145

43
Census A survey that includes all members of the population. Continuous variable A (quantitative) variable that can assume any numerical value over a certain interval or intervals. Cross-section data Data collected on different elements at the same point in time or for the same period of time. Data or data set Collection observations or measurements on a variable. Descriptive statistics Collection of methods for organizing, displaying, and describing data using table, graphs, and summary measures. Discrete variable A (quantitative) variable whose values are countable. Element or member A specific subject or object included in a sample or population. Inferential statistics Collection of methods that help make decisions about a population based on sample results. Observation or measurement The value of a variable for an element. Population or target population The collection of all elements whose characteristics are being studied. Qualitative or categorical data Data generated by a qualitative variable. Qualitative or categorical variable A variable that cannot assume numerical values but is classified into two or more categories.
Quantitative data Data generated by a quantitative variable. Quantitative variable A variable that can be measured numerically. Random sample A sample drawn in such a way that each element of the population has some chance of being included in the sample. Representative sample A sample that contains the same characteristics as the corresponding population. Sample A portion of the population of interest. Sample survey A survey that includes elements of sample. Simple random sampling If all samples of the same size selected from a population have the same chance of being selected, it is called simple random sampling. Such a sample is called simple random sample. Statistics Group of methods used to collect, analyze, present, and interpret data and to make decisions. Survey Collection of data on the elements of a population or sample. Time-series data Data that give the values of the same variable for the same element at different points in time or for different periods of time. Variable A characteristics under study or investigation that assumes different values for different elements.
Glossary

44
1.1 Briefly describe the two meaning of the word statistics. 1.2 Briefly explain the types of statistics 1.3 Briefly explain the terms population, sample, representative sample, random sample,
sampling with replacement, and sampling without replacement. 1.4 Give one example each of sampling with and sampling without replacement. 1.5 Briefly explain the difference between a census and a sample survey. Why is conducting a
sample survey preferable to conducting a census?
1.6 Explain whether each of the following constitutes a population or a sample. a. Pound of bass caught by all participants in a bass fishing derby b. Credit card debts of 100 families selected from a city c. Number of home runs hit by all Major League baseball players in the 2005 season d. Number of parole violations by all 2147 parolees in a city e. Amount spent on prescription drugs by 200 senior citizens in a large city
1.7 Explain whether each of the following constitutes a population or a sample. a. Number of personal fouls committed by all NBC players during the 2005-2006 season b. Yield of potatoes per acre for 10 pieces of land c. Weekly salaries of all employees of a company d. Cattle owned by 100 farmers in Iowa e. Number of computers sold during the past week at all computer stores in Los Angeles
1.8 Explain the meaning of an element, a variable, an observation, and a data set.
Exercises
CONCEPTS AND PROCEDURES
APPLICATIONS
CONCEPTS AND PROCEDURES

45
1.9 The following table gives the number of dog bites reported to the police last year in six
cities. City Number of Bites Center City 47 Elm Grove 32 Franklin 51 Bay City 44 Oakdale 12 Sand Point 3
Briefly explain the meaning of a member, a variable, a measurement, and a data set with reference to this table.
1.10 The following table lists the crude oil reserves (in billions of barrels) for six countries with the largest reserves as of June 2004.
Country Oil Reserves Saudi Arabia 261.7 Iraq 112.0 Kuwait 97.7 Iran 94.4 United Arab Emirates 80.3 Venezuela 64.0
Briefly explain the meaning of a member, a variable, a measurement, and a data set with reference to this table.
1.11 Refer to the data set Exercise 1.9. a. What is the variable for this data set? b. How many observations are in this data set? c. How many elements does this data set contain?
APPLICATIONS

46
1.12 Refer to the data set Exercise 1.10. a. What is the variable for this data set? b. How many observations are in this data set? c. How many elements does this data set contain?
1.13 Explain the meaning of the following terms. a. Quantitative variable b. Qualitative variable c. Discrete variable d. Continuous variable e. Quantitative data f. Qualitative data
1.14 Indicate which of the following variables are quantitative and which are qualitative. a. Number of persons in a family b. Color of cars c. Marital status of people d. Length of a frog’s jump e. Number of errors in a person’s credit report
1.15 Indicate which of the following variables are quantitative and which are qualitative. a. Number of typographical errors in newspapers b. Monthly TV cable bills c. Spring break locations favored by college students d. Number of cars owned by families e. Lottery revenues of states
1.16 Classify the quantitative variables in Exercise 1.14 as discrete or continuous. 1.17 Classify the quantitative variables in Exercise 1.15 as discrete or continuous.
CONCEPTS AND PROCEDURES
APPLICATIONS

47
1.18 Explain the difference between cross-section and time-series data. Give an example of each of these two types of data.
1.19 Briefly describe internal and external sources of data.
1.20 Classify the following as cross-section or time-series data. a. Liquor bills of a family for each month of 2005 b. Number of armed robberies each year in Dallas from 1992 to 2005 c. Number of homicides in 40 cities during 2005 d. Gross sales of 200 ice cream parlors in July 2005
1.21 Classify the following as cross-section or time-series data. a. Average prices of houses in 100 cities b. Salaries of 50 employees c. Number of cars sold each year by General Motors from 1980 to 2005 d. Number of employees employed by a company each year from 1985 to 2005
1.22 The following table lists five pairs of m and f values.
m 5 10 17 20 25 f 12 8 6 16 4
Compute the value of each of the following:
a.m b.2f c.mf d. fm2
1.23 The following table lists five pairs of m and f values.
m 3 6 25 12 15 18 f 16 11 16 8 4 14
Compute the value of each of the following:
a.m b.2f c.mf d. fm2
CONCEPTS AND PROCEDURES
APPLICATIONS
CONCEPTS AND PROCEDURES

48
1.24 The following table lists five pairs of x and y values.
x 15 22 11 8 5 y 10 12 14 9 18
Compute
a. x b. y c. xy d.2x e.
2y
1.25 The following table lists five pairs of x and y values.
x 4 8 25 9 12 20 y 12 5 14 7 12 8
Compute
a. x b. y c. xy d.2x e.
2y
1.26 Six adults spent $20, $14, $57, $23, $7, and $102 on lottery tickets last month. Let y denote last month’s lottery ticket expenses for an adult. Find
a. y b. 2)( y c.
2y
1.27 The phone bills for January 2006 for four families were $83, $205, $87, and $154. Let y be the amount of the January 2006 phone bill for a family. Find
a. y b. 2)( y c.
2y
1.28 Price (in thousands of dollars) of five new cars are 28, 35, 29, 54, and 18. Let x be the price of a new car in this sample. Find
a. x b. 2)( x c.
2x
1.29 The number of students (rounded to the nearest thousand) currently enrolled at seven universities are 7, 39, 21, 16, 3, 43, and 19. Let x be the number of students currently enrolled at a university. Find
a. x b. 2)( x c.
2x
APPLICATIONS

49
1.30 The following table gives the average attendance at interleague Major league baseball
games for the 1999 to 2004 seasons. Average Attendance at
Season Interleague Games 1990 33,352 2000 33,212 2001 33,692 2002 31,921 2003 30,894 2004 32,976 Source: USA TODAY, July 8, 2004
Describe the meaning of a variable, a measurement, and a data set with reference to this table.
1.31 The following table lists the number of Americans who took cruises during 1995 to 2004.
Total Year (millions)
1995 4.4 1996 4.7 1997 5.1 1998 5.4 1999 5.9 2000 6.9 2001 6.9 2002 7.6 2003 8.2 2004 9.0 Source: Cruise Lines International Association. USA TODAY, February 2, 2005
Describe the meaning of a variable, a measurement, and a data set with reference to this table.
Supplementary Exercises

50
1.32 Refer to Exercises 1.30 and 1.31. Classify these data sets as either cross-section or times- series.
1.33 Indicate whether each of the following examples refers to a population or to a sample.
a. A group of 25 patients selected to test a new drug b. Total items produced on a machine for each year from 1995 to 2005 c. Yearly expenditures on clothes for 50 persons d. Number of houses sold by each of the 10 employees of real estate agency during
2005
1.34 Indicate whether each of the following examples refers to a population or a sample. a. Salaries of CEOs of all companies in New York City b. Allowances of 1500 sixth-graders selected from Ohio c. Gross sales for 2005 of four fast-food chains d. Annual incomes of all 33 employees of a restaurant
1.35 State which of the following is an example of sampling with replacement and which is
an example of sampling without replacement. a. Selecting 10 patients out of 100 to test a new drug b. Selecting one professor to be a member of the university senate and then selecting
one professor from the same group to be a member of the curriculum committee
1.36 State which of the following is an example of sampling with replacement and which is an example of sampling without replacement. a. Selecting seven cities to market a new deodorant b. Selecting a high school teacher to drive students to a lecture in March, then selecting
a teacher from the same group to chaperone a dance in April
1.37 The number of shoe pairs owned by six women are 8 , 14 , 3 , 7 , 10 , and 5. Let x denote the number of shoe pairs owned by a woman. Find
a. x b. 2)( x c.
2x

51
1.38 The number of restaurants in each of five small towns is 4, 12, 8, 10, and 5. Let y denote the number of restaurants in a small town. Find
a. y b. 2)( y c.
2y
1.39 The following table lists five pairs of m and f values.
m 3 16 11 9 20 f 7 32 17 12 34
Compute the value of each of the following:
a.m b.2f c.mf d. fm2
e.2m
1.40 The following table lists five pairs of x and y values.
x 7 11 8 4 14 28 y 5 15 7 10 9 19
Compute the value of each of the following:
a. y b. 2x c. xy d. yx 2
e.2y

52
1. A population in statistics means a collection of all
a. men and woman b. subjects or objects of interest c. people living in a country
2. A sample in statistics means a portion of the a. people selected from the population of a country b. people selected from the population of an area c. population of interest
3. Indicate which of the following is an example of a sample with replacement and which is a sample without replacement. a. Five friends go to a livery stable and select five horses to ride (each friend must choose
a different horse). b. A box contains five balls of different colors. A ball is drawn from this box, its color is
recorded and it is put back into the box before the next ball is drawn. This experiment is repeated 12 times.
4. Indicate which of the following variables are quantitative and which are qualitative.
Classify the quantitative variables as discrete or continuous. a. Women’s favorite TV programs b. Salaries of football players c. Number of pets owned by families d. Favorite breed of dog for each of 20 children
Self – Review Test

53
5. The following table lists the total career yards rushed by each of the top ten rushers in the Nation Football League as of February 4, 2005.
Player Yards Emmitt Smith 18,355 Walter Payton 16,726 Barry Sanders 15,269 Curits Martin 13,336 Jerome Bettis 13,294 Eric Dickerson 13,259 Tony Dorsett 12,739 Jim Brown 12,312 Marcus Allen 12,243 Franco Harris 12,120 Source: USA TODAY, February 4, 2005.
Explain the meaning of a member, a variable, a measurement, and a data set with reference to this table.
6. The number of credit cards possessed by five couples are 2, 5, 3, 12, and 7. Let x be the
number of credit cards possessed by a couple. Find
a. x b. 2)( x c.
2x
7. The following table lists five pairs of m and f values.
m 3 6 9 12 15 f 15 25 40 20 12
Calculate
a.m b. f c.2m d.mf e. fm2
f.2f

54
INTRODUCTION TO STATISTICS
เสนอ อ.ดร.ณชชา มหปญญานนท
แปลโดย นางสาววนด เอยดแกว
รหส 521997239
งานแปลนเปนสวนหนงของวชาวธการทางสถตส าหรบการวจยและประเมน สาขาการวจยและประเมน คณะศกษาศาสตร
มหาวทยาลยทกษณ

55
ค าน า
งานแปลฉบบนเปนสวนหนงของวชาการวจยทางการศกษา ซงผแปลไดแปลจากหนงสอตางประเทศ และไดทาการแปลเปนบทความภาษาไทยเพอใหเกดความเขาใจงายขนและสะดวกในการนาไปใช ซงเปนเนอหาเกยวกบความร พนฐานทางสถตทใชเปนฐานในการศกษาเกยวกบสถตผเขยนหวงวางานแปลฉบบนจะเปนประโยชนกบผอานทกทานในการนาไปใช
ผเขยนตองขอขอบพระคณ อ.ดร.ณชชา มหปญญานนท เปนอยางยงททาใหผเขยนไดฝกการอานภาษาองกฤษไดอยางรวดเรวและเรยนรคาศพทใหม รวมไปถงศพทเฉพาะทางหรอศพทเทคนคมากมาย ซงสามารถนาความรทไดไปปรบใชในการศกษาตอไป หากการแปลครงนมความผดพลาดประการใดผเขยนกขอ อภยไว ณ ทนดวย
วนด เอยดแกว พฤศจกายน 2552

56
สารบญ เรอง หนา ผงมโนทศน บทนา 1.1 สถตคออะไร ………………………………………………………………………… 1 1.2 ประเภทของสถต ……………………………………………………………………. 2 1.3 ตวอยางละประชากร ………………………………………………………………… 3 1.4 คาพนฐาน …………………………………………………………………………… 5 1.5 ประเภทของตวแปร …………………………………………………………………. 7 1.6 ขอมลภาคตดขวางแลอนกรมเวลา …………………………………………………... 9 1.7 แหลงขอมล …………………………………………………………………………. 10 1.8 เครองหมายบวก …………………………………………………………………….. 11 อภธานศพท ……………………………………………………………………………… 15 แบบฝกหด ………………………………………………………………………………. 17 แบบทดสอบ ………………………………………………………..…………………… 23 อางอง …………………………………………………………………………………… 25 ภาคผนวก
- เอกสารตนฉบบ ………………………………………………………………… 26 - เฉลยแบบฝกหด ………………………………………………………………… 54 - เฉลยแบบทดสอบ ……………………………………………………………… 67

57
งมโนทศน โดยรวม
INTRODUCTION TO STATISTICS
ประชากรและตวอยาง
ความหมาย
เครองหมายบวก
แหลงขอมล
ประเภทของตวแปร
ค าพนฐาน
ประเภทของสถต
ขอมลภาคตดขวางและ
อนกรมเวลา
ขอเทจจรงหรอ
ตวเลข
วธการเกบรวบรวม
น าเสนอ วเคราะหและต
ควากมายขอมล
สถตพรรณนา
คอ การบรรยาย สถตอนมาน
คอ การอางอง
คาจากการ
สงเกต
ตวอยาง คอ สวน
หนงทเลอกจาก
ประชากร
องคประกอ
บ
ตวแปร
ประชากร คอ สงท
สนใจ
เชงคณภาพ
เชงปรมาณ
ตอเนอง
ไม
ตอเนอง
ภาคตดขวาง คอ
องคประกอบตางกนเวลา
เดยวกน
อนกรมเวลา คอ
องคประกอบเดยวกนเวลา
ตางกน
ภายในไดจากการ
บนทก
ภายนอกไดจากแหลงอน
เปนสญลกษณใช
แทนการบวก