aa pakistan: appraisal of the sali ty con ... - the world...
TRANSCRIPT

Report No. 1540a-PAK AA X
Pakistan: Appraisal of the Sali ty Cont rol ZdReclamation Project (SCARP) VI ILE COpNovember 10, 1977
Agriculture Division ASouth Asia Projects Department
FOR OFFICIAL USE ONLY
U
Document of the World Bank
This document has a restricted distribution and may be used by recipientsonly in the performance of their official duties. Its contents may nototherwise be disclosed without World Bank authorization.
Pub
lic D
iscl
osur
e A
utho
rized
Pub
lic D
iscl
osur
e A
utho
rized
Pub
lic D
iscl
osur
e A
utho
rized
Pub
lic D
iscl
osur
e A
utho
rized
Pub
lic D
iscl
osur
e A
utho
rized
Pub
lic D
iscl
osur
e A
utho
rized
Pub
lic D
iscl
osur
e A
utho
rized
Pub
lic D
iscl
osur
e A
utho
rized

CURRENCY EQUIVALENTS
US$1 = Rs 9.9Rs 1 = US$0.10
WEIGHTS AND MEASURES
English/US Units Metric Units
1 foot (ft) = 30.5 centimeters (cm)1 yard (yd) = 0.915 meters (m)1 mile (mi) = 1.609 kilometers (km)1 canal mile = 1.524 kilometers1 acre (ac) = 0.405 hectare (ha)1 square mile (sq mi) = 259 ha 31 cubic ft (cu ft) = 0.028 clbic meters (m )1 cubic yd (cu yd) = 0.765 m31 acre-foot (ac-ft) = 1,233 m31 cu ft/sec (cusec) = 0.028 m /secI pound (lb) - 0.454 kilograms (kg)1 long ton (lg ton) = 1,016 kg (1.016 metric tons)
Pakistani Units English Units Metric Units
1 maund (md) = 82.3 lb (.0367 lg ton) = 37.3 kg (.0373 m tons)26.8 mds = 2,205 lbs - 1.0 m ton27.2 mds = 1.0 lg ton (2,240 lbs) = 1,016 kg

MUR OWnCIAL USE ONLY
PRINCIPAL ABBREVIATIONS AkD TCRONYMS USED
ABL - Allied Bank Ltd.AO - Agricultural OfficerCB - Commercial BankCCA - Cultivable Commanded AreaCIDA - Canadian International Development AgencyEADA - Extra-Assistant Director of AgricultureGOP - Government of PakistanGOPunjab - Government of PunjabIBP - Indus Basin ProjectIRDP - Integrated Rural Development ProgramGM - General ManagerHBL - Habib Bank Ltd.MAF - Million ac-ftMCB - Muslim Commercial Bank Ltd.NRP - National Bank of Pakistan, Ltd.O&M - Operation and MaintenancePCC - Project Coordination CommitteePLLP - Precision Land Leveling ProjectPSC - Project Steering CommitteeSBP - State Bank of PakistanSCARP - Salinity Control and Reclamation ProjectUBL - United Bank LimitedWAPDA (NZ) - Water and Power Development Authority (Northern Zone)
GLOSSARY
Brassicas - Oilseed crops of the Brassica family.Xharif - The hot (summer) season (April to September).Patwari - Local official in charge of the watercourses.Markhaz - An administrative entity of the IRDP.Paddy - Threshed unmilled rice.Rabi - The cool (winter) season (October to March).Tehsil - The first subdivision of a District in the Punjab.
There are usually three or four tehsils in a District.
FISCAL YEAR
July 1 to June 30
This document has a restricted distribution and may be used by recipients only in the performanceof their official duties. Its contents may not otherwise be disclosed without World Dank authorization.


PAKISTAN
APPRAISAL OF THESALINITY CONTROL AND RECLAMATION PROJECT (SCARP) VI
Table of Corntents
Page No.
SUMMARY AND CONCLUSIONS ............................. i - ii
I. INTRODUCTION ........................................
II. BACKGROUND .. .................................. ...... 1
The Economy ........ ....... ...................Agriculture and Irrigation in the Indus Basin ....... 2Project Formulation ................................ . 3
III. THE PROJECT AREA .................... 4
General ......... . ..... ....................... . 4Climate ........................................................ 4Population ....................................................... 4Farm Size and Land Tenure .* ................. 5Soils and Topography ................................ 5Salinity and Alkalinity ..... ............. ... 5Waterlogging and Drainage .......................... 6Irrigation .......................................... 6Agricultural Production ..... ............. . 7Agricultural Supporting Services .... ............ 7Agricultural Credit ................................ . 7Primary Processing ...... ....................... ........ 7Storage .................................. 8Agricultural Inputs . .... ................... . 8Transport and Communications .. 8..................... 8
IV. THE PROJECT ......................... 8
Project Objectives ............................. . 8Project Components ....... .......................... . 9Water Supply, Demand and Quality .................... 14Implementation Schedule ............. .. .............. 15Project Costs ................................ ..... 0........... 16Financing ............... ............................ 19
This report is based on the findings of an Appraisal Mission comprisingMessrs. A. Seager, M. Fireman, C. J. Perry (IDA) and W. Backiewicz, J. B.Downs and H. Vieilhescaze (Consultants) who visited Pakistan in October/November 1976.

-2-
Table of Contents (cont'd)
Page No.
Procurement ..................... .................... 19Disbursements .............. ... .... 20Accounts and Audit ...... ... ............................ 21
V. ORGANIZATION AND MANAGEMENT ................ . ......... 21
Project Implementation ... & ......................... 21Agricultural Supporting Services ............ *....... 22Consultants .............. . ......................... 22Coordination of Works ... ..................... . . 23Operation and Maintenance ...................... 23Cost Recovery .......... . ............................. 24
VI. PRODUCTION, MARKET PROSPECTS, PRICES ANDFARM INCOME ....................................... 26
Future Cropping Patterns and Yields ....... .. ........ 26Market Prospects ...... .................... .... .... 27Prices ........... 27Farm Incomes . ............ 28
VII. BENEFITS AND JUSTIFICATION .......................... 29
Anticipated Overall Effects ................. . . ....... 29Production Benefits ............... .. ........ ...... 29Employment Effects ................................. 29Income Distribution ................................ 29Economic Evaluation ................................ 29Project Risk . ............. ....... ... .0.... ........ . 30
VIII. AGREEMENTS REACHED AND RECOMMENDATIONS .... .......... 31

ANNEXES
1. Project Area Climatic Data2. Soils and Drainage3. Groundwater: Recharge, Quality and Levels4. Project Works:
A. Canal RemodelingB. Well Field Design, Well Construction and Operating CostsC. Saline Effluent DisposalD. Electricity Distribution NetworkE. Project Area Operation and Maintenance
5. Land Leveling and Reclamation6. Agricultural Credit7. Consulting Services8. Equipment List9. Water Demand, Supply and Quality10. Implementation Schedule11. Estimated Schedule of Expenditures, Proposed Credit Allocation,
and Schedule of Credit Disbursements12. Organization and Management13. Agricultural Supporting Services14. Draft Terms of Reference for Study of Agricultural Pricing
and Water Charges15. Present and Future Cropping Patterns and Production16. Agricultural Inputs and Crop Budgets17. Prices, Incomes and Farm Budgets18. Economic Analysis


PAKISTAN
APPRAISAL OF THESALINITY CONTROL AND RECLAMATION PROJECT (SCARP) VI
SUMMARY AND CONCLUSIONS
i. Irrigated agriculture has always dominated the economy of Pakistan.At present, it is practiced on about 30 M ac, accounts for about one-thirdof the GDP, employs about one-third of the labor force, and contributes over90% to total agricultural production. In the recent past, production hasbeen significantly boosted by the introduction of high yielding varieties ofcereals, mainly wheat and rice, a sizeable increase in fertilizer consumptionand a large increase in the number of private tubewells to augment irrigationsupplies. However, future progress is hampered by increasing waterloggingand salinization of the soils and by the fact that the existing irrigationcanal system cannot divert more of the abundant kharif (summer) river flows.
ii. The SCARP VI area comprises the southernmost district of the Punjabprovince and extends to about 1.5 M ac cultivable commanded area (CCA). Ofthis, the Government of Pakistan (GOP) is already developing Unit 1, 200,000ac. The project considered in this report consists of Units II, III, IV, andV, embracing an area of 1.27 M ac. 1/
iii. The proposed project would lower the groundwater table by tubewells,control it at levels which would not impede agricultural development andwould prevent soil salinization. In the areas where the groundwater is fresh,it would be used for irrigation. In the saline groundwater areas, the pumpedwater would be conveyed by drains into evaporation ponds in the CholistanDesert. The existing canals would be enlarged to use more of the surpluskharif river flows. The electrification network would be expanded to energizeabout 1,180 public tubewells and five effluent pumping stations. Agriculturalcredit would be made available to assist farmers in constructing tubewells forrabi (winter) irrigation in Unit III and for land leveling.
iv. Total project costs, net of taxes and duties of US$3.6 M, areestimated at US$166.4 M equivalent. These costs include a foreign exchangecomponent of US$46.5 M equivalent. The GOP has tentatively secured a grantof US$15 M equivalent from the UK and a credit of US$8.3 M equivalent fromthe Federal Republic of Germany. Together with the proposed IDA credit ofUS$70 M equivalent, the grant and credits would finance all the foreignexchange cost and 39% of the local cost of the project, or 56% of the totalproject costs. Project implementation would take six years; the first yearwould be spent mainly on final design, procurement of equipment and prepar-ation of tender documents for civil works.
1/ Throughout this report, the IDA project area is referred to as SCARP VI.
- ii -
v. The Water and Power Development Authority (WAPDA), a GOP agency,would be responsible for the construction of the civil works and the procure-ment of equipment, including components for electrification. The Departmentof Agriculture of the Government of Punjab (GOPunjab) would procure anddeploy tractors and scrapers for land leveling and would provide the necessarylaboratory and other facilities to advise on soil reclamation. Refinancingof 50% of credits given to farmers by commercial banks for on-farm investmentswould be made by GOP through the State Bank of Pakistan (SBP). A ProjectCoordination Committee based in the project area and consisting of represen-tatives of all the agencies responsible for various aspects of the project andrepresentatives of the farming community would ensure coordination duringproject implementation at the project level. A Project Steering Committee inLahore, with members of secretary rank representing the concerned departmentsof GOPunjab, would coordinate the work and its related aspects (finance,administration, etc.) at the policy level.
vi. A grant from the United Kingdom would finance all earthmoving equip-ment required for canal remodeling, the full foreign exchange cost and aproportion of the local costs of the drainage disposal system in Unit V, andother imported equipment required for project execution. Canal remodelingworks which are not suitable for international competitive bidding (ICB) wouldbe awarded after local competitive bidding (LCB). Contracts for electrifica-tion works would be let through by ICB; WAPDA would supply all components whichit would procure through a credit from the Federal Republic of Germany. Landleveling and private tubewell corstruction would be carried out by localcontractors under contract with the farmers. Construction contracts fortubewells in Units II and V would be awarded after ICB in accordance with BankGroup guidelines.
vii. Main project benefits would come about from a 33% increase inannual crop production and a 46% increase in the net value added. Productionof grain crops (rice, maize, millets and wheat) would increase from 225,000tons at present to 519,000 tons at full project development. Seed cottonwould increase from 150,000 tons to 260,000 tons. Some 100,000 farmingfamilies would benefit -- 60% of whom are farmers with land holdings lessthan the average of 12.5 ac. The economic rate of return on project invest-ment would be about 19%.
viii. The project is suitable for an IDA credit of US$70 M equivalent.The Borrower would be the Islamic Republic of Pakistan.
PAKISTAN
APPRAISAL OF THESALINITY CONTROL AND RECLAMATION PROJECT (SCARP) VI
I. INTRODUCTION
1.01 The Government of Pakistan (GOP) has requested a credit of US$70 Mequivalent to assist the construction of the Salinity Control and ReclamationProject (SCARP) VI in the southern Punjab. This would be the third credit byIDA to assist GOP's program to control salinity and waterlogging in the IndusBasin. The first project, SCARP Khairpur, was completed in 1971, and haslargely fulfilled its expectations. Implementation of Khairpur II, a tiledrainage project, has only recently begun and cannot as yet be evaluated.
1.02 The present project was identified in the Bank's Indus Special Study(ISS) Report of 1967. The Feasibility Report of the project was prepared forthe Water and Power Development Authority (WAPDA) of GOP by the ConsultingEngineering firm of Tipton and Kalmbach of the United States in 1968. In 1975,Sabasun Technical Services, a Pakistani consultant firm, updated the report.The present report is based on the findings of an Appraisal Mission comprisingMessrs. A. Seager, M. Fireman and C.J. Perry (IDA) and W. Backiewicz, J.B.Downs and H. Vieilhescaze (Consultants) who visited Pakistan in October/November 1976.
II. BACKGROUND
The Economy
2.01 Pakistan covers about 197 M ac of which only about 47 M ac or 24%are cultivable. Of this, about 33 M ac are irrigated, mostly by the IndusRiver and its tributaries. Population is around 73 M and increasing at about3% per annum.
2.02 Following a decade during the 1960s of sustained and rapid economicgrowth, Pakistan's economy stagnated during the early 1970s. This was causedby a variety of factors: in the agricultural sector the impact of the highyielding varieties introduced in the mid-1960s and the rapid growth of invest-ment in private tubewells began to fade; in industry, the disruption of theseparation from Bangladesh and the deterioration in terms of trade due pri-marily to increased oil prices were the main causes of reduced growth. Asa result, per capita income in 1975 was little different from that in 1970(Rs 1,435). In 1976, there were signs of revival in economic activity, en-couraged by GOP's action to increase resource mobilization and, in the agri-cultural sector, to improve prices paid to farmers which, by the early 1970shad deteriorated relative to both world prices and the internal price ofinputs. The present six-year plan projects substantial annual increases inagricultural production (4.5%), which would make Pakistan self-sufficient inwheat and increase exports of cotton and rice sharply. However, a growth

- 2 -
rate of 3% to 4% per annum would appear a more realistic projection. Thetechnological base to sustain such a rate has existed since the second half ofthe 1960s and 3-4% growth could he achieved, given reasonable price incentivesfor inputs and outputs and improvrements in the agricultural extension service.
Agriculture and Irrigation in the Indus Basin 1/
2.03 As rainfall on the Indtis Basin plains, especially in the south,is inadequate for satisfactory crop growth, irrigation from rivers, using thehigh monsoonal summer flows, has been a feature of agricultural productionsince about 2500 B.C. Since the 1870s, barrages have been constructed ena-bling year-round irrigation. The surface system, the largest basin system inthe world, was completely controlled by barrages by 1963. The use of ground-water, where suitable, while always an integral feature of the system, hasdeveloped very rapidly since the early 1960s. At present, some 160,000 tube-wells are in operation. Storage reservoirs on the Indus at Tarbela (9.-3 M ac-ftcapacity) and Chasma (0.9 M ac-ft) and Mangla (5.4 M ac-ft) on the Jhelum,augment winter flows. The area aad production of the major crops, almostentirely a function of water from the rivers, wells and reservoirs, isapproximately as follows:
Wheat {ice (Milled) Cotton (Seed) Sugarcane
Area (M ac) 15.1 3.1 4.6 1.5Production (M tons) 8.5 2.4 1.9 22.7Yield (tons/ac) 0.6 0.66 0.45 14.5
Of the major crops, cotton is especially subject to seasonal variations inyield due to floods and insect pests.
2.04 Drainage, a vital adjunct to irrigation, was not provided on anyscale until the 1960s and therefore the water table has risen in many areasto levels where it hampers crop pioduction. Also, irrigation water is oftenthinly spread, allowing salts to tuild up in the crop root zones. Consequently,waterlogging and salinization have impeded production in many areas, as thefollowing figures show:
1/ For a more detailed description see Pakistan Special Agricultural SectorReview (922a-PAK, 1976).

-3-
Indus Basin Punjab ProvinceM ac % of CCA 2/ M ac % of CCA Ia
WaterloggingSevere (wazer tableless than 5 ft) 6.5 16.7 2.6 10
Moderate 10.4 26.7 5.2 20
Total Affected 16.9 43.4 7.8 30
SalinitySevere 9.1 23.3 2.6 10Slight to Moderate 10.4 26.7 7.8 30
Total Affected 19.5 50.0 10.4 40
/a CCA = Culturable Commanded Area. The figures are not cumulative or selfexclusive: land may be affected by waterlogging, or salinity, or both.
2.05 The Government's Salinity Control and Reclamation Program (SCARP)was conceived in the late 1950s. Its first project became operational in1963. To date, more than 8,000 publicly owned tubewells have been installedin both saline and fresh groundwater areas, mainly to lower the water tableand, where possible, to enable reclamation and increase irrigation. Privateenterprise has installed over 150,000 tubewells in areas where the ground-water is suitable for irrigation. However, in areas where the groundwater issaline, and in fresh groundwater areas where the water table is so high thatprofitable irrigation cannot take place without first lowering the water table,little or no private groundwater development has taken place.
Project Formulation
2.06 In many parts of the SCARP VI area, in both the fresh and salinegroundwater zones, the water table is so high that it interferes with profit-able agriculture. Consequently, fresh water tubewell development, while sub-stantial, lags behind that of the rest of the Punjab. In addition to theeffects of the high water table, some of the soils have become saline due todeliberate under-irrigation by farmers. Consequently, in 1967 the ISS reporthad established that remedial action would be necessary to lower the watertable, dispose of saline effluent and to provide more irrigation water toleach the salt-affected soils. A project plan was prepared in 1968. In 1973,when the Federal Planning Commission prepared its "Proposals for an AcceleratedProgram for Salinity and Waterlogging Control", the need for the project wasreaffirmed.

-4-
III. THE PROJECT AREA
General
3.01 The SCARP VI area is in the Bahawalpur Division of the Punjab. Itcovers about 1.7 M ac, of which 1.47 M ac are canal commanded. It is oblongin shape: about 25 mi wide and about 100 mi long. It is bounded by theCholistan Desert to the east and the Indus River to the west.
3.02 The project area has been divided into five units for developmentpurposes, according to a combination of irrigation regime and the quality ofunderlying groundwater (Map 12601). Unit I, which has fresh groundwater, isalready being developed by WAPDA by installing tubewells which will eventuallybe operated and maintained by the Irrigation Department; the groundwater willbe used conjunctively with canal waters. It comprises about 200,000 ac. Theproposed IDA project comprises Units II to V, totalling 1.27 M ac. Of these,Units IV and V (76,000 ac and 464,000 ac, respectively) are mainly perenniallyirrigated by surface systems and underlain by saline groundwater; Units II andIII, 340,000 ac and 390,000 ac respectively, receive non-perennial surfaceirrigation and are underlain by fresh groundwater, as shown in the tablebelow:
Perennially Seasonally TotalIrrigated Irrigated Irrigated Groundwater
------------------- ('000 ac CCA) -----------------
Unit II 10 330 340 FreshUnit III - 390 390 FreshUnit IV 72 4 76 SalineUnit V 419 45 464 Saline
Total 501 769 1,270
Climate
3.03 The climate is arid. Annual rainfall averages under four incheswith most occurring in July and August. There are two main seasons: therabi (winter) and the kharif (sumimer). In the rabi (October-March), humi-dity is low and low temperatures keep monthly pan evaporation below threeinches per month (Annex 1). Frost in December and January is not uncommon.Generally, cloud cover is slight. In the kharif (April-September), humidity ishigher and temperatures may reach 118°F and rarely drop below 80 0F. Panevaporation is then up to eight inches per month. Wind velocities aregenerally low but in the kharif cccasional sand storms occur.
Population
3.04 The population of the project area is approximately 1.4 million; 80%live in the rural areas, and the total agricultural labor force is estimatedat 300,000. The main towns in the area are Rahimyar Khan (population 74,000),Khanpur (60,000) and Sadiqabad (55,000).

-5-
Farm Size and Land Tenure
3.05 The distribution of farm sizes within the project area is shownbelow.
Farm Size % of Total % of Total(ac) Farms Area
0 - 2.5 6 12.5 - 7.5 21 77.5 - 12.5 30 2012.5 - 25 30 3225 - 50 10 20
over 50 3 20
Present legislation limits land holdings to 150 ac of irrigated land. Of thetotal cultivated area of the project, 45% is farmed by the owner and 55% bytenants. However, many farm units, amounting to 25% of the project area,comprise both operator's own land and land rented or leased. The reasonis as much an effort to augment farm units as to consolidate them. Consequently,individual landowners may well be lessors and lessees of land. The predominanttenancy arrangement provides that all taxes and water charges are paid by thelandowner; seasonal input costs, and the crop, are shared equally betweentenant and owner. However, tenants grow fodder entirely for their own use andin return provide work animals for the farm; the landlord provides housing forhis tenants and credit for inputs.
Soils and Topography
3.06 Soils in the project area are mostly coarse to medium textured, cal-careous and therefore slightly alkaline, low in organic matter and nitrogen,low to moderately low in phosphorous and well supplied with potash. Most ofthe soils are quite permeable, well aggregated and non-erosive, have moderatewater holding capacities and are resistant to alkali hazards. In short, theproject area soils are as good and have as high a development potential as anyin Pakistan. Except along the edge of the Cholistan Desert where there aresand dunes, the land is relatively flat. Its slopes are of the order of 1 in5,000, towards the south/southeast along the course of the Indus River andtowards the Cholistan Desert. Natural drainageways are ill-defined and in-adequate. Soil salinity and alkali problems, and waterlogging exacerbated byirrigation for the last five decades, now affect a considerable proportion ofthe project area (Annex 2).
Salinity and Alkalinity
3.07 On the basis of a soil survey comprising approximately 11,000samples, it is evident that approximately 350,000 ac is sufficiently salineto affect crop growth. Some 160,000 ac of this area, also require alkalireclamation. The remainder would require only leaching with about 2 ft

- 6 -
of water for complete restoration of productivity. The alkali soils wouldrequire chemical amendment (up to 5 tons/ac of gypsum), followed by leachingwith 2 ft of water to make them economically productive (Annex 2). All recla-mation works would depend on effective control of the water table.
Waterlogging and Drainage
3.08 The water table is at c, ft or less under 10% of the project area,and between 5 and 10 ft under a further 50Z - a considerably higher levelthan in most of the Province. The high water table impairs crop growth andcontributes to soil salinization.
Irrigation
3.09 For several centuries the project area was irrigated by inundationcanals that tapped the high flows of the river during the kharif. Rabi crop-ping was supported either by residual moisture from kharif inundations or byopen wells. Most of the 18,000 dug vells date from this period; some 9,000are still in use. In 1930, the whole project area came under controlled canalirrigation from the Panjnad Barrage, commanded by the Panjnad canal (CCA 1.35 Mac) and the Abbasia canal (CCA 154,000 ac). About one-third of the total areais perennially irrigated.
3.10 The Indus Waters Treaty of 1960 between India and Pakistan reservedthe total flows of the Indus Basin's three eastern rivers (the Ravi, Beasand Sutlej) for India. HistoricaLly, most of the project area's water supplywas provided by the Sutlej. Therefore, under the Indus Basin Project (IBP)replacement works, the Taunsa-Paninad Link Canal connecting the Indus and theJhelum, was constructed. It has a capacity of up to 12,000 cusecs. Sincekharif flows in the Indus are sufficient, supplies in the Panjnad River (as thejoint Jhelum-Sutlej River is called) can, in most years, be augmented to supplythe projected needs of the SCARP 1V area at the Panjnad Barrage.
3.11 Areas with fresh groundwater (Units II and III) were designed forkharif canal irrigation only (non-perennial). The rabi supplies were to comefrom wells. Between 1932 and 1976, over 5,000 tubewells were installed in theproject area, about 4,600 since 1'l65 and 1,300 since 1974. Most tubewells arearound 1 cusec capacity. The tubewells in non-perennial areas are mostly usedwhen the canals do not run; the few tubewells in the perennial areas (Units IV& V) are used conjunctively with canal waters. All but about 1% of the tube-wells are privately owned and operated. The dug wells that are still opera-tional are mostly run by Persian uheels.
3.12 The canal system is operated and maintained by the Irrigation De-partment (ID) of the Ministry of Public Works and Irrigation of GOPunjab.Water allocation to individual farmers is supervised by the patwari (an offi-cial of the Irrigation Department) who is supposed to ensure that each farmertakes water for the number of hours to which his landholding and croppingpattern entitle him. There is a water charge for each irrigated acre; therate varies from crop to crop (para 5.13). Watercourse channels (which carry
- 7 -
water to the farms from the ID's canals) are maintained collectively by all
the landowners served. The standard of maintenance is highly variable andin general less than optimal.
Agricultural Production
3.13 The principal cash crops are cotton in the kharif, wheat in the rabiand sugarcane which is perennial, occupying in all some 70% of the totalcropped area. Other important crops are rabi and kharif fodder for the workand milch animals (18-19%), rice and millets in the kharif, and pulses andoilseeds in the rabi (7-8%). The balance (3-5%) is taken up by orchards,vegetables and miscellaneous crops. While the cotton and wheat area is showinga slight increase over time in some localities, there is substitution bymillets, rice and pulses in areas where waterlogging and salinity are on theincrease.
Agricultural Supporting Services
3.14 Agricultural Extension is under the control of the Extra-AssistantDirector of Agriculture (EADA) in Rahimyar Khan, who reports to a DeputyDirector (DDA) in Bahawalpur. He has 20 Agricultural Officers (AO) to whom84 Field Assistants (FAs) report. There are 147 foreman-laborers (beldars)who handle sprayers and pesticides and assist farmers with spraying (mostlycotton and orchards). An agronomist and a plant protection specialist providetechnical support to the field staff. A statistical section collects relevantinformation on production trends and crop yields.
3.15 The extension service suffers from lack of staff housing and trans-port, as well as a shortage of extension materials. Further, it has inadequateresearch backing. This is to be corrected, however, under an extension andresearch project for the Punjab, which IDA is currently appraising.
3.16 The Agricultural Engineering Section of the Agriculture Departmentassists with physical land reclamation through land leveling and gives adviceand assistance with private tubewell design and installation.
Agricultural Credit
3.17 Short- and medium-term agricultural credit is primarily providedby the 103 branches of the five nationalized commercial banks: the NationalBank of Pakistan (NBP), Habib Bank Ltd. (HBL), United Bank Ltd. (UBL), MuslimCommercial Bank Ltd., (MCB) and Allied Bank Ltd. (ABL). They entered intoagricultural lending operations in 1972 under the GOP-sponsored agriculturalsmall loans scheme. Interest rates are 12%. Due to decentralization of
sanctioning power, loans are processed fairly quickly.
Primary Processing
3.18 Cotton ginning and cottonseed pressing are major industries withsufficient installed capacity in the 29 ginneries and 17 screw-type expellerplants to handle more than the already substantial cotton crop. The cotton
ginning industry was nationalized at the beginning of the 1976-77 season.

-8-
3.19 Flour and pulse milling and rice husking are small-scale industries,widely scattered in villages and provide for needs of rural populations. Theurban centers mainly receive flour and rice from plants outside the projectarea.
Storage
3.20 The project area produces surplus wheat which is procured by theGovernment, and also small surpluses of other crops in good years. In 1975and 1976, when production levels were high, storage facilities were inadequate,and the Government had to store in unsuitable buildings and even in the open,under tarpaulins. There is a clear need for additional storage facilities, andrequirements are to be the subject of a study funded by the Canadian Interna-tional Development Agency (CIDA). Terms of reference for the study will bejointly defined by CIDA and the Bank Group.
Agricultural Inputs
3.21 Fertilizers are in adequate supply and are available from about 100privately operated sales points within the project area. Pesticides are soldby the agricultural extension services and by dealers appointed by the majorpesticide distributors. Commercial seed supplies are of poor quality andfarmers tend to keep their own whenever feasible. The IDA-financed seedsproject (Cr. 620-PAK) is expected to provide certified cotton, wheat and riceseeds for sale within the next few years.
Transport and Communications
3.22 Road and rail communica:ions in the project area are adequate. Thedouble track Karachi-Khanewal-Lahore railway line traverses its full length.A branch line from Khanpur extends to Chachran, on the Indus. Sections ofthe Karachi-Peshawar national higlhway and other major metaled roads, allin good repair, total about 400 m:. The extensive unmetaled village roadnetwork is constantly being upgracled. Agricultural commodities are movedto the primary and secondary markets by road, in trucks, oxcarts or oncamels. Exports to other parts of Pakistan, mainly of wheat and ginnedcotton, go by rail.
IV. THE PROJECT
Project Objectives
4.01 The project works and supporting services would:
(a) lower and control the groundwater table at levels which wouldfacilitate agricultural development and would prevent soilsalinization;

-9-
(b) provide increased surface water deliveries, mainly in thekharif when there is surplus water in the rivers, to giveadequate supplies for good irrigation management practicesand higher cropping intensity;
(c) provide safe disposal of saline groundwater;
(d) provide additional rabi irrigation to non-perennial areasby increased exploitation of fresh groundwater in thepublic and private sectors; and
(e) level and reclaim land which is saline and uncultivated.
Project Components
4.02 Unit I is already being developed by WAPDA. In Units II to V, theproject would have the following major components:
In all Units:
(a) the irrigation canals would be remodeled and new water-courses constructed, to convey the increased suppliesneeded for more intensive and adequate kharif irrigation;
(b) equipment, technical assistance and credit would be madeavailable to farmers for coarse and fine land leveling,estimated to be required on about 100,000 ac;
(c) gypsum would be provided to enable the reclamation of approxi-mately 40,000 ac of alkaline land;
In addition, the following would be carried out in individual Units:
(d) in Unit II, (seasonally irrigated, fresh groundwater):
(i) the construction of about 800 public tubewells, rangingin size from 2 to 3 cusecs, with a total capacity ofabout 2,000 cusecs for rabi irrigation and conjunctiveuse with the canals in kharif to control the water table;
(ii) the construction of 135 public tubewells of 3 cuseccapacity and appurtenant works to enable surplus waterto be discharged into canals for use downstream.
(e) in Unit III (seasonally irrigated, fresh groundwater), pro-vision of credit and technical advice to farmers for theinstallation of about 2,300 private tubewells (1/2 - 1-1/2cusec) for rabi irrigation;
(f) in Unit IV, where the groundwater is saline but is at a safedepth for the time being, only the works shown under (a) (b)and (c), above, are required.

- 10 -
(g) in Unit V (perennially irrigated, saline groundwater):
(i) construction of 2'O public tubewells of 3 cuseccapacity to drain about 300,000 ac and tostabilize the groundwater level at an averageof about 7-8 ft (the remaining 163,000 ac ofUnit V have lower groundwater levels at present);
(ii) construction of a drainage disposal system for thesaline effluent which would be taken into five eva-poration ponds to be built in the Cholistan Desert;
(h) construction of an electrification network to energize allpublic tubewells in Units II and V and five pumping stationson the drainage system in the Cholistan Desert;
Provisions would also be made for:
(i) increasing the availabiLity of credit through the nationalizedcommercial banks for private tubewells and land leveling;
(j) engaging consultants to assist WAPDA in the final design andin the supervision of construction of the project, to prepareoperating manuals and o'>ganize the monitoring of projectbenefits;
(k) procuring vehicles and i!quipment necessary for projectexecution aitd subsequent management; communications andmini-computer equipment for improved operation of the exist-ing and proposed irrigaiion and drainage works in the wholePanjnad Barrage command:
(1) providing equipment and vehicles for an existing soilslaboratory enabling it to expand its activities to adviseon, and monitor the progress of, saline and alkali soilreclamation;
(m) procuring surveying instruments as an aid to the systematicplanning and execution cf land leveling; and
(n) consultant services to assist WAPDA in the final designof new projects, including those identified under theongoing preparation of a Revised Action Plan, which isfinanced by UNDP, and for which the Bank is theexecuting agency.
4.03 Details of the groundwater situation are described in Annex 3. Themajor project civil works are described in Annex 4 and summarized below.
4.04 Canal remodeling, including the construction of new watercourses,will be necessary to provide additional water in the kharif, first for recla-mation of saline and alkali land bi leaching and later to meet the needs of

- ii -
expected higher kharif cropping intensities. The new and remodeledwatercourses would be built to the same standard as required under GOPunjab'sOn-Farm Development Project currently being undertaken jointly with USAID.Water made available at peak irrigation requirement would be increased fromthe present 1 cusec per 100-130 ac irrigated to about 1 cusec per 75 ac.Allowing for the anticipated pumping regime of the Unit II tubewells, thepeak flow in the Panjnad and Abbasia canals would have to be increased to13,000 cusecs and to 1,250 cusecs respectively. These higher flows wouldrequire that the branch canals, distributaries, minors and structures beenlarged and some additional parallel minors constructed. Watercourses whichare at present carrying in excess of 1-1/2 cusecs would not be enlarged sincewater management becomes increasingly difficult and inefficient at higherdelivery rates. Instead, additional watercourses would be built.
4.05 Land Levelirg would be carried out by contractors and farmers onapproximately 100,000 ac which is now saline and therefore out of cultivation.This land would need leveling before it could be effectively leached and,subsequently, cropped. Leveling to the standards of the ongoing PrecisionLand Leveling Project (PLLP) is estimated to cost about Rs 1,000 per ac. Thetask would be aided by the provision of suitable agricultural tractors andscrapers and by training and equipping staff in the Agricultural EngineeringSection to help farmers organize the work efficiently and on a technicallysound basis (para 4.17 and Annex 5). Credit would be made available tosupport this work (para 4.14).
4.06 Land Reclamation using gypsum to combat alkalinity would be neededon about 160,000 ac. Such work would only be effective after the drainage,provided under the project, is installed. Consequently, it is expected thatduring the implementation time of this project only about 40,000 ac would beready for reclamation by these means. Properly prepared for marketing anddistributed in bulk, the gypsum should cost about Rs 200 per ton at retailsales points; about 5 tons per ac would be required. This technique has notbeen previously used in Pakistan and much work is required to develop waysof efficiently working gypsum deposits, preparing the material in a formsuitable for farm use and establishing suitable means of transport and dis-tribution. Given the need for development work and the possibility ofinitially high costs, the gypsum required during project implementation wouldbe a project cost. Agreement was reached during negotiations with GOPunjabthat: (i) by June 30, 1978, it would have prepared and discussed with IDAplans, and a related implementation schedule, to ensure supplies of gypsumto project area farmers, and (ii) annually, during the project implementationperiod, it would discuss with IDA the price to be paid by farmers for gypsumand any subsidy to be granted to its users.
4.07 In Unit II fresh groundwater development would be in the publicsector. This is justified and necessary because a major source of highgrotndwater levels is excessive leakage from the major canals passing throughthe area (estimated to be about 365,000 ac-ft/yr at present). Canal liningwould be difficult and expensive since the main canals are perennial and

- 12 -
would have to be by-passed during lining. The recharge to the aquifer in thearea under full project development is expected to be around 965,000 ac-ft perannum, which would be developed approximately as follows:
Tubewell Capacity (cusecs) No.
Irrigation ( 2.0 286wells ( 2.5 160
( 3.0 350Export wells 3.0 135
Total - 931
The water from the irrigation wells would be discharged directly into thewatercourses and would be used vainly in the rabi when surface supplies arenot available. The annual utilization factor would be about 47% or 4,150hours per well. The 135 export tubewells of 3 cusec capacity would pumpexclusively to lift water into the canal system, to be conveyed to Unit V.These wells would operate at 70% utilization or about 6,150 hours a year.
4.08 In Unit III, the groundwater would be developed in the private sector.The groundwater level in this Unit is stable under the present canal regimeand operating pattern of the approximately 2,000 private tubewells already inthe area, which abstract an estimated 200,000 ac-ft per annum. At full projectdevelopment, a further 440,000 a2-ft per annum would be abstracted, mainlyduring the rabi, by more intense operation of the existing wells and installa-tion of about 2,270 additional private wells. The increased abstractionwould be made possible primarily by the increased recharge during khariffollowing canal remodeling. Prizate rather than public development is appro-priate in Unit III because it is technically feasible, many farmers canafford it, and scarce public funds are more beneficially allocated to UnitsII, IV, and V where development Ls only feasible in the public sector. InUnit III, private development is already substantial and conditions arefavorable for further progress, given adequate technical and financialsupport which would be provided under the project (para 4.14).
4.09 In Unit IV, the groundwater is now at a safe depth. The availablegroundwater models show that the Unit is receiving most of its inflows fromUnit I, where the water table at present is very high. When development ofthis Unit is completed in 1978 and the water table appropriately lowered(para 3.02) the models show that the underground inflow to most of Unit IVwill cease. Thus, the drainable surplus will disappear by the undergroundflow into the Cholistan Desert (Annex 3). Therefore, works under the presentproject would be confined to those described under paras 4.04 to 4.06.
4.10 Saline Water Drainage in Unit V would be effected by about 250tubewells of 3 cusec capacity. To remove the drainable surplus and stabilizethe water table, an annual pumpage of 380,000 ac-ft would be required, giving

- 13 -
a well operating factor of about 70% or 6,150 hours per annum. To maximizewater table control, the wells would be placed on a triangular grid as faras possible, each draining approximately 1,200 ac. The pumps, motors and thescreens would be of materials that withstand the chemical action of salinewater.
4.11 Saline Effluent Disposal would be through drainage canals into fiveevaporation ponds in the Cholistan Desert. Annual evaporation is expectedto be about 80" as against 100" of fresh water. The amount to be evaporatedwould be about 380,000 ac-ft (para 4.10). Therefore, the total area of theponds would be about 57,000 ac.
4.12 Pumping stations would be provided to lift the water from the drain-age canals into the evaporating ponds. Each station would have four 24-inchaxial flow pumps of 38 cusec capacity, having a 10-ft lifting head; one pumpwould serve as a standby.
4.13 Electrification would be provided to all tubewells in Units II and Vand to the five effluent pumping stations. Works required would include theerection of approximately 1,120 mi of 11 kV, 55 mi of 66 kV and 24 mi of 132 kVlines and six grid stations. The network lines constructed for electrifyingtubewells and pumping stations would also contribute to the ongoing villageelectrification program. No specific provision would be made for electrifica-tion of private tubewells in Unit III, most of which would be powered by dieselengines, though an estimated 10% would have access to existing electricitysupplies. Provision of electricity to the many small, private tubewells wouldbe expensive, involving a very dense distribution network.
4.14 Credit would be provided to farmers under the project to supportland leveling (para 4.05) and private tubewell development (para 4.08).In each case, farmers would provide at least 25% of the investment from theirown resources and be eligible for a six-year loan at 12% to cover the remainderfrom participating commercial banks (CBs). The CBs would, in turn, be ableto refinance half of their advances from the State Bank of Pakistan (SBP). TheGOP would provide funds to SBP from the proposed credit to cover SBP's refinanc-ing. The SBP would charge CBs 6%, and GOP would charge SBP 5%. These interestrate spreads are satisfactory (Annex 6).
4.15 The GOP at present provides a grant of Rs 8,000 to farmers installinga private tubewell. The grant is restricted to farmers (or groups of farmers)owning at least 25 ac of land. This discriminates against smaller farmers anddiscourages the use of small 1/4 to 1/2 cusec tubewells which have been suc-cessful under similar conditions in other countries. While a subsidy fortubewells does not appear necessary on financial grounds and would be reviewed(para 5.16) under the project, a first step would be to remove the existingdiscrimination. Accordingly, assurances have been obtained from GOP thatinsofar as GOP continued to subsidize the investment costs of private tube-wells, grants would be made available to project area farmers irrespectiveof the size of landholdings.
4.16 Consultants would be engaged to advise and assist WAPDA in prepar-ing the final design of the project, to prepare procurement and contract

- 14 -
documents as well as to supervise construction. They would also develop thecomputer model to optimize operation of the entire Panjnad Barrage irrigationsystem. An estimated 310 man-morths of consultants would be required for thisover a six-year period, at an estimated total cos-, including overheads,travel, and reimbursable expenses of US$9,600 per man-month (Annex 7). Inaddition, finance would be providad under the project to assist WAPDA inthe final design of other projects. Following the completion of the ongoingMaster Planning Project financed by UNDP in 1978, and meanwhile based onexisting plans for high priority orojects, these services would be used toensure a pipeline of well preparel projects consistent with an integratedoverall development plan.
4.17 Vehicles would be proviled to the executing agency -- WAPDA -- tobe passed on to the operating ageicy when WAPDA withdraws one year afterproject completion. Specialized !quipment would include a mini-computer whichwould program the operation of tht whole canal system, including pumpage inUnit II, to control the groundwatetr. The soils laboratory at Bahawalpur wouldrequire additional equipment and :ransport to be effective in the soils recla-mation program. The agricultural engineering section would be provided with40 tractors of 65-75 hp, with sui::ably scaled scrapers and chisel plows forfine land leveling and deep ripping of areas where a hard pan prevents rootpenetration and drainage. Survey equipment, for use by the agriculturalengineer and his staff to mark oul. fields for fine leveling, would be provided(Annex 8). The project would als( finance the purchase and installation oftwo center-pivot sprinkler system .-, estimated to cost Rs 1.1 M, for trials inthe North-West Frontier Province and Baluchistan. The units would be installedon land where the topography is rlIling so that land leveling for surfaceirrigation is prohibitively expenmiive, and high value crops would be grown ona trial basis by the Provincial Departments of Agriculture.
4.18 The Agricultural Extension service would be improved under a sepa-rate project for strengthening agricultural extension and research in Punjabwhich is now under appraisal (pare 3.15).
4.19 Grain Storage facilities for wheat procured by the Government areinadequate and need augmenting (para 3.20). However, a solution can best befound within an all-Pakistan framEwork. The Canadian International Develop-ment Agency (CIDA) are shortly commencing a study of the situation. Termsof reference have been discussed with IDA; the study itself is expected tobe completed in 1978. Assurances hiave been obtained from GOP that by June 30,1979 an all-Pakistan plan on how GOP proposes to improve grain storage prob-lems, including proposals satisfactory to IDA for storing grain producedin the project area, would be presented to IDA, and by July 1, 1980, it wouldcommence implementation of such a elan in the SCARP VI area.
Water Supply, Demand and Quality
4.20 Present irrigation supplies are not sufficient for the existingcropping patterns adopted by farme-s (Annex 9). The consequent under-irrigation contributes in part to :he low yields and the salinizationof soils. In the future, kharif wtter requirements under the project would

- 15 -
be higher than at present; the remodeling of the canal system would enable
them to be met from surplus river flows. Future rabi water requirements of
the design cropping pattern for the perennial areas will in part have to be
met from storage. In an average year about 355,000 ac-ft would be required
to supplement historic, post-IBP rabi flows at the Panjnad Barrage. Assur-
ances have been obtained from GOPunjab that they would provide the future
water requirements of Units IV and V.
4.21 The design and operating plan of the Panjnad Barrage system calls
for closure of the non-perennial canals (in Units II and III) from November
to March, inclusive. During the past few years. however, the canals have
been allowed to run until late November and some-Lia - again in January.This was possible because in recent years there were more than averageflows in the rivers. However, in average years there is no such excess
during the rabi season. Extending the period of surface irrigation in UnitIII has two effects: firstly, existing private tubewells need to pump less,
while recharge to the aquifer is increased - thus increasing the likelihood
of waterlogging, and secondly the incentive to install more private tubewells
is reduced. Since there are other canal commands where the extra deliveries
could be equally productive, including ones where there is no scope for pri-
vate groundwater development, it would be desirable to maximize the incenti.erfor private development and control of the groundwater in Unit III by enforc-
ing the traditional canal closure date of October 31. Accordingly, assurances
have been obtained from GOPunjab that, by October 31, 1980, no surface water
would be provided to Unit III from about October 31 to about March 31.
4.22 The quality of the river water is good and with proper irrigation
practices no ill ef ei.ts to the soil should result. The groundwater in UnitsII and III is also of good quality and suitable for irrigation.
Implementation Schedule
4.23 The overall expected implementation period of the project would be
six years. The first year would be spent mainly in final design, procurementof equipment and vehicles, preparation of tender documents for civil works
and in promotional efforts for the private tubewell program in Unit III. Themajor physical works would start in the second year and be completed by the
end of the sixth year (Annex 10).
4.24 Comprehensive schedules for construction, implementation and budgetrequirements are to be prepared annually by all concerned agencies for reviewand coordination by WAPDA (NZ). Assurances have been obtained from GOP and
WAPDA that adequate and timely funds would be provided for project implementa-
tion, according to estimates prepared by General Manager WAPDA (NZ). Assurances
have also been obtained from WAPDA that the annual implementation schedule,together with budgetary estimates for the coming financial year, would be
submitted to IDA by March 31st of each year of implementation.

- 16 -
Project Costs
4.25 Total project costs would be about US$170.0 M equivalent (includingtaxes and duties of US$3.6 M) of which the foreign exchange component would beUS$46.5 M or 27% of the total. Tubewell costs are based on recent experiencein Pakistan. The cost of canal remodeling, the excavation of drains and theconstruction of the evaporation ponds are based on the preliminary designs andestimates, and on the costs of similar work recently carried out in Pakistan.Consultant costs are based on US$9,600 per man-month including local andforeign travel, recruitment and housing costs. An overall physical contingencyof 12% is included; canal remodeling and drainage disposal works carry 15%physical contingency. Price escalation has been calculated according to Bankprojections for inflation of 9%/yr up to 1980 and 8%/yr thereafter for localcosts, and 8%, 7.5% and 7% for 1978, 1979 and 1980-83, respectively for foreigncosts. Taking account of the schedule of expenditure, overall price escalationwould be 36%. A summary of cost estimates is given below, and details are shownin Annex 11. O&M costs, which would be financed by WAPDA during project con-struction, are estimated at US$11.9 M equivalent, including price escalation.

- 17 -
Rs Million US$ Million %Local Foreign Total Local Foreign Total Total
I. Land Acquisition 19.9 - 19.9 2.0 - 2.0 2
II. Civil WorksCanal Remodeling 166.5 13.5 180.0 16.8 1.4 18.2 16Unit II Tubewellsard Drains 77.4 48.3 125.7 7.8 4.9 12.7 11Unit V Tubewells 22.5 36.5 59.0 2.3 3.7 6.0 5ElectrificationWorks 164.6 9.3 173.9 16.6 0.9 17.5 15Drainage Works 139.4 27.2 166.6 14.1 2.7 16.8 15
Subtotal 570.4 134.8 705.2 57.6 13.6 71.2 62
III. On-Farm InvestmentsUnit III Tubewells 41.4 19.0 60.4 4.2 1.9 6.1 5Land Leveling 85.0 15.0 100.0 8.6 1.5 10.1 9Gypsum 36.0 4.0 40.0 3.6 0.4 4.0 4
Subtotal 162.4 38.0 200.4 16.4 3.8 20.2 18
IV. Equipment andVehiclesCanal RemodelingEquipment 12.5 32.0 44.5 1.3 3.2 4.5 4Electrical Components 24.4 62.3 86.7 2.5 6.3 8.8 8Transport, LevelingEquipment, Computer/Communications, 4.9 17.2 22.1 0.5 1.7 2.2 2Spares & Miscel-laneous --- -Subtotal 41.8 111.5 153.3 4.2 11.3 15.5 14
V. Consultants 5.0 46.8 51.8 0.5 4.7 5.2 5
Base Cost 799.5 331.1 1,130.6 80.8 33.4 114.2 100
VI. Physical Con-tingency 103.9 36.1 140.0 10.5 3.6 14.1
VII. Expected PriceIncreases 319.0 93.2 412.2 32.2 9.5 41.7
TOTAL 1,222.4 460.4 1,682.8 123.5 46.5 170.0
O&M DuringConstruction 96.2 21.4 117.6 9.7 2.2 11.9

Summary of Proposed Financing(RsM)
Category Total IDA UK KFW GOP CB Farmers
Land Acquisition 27.7 27.7
Civil Works 984.9 445.5 74.2 465.2
On Farm Investments 287.9 103.9 56.3 76.4 51.2
Equipment and Vehicles 183.0 54.5 78.2 50.3
Consultants 59.3 59.3
Base Cost Including Price Escalation 1,542.8 608.8 128.7 78.2 599.5 76.4 51.2
Physical Contingency i4u.u 84.2 19.8 4.0 19.2 7.6 5.2
Total (RsM) 1,682.8 693.0 148.5 82.2 618.7 84.0 56.4
US$M 170.0 70.0 15.0 8.3 62.5 8.5 5.7_
Percentage Distribution 100 41 9 5 37 5 3

- 19 -
Financing
4.26 The proposed IDA credit of US$70 M together with a credit underterms similar to IDA's, of DM 20 M (US$8.3 M equivalent) from the FederalRepublic of Germany through the Kreditanstalt fuer Wiederaufbau (KfW) anda grant of US$15 H equivalent from the United Kingdom, would finance 56% oftotal project costs, excluding taxes and duties, and cover the full foreignexchange costs of the project and approximately 39% of the local costs (page17 and Annex 11). Other funds required for the project would be provided byGOP, as a loan to GOPunjab (US$62.5 M equivalent); commercial banks (US$8.5 Mequivalent), and farmers' own resources (US$5.7 M equivalent). The fulfill-ment by the Borrower, GOPunjab and WAPDA of all conditions of effectiveness ofthe grant from the UK and the credit from West Germany would be a condition ofcredit effectiveness.
Procurement
4.27 Project components to be financed by IDA include canal remodeling,Unit II and Unit V tubewells, electrification works, on-farm development, theprovision of gypsum for land reclamation, and consultant services. Canalremodeling (costing an estimated US$28.2 M equivalent including contingencies)would be scattered over a large area and would have to be phased with seasonalagricultural activities and could not be so contractually packaged as to belikely to be attractive to international contractors. Work scheduling woulddepend on agricultural seasons; consequently, this component is not suitablefor international competitive bidding (ICB). Therefore, contracts would belet through local competitive bidding (LCB). Tubewell construction in UnitsII and V, estimated to cost the equivalent of US$17.8 M and US$9.4 M respec-tively, would be through ICB in which Pakistani firms would have a 7-1/2%preference. Similar procedures would be used for construction of the elec-trification system (costing US$26.8 M equivalent). Consultants (costing US$6.4M equivalent) would be selected in line with IDA guidelines (para 5.08).Gypsum (US$6.6 M) would be obtained through LCB from suitable local contractors(likely to be fertilizer manufacturers and/or distributors) who would supply itaccording to prescribed specifications, in bulk, at the dealers' sales point.
4.28 The KfW would finance the foreign exchange cost of imported andlocally manufactured electrification components (estimated to cost US$11.8 Mequivalent) procured through its own international competitive bidding pro-cedures. These components would be supplied to the contractors constructingthe electrification system.
4.29 The UK grant would finance equipment needed for canal remodelingand other construction purposes (US$7.8 M equivalent). Such equipment wouldbe procured from UK suppliers. The UK would also finance the foreign exchangecomponents and part of the local costs of the drainage disposal system andevaporating ponds (US$27.8 M equivalent) with procurement according to its ownprocedures.

- 20 -
4.30 On-farm investments by farmers (US$24.5 M equivalent) compriseprivate tubewells in Unit III ancL land leveling. Farmers would have freedomof choice in procuring the goods and services involved.
4.31 Land required for the project (US$2.9 M equivalent) would be pro-cured by GOPunjab for WAPDA.
Disbursements
4.32 Disbursements of the proposed IDA and KfW credits and UK grantwould be made as follows:
IDA Credit
(a) 50% of net credits to farmers made by participating com-mercial banks for on-farm investments including privatetubewells and land leveling;
(b) 100% of expenditures for approved consultant services;
(c) 100% of foreign expenditures for directly imported goods,or 100% of local expenditures (ex-factory) for goodsmanufactured locally, or 50% of expenditures for othergoods procured locally;
(d) 100% of the foreign expenditures and 50% of the localexpenditures on canal remodeling, Unit II and Unit Vtubewells, and electrification works.
KfW (Germany) Credit
(e) 100% of the foreign exchange cost of imported and domesticallymanufactured electrical components and equipment;
United Kingdom Grant
(f) 100% of the foreign exc!iange costs of the canal re-modeling equipment;
(g) 100% of the foreign exchange cost of the drainage worksand 30% of the local costs.
(h) 100% of the foreign exchange cost of transport, levelingequipment, mini-compute:.
4.33 Some US$10.9 M equivalent (12%) of the credits and grant would beunallocated and reserved for contingencies. Disbursements against creditsextended to farmers for on-farm investments would be made against certifiedstatements of expenditure submitted by GOP and based on the documentationwhich would be held by GOP for review by Supervision Missions. All otherdisbursements would be made against full documentation. It is expected

- 21 -
that disbursements would be completed by June 30, 1984, six months afterproject completion. A schedule of estimated disbursements and proposed creditallocation is given in Annex 11. Any amounts not used by the project would becancelled unless, subject to IDA concurrence, other suitable project relatedexpenditures are identified.
Accounts and Audit
4.34 Project accounts would be maintained separately, and in a readilyidentifiable form. This would enable them to be audited separately fromWAPDA's overall accounts by an independent external auditor thereby ensuringtheir timely availability. Accordingly, assurances have been obtained fromGOP that: (i) separate accounts would be established and maintained forproject expenditures by the Project Director; (ii) these accounts would beaudited annually by an independent auditor acceptable to IDA; (iii) accountsof loans by the CBs to farmers under this project would be recorded separatelyand audited annually and consolidated by SBP, and (iv) copies of all theproject accounts and SBP consolidated accounts for project related itemswould be sent to IDA not later than six months after the end of each financialyear.
V. ORGANIZATION AND MANAGEMENT
Project Implementation
5.01 Civil Works. In this project, as in all other SCARPs, WAPDA wouldbe the agency responsible for project civil works, including canal remodeling(where necessary, including water courses), public tubewells, electrification,drains, pumping stations and evaporation ponds. WAPDA would be responsiblealso for the procurement of equipment and vehicles required under the project.The General Manager (GM) of WAPDA Northern Zone (NZ) would have overallresponsibility for the final design and construction of the civil works.The Director (Planning), WAPDA (NZ), in Lahore, under the GM (NZ), wouldcarry out the final design. A project construction unit (also under GM (NZ)),headed by a Project Director would be established and made responsible for theconstruction. The Unit, based in Rahimyar Khan, would have four divisions--Irrigation, Drainage, Mechanical and Electrical, and Agriculture and Monitoring(Annex 12).
5.02 On-Farm Investments comprise private tubewells in Unit III, landleveling on about 100,000 ac and soil amelioration with gypsum on about40,000 ac. Private tubewells would be installed by several contractors, in-cluding the Agricultural Engineering Section of the Agricultural Departmentwhich operates in Rahimyar Khan and the nearby Bahawalpur, Multan and SukkurDistricts. These contractors have capabilities to sink between 800 and1,000 wells a year.

- 22 -
5.03 Land leveling would be planned and supervised by trained surveyorsfrom the Agricultural Engineering Section, who would mark out the fields andcheck the completed work. The surveyors would be trained by PLLP to the samestandard of proficiency as their own staff. An assurance has been obtainedfrom GOPunjab that it would provice the necessary training to, and approve thepost of, at least six additional surveyors in the Agricultural EngineeringSection by December 31, 1978, to enable them to plan and supervise precisionland leveling in the SCARP VI area.
5.04 The actual leveling would be carried out either by the Departmentof Agriculture or by private contractors according to farmer choice. Assur-ances have been obtained from GOPunjab that the Department of Agriculturebulldozer strength in the Rahimyar Khan District would be maintained at leastat the present level of 25 operating units while the demand for their servicesexists, and the tractors provided to the Department under the project wouldat all times give priority to land leveling work.
5.05 After leveling and bunding, an estimated 160,000 ac would requirereclamation with gypsum. However, it is estimated that only about 40,000 acwould be reclaimed during the project implementation period of six years.Gypsum requirements would be determined by the soils laboratory in Bahawalpur,which is attached to the Agricultural Research Station. The laboratory wouldbe expanded under the project to do the required analyses (Annex 2). Staffattached to it would identify the problem in the field and provide the neces-sary advice. An assurance has beea obtained from GOPunjab that the soilslaboratory at Bahawalpur would be expanded and staffed to provide adequatetechnical support for the soil reclamation works to be carried out both duringthe project implementation period mnd thereafter, until all necessary reclama-tion works have been completed in the project area.
Agricultural Supporting Services
5.06 Agricultural extension would be the responsibility of the PunjabDepartment of Agriculture. An IDA project to improve extension servicesis currently being appraised, and wiould include the SCARP VI area.
5.07 Fertilizer production, oni stream or planned, is adequate for thewhole of Pakistan until the late 1980s. The present distribution systemand its planned expansion is also adequate to meet increased demands. Suffi-cient quantities of high quality seeds will soon become available under anongoing IDA project (Cr. 620-PAK). Because of the increased area under cotton,and the increase in demand resulting from an improved extension service, pestcontrol activities would have to be stepped up considerably (Annex 13).Assurances have been obtained from GOPunjab that it would ensure the supplyof suitable pesticides and sprayers to meet the increasing demands of projectarea farmers.
Consultants
5.08 WAPDA would appoint consultants to help with the final design of theproject as well as to supervise corLstruction. The consulting group would

- 23 -
include specialists in irrigation, drainage, land reclamation, agriculturepower, geo-hydrology and tubewell development. Up to six man-months would bedevoted to assist GOPunjab with a study directed towards devising a system ofwater charges more appropriate to present and future needs than that used atpresent (para 5.16). The estimated requirement for consultants required forSCARP VI would be 310 man-months (Annex 7). The consultants working directlyon the project would have the full-time support of WAPDA and IrrigationDepartment staff, including that of WAPDA's power wing. They would prepareoperating and maintenance manuals for the project works including specifica-tion of maintenance standards and allowable deterioration for public tubewells.In particular, they would define precisely the degree of deterioration per-missible in any well before rebuilding or replacement becomes necessary. Theappointment of the consultants required for final design of SCARP VI would bea condition of credit effectiveness.
Coordination of Works
5.09 As is the normal practice for the implementation of projects inPakistan, and in order to synchronize the efforts of all concerned, two coor-dinating committees would be created: a Project Coordination Committee (PCC)based in the project area in Rahimyar Khan and a Project Steering Committee(PSC) in Lahore. The PCC would be chaired by the Commissioner, Bahawalpurwith the Project Director appointed as Vice Chairman. Its members wouldinclude but not be confined to Director (Planning) of WAPDA (NZ), the DeputyCommissioner of the Rahimyar Khan District, Superintending Engineer of theIrrigation Department in charge of the Panjnad Barrage and Command, DeputyDirector of Agriculture of Rahimyar Khan District, the District SuperintendingEngineer of WAPDA's Power Wing, representatives of the CBs giving credit tofarmers in the project area, and representatives of the farming community inthe area. It would meet regularly and deal with problems and difficultiesarising from project coordination and implementation.
5.10 The PSC would be chaired by GOPunjab's Additional Chief Secretaryof Planning and Development. Its members would be the Secretary of Agricul-ture (GOPunjab), Secretary of Irrigation (GOPunjab), Commissioner of BahawalpurDivision, WAPDA General Manager (NZ), and WAPDA General Manager - Power Wing.Both the PCC and PSC would have the power to coopt additional members asappropriate. The establishment of the PCC and PSC would be a condition ofcredit effectiveness.
Operation and Maintenance
5.11 WAPDA would be responsible for operating project works for at leastone year after completion of all components and for attending to all problemsarising during this period. After the trial year, and if overall projectperformance is satisfactory, the project would be transferred to the PunjabIrrigation Department. Total project operating and maintenance costs, includ-ing replacements are estimated to cost an average of about Rs 70 M/yr at

- 24 -
present prices (Annex 4). Assurances have been obtained from WAPDA andGOPunjab that they would make adequate and timely budgetary provisionsto cover these costs and provide adequate staff levels to satisfactorilyoperate and maintain the project facilities.
5.12 For accurate assessment of project benefits, cropping and produc-tion data are required regularly. At present, the Department of Agriculturecollects crop area and yield data on a sample basis; the Revenue and Irriga-tion Departments compile information on total cropped areas, but not yield.Private tubewell development is at present recorded by the Department ofAgriculture. Under the project, such information would be collated by WAPDA'sCentral Monitoring Organization (CMO) which would then be in a position to fillany perceived gaps in data gathering. Assurances have been obtained from WAPDAthat CMO would conduct a benchmark survey and update it every two years, torecord changes in crop productioa brought about by the project.
Cost Recovery
5.13 Direct recovery of con3truction and operating and maintenance costsof irrigation and drainage projects in Pakistan is partially effected throughProvincial water charges. In Punjab, water charges vary between crops, and afarmer's liability is calculated as the area he has under each crop multipliedby the respective rate for the crop. Though rates vary substantially, (e.g.fodder rate = Rs 6.40/ac, orchard rate = Rs 33.60/ac), in all cases chargesform an insignificant proportion of the value of crops per acre, and hencehave virtually no effect on the mix of crops that is grown.
5.14 According to budget statistics, water charges form only about 2.5%of the national tax income, but provide about 30% of tax revenues directlycollected by the Provincial gove^-nments. Expenditures on O&M alone accountfor about 40% of direct Provincial revenues, and need to be increased ifsatisfactory standards of maintenance are to be achieved. Consequently,present water charges are inadequate to cover O&M costs, let alone therecovery of construction costs.
5.15 There is a pressing need to increase national tax income in Pak-istan, not only to meet irrigation and drainage system costs but to bettermaintain and to improve the whole spectrum of Government infrastructure andservices. Farm budget analyses and estimates of the value of water to farmersmade in the appraisal of this project indicate that substantially increasedwater charges or increased taxat:ion could be borne by project beneficiaries.However, the appropriate level and structure of water charges cannot betreated satisfactorily on a project specific basis, since the irrigationand drainage system in the Province is highly integrated and interdependentbetween areas. In addition, issues of equity arise between farmers havingdifferent quality land, farmers situated in different canal commands and thelocation of land on the watercourse (land near the "head" of the watercoursereceives much better supplies than that near the "tail"). Also, any examina-tion of water charges must take Lnto account other agricultural taxes.

25 -
These include, for example, a system of taxing agricultural products whichnow contributes Rs 2.7 billion/year, or between 15 and 20% of total nationalrevenues from tax. About half as much again is paid indirectly by farmers inthe form of a transfer to wheat consumers due to wheat procurement prices thatare kept artificially low. In the project area, for example, export taxesalone on the incremental production of cotton generated by investments inSCARP VI would amount to Rs 74 million annually which would more than coverproject O&M costs. In devising means to increase revenues from agriculture,particular attention would need to be given to maintaining incentives tofarmers and introducing a progressive tax structure.
5.16 During negotiations, terms of reference for a study (Annex 14) werediscussed, and agreement was reached on its timing and scope. The principalelements in the review would be:
Part I
- Operation and maintenance of the Provincial irrigation anddrainage system - the costs of effective O&M and the extentto which these should be met by irrigation water usersthrough direct water charges;
- Public savings - the extent to which Government should cap-ture part of the increases in net benefits generated by newinvestments in irrigation for funding future investment inagriculture and elsewhere and to what extent this shouldbe through direct water charges;
Part II
- Level of overall agricultural taxation - the appropriate-ness of this level and its structure in relation to in-come distribution and the appropriateness of the sharecontributed by direct water charges.
Without prejudging the results of the study, an increase in water chargeswould appear feasible and desirable; it could be made progressive and thuswould have a positive effect on income distribution, would be preferable toan increase in taxes on output from the economic efficiency viewpoint, andwould accrue directly to GOPunjab. If this conclusion were supported, thestudy should recommend:
- differentials between different farm sizes, types ofirrigation, farm locations on the watercourse andbetween SCARP and non-SCARP areas;
- systems of imposition and collection of water charges.
Assurances were obtained from GOP that it would carry out a study, underterms of reference satisfactory to IDA, on the structure and level of
- 26 -
agricultural pricing and taxatior with particular reference to water charges;the study would be furnished to IDA for discussion by September 30, 1979.Assurances were obtained from GOE'unjab that, after consultation with GOP andIDA, it would introduce revisions to the structure and level of water charges,taking into account the conclusions of the study, by July 1, 1980. Unless,based on the recommendations of the study, GOP, GOPunjab and IDA otherwiseagree, Punjab would, not later than July 1, 1980, July 1, 1985 and July 1,1990 raise the level of water charges in Punjab in three stages so that byJuly 1, 1990, either (i) water charges in Punjab are sufficient to recoverthe full cost of O&M plus a reasonable proportion of the capital cost of theProvince's irrigtion and drainage facilities, or (ii) water charges in theProject area are sufficient to recover the full cost of O&M plus a reasonableproportion of the capital costs of the project area's irrigation and drainagefacilities. Assurances were further obtained from GOPunjab that water chargesin each Unit of the project would, within one year after completion of worksin that Unit, be raised to the maximum permissible rate under prevailinglegislation. If project area water charges are increased to cover projectO&M, direct project rent recovery from water charges would amount to about23%, and indirect recovery, principally from the tax on cotton, would amountto a further 34% (Annex 17).
VI. PRODUCTION, MARKET PROSPECTS, PRICES AND FARM INCOME
Future Cropping Patterns and Yields
6.01 Project works would ena,le higher cropping intensities to beachieved mainly in cotton, wheat, sugarcane and orchards. It is estimatedthat with the project overall cropping intensities would rise, in Units IIand III, from the present 99% and 101% to 135% and 126%, respectively, andin Units IV and V from 99% and 107% to 125% and 128%. In the perennial units(IV and V), the balance between Iharif and rabi cropping intensities wouldbe approximately maintained. In che non-perennial Units (II and III), wheresubtantial rabi supplies would be available for the first time, the propor-tion of rabi crops in the total cropped area would increase.
6.02 Without the project, berause of the rising water table and soilsalinization, there would be an i:crease in the kharif rice acreage in UnitsII and V and a more than correspoading decrease in the cotton area, becauseof the higher irrigation requireme3nts of rice. In the rabi, wheat would de-crease, and pulses and oilseeds, both of which can tolerate a higher watertable, would increase. Land use of areas remaining in cultivation would beintensified to compensate for land that would have to be abandoned. Even-tually, however, waterlogging and salinity would reach such levels that byabout 1990 it would no longer be possible to maintain present crop acreages.
6.03 The figures below show i:he expected aggregate trend in yields andcrop areas. Full details of expected yields, inputs and cropping patternsby project Unit are given in AnneLes 15 and 16.

- 27 -
------------ Future (1990)----------Present Without Project With Project
AREA YIELD AREA YIELD AREA YIELD('000 ac) (t/ac) ('000 ac) (t/ac) ('000 ac) (t/ac)
Rice 35.8 0.8 68.6 0.8 57.0 1.0Cotton 371.9 0.4 305.7 0.6 401.5 0.6Maize 17.3 0.4 17.3 0.4 29.6 0.7Millets 59.3 0.3 81.0 0.3 77.5 0.3Kharif fodder 83.7 10.8 83.7 12.1 78.3 15.0Wheat 324.9 0.5 284.7 0.7 465.2 0.9Rabi pulses 12.6 0.2 44.9 0.2 32.1 0.3Oilseed 67.4 0.2 75.3 0.2 103.2 0.3Rabi fodder 129.6 10.0 129.6 12.5 103.2 15.0Sugar cane 70.4 13.6 70.4 16.0 93.8 18.6Other Perennials 25.4 1.6 25.4 1.8 47.2 2.0
Market Prospects
6.04 The market for the crops produced in the area is reliable andwell developed. The area is well served by local roads and is on the mainKarachi-Lahore railroad (para 3.22). In good crop years, large quantitiesof wheat are shipped to deficit areas in Pakistan, and this will continuefor the foreseeable future. Two sugar mills are at present operating inthe area. They, and the overall high demand for gur, ensure a ready marketfor sugarcane. Adequate local facilities exist to process the expected in-crease in cotton production which is in demand for both domestic and exportuse.
Prices
6.05 Prices used in the economic analysis for internationally tradedcrops and inputs are primarily based on Bank projections for world marketprices for 1985. Adjustments have been made to allow for transport and pro-cessing costs, and to reflect the historic differences between world pricesand prices paid or received by Pakistan. These differences arise from qual-ity differences and international transport costs. For non-traded commodi-ties, economic prices are based on prevailing and projected financial prices,adjusted by the average ratio of financial to economic prices for tradedagricultural commodities. All economic prices are computed using an exchangerate of US$1=Rs 9.9 (Annex 17).
6.06 Financial prices are based on prevailing market prices adjusted fortransport costs to farm gate prices. The comprehensive structure of Govern-ment controls, taxes and subsidies results in substantial differences betweenfinancial and economic prices. In recent years, these differences have beenreduced due to increased domestic prices and decreased world price. Futurefinancial prices are projected on the assumption that the present ratios willpersist. Linear Programming analysis indicates that water availability is the main

- 28 -
constraint on present production, and, given increased supplies, prevailingfinancial prices provide adequate incentives to increase production.
Farm Incomes
6.07 Estimated net farm incomes for owner-operated farms from crops, in-cluding wage income from off-farm work in agriculture and assuming the exist-ing levels of water rates are raised to recover O&M costs, are shown below:
Net Farm Income by Farm Size(Rs)
…---- 5 ac ---- 12.5 ac ---- ---- 25 ac -----P W i' P W W P W W
Unit II 2,800 2,725 6,720 6,895 7,738 16,925 12,085 14,305 30,610
Unit III 2,900 3,175 6,395 7,095 9,095 15,085 11,875 16,005 27,085
Units IV & V 2,970 3,065 6,545 7,305 8,315 15,815 12,600 13,750 28,260
P = Present, W Future without project (1990), W = Future with project (1990)
6.08 Most sharecropped farms are in the 7.5-12.5 ac class. Farm incomein cash for such farms is rather less than half that for an owner operatedfarm. However, tenants receive free housing, fodder for their animals andoften some basic food ration.
6.09 Off-farm employment as hired labor in agriculture contributesone-third of total income for 5 ac farms. Data were not available to esti-mate other income to farm households which, allowing for income from live-stock, is probably substantial.
6.10 With the project, farm incomes are expected to double. For thesmall farms (5 ac), off-farm employment would provide a higher absolute in-come but a smaller proportion of total income (about one quarter) than atpresent. Tenants' income would increase slightly more in relative terms,because any increases in water charges would be borne by the landlords.
6.11 Without the project, overall farm incomes would rise only slightly,but the increased supply of labor due to population growth would result inreduced demands for hired labor, increased competition for available employ-ment and hence a reduction in income from this source to the smaller farmers.

- 29 -
VII. BENEFITS AND JUSTIFICATION
Anticipated Overall Effects
7.01 The land resources in the SCARP VI area are underutilized due todeteriorating soil conditions and inadequate irrigation supplies. The projectwould relieve these deficiencies, which in turn would substantially increaseagricultural production and increase employment opportunities in agricultureand related processing industries.
Production Benefits
7.02 The estimated incremental production increases at full projectdevelopment, ten years after project completion, would amount annually to230,000 tons of foodgrains, 87,000 tons of seed cotton and 12,000 tons of oil-seeds. After deducting the increased costs of production and inputs, the netcontribution to the economy would be Rs 460 million per year.
Employment Effects
7.03 Increased demand for labor would result primarily from increasedcropping intensities and higher labor inputs per croped acre. The labordemand would increase from the present 31 M man-days per year to 50 M man-daysat full project development. Secondary effects in the agricultural processingindustries due to increased production, and in other industries due to higherfarm incomes, would also be substantial. The main supply of labor for thisincreased demand would come from the smaller farms.
Income Distribution
7.04 The main determinant of income distribution would be, as at present,the distribution of land ownership, which is skewed in favor of larger hold-ings (40% of the land area is owned by 13% of the farmers). An inadequateagricultural environment is the main constraint on all farmers in the area,however, and it is impracticable to release this constraint selectively.Thus the main justification for this project is the effect on overall agri-cultural production. The smaller and poorer farmers in the project area wouldalso benefit due to the sharp increase in employment opportunities for whichthey would be the main source of labor. In the case of sharecroppers, anyincrease in water rates would be borne by the landlords, so that tenants wouldshare in the benefits of the project but not in the costs.
Economic Evaluation
7.05 The project has been evaluated as a complete package and by individ-ual Units (Annex 18). The analysis by Unit is only indicative for two mainreasons. Firstly, there are interdependencies between Units (e.g. drainagewater from Unit II provides irrigation for Unit V; lowering the water table in

- 30 -
Unit I also helps maintain the witer balance in Unit IV), and secondly, thereare economies of scale in canal remodeling, so that once remodeling is under-taken the marginal cost of providling a further increment of capacity is muchless than the average cost.
7.06 Attributing costs on a pro rata basis of the area served by eachcategory of expenditures gives rates of return as follows:
Unit II 19%Unit III 25%Unit IV 30%Unit V 13%
Total Project 19%
Application of gypsum to reclaim alkali-affected land, which would be under-taken on a pilot scale in the project, has not been evaluated and its benefitsare not taken into account in the above. The primary reason for this compo-nent is to test and develop the techniques which should have wide applicabil-ity in the country as a whole. The main effect of this project componentwould be on individual farms that have substantial alkali problems. At theproject level, the area of land involved is small (about 3% of the projectarea), and thus is insignificant in the overall economics.
Project Risk
7.07 The project would entail no special risks other than those normallyassociated with irrigation projects. Projected yields are conservative andbenefits depend mainly on increases in cropped area. Linear programminganalysis shows that water availability is the primary present constraint oncropped area, and the project wou:Ld substantially relieve this constraint.The rate of return of the project under various adverse assumptions is shownbelow:
(a) Benefit realization delayed two years: 15%
(b) Cost increase of 20% 16%
(c) Benefit decrease of 20% 16%
(d) Combination of (b) and (c) 12%
An IDA agricultural extension project is under appraisal for SCARP VI andother areas in Punjab. This extension project would improve farm practicesand increase the use of farm inputs. Consequently, it should improve uponthe yields estimated for this project (Annex 15).

- 31 -
VIII. AGREEMENTS REACHED AND RECOMMENDATIONS
8.01 Assurances have been obtained from GOP that:
(a) insofar as GOP continued to subsidize the investment costsof private tubewells, grants would be made available toproject area farmers irrespective of the size of landhold-ings (para 4.15);
(b) by June 30, 1979 GOP will submit to IDA an all-Pakistanplan for improving grain storage, including proposalssatisfactory to IDA for storing grain produced in theproject area; and by July 1, 1980 it would commenceimplementation of such plan with respect to the SCARP VIarea (para 4.19); and
(c) it would carry out a study, under terms of referencesatisfactory to IDA, on the structure and level of agri-cultural pricing and taxation with particular referenceto water charges; the study would be furnished to IDAfor discussion by September 30, 1979 (para 5.16).
8.02 Assurances have been obtained from GOP and WAPDA that:
(a) adequate and timely funds would be provided for projectimplementation, according to estimates prepared by GeneralManager, WAPDA (NZ) (para 4.24); and
(b) (i) separate accounts would be established and maintainedfor project expenditures by the Project Director; (ii)these accounts would be audited annually by an independentauditor acceptable to IDA; (iii) accounts of loans by thecommercial banks to farmers under this project would berecorded separately and audited annually and consolidatedby SBP, and (iv) copies of the project accounts and SBPconsolidated accounts for project related items would besent to IDA not later than six months after the end of eachfinancial year (para 4.34);
8.03 Assurances have been obtained from WAPDA that:
(a) WAPDA's General Manager (NZ) would prepare an annual ProjectImplementation Plan together with budgetary estimates for thefollowing fiscal year to be furnished to the Association forreview not later than March 31st of each year of implementa-tion (para 4.24);
(b) they would make adequate and timely budgetary provisions andprovide adequate staff satisfactorily to operate and maintain

- 32 -
the projects facilities during construction and for thefirst year of operations (rara 5.11); and
(c) WAPDA's Central Monitoring Organization would conduct abenchmark survey and update it every two years to recordchanges in crop production brought about by the project(para 5.12).
8.04 Assurances have been obtained from GOPunjab that:
(a) (i) by June 30, 1978, it would have prepared and discussedwith IDA plans, and a related implementation schedule, toensure supplies of gypsum to project area farmers, and(ii) annually during the project implementation period,it would discuss with IDA the price to be paid by farmersfor gypsum and any subsidy to be granted to its users(para 4.06);
(b) it would provide the future water requirements of UnitsIV and V (para 4.20);
(c) by October 31, 1980, no sur:Eace water would be providedto Unit III from about October 31 to about March 31(para 4.21);
(d) it would provide the necessary training to, and approve thepost of, at least six surveyors in the Agricultural Engineer-ing Section by December 31, 1978, to enable them to plan andsupervise precision land leveling in the SCARP VI area(para 5.03);
(e) the Department of Agriculture bulldozer strength in RahimyarKhan District would be maintained at least at the presentlevel of 25 operating units while the demand for theirservices exists and the tractors provided to the Departmentunder the project would at all times give priority to landleveling work (para 5.04);
(f) the soils laboratory at Bahawalpur would be expanded andstaffed to provide adequate technical support for the soilreclamation works to be carried out both during the projectimplementation period and thereafter, until all necessaryreclamation works have been completed in the project area(para 5.05);
(g) it would ensure the supply of suitable pesticides andsprayers to meet the increasing demands of project areafarmers (para 5.07);
- 33 -
(h) they would make adequate and timely budgetary provisionsand would provide adequate staff satisfactorily to operateand maintain the projects facilities after their transferfrom WAPDA (para 5.11);
(i) after consultation with GOP and IDA, it would introducerevisions to the structure and level of water charges,taking into account the conclusions of the study referredto in para 8.01(c) by July 1, 1980. Unless, based on theconclusions and recommendations of the study, the Borrower,Punjab and IDA shall otherwise agree, Punjab would, notlater than July 1, 1980, July 1, 1985 and July 1, 1990 raisewater charges in three stages so that by July 1, 1990 either:(i) water charges in Punjab are sufficient to recover alloperating and maintenance costs plus a reasonable proportionof investment costs of drainage and irrigation facilities inthe Province, or (ii) water charges in the SCARP VI areaare sufficient to recover all operating and maintenancecosts plus a reasonable proportion of the capital costsof irrigation and drainage facilities located in theProject area (para 5.16); and
(j) water charges in each Unit of the project would withinone year after completion of works in that Unit, beraised to the maximum permissible rate under prevailinglegislation (para 5.16).
8.05 Conditions of credit effectiveness would be that:
(a) all conditions applicable to GOP, GOPunjab and WAPDA forthe effectiveness of the grant from the UK and the creditfrom the Federal Republic of Germany had been fulfilled(para 4.26);
(b) consultants for the final design of SCARP VI had beenappointed under terms and conditions acceptable to IDA(para 5.08); and
(c) the Project Coordination Committee and the Project SteeringCommittee had been established (para 5.10).
8.06 With the above assurances received, and the conditions of effective-ness met, the project is suitable for an IDA credit of US$70 M. The Borrowerwould be the Islamic Republic of Pakistan.
November 10, 1977

ANNEX 1
Page 1
PAKISTAN
SALINITY CONTROL AND RECLAMATION PROJECT (SCARP) VI
Project Area Climatic Data
1. Temperature (0F)-oaRahimyar Khan 5. Sunshine (hours) - in SukkurAirstrip, 1927-74 1927-74
Mean maximum 108 - in June Maximum 10.5 - in MayMean minimum 40 - in Januar-y Minimum 8.6 - in DecemberAnnual mean 78 Mean 9.4Extreme ranges 120 - in June
25 - in January 6. Rainfall (inches)- on Rahimyar KhanAirstrip and Panjnad
2. Relative Humidity (%)-in Sukkur, Barrage - 1937-741897-1964
Maximum 77 - in August Average 3.9Minimum 54 - in April Median Maximum .92 - in JulyMean 65 Median No. of
Months at Less3. Dewpoint (OF) - in Sukkur, than 0.1' 8
1897-1964July 85 7. Wind Speed (miles per day) -January 45 Bahawalpur, 1927-74
4. Cloud Cover (in tenth) - in Sukkur Maximum 156 - on June1960-65 Minimum 45 - in November
Maximum 2.1 - in July Mean 73Minimum .2 - in Januarr 1/Mean 1.3 8. Pan Evaporation (mm)- - Bahawalpur,
1927-74Jan 76 Jul 209Feb 98 Aug 191Mar 137 Sep 170Apr 182 Oct 138May 218 Nov 96June 225 Dec 70
Total 1,810
1/ Observations from U.S. Weather Eureau Class A pan.
34

ANNEX 2Page 1
PAKISTAN
SALINITY CONTROL AND RECLAMATION PROJECT (SCARP) VI
Soils and Drainage
A. Soils
Surveys and Classification
1. The soils of the project area were surveyed on a semi-detailedscale and sampled for analysis on a one-mile grid in the mid-1960s by theformer Water and Soil Investigation Division (WASID) of WAPDA. In accord-ance with the contemporary requirements for project planning, the soils weregrouped into five mapping units, according to texture between a depth ofabout 6 to 72 inches. These five groups were designed primarily to delineatepresumed differences in drainability, considered to be the most importantsoil-related constraint that would prevent the attainment of full crop pro-duction potential. The grouping did not endeavor to portray existing orfuture problem areas. Fortunately, areas showing soil problems were closelyapproximated by parts of the culturable area designated as salt-affected(saline and/or alkali) or waterlogged, or both. Special checks and fieldinspections by the appraisal mission indicate that the original WASID dataprovide a good indication of the extent of adverse soil conditions. Whereasthe WASID soil classification system was not according to present standards,sufficient data were available to enable a reasonable assessment of the moreimportant soil constraints.
Soil Characteristics
2. The soils of the project area were formed almost entirely fromrelatively homogeneous alluvium deposited by the Indus River system. Floods,winds, changes in the course of rivers and moving sand dunes have createdmixed patterns of deposition, but relatively few significantly differenttypes of soils have been formed. The principal soil forming factors: rain-fall, wind, temperature, relief, erosion, vegetation, time and man's activi-ties, have modified the original alluvium only slightly; the soils areimmature and lack well-defined profile characteristics.
3. In general, the soils are mostly coarse to medium in texture; lightto dark brown in color, slightly to moderately calcareous and thereforemoderately alkaline in reaction; low in organic matter and nitrogen, low tomoderately low in phosphorus and well supplied with potash. The clay com-plexes consist mainly of illitic and amorphous materials; cation exchangeand water retention capacities are moderate; infiltration and permeabilityrates are moderate to high; and the soils are well drained where outletsexist and could be easily drained by providing appropriate facilities.
35

ANNEX 2Page 2
They are well aggregated and easily cultivated. Calcium sulphate (gypsum)occurs in large areas; the resistance to alkali hazards is high, and most ofthe salt-affected lands are relatively easy to reclaim.
4. More specifically, about a third of the soils are very coarse toslightly coarse (dune sands to sandy loams). The coarse soils are permeable,easily drained, easily cultivated, less fertile and have relatively lowwater-retention capacities; therefore, they are best suited for producingdeeper rooted crops or crops with moderate to low water requirements. Abouta sixth of the soils are fairly fine-textured (clay loans and silty clay loams)with high water-retention capacities and relatively high inherent fertility;however, they are somewhat difficult to cultivate, have relatively lowinfiltration and permeability rates and restricted internal drainage. As aresult, a high percentage of these soils are salt-affected (saline and/oralkali) and waterlogged. They can be successfully farmed by following carefulsoil and water management practices, and are best suited for rice, wheat,cotton and fodder crops. About 50% of the project area has medium texturedsoils (loams and silt loamns) with moderate infiltration and permeabilityrates, generally favorable internal drainage characteristics and moderatelyhigh moisture-retention capacities. They are suitable for most crops butare subject to salinity hazards where the drainage facilities are not adequate.
Soil Constraints
5. The significant soil-related constraints are therefore fertility,texture, drainage, salinity and alkali.
(a) Fertility is seldom listed as a soil constraint since,almost without exception, crops must be fertilizedregardless of inherent soil fertility. Because mostof the project soils a-re relatively coarse and havebeen subjected to flooding and high temperatures, theyare deficient in organ:Lc matter and in nitrogen, quitelow in phosphorus, probably relatively low in otheressential elements such as sulphur and zinc but ade-quately supplied with potash.
(b) Soil texture is a constraint wherever sands and loamysands, which comprise about 18% of the project soils,are found. These soils have low water holding capacity.Except where water supplies are plentiful or the ground-water level is high, coarse soils are best suited fordeep rooted and drought resistant crops. High cropyields require careful water management, frequentirrigation, particularly in warm weather, and frequentfertilizer applications. Severe salinity problems donot occur because of their high infiltration rates.Most of the severe salinity is associated with mediumand fine textures. In the project area, only 0.03% 36

ANNEX 2Page 3
of the soils are clays; these have associated infiltra-tion and permeability problems and are at present salt-affected.
(c) Drainage. Plant growth and therefore crop yields aredepressed where the groundwater table impinges on theroot zone. Soil saturation impairs the circulation ofair, prevents nitrification and the decay of organicmatter, damage structure and tilth, hinders cultivation,cools the soil and thereby delays seed germination.Most importantly, a high watertable impedes or evenprevents leaching and accelerates the upward movementof soluble salts and their accumulation in the root zone.This contributes to, or can even cause, salinity and alkaliproblems.
(d) Salinity and alkali. Primarily inadequate subsurfacedrainage and, to some extent, insufficient and incor-rectly administered irrigation have resulted in thedevelopment of saline and alkali soil conditions.Laboratory data collected by WASID in the course ofits survey of the area (para 1), the local "ThurGirdawari" of the Irrigation Department 1/ and a checkmade by the Consultant provide information on the extentof salinity and alkali in the project area. These basicconcepts are discussed in some detail below. Beforediscussing these values and their present and potentialimpact on crop production, it is useful to define theterms: saline and alkali soils.
Salinity and Alkali Soil Conditions - definitions and criteria
6. Saline soils are defined as those that contain sufficient soluble
salts in the root zone to suppress the growth of most crop plants. A salinesoil, according to the U.S. Salinity Laboratory and most other authorities,has a saturation extract conductivity (ECe) of 4 millimhos per cm or moreand an exchangeable sodium-percentage (ESP) of less than 15. Alkali soilscontain sufficient exchangeable sodium -- by common definition 15% or more -seriously to impair the physical properties of the soil, especially thepermeability of air and water -- and therefore interferes with the developmentof most crops. Alkali soils are commonly highly alkaline in reaction (pH of
soil paste is 8.5 or more) but they do not contain harmful amounts of salts.Saline-alkali soils contain excessive quantities of soluble salts and ex-
changeable sodium as defined above, but are not necessarily highly alkaline.It is important to note that critical salinity levels have been determined
1/ A survey based on visual evidence, conducted last in 1972/73, concludedthat 18.2% of the land in SCARP VI was "Thur", i.e., salt-affected.
37

ANNEX 2
Page 4
under conditions where crop variety, seed quality, insect, disease and weedcontrol were not limiting crop growth, and, in particular, soil and watermanagement and fertilization was also optimized. Little reliable informationis available on the precise relationships between different salinity levelsand associated crop yields when aay of the foregoing factors are sub-optimal,which is the usual state of affairs in the less highly developed agriculturalcommunities, including Pakistan. Nevertheless it is certain that, because ofthe lower level of inputs and management practices in the agriculturally stilldeveloping countries, the deleterious effects of given levels of salinity oncurrent crop yields, when compared with unaffected areas, are not nearly asgreat as indicated in salt tolera-ace tables which were compiled, usually,under highly developed farming conditions. Similarly, as regards criticalalkali levels, soils with ESP values at or slightly above 15 may not havedeteriorated sufficiently to affect crops if the soil is coarse textured orwell aggregated, if the clays are illitic, amorphous or kaolinitic in char-acter, or if the high sodium soil layer is at some depth in the profite(generally more than three feet).
7. Since field trips and an aerial survey of the project area appearedto have borne out the foregoing observations, the WASID data were reviewedand reclassified according to standards considered more appropriate underthe prevailing farming conditions in the area. Table 1 shows the resultsof the comparison. As expected, the more realistic use of an ECe value ofabout five for the coarser soils and six for the finer, to delineate salinity,indicated that only 25% to 30% of the soils were sufficiently saline toaffect crop growth and therefore :In need of reclamation. Furthermore, con-sideration of the role of the predominant clay complex (illitic and amorphous),depth to the "alkali layer", texture and/or soil permeability, and in parti-cular, the presence of an appreciable amount of gypsum in or above soil layerscontaining excess exchangeable sodlium, resulted in the conclusion that only10% of these soils (instead of 42%) are "truly alkali". During the datareview, another 6% or 7% was placed in a questionable group either because ofmarginal exchangeable sodium percentages, permeability or gypsum content; *itis assumed that about half of these would eventually require reclamation. Itis therefore concluded that about 13% of the project area (165,000 ac) wouldrequire alkali reclamation for satisfactory crop growth. Since most of the"probably alkali" soils are also saline (i.e., most of the problem soils aresaline-alkali), not more than about 25% of the project soils would requireeither leaching to remove excess salinity, or a chemical amendment, such asgypsum, coupled with leaching, to remove excess exchangeable sodium. Ob-viously reclamation is possible orLly if drainage facilities are adequate.
B. Drainage
8. In most of the project area, the relief is flat, natural drainage-ways ill-defined and inadequate. Under present water distribution and manage-ment practices, drainage problems exist where the water table lies withinfive feet of land surface, and problems may develop where the water table iswithin 10 ft. In both cases, in addition to the direct effects on crop
38

ANNEX 2Page 5
growth, upward movement of groundwater by capillarity contributes appreciablyto existing or potential salinity problems. The areas with a water tablewithin five feet of the surface require drainage to sustain or improve pres-ent productivity and as a prerequisite to efficient use of the additionalirrigation supplies that would be made available by the project. Controlof subsurface drainage does not necessarily require lowering and maintainingthe water table at depths of 10 ft or more. With adequate water applica-tions to ensure leaching of salts from the root zone and a pattern ofgroundwater use or disposal that provides for elimination of a portion ofthe leachate, successful irrigation can be practiced when the water tableis at a depth of five feet or less.
9. Approximately 60% of the project area had the water table at lessthan 10 ft in 1960 and 1974 when it was surveyed (and presumably also in1977), but only about 10% at five feet or less. Thus, under present condi-tions, groundwater levels appear to be more or less at equilibrium.
Conclusions and Recommendations
10. Soil Survey and Classification. Although the land classificationsystem used in the project area was deficient by modern standards, theintensity of the soil inspections, the accuracy of the group separations,reasonable characterization of the more important soil constraints (texture,drainage, salinity and alkali) and the amount of supporting laboratory dataprovide an adequate basis for project implementation purposes. Since soilsurveys have not been in sufficient detail to provide the information neededfor reclamation of saline and alkali soils, this study and farmer recommenda-tions arising therefrom will be provided under the project.
11. Salinity and Alkali. As indicated (para 7), about 25% of the proj-ect area (approximately 320,000 ac) require reclamation to permit profitablecrop production. About half of these soils require only leaching to removeexcess salinity; half would require the addition of gypsum, coupled withleaching to remove excess exchangeable sodium (i.e., alkali). The gypsumrequirement will average about five tons 1/ per acre, and the water requiredfor leaching of saline and/or alkali soils will average about two acre-feet.Both kinds of problem soils should first be leveled and bunded. Gypsum shouldbe incorporated into the soils as deeply as possible (6 to 12 inches or more)and the field then leached until a minimum of two feet of water has passedthrough. The saline areas require leaching only. Crops can be grown duringthe leaching process in both cases but the fertilizer requirements will behigher than normal, particularly after leaching, and it may be necessary toapply zinc (usually as zinc sulphate) at a rate of 40 pounds per acre to thealkali soils to obtain reasonably good crop growth.
1/ This refers to 100% pure and not to "mine-run", gypsum, which usuallycontains a high proportion of worthless material. The gypsum shouldbe pulverized so that about 80% will pass a 40 mesh sieve.
39
ANNEX 2Page 6
12. The only requirements for reclamation are: (1) willingness on thepart of the farmer to make the attempt; (2) availability of water for leaching,and, (3) an adequate drainage system so that the saline effluent can be dis-posed. Thus, most of the strict:ly saline soils could be reclaimed two or threeyears after suitable drainage facilities have been provided. However, alkalireclamation is much more costly and slower. Suitably prepared gypsum, andcompetent advice must be readily available to the farmers. Considering allfactors, it is estimated that not over 40,000 of the estimated 160,000 acof alkali soils in the project area will be reclaimed during the projectconstruction period.
13. The reclamation of alkali soils would have to be monitored and itsprogress controlled by a soils laboratory equipped for the task. Such a lab-oratory would also check leaching requirements and monitor the bettermentprocess, on saline soils. The soils laboratory now in Bahawalpur (Annex 13)would have to be supplied with suitable additional equipment to fulfill thistask. Such equipment would include conductivity bridges, pH meters, a flamephotometer, shakers and sieves; also soil sampling tools and equipment totest soil permeability. Estimated costs are given in Annex 6, "Survey andLaboratory Equipment."
14. Drainage. Provision for drainage will restore waterlogged land tofull productivity, permit the application of full irrigation supplies to landthat is now under-irrigated because of drainage problems and allow the recla-mation of a large acreage of severely salt-affected land. It is estimatedthat about 100,000 ac of land are now waterlogged, an equal or larger areacannot be more intensively cropped because of incipient waterlogging, andperhaps another 200,000 ac could be reclaimed and made available for profit-able cropping by provision for adequate drainage facilities.
November 1977
40

ANNEX 2Table 1
PAKISTAN
SALINITY CONTROL AND RECLAMATION PROJECT (SCARP) VI
Saline and Alkali Soils(by subdivision and by ground water classification)
2/ 4/1/ Apparently Probably Trulv
Subdivision Classification Profiles Saline Alkali Alkali AlkLi;
(No.) (Z M% (% (%
Malkani Non-saline 274 40 36 14 10
Rukanpur Non-saline 219 38 42 16 12
Ahmadpur Lamma Non-saline 145 44 41 14 10
Bhong Non-saline 183 45 44 16 13
Pacca Laran Saline 262 51 48 16 12
Allahabad Non-saline 257 51 46 18 12
Khanpur Saline 296 49 36 7 4
Kot Samaba Saline 282 51 44 13 11
Rahimyar Khan Saline 210 60 47 5 3
Project Total and Averages 2,130 48 42 13 10
1/ ECe = 4 mmhos or more. (About 30% salty enough to affect crop growth.)2/ SAR = 13 or more, or ESP = 15 or more.3/ SAR = 30 or more within' root zone (3 ft or less), little or no gypsum present and
soil permeability low.4/ Truly alkali plus half the profiles with SAR between 20 and 30, containing
no gypsum.
41
ANNEX 3Page 1
PAKISTAN
SALINITY CONTROL AND RECLAMATION PROJECT (SCARP) VI
Groundwater: Recharge, Quality and Levels
A. Present Situation
1. The Aquifer. The pro-ject area is on an alluvial complex of recentage, deposited by the ancestral rivers of the Indus drainage system. Thealluvium consists predominantly of coarse clastic sediments and is saturatedwith water, often to within a few feet of the ground surface, thus consti-tuting an extensive aquifer.
2. The thickness of the alluvium is not known accurately, but it isthought to exceed 1,500 ft in places and is known to be more than 400 fteverywhere in the project area. The bulk of the alluvium consists of fairlywell sorted fine to medium sand. Silty sands and silts are common; claysare generally rare. Layers of gravel-like carbonate concentrations (kankar)of irregular size are found scattered in the subsoil.
3. The nature and properties of the alluvium have been studied bymeans of approximately 100 boreholes and test wells, including pumpingtests and piezometers associatecl with some of them. The distribution ofthe various lithologies is not uniform. Clays and silts are common atshallow depths, particularly in the southeast of the area, where the upper-most deposits may be related to the smaller old Hakra River, rather than oneof the major tributaries of the Indus system. Nevertheless, even in thatarea, sands predominate below seme 50 ft depth.
4. The hydraulic properties of the aquifer are available from the ninepumping tests carried out by WASID (Table 1). Results show that the calcu-lated transmission and storage parameters of the aquifer fall within a satis-factory and narrow range. Vertical permeabilities of the water table zone arehigh, despite the occurrence of clay and kankar layers.
5. Groundwater Quality distribution in the area (as in the rest of theIndus alluvial system) is complex. In broad terms, there is a wide trough offresh water parallel to the river, a transitional belt, 4 km wide, runningmore or less along the main railway line, and a saline water zone to thesouthwest, towards the Cholistar Desert. In terms of the development units,Units II and III are underlain mainly by fresh groundwater and Units IV andV by saline groundwater. There is considerable variation in groundwaterquality for all areas: patches of poor quality water occur in fresh ground-water areas and some water of reasonable quality is found in the saline zone.
42
ANNEX 3Page 2
Table 2 shows this variation clearly. The overall quality of fresh ground-water in Units II and III, particularly as regards conjunctive use with thevery high quality river supplies, is satisfactory; however, in Units IV andV the water quality is generally not suitable for irrigation.
6. Groundwater Levels in the project area have been monitored since1928 (i.e. four years before the Panjnad Headworks were constructed), usinga network of 155 shallow observation wells. Some of them have been installedonly recently and a few are not functioning properly, nevertheless the datagive a fairly clear idea of changes in the water table since the introduc-tion of controlled irrigation. The Panjnad Main Line now runs along a topo-graphic high, which was previously used by a series of inundation channels.The leakage had produced a high water table in a portion of the area longbefore 1932. Further to the southeast, in the present perennial area, wherethe inundation supplies were much smaller and less reliable, the water tablewas much lower. The whole system was probably in equilibrium, with the mainoutflow being subsurface drainage towards the southeast. The constructionof the Panjnad Headworks and its associated canal system resulted in watertable rise until a new equilibrium was achieved by subsurface outflows towardsthe Cholistan Desert or the adjacent Gudu Command, evaporation and evapo-transpiration from the higher water tables and by groundwater abstractionsfrom open wells and tubewells.
7. In almost all areas, the water table appears once again to be inbalance, and has not changed significantly since about 1960. The main outflowis thought to be evaporation or evapotranspiration from the water table exceptin Unit III, where, on average, the water table is deeper than 10 ft belowground level, and the recharge from drainable surplus is balanced mainly bywell abstractions and subsurface outflow. The position of the water tableand its variation in recent years is summarized in Tables 3 and 4. The water-logging problem is not severe under the present irrigation regime. Overall,14% of the total Abbasia and Panjnad Command has the water table within fivefeet of the ground surface. In about half the total area the water table isbetween five and ten feet and in the rest deeper than 10 ft. With reason-able agricultural management, water tables more than five feet in depthshould have little or no adverse effect on field crop production (Annex 2).
Groundwater Balance
8. Subsurface inflow was computed using the Darcy equation with thefollowing parameters:
Average lateral permeability = 0.0015 ft/secEffective aquifer thickness = 400 ftAquifer width = 12.3 mile 4Average hydraulic gradient = 4.5 x 10
An estimate based on these figures is an inflow of 12,700 ac-ft per annum.This contribution is mainly down valley, via Unit I. In terms of the projectarea of this appraisal the gains are in Units II and IV. It is considered that
43

ANNEX 3Page 3
this subsurface inflow will be reduced to negligible proportion by the im-plementation of a tubewell pumping scheme at present under construction inUnit I.
9. Seepage from Rivers. Total seepage from the rivers to the aquifersof the Northern Indus Plains has been estimated at about 2.0 MAF per annum.This is assumed to be constant per unit length of river bank and would there-fore give the following recharge to the project area:
Unit II 0.0417 MAF/annumUnit III 0.0493 MAF/annumUnit IV 0Unit V 0
10. Seepage from Canals. The conveyance losses have been estimated asfollows for main canals and branches:
QA = 0.0133xLxQ 0.5625
Where QA = losses in a reach in cusecsQ = discharge in the reach in cusecsL = length of the reach in thousands of feet
Of these losses, 10% are taken as evaporation and 90% as seepage losses,i.e. aquifer replenishment. Ia distributaries including minors, the totallosses are taken as 15% of supplies at head, of which 80% is seepage.
11. The total losses from canals and distributaries come to about 35%of diversions at the Panjnad Headworks, about 15% of which is lost to thesystem by evaporation and non-beneficial evapotranspiration. Thus, rechargeto the aquifer is about 30% of headworks diversions.
12. The areawise distriblition of this recharge is not uniform as moremain and branch canals pass through Units I and II than elsewhere. Usingavailable data, the recharge i3 distributed as follows: (Unit I is includedfor completeness):
Unit I 21% of the totalUnit II 31% of the totalUnit III 20% of the totalUnit IV 5% of the totalUnit V 23% of the total
13. Losses from Watercou:rses and Irrigated Fields. The losses fromwatercourses are taken as 10% of the deliveries at the watercourse head,half of which is assumed to reach the water table and half is wasted byevaporation. Deep percolation from irrigated fields is taken as 20% ofsupplies delivered at the heads of watercourses, a figure supported by allavailable reports. Thus, the total losses from watercourses and irrigated
44

ANNEX 3Page 4
fields are estimated to be 30% of deliveries at watercourses head. Thecontribution to recharge from these sources is taken as 25% of deliveriesat watercourse head, which is equivalent to 16.25% of diversions at thePanjnad Headworks for water from that source.
14. Rainfall Percolation, based on the annual median value of rainfallof two inches, is distributed as follows:
Unit II 0.0240 MAFUnit III 0.0282 MAFUnit IV 0.0039 MAFUnit V 0.0252 MAF
15. Subsurface Outflow was computed as for the inflow, using the follow-ing parameters:
aquifer width 11.8 milesaverage hydraulic gradient 5.2x10
and permeability and effective aquifer depth as before. The calculated out-flow is 14,000 AF per annum.
16. Abstractions by Wells: The present estimated groundwater abstrac-tions by tubewells and open wells are as follows:
1974-75Type of Wells/Unit II III IV V Total
-------------------ac -ft -------------------…----
Open Wells 90,002 65,385 48 9,242 164,677Public Tubewells 35,843 6,990 - - 42,833Private Tubewells 142,018 195,577 3,348 41,415 382,358
Total 267,863 267,952 3,496 50,657 589,868
It is estimated that of the total of approximately 0.6 MAF of pumpage, some25% or 0.15 MAF per annum is returned to the aquifer as seepage.
17. Evaporation and Evapotranspiration from the groundwater table aretaken as the major outflow components of the balance equation. However, asthey cannot be measured and are difficult to estimate, they generally arecalculated by difference. Evaporative losses included are either evaporateddirectly from the water table or transpired by vegetation with roots near thewater table. Of these, direct evaporation is the major component.
18. Because of differences in depth to water table and variation in soiltypes, evaporation losses can be estimated only roughly. However, the estimatesobtained by difference must be checked to make sure that they are reasonable.Table 5 gives a groundwater balance with such estimates of water table evapora-tion. Converting these figures to depth of water evaporated and percentage ofpotential "open water" evaporation gives the following (Unit I is includedfor comparison):
45

ANNEX 3Page 5
Estimai:ed Annual Percentage of OpenUnit Evaporation (feet) Water Evaporation /a
I 1.22 20II 0.99 16III 0.62 10IV 1.15 19V 0.83 14
/a Open water evaporation is taken as 6 feet.
The highest evaporation is in Unit I where the water table is nearest tothe surface, and lowest evaporation is in Unit III where the water tableis deepest. The calculated evaporative losses in Units III, IV and V areprobably high because the method ignores subsurface drainage which may beconsiderable in these cases. Ir Unit IV in particular, there is a steepwater table gradient towards the Cholistan Desert, and subsurface outflowis probably responsible for the relatively large calculated evaporativeloss. In Unit III also, there miight be a significant amount of subsurfaceoutflow to the southwest, towards Gudu Command.
B. PROPOSED DEVELOPMENT
The General Setting
19. The proposed developments would control the water table in areaswhich need subsurface drainage now or in the near future, and exploit thegroundwater resource for additional irrigation supplies, where the qualityis satisfactory. The estimated groundwater recharge by Unit at full develop-ment is expected to be as follows:
Unit Unit Unit Unit ProjectSource of Recharge II III IV V Area
-------- - -MAF -- --
Seepage from Rivers 0.042 0.049 - - 0.091
Seepage from Canals 0.506 0.327 0.082 0.376 1.291Seepage from Watercoursesand Irrigated Fields 0.154 0.213 0.071 0.385 0.782
Percolation fromRainfall ).024 0.028 0.004 0.025 0.081
Total 0.726 0.617 0.157 0.786 2,245
The figures show inflows from surface sources only and do not include anyrecirculation components from irrigation with groundwater. Also the subsur-face inflows and outflows to eachl unit are ignored.
46

ANNEX 3Page 6
Unit-Wise Development Criteria
20. Unit II is a fresh groundwater area and some parts of it sufferfrom waterlogging. Recently, some 44,000 acres of the commanded area had thewater table at less than five feet from ground level. Much of the severewaterlogging occurs close to Panjnad Main Line and other major canals. Inaddition to the subsurface drainage problems, part of the area (close tothe main Panjnad-Khanpur Road) is a topographic low, which is subject tofrequent flooding by spill water from the river, canals and rainstorms.
21. Because the canals conveying supplies to Units III and V pass throughUnit II and have high seepage losses, the drainable surplus is particularlyhigh. Since groundwater levels are mostly above the canal bottoms, seepagewould increase if lowered. Calculations have shown that if all the kharifirrigation requirements were supplied from surface sources, the drainablesurplus would be greater than the rabi water demand for the design inten-sities and it would be necessary to export groundwater from the area tomaintain a satisfactory groundwater level.
22. Because of the complex interrelationships between groundwater irri-gation and drainage in this Unit, it is proposed that development be based onpublic tubewells. Most of these would pump directly into watercourses forlocal use. Some would intercept seepage from the major sources of waterlog-ging and dispose of it into a convenient canal for export. A few of thewells might have to serve both purposes; if so they would be provided with adual disposal system.
23. The groundwater balance would be maintained as shown:
Inflows (MAF per annum)
1. Seepage from Rivers 0.0422. Seepage from Canals 0.552 /a3. Seepage from Watercourses and Irrigated Fields 0.1544. Percolation from Rainfall 0.0245. Return Flow from Well Irrigation 0.193
Total 0.965
Outflows (MAF per annum)
1. Abstraction by Public Wells for Export 0.2042. Abstraction by Public Wells for Local Irrigation 0.6913. Abstraction by Private Wells 0.070 /b
Total 0.965
/a This figure includes an estimated increase in canal seepagecaused by installation of wells along leaky canals.
/b It is assumed that the output from existing private wells willreduce to about half of its present value.
47

ANNEX 3Page 7
24. The peak demand for the tubewell water for local irrigation isestimated at about 2,000 cusecs constant flow in October and early November.Assuming, pro rata that about 9% of this will be supplied by private wells,tubewells are required to produce 1,820 cusecs. The highest operating factorthat could be maintained for about 45 days is considered to be 90%. Thus,the installed capacity requirerment for the public wells is at least 2,022cusecs, distributed as follows to suit the pattern of watercourse locationsand sizes:
Capacity No.(cusecs)
2.0 2862.5 1603.0 350
The overall annual operating factor of these wells on the basis of the irri-gation demand for tubewell water is 0.48 or about 4,150 hours per year.
25. Additional capacity will be required to cope with the more seriouscases of canal seepage; the grcundwater would be exported via the irrigationcanal system. Some 400 cusecs of pumpage capacity would be required, involv-ing 135 tubewells of three cusec capacity each, pumping about 70% of the time.
26. Unit III is a fresh groundwater area which does not need subsurfacedrainage. Data for depth to water table show that none of the area has thewater table at five feet or less and in only 12% of the area is the watertable less than 10 feet from the ground surface. Furthermore, it appears thatgroundwater levels are stable under existing conditions, due probably to sub-surface outflow rather than evaporation. Even with increased canal supplies,a rapid rise in water tables to dangerous levels is unlikely as at the proposedcropping intensities (at full development) the drainable surplus would bebalanced by rabi irrigation demand. Thus, the area seems ideal for privatewell development. The local farmers appear to have recognized this and thereare substantially more private tubewells in Unit III than any other part ofthe project area.
27. The water balance at full development is estimated below:
48

ANNEX 3Page 8
Inflows (MAF per annum)
1. Seepage from Rivers 0.0492. Seepage from Canals 0.3273. Seepage from Watercourses and Irrigated Fields 0.2134. Percolation from Rainfall 0.0285. Return Flow Well Irrigation 0.147
Total 0.764
Outflows (MAF per annum)
1. Abstractions by Existing Private Tubewells 0.3622. Abstractions by Future Private Tubewells 0.275
Total 0.637
As can be seen, there is an apparent imbalance of 0.127 MAF per annum, withthe calculated drainable surplus exceeding the proposed pumpage. However, adifference of this magnitude is most unlikely to lead to a rise in water ta!)1-as the calculated undrained surplus under existing conditions is considerablylarger than this, and yet the water table appears to be stable and at accept-able depths.
28. Under the project, tubewell operation in the kharif would virtuallycease as the present irrigation deficit would be met by increased canal sup-plies; thereafter wells will be used almost entirely for rabi irrigation.
29. Estimated pumpage of existing wells in the future is based on theirinstalled capacity, but with demands calculated on the basis of a croppingpattern compatible with the planned development. The estimated peak demandis some 3,300 cusecs constant flow in late October. Assuming that privatewells would be operated at a high operating factor (say, 18 hours/day or0.75) for a short time (15 days), overall annual operating factors would beabout 20%.
30. The installed capacity of existing wells is estimated to be 2,500cusecs. Therefore, an additional capacity of about 1,900 cusecs is requiredto meet the peak demand. For the purpose of cost estimates, tubewells to beinstalled are assumed to be as follows:
49

ANNEX 3Page 9
No. of Rated OperatingTubewells Capacity Factor %
1,000 0.5 201,000 1.0 20267 1.5 20
31. Unit IV is a small saLine groundwater area, located on the edge ofUnit I, next to the desert fringe. It has some waterlogging problems alongits boundary with Unit I, but the water table falls off very rapidly towardsthe desert where there is obviously considerable drainage by subsurface out-flow. The waterlogging problem at the boundary with Unit I will be greatlyimproved by the tubewell drainage system that is presently being constructed.Therefore, no drainage works fo:r Unit IV are proposed. There are a few pri-vate wells in the area, probablv producing water of marginal quality. Theseshould continue to operate. The groundwater balance under full developmentis given below:
Inflows (MAF per annum)
1. Seepage from Canals 0.0822. Seepage from Watercourses and Irrigated Fields 0.0713. Percolation from Rainfall 0.004
Total 0.157
Outflows (MAF per annum)
1. Abstraction by Wells 0.0032. Evaporation and Su.bsurface Outflow 0.154
Total 0.157
Unit V is a saline groundwater area, though some moderate and good qualitywater may be found at its south-eastern boundary and in small, isolatedpockets elsewhere. The topographic low, mentioned under Unit II, stretchesinto Unit V to the southeast of Rahimyar Khan and Sadiqabad. On account ofthis, part of the area suffers from severe waterlogging with some 82,000 acreshaving the water table at less than 5 feet from ground surface and is subjectto periodic flooding by river or canal overspill and rainstorm water. Also,data show that in June 1974, 712 of the area had the water table at between5 and 10 feet from ground level. Thus, part of the area needs subsurfacedrainage now. Furthermore, since it is proposed to increase canal supplies,the waterlogging problem would increase unless preventive measures are taken.It is estimated that some 300,OCO acres (about 52% of the CCA) should be pro-vided with drainage wells.
50

ANNEX 3Page 10
32. The upper parts of the aquifer in Unit V contain a high proportionof clayey material, which in this area would not impede drainage by tubewells,since the material is permeable (Annex 2, and Table 1). This conclusion issupported by the absence of perched water tables in the area.
33. The drainage requirement for the 300,000 acres would be met by 250drainage wells, each of 3 cusec capacity operating at a factor of 0.7 (or6,132 hours per year), installed on (or as near as practicable to) a triangulargrid. To be left out of this drainage scheme is the desert fringe, which ap-parently is drained to some extent by subsurface outflow towards the desert,and the area adjacent to the Gudu Command where the water table is reasonablydeep. The groundwater balance in the area under full development conditionsis shown below.
Inflows (MAF per annum)
1. Seepage from Canals 0.3762. Seepage from Watercourses and Irrigated Fields 0.3853. Percolation from Rainfall 0.0254. Seepage from Disposal Drains /a 0.038
Total 0.824Outflows (MAF per annum)
1. Abstractions by Private Wells 0.0512. Pumpage by Public Drainage Wells 0.3803. Evaporation and Subsurface Outflow 0.393
Total 0.824
/a Seepage from drains is estimated as 10% of their flow.
November 1977
51

PAKISTAN
SALINITY CONTROL AND RECLAMATION PROJECT (SCARP) VI
Results of Pumping Tests in the Project Area
Lateral Vertical SpecificPermeability Permeability Yield of
Depth Length Depth of Discharge Duration Maximum Specific of the Screened of Water- Water TableWell of Well of Screen Water Table Rate of Test Drawdown Capacity Interval Table Zone ZoneNo. (ft) (ft) (ft) (cusecs) (hours) (ft) (cusec/ft) (ft/sec) (ft/sec) (fraction)
Wi 205 120 14.40 3.1 96 15.70 0.20 0.0022 0.00016 0.16
W2 215 130 7.62 3.0 110 14.62 0.21 0.0021 0.00011 0.07
W3 200 120 8.90 3.5 96 18.80 0.19 0.0017 0 00n1n 0iiP
W4 215 130 6.50 2.7 96 15.16 0.18 0.0013 0.00057 0.06
W5 215 128 8.25 2.5 91 14.00 0.18 0.0019 0.00011 0.10
W6 205 125 7.37 2.5 96 21.27 0.12 0.0013 0.00010 0.16
W7 208 120 9.65 3.0 96 16.50 0.18 0.0021 0.00012 _
W8 220 135 7.47 2.7 96 14.16 0.19 0.0018 0.00013
W9 210 125 8.60 2.4 102 14.40 0.17 0.0016 0.00017 -
Average - - - - - - 0.18 0.0018 0.00018 0.12
H BSource: Sabasun Technical Services (1976) X >
H L
U,

PAKISTAN
SALINITY CONTROL AND RECLAMATION PROJECT (SCARP) VI
Groundwater Quality
(Tubewell Water)
Quality / Area UNIT II UNIT III UNIT IV UNIT V
EC x 106 No. of Percent No. of Percent No. of Percent No. f Percent
@ 25°C SAR Wells of Wells Wells of Wells Wells of Wells Wells of Wells
< 1400 <10* 633 93.8 436 96.0 4 12.1 152 52.81400-2500 ?15 34 5.0 12 2.7 9 27.3 70 24.3
2500-3200 '20 4 0.6 2 0.4 6 18.2 34 11.8
p3200 -25 4 0.6 4 0.9 14 42.4 32 11.1
Totals 675 100.0 454 100.0 33 100.0 288 100.0
*Most of the SAR values are less than 5.
Source: Sabasun Technical Services (1976)
rI-tTX

PAKISTAN
SALINITY CONTROL AND RECLAMATION PROJECT (SCARP) VI
Water Table Depth Distribution(June 1974)
Area Within Depth Range SpecifiedUnit GCA 5 feet 5-10 feet 10-15 feet 15 feet
(000's 000's % of 000's % of 000's % of 000's % ofacres) acres GCA acres GCA acres GCA acres GCA
I 216 102 47 111 52 3 1 0 0
II 374 44 12 250 67 80 21 0 0
III 426 0 0 50 12 261 61 115 27
IV 95 13 V J i) 47 55 17 20
V 575 82 14 409 71 81 14 3 1
Total 1,676 236 14 833 50 472 28 135 8
Source: Sabasun Technical Services (1976)
rb>

PAKISTAN
SALINITY CONTROL AND RECLAMATION PROJECT (SCARP) VI
Water Table Depth Variation
Area Within Depth Range Specified
Date 5 Feet 5 to 10 Feet 10 to 15 Feet 15 Feet
000's Acres % of GCA 000's Acres % of GCA 000's Acres % of GCA 000's Acres % of GCA
June 1943 34 2 226 14 426 25 990 59
June 1947 26 2 279 16 482 29 889 53
June 1955 121 7 820 49 568 34 167 10
June 1960 211 12 899 54 499 30 67 4
June 1970 496 30 845 50 316 19 19 1
June 1973 188 11 947 57 491 29 50 3
Oct. 1973 582 35 704 42 349 21 41 2
June 1974 236 14 833 50 472 28 135 8
Source: Sabasun Technical Services (1976)
F3 t>
>~~~~~~~~~~~~~~~~~~~~~~~~~~~~~~~4 ,

ANNEX 3Table 5
PAKISTAN
SALINITY CONTROL AND RECLAMATION PROJECT (SCARP VI)
Groundwater Balance - Existing Situation(Average Year)
Unit Unit Unit Unit Unit ProjectInflows* I II III IV V Area
- - - MAF/annum
Seepage from rivers 0.013 0.042 0.049 0.000 0.000 0.104Seepage from canals 0.247 0.365 0.235 0.059 0.270 1.176Seepage from watercoursesand irrigated fields 0.083 0.141 0.158 0.036 0.219 0.637
Returu flow from wellirrigation 0.030 0.067 0.067 0.001 0.013 0.178
Percolation from rainfall 0.013 0.024 0.028 0.004 0.025 0.094
Total Inflows 0.386 0.639 0.537 0.100 0.527 2.189
Outflows*
Abstraction by wells 0.120 0.268 0.268 0.003 0.051 0.710Evaporative losses
(calculated by difference) 0.266 0.371 0.269 0.097 0.476 1.479
Total Outflows 0.386 0.639 0.537 0.100 0.527 2.189
* Sub-surface inflow and outflow are i,gnored.
Source: WAPDA (1976)and Mission Estimat:es (1976)
56
ANNEX 4Page 1
PAKISTAN
SALINITY CONTROL AND RECLAMATION PROJECT (SCARP) VI
Project Works
A. Canal Remodeling
Design Criteria
1. Annex 9 develops the water requirements at the barrage for each ofthe project units. Units II, III and V get their surface supplies via thePanjnad Canal; Unit IV from the Abbasia Canal. Unit I, which is part of theSCARP VI area but not of the project under consideration, derives its surfacesupplies from both main canals. The pumpage generated within that unit isall reused, therefore its water requirement is only of concern for canalremodeling insofar as it makes demands on the main canals.
2. Table 1 converts the diversion requirements shown in Annex 9 intoflow figures required to provide the water. The flow figures required forUnit I have been taken from the appropriate planning report as approved byGOP for execution. No allowance has been made for future requirements of anextension project approved under the name Abbasia Flood Channel (AFC) Proj-ect because the original design of the Abbasia Canal and its headworks madeallowances for the expected need of the AFC area.
3. Table 2 compares the salient features of the proposed requirementsof the canals with those of the original design and the present operatingconditions. It shows that while the maximum discharge in the Panjnad maincanal has to be increased by 38Z and that of the Abbasia by 18%, the ratiobetween maximum and minimum discharge would actually narrow considerably,thereby easing operating problems. Since the Panjnad main canal servesseasonal and perennial areas, a further narrowing of the discharge ratio isnot practicable.
Remodeling Design and Works
4. In designing the remodeled system, note will have to be taken ofthe fact that many of the original design cross sections have changed, partlythrough siltation and partly through scouring brought about by excessive dis-charges being forced into some of the canals. Consequently, a detailed surveyof all main and branch canals would be required before the final quantitiesof earthwork to be carried out can be accurately established. Sample designs,based on actual surveys, have been made; the extent of the necessary works,which may require minor adjustment in the light of the eventually adopteddesign cropping pattern (Annex 15) are listed below:
57

ANNEX 4Page 2
5. Intake Structures. The intake capacity of both the main canal gatesat the headworks is adequate to accevt the required discharges.
6. The Paninad Canal Command.
(a) The Panjnad main canal would have to be strengthened and thefreeboard increased for safety.
(b) The Minchin branch canal wll continue at its present dis-charge rate but with a rediced command area. Some of itsright bank distributaries 41ll receive water from two newfeeder canals. Their comb.ned length would be about 30 mi(32 canal miles of 5000 ft .
(c) The Rahimyar Khan Branch wuuld be similarly remodelled withtwo new feeders on its right bank. Their combined lengthwould be about 24 miles (2; canal miles).
(d) The Sadiq Branch would be supported by one parallel canalwhich would originate from the same regulator as the SadiqBranch. It would be 48 miles long (51 canal mi).
(e) The Dallas branch, which al present provides most of thewater to Unit III will require minor modification andstrengthening; the structuies would appear to be adequate.
7. Sections that would, after remodelling, have still to convey morewater than at present would be able to do so after deepening and the strength-ening of their banks. The structures would be able to pass the additional dis-charge with only minor modifications.
8. The Abbasia Command. The capacity of the top reach of the canal,which is perennial, would have to be augmented by a parallel canal, about 25mi (26.5 canal mi) long. The rest of the system would be remodelled, as re-quired by deepening and strengthening the canals; the structures are adequate.
9. In summary, the following works require to be done on the canalsystem:
Additional Deepening and StrengtheningParallel Canals Major Canals
m/c.m. m/c.m.
Panjnad Command 102/107 215/227Abbasia Command 25/26.5 16.5/17.4
Note: m = mile (5,280 ft)c.m. = canal mile (5,000 ft)
58

ANNEX 4Page 3
10. The total length of subordinate canals, with a carrying capacitybetween 800 cusecs and 10 cusecs, averaging about 180 cusecs, is about 1,240mi. Based on sample surveys, it is estimated that about half the total lengthwould require some remodelling, the other half, once restored to its designdimensions and strength, would require no additional work.
New Watercourse Commands
11. To enable the more efficient utilization of the additional water,it would not be prudent to increase the flow of any existing watercoursechannel above 1.5 cusecs. Therefore, new modules would have to be built andnew watercourse commands established; these would not exceed the area that, atpeak discharge, requires more than 1 cusec. It is estimated that up to 1,500new modules would have to be built, about 1,000 of the old modules altered andabout 1,100 miles of new watercourse channels constructed.
Irrigation System Operation
12. The Problem. Under project conditions, operation of the irrigationsystem will become more complex than before, because instead of the kharifirrigation supplies coming only from diversions, large amounts will come fromgroundwater abstraction within the project area (Annex 9). Therefore, opera-tions will be a combination of barrage diversions, fresh groundwater use with-in Unit II and export of fresh groundwater to Unit V. A small "desk top" typedigital computer by the Panjnad Barrage would be necessary to coordinateoperations.
13. Computer Operations. The computer would be used to:
(a) predict demand at the Barrage; and
(b) provide operating instructions for surface and groundwaterirrigation supplies.
Input data to the computer which would be run each day would consist ofconstant and varying inputs. Constant inputs would be:
(a) losses expressed as percentage of discharges;
(b) irrigation control structure characteristics and maximumdischarge capacity;
(c) individual canal conveyance capacities and maximum allow-able flow ratios to maintain regime;
(d) recharge expressed as percentages of canal flows and fieldlosses;
(e) depth to groundwater limitations;
(f) tubewell pump characteristics and limitations. 59
ANNEX 4Page 4
Variable inputs would consist cf:
(a) rainfall in past 24 hours by canal command;
(b) crops being grown by minor canal command;
(c) canal discharges measured in the past 24 hours.
14. Computer Outputs. The computer would print out the following:
(a) demand at barrage;
(b) discharges required in main, branch, distributary and minorcanals;
(c) gate openings required at all major irrigation control structures;
(d) escape operation;
(e) FGW well operation (watercourse wells);
(f) FGW well operation (export wells);
(g) SGW well operation; aad
(h) evaporation pond pump settings.
Cost Estimates
15. Investment Costs. De: ived largely from sample surveys of relativelyshort canal sections, and from i:he extent of anticipated work outlined inparas 6-10 above, it is estimated that the total cost of canal remodelling,inclusive of constructing the modules and the new watercourse channels, wouldbe Rs 180 X, including an indirect foreign exchange component for fuel, oiland lubricants, of Rs 13.5 M. P'rovision is also made for purchase of remodel-ing equipment estimated to cost Rs 40 M (foreign exchange component Rs 32 M).The computer would cost about Rs 200,000, all of it in foreign exchange.
16. Operation and Maintenance. Despite the remodelling, it is not ex-pected that the 0 and M costs oif the remodelled canal system will be signifi-cantly higher than at present. More efficient system operation would reducemaintenance costs per mile of canal, besides markedly contributing to in-creasing irrigation efficiencies. Consequently, it is assumed that 0 and Mcosts of the remodelled system will be the same per acre CCA as at present,i.e. Rs 20, or Rs 25.4 M per annum for the project area.
Construction Methods
17. Since much of the remcdelling would be done while the canals areflowing, the most suitable machine would be a dragline. The construction ofparallel canals and the remodelling of seasonal branches would be done byscrapers, bulldozers or hand labor assisted by donkeys. 60
ANNEX 4Page 5
18. Canal remodelling should be scheduled to fit in with the requirementsof the Irrigation Department and the farmers which are subject to variation atshort notice, and also involves question of access and the disposal of spoil.These complications preclude the use of international contractors, and remodel-ling works would therefore be carried out after local competitive bidding.
19. The successful bidders might need to augment their fleet of equip-ment by importing new machinery or spares. In anticipation of this, the localand foreign cost estimates are as follows:
20. Cost Summary
Local Foreign Total- -- M. Rs.
Canal Remodelling 174.5 45.5 220.0
Computer andCommunicationEquipment - 10.0 1.0
Total 201.2 58.6 259.8
B. Well Field Design, Well Construction and Operating Costs
Introduction
21. Under the project there would be four types of tubewells: in UnitV, 3 cusec wells pumping water that would be taken to evaporation ponds; inUnit II, 3 cusec wells pumping water into the irrigation canals; also in UnitII, wells of 2 to 3 cusec discharge, pumping into water courses and in UnitIII, wells of 1/2 to 1-1/2 cusec discharge, pumping into field channelsfor use by the well owner or owner group.
The Drainage Wells
22. The aim of the salt water tubewells is to reduce and maintain thewatertable at a maximum possible elevation consistent with not impeding cropyields or imposing the use of special farming techniques (Annex 2). Suchuniformity is best achieved by a well-field layout as nearly as possible ona triangular grid system. Therefore, consistent with topography and the lay-out of the drainage disposal network, there would be one well per 1,200 ac
61

ANNEX 4Page 6
of CCA, i.e., the approximate distance between the wells would be 2 mi.Totall number of wells would be 25:).
23. Casings and well screen!3 would -be made of fiberglass, which wouldresist corrosion and incrustation. The turbine pumps and drive shaft wouldbe of material that would resist iorrosion, such as stainless steel. Unitcost of the components is given ii Table 3. The cost of one well, inclusiveof civil works for connecting to the main disposal system, would be Rs 208,000(Table 4). Total cost of this coaponent would be Rs 52 million, inclusive offoreign exchange of Rs 36 million,
Fresh Water Export Wells
24. In Unit II, 135 3 cusec wells would be required to export waterwhich would be surplus to irrigat::.on requirements. These wells would besituated in depressions where the groundwater levels at present are high andare likely always to be so and along the main canals from which there is un-avoidable heavy seepage to the war:ertable. The wells would return water intothe major canals for export into unit V, where it would be used for irrigation.The wells would be operating throughout the year.
25, Design of these wells would be the same as that of the drainagewells: casings and screens would be of fiberglass, the pumps would be turbinepumps. However, the material of vhich the pumps and drive shafts would bemade need not be corrosion resistcnt, which reduces the overall cost of thewells to Rs 141,000, inclusive of the disposal works (Table 5). Cost of thiscomponent would be Rs 19 million, inclusive of a foreign exchange componentof Rs 7.9 million.
The Irrigation Wells
26. Rabi crop water requirenents (Annex 9) make it necessary to installa pumping capacity of approximately 2,100 cusecs. A preliminary assessmentof tubewell numbers and sites concluded that their distribution as to sizewould be as follows:
No. Capacity Operation(hr/year)
286 2.( ) 4,150100 2.' )350 3.C ) (48%)
27. These wells would be at or very near the module and discharge directlyinto the watercourse. Water distribution would be in the same manner, and ac-cording to the same rotation (warabundi) as for surface flows. The exact numberin each size class would therefore depend on the final number of watercoursesin the Unit after remodelling, and on the size distribution of the watercoursemodules. The wells would be used also in the kharif, conjunctively with the
62

ANNEX 4Page 7
canals, to provide peak crop water requirements that are beyond the capacitiesof the canals to deliver.
28. Tubewell design, as before, would be of the submersible turbinetype, using the same materials and specifications as described for the sweet-water export wells (para 25). The expected cost of each kind is given inTables 5, 6, 7 and 8. This component of the project would cost Rs 124.2million, with a foreign exchange component of Rs 49.1 million.
Summary of Project Well Costs
29. The following list summarizes expected expenditure on publiclyoperated tubewells, inclusive of channelling the water into the trunk dis-posal system, but excluding electrification:
Local Costs Foreign Exchange Total
Drainage Wells 15.5 36.5 52.0Fresh-water ExportWells 11.1 7.9 19.0
Irrigation Wells 57.3 40.4 97.7
Total 84.9 84.8 168.7
Private Tubewells
30. In Unit III, the groundwater would be exploited by private enter-prise, sinking wells to irrigate either individual holdings or the farms andfields of farmers who jointly install and operate a well. Since surface watersupplies would be augmented through canal remodelling to supply the needs ofthe design cropping pattern, it is unlikely that these private wells would beused to any extent during the kharif. The ones to be installed under theproject, together with the already installed capacity of 2,500 cusecs, wouldmeet the requirements of the design cropping pattern for the rabi. The newwells, like the existing ones, are likely to be installed along the fieldchannels or the main watercourse channel but would serve an area smaller thana complete watercourse command.
31. The private wells would be on the surface or in a pit not exceeding7-8 ft in depth. Screens and casings would be of PVC, coir or brass, depend-ing on water quality. The pumps would be centrifugal, non-submersible and bedriven either by an electric motor, or more likely, at least initially, bya diesel engine. Cost estimates are given in Tables 8 to 16. In all cases,it was assumed that the power unit is commensurate with the load imposed onit. At present, the engines or motors are grossly oversized, leading tounwarrantably high capital and, in case of diesel engines, operating costs.
32. The numbers likely to be installed will depend on the kind and numberof farmers deciding to make the investment and any estimation is likely to behighly tentative. However, to arrive at an approximate figure, the followingassumptions were made:
63

ANNEX 4Page 8
CapacityNo. Kind Cusecs Local Cost Foreign Exchange Total
(Rs Million)
900 Diesel 0.5 14.2 6.4 20.6100 Electric /a 0.5 1.7 1.0 2.7900 Diesel /a 1.0 17.5 7.8 25.3100 Electric 1.0 2.0 1.1 3.1240 Diesel 1.5 5.4 2.4 7.827 Electric /a 1.5 0.6 0.3 0.9
2,267 - 41.4 19.0 60.4
/a Including Rs 10,000 per well connection charge; half localcosts, half F.E.
Operation and Maintenance Costs
33. Unit II. The economic price of electricity which would cover thefull operational cost of the supply system is estimated at Rs 0.30 per kWh.On the basis of the estimated operating factors, and assuming that operatingcosts other than fuel amount to Rs 5,000 per year, the annual cost of oper-ating wells in Unit II amounts to Rs 23.37 M. Spare parts and major over-hauls are assumed to cost the equivalent of half the pump and motor every tenyears, (Rs 28.31 M total), and complete replacement would be required every20 years. Annual annual O&M cost thus amounts to Rs 33.2 M.
34. Unit III. Annual operating costs for private wells have been cal-culated assuming a seven-year Life for the well and a ten-year life for theengine. The economic cost of diesel fuel is assumed to be Rs 6.50, andmaintenance costs are taken as Rs 1,500 per annum for diesel wells and Rs 750per annum for electric. At fuLl development, assuming the well size distri-bution shown in para 32, annua:L O&M costs amount to Rs 8.9 M.
35. The older, less efficient wells which are expected to pump morewater in rabi - primarily due to earlier closure of the canals - will requireadditional O&M expenditures amounting to a maximum of Rs 7.2 M, which woulddecline to Rs 2.2 M per annum as these are replaced by newer, more efficientwells.
36. Unit V. Fuel, operal:ing and maintenance costs of the drainagewells in Unit V are expected to cost Rs 6.67 M per annum. It is expectedthat the corrosive operating ernvironment will necessitate major overhauls,costing Rs 6.02 million every five years and complete replacement will berequired every 20 years.
64

ANNEX 4Page 9
C. Saline Effluent Disposal
The Problem and Development Alternatives
37. Saline effluent from the tubewells in Unit V could be dischargedinto the irrigation network or into the Indus, or taken completely out of thesystem, thereby establishing a net export of salts.
38. Available information would suggest that for several years effluentsalinities would be considerably in excess of what can safely be put back intothe irrigation system, even under the best conceivable water and soil manage-ment. Disposal into the river during the rabi would increase the overallsalinity of irrigation water so much that downstream farmers would have alegitimate complaint. Therefore, the best way of disposal appears to be totake the effluent altogether out of the irrigated area.
39. The Left Bank Outfall Drain (LBOD) which would discharge into thesea and would collect runoff from freak storms and saline effluent from thewhole Indus Left Bank area in the Sind, is at present under construction.Plans are to extend it, eventually, to the boundary of the project area.Therefore, the LBOD could eventually be used to convey the saline effluentinto the sea and thereby ensure that more salt leaves the project area thanwould enter it.
40. The LBOD, a very costly project, however, is unlikely to reach thenorthern Sind in less than two or three decades, and therefore an interimmethod of saline water disposal is required. The best alternative appears tobe the construction of a series of evaporation ponds in the Cholistan Desert,adjoining the project area. The ponds would be outside areas at present en-visaged for irrigation, such as the Abbasia Flood Channel area and the pro-posed extension of the command of the Kandera distributary.
Drain Design and Construction
41. To avoid excessive seepage and consequent recycling by the drainagewells, water levels in drains would be kept below ground level wherever pos-sible. While high-level drains would give command of the evaporation ponds,such a design would result in considerable seepage and damage to adjoiningagricultural land if the canals were unlined, or, alternatively, it would benecessary to line on a large scale. In any case, some stretches would have tobe lined, e.g. in sandy soils or where the drains cross depressions and wouldtherefore have command of the surrounding land, but as the land slopes to thesoutheast, such stretches are likely to be short. The drains would empty intofive evaporation ponds by means of low-lift pumping stations. When the LBODreaches the project area, the drains would bypass the pumping stations and bedirectly connected to it.
65
ANNEX 4Page 10
The Evaporation Ponds
42. It is expected that five evaporation ponds will have to be con-structed. The ponds would be formed by closing the gaps between the sanddunes with earth fill. The fill would be taken from nearby clay pans tominimize seepage losses. The ponds would have interconnecting overflowspillways; the lowermost pond would discharge into the Thar Desert. Thesurface area of the ponds was calculated from the amount of drainage effluentthat they would receive and the likely rate of evaporation. Annex 3 showsthe drainable surplus to be about 380,000 ac-ft. Evaporation of fresh waterin the desert near SCARP VI has been recorded to be 100" per annum. It isestimated that the saturated brine which will eventually fill the ponds wouldevaporate at the rate of 80" per annum. Therefore, the ponds have to be ofminimum surface area of 380,000: 6.67 = 57,000 ac; a safety margin is providedby seepage from the ponds.
Operation and Maintenance Problems
43. Drifting Sands. Examination of aerial photographs taken in 1953and 1976 show very little wind-induced movement of the dunes. This iscorroborated by the low recorded annual wind velocities. However, smallsand drifts are to be found across infrequently used tracks, and quite vio-lent, albeit short duration, saaldstorms do occur. Thus, drifting sandis likely to encroach into draiais (as it does into some irrigation canalsand watercourses) and would have to be cleaned out periodically as part ofthe maintenance operation. Some sand would no doubt blow into the ponds,but this is not likely to be a serious hazard.
44. Sediment picked up from the drains would also contribute to thefilling of the ponds, but owing to the flat gradients, minimal amounts areexpected to reach the ponds froti this source.
45. Salt deposits would crystallize through evaporation. Some of thissalt will undoubtedly be commercially exploited, as is done with similardeposits and effervescences elsewhere in the irrigated area. However, theponds size given in para 42 would be large enough to accommodate all depositsfor more than 100 years, and the LBOD will reach the project area long beforethen.
46. Aquatic Vegetation will not grow in the ponds after a few yearsbecause of the extremely high salinity of any standing water. However, basedon experience in the nearby SCARP Khairpur project, some of the drain sections,where the water contains less than 4,000 ppm of dissolved solids, may beaffected by aquatic weeds. Control would be partly by manual labor, partlyby establishing an operating regime that would enable sections of the drainsto dry out completely for a few weeks, which would kill most vegetation andallow the comparatively cheap removal of the desiccated remains.
66

ANNEX 4Page 11
Design and Costs of the System
47. The drainage canals. There would be five main drains leading intothe desert, distributed so that each would have a discharge of 100-110 cusecs.The total length of drains, including main and branch lines, but excludingthe short channels that would connect individual wells to the system,would be about 530 miles. The cost, based on current contract rates, isestimated at Rs 159.6 M, with a foreign exchange component of Rs 20.6 M.
48. The pumping stations would each consist of four axial flow lowlift pumps of 24" diameter each capable of pumping 38 cusecs through a liftof 10 feet. This would include one standby pump at each station. Costsare estimated as follows:
F.E. Local Total------- (Rs '000)- --
20 pumps, CIF 5,380 5,380freight and handling 323 20 343civil works on pump stations 58 422 480spares for pumps (15Z) 807 3 810
Total 6,568 445 7,013
49. Total cost of the saline effluent disposal system would thereforebe as follows:
F.E. Local Total-- __--- (Rs M) -------
Surface drains and ponds 20.6 139.0 159.6Pumping Stations 6.6 .4 7.0
Total 27.2 139.4 166.6
Additional Investigations Required
50. While the system layout and design studies carried out to date aresufficient to estimate costs, detailed survey work will be required to locateprecisely the ponds and the main, subsidiary and branch drains on the ground.
67

ANNEX 4Page 12
Detailed design of the drains would be done in conjunction with the design ofthe drainage well field and would take into consideration the demands made onit if, after an estimated 10 to 15 years, drainage wells would have to beinstalled in the remaining 150.,000 ac of Unit V. The gathering and collatingof all necessary information would be one of the Consultants' major tasks(Annex 7).
Surface Drainage
51. It should be noted that the drainage system described is for subsoildrainage only. The project area is however subject to occasional surfaceflooding from above-normal rainifall, and from the failure of river protectionworks. Surface drainage could be accommodated by using small local drainagesystems to collect water which could be pumped into a canal.
Operation and Maintenance Costsi
52. Pump Replacement Costs. The pumps are expected to require majoroverhaul every five years and complete replacement every 20 years. The five-yearly replacements are estimated to amount to 12.5% of the capital cost ofthe pumps. Hence, replacement costs would be as follows (in Rs '000):
Year 5 - 672Year 10 - 672Year 15 - 672Year 20 - 5,723Year 25 - 672Year 30 - 672
53. Energy Costs. Overall pump efficiency would be 65%. With an aver-age estimated lift of 10 ft the energy required would be as follows:
52 ft x 62.4 lbs x 10 ft x 1 sec x 0.746 kw x 365 days x 74s ft3 550 ft lb hp hp year
- 3,892,446 kWh/year.
The cost of electricity per kWh has been taken as Rs 0.3 per kWh. The costof pumping into evaporation ponds will therefore be about Rs 1.2 M/yr.
54. Other 0 & M Costs are those associated with staffing, transport,housing and repair facilities, and include routine maintenance of thedrainage system. The estimated costs are tabulated below.
68

ANNEX 4Page 13
Foreign LocalExchange Component Total-------------Rs '000-----
Pump station staffing - 255 255Other staff - 43 54Transportation 13 97 110Drain maintenance 27 187 214
Total 40 593 633
55. Total 0 & M Costs. Overall operation and maintenance costs foreffluent disposal are as follows:
Foreign LocalYear Exchange Component Total
------------------(Rs '000)---------------
1to 4 40 1,761 1,8015 712 1,761 2,473
6 to 9 40 1,761 1,80110 712 1,761 2,473
11 to 14 40 1,761 1,80115 712 1,761 2,473
16 to 19 40 1,761 1,80120 5,420 1,761 7,181
21 to 24 40 1,761 1,80125 712 1,761 2,473
D. Electricity Distribution Network
The Present Situation
56. The project area is flanked by two large power stations, one inMultan and another at Gudu with a generating capacity of 260 and 430 MW,respectively. Both feed into the 132 kV national grid line, which passesthrough the area. There is at present insufficient capacity to abstractpower due to the limited distribution network. Network density is greaternorth and west of the railway line, in Units II and III, than to the southand east, in Units IV and V. However, nowhere is extent and capacity ofthe distribution network adequate to meet the demands that will be imposedby the project.
69

ANNEX 4Page 14
Project Works and Costs
57. Under the project, additional power consumption would be around23 MW, the provision of which should present no problem from the nationalgrid, which is soon to receive substantial additional supplies from theTarbela generators. Power lines would have to be provided to Units II andV for the public tubewells and the effluent pumping stations. No worksdemanding electric power are contemplated in Unit IV and it is not proposedto provide any additional infrastructure in Unit III. Private wells, in thatUnit, if electrified, would be energized under WAPDA's ongoing expansionprogram.
58. Table 16 outlines the works necessary to energize all publiclyoperated wells. There is a physical contingency element in the extent ofthe 11 KV lines, as the exact location of the wells and the pumping stations,and consequently, the exact length of the line leading to them, will onlybe known after detailed design. However, the bill of quantities and thecosts are unlikely to differ subatantially from the estimates.
59. The table estimates total project electrification costs to beRs 249 M. While the whole of this sum would have to be committed by GOP,the project is only to be chargeil with 60% of it, the rest being attributableto rural electrification.
60. Pakistan has a well developed heavy electrical industry; neverthe-less some components, essential Eor complete network construction, are notmanufactured locally. However, all raw materials are imported. Consequently,the foreign exchange component oE electrification costs inclusive of engineer-ing and construction would be about 30%, free of all duties and taxes.
Project Execution
61. All materials, with the exception of 11 kV poles, would be procuredby WAPDA through international competitive bidding, in which Pakistani firmswould have a 15% advantage, or one equal to duties and taxes, whichever islower. Installation would be contracted through local competitive bidding,in which foreign-based firms may participate. It would be of utmost importanceto ensure that the electrification works are completed at the same time as theinstallation of tubevells and putmping stations. The bill of quantities onwhich ICB would be invited would be drawn up with the assistance of theConsultants and WAPDA's power wing.
70

ANNEX 4Page 15
Cost Summary
Rs M
62. Electrification of SCARP VI Wells: (60%) 149,129Rural Electrification: (40%) 99,420
Total Electrification: (100%) 248,549
Of Which:Foreign Exchange Costs (30%) 74,564
E. Project Area Operation and Maintenance Costs
63. Estimated Operation and Maintenance costs for each project com-ponent are given in the relevant sections above, and summarized below:
Existing Surface Irrigation System (para 16)Annual Operation, Maintenance: Rs 25.4 M/yr
Unit II (para 33)
Annual Operation : Rs 23.4 M/yrSpares, overhaul (at 10 years) : Rs 28.3 MComplete Replacement (at 20 years): Rs 116.7 M
Unit III (para 34)
Annual Operation: a) New uells Rs 8.9 M/yrb) Maximum incremental operation of
existing wells Rs 7.2 M/yrPump and well replacement (each 7 years): Rs 26.3 MEngine replacement (each 10 years) : Rs 34.3 M
Unit V (para 36)
Annual Operation : Rs 6.7 M /yrPump replacement, overhaul (each 5 years): Rs 6.0 MComplete replacement (each 20 years) : Rs 52.0 M
Drainage Works (para 55)
Annual Operation : Rs 1.8 M/yrPump replacement, overhaul (each 5 years): Rs 0.7 MComplete Replacement (each 20 years) : Rs 5.7 M
64. The resulting schedule of O&M expenditures, excluding privatetubewell, averages about Rs 70 M/yr after full development (Table 16). Theschedule for tubewell overhaul and replacement includes allowance for theinitial pattern of installation.
November 1977 71

ANNEX 4Table 1
PAKISTAN
SALINITY CONTROL AND RECLAMATION PROJECT (SCARP) VI
Required Flow Rates in Main Canals(cusecs)
Panjnad Canal Abbasia Canal
Units II, III, Unit I Total Unit IV Unit I Total& V
April 8 4,903 656 5,559 297 196 493
May 9 5,148 716 5,864 287 214 50110 4,639 716 5,355 287 214 501
June 11 12,977 1,114 1,411 650 333 98312 10,733 1,114 11,847 713 333 1,046
July 13 11,326 1,213 12,539 803 362 1,16514 10,819 1,213 12,032 745 362 1,107
Aug 15 11,484 1,114 12,598 803 333 1,13616 11,303 1,114 12,417 865 333 1,198
Sept 17 12,223 1,034 13,257 950 309 1,25918 12,080 1,034 13,114 950 309 1,259
Oct 19 12,755 755 13,530 977 232 1,209
Mean Kharif 10,033 984 11,017 694 294 988
Oct 20 5,271 775 6,046 977 232 1,209
Nov 21 4,080 158 4,238 713 47 76022 2,180 158 2,338 353 47 400
Dec 23 1,532 318 1,850 287 95 38224 1,539 318 1,857 287 95 382
Jan 1 1,771 358 2,129 342 107 4492 1,994 358 2,352 342 107 449
Feb 3 2,529 438 2,967 446 131 5774 3,225 438 3,663 571 131 702
Mar 5 3,548 278 3,826 629 83 7126 3,890 278 4,168 690 83 773
Apr 7 2,593 656 3,249 417 196 613
Mean rabi 2,846 378 3,224 505 113 618
Mean Annual 6,440 681 7,120 600 2n4 803
72

ANNEX 4Table 2
PAKISTAN
SALINITY CONTROL AND RECLAMATION PROJECT (SCARP) VI
Salient Features of Present and Proposed Canal Regimes
Panjnad Abbas. ia
Present Future Present Future
( cusecs)Maximum Kharif Flows:
Design 9,567 - 1,064 -
Actual Operation 10,484 13,530 1,064 1,259
Minimum in Rabi 1,065. 1,850 151 382
Kharif Mean 7,506 11,017 753 988
Rabi Mean 2,235 3,224 296 618
Maximum Over Minimum Discharge 9.8 to 1 7.3 to 1 7 to 1 3.3 to 1
m >1wN)4-

ANNEX 4Table 3
PAKISTAN
SALINITY CONTROL AND RECLAMATION PROJECT (SCARP) VI
UNIT COSTS
PUBLIC WELL CONSTRUCTION
CostsItem Description UnitNo LC % FE % Total (RS)
1 Drill 22" or 24" dia hole l.ft 70.0 30.0 75.00
2 Supply & install 14" dia steel casing l.ft 40.00 60.0 225.00
3 " " " 12" " " " iL 4u.u 60.0 200.00
4 " " " 10" " GRP " l.ft 10.0 90.0 135.00
5 " " " 8" " " l.ft 10.0 90.0 115.00
6 " " it 10" " " screen l.ft 10.0 90.0 147.00
7 " " " 8" " " screen l.ft 10.0 90.0 127.00
8 " " " gravel shrouding l.ft 100.0 0.0 30.00
9 Supply & install pump & motor Sum 60.0 40.0 37,000 & l0,OOOQ
10 " " " " " " " Sum 15.0 85.0 74,000 & 20,OOOQ
11 Develop & Test Sum 60.0 40.0 3,000.00
12 Pump house & discharge box Sum 100.0 7,500.00
13 Operators house Sum 100.0 4,000.00
14 Distribution works Sum 100.0 2,000.00
15 Land Sum 100.0 500.00
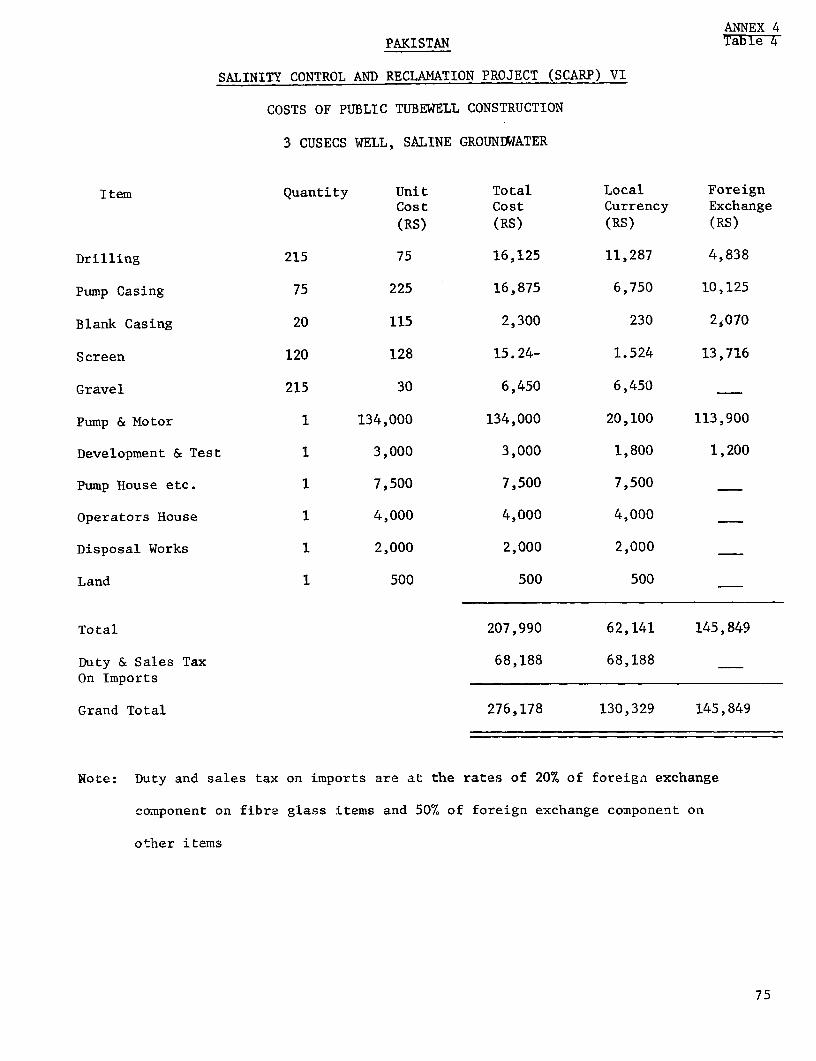
ANNEX 4PAKISTAN Table 4
SALINITY CONTROL AND RECLAMATION PROJECT (SCARP) VI
COSTS OF PUBLIC TUBEWELL CONSTRUCTION
3 CUSECS WELL, SALINE GROUNDWATER
Item Quantity Unit Total Local ForeignCost Cost Currency Exchange(RS) (RS) (RS) (RS)
Drilling 215 75 16,125 11,287 4,838
Pump Casing 75 225 16,875 6,750 10,125
Blank Casing 20 115 2,300 230 2,070
Screen 120 128 15.24- 1.524 13,716
Gravel 215 30 6,450 6,450
Pump & Motor 1 134,000 134,000 20,100 113,900
Development & Test 1 3,000 3,000 1,800 1,200
Pump House etc. 1 7,500 7,500 7,500
Operators House 1 4,000 4,000 4,000
Disposal Works 1 2,000 2,000 2,000
Land 1 500 500 500
Total 207,990 62,141 145,849
Duty & Sales Tax 68,188 68,188On Imports
Grand Total 276,178 130,329 145,849
Note: Duty and sales tax on imports are at the rates of 20% of foreign exchange
component on fibre glass items and 50% of foreign exchange component on
other items
75

ANNEX 4Table 5
PAKISTAN
SALINITY CONTROL AND RECLAMATION PROJECT (SCARP) VI
COSTS OF PUBLIC TUBEWELL CONSTRUCTION
3 CUSECS W:ELL, FRESH GROUNDWATER
Item Quantity Unit Total Local ForeignCost Cost Currency Exchange(RS) (RS) (RS) (RS)
Drilling 215 75 16,125 11,287 4,838
Pump Casing 75 225 16,875 6,750 10,125
Blank Casing 20 115 2,300 230 2,070
Screen 120 127 15,240 1,524 13,716
Gravel 215 30 6,450 6,450
Pump & Motor 1 67,000 67,000 40,200 26,800
Development & Test 1 3,000 3,000 1,800 1,200
Pump House etc 1 7,500 7,500 7,500
Operators House 1 4,000 4,000 4,000
Distribution Works 1 2,000 2,000 2,000
Land 1 500 500 500
Total 140,990 82,241 58,749
Duty & Sales Tax 24,998 24,998On Imports
Grand Total 165,988 107,239 58,749
Note: Duty and sales tax on imports are at the rates of 20% foreign exchange component
on fibre glass items and 50% of foreign exchange component on other items.
76

ANNEX 4PAKISTAN Table 6
SALINITY CONTROL AND RECLAMATION PROJECT (SCARP) VI
COSTS OF PUBLIC TUBEWELL CONSTRUCTION
2 CUSECS WELL, FRESH GROUNDWATER
Item Quantity Unit Total Local ForeignCost Cost Currency Exchange(RS) (RS) (RS) (RS)
Drilling 185 75 13,875 3,721 4,163
Pump Casing 65 225 14,625 5,850 8,775
Blank Casing 20 115 2,300 230 2,070
Screen 100 127 12,700 1,270 11,430
Gravel 185 30 5,550 5,550
Pump & Motor 1 57,000 57,000 34,200 22,800
Development & Test 1 3,000 3,000 1,800 1,200
Pump House etc 1 7,500 7,500 7,500
Operators House 1 4,000 4,000 4,000
Distribution Works 1 2,000 2,000 2,000
Land 1 500 500 500
Total 123,050 72,612 50,438
Duty & Sales Tax 21,169 21,169On Imports
Grand Total 144,219 93,781 50,438
Note: Duty and sales tax on imports are at tEle rates of 20% of foreign exchange
component on fibre glass items and 50% of foreign exchange component on
other items.
77

ANNEX 4Table 7
PAKISTAN
SALINITY CONTROL AND RECLAMATION PROJECT (SCARP) VI
COSTS OF PUBLIC TUBEWELL CONSTRUCTION
2.5 CUSECS WELL, FRESH GROUNDWATER
Item Quantity Unit Total Local ForeignCost Cost Currency Exchange(RS) (RS) (RS) (RS)
Drilling 200 75 15,000 10,500 4,500
Pump Casing 70 225 15,750 6,300 9,450
Blank Casing 20 115 2,300 230 2,070
Screen 110 127 13,970 1,397 12,573
Gravel 200 30 6,000 6,000
Pump & Motor 1 62,000 62,000 37,200 24,800
Development & Test 1 3,000 3,000 1,800 1,200
Pump House etc 1 7,500 7,500 7,500
Operators House 1 4,000 4,000 4,000
Distribution Works 1 2,000 2,000 2,000
Land 1 500 500 500
Total 143,020 77,427 54,593
Duty & Sales Tax 22,904 22,904On Imports
Grand Total 154,924 100,331 54,593
Note: Duty and sales tax on imports are at the rates of 20% of foreign exchange
component on fibre glass items and 50% of foreign exchange components on
other items
78

ANNEX 4Table 8
PAKISTAN
SALINITY CONTROL AND RECLAMATION PROJECT (SCARP) VI
Unit CostsPrivate Well Construction
Item CostsNo. Description UTnit LC x FE % Total (Rs)
1 Drill 8" dia. hole l.ft 90.0 10.0 50.002 Supply & install 8" casing l.ft 50.0 50.0 70.003 Supply & install 6" casing l.ft 50.0 50.0 55.004 Supply & install 8" coil screen l.ft 60.0 40.0 25.005 Supply & install 6" coil screen l.ft 60.0 40.0 20.006 Supply & install 8" PVC screen l.ft 60.0 40.0 74.007 Supply & install 6" PVC screen l.ft 60.0 40.0 42.008 Supply & install 8" brass screen l.ft 60.0 40.0 180.009 Supply & install 6" brass screen l.ft 60.0 40.0 125.00
10 Develop & test sum 70.0 30.0 2,000.0011 Miscellaneous sum 80.0 20.0 4,000.0012 Supply & install pump & motor
(electric) sum 70.0 30.0 4,000 + 2,500 Q13 Sulpply & install pump & motor
(diesel) sum 70.0 30.0 10,000 + 4,500 Q14 Land sum 100.0 - 500.00
15 Supply & place gravel shrouding(if required) l.ft 100.0 - 20.00
79

ANNEX 4Table 9
PAKISTAN
SALINITY CONTROL ANI) RECLAMATION PROJECT (SCARP) VI
Costs of Private Tubewell Construction0.5 Cusecs Well, PVC Screen, Electric Motor
Unit Total Local ForeignItem Quantity Cost Cost Currency Exchange
(Rs) (Rs) (Rs) (Rs)
Drilling 80 50 4,000 3,600 400Blank Casing 30 55 1,650 825 825Screen 50 42 2,100 1,260 840Pump & Motor 1 5,250 5,250 3,675 1,575Development & Test 1 2,000 2,000 1,400 600Miscellaneous 1 4,000 4,000 3,200 800Land 1 500 500 500 -
Total 19,500 14,460 5,040
Duty & Sales Tax on Imports 2,520 2,520 -
Total without Tax & Duty 16,980 11,940 5,040
Note: Duty and sales tax on imports are taken as 50% of the foreign exchangecosts.
on

ANNEX 4Table 10
PAKISTAN
SALINITY CONTROL AND RECLAMATION PROJECT (SCARF) VI
Costs of Private Tubewell Construction0.5 Cusecs Well, PVC Screen, Diesel Engine
Unit Total Local ForeignItem Quantity Cost Cost Currency Exchange
(Rs) (Rs) (Rs) (Rs)
Drilling 80 50 4,000 3,600 400Blank Casing 30 55 1,650 825 825Screen 50 42 2,100 1,260 840Pump & Motor 1 12,250 12,250 8,575 3,675Development & Test 1 2,000 2,000 1,400 600Miscellaneous 1 4,000 4,000 3,200 800Land 1 500 500 500 -
Total 26,500 19,360 7,140
Duty & Sales Tax on Imports 3,570 3,570 -
Total without Tax & Duty 22,930 15,790 7,140
Note: Duty and sales tax on imports are taken as 50% of the foreign exchangecosts.
81

ANNEX 4Table 11
PAKISTAN
SALINITY CONTROL AND RECLAMATION PROJECT (SCARP) VI
Costs of Private Tubewell Construction1 Cusec Well, PVC Screen, Electric Motor
Unit Total Local ForeignItem Quantity Cost Cost Currency Exchange
(Rs) (Rs) (Rs) (Rs)
Drilling 120 50 6,000 5,400 600Blank Casing 30 55 1,650 825 825Screen 90 42 3,780 2,268 1,512Pump & Motor 1 6,500 6,500 4,550 1,950Development & Test 1 2,000 2,000 1,400 600Miscellaneous 1 4,000 4,000 3,200 800Land 1 500 500 500 -
Total 24,430 18,143 6,287
Duty & Sales Tax on Imports 3,144 3,144 -
Total without Tax & Duty 21,286 14,999 6,287
Note: Duty and sales tax on imports are taken as 50% of foreign exchangecosts.
82

ANNEX 4Table 12
PAKISTAN
SALINITY CONTROL AND RECLAMATION PROJECT (SCARP) VI
Costs of Private Tubewell Construction1 Cusec Well, PVC Screen, Diesel Engine
Unit Total Local ForeignItem Quantity Cost Cost Currency Exchange
(Rs) (Rs) (Rs) (Rs)
Drilling 120 50 6,000 5,400 600Blank Casing 30 55 1,650 825 825Screen 90 42 3,780 2,268 1,512Pump & Motor 1 14,500 14,500 10,150 4,350Development & Test 1 2,000 2,000 1,400 600Miscellaneous 1 4,000 4,000 3,200 800Land 1 500 500 500 -
Total 32,430 23,743 8,687
Duty & Sales Tax on Imports 4,344 4,344 -
Total without Tax & Duty 28,086 19,399 8,687
Note: Duty and sales tax on imports are taken as 50% of foreign exchangecosts.
83
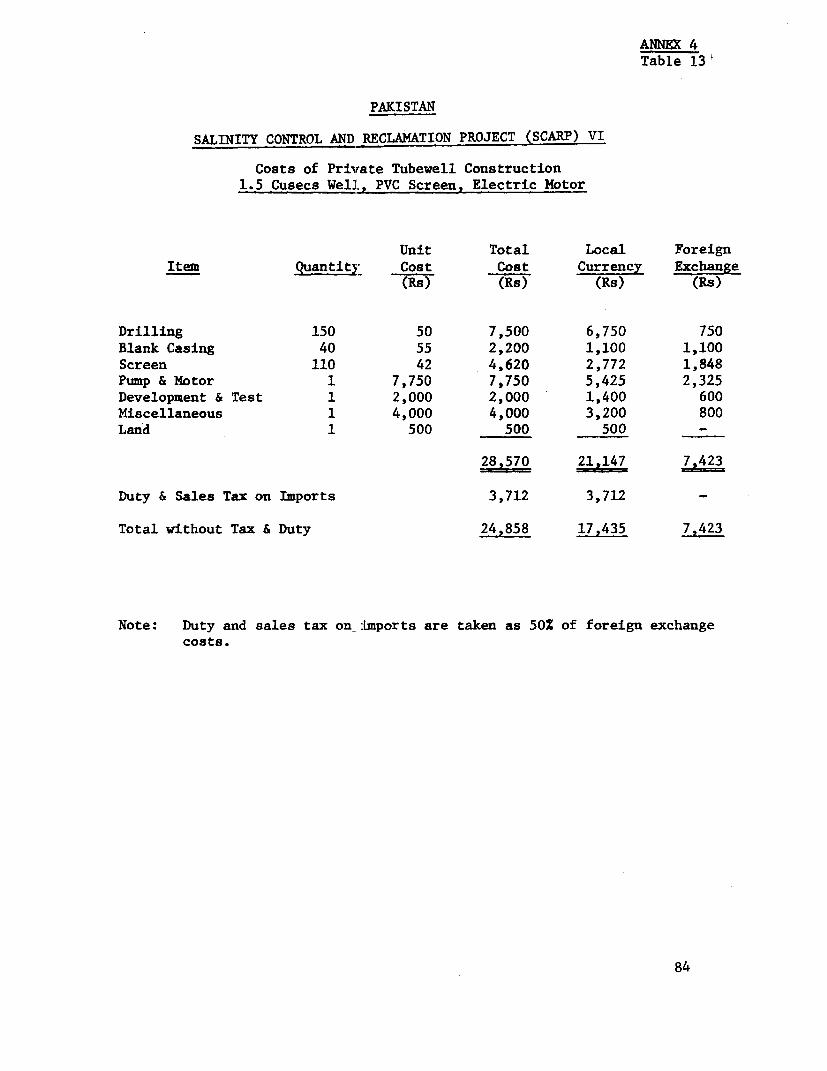
ANNEX 4Table 13
PAKISTAN
SALINITY CONTROL AND RECLAMATION PROJECT (SCARP) VI
Costs of Private Tubewell Construction1.5 Cusecs Well, PVC Screen, Electric Motor
Unit Total Local ForeignItem Quantity Cost Cost Currency Exchange
(Rs) (Rs) (Rs) (Rs)
Drilling 150 50 7,500 6,750 750Blank Casing 40 55 2,200 1,100 1,100Screen 110 42 4,620 2,772 1,848Pump & Motor 1 7,750 7,750 5,425 2,325Development & Test 1 2,000 2,000 1,400 600Miscellaneous 1 4,000 4,000 3,200 800Land 1 500 500 500 -
28,570 21,147 7,423
Duty & Sales Tax on Imports 3,712 3,712 -
Total without Tax & Duty 24,858 17,435 7,423
Note: Duty and sales tax on :Lmports are taken as 50Z of foreign exchangecosts.
84

ANNEX 4Table 14
PAKISTAN
SALINITY CONTROL AND RECLAMATION PROJECT (SCARP) VI
Costs of Private Tubewell Construction1.5 Cusecs Well, PVC Screen, Diesel Engine
Unit Total Local ForeignItem Quantity Cost Cost Currency Exchange
(Rs) (Rs) (Rs) (Rs)
Drilling 150 50 7,500 6,750 750Blank Casing 40 55 2,200 1,100 1,100Screen 110 42 4,620 2,772 1,848Pump & Motor 1 16,750 16,750 11,725 5,025Development & Test 1 2,000 2,000 1,400 600Miscellaneous 1 4,000 4,000 3,200 800Land 1 500 500 500 -
Total 37,570 27,447 10,123
Duty & Sales Tax on Imports 5,062 5,062
Total without Tax & Duty 32,508 22,385 10,123
Note: Duty and sales tax on imports are taken as 50% of foreign exchangecosts.
85

ANNEX 4Table 15
PAKISTAN
SALINITY CONT}OL AND RECLAMATION PROJECT (SCARP) VI
Electrification Costs('000 Rs)
ItemNo Item Unit II Unit V Total
1. Preliminary and General 684 150 834
2. Civil Works:
(i) residences & quarters forlinesman and other staff. 6,384 1,804 8,188
(ii) offices and stores 1,710 528 3,241
3. Equipment and materials includingerection.(a) Distribution lines
(798+159) miles of 11 kvline using ACSR Dog includingpole mounted sub-stationon single structure and L.T.service cable up to tubewelland meter. 111,700 22,200 133,900
((b) (114+42) miles of 11 kvliea using ACSR Rabbitincluding pole mounted suh-station on single structureand L.T. service cable up totubevell and meter 14,250 5,225 19,475
(c) (4+10) Nos. capacitor setEof 300 KVAR each. 24 60 84
4. Grid Stations(a) Data Shah 4,100 4,100(b) Khan Bela 4,100 4,100(c) Tillu Goth 4.100 4,100(d) Jajja Abbasia (i) 7,000 7,000
(ii) 3,500 3,500(e) Gulmerg 5,000 5,000(f) Chachran 100 100(g) Rahim Yar Khan (extension) 50 50(h) Khanpur (extension) 2,000
as,950
5. Transmission Lines(a) (42.9+12) miles of
66 kv transmission lineusing ACSR Dog fromJajja-Abbasia to Khan Bela,Jajja-Abbasia to Palashah,Sadiqabad to Jamaldinwali.,Sadiqabad. to Kasmani andSadiqabad to Tillu Goth 25,800 7,200 33,000
(b) (13.2+10.0) miles of 132 kvtransmission lines usingACSR LYNX from Khanpurto Jajja-Abbasia and RahiayarKhan to Gulmerg 11,880 9,000 20,880
TOTAL 193,282 55,267 248,549
86

PARISTAN ANU 4
SALINITY CONTROL AND RECLAMATION PROJECT (SCARP VI) Table 16
Operating, Maintenance and Replacement CostsRs Million
YR Unit 1 Unit III 3 UIt V D1ainage 3otau'A-l/ R2/ 2~~~/ 17 2 Proj ec t Puli
Secto ;-'
1 1 26.42 6 3 34.4 31.43 12 7 444 37144 20 12 44.4 37.4
5 ~~23.4 13 57.4 45.46 of 14 3.4 66.2 52.27 15 6.7 1.8 72.3 57.38 16.1 1it73.4 57.39 ' 14.5 t' 71.8 57.3
10 13.0 it70.3 57.311 12.0 5.7 " 3 78.0 60.312 11.1 5.7 3 .7 77.8 61.013 14.t 5.7 88.2 71.414 14.1 12.6 95.1 71.415 12.6 5 81.0 57.316 6.9 3 78.3 60.317 6.9 3 .7 78.3 60.318 " " 12.6 " 81.0 57.319 5.7 74.1 57.320 " 5.7 74.1 57.321 "" 5 .7 " 3 77.1 60.322 ' " 5.7 " 3 ' .7 77.8 61.023 58.3 " 6.9 "133.6 115.624 58.4 ' 1 6.9 " 133.7 115.725 12.6 "81.0 57.326 " " 12.6 " 29 " 110.0 86.327 "12.6 29 "5.7 115.7 92.028 " 5.7 74.1 57.329 " 5.7 74.1 57,330 U 68.4 5.
1/A - Annual fuel and operating costs
-R Replacements and major overhauls
3/ --DIncluding D&M of existing system (Rs 25.4 M/yr)
-/ Excluding Unit III private tubevella
ANNEX 5Page 1
PAKISTAN
SALINITY CONTROL AND RECLAMATION PROJECT (SCARP) VI
Land Leveling and Reclamation
Introduction
1. Basin irrigation has been traditional in Pakistan since prehistorictimes. The fact that land to le so irrigated has to be leveled, preferablyto a zero slope, is well recogrized. Therefore, individual irrigation unitsare regularly leveled as part cf land preparation for all the major crops.
2. When new land is brought into cultivation, either to increase theirrigated area, or replace salinized land, a great deal of time and effort isspent on levelling.
3. Under project conditions, with increasing water supplies, it willbe possible to bring into cultivation land defined as "culturable waste"(irrigable land, not cultivated for the last three years or more) as well as"current fallow" (land cultivated within the last three years). Further, toincrease irrigation efficiencies and to enable farmers to irrigate more landwith their share of river or well water without deliberately underirrigatingand thereby causing salinization, fine leveling must be speeded up.
Physical Land Reclamation
4. For the last 20 years or more, land potentially commandable bysurface irrigation but not cultivated for a long time, if ever, was beingroughly leveled by bulldozers, to be finished off by the farmers' own effortsand equipment (para 6). For this purpose, the Agricultural Engineering Divi-sion maintains a fleet of 30 crawler tractors with bulldozer blades. Asmany of them are old, the average number that are operational at any one timeis reported to be around 25. They work for cash, at a subsidized rate.(Rs 85/hr for the larger tractors and Rs 55/hr for the smaller ones, insteadof a more realistic figure, inclusive of overheads, of around double). Thereis only limited borrowing from the banks by the farmers for this purpose. Thewaiting list for tractor services is about six months.
5. It is doubtful whether the most efficient method, even for coarseleveling, is with bulldozers onLy. In other countries a combination ofbulldozers and scrapers is used, but this has never taken on in Pakistan.However, as the farmers usually aim to create relatively small irrigationunits (typically one acre fields, divided into four sections) the scrapers,while more efficient than bulldozers, have a relatively small advantage,
88
ANNEX 5Page 2
further reduced by the experience of using bulldozers. It is planned toaugment the bulldozer fleet from the 400 units shortly to be imported underbilateral aid. This will reduce considerably the present six-months fromrequest of services to execution. Further, under the project, credit wouldbe readily available to pay for tractor hire (Annex 6) and therefore itis expected that coarse land leveling will proceed at a rate correspondingto the need to bring fallow land and culturable waste into cultivation inline with increasing water supplies.
Fine Leveling
6. Fine leveling of fields already in cultivation, or followingphysical reclamation, is traditionally done with ox-drawn scraperboards.A relatively recent introduction is an ingenious local adaptation of themultipurpose blade, hitched behind 35-40 hp agricultural tractors, origi-nally designed for grading. Both methods are used as a routine land prep-aration measure for wheat, cotton and sugarcane. The land is ploughed andthen the soil moved from spots judged, or remembered from previous cropping,to be high, into similarly identified low spots. Land leveling for rice iseither done in a similar way or after flooding, using a heavy timber baulkas a float. If leveling is done on dry land, the accuracy of the work isnot known until the fields are irrigated. Any unevenness then identified isusually remedied in a subsequent year, because there is neither time, norwater, to let the land dry, re-level and flood it again prior to planting.
7. A task increasingly undertaken for greater working efficiency,usually with agricultural tractors but sometimes also with oxen, is toenlarge the small irrigation units.
Land Development Under the Project
8. The benefits of leveling. Culturable waste cannot be irrigatedunless leveled; additional water would be made available under the projectto expand the cropped area and therefore the development of culturable wasteis essential. Experience in completed projects shows that if the farmersare assured of water for reclamation and subsequent cropping, they willreadily undertake the task; it was noted that even with slowly increasingwater supplies demand for bulldozer-type leveling is far in excess ofcapacity. Therefore, there would appear to be little doubt that even anaugmented bulldozer fleet would be fully committed for several years tocome.
9. Fine leveling shows less spectacular benefits, but they arenonetheless readily demonstrable. The following table shows some of theresults obtained by the USAID -sponsored Precision Land Leveling Project(PLLP) in the Sind, on wheat in the 1975-76 season.
89

ANNEX 5Page 3
Leveled Areas Changes inDate Volume of Cut- Comparable Yields
Acres Crop Leveled m /acre Sites md/ac
7.5 Wheat Mar. '75 127 Wheat +6.54.5 Wheat Feb. '75 192 Wheat +9.012.5 Wheat Sept. '75 321 Wheat +6.4
PLLP report that their measurements of water required to irrigate leveled vs.unleveled fields were incomplete but are satisfied that water savings aresubstantial. Their contention of yield increase and water saving is corrob-orated, as noted, by fine levelLng being part of farming tradition. There-fore, there is a strong case to speed up the operation and put it on a morescientific basis. Using the technology developed by PLLP, it is proposedto supply 40 65-75 hp four-whee.L tractors, with scrapers and chisel plows.These units would be able to speed up the work of the bulldozers and so com-plete the leveling process more rapidly. The result would be a reduction inthe time required to reach full production on newly reclaimed land. Thiswould be particularly important where leaching is required, with or withoutthe application of gypsum (Annex 2 and para 13). The same units would ofcourse be available to farmers who have no need for bulldozers and onlyrequire hired equipment for enlarging and/or fine leveling their fields.
10. In addition to the mechanical equipment, it is proposed to augmentthe staff of the agricultural engineer with trained surveyors who would markout the fields before work star1s and check the completed job. This wouldbenefit the farmers in two ways;
(a) before hiring equipmentt or engaging contractors, theywould have a more exact idea of the task involved,through being advised of the quantities of earth tobe moved and have a definite plan according to whichto move the earth, inntead of eye estimates and recol-lections of past unevenness;
(b) on completing the job, the surveyors would check itsaccuracy; there would be no need for trial flooding,and therefore it would be possible to correct mistakeswithout delay.
Annex 6 shows the local investment costs in equipment and additionaltransport needs for land leveling and reclamation.
11. Further, it is proposed to provide US$3.8 m as part of the medium-term agricultural credit component (Annex 6) to enable farmers to borrowfrom the commercial banks (CBs) for land leveling. It is expected thatsome 100,000 ac of culturable waste and fallow land would be leveled duringthe life of the project; costs aLre estimated to be around Rs 1,000 per ac.
90

ANNEX 5Page 4
The farmer, from his own resources -- or by the use of his own equipment andlabor -- would provide the equivalent of 25% of the cost. Half of the re-mainder would be provided by the CBs' own resources.
12. The assumption in deriving the credit requirements was that allfarmers will borrow 75% of the costs of leveling not cultivated lands.While it is expected that the simpler and streamlined formalities of obtain-ing credit under the project would encourage more applicants than in the past,and that their number would be further enhanced when it becomes known thatthe waiting time is less than six months, the sum indicated might still notbe fully used for financing the leveling of fallow and culturable waste. Itis expected however that any unutilized balance would be taken up by farmerswanting to rent the wheel tractors and equipment for fine leveling land alreadyin cultivation and by others who have soils which would benefit from periodicdeep chisel plowing.
13. Soil Amendments. As noted in Annex 2, some 12%-13% of the proj-ect area, or about 160,000 ac, would require the application of up to fivetons of gypsum to restore the potential productivity of the soil. However,the benefits would only be temporary if the gypsum were to be incorporatedin the soil before the water table is established at a safe depth and thereis enough irrigation water available to irrigate the reclaimed lands atleast once a year. Consequently, it is expected that significant demandsfor gypsum would not arise until the third or fourth year after the begin-ning of the project. Therefore, the area that would in fact receive itbefore the project is completed is unlikely to exceed 40,000 ac. It is esti-mated that five tons per ac would be required which, with appropriate pro-cessing, would cost Rs 200 per ton at the sales point. Consequently, thegypsum to be applied would cost Rs 40 M. As the technique, at least on sucha scale, is new to Pakistan, the supply of gypsum at the sales point wouldbe a project component. The farmer, however, would be expected to use hisown transport and labor to collect and spread it, according to the technicaladvice given by staff of the Bahawalpur soils laboratory (Annex 13).
November 1977
91
ANNEX 6Page 1
PAKISTAN
SALINITY CONTROL. AND RECLAMATION PROJECT (SCARP) VI
Agricultural Credit
The Present Situation
1. Background. Institutional lending for seasonal inputs and invest-ments on the farm was, until thIe end of 1972, the responsibility of thecooperative banks and the Agricultural Development Bank of Pakistan (ADBP).Both were experiencing difficulties due to scarce resources, unsound creditpolicy and poor administration. This latter led to poor loan recoveries,a deteriorating financial position and general slowing down in operations aspreoccupation with these issues developed. Recent GOP action, including theestablishment of a Federal Bank for Cooperatives, has improved the situationsomewhat, and these institutions should provide 50% of lending to the sectorduring the 1976-81 plan period (Table 1).
2. Commercial Bank Involvement in Agricultural Credit. In parallelwith GOP efforts to improve the operations of the cooperative and ADBP agen-cies, the State Bank of Pakistan (SBP) drew up a scheme in November 1972 toinvolve commercial banks in short and medium term agricultural credit. Des-pite the new demands for expertise which this made on the commercial banks,they have vigorously expanded operations in the sector. Total disbursementsrose from Rs 69 million in 1972/73 to Rs 710 million in 1975/76 - 17% over thetarget. Lending data for the five scheduled banks involved (National Bankof Pakistan (NBP), Habib Bank Ltd (HBL), United Bank Ltd (UBL), Muslim Com-mercial Bank (MCB) and Allied Bank Limited (ABL) are shown in Tables 2 and 3.
3. The commercial banks will be used as the credit channel for IDAfunds provided for farm level investments in the tubewells, land levellingand soil improvement under the present project.
4. Commercial Bank Activities in the Project Area. In Rahimyar KhanDistrict, agricultural credit disbursements for 1975/76 represented about 12%of loans of all kinds for NBP, MICB and ABL and 46% and 69%, respectively, forHB and UBL (Table 4).
5. While about 60% of MCB and ABL agricultural loans are developmentoriented, the other banks mostly finance inputs, mainly fertilizers. Amongdevelopment loans, borrowing for tubewells (maintenance, replacement, or newinstallation) predominates although tractors and bullocks represent a signi-ficant proportion. Loans for land levelling are negligible. Production loans(below Rs 2,000) go mainly to small-size farmers while loans for expensiveequipment or machinery (from Rs 5,000 to Rs 25,000 and above (Table 5)) goto the big landowners.
92

ANNEX 6Page 2
6. Distribution and Staffing of Branches. The commercial banks havemarkedly increased the number of their branch offices in the rural areas. Atpresent, they have 5,668 branches and offices of which 2,044 are in rural areas,and 103 in the project area. In addition to its own commercial branches, NBPhas an independent network of 64 Basic Credit Units (BCU) dealing exclusivelywith supervised agricultural credits. These BCUs are mainly grouped aroundLahore (Punjab), and Peshawar (NWFP). The headquarters of the AgriculturalProject Department, which operates the BCUs, are in Lahore.
7. As the banks got more deeply involved in lending for agriculture,they augmented their staff with agricultural graduates, trained specially inthe agricultural credit business. There are 11 such officers in the projectarea.
8. Terms and Conditions of Lending. The banks pay the supplier ofinputs, the contractor who carried out the works or the dealer who suppliedthe equipment. The borrower must contribute from 10% to 25% of the invest-ment. The amount lent must be less than 80% of the value of the land securingthe loan. This value is determined from the Passbook on the basis of 60 timesthe number of produce index units (PIU) published under the authority of theLand Commission for the province.
9. Production loans usually have to be repaid at the end of the cropseason; at most, they can be extended for 12 months. Development loans (tube-well, tractors, land-leveling, on-farm permanent improvements) have to be re-paid within five years. Such repayments are made through semi-annual or an-nual installments. The rate of interest is 12% for short- and medium-termloans, i.e. 3% above the SBP discounting rate (9%). All banks are charginga 1% to 3% penalty for late repayment.
10. Loans are secured by two guarantors (up to Rs 2,000) or by mortgageon land under the passbook system. This was established under the Loans forAgricultural Purposes Rules 1973. Banks may also take a lien on growing cropsor on equipment financed by the credit granted. For crops and machinery, thisdocument is a simple agreement signed by the lending bank and the loanee, inwhich, inter alia, the borrower binds himself not to dispose of the itemhypothecated without the consent of the bank. For tubewells, the borroweralso binds himself not to transport the pumping equipment elsewhere.
11. The sanctioning of agricultural loans has been accelerated throughdecentralization of responsibility. Most production loans (inputs) up toRs 5,000, are within the sanctioning power of local branch managers. Devel-opment loans, ranging from Rs 2,000 to Rs 5,000 for land leveling and bullocksand to Rs 25,000 (tubewells) are within the sanctioning power of the local orZonal Branch Manager. Loans between Rs 5,000 and Rs 10,000, Rs 25,000 (MCB)or Rs 50,000 (UBL) are approved by the Zonal or Regional Branch Manager. TheKarachi Head Office has to approve loans in excess of these amounts. Com-pletion of the lending procedure seldom exceeds ten days. Loans for tractors,the procurement of which sometimes requires lengthy formalities, and since thecost exceeds Rs 50,000, have to be approved by the Bank's Head Office. Thefull procedure in some cases requires more than one month.
93

ANNEX 6Page 3
12. Evidence of short- or medium-term loans is the Demand PromissoryNote (DPN) signed by the borrower and, where required, by guarantors; theloan agreement between the bank and the borrower, or if required, the deedof hypothecation.
13. Loan Recovery. The maturity date of loans or installments coincideswith the harvest of kharif and rabi crops financed. A notice is sent ordelivered to the borrower one month before the stipulated expiration date.In case of default, after due warning the Revenue Department recovers underpowers vested in it by the law on agricultural credit.
14. The Banks' records are not kept in a manner that enables an easydetermination of the loan recovery rate. In Rahimyar Khan District, itwould, however, appear from commercial branches' statements that the rateof collection for short-term loans range from 70% (UBL) to 83% (NBP). Forthe NBP's supervised Agricultural Credit Program (not yet extended to theproject area), the rate of recovery for production loans as of October 31,1976 was 98% for loans disbursed up to 1973, between 92% and 94% for loansdisbursed from 1974 to 1975 and 72% for loans disbursed during the winter(rabi) 1975/76. For medium-term loans, the rate given by NBP Headquarterswas 85%. Losses and bad debts arising out of agricultural lending are 50%underwritten by SBP. However, the procedures at present set out for suchclaims are so involved and time consuming that no bank has yet availed it-self of this facility.
Financial Position of the Commercial Banks
15. Table 6 shows that the five nationalized banks are in a satisfactoryfinancial position. They have substantial liquid assets despite significantinvestments in Government securities, trustee securities, and debenturesguaranteed by the Government. PIofits are increasing.
16. Commercial banks are subject to annual SBP administrative, technicaland financial inspection. In adcLition, their monthly and quarterly returnsare submitted to the Control Division of SBP, and each bank is audited by afirm of auditors of international, standards.
II. Commercial Banks as IDA Credit Participating Agencies
17. Operating Procedures. Each participating CB would have a "SCARP VIAgricultural Credit" account opened in SBP books. The IDA credit proceeds re-lated to SCARP VI Agriculture Credit components (tubewells, land-leveling, soilimprovement) would be transferred from the GOP account to the "SCARP VI Project"account in SBP books and, from this latter account, passed on to the creditof the participating bank "SCARP VI Agricultural Credit" account as reimburse-ment of loans pre-financed.
94

ANNEX 6Page 4
18. ITstaliments of mediidi- :e;rm loans collected by the bank would betransfe-red to a "SCARP VI Agrieultltral Credit Revolving Account" opened inSBP books, and usec for financing new loans along with IDA and bank comple-mentar-- sh3res as necessary. The participating banks' share would be 50% ofloans ie'quired, after using the balance of the revolving account. They wouldbear the full credit risk. Such significant bank involvement in financingwould be an assurance that applicants' repayment capacity would be carefullyappraised and loan recovery actively pursued.
19. Interest Rates. The GOP would charge SBP an interest of 5%, repre-senting the service charge paid to IDA. The SBP would charge commercialbanks 6%. This corresponds to the average cost of resources of commercialbanks.
20. Project Agricultural Credit Components. The project would providecredit facilities to farmers for: (a) installation of tubewells in freshgroundwater areas (Unit III); and (b) for land leveling. Credit would be formedium-term (3-5 years).
21. The Project Director would administer the project account opened inSBP books and, with SBP assistance, would keep permanent control of the "SCARPVI Agricultural Credit" account opened for each participating bank (throughwhich IDA credit share in medium-term loans would pass). He would also keepcontrol of "SCARP VI Agricultural Credit Revolving Accounts" to ensure thatthis account is adequately used by banks.
22. All documents justifying the bank's application for IDA disbursementwith or without utilization of the revolving account would be scrutinized bythe Project Director. Accredited representatives of the commercial banks, whowould be members of the Project Coordinating Committee, would assist the ProjectDirector in credit supervision.
23. Terms and Conditions of Loans. The first installment would fall dueat the end of the next rabi season when loans are disbursed during the kharifperiod, or the end of the next kharif season when loans are disbursed duringthe rabi period.
24. An interest of 12% per annum would be charged. A penalty of 2%would be levied when installments are paid more than two months after thedate on which they are due. No loan would be made to tenants or sharecroppersexcept where the landowner guarantees the loan, jointly and separately. Insuch particular case, landowner and sharecroppers would also share equallyin the repayment of loan installments.
25. For tubewells, prospective borrowers would have to justify, througha certificate from an accredited laboratory, that the water is fit for irri-gation and that the pumping output meets the irrigation requirements of thecultivated area and planned cropping intensity. To comply with the lattercriteria, small land owners would be encouraged to form groups covering the
95

ANNEX 6Page 5
optimum acreage. Group members would be jointly and severally responsiblefor the repayment of the loan and a charge would be taken on the land ownedby each. An agreement would be signed by all group participants stipulating:
(a) the joint liability in the loan repayment;
(b) the rules for contributing to operation and maintenanceexpenditures;
(c) on what basis each nember would share in the repaymentof annual loan installments;
(d) the members' turn aid timing in water use; and
(e) on what basis and bI whom, the association would beadministered;
(f) in case of liquidation, what would be the members'share in the outstaading debt.
26. For land leveling, no down payment would be required from appli-cants who own less than 12 ac and only 10% from farmers who own 12 to 25 ac.Loans for land leveling to small farmers (less than 12 ac) would be charged10% interest per annum instead of 12%. The substantial spread between theIDA service charge (0.75%) and the interest paid by the ultimate borrower(12%) would easily absorb the bonus of 2% granted to small farmers. Thiswould be in accordance with reocommendations of the Bankers Conference (Novem-ber 1976) that small farmers ihould pay a lower interest than big farmers.The disbursement of loans wou>d be subject to a certificate from the Agri-cultural Engineering Departmenit certifying that leveling has been completedto the specified standard.
27. Lending Procedure. Participating banks would continue followingthe present lending procedure.. However, the loan application form would bestandardized and would state mhe farm plan and the farm budget before andafter investment. An estimate of equipment or works to be financed would beattached to the application a3ong with a recommendation from a technicalsupporting department. The loan appraisal would focus more on the need forinvestment and the applicant's repayment capacity based on the farm plan andfarm budget than on formal securities.
28. Payment for goods or services would be made directly to the supplieror the contractor after the branch manager has been given: (a) a detailedstatement showing the final cost of works or equipment and the down-paymentsmade by the farmer; (b) a rec.ipt signed by the latter and the branch agri-cultural credit officer certifying that tubewell installation has been com-pleted satisfactorily; and (c) for land leveling, the document referred toin para 26.
29. Payment for works such as well digging, masonry or land levelingand partial disbursements, when claimed by contractors, would be made
96

ANNEX 6Page 6
according to the progress of the works and upon recommendation of the branchfield officer who supervises the work. The final disbursement, however, wouldrequire the documents mentioned in para 28 (b) and (c).
30. Technical Staffing. There are not enough agricultural credit tech-nicians to cope adequately with the increase in lending volume expected underthe project. Habib Bank and Muslim Commercial Bank have about one specialistfor five branches; the others have only one in the district and ABL has none(Table 4). For ABL, the general controller in the Regional Office in Bahawal-pur supervises the branch managers in the project area when dealing with agri-cultural credit applications.
31. Records. Participating banks would have to keep separate accountsfor loans made under the SCARP VI Project Agricultural Credit. These wouldbe kept in such a manner that a clear picture could be had at all times ofoverdues, interest payments and principal sums recovered.
32. The banks' charts of account would be reviewed so as to open foreach branch in the project area a medium-term loan account subdivided intothree principal accounts: "Loans not yet due", "Loans overdue", and "Loansunder legal action". Each of these three principal accounts would be sub-divided into two sub-accounts; "Tubewell" and "Land leveling." These sub-
accounts when related to the principal account "Loans not yet due" would besubdivided into "Loans 1978" account, "Loans 1979" account, "Loans 1980".
Sub-accounts related to the principal account "Loans overdue" and "Loans underlegal action" would be subdivided into "Installments 1979" account, "Install-ments 1980" account, etc.
Credit Requirement and Financing
33. Credits would be provided for financing for up to five years (a)the procurement and installation of 1,000-1/2 cusec, 1,000 1 cusec and 2871-1/2 cusec tubewells in the freshwater areas; and (b) the leveling of about100,000 ac.
34. The tubewells are estimated to cost Rs 60.4 M. Land leveling costper acre is estimated at Rs 1,000, or a total cost of Rs 100 M. The totalwould thus be about Rs 160.4 M plus contingencies.
35. This component of the project has been estimated at the most pes-simistic assumption on repayments, i.e. that none of the farmer repaymentinstallments will be available for relending. On this assumption, the pro-ject would have to finance Rs 82.5 M. However, it will be readily apparentto the project auditors from the required records (para 31) how repaymentsbecome available. There would therefore be a clear record whether the lendingrates can be increased or whether funds from the farmer credit category wouldbe available for reallocation to other project components.
November 1977 97

ANNEX 6Table 1
PA.KISTAN
SALINITY CONTROL AND RECLAMATION PROJECT (SCARP) VI
Five Year Plan 1976 - 1981
Agriculture Sector Financing
To-tal Financing AnnualFo'- the 5 years financing
Investmen:. Seasonal Investment SeasonalCredit Credit Total Credit Credit Total
--------------------…(Rs Million)----------------
ADBP 2,300 1,500 3,800 460 300 760
Cooperatives - 2,000 2,000 - 400 400
Govt Taccavi Loans - 100 100 - 20 20
Commercial Banks 500 4,870 5,370 100 974 1,074
Total 2,800 8,470 11,270 560 1,694 2,254
98

ALNNtX 6Tahlc 2
,"mVUSTAN
SALINITY CONTROL AND RECI.MATION PROJECT (SCAXP) _VI
Performance of NNationalized Commercial Banks
Under State Bank of Pakistan Agricultural Credit Schenme 197i;i 6
(Rs'000)
Dishursements
Development Total tor DevelopmentiInput Credits Credit Total Disbursement Credit as X of
(Pb Diab '2 As % of Total Agric.Target JD.e~e2 Target men s~14 Target n ' Total Targtet Crdit_Disburskemenl,
1 2 1 3 4 3 5
National Bank ofPakistan 136,800 232,989 170 22,400 22,776 102 159,20C 255,'f; 160 9
Habib Bank Ltd. 163,300 182,409 112 26,700 17,830 67 190,000 710,2-'. 105 9
United Bank Ltd. 122,700 99,767 81 20,000 42,993 215 142,700 142,760 100 30
Muslim CommercialBank Ltd. 62,600 63,577 102 10,200 13,534 133 72,800 77,111 LOt 18
Allied Bank Ltd. 34,600 23,577 68 5,700 10,157 178 40,300 33,734i _' 29
Total 520,000 602,319 116 85,000 107,290 126 605,000 709,609 i11 15
%O (1) The total target is fixed by State Bank of Pakistan in accordance with the agricultural o,bjectives of the .'IO ongoing plan for the year considered. The target is alloted to Commercial Banks accoriing to their
financing potential. The target achievement is compulsory. Any Commercial Bank which does nor £ulf illits obligation, is penalized. An amDunt of its liquidities equal to the target shortage is blocked In aspecial account in State Bank books until the target is completed.
(2) Net increase in outstanding balance.

ANNEX 6
Table 3
PAKISTAN
SALINITY CONTROL AND RECLAMATION PROJECT (SCARP) VI
NATIONALIZEDCOMMERCIAL BANKS INVOLVEMENT
INAGRICULTURAL CREDIT
1975/76(Rs '000)
Agricultural Outstanding Balance AgriculturalTotal of which Credit Techn. of Total Credits Outstanding Balance of CreditBranches Rural BCU Staff in (all kind) as at Agricultural Credits as % of
Branches (1) HO Branches June 30, 1976 as at June 30, 1976 Totnl rr4-Af*
Input Devel. TotalLoans Loan:
National Bank of Pakistan 1,403 604 64 3 105 5,594,000 210,300 25,000 235,300 4.2
Habib Bank Ltd. 1,389 740 - 10 150 6,507,700 109,500 39,000 148,500 2.3
United Bank Ltd. 1,300 1,000 - 8 52 4,618,000 140,500 78,100 218,600 4.7
Muslim Commercial Bank 1,061 400 - - 12 2,311,100 47,500 34,100 81,600 3.5
Allied Bank of Pakistan 515 200 - 6 40 1,583,300 33,300 14,100 47,400 3.0
5,668 2,944 64 27 359
(1) Basic Credit Unit exclusively dealing with Agricultural Credit.
w s
00

Table 4
PAKISTAN
SALINITY CONTROL AND RECLAMATION PROJECT (SCARP) VI
COMMERCIAL BANKS INVOLVEMENTIN THE PROJECT AREA - RAHIMYAR KHAN DISTRICT
1975/76
Total of whichNo. Staff Specialized in
of Branches (1) Agricultural Disbursementsor Offices Credit Commercial % Agriculture % Total
…---------------------(Rs million)------------------------
NBP 20 205 1 73.6 87 10.3 13 83.9
HB 18 90 6 16.7 54 13.9 46 30.6
UBL 26 125 1 11.0 31 24.9 69 35.9
MCB 30 128 3 11.8 88 1.6 12 13.4
ABL 9 32 - 25.2 88 3.5 12 28.7
103 580 11
(1) Exclusive of non-clerical staff.
C)~~~~~~~~~~~~~~~II-"~~~~~~~~~~~~~~~~~~~~~~~~~~~~~~~

ANIEX 6Table 5
PAKISTAN
SALINIrTY CONTROL AND RECLAI4ATION PROJECT (SCARP) VI
C0HMERCIAL BANKS LENDING OPERATIONS IN RANDIfAR KNAN DISTRICT1975/76
Loans Disbursed Disbursed Loans Broken Dovn by SizeAmount Less Than Rs 1,000 to Rs 2,000 to Rs 5,000 to Above
No. Rs '000 % Rs 1.000 Rs 2.000 Rs 5.000 Rs 25.000 Rs 25,00
National Bank of PakistanProduction Loans
Fertilizers 1,700 9,372 91 7,312 732 353 975 -Pesticides - - - - - - -Seeds 54 340 3 - 82 258
1,754 9,-712 94 7,312 814 611 975 -
Development LoansTubewells 2 15 " - - - 15Land LevellinR - - - -Others (1) 35 578 6 - 178 _ 400
37 593 6 - -178 15 400Total 1,791 10.305 100 7.312 814 789 990 400
Nabib Bank Ltd.Production Loans
Fertilizers 816 2,000 29 400 650 250 700 -Pesticides - - - -Seeds 890 2.800 40 280 660 1.120 _J740
1,706 4,800 69 680 1,310 1,370 1,440 -Developisent Loans
Tubewells 60 1,380 20 - - - 1,380Land Levelling - - -Others (1) 17 780 11 _ - - - 780
77 2.160 31 1.380 780Total 1.783 6.960 100 680 1.310 1,370 2.820 780
United bank Ltd.Production Loans
Fertilizers 3,510 7,756 50 - 2,365 1,616 2,670 1,105Pesticides 136 680 4 - 40 486 154 -Seeds 317 1.665 11 - 515 106 160 884
3,963 10,101 65 - 2,920 2,208 2,984 1,989DevelIopmen t Loans
Tubevells 128 2,780 18 - - - 2,030 750Land Levelling - - - -Others (1) 188 2,640 17 - 605 1.285 750
316 5,420 35 - - 605 3.315 1.500Total 4,279 15.521 100 - 2.920 2,813 6.299 3.489
14uslis Cose,ercial BankProduction Loans
Fertilizers 78 376 37 18 42 140 176 -Pesticides - -Seeds 5 35 3 _ - 15 20
83 411 40 18 42 155 196 -Development Loans
Tubewells 32 624 60 - - _ 478 146Land Levelling 1 4 4Others -
33 628 60 - 448 4Total 116 1.039 10O 18 42 159 674 146
Allied Bank of Pakistan__Production Loans
Fertilizers 399 757 62 43 330 337 47 -Pesticides 22 35 3 - 19 16 -Seeds 46 50 4 23 27 -
467 842 69 66 376 353 47 -Development Loans
Tubewells 10 120 10 - - - 120Land Levelling 5 16 1 - - 16 - -Others (1) 21 242 20 - _ 62 - 180
36 378 31 - - 78 - 180Total 503 1.220 100 66 376 431 167 180
(1) Mainly tractors and bullocks.

Table 6
PAKISITANO
Conaet I-Blac Sheet 1973 to 1975 for the Fice Nolioo..liaed Coe-rcll Oanke(Rs -ilion)
National Bek Bobib leek united flank Bloslis Coesorie1 Allied leek National Bak Habib flak United Meak Muslim Cos-rtl1 Allied Bleekof Peklet- Liedld Limited leek LIited a'LmldI fPksa iie iie ln ieid a) Limte bi19317 9517 9417 9317 9312 941975 17 194 971973 1974 1975 1973 1I974 1975 1973 1974 1975 1973 1974 1975 1973 1974 1975
A I S E T I S
Ceeb 530 795 1)17 620 753 937 647 641 972 239 351 672 1951 293 364 paid dp Capite1 Ii 30 30 93 95 95 68 38 39 32 27 27 13 11 fiSBanka 769 1171 1207 732 792 1231 262 268 188 46 91 194 34 12 11 R...oC . .Q_ 4 = 31 Jfiu US U1 -Al _a _u zA. .38 __, 2 . 13Mony 01 Call
111 130 161 201 250 292 135 120 130 51 57 61 28 20 36
631 438 LS 855 446 46 357 480 076 52 5 7 10 25 16 Correct Aeceonte 2296 3219 4025 2473 3052 3377 1623 1800 3257 585 879 1124 365 557 6921929 404 3 Z20 198125841266 389 236 36 437 939 39 33 31 DePosits Fined 2001 2081 2933 2321 2121 5899 2321 2339 3462 318 696 893 258 496 764
Ioetnt(1) 14-41 1414 1966 107 1914 0106 1440 1363 15330 561 t34 837 132 292 403 Savina 1391 1771 2193 2786 3420l 4325 1924 2235 2391 85 1131 1500 330 407 510Ad-eo.e (2)
5690 7071 9143 7380 8593 11081 5868 6393 8010 17468 2506 3517 953 1660 1988
Ovedrafts 2785 4087 3054 3404 5445 6544 3139 5828 5108 1138 2034 2329 653 1022 1389 B-resing* 7 5319 8 1 $552 4 7 1 1 4 2 4 3fills Dti Bills Paytbls k Other Llebillti.s 414 541 581 276 459 478 112 131 151 37 158 118 43 70 61onoatod 376 1144 313 601 767 lout 57 535 559 49 68 106 28 57 121 C._A_ .42 1139 3937 4734 692I 2619 78 22 2. 0
3141 5321 3069 4003 6212 7622 3713 4363 5666 1207 2102 2433 681 1079 1110 P-efit and Lose Acoont
- - - -- - - - - - - - - - - B.1-.aianoB/F 1 2 - 16 2 3 - - - - I -. Ceetra Anoonte 4227 6141 3794 3350 5074 5407 3041 2618 2811 1226 1698 1777 252 2354 202Pnofit for Ike Yeo 41 74 93 114 211 253 41 65 81 9 L8 32 6 11 13Vimed A eets
(Ndat) 73 111 123 106 124 139 09 94 102 31 39 32 14 13 20 42 76 95 150 213 256 41 85 81 9 29 52 6 12 15Othee Asse.ts 102 136 141 145 204 161 161 081 232 49 125 156 30 112 181
Approptrl-eoe (3) 40 76 94 128 21O 255 41 65 81 8 2 32 5 12 15
Alsseebed BltI-6 C/F 2 - 1 2 3 1 - - - - - 1 - -Beebe - - - ~~~~~- 2 - - - -6- - 3 - Tt1-ili.194146106U9 53 83491 02 27 3653 2619 0220
T-1 A...t. 10915 15426 15076 11696 15531 18Tota1L34illtts 1014 1426850760697 53311815 9718100231247633665033621 13957952280
(1) l6ostly Coveenet and other Itosteesaoie
(2) Net of bad debts for heich provistes seetefattar to the kAditota 5b9m best made.
(3) loclodto poiso fortesit
a) .. sbsoobad tke Prnier Bask Ltd.
,) tR .. e Iro. f bo th ergiog of: ; otaai Bank Lad.0 ~~~~~~~~~~~~~~~~~~~~~~~~~~~~~~-hOtbd flak Ltd.-Lhtiar Bank Ltd.- Pk Ba_k Ltd-

ANNEX 7Page 1
PAKISTAN
SALINITY CONTROL AND RECLAMATION PROJECT (SCARP) VI
Consulting Services
General
1. The WAPDA (NZ), who would be the executing agency for SCARP VI,would be assisted by a consulting firm (hereinafter referred to as Consul-tants) in the detailed planning, design and execution of the project.However, to provide the maximtm amount of training and continuity, theConsultants would be principally advisors.
2. The Consultants wou]d advise and supervise the work of WAPDA person-nel, be it planning, design or field supervision of construction work. TheWAPDA staff may be, and for mzitters connected with the surface irrigationsystem preferably should be, cn secondment from the Irrigation Department,so as to ensure maximum contirnuity after WAPDA withdraws from the project.
3. Consultant services woulcl, in addition, be provided to support prepara-tion of high priority projects identified under the Indus Basin Planningproject. The objectives of the Planning Project include identification,in the form of a Revised Action Plan of high priority projects for earlyimplementation. Such projects are in various stages of preparation, andmost need further work to fintlize preliminary designs so that appraisalcan take place, and for revisions in design to incorporate necessary changesidentified during the planning exercise.
Services Required
4. For the detailed design of SCARP VI, it is expected that the totalcumulative time for which expertise and skills not available within Governmentservices would be required is a total of about 310 man-months. This would bedivided as follows:
(a) Civil Engineer/Team Leader:
He would have overall responsibility for the workingof the group. He should have extensive experiencein irrigation and drainage works construction, andin managing and executing large projects. He wouldbe required for 72 vronths.
104

ANNEX 7Page 2
(b) Irrigation Engineer:
He would be responsible for the design of the remodelledcanal system and the design and construction of the newwatercourses. The selection, design and implementationof works in the pilot areas for matters other than landleveling would be his responsibility. His services wouldbe required for 60 months.
(c) Geohydrologist/Groundwater Engineer:
His first task would be to set up a groundwater model(in which he would be assisted by a Computer Programmer,see below) to test the characteristics of the aquiferagainst past records and predict its behavior under proj-ect conditions. He would identify and develop the neces-sary inputs for the Tyson-Weber polygonal model, andestablish whether and when, under full implementationwater regime, and drainage works would have to be extendedto the remaining 250,000 ac of Unit IV and V. He wouldadvise on the design and layout of the tubewell fieldand the details of the wells under the differentconditions. His services would be required for 48 months.
(d) Drainage Engineer:
He would assist with the design of the saline effluentdisposal system, the pumping stations and the evaporationponds. His first tasks would be to oversee the surveysnecessary and to accurately locate them. It is expectedthat his service would be required for 24 months.
(e) Economist/Agricultural Economist:
He would set up studies to ascertain the present statusof the business of representative sample farmers andcontinue to monitor and update their progress as theproject advances. He would maintain contact with allsections of the Department of Agriculture who are in-volved in the implementation of the project. He wouldassist in the training of the staff of the CBs inappraising loans to farmers for tubewells, leveling andgypsum. He would assist CMO to organize annual and sea-sonal data collection to enable project benefit monitor-ing to be done effectively. His services would berequired for 24 months.
105

ANNEX 7Page 3
(f) Agriculturist:
He would work with the extension and research servicesto develop suitable cropping patterns applicable underproject conditions and also to determine the culturalpratices, including selection of varieties, fertilizerand pesticide application, desirable degree and kind offarm mechanization that would optimize production andfarm profits. His servLces would be required for atotal of 24 months divided into two or three periods,during which changes in soil and water relations wouldbecome manifest and enable him to adjust his recommen-dations accordingly.
5. In addition to the discLplines mentioned above, all of which wouldbe required either continuously or in two or three relatively long periods,there would be a need for short-term visits to keep a watching brief, andprovide guidance, for other disciplines. Foreseeably, such would be theservices of a soil scientist and alkali reclamation specialist, hydrologist,electrical engineer specializing Ln transmission lines, switchgear and trans-formers, and a computer programmer. It is estimated that for these disciplinesan aggregate of 24 man-months be required. There should be a contingencyallocation for a further 24 man-months, making a total consultant time of310 man-months.
Consultants' Work Program for SCAILP VI Detailed Design
6. The Consultant would inn.tially work within WAPDA's Project PlanningDirectorate in Lahore. The engineers who will eventually be assigned to theProject Director, SCARP VI for overseeing project construction would also workwith the Project Planning Directorate and transfer to the field before actualwork starts. The Consultants would similarly transfer their operation to theproject area as the design work is completed. About 1-1/2 years after arrivalpractically all the work would be on site.
7. The preparation of Operation Manuals for each of the project com-ponents would be a major part of the Consultants' work.
Consultant Allocation for Preparation of SubsequentHigh Priority Projects
8. The final list of projects to be prepared for early implementationwill depend on the recommendations of the UNDP Revised Action Program, ex-pected in late 1978.
106

ANNEX 7Page 4
Costs
9. It is expected that the consulting firm for detailed design ofSCARP VI would be internationally recruited. Therefore, inclusive of companyoverheads and supervision, it is expected that costs would be about US$7,000per man-month at present prices. Air travel, local housing and mobilizationcosts are extra. The budget is expected to be as follows:
US$ '000
Mobilization costs 4310 man-months @ 7,000 2,170Air travel for full-time staff and 90
families 20 x $4,500Air travel, visiting staff 45Housing, full-time staff 120Offices 15Housing & hotel accommodation, visiting staff 78Local transport costs and allowances 100Urban transport 20Office equipment (other than transport) 200Supporting staff (clerical & administrative) 120Furnishings etc. 20
Total 2,982
10. To enable final preparation of high priority projects, expendi-tures of up to US$2 M would be financed by IDA to support necessary con-sultant activities.
November 1977
107
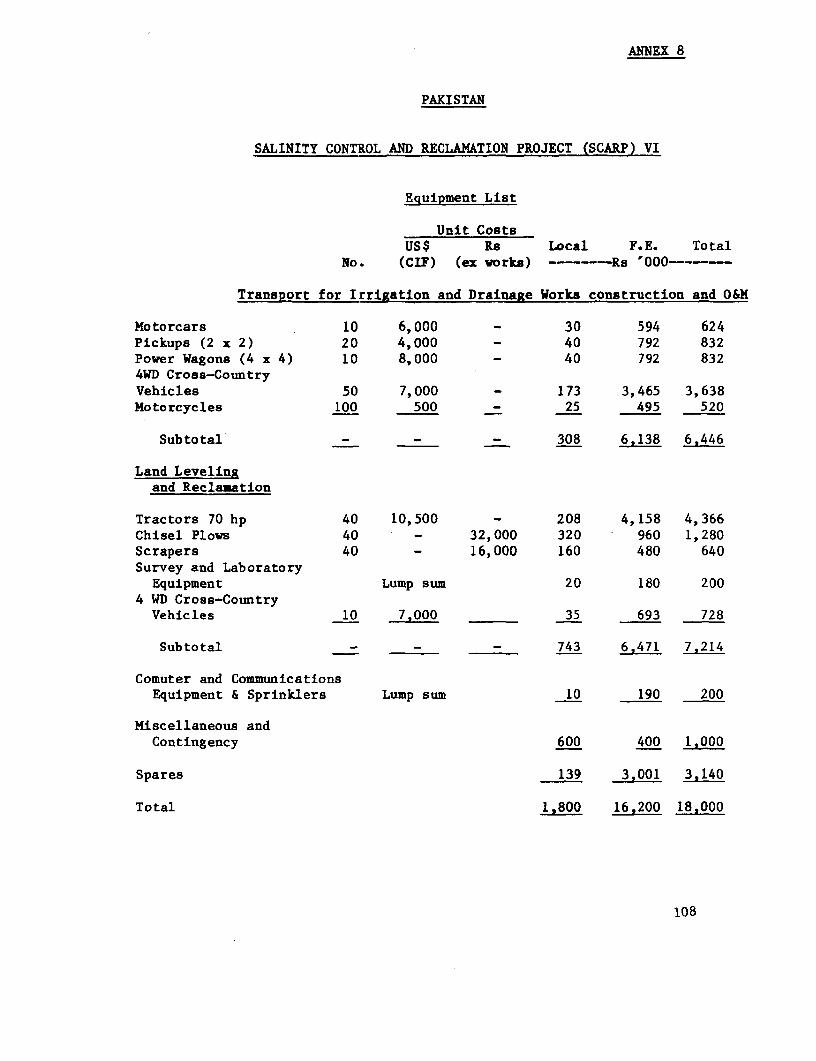
ANNEX 8
PAKISTAN
SALINITY CONTROL AND RECLAMATION PROJECT (SCARP) VI
Equipment List
Unit CostsUS$ Rs Local F.E. Total
No. (CIF) (ex works)… Rs '000--
Transport for I:rrigation and Drainage Works construction and O&M
Motorcars 10 6,000 - 30 594 624Pickups (2 x 2) 20 4,000 - 40 792 832Power Wagons (4 x 4) 10 8,000 - 40 792 8324WD Cross-CountryVehicles 50 7,000 - 173 3,465 3,638Motorcycles 100 500 - 25 495 520
Subtotal - - - 308 6,138 6,446
Land Levelingand Reclamation
Tractors 70 hp 40 10,500 - 208 4,158 4,366Chisel Plows 40 - 32,000 320 960 1,280Scrapers 40 - 16,000 160 480 640Survey and LaboratoryEquipment Lump sum 20 180 200
4 WD Cross-CountryVehicles 10 7,000 35 693 728
Subtotal - - - 743 6.471 7.214
Comuter and CommunicationsEquipment & Sprinklers Lump sum 10 190 200
Miscellaneous andContingency 600 400 1,000
Spares 139 3.001 3.140
Total 1,800 16,200 18,000
108

ANNEX 9Page 1
PAKISTAN
SALINITY CONTROL AND RECLAMATION PROJECT (SCARP) VI
Water Demand, Supply and Quality
Water Demand
1. Crop water requirements of the design cropping pattern have beencalculated using the modified Penman approach. U.S. Weather Bureau Class Apan evaporation figures were extrapolated from nearby weather stations andhalf-monthly crop factors were developed from the appropriate curves. Therequirements were calculated inclusive of water requirements for land pre-paration and, where appropriate, due allowance was made for soil moisturedepletion. Table 1 shows the spread of planting times and the K-curves used;Table 2 gives the K-curves, Table 3 (16 pages) the crop water requirements. 1/Table 4 is a summary of Table 3; Table 5 shows the cropping patterns adoptedfor the development units; Table 6, 7, 8 and 9 water requirements for theseparate units and Table 10 the total project water requirements. Cropwater requirements are calculated in milimeters and the totals are expressedin million cubic meters. It will be noted that no allowance was made forrainfall, which is very low on the average (Annex 1) and also there maybe several consecutive years without rain.
2. All figures in the foregoing tables refer to consumptive userequirements, without any allowance for conveyance or percolation losses.These have been determined as follows (Annex 3):
Watercourse channel losses: 10% of deliveries at module.Infiltration losses in the field: 20% of deliveries at module.
3. To arrive at requirements at the barrage, it was assumed thatlosses between barrage and watercourse head amount to 35% (Annex 3). There-fore, water use efficiency between barrage diversion and consumptive use is45.5%. Table 11 shows water requirements per planning unit, at watercoursehead and also at diversion; for easier comparison with published data, theyare converted to acre-feet.
4. Requirements shown at the barrage in Table 11 take into accountthe pumpage of fresh water in Units II and III. Unit III pumpage is con-fined to the rabi and is assumed to cover the needs of the crops. InUnit II however, 135 wells of three cusec capacity and 70% annual utiliza-tion are assumed to be pumping about 17,000 ac-ft per month, for exportto Unit V.
1/ The crop calendars after which Table 3 was drawn up are shown inAnnex 15. 109

ANNEX 9Page 2
5. Diversions necessary for the kharif requirements of Unit II arepartly met in months of peak demand by using the irrigation wells in thatunit (Annex 3) to supplement surface supplies. Through an iterative processof calculation, it was found that the combined monthly flow rate of the wells,as shown in Table 12, would maintain the water balance in Unit II in the kharifby deducting pumpage by the irrigation wells from requirements at the moduleand allowing, as before, a 65% delivery efficiency for the balance betweenbarrage and module. There are no diversion requirements in the rabi, sincein Unit II all water would comne from the irrigation wells within the unit.
6. In Unit V, diversion requirements were calculated based on require-ments at the module, less that portion of the 17,000 ac-ft monthly exportpumpage from Unit II arriving at the modules, which is assumed to be 75% ofthe pumpage or say 12,800 ac-ft per month. The final column of Table 11shows the half-monthly requirements, in acre-feet, at the barrage.
Water Supply
7. Table 13 shows montiLy availabilities at the Panjnad Barrage, com-pares them with surface water demand as shown by monthly diversion require-ments and shows monthly and total deficiencies. Availabilities at thebarrage are the mean historic post--IBP flows.
8. Supplies available Erom pumpage of groundwater, and suitable forirrigation, are shown in detail in Annex 3, as are recharge and groundwaterbalance calculations. In Unit II, in addition of the kharif supplies usedto supplement surface flows, and the year-round supplies provided for useelsewhere by the drainage wel.Ls, the irrigation wells are designed to meetfull water requirements at the module for the rabi. In Unit III the sameassumption is made, although actual pumpage may be slightly lower than shown,since, unlike in Unit II, the privately owned tubewells are likely to benearer the fields they are expected to serve and therefore actual conveyancelosses -- and possibly even f:Leld losses, due to more efficient control andutilization -- may well be lower.
Water Quality
9. The quality of river water has been studied over many years andfound to be very high (Table L4). No risk of damage to the soil exists,given minimum standards of irrigation techniques and at least one heavy irri-gation each year.
10. Groundwater quality in the project area has also been extensivelystudied, and it has been concluded that, as a general rule, wells in Unit IIand III are likely to yield waiter suitable for irrigation. Table 15 givesthe analysis from a total of 1,129 wells and concludes that, according tothe criteria explained in Annex 2, and in view of the fact that excellent
110
ANNEX 9Page 3
river water is available in the kharif with which to leach any accumulation ofsalts almost every year, at least 95% of the wells yield water suitable forirrigation without mixing.
November 1977
:11
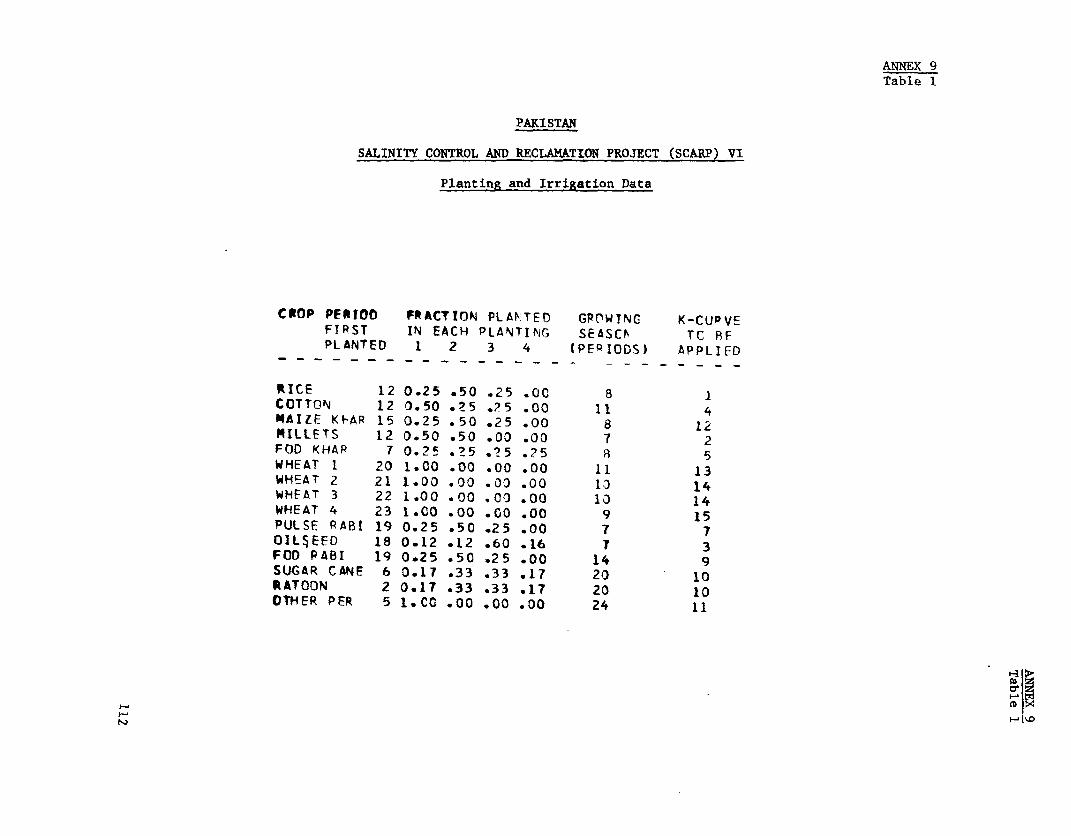
ANNEX 9Table 1
PAKISTAN
SALINITY CONTROL AND RECLAMATION PROJECT (SCARP) VI
Planting and Irrigation Data
COOP PFIOO FRACTION PLANTED GPDWTNG K-CUPVEFIRST IN EACH PLANTIN(G SEASCh TC RFPLANTED 1 2 3 4 (PEQI0DS) APPLIED
RICE 12 0.25 .50 .25 .00 8 1COTTON 12 0.50 .25 .25 .00 11 4tAIZE KF-AR 15 0.25 .50 .25 .00 8 12MILLETS 12 0.50 .50 .00 .00 7 2FOD KHAR 7 0.2 *25 .25 .?5 A 5WHEAT 1 20 1.00 .00 .00 .00 11 13WHEAT 2 21 1.00 .00 .00 .00 13 14WHEAT 3 22 1.00 .00 .00 .00 10 14WHEAT 4 23 1.00 .00 .CO .00 9 15PULSE RABI 19 0.25 .50 .2 5 .00 7 7OIL5EED 18 0.12 .12 .60 .16 7 3FOD PABI 19 0.25 .50 .25 .00 14 9SUGAR CANE 6 0.17 .33 .33 .17 20 10RATOON 2 0.17 .33 .33 .17 20 10OTHER PER 5 1.CQ .00 .00 .00 24 11
* 1a

ANNEX 9Table 2
PAKISTAN
SALINITY CONTROL AND RECLAMATION PROJECT (SCARP) VI
Crop Factors Used Over Growing Period
K-CURVESCURVE 0% 10% 203 302 40% 50% 60g 70% 80% 90% 100S
1 0.9 0.85 0.95 1.03 1.17 1.34 1.36 1.28 1.12 0.96 0.842 0.2 0.36 0.44 0.51 0.59 0.79 0.81 0.66 0.54 0.47 0.433 0.3 0.40 0.50 0.58 C.95 1.05 1.15 1.18 1.05 0.85 0.504 0.2 0.35 0.55 0.65 0.75 1.05 1.13 1.17 0.97 0.81 0.425 0.0 0.35 0.39 0.50 0.65 0.70 0.70 0.90 0.85 0.85 0.836 3.3 0.38 0.55 0.65 0.80 0.90 1.20 1.20 0.80 0.70 0.607 0.3 0.38 0.42 0.47 0.54 0.72 0.78 0.85 0.85 0.68 0.528 3.3 0.25 0.34 0.62 0.90 1.05 1.05 1.05 1.00 0.68 0.409 0.3 0.35 0.63 0.67 0.73 0.84 0.96 1.04 1.06 0.83 0.68
10 0.5 0.90 1.24 1.30 1.35 1.35 1.30 1.25 1.10 0.90 0.7011 0.7 0.75 0.80 0.80 0.80 0.80 0.82 0.85 1.00 0.80 0.7012 0.4 0.31 0.40 0.52 0.68 1.05 1.05 0.79 0.71 0.67 0.6313 0.3 0.44 0.58 0.68 0.80 0.90 1.05 1.15 1.20 1.05 0.6514 0.3 0.44 0.56 0.71 0.84 0.98 1.11 1.20 1.19 1.02 0.6515 0.3 0.49 0.62 0.77 0.91 1.05 1.17 1.20 1.18 1.00 0.65
.~~~~~~~~~~~~~~~~~~I

Table 3Page I
PAKISTAN
SALINITY CONTROL AND RECLAMATION PROJECT (SCARP) VI
Crop Water Requi-rements
Rice
JAN FES PAR APR MAY JUN JUL AUG SEP OCT NOV DEC1 2 3 4 5 6 7 8 9 13 it 12 13 14 i5 16 1? 18 19 23 21 22 23 24
EST FAIN 0 .0 0. 0. 0. 0. 0. 0. 0. 0. 0.
ETO 36. 40). 45. 53. 63. 7'.. 86. S6. 106. 112. 113. 112. 1 07. 102. 98. 93. 88. 82. 14. 64. 53. 43. 36. 34.
CRtOP FACT 0.00 0.03 0.0C 0. 00 0.03 0.30 0.o0 0.00 0.00 0.00 0.00 0 .22 0.67 0.95 1.07 1.22 1. 31 1. 26 1. 10 0.73 0.23 0. 00 0.00 0.00CONS LISF 0. 0. 0. 0. 0. 0. 0, 0. 0. 0. 0. 24. 71. 97. 105. 1 14. 115. 103. 81. 47. 12. 0. 0. 0.LANDPPFP 0. 3). 0. 0. 0. 0. 0. 0. 0. 0. 25. 50. 25. 0. 0. 0. 0. 0. 0. 0. 0. 0. 0. 0.PERC 0. 3. 0. 0. 0. 0. 0. 0. 0. 0. 0. 10. 35. 45. 45. 45. 45. 45. 35. 25. 0. 0. 0. 0.RESMOIST 0. 3. 3. 0. 0. 0. 0. 0. 0. 0. 0. 0ll 0. 0. 0. 0. 0. 0. 0. -30. -12. 0. 0. 0.
GROSS RFQ 0. 3. 0. 0. 0. 0. 0. 0. 0. 0. '25. 84. '1 31. 142. 150. 159. 160. 148. 116. 42.' 0. 0. 0 . 0.
EFF PAIN 0. 3. 0. 0. 0. 0. 3. a0. 0 . 0 . 0. 0. 0. 0. 0. 0. 0. 0. 0. 0. 0. 0 . 0 . 0.
NET REQ 0. 0. 0. 0 . 0. 0. 0. I 0. 0. 0.- 25. 84. 131. 12. 150 5.160.18 16. 42. . 0. 0. 0.AT FIELD
IRQ. QEQ 0. 3. 0. 0. 0. 0. 0. 0. 0. 0. 25. 84. 131. 142. 150. 159. 160. 148. 116. 42. 0. 0. 0. 0.AT TUPR!CUTFIELD F~F9 ****T
TCTALS (MM)CONS USE * 768.EFF PAIN = 0.IRR4 PEO = 1156.

TablIe 3Page 2
PAKI STAN
SALINITY CONTROL AND RECLANATION PROJECT (SCARP) VI
Crop WaertRequirements
Cotton
JAN FEB MAR APR MAY JUN JUL AUG SEP OC T NOV DEC
1 2 3 4 5 6 7 8 9 10 11 12 13 14 15 16 17 18 19 20 21 22 23 24
EST PAIN 0. 0. 3. 0. 0. 0. 0. 0. 0. 0. 0. 0.
ETO 36. 40. 45. 53. 63. 74. 86. 96. 106. 112. 113. 112. 107. 102. 98. 93. 88. 82. 74. 64. 53. 43. 36. 34.
CROP FACT 0.00 0.00 0.00 0.00 0.00 0.0C O.00 0.00 0.00 0.00 0.00 0.13 0.28 0.46 0.58 0.70 0.89 1.02 1.12 1.08 0.98 0.77 0.37 0.15
CONS USE 0. 0. 0. 0. 0. 0. 3. 0. 0. 0. 0. 15. 30. 47. 57. 65. 78. 83. 83. 69. 52. 33. 13. 5.
LANDPREP 0. 0. O. 0. 0. 0. 0. 0. 0. 0. 50. 25. ZS. 0. 0. 0. 0. 0. 0. 0. 0. 0. 0. 0.
RESMWIST 0. 0. O. 0. 0. 0. 0. 0. 0. O. 0. 0. 0. 0. 0. 0. 0. 0. 0. 0. 0. -33. -13. -5.
… _ _ _ _ _ _ _ _ _ _ _ _ _ _ _ _ _ _ _ _ _ _ _
GRCSS REQ 0. 0. 0. 0. 0. 0. 0. 0. J. O. 50. 40. 55. 47. 57. 65. 78. 83. 83. 69. 52. 0. 0. 0.
EFF RAIN 0. 0. 0. 0. 0. 0. 0. 0. 0. 0. 0. 0. 0. 0. 0. 0. 0. 0. 0. 0. 0. 0. 0. 0.CFF RAIN °~~~~~~~~~~~~~~~~~~~~~~~~~~~~;- -* -* °- °-- °- °- -* °- °- °- °- °
NET QEQ 0. 0. 0. 0. 0. 0. 0. 0. 0. O. 50. 40. 55. 47. 57. 65. 78. 83. 83. 69. 52. 0. 0. 0.
AT FIELO
IRP. PEO 0. 0. 0. 0. 0. 0. 0. 0. 3. 0. 50. 40. 55. 47. 57. 65. 78. 83. 83. 69. 52. 0. 0. 0.
AT TURNOUTFIELD EFF ****?
TOTALS (MM$CCNS USE z 631.EFF RAIN - 0.TRR QFO = 680.
P e

ANNEX 9PAKI STAN Table 3
Page 3SALINITY CONTROL AND RECIAMATTON PROJECT (SCARP) VI
Crop Water Reguirements
Maize
JAN FEB MAR APR MAY JUN JUL AUG SEP OCT NOV DEC1 2 3 4 S 6 7 8 9 10 11 12 13 14 IS 16 17 18 19 20 21 22 23 24
EST RAIN 3. 0. 0. 0. 3. 0. 0. 0. 0. 0. 0. 0.
ETO 36. 40. 4'i. 53. 63. 74. 86. 96. 136. 112. 113. 112. 107. 102. 98. 93. 8R. 82. 74. 64. 53. 43. 36. 34.
CROP FACT 3.0 0.)3 0.30 0.00 0.03 J.00 3.30 0.00 3.03 0.00 3.00 3.00 3.00 0.00 0.09 0.27 0.42 0.57 0.81 3.94 0.85 0.72 0.50 0.16CONS tSE 0. 3. 0. 0. 3. 0. 0. 0. 3. 0. 3. ). 0. O. 8. 25. 37. 47. 59. 60. 45. 31. 18. 4.LANOPQFP C. 0. O. 0. O. 0. 0. 0. 0. 0. O. 3. 0. 20. 43. 20. 0. 0. 0. 0. 0. 0. 0. 0.
GROSS PEC 0. U. O. 0. 0. 0. 0. 0. 0. 0. 0. 0. 0. 20. 48. 45. 37. 47. 59. 60. 45. 31. 18. 6.
EFF PAIN 0. 3. 0. 0. 0. 0. - - 0o o . . . 0. . u. u. 0. 0. 0. 0. 0. 0. 0. 0.
NET QEQ 0. 3. 3. 0. O. 0. O. O. 0. 3. 0. 0. 0. 20. 48. 45. 37. 47. 59. 60. 45. 31. 18. 6.AT FIELf'
IRR. REO 0. 3. 0. 0. 3. 0. 3. 0. 0. O. 0. 3. 0. 2a. 48. 45. 37. 47. 59. 63. 45. 31. 18. 6.AT T(JRNOUTFIELD EFF ****X
TCTALS (MtmCONS USE - 336.5FF RAIN - 0.
IPQR RE = 416.
o~~~~~~~~~~~~~~~~~~~~~~~~~~~~~~~~~~~~~~~~~~~~~~~~~~~P wWlI-. Ii..~~~~~~~~~~~~~~~~~~~~~~~~~~~~~~~~~~pPI-..~~~~~~~~~~~~~~~~~~~~~~~~~~~~~~~~~~~~~~~~~~~~~~~~L)%
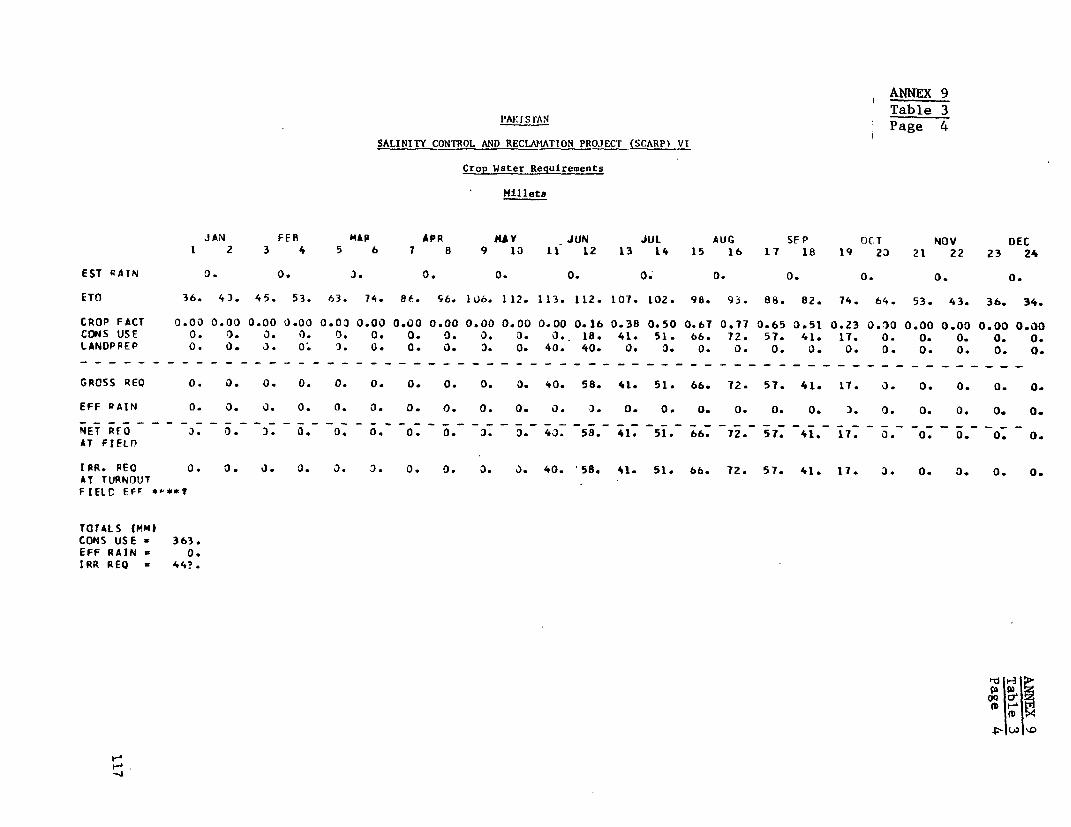
ANNEX 9Table 3
PAY[S AN Page 4
SALINITY CONTROL AND RECLANATTON PROJECT (SCARP) VI
Crop Water Requirements
Milleta
JAN FEB MAP APR MA Y JUN JUL AUG SE P OCT NOV DEC
1 2 3 4 5 6 7 8 9 10 I1 12 13 14 15 16 17 18 19 23 21 22 23 24
EST RAIN 0. 0. J. 0. 0. 0. o.o 0. 0. 0. 0.O,
ETO 36. 43. 45. 53. 63. 74. 8e. S6. IU6. 112. 113. 112. 107. 102. 98. 93. 88. 82. 74. 64. 53. 43. 36. 34.
CROP FACT 0.00 0.00 0.00 0.00 0.03 0.00 0.00 0.00 0.00 0.00 0.00 0.16 0.38 0.50 0.67 0.77 0.65 0.51 0.23 0.o0 0.00 0.00 0.oo 0.00
CONS USE 0. 3. J. 0. 3. 0. 0. 0. 0. 0. O. 18. 41. 51. 66. 72. 57. 41. 17. 0. 0. 0. 0. 0.
LANDPPEP 0. 0. 3. o. 3. a. 0. 0. 3. 0. 40. 40. 0. 3. 0. 0. 0. 0. 0. 0. 0. 0. 0. 0.
…__ _ _ _ _ _ _ _ _ _ _ _ _ _ _ _ _ _ _ _ _ _ _ _ _ _ _ _ _ _ _ _ _ _ _ _ _ _ _ _ _ _ _ _ _ _ _ _ _ _ _ _ _ _ _ _ _ _ _ _ _ _ _
GROSS REQ 0. 0. 0. 0. 0. 0. 0. 0. 0. 0. 40. 58. 41. 51. 66. 72. 57. 41. 17. 3. 0. 0. 0. 0.
EFF RAIN 0. 0. 0. 0. 0. 0. 0. 0. 0. 0. 0. o. 0. 0. 0. 0. 0. 0. 3. 0. 0. 0. 0.
NET REQ 3. o. o. 0. 0. o. 0. 0. D. 8. 40. 58. 41. 51. 66. 72. 57. 41. 17. o. 0. 0. 0. 0.
AT FtELn
IPR. PEO 0. 0. J. 0. 3. 3. 0. 0. 0. 3. 40. 58. 41. 51. 66. 72. 57. 41. 17. J. 0. 0. 0. 0.
AT TURNOUTFIELC EFF *.**t
TOTALS (MM)
CONS USE - 363.EFF RAIN s 0.IRR REQ * 44?.
ItdH 0QSiOX
0ID
I-.

ANNEX 9TIIable_3Page S
PAKI STAN
SALINITY CONTROL AN]D RECLAIATION PROJECT (SCARP) VI
Crop Water Requiirements
FOD KUAR
JAN FEB MAP APR MAY JUN JUL AUG SeP OCT NOV DEC1 2 3 4 5 6 7 8 9 10 11 12 13 14 15 16 17 18 19 23 21 22 23 24
EST RAIN 0. 0. O. 0. J. 0. 0. U. ;3. 0. O. O.
ETO 36. 43. 45. 53. 63. 74. e6. se. lJ. 112. 113. 112. 107. 102. 98. 93. 88. 82. 74. 64. 53. 43. 36. 34.
CROP FACT 0.00 0.00 O.OC 0.03 0.33 0.00 0.05 0.15 04.J8 0'.5 0.57 0.69 0.77 0.81 0.64 0.42 0.21 0.00 0.00 0.00 0.00 0.00 0.00 0.00CONS USE 0. 3. 0. 0. 0. 0. 5. 15. 33. 50. 64. 77. 82. 83. 63. 39. 18. 0. 0. 3. 0. 0. 0. 0.LANOPREP 3. 3. 3. 0. 3. 20. 20. 20. 23. 0. 0. J. 0. 0. 0. O. 0. 0. 0. 3. 0. 0. 0. 0.
GRCSS REO 0. o. J. 0. 3. 20. 25. 3'. 50. 50. 64. 77. 82. 83. 63. 39. 18. 0. O. 0. 0. 0. 0. 0.
EfF RA1N 0. 3. 2. 0. 3. 0. 0. O. J. 0. 3. O. 0. 0. 0. 0. 0. 0. 0. 0. 0. 0. 0. 0.
NET REO 3. 3. 0. 0. 0. 20. 25. 3;. 50. 5. 64. 77. 82. 83. 63. 39. 18. 0. 0. O. 0. 0. 0. 0.AT FIELD
IRR. PEO 0. 3. O. 0. 3. 23. 25. 3'5. 50. 50. 64. 77. 82. 83. 63. 39. 18. 0. 0. 3. 0. 0. 0. 0.AT TURNOUTFIELD EFF ****?
TOTALS [MM)CONS USF = 526.EFF PAIN . 0.IRR RQF = 636.
OQ c(U tp m
s~~~~~~~~~~~~~~~~~~~~~~~~~~~~ X

ANNEx 9
PAKISTAN Table 3
SALINITY CONTROL AND RECLAHATION PROJECT (SCARP! Vl
Crop Water Requirements
Wheat I
JAN FEB MAF APR MAY JUN JUL AUG SEP OCT NOV DEC
1 2 3 4 5 6 7 8 9 10 11 12 13 14 15 16 17 18 19 20 21 22 23 24
EST RAIN 0. 0. 3. 0. 0. 0. 0. 0. 3. 0. 0. 0.
ETO 36. 40. 45. 53. 63. 74. t6. 96. 136. 112. 113. 112. 107. 102. 98. 93. 88. 82. 74. 64. 53. 43. 36. 34.
CROP FACT 0.90 1.34 1.13 1.19 I.IJ C.83 O.OC 3.00 0.00 0.00 0 .00 0.00 0.00 0.00 0.00 0.03 0.00 0.00 0.39 0.49 0.61 0.70 0.81
CONS USF 32. 41. 51. 63. 70. 62. 0. O. 0. 0. 0. 3. 0. 0. 0. 0. 0. 0. 0. 25. 26. 26. 25. 27.
LANDPREP 0. J. 0. 0. J. 0. 0. 0. 0. 3. O. J. 0. 0. 0. 0. 0. 0. 83. 0. 0. 0. 0. 0.
GROSS REO 32. 41. 51. 63. 7C. 62. U. 0. 0. 0. 0. 0. 0. 0. 0. 0. 0. 0. 80. 25. 26. 26. 25. 27.
EFF RAIN 0. . 0. 0. 3. 0. 3. 0. 0. 0. 0. 3. 0. 0. 0. 0. 0. 0. 0. 0. 0. 0. 0. 0.
NET pEQ 32. 41. 51. 63. 70. 62. 3. 0. O. 0. 0. 0. 0. 0. O. 0. 0. 0. 80. 25. 26. 26. 25. 27.
AT FIELf3
IRP. DEG 32. 41. 51. 63. 70. 62. a. 0. 0. 0. 0. 0. 0. 0. 0. 0. 0. 0. 80. 25. 26. 26. 25. 27.
AT TURNOUTFIFLO EFF ****T
TOTALS (mm)CONS USE - 449.EFF QAIN 0.
IRR RFO = 529.
OQ 9(D~
*~~~~~~~~~~~~~~~~~~~~~~~~I ~ ~ ~ ~ ~ ~ ~ ~ ~ ~ ~

ANNEX 9PAYKISTAN Table 3
SALINITY CONTROI AND RECLAMATION PROJECT (SCARP) VI Page 7
Crop Water Requirements
Wheat 2
JAN F- B MAP APR MAY J U.N JUL AUG SEP OCT NOV DEC1 2 3 4 5 e 7 8 9 10 11 12 13 14 15 16 17 18 19 20 21 22 23 24
EST PAIN 0. 0. 0. 0. 0. O. 0. 0. 3. 0. 0. 0.
ETO 36. 40. 45. 53. 63. 74. ee. S6. 106. 112. 113. 112. 107. 102. 98. 93. 88. 82. 74. 64. 53. .43. 36. 34.
CROP FACT 0.91 1.05 1.16 1.23 1.11 0.84 O.CC 0.00 3.30 3.30 3.33 0.33 3.03 0.00 0.00 0.30 0.00 0.00 0.00 0.00 0.39 0.50 0.63 0.78CONS USF 33. 42. 52. 63. 70. 62. 0. 0. 0. 0. 0. 0. 0. 0. 0. 0. 0. 0. 0. 0. 21. 22. 23. 26.LANDPREP 0. 3. ). 0. O. 3. 0. 3. 0. J. 0. . 0. 0. 0. 0. 0. 0. 0. 80. 0. 0. 0. .0.
GROSS REQ 33. 42. 52. 63. 70. 62. 0. 0. 0. 0. 0. 0. 0. 0. 0. 0. 0. 0. 0. 80. 21. 22. 23. 26.
EFF 4A!N 0. 3. O. 0. '3. C. 3. 3. 0. 0. 0. 0. O-. 0. 0. 0. 0. 0. 0. 0. 0. 0. 0Q
NET REQ 33. 42. 57. 63. 70. 6Z. 0. 3. 3. J. 30. . 0. 0. 0. 0. 0. 0. 0. 8J. 21. 22. 23. 26.AT FIELO
IQR. P'Q 33. 42. 52. 63. 70. 62. 0. 0. 0. O. O 0.. 0. 0. 0. 0. 0. 0. 0. 80. 21. 22. 23. 26-AT TUPNOUTFIELD EFF ****I
TOTALS (M4M)CONS USF a 413.EFF 0AIN = 0.1QR Q=Q 493.
C).mQO
0~~~~~~~~~~~~~~~~~~~~~~~~~~~~~~~~~~~~~~~~~~~~~JL)"

ANNEX 9PAKISTAN Table 3
SALINITY CONTROL AND RECLAMATION PROJECT (SCARP) VI Page 8
Crop Water Requirements
Wheat 3
JAN FF6 MAR AP MAY JUN JUL AUG SEP OCT NOV DEC
1 2 3 4 5 6 7 d 9 10 11 12 13 14 15 lo 17 18 19 20 21 22 23 24
EST RAIN 0. 0. 0. 0. 0. U. O* 0. 3. 0. 0. 0.
ETC 36. 40. 45. 53. 63. 74. 66. 9s. 106. 11. 113. 112. 137. 102. 98. 93. 88. 82. 74. 64. 53. 43. 36. 34.
CROP FACT 0.78 0.91 1.05 1.16 1.20 1.11 0.84 0.00 0.00 0.00 0-00 3.JO 0-00 3-.0 0.03 0-00 0-03 0-00 0-00 0.00 0.00 0.39 0.50 0.64
CCNS USF 28. 36. 47. 61. 76. 82. 72. J. 0. 0. 0. 3. 0. 0. 0. 0. 0. 0. 0. 0. 0- 17. 18. 21.
LANDPREP 0. 0. 3. 0. 0. 0. 0. O. 0. 0. 3. 0. 0. 0. 3. 0. 0. 0. 0. 0. 80. 0. 0. 0.
GROSS RFQ 28. 'h6. 47. 61. 76. 82. 72. 0. 3. 3. 0. 3. 0. 0. 0. 0. 0. 0. 0. 0. 80- 17. 18. 21.
EFF RAIN 0. O. 0. 0. 0. 0. 0. J. 0. 0. 0. 0. 0. 0. 0. 0. 0. 0. 0. 0. 0. 0. 0. 0.
_ _ _ _ _ _ _ _ _ _ ~ ~ ~~~ _ _ _ _ _ _ _ - _ _ - _ -- - - - -- _ - - _ _ _ _ _
NET REQ 28. 30. 47. 61. 76. 82. 72. 0. 0. 0. 0. 0- 0. 0. 0- 0. 0. 0. 0. 0. 80. 17. 18. 21.
AT FIELD
IRR. REO 28. 36. 41. 61. 76. 82. 72. 0. 0. 0. 0. -. 0. 0. 0. 0. 0. 0. 0. O. 80. 17. 18. 21.
AT TURNCUTFIELD FFF **** t
TGTALS (1M1CONS USE = 458.EFF PAIN = 0.
IRP PEQ = 538.
p i I'D

£tAnA 9
Table 3PAKI STAN Page 9
SALINITY CONTROL AND RECLIANTION PROJECT (SCARP) VI
Crop Water Requirements
Wheat 4
JAN FEB MAP APR MAY JUN JUL AUJG SEP OCT NOV DEC1 ? > 4 5 6 7 8 9 10 11 12 13 14 15 16 17 18 19 20 21 22 23 24
EST RAIN 0. 0. 0. 0. 0. 0. 0. J. 0. 0. 0. 0.
ETO 36. 4). 45. 53. 63. 74. 86. se. 1)6. 112. 113. 112. 107. 102. 98. 93. 88. 82. 74. 64. 53. 43. 36. 34.
CROP FACT 0.74 0.89 1.05 1. 17 1.20 1.12 3.64 0.00 0.00 0.J0 0.00 0.00 ).00 0.00 0.00 0.00 0.0U 0.00 0.00 0.00 0.00 0.00 0.42 0.58COlNS USE 26. 36. 48. 62. 76. 83. 72. 0. . 3. 0 . 0. 0. 0. 0. 0. 0. 3. a. 0. 0. 0. 15. 19.LANDPPFP 0. J. 0. 0. 3. 0. 0. 3. 0. 0. 0. 0. 0. 0. 0. 0. 0. 0. 3. 0. 0. 80. 0. 0.
GROSS PEO 26. R6. 48. 62. 76. 8'. 72. 0. 0. 0. 0. 0. 0. 0. 0. 0. 0. 0. 0. 0. 0. 80. 15. 19.
EFF RAIN 0. J. 0. a. O . O. 0. 0. 0. 0. 0. 0. 0. 0. 0. 0. 0. 0. 0. 0. 0. 0. 0. 0
NEit Eiu zb. jo. 4'i. o2. lb. 03. [z. u. U. C. u. u. U. u. u. u. u. u. u. u. u. Du. i5. 9,.
AT FI ELD
IRP. PEO 26. 36. 48. 62. 76. 83. 72. 0. 0. 0. 0. 0. 0. 0.. 0. O. 0. 0. 0. 0. 0. 80. 15. 19.AT TURNOUTFIELIn EFF w***2
TOTALS (MM)CnNS USE - 438.EFF RAIN = 0.IRP REQO 518.
oQ W %4W z

ANNEX 9,Table 3
PAKISTAN I Page 1O
SALINITY CONTROL AND RECIAMATION PROJECT (SCARP) VI
Crop Water Requirements
pulse Rabi
JAN FEB MAR APR MAY JUN JUL AUG SEP OCT NOV DEC
1 2 3 4 5 6 7 8 9 10 11 12 13 14 15 16 17 18 19 20 21 22 23 24
EST RAIN O. 0. 0. 0. 0. 0. 0. 0. O. 0. 0. 0.
ETO 3h. 4J. 45. 53. 63. 74. 8e. 56. 1.6. 112. 113. 112. 1J7. 102. 98. 93. 88. 82. 74. 64. 53. 43. 36. 34.
CROP FACT 0.79 0.53 0.16 C.O0 0.01 3.00 3.00 0.00 0.00 0.00 0.00 0.00 0.00 0.00 0.00 0.00 3. )0 0.00 0.09 0.29 0.43 0.54 0.69 0.80
CONS US; 28. 21. 7. 0. O. 0. 0. 0. O. 0. 0. 0. 0. 0. 0. 0. 0. 0. 7. 18. 23. 23. 25. 27.
GROSS REQ 28. 21. 7. 0. 0. 0. O. O. 0. 0. 0. 0. 0. 0. 0. 0. 0. 0. 7. 18. 23. 23. 25. 27.
EFFRAIN 0. 0 . 0. 0. J. 3. 0. 0. 0. 0. 0. 0. 0. 0. 0. 0. 0. 0. 0. 0. 0. 0.
NET PFQ 28. 21. 7. 0. 0. 0. 0. 0. 0. 0. 0. 0. 0. 0. 0. 0. 0. 0. 7. 18. 23. 23. 25. 27.
AT FIELD
IRR. REQ 28. 21. 7. O. 0. 0. O. O. O. 0. .0. 0. 0. 0. 0. 0. 0. 0. 7. 18. 23. 23. 25. 27.
AT TUONOUTFIELD EFF ****
TCTALS (MM)
CONS USF = 17'.EFF RAIN = 0.IRR REO a 179.
0 Om~

ANNEX 9PAKI STAN Table 3
SALINITY CONTROL AND RECLAMTION PROJECT (SCARP) VI Pg .
Crop Water Requirements
Oilseed
JAN FEB MAR APR MAY JUN JUL AUG SEP OCT NOV DEC1 2 3 4 5 6 7 8 9 10 11 12 13 14 15 16 17 i8 19 20 21 22 23 24
EST PAIN 3. . 0. 0. 0. 0. 0. 0. 0. 0.0..
E Tf 36. 4 3. 4 5. 53. 63. 74. 86. 9f. 106. 112. 113. 112. 107. 132. 98. 93. 88. 82. 74. 64. 53. 43. 36. 34.
CROlP F-ACT 0.92 0.62 3.12 0.00 0.00 :).)) 0.00 0.00 0.0) 0.03 0.00 0-.)0 0.00 0.00 0.00 0.00O ). 00 0.04 0.11, 0.38 0.59 0.82 1.02 1.08CONS USE 33 . 25. 5. 0. 0. 0. 0. 0 . 0. 0. 0 . 0. 0. 0. 0. (0. 3. 4. 8. 24. 31. 36. 37. 36.LANnPRFP 0. 3. 0. 0. 0. 3. 0. 0. 0. 0. 3. 0. 0. 0. 0. 0. 10. 10. 50. 13. 0. 0. 0. 0.- - - - - - _- - - _. - - - - - - - - - - - - - - - - - - - - - - - - -
GROSS REG 33. 25. 5 . 0. 3. 0. 3. 0. 0. 0. 0. 0. 0 0. 0. 0. 10. 14. 58. 34. 31. 36. 37. 36.
el!F rRR A0. 3. 0 u. U. 4C. 0. 0. 0. 0. 0. 0. 0. 3. 0. 0. 0. 0. 0. 0.' 0. 0. 0. 0.
NET R~~~Q 33. 25. 5. 0.- 0. 0 0. .- 00. -- 0. 0 . 0. 0 . 0 0 4 8 4 1 6 7 6AT FIELD
VWP. PEG 3?. 25. 5. 0. 0. 0. 0. 3). 0. a. 0. 3. 0. 0. 0. 0.- 10. 14. 58. 34. 31. .36. 37. 36.AT TUPMOUTFIELD EFF IF*a**
TCTAkLS (MM)CONS USF a 239.EFF RAIN 2 0.IRA QEQ a 319.
OQ O
(m

PA), [ STAN ANNEX 9Table 3
SALINTTY CONTROL AND1 RECLAMATTON PROJECT (SCARP) VT Page 12
Crop Water Requiirements
FOD Rabi
JAN FEB MAR APR MAY JUN JUL AUG SEP OCT NOV DEC1 2 3 4 5 6 1 e 9 10 11 12 13 14 15 16 17 18 19 20 21 22 23 24
EST PAIN 0. 0. 0. 0. 3. 0. 0. 0. 0. 0. 0. 0.
ETO2 36. 43. 45. 53. 63. 7'i. 86. '6. 106. 112. 113. 112. 1 07. 102. 98. 93. 88. 82. 74. 64. 53. 43. 36. 34.
CROP FACT 0.71 3.a0 0.88 0.96 1.32 1.03 O.SE 0.86 0.58 0.18 0.00 3.00 0.00 0.00 0.00 0.00 0.00 0.00 0.08 0.25 0.41 0.54 0.64 0.69CCNS USE 26. 32. 43.9 51. 64. 77. 84. 83. 61. 23. 0. 13. 0. 0. 0. 0. 0. 0. 6. 16. 21. 23. 23. 23.LANrPRFP 0. J. 0. 0. 0. 0. 0. 0. 3). 0. 0. 0. 0. 0. 0. 0. 0. 20. 40. 20. 0. 0. 0. 0.
GROSS PEQ 26. 32. 40. 51. 64. 77. 84. 83. 61. 20. 0. 0. 0. 0. 0. 0. 0. 20. 46. 36. 21. 23. 23. 23.
EFF PAIN 0. 1. J. 0. 3. 0. 0. 0. 0. 0. 0. 0. 0. 0. 0. 0. 0. 0. 0. 0. 0. 0. 0. 0.
NE ~T R EQ 26-. -32. 40-. -51.- 64-. 771. -84-. -83. -6 1. 20-. 0. 0-. -0. 0.- 0. 0.- 0. -20.- 46-. -36.- 21-. -23. 2 3-. 23.AT FIELD
IRR. RFO 26. 32. 40. 51. 64. 17. 84. 83 . 61. 20. 0. 3. 0. 0. 0. 0. 0. 20. 46. 36. 21. 23. 23. 23.AT TOPNJO'TFIELn FrF ****T
TCTALS (MM)CONS USF = 652.EFF RAIN - 0.IPR REQ = 732.
I-.c
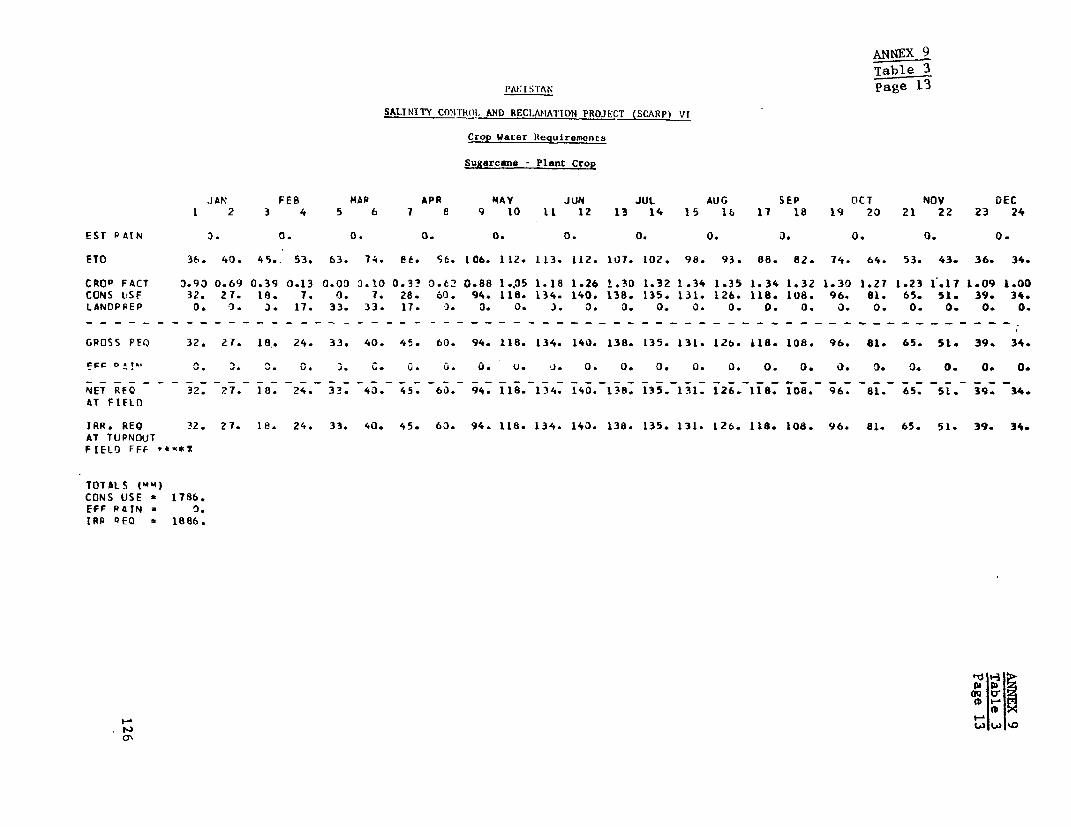
ANNEX 9Table 3
PAt STAN page 13
SALINITY CONlTRhOL AND RECIAMATION PROJECT (SCARP) VI
Crop Water Requirements
Sug4rcans - Plant Crop
JAN FEB MAR APR MAY JUN JUL AUG SEP OCT NOV DEC1 2 3 4 5 6 7 a 9 10 IL 12 13 14 15 1b 17 18 19 20 21 22 23 24
EST PAIN 3. 0. 0. 0. 0. 0. O. 0. a. 0. 0. 0.
ETC 38. 40. 45. 53. 63. 7.- et. 56. 1 08- 112. 113. 112. 107. 102. 98. 93. 88. 82- 74. 64. 53. 43. 36. 34.
CROP FACT 3.98 0.69 0.39 0.13 0.00 3.10 0.3? 0.62 0.88 1..05 1.18 1.26 1.30 1.32 1.34 1.35 1.34 1.32 1.30 1.27 1.23 1.17 1.09 1.00
CONS USF 32. 27. 18. 7. 0. 7. 28. 60. 94. 118- 134. 140. 138. 135. 131- 126. 118. 108. 96. 81. 65. 51. 39- 34-
LANDPFEP 0. O. J. 17. 33. 33. 17. 0. 0. 0. 3. 3. 0. 0. 0. 0. 0. 0. 0. 0. 0. 0. 0. 0.
GROSS PEO 32. 27. 18. 24. 33. 40. 45. 60. 94. 118. 134. 140. 138. 135. 131. 126. 118- 108. 96. 81. 65. 51. 39. 34.
0C. . . 3. i. u. G. u. U. 3. 0. 0. 0. 0. 0. 0. 0. 0. 0. 0. 0. 0. 0.
NET REO 32. 27. 18. 24. 33. 43. 45. 60. 94. Ii8. 134. 140. 138. 135. 131. 126_ 118. 108. 96. 81. 65. 51. 39. 34.
AT FIELD
IRR. REQ 32. 77. 18. 24. 33. 40. 45. 60. 94. 118- 134. 140. 138. 135- 131- 126. 118- 108. 96. 81. 65. 51. 39. 34.
AT TUPNOUTFIELO FFF **x*T
TOTALS (mm)CONS USE a 1786.EFF PAIN * O.IRP QEO = 1886.
014 IAi@iD

I'AKLSTAN Table 3Pa-ge 14
SALINITY CONTROL AND RECLAIATION PROJECT (SCARP) VI P 1
Crop Water Requirements -
SuAarcaaa - iatoon Crop
JAN FEB MAR APR MAY JUN JUL AUf, SEP OCT NOV DEC1 2 3 4 5 A 7 8 9 10 11 12 13 14 15 16 17 18 19 23 21 22 23 24
EST RAIN 0. 0. .0. 0. 0. Oo 0. 0. 0. J. 0.
ETO 36. 40. 45. 53. 63. 74. 8e. S6. 106. 112. 113. 112. 107. 102. 98. 93. 88. 82. 74. 64. 53. 43. 36. 34.
CROP FACT 0.03 0.10 0.33 3.62 0.89 1.05 1.18 1.26 1.33 1.32 1.34 1.35 1.34 1.32 1.30 1.27 1.23 1.17 1.09 1.00 0.90 0.69 0.39 0.13CONS USE 0. 4. 15. 33. 56. 7S. 101. 121. 138. 148. 152. 150. 143. 135. 127. 119. 108. 95. 80. 64. 47. 30. 14. 4.
GROSS REQ 0. 4. 15. 33. 56. 78. 101. 121. 138. 148. 152. 150. 143. 135. 127. 119. 108. 95. 80. 64. 47. 30. 14. 4.
EFF RAIN 0. 3). 0. 0. C. . C. 3. 0. 0. 0. 0. 0. 0. 0. 0. 0. 0. 0. 0. 0. 0. 0. 0.EFF~~~~~~~~~~~~~~~~~~~~~~~~~~~~~~~~~~~~~~~~~~~~~~~~~~~ IAI 0- O- 3- °- O-- i;
NET -FQ 0. 4. 15. 33. 56. 78. 101. 121. 138. 148. 152. 150. 143. 135. 17 108. 95. 80. 64. 47. 30. 14. 4.AT FIELD
IRP. REQ 0. 4. 15. 33. 56. 78. 101. 121. 138. 148. 152. 150. 143. 135. 127. 119. 108. 95. 80. 64. 47. 30. 14. 4.AT TUPriOuTFIELD EFF ****
TCTALS (MM)CONS USF = 1963.EFF RAIN = 0.IRR REG = 1961.
ID t0A 2L. tDa

ANMEX 9
PAVI STAN Table 3
SALINITTY CONTROL AND RECLAMATION PFiOJECT (SCARP) VIPae1
Crop Water Requiremnents
Other Perennial Crops
JARJ FEB MAP APR M4AY JUN JUL AUG SEP OCT NOV DECI ' 3 4 5 6 7 8 9 10 it 12 13 14 15 16 1.7 18 19 23 21 22 23 24
EST PAIN 0. 0. 0. 0. 0. 0. 0. 0. 0. 0. 0. 0.
ETC 36. 43. 45. 53. 63. 14. 8f. 9 6. 1 06. 1 12 . 1 13. 112. 107. 132. 98. 93. 88. 82. 74. 64. 53. 43. 36. 34.
CROP FACT 0.89 0.81 0.16 0.72 0.71 0.73 0.75 0.11 0.79 0.80 0.80 3.80 0.80 0.80 0.83 0.80 0.80 0.81 0.82 0.83 0.85 0.89 0.96 0.98CONS USE 32. 32. 35. 38. 45. 54. 64. 74. 84. 89. 91. 89. 85. 82. 78S. 75. 71. 66. 60. 53. 45. 39. 35. 33.
…
GRCSS REQ 32. 32. 35. 38. 45. 54. 64. 74. 84. 89. 91. 89. 85. 82. 78. 75. 71. 66. 60. 53. 45. 39. 35. 33.
EFF RAIN 0. 0. 0. 0. 0. 0. 0. 0. 0. 0.n ~ .. I0. 0. 3. 3. 0. G. 0
NET REQ 32. 32. 35. 38 45. 54. 6 4. -74. 84. 89. 91. 89. 5. 82. 78. 75. 7. 66. 60. 53. 45. 39. 3 5. 33.AT FIELO
IPP. REQ 32. 32 . 3 5. 38. 4 5. 54. 6 4. 14. 84. 89. 91. 89. 85. 82. 78. 75 . 71. 66. 60. 53. 45. 39. 35. 33.AT TUPNCt-ITFIELD FFF ****I
TOTALS (¶Mm)CONS USF = 1450.EFF RAIN = 0.[RR PEQ0 = 1 450.
00"'

ANNEX 9PAK S TA N Table 4
SALINITY CON'lROL END RECIJIA'TION PROJECT (SCARP) VII
SUMHMAhY TAi3L rIQRRIGAT19F1k PEOUIREME1 TS AT TtJr NOUT
J AN- FEB MAR APR MAY JUN JUL AIJO SFP ncT NnV DEC TOT1 2 3 4 5 6 7 a 9 10 11 12 13 14 15 16 17 18 19 23 21 22 23 24
RICF
J. . 1). J. . O. O . O. O. O. 2 5. 84. 1 31. 14Z-. 1 50. 159. 160. 148. 1 16. 42. O. O. Q. . 1156-
CCtTON0. J. D. O. O. O. J. O. O. 8. 50. 43. 55. 4 7. 57. 65. 7 8. 83- 8 3- 69- 52- O- O. O. 6BO.
MAI ZE KHAR0. O. O. J. ). . O. O. J. J . D. O. O. 20- 48. 45. 37. 47- 59- 60. 45. 31- 18. 6- 416.
MILLFTS
o. a. o. U. c. o. o. a. a. o. 40. saB. 41. 51. 66. 72. 57- 41. 17. 3. O- O- O. O. 443.FOD KHAR
0. 0. . J. O. 23. 2;. 35. 5C- 53. 64. 77. 82- 83. 63- 39- 18 Id O. O. O. O. O- O- O. 606.
WliEAT I32. 41. 51. 63. 7C. 6?. O. O. O. 3. O. O. O. O. O. O). O. O- 83. 25. 26. 26- 25. 27- 529.
WHEAT 23 3. 42. 52 . 63 . 7J. (62. O. O. O. 0. . C. O. O. O. 3. 3. O. O. 80. 21. 22. 23. 26. 493.
WHEAT 328B. 36. 47. 61. 76. 82. 72. 0. C. O. O. O. O- O- O. O. J. O. O. O- 80. 17- 18. 21. 538.
WHEAT 426. 36. 43. 62. 76. R13. 72. O. O. O. O, O. O. O. O. O. O. O. O. O- O. 80. 15. 19. 518.
PULSF PABI28. 21. 7- O- O. d. O. d. d. O. O. 8. O- O- O. O- J. O- 7. 18. 23. 23. 25. 27. 179.
01ILsFFn3 3. 25. 5. 0 . 3 . O. C. O. O . O . O. O- O- O- O. O- 10. 14. 58. 34. 31. 36. 37. 36. 319.
FOD PABI2h~. 3 2. 40. 51. 64. 77. 84 . 8'. 61. 2 0. aO. O. O. O. O . O. O. 20. 46- 36. 21. 23. 23. 23- 732-
SUJGAR CAI-IF
3 2. 27. 18. 24. 3 3. 4,). 45. 60. 94. 118. 134. 143. 138. 135. 131- 126. 118. 108. 96. 81. 65". 51. 39. 34- 1886.
RATonN
O3. 4. 15. 3'. 56. 78 . 101. 121. 1I8. 148. 152. 150. 143. 135. 127. 119. 108. 95. 80. 64. 47. 30. 14- 4- 1963-
OTHFQ PE-,
32. 32. 35. 38. 45. 5 4. 64. 74. 84. 89. 91- 89. 8 5. 82. 78. 75. 71. 66. 60. 53- 45. 39. 35- 33- 1450.
cl!~~~~~~~~~~~~~~~~~~~~~~~~~~~~~~~~~m >

ANNEX 9Table 5
PAKISTAN
SALINITY CONTROL AND RECLAMATION PROJECT (SCARP) VI
Cropping Patterns
Rice Cotton Maize Millets Kh Fod Wheat Pulses Oilseeds Fodder Cane Others
Unit 2 7 35 3 8 5 35 4 8 10 5 5Unit 3 5 30 1 5 5 40 2 6 8 10 2Unit 4 6 35 2 4 6 37 2 8 7 7 2Unit 5 2 30 3 6 8 3i 10 7 7 4
nDX
Q~~~~~~~~~~~~~~~~~~~~~~~~~~~~~~~~~~~~~~~~~~~~~~~~~~~~~~~~~~~~~~i

ANNEX 9PAKISTAN Table 6
SALINITY CONThOL. AND RECLANATION PROJEcr_ cscKP %qr
-wATEb i-EUjfkNEhTS Ay CANAL H::AD - Unit NO 2 137 560. HAI
(NIL M31
JaN tFR M4AR APR mAY JUN JUJL Au(- SEP OCT NL)v DEC TOT1 2 3 4 5 6 1 8 4 10 11 12 13 14 15 16 17 18 19 2.) 21 22 23 24
RAI N . . 0. 0. 3. 0. J.3 0. 0. 3. 0. 0.
R TCE0.0 0.0 0.o0.3. 0.') 0.0 C. C 0. J 0.0 0.0 2.4 8. 1 12.6 13. 6 14.4 15. 3 1 5.4 14. 2 11 .2 4.0 0.0 0.0 0.0 0. 0 1 11. 3
COTTON3.0 0.0 '3.0 0.3J 0. 3 0..) 0. 0 0.3 0.0 3.0 24.1 19.2 26. 3 22 .7 21.6 31. 5 3 7.6 40.0 39.8 33. 3 24.9 0. 2 0.1I 0.0 32 7.2
0.0 0.0 0.3 0.3 0.0 0.0 G.0 0.0 0.0 0.0 0.0 0.0 0.0 0.8 2.0 1.9 1.5 1.9 2.4 2.5 1.8 1.3 0.6 0. 2 17.2MILLFTS
3.0 0.0 O0.3 0.) 0.0 0.)- 0.0 0.0 0.0 0.) 4.4 6.3 4.5 5.6 7.3 7.9 6.3 4.6 1.9 0.0 0.0 0.0 0.0 0.0 48.7FOP KHAR
0.0 0.0 0.3 C. Z 0.0 1.4 1.7 2.4 3.4 3.4 4.4 5.3 5.7 5.7 4.3 2.7 1.3 0.0 0.0 0.0 0.0 0.0 0.0 0.0 41.7WHEAT 1
1.8 2.3 2.A 3.5 3 .9 3.4 0.0 0.3 0.3 0.0 0.0 3.3 3.3 0.0 0.0 0.0 3.0 0.0 4.4 1.4 1.4 1.4 1.4 1.5 29.1WHEAT 2
7.6 9.7 12.2 14.8 16.4 14.5 C.C 0.0 0.0 O.C 0.0 0.0 0.0 0.0 0.0 0.0 0.0 0.0 0.0 18.7 4.8 5.1 5.4 6.1 115.3WHEAT 3
3.4 4. 5 5.9 7. 6 9. 4 10.2 b. .4 0.0 03.0 0..)J 3. a3.0 J.3C 3.0 0.0 0). 0 0.0 0.0 0.0 0.0 9.9 2.1 2.2 2.6 66.7WHEAT 4
2.2 2.9 3.9 5.! 6.3 6.9 6.0 3.3 0.0 0.0 3.0 0.0 0.3 0.0 0.0 0.0 0.0 0.0 0.0 0.0 0.3 6.6 1.3 1.6 42.7PULSF PAP!
1.6 1.2 0.4 0. ) 3.0- 0.0 0.0 0.0 0.3 0 . ) 0.0 0.0 3.3 3.0 0.0 3.0 0.0 0.0 0.4 1.0 1.2 1.3 1.4 1.5 9.9OILSEED
.6 2.7 0.6 0.0 0.3 0.3 0.0 3.0 0.0 0.0 3.0 3.0 0.0 0.0 0.0 0.0 1.1 1.5 6.4 3.8 3.4 3.9 4.1 4.0 35.1'FOD kAdi
3.6 4.4 5.5 7.0 8.9 10.6 11.6 11.4 8.4 2.8 3.0 0.0 3.3t 0.0 0.0 0.0 0.0 2.3 6.3 5.0 2.9 3.2 3.2 3.2 100.7SUGAP CANF
1.1 0.9 0.'.~ 0.8 1.1 1.4 1.6 2. 1 3.2 4.1 4.6 4.8 4.8 4.6 4.5 4.3 4.1 3.7 3.3 2.6 2.2 1.7 1.4 1.2 .64. 9RAT CON
0.3 ). I13. 5 1.1 1.9 2. 7 3.5 4.2 4.7 5.1 5.2 5.2 4.9 4.6 4.4 4.1 3.7 3.3 2.8 2.2 1.6 1.0 0.5 0.1. 67.5CTHEP PE~;
'y 2.2 2.4 '.6 ?.I 3.7 4.4 5.1 5.8 6.1 6.2 6.1 5.9 5.6 5.4 5.1 4.9 4.6 4.2 3.7 3.1 2.1 2.4 2.3 99.7
CTAL 27. 31. 35. 43 51. 55 13. 25. 26. 2. 51. 55. 65. 63 70 7. 76. 76 8.7.5.3.2.24. 1178.
CANAL EfFFIrJNCy P**7

|ANNEX 9Table 7
PAKTSTAN
SALTNITY CONTROL ANID RECLIAMATION PROJECT (SCARP) VT
WATEI ReiQllKEMErTS AT CANAL HEAO - Uiht NO 3 4 15729J.HAIA
ItAI L I 1
JAN FfB MAO APF MAY J UN JUtL AUG SEP OCT NOY DEC TOT1 2 3 4 S 6 7 a S i J t1 12 13 14 15 16 17 18 19 20 21 22 23 24
RATN 0. O- 3- °- .0 .0 0 .0 . 0
R ICE
O.O O.0 O.O O.O J.O O.O O.O o.a o.o o.o z.0 6.6 13.3 Itl.l 11.8 1Z. 5 12 . 6 1.6 9.1 3.3 0.0 0.0 0.0 0. 0 90.9CCT T--1N
0.0 0.3 3.30 .3 0.3 0.3 0.0 0.0 0 .1 0.0 23-4.6 18.9 25.8 2 2.2 2 7. 0 30.8 36.9 39. 2 39. 0 32. 7 24.4 0.2 0.1 0.0 320.1MAFIZE KFAP
0.0 0.0 0.0 0.f) 0.0 0.) 0.0 0 . 0.0 3.0 0.0 0.0 3.J 0.3 0.8 0.7 3.6 0.7 0.9 0.9 0.7 0.5 0.3 0.1 6.'M ILLrTS
-0 0 0 . n -' - 0 -' > '. ". . ° .0 3 . 1 4., . 2 4. 3 . 25. o 4.> o . 13 0.0 O.J 0.0 0.0 0.0 34.8FOP KHAR
0.0 0.0 0.3 0.0 0.0 1.6 1.9 2 .7 3.s9 3.9 5.1 6.1 6.5 6.5 4.9 3.1 1-4 O.O O-O O-O O-O O-O O.O O-O 47.7
2.0 2.6 3.2 4.0 4.4 3.9 0.0 0.0 0.0' 0.0 0.0 0).0 0.0 0.0 0.0 0.0 0.0 0.0 5.0 1.5 1.6 1.7 1.6 1. 7 33.3WHE-AT 210.3 13.1 16.4 ?0. 0 22.0 19.5 0.0 0.0 0.0 0.0 0.0 3 .0 0.0 0.0 0.0 0.0 o.O0 0.0 0.0 25.2 6.5 6.8 7.2 8.2 1SS.I
WHFAT 3
4.4 5.7 7.4 9.7 11.9 I2.', 11.3 0 . 0.0 O .o 0-0 0-0 3.0 0-0 0-0 0.0 0.0 0.0 0.0 0-0 12.6 2.7 2.8 3.4 84.70FFAT 4
.s 3 .4 4.5 5.9 7.2 7.8 e.e a.o O.Q 0.0 0.0 0.0 0.0 0.0 0.0 0.0 0.0 0.0 0.0 0.0 0.0 7.5 1.4 1.e 48.9PULSE RABI
0.9 0 .7 0.2 J.O 0.0 O.j 3.0 0.0 0.0 0.0 0.0 0.0 0.0 0.0 0.0 0.0 J.0 0.0 0.2 0.6 0.7 0.7 0.8 o.a 5.6OILSFen
3.1 2. 3 0.5 0.0 C.0 C.0 0.0 0.0 0.0 0.0 0.0J 0.0 0.0 0.0 0.0 0.0 0.9 1.3 5.5 3.2 2.9 3.4 3.5 3.4 30.1FOE' PAR!
3.? 4.0 S.0 6.4 8.1 9.7 10.6 10.4 7 .7 2.6 0.0 0.0 0.0 0.0 0.0 0.0 J.0 2.S 5.8 4.5 2.7 2.9 2.9 2.9 92.1SUGAP CANE
'). 5 .2. 1.4 1.9 2.6 3.2 3 .6 4 .7 7 .4 9.3 lO.S i1.a 10.9 10.6 10.3 9.9 9.3 B.5 7.5 6.4 5.1 4.0 3.1 2.6 148.3A T wwf
3.) 3.3 1.2 2.6h 4.4 6.2 eq. J s.5 IJ.e 11.6 11.9 11.8 11.2 10.6 10.0 9. ' 8.5 7.5 6.3 5.0 3.7 2.4 1.1 0.3 154.4OTl4FQ P sr
1.0 1.0 1.1 1.2 1.4 1.7 2.0 2.-3 2.ti 2.8 2.9 2.8 2 .7 2.6 2.5 2.3 2.2 2.1 t.9 1.7 1.4 1.2 1.1 1.0 45.e1
TO^A ;33 3s. 41. s2. t2. 6E. 44. 3C. 32. 3 J. 59. h2i:-8. 2. 341i. 68. 72. 4 7 77. 83 S 2 4 6. 26. 1299.
rArlAl F FF Ir ! FPICY *vwt
.E~~~~~~~~~~~~~~~~~~~~~~~~~~~~~~~~~~~~~~~~~~~~~~~~~- @10

ANNEX 9Table 8
PLI I STAN
SALINTTY CONITROL AND RECLIAATION PROJECT (SCARH VI
hATFR PFOUIREMENTS AT CANAL HEAD - Unit NO 4 30835.HA)
IMIL M31
JAN Fr8 M AR APS MAY JUN JUL AUG SEP OCT NOV OEC TOT1 2 3 4 5 6 7 8 9 13 11 12 13 14 15 16 17 18 19 20 21 22 23 24
RAIN' 3. 0. 3. O. O. D. 0. 0. 3. 0. O. 0. 0.
RICE0.0 0. a3.3 0.0 3.0 0.0 0.0 0.0 0.0 0.0 0.5 1.6 2.4 2.6 2.8 2.9 3.0 2.7 2.1 0.8 0.0 0.0 0.0 0.0 Z1.4
COTTONO.0 0.0 0.0 0.0 0.0 0.0 0.0 0.0 0.0 0.0 5.4 4.3 5.9 5.1 6.2 7.1 8.4 9.0 8.9 7.5 5.6 0.1 0.0 0.0 73.3
MAIZ_ KH-AR0.0 0.0 0.0 C.J 0.1 0.3 0.0 0.3 0.0 0.0 3.0 0.0 J.: 0.1 0.3 0.3 0.2 0.3 0.4 0.4 0.3 0.2 0.1 0.0 2.6
M ILL ETS0.0 0.0 0.0 3.0 0.3 0.3 0.0 0.0 0.0 3.0 0.5 0.7 J.5 3.6 0.8 0.9 0.7 0.5 3.2 0.0 0.3 3.0 0.0 0.0 5.5
FOPt '-HAR0.0 0.0 0.0 0.0 0.0 0.4 C.5 0.6 0.s C.9 1.2 1.4 1.5 1.5 1.2 0.7 0.3 0.0 0.0 0.3 0.0 0.0 0.0 0.0 11.2
WHEA T
I
3.4 0.5 0.6 0.8 0.9 O.d 0.0 0.0 0.) 3.3 0.3 O 3.3 0.0 0.0 0.0 0.0 0.0 0.0 1.0 0.3 0.3 0.3 0.3 0.3 6.5WI4dAT 2
1.q 2.4 '.1 3.7 4.1 2.6 0.0 0.3 0.0 0.0 0.0 3.0 0.0 0.0 0.0 0.0 3.0 0.0 0.0 4.7 1.2 1.3 1.3 1.5 28.94IF AT 3
o.e l.o 1.3 1.7 ?.1 2.? 2.0 0.3 0.0 0.3 3.0 J.3 0.3 3.0 3.0 3.0 3.0 3.0 3.0 0.0 2.2 0.5 0.5 0.6 14.9WHEA4T 4
3.4 0.5 0.7 1.3 1.2 1.3 1.1 C.J C.3 3.0 0.0 0.0 3.0 0.0 0.0 0.0 0.0 0.0 0.0 0.0 0.0 1.2 0.2 0.3 8.0PUL SE R AFA1
0.2 0.1 0.0 0.0 0.0 0.3 0.0 0.3 3.3 0.0 3.0 3.0 J.0 J.0 0.0 0.0 J.0 0.0 3.0 0.1 3.1 0.1 0.2 0.2 1.1CIL SFEn
0.8 0.6 0.1 0.3 0.0 0.0 0.0 0.0 U.0 0.C 0.0 0.0 0.0 0.0 0.0 0.0 U.2 0.3 1.4 0.8 0.8 0.9 0.9 0.9 7.9FOnr ARI
0.6 0.7 0.9 1.1 1.4 1.7 1.8 1.S 1.3 0.4 0.0 0.0 0.0 0.0 0.0 3.0 0.0 0.4 1.0 0.6 0.5 0.5 0-5 0.5 15.8SUGAP CA'"r
0.3 ).3 0.' 0.3 J.4 0.4 0.5 0.6 1.3 1.3 1.4 1.5 1.5 1.5 1.4 1.4 1.3 1.2 1.0 0.9 0.7 0.5 0.4 0.4 20.4RATrCN
0.0 0.0 0.? 0.4 C.6 0.8 1.1 1.3 1.5 1.6 1.6 1.6 1.5 1.5 1.4 1.3 1.2 1.0 0.9 0.7 0.5 0.3 0.2 0.0 21.2
OTHEP Prp'0.2 3.2 '3.2 0.2 0.3 0.3 0.'4 C.' 0.5 0.6 3.6 0.6 ).5 3.5 0.5 0.5 0.4 0.4 0.4 0.3 0.3 0.2 0.2 0.2 8.9
T _ _ _ _ _ _ _ _ - - _ -_ - - _ _ _ _ _ _ _- __ _ _ _ _ _ _ -_ _ _ __-T - - - - -
TCTIA s. -.. 7. '7 . iI. 12. 1. '. 5. 5. 11. 12. 14. 13. 14. 15. 16. 16. 17. 17. 12. 6. S. 5. 248.
CA'JAl -Fr IC TrCy *--
(D 00LD~~~~~~~~~~~~~~~~~~~~~~~~~~~~~~~~~~~~~~~~~~~~~~~~~~~~~~~~~~~~~0 -

ANNEX 9Table 9
PAK I S AN
SALINITY CONTROL AND RECLAtATION PROJECT (SCARP) VI
whTEF PEQUIREMENTS AT CANAL HEAD - Unit NO 5 t 187450.HAI
IMIL M31
J A\4 FFB MAR APP MAY JUN JUL AUG SEP OCT NOV DEC TOT1 2 3 4 5 6 7 6 9 10 11 12 L3 14 15 16 17 18 19 '3 21 22 23 24
RAIN 0. O. 0. 0. 0. U. 0. 0. 0. O. 3. 0. 0.
P ICF0.0 o. 0.o0 0.0 0.0 0.0 C. 0 (.0 U.C 0.0 0.9 3.2 4.9 5.3 5.6 5.9 6.0 5.5 4.3 1.6 0.0 0.0 0.0 0.0 43.3
COTTON0.0 0.0 0.0 0. 3 0.0 0.3 0.0 0.0 0.0 0.3 28.1 22.5 33.7 26.5 32,2 36. 8 43.9 46.7 46.5 38.9 29.0 0.3 0.1 0.0 382.2
MAIZF KHAR0.0 0.0 0.0 0.0 0.0 0.3 0.0 3.0 0.0 0.0 0.0 0.0 0.0 1.1 2.7 2.5 2.1 2.6 3.3 3.4 2.5 1.8 1.0 0.3 23.4
MILL ETS3.0 3.0 0.) 0.0 0.0 3.) 0.0 0.C 0.0 0.0 4 4'i 7.7 1.; 5. xJ..j U.u 0.0 U.0 49.8
0.3 0.0 0.3 0.; G.0 3.)0 3.7 5.2 7.5 7.5 9.6 11.5 12.4 12.5 9.4 5.9 2.7 0.0 0.0 0.0 0.0 0.0 0.0 0.0 90.9WHEAT I
2.4 3.1 3. 8 4. 7 S.2 4.h 0.0 0.0 0.0 0.3 0.0 3.0 0.0 3.0 3.0 0.0 0.0 0.0 6.0 1.8 1.9 2.0 1.9 2.0 39.7WHEAT 2
13.4 13.2 16.7 ?0.2 22.3 IS.8 0.0 0.0 0.0 0.0 0.0 0.0 0.0 0.0 0. t) .0 0.0 0.0 0.0 25.5 6.5 6.9 7.3 8.3 157.2WHEAT 3
4.7 6.1 8.) 10.4 12.8 1?.P 12.1 C.C 0.0 0.0 J.0 0.0 J.) 0.0 0.0 3.0 0.0 0.0 0.0 0.0 13.5 2.9 3.0 3.6 90.8WI-EAT 4
3.0 4.0 5.3 7.0 8.5 9.4 E.1 0.0 O.C Q.0 0.0 0.0 0.0 0.0 0.0 0.0 3.0 0.0 0.0 0.0 0.0 '-.0 1.7 2.2 58.2PULSE RA8PI
1.1 0.8 3.3 0.0 3.0 0.3 0.0 0.0 0.0 0.3 0.J 3.0 3.0 3.0 3.0 3.0 0.0 0.0 0.2 0.7 0.8 0.9 0.9 1.0 6.7
OILSFrn6.2 4.6 1.0 u.0 0.0 C.0 0.0 0.0 0.0 0.0 0.0 0.0 0.0 0.0 0.0 0.0 1.9 2.6 10.8 6.4 5.8 6.7 6.9 6.8 59.7
FOD PABI3.5 4.2 5.2 6. 7 8.4 10.1 11.0 10.- 8.1 2.7 0.0 0.0 3.0 0.0 3.0 0.0 0.0 2.6 6.0 4.7 2.8 3.1 3.0 3.0 96.0
SUGAR CANE?.1 1.P 1.? 1.6 '.1 2.6 .3 3 .9 6.1 7.7 8.8 9.2 9.1 8.8 8.6 8.2 7.7 7.1 6.3 5.3 4.2 3.3 2.6 2.2 123.8
Q aTn'5N
D.0 0.3 1.) 2.2 3.7 5.1 L.6 6.C 9.0 S.7 10.0 9.8 9.4 8.9 8.4 7.8 7.1 6.2 5.3 4.2 3.1 2.0 0.9 0.3 128.8OTHER Pr.
2.4 2.4 z.6 2.9 3.4 4.1 4.P c.E e.3 6.7 6.8 6.7 h.4 6.1 5.9 5.6 1.3 5.0 4.5 4.0 3.3 2.9 2.6 2.5 108.7
TCTAL '6. 4D. 45. 't. h7. 7 . 49. 34. '7. '4. 6S. 69. 77. 75. 80. 81. 83. 83. 95. 97. 74. 42. 32. 32. 1459.
(ANAL EFrIlrNIY *..Y
nixLa @ \0

ANNEX 9PANISTAN Table 10
SALINITY CONTROL AND RECLAMATION PROJECT (SCARP) VI
TOTAL PROJECT WATER REQUIREMENTS AT CANAL HEAD
(tIL M31
JAN FFB MAR APP MAY JU,IA JUL AUG SEP OCT NOV OEC TOT1 2 3 4 5 6 7 8 9 10 11 12 13 14 15 16 17 18 19 23 21 22 23 24
RAIN 0. .. 0. 0. 0. 0. 0. 0. 3. 0. ). 0. 0.
R ICf0.0 0.0 0.0 0.0 0.0 0.0 0.0 O.G 0.0 0.0 5.8 19.4 30.3 32.7 34.5 36.6 37.0 34.1 26.8 9.7 0.0 0.0 0.0 0.0 266.9
CCTT N3.0 0.0 3.3 0.0 0.0 O.' 0.0 0.0 0.0 0.0 81.2 64.9 88.7 76.4 92.9106.1126.8134.7134.2112.4 83.8 0.8 0.4 0.01103.4
MAIZE KI-AR. 3 0.0 0.3 0.0 Z.0 0.3 0.0 3.0 3.0 0.0 0.0 0.0 3.3 2.4 5.8 5.4 4.4 5.6 7.1 7.1 5.3 3.7 2.2 0.7 49.6
MILLETS0.3 3.3 0.0 3.0 J.0 0.) 0.0 0.0 0.0 0.0 12.5 18.0 12.8 16.1 20.7 22.5 18.0 13.0 5.3 0.0 0.0 0.0 0.0 0.0 138.8
FOO KHAR3.0 0.0 0.. 0.0 0.0 6.3 7.8 10.9 15.7 15.8 20.3 24.3 26.0 26.2 19.8 12.4 5.8 0.0 0.0 0.0 0.0 0.0 0.0 0.0 101.4
WFEAT 16.6 8.5 J1.5 12.9 14.4 12.7 0.0 0.0 0.3 0.0 3.3 3.0 0.0 0.0 0.0 0.0 3.0 0.0 16.4 5.1 5.3 5.4 5.2 5.6 108.6
wAEAT 230.2 3e.5 48.4 58.8 64.8 57.4 3.0 0.0 0.0 0.0 0.0 0.0 o.0 0.0 0.0 0.0 0.0 0.0 0.0 74.1 19.0 20.1 21.2 24.1 456.5
WiEAT 313.3 17.3 22.6 2q.3 36.2 39.2 34.2 C.C C.J 0.0 0.3 0.0 3.0 0.0 0.0 0.0 0.0 0.0 0.0 0.0 38.2 8.1 8.6 10.2 257.1
WHEAT 48.1 10.8 14.5 19.0 23.1 25.3 22.1 0.0 0.0 0.0 0.0 0.0 3.0 0.0 0.0 0.0 0.0 0.0 ).O 0.0 0.0 24.4 4.7 5.9 157.8
PULSE RABI3.7 2.7 0.9 0.0 '.0 0.3 0.0 0.0 0.0 0.0 0.0 3.0 0.3 0.0 0.0 0.0 0.0 0.0 0.9 2.4 2.9 3.1 3.2 3.5 23.3
OILSEFn13.7 10.3 2.3 0.0 0.0 0.0 0.o 0.0 0.0 0.0 0.0 0.0 J.0 0.0 0.0 0.0 4.2 5.7 24.1 14.3 12.9 14.9 15.4 15.2 132.7
FOn RA9111.0 13.3 16.6 21.2 26.8 31.9 35.0 34.' 25.5 e.5 0.0 0.0 0.0 0.0 0.0 0.0 0.0 8.3 19.1 15.0 8.9 9.7 9.6 9.6 304.6
SUGAP CANF6.1 5.2 3.4 4.5 6.3 7.7 8.6 11.4 17.8 22.3 25.3 26.6 26.2 25.6 24.9 23.8 22.4 20.4 18.1 15.4 12.3 9.6 7.5 6.4 357.3
PATrON0.0 3.7 2.8 6.3 13.6 14.8 19.2 23.3 26.1 28.0 28.7 28.4 27.0 25.6 24.1 22.5 20.5 18.0 15.2 12.1 9.0 5.7 2.7 0.8 371.8
CTHEP PER5. P S.P 6.3 L. 8 1.2 9.i 11.7 1?.5 15.3 16.2 16.4 16.2 15.5 14.8 14.2 13.6 12.9 12.0 10.9 9.7 8.1 7.0 6.3 5.9 263.0
TCTAL ')8. 113. 12R. 159. 1S3. 235. 138. 93. 103. Sl. 190. 198. 226. 220. 237. 243. 252. 252. 278. 277. 206. 112. 87. 88. 4183.
tn C)0

ANIE 9Table 11
PAKISTAN
SAiLINITY CONTROL AND RECLAMATION PROJEGT (SCARP) VI
W4ter Requirements per Planning Unit(000 ac-ft)
Unit II - Ugit III Unit IV Unit V Total Project
4/ 1/3/ 4/ 2/ 4/ 4/ 3/ 4/At Module At Diversion At Module At Diversion At Modulrsion At Msion At Module At Divermion At Module At Diversion
April 8 28.9 44.5 34.7 53.4 5.8 8.9 39.4 51.2 105 8 156 0
May 9 30.1 46.3 37.0 56.9 5.8 8.9 42.8 56.4 115 7 168 510 25.5 39.2 34.7 53.4 5.8 8.9 39.4 51.2 105 4 152.7
Junie 11 59.0 90.8 68.3 105.1 12.7 19.5 79.9 113.5 219 9 408 812 63.7 98.0 71,8 110.5 13.9 21.4 79.9 113.5 229 3 343.4
July 13 75.3 96.9 82.2 126.5 16.2 24.9 89.1 127.7 262.8 376.014 72.9 90.2 78.7 121.1 15.0 23.1 86.8 124.1 253.4 358.5
August 15 81.0 94.6 83.4 128.3 16.2 24.9 92.6 133.1 273.2 380.916 84.5 83.6 85.7 131.9 17.4 26.8 93.8 134.9 281.4 377.2
September 17 88.0 90.4 89.1 137.1 18.5 28.5 96.1 138.4 291.7 395.218 88.0 86.9 89.1 137.1 18.5 28.5 96.1 138.4 291.7 390.9
October 19 96.1 87.8 96.1 147.8 19.7 30.3 110.0 159.8 321.9 425.7
- shar-l /Y.uU 949./ o)0.8 i,309., 165.5 254.6 945.9 1,342.2 2,752.2 3,935.8
October 20 90.3 - 98.4 - 19.7 30.3 112.3 163.4 320.7 193.7
November 21 66.0 - 71.8 - 13.9 21.4 85.7 122.4 237.4 143.822 35.9 - 39.4 - 6.9 10.6 48.6 65.4 130.8 76.0
December 23 27.8 - 30.1 - 5.8 8.9 37.0 47.5 100.7 56.424 27.8 - 30.1 - 5.8 8.9 37.1 47.7 100.8 56.6
January 1 31.3 - 34.7 - 6.9 10.6 41.8 54.9 114.7 65.52 35.9 - 40.5 - 6.9 10.6 46.3 61.8 129.6 72.4
February 3 40.5 - 47.5 - 8.1 12.5 52.1 70.8 148.2 83.34 49.8 - 60.2 - 10.4 16.0 64.8 90.3 185.2 106.3
March 5 59.0 - 71.8 - 12.7 19.5 77.6 110.0 221.1 129.56 63.7 - 76.4 - 13.9 21.4 84.5 120.6 238.5 142.0
April 7 44.0 - 50.9 . 8.1 12.5 56.7 77.8 159.7 90.3
Total Rabi 572.0 NIL 651.8 NIL 119.1 183.2 744.5 1,032.6 2,087.4 1,215.8
Total 1,362.0 949.2 1,502.6 1,309.1 284.6 437.80 1,690.4 2,374.8 4,839 5,151.6
Allowing for pumpage by irrigation wells in unit, and conveyance losses between barrage and module . (65% efficiency)
2/No surface supplies provided in rabi.
Allowing for water exports from Unit II. (757. efficiency)
Based on crop vater requirements and allowing for watercourse and field losses. (70% efficiency)
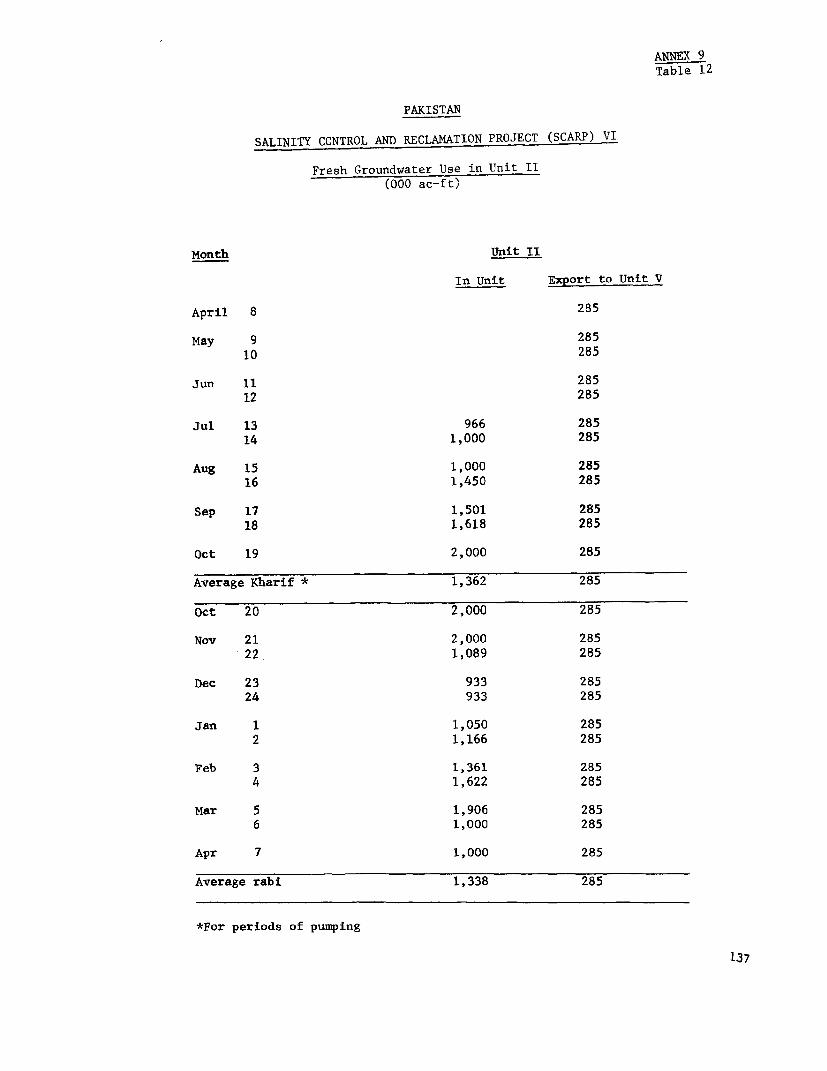
ANNEX 9Table 12
PAKISTAN
SALINITY CONTROL AND RECLAMATION PROJECT (SCARP) VI
Fresh Groundwater Use in Unit II(000 ac-ft)
Month unit II
In Unit Export to Unit V
April 8 2B5
May 9 28510 285
Jun 11 28512 285
Jul 13 966 28514 1,000 285
Aug 15 1,000 28516 1,450 285
Sep 17 1,501 28518 1,618 285
Oct 19 2,000 285
Average Kharif * 1,362 285
Oct 20 2,000 285
Nov 21 2,000 28522. 1,089 285
Dec 23 933 28524 933 285
Jan 1 1,050 2852 1,166 285
Feb 3 1,361 2854 1,622 285
Mar 5 1,906 2856 1,000 285
Apr 7 1,000 285
Average rabi 1,338 285
*For periods of pumping
137

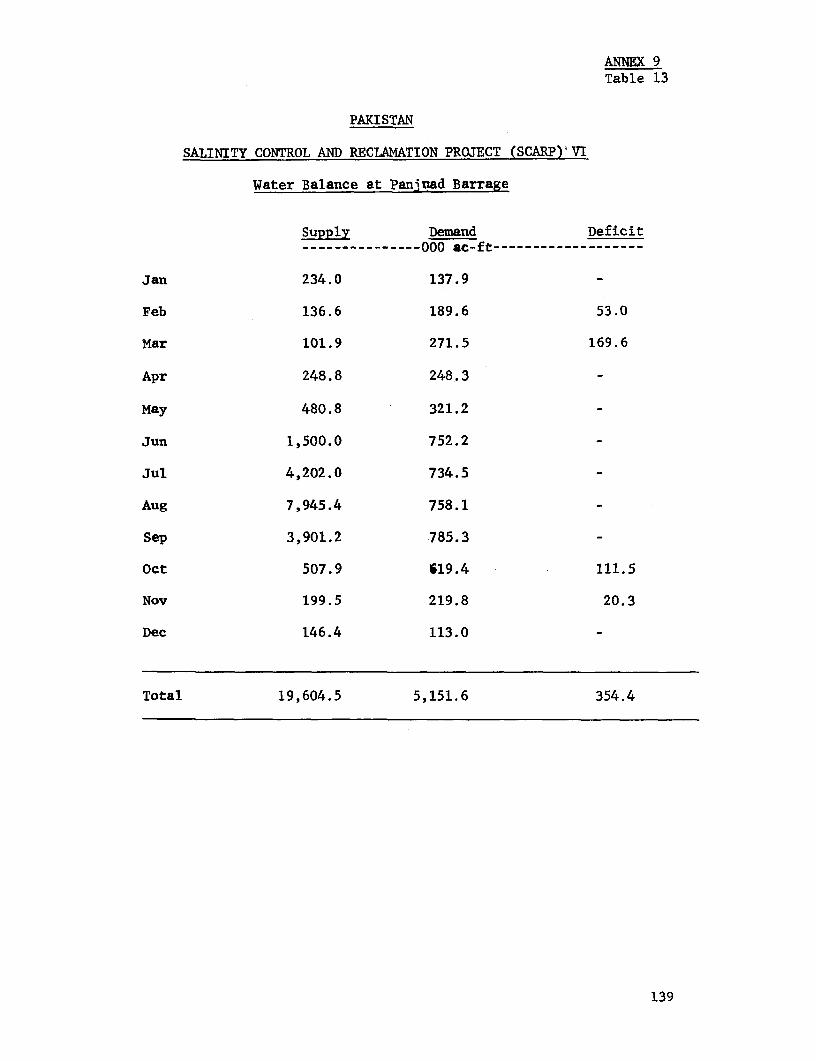
ANNEX 9Table 13
PAKISTAN
SALINITY CONTROL AND RECLAMATION PROJECT (SCARP)'VI
Water Balance at Paninad Barrage
Supply Demand Deficit---------------000 ac-ft-----------
Jan 234.0 137.9 -
Feb 136.6 189.6 53.0
Mar 101.9 271.5 169.6
Apr 248.8 248.3
May 480.8 321.2
Jun 1,500.0 752.2
Jul 4,202.0 734.5
Aug 7,945.4 758.1
Sep 3,901.2 785.3
Oct 507.9 619.4 111.5
Nov 199.5 219.8 20.3
Dec 146.4 113.0
Total 19,604.5 5,151.6 354.4
139

table 14
PAKI STAN
SALINITY CONT)ZIROL AND RECLAMATION PROJECT (SCARP) VI
Analysis of Canal Water Samples
.~~~~~~~~Ca+ Na Co, HCO C1 SO Total Total ECxl 0 pH SAR
lig m3 Cations Salts at 250Cmeq/1 Anions ppm.
Panjnad Barrage 2.06 0.26 - 1.65 0.41. 0.26 2.32 145 226 7.7 0.25
CI

ANNEX 9Table 15
PAKISTAN
SALINITY CONTROL AND RECLAMATION PROJECT (SCARP) VI
Groundwater Quality
Quality/Area UNIT II UNIT III
EC x 106 No. of Percent No. of Percent@ 25 C SAR Wells of Wells Wells of Wells
<1400 410 633 93.8 436 96.01400
-2500 >15 34 5.0 12 2.72500
-3200 >20 4 0.6 2 0.4
>3200 >25 4 0.6 4 0.9
Total 675 100.0 454 100.0
*Most of the SAR values are less than 5.
I>!

ANNEX 10PAKISTAN
SALINITY CONTROL AND RECLAMATION PROJECT (SCARP) VIIMPLEMENTATION SCHEDULE
SUBJECT 1978 1979 1980 1981 1982 1983
PROJECT PLAN
CONTRACT DOCUMENTS _ _ -I _ _ -I _ _ - - -_
FGW WELLS UNIT II
FGW WELLS UNIT III
SGW WELLS UNIT V
ELECTRIFICATION
DRAINS/EVAP. PONDS -
REMODELING CANALS
UNIT ll
UNIT III
UNIT IV
UNIT V
World Bank-17205N)~~~~~~~~~~~~~~~~~~~~~~~~~~~~~~~~~~~~ a-
0

PAKISTAN
SALINITY CONTROL & RECLAMATION PROJECT (SCARP) VI
Estimated Schedule of Expenditures( R. Million)
Total 1978 1979 1980 _ _ 1981 1982 19b3 _
Local Foresgn Local Foreign Local Foreign Local F Local Foreign Local Foreign Local Foreign
I. Land Acquisition 19.9 - 0.4 - 4.5 - 4.5 - 4 5 - 4 5 - 1 5 -Physical Contingency 2.0 - - - 0.4 - 0.4 - 0 5 - 0.5 - 0 2 -
Expected Price Increases 7.8 - - - 0.9 - 4 - 1.9 - 2 5 - 1.1 -Subtotal 29.7 - 0.4 - 5.8 - 6.3 - 6 9 - 7 5 - 2,8 -
II. Civil WorksCanal Remodelling 166.5 13.5 8.0 1.0 35.8 2.6 35.8 2.8 35 8 2 8 35 8 2 8 15-3 1.3Unit II Tubewells & Drains 7K.4 48.3 5.2 3.3 29.7 18.0 29.7 18 0 12.8 9.0 - - - -Unit V Tubewells 22.5 36.5 - - - - - - 5 9 9.1 10.7 18 3 5.9 9.1
Electrification Works 164.6 9.3 6.6 1.3 39.5 2.0 39.5 2.0 39.5 2.0 39.5 2 0 - -Drainage Works 139.4 27.2 - - 23.3 5.8 46 4 5.8 46 4 12 4 23 3 3.2
Subtotal 570.4 134.8 19.8 5.6 105.0 22.8 128.3 28.6 140.5 28.7 131.4 35.5 44 5 13.6Physical Contingency 83.2 20.2 2.8 0.8 15.2 3.4 18.6 4.3 20.8 4 3 19.4 5 3 6 4 2.0Expected Price Increases 230.7 49.0 1.9 0.5 22.0 4.2 40.0 8.0 62.1 11.0 74 4 17 1 30 3 8.2
Subtotal 884.3 204.0 24.5 7.0 142.2 30.4 187.0 40.9 223.3 44 0 226.2 57.9 82.1 23 8
III. On-Farm InvestmentsUnit III Tubewells 41.4 19,0 3.9 1.5 7.5 3.5 7.5 3.5 7.5 3.5 7.5 3 5 7 5 3.5Land Levelling 85.0 15.0 - - 17.0 3.0 17.0 3.0 17.0 3.0 17.0 3 0 17.0 3 0Gypsum 36.0 4.0 - - - - - - 12.0 1.3 12.0 1.4 12 0 1 3
Subtotal 162.4 38.0 3.9 1.5 24.5 6.5 24.5 6 5 36 5 7.8 36.5 7 9 36 5 7 8Physical Contingency 16.2 3.8 0.4 0.1 2.4 0.7 2.4 0.7 3.6 0 8 3.6 0.8 3 6 018Expected Price Increases 73.7 13.8 0.5 0.2 5.3 1.1 7.5 1,7 15.6 2.9 20.1 3.5 24.9 4.3
Subtotal 252.3 55.6 4.8 1.8 32.2 8.3 34.4 8.9 55 7 11.5 602 122 650 129
IV. Equipment & VehiclesCanal Remodelling Equipment 12.5 32.0 12.5 32.0 - - - - - - - - - -
Electrical Components 24.4 62.3 0.4 4.3 6.0 14.5 3 0 14 5 e'.o 14 5 6.0 14.5 - -Transport, Levelling eqpt.,
Computer/Communications,
Spares & Miscellaneous 4.9 17.2 1.5 5.2 2.0 7.8 1.4 4.2 - - - - - -
Subtotal 41.8 111.5 14,4 41.5 8.0 21 3 7.4 18.7 6.0 14 5 6.0 145 -Physical Contingency 2.0 9.4 0.8 3.6 0.3 2.5 0.3 1.5 0.3 1.4 0 3 1.4 -Expected Price Increases 5.6 24.1 0.8 3.6 0.8 3.8 1.0 4 8 1 3 5.2 1 7 6.7 - _
Subtotal 49.4 145.0 !{7O 48.7 9.1 27.6 8.7 25.0 7.6 21.1 8 0 226 - -
V. Consultants 5.0 44..8 1.5 17.9 1.5 17.9 0.8 4 0 0,4 3 0 0.4 2.0 0 4 2 0Contingency 0.5 2.7 0.1 0.8 0.2 0.8 0,1 0.4 - 0.3 - 0.2 - 0.2Expected Price Increases 1.2 6.3 0.1 0.7 0.3 1.4 0.3 1.1 0.2 1.1 0.2 0.9 0 2 1 1
Subtotal 6.7 55.8 1.7 19.4 2.0 20.1 1.2 5.5 0 6 4.4 0.6 3.1 0.6 3 3
TOTAL 1,222.4 460.4 47.4 76.9 191.3 86.4 237.6 80.3 294.1 81.0 302.5 95.8 149.5 40.0
7
Note Assumed annual rates of inflation are:Local . Foreign_
1978 9 81979 9 7.51980 orwards 8 7

ANNEX 11Table 2
PAKISTAN
SALINITY CONTROL AND RECLAMATION PROJECT (SCARP) VI
Proposed Credit Allocation
Amount Allocated % of Expenditure To Be(US $ M Equivalent) Financed
Category Total IDA UK KFW IDA UK KFW
Civil Works
Canal Remodelling )
Unit II Tubewells & Drains ) 45.0 100%
of foreignUnit V Tubewells ) 50%
of local costsElectrification Works o
Drainage Works 7.5 100%of foreign,
30%of local costs
On-Farm Investments
Unit III Tubewells ) 50%) 8.5 of advances
Land Levelling ) by Banks
Gypsum 2.0 50%of local costs
Equipment and Vehicles
Canal Remodelling Equipment 3.5 100%of foreigncosts
Electrical Components 7.9 100%of foreign
costs
Transport, Levelling )Eqpt., Computer 2.0 100% ofCommunications, Spares foreign costsand Misc. )
Consultants 6.0 100%
Unallocated 8.5 2.0 0.4
TOTAL 70.0 15.0 8.3
144

ANNEX 11Table 3
PAKISTAN
SALINITY CONTROL AND RECLAMATION PROJECT (SCARP) VI
Schedule of Credit Disbursements(US$M Equivalent)
IDA Fiscal Year Accumulatedand Semester Disbursements Disbursements
1978
1st .5 .52nd 1.5 2.0
1979
1st 5.0 7.02nd 5.5 12.5
1980
1st 6.5 19.02nd 6.5 25.5
1981
Ist 8.0 33.52nd 8.0 41.5
1982
1st 8.5 50.02nd 5.0 55.0
1983
1st 5.0 60.02nd 5.0 65.0
1984
1st 5.0 70.0
145

ANNEX 12Page I
PAKISTAN
SALINITY CONTROL AND RFC M^ATT)N PROJECT (SCARP) VI
Organization and Management
General
1. The proposed organization chart at the project level is shown inFigure 1. The officer in charg.Ž would be the Project Director, who would beof Chief Engineer rank. He would control five technical sections, each headedby an officer of Superintending Engineer rank or equivalent. The sections,and their subdivisions, would b] as follows:
(a) Irrigation: with sub3ections in charge of canal remodel-ing and new watercourse design, the siting and design oftubewells in Unit II; design of tubewells in Unit V, de-sign and advice to farmers on private wells in Unit III.
(b) Drainage: with subse:tions in charge of siting of salinedrainage wells and ap urtenant works to connect them withthe trunk drainage sy ;tem; design and construction super-vision of the evapora-ion ponds and pumping stations;
(c) Electrification: witl subsections for the power lines;and substations and connections of all public wells andpumping stations. Tho section would also assist withelectrification of groups of private wells in Unit III.
(d) Mechanical: concerne&i with maintenance and all repairwork of public well equipment and the pumping stations;the maintenance of al: project vehicles and to ensureproper inventory control and ordering of spare parts.
(e) Agriculture and Monit(ring would be headed by an agri-cultural economist wilh subsections to provide WAPDA'sCentral Monitoring Orianization with data to report onprogress. He and his staff would maintain liaison withagricultural extensioiT and research, and the agriculturalengineering service oT' progress with land leveling,applications for and :nstallation of private wells andprogress on advising larmers how to exploit projectbenefits; with the paiticipating CBs on how loan appli-cations for wells are encouraged, processed and the workexecuted.
146

ANNEX 12Page 2
The electrification subdivision would report to the Superintending Engineer,Power Wing, WAPDA, based in Rahimyar Khan but would be expected to maintainclose liaison with the Project Director on the phasing and progress of hiswork.
The Implementation Period
2. During project implementation, the PD and all his staff would beWAPDA officials, even though, for the sake of continuity, it would be bene-ficial if many could be seconded from GOPunjab line departments and continuein their post after GOPunjab takes over the project. The PD, a substantiveChief Engineer, would report to the General Manager, Northern Zone, and wouldalso have frequent technical contacts with the Project Director (Planning).
The Post-Implementation Period
3. After project completion and at least one year's successful opera-tion, the operation of the project, in accordance with accepted GOP procedures,would be handed over to GOPunjab's Irrigation Department. The PD would thenbe an Additional Chief Engineer, reporting to the Secretary for IrrigationGOPunjab through the Chief Engineer, Bahawalpur Irrigation Circle. The Agri-cultural Officer would be seconded from the Department of Agriculture. Matterspertaining to the supply and distribution of electric power to project unitswould become the routine duty of WAPDA's organization based in Rahimyar Khan(Figure 2).
The Project Committees
4. There would be two coordinating committees: a Project CoordinationCommittee in Rahimyar Khan, and a Project Steering Committee in Lahore.
(a) The Project Coordination Committee would be headed bythe Deputy Commissioner of the district and the PDwould be its executive officer. Members would be theChief Engineer, Irrigation, the Director of Agriculture,and the district Superintending Engineer for WAPDA'spower wing. The farming community would be representedby one or two leading farmers from each of the projectunits. The Unit III representative would be selectedfrom tubewell owners.
The CBs, participating in the credit scheme for wells, land leveling andreclamation, would also be represented. The committee would have powers toco-opt anybody who they consider would help their deliberations. They wouldmeet, during project implementation, at least six times a year, to be advisedof progress and to be able to offer advice on overcoming problems other thantechnical in nature. After the project is completed, fewer meetings maysuffice.
147

ANNEX 12Page 3
(b) The Project Steering Committee would be chaired by theAdditional Chief Secretary, Planning and Development.Members would be the Secretary for Agriculture, Secretaryfor Irrigation and the Divisional Commissioner for BahawalpurDivision. GOP would be represented by WAPDA's GM (NZ) andthe GM Power Wing. The CBs would be represented by oneor more of the General Managers of the participatingcommercial banks. All rmembers may be accompanied bytheir field officers and the Committee as such may co-opt additional members.
November 1977
148

PAKISTAN
SALINITY CONTROL AND RECLAMATION PROJECT (SCARP) VIOrganization Chart; - Project Implementation
GENERAL MANAGER - | STEERING__(NZ) 1 COMMITTEE
p
FINANCE PROJECT - - …- - - - PAND PROJECTORADMINISTRATION DIRECTOR
_~~ WAP DAPOWER WING
AGRICULTUREIRRIGATION DRAINAGE MECHANICAL AND ELECTRICAL
WORKSHOPS MONITORING
%D
World Bank-17246

PAKISTANSALINITY CONTROL AND RECLAMATION PROJECT (SCARP) VI
Organization Chart; - Post-Implementation
| SECRETARY FOR IRRIGATION l | STEERINGG.O. PUNJAB _ _ _ _ _ _ _ _ _ _ _ COMMITTEE
l~~~~~~~~~~~~~~~~~~~~~~~~~~~~~~~~CHIEF ENGINEER, IRRIGATION l
BAHAWALPUR l
l~~~~~~~~~~~~~~~~~~~~~~~~~~~~~~~lFHUJLL. I rriu.itiu
DIRECTOR COMMITTEE
I WAPDA
POWERWING
AGR ICULTUREMECHANICAL ADEETIA
IRRIGATION DRAINAGE WORKSHOPS A ELECTMONITORING
World Bank-17245
0

ANNEX 13Page 1
PAKISTAN
SALINITY CONTROL AND RECLAMATION PROJECT (SCARP) VI
Agricultural Supporting Services
A. Extension
I. The Present Situation
Organization
1. The agricultural extension service is built up according to adminis-trative boundaries, the same as other departments. One Field Assistant (FA)is posted to each Union Council, - the smallest administrative unit of the1960s, now existing mainly as units of internal security and agricultural de-velopment. There are 84 Union Councils in the canal irrigated parts ofRahimyar Khan district.
2. The Union Councils are grouped into four tehsils, with 18 to 24Union Councils in each. At each tehsil headquarters there are four Agricul-tural Officers (AO) who report to the Extra Assistant Director of Agriculture(EADA) stationed in Rahimyar Khan.
3. The EADA is assisted by technical and administrative staff officers.His Assistant Plant Protection Officer (APPO) acts as a Subject MatterSpecialist, is actively involved in training programs for the AOs and FAs andcontrols, through them, 147 special skilled laborers (beldars) attached tothe FAs. The beldars administer the pesticide stores, do minor repair andmaintenance work on the sprayers, demonstrate the use of equipment and pesti-cides and supervise spraying operations by the farmers. There is an AO(Technical) who is an agronomist and supports the tehsil AOs on all agronomicmatters relating to the more common crops.
4. The Assistant Statistical Officer (ASO) is responsible for compil-ing, bi-annually, the crop and other statistics for the district. Aided byfour statistical investigators in the tehsils and 19 reporting FAs, hecollects crop information three times a season, and other data, like thenumber of tubewells and tractors and implements annually. Crop informationis recorded in statistically selected sample villages.
5. The EADA also administers a Cotton Maximization Scheme, underwhich a fifth AO is posted to each tehsil. The job descriptions forspecial cotton staff and the regular extension staff are the same. Theyare placed so as to enable the geographic area of each staff member to bemade smaller, thereby aiming at increasing their effectiveness.
151

ANNEX 13Page 2
6. The Agricultural EngLneering Unit is a service organization provid-ing facilities and equipment for coarse land leveling with bulldozers (Annex5), and for drilling tubewells. It administers the tubewell subsidy schemein consultation with the Deputy Commissioner, the District and the TehsilCouncils. Staff consists of bulldozer drivers and mechanics, supervisorystaff for the land leveling work and supervisors who train workers operatingthe tubewell drilling rigs (foc which labor is provided by the farmers).The organization sells well casings and, occasionally, engines.
7. Market Control. The main markets are managed by an AssistantDirector (Economics and Marketing). His staff record movement of goodsthrough the markets and publisi every week the prices of the major tradedcommodities.
8. The EADA reports to a Deputy Director of Agriculture (DDA) inBahawalpur, who is in charge of the entire division. The Agricultural Engi-neer reports to a Deputy Director of Agricultural Engineering, the AssistantDirector (Economics and Marketing) to a DDA (Economics and Marketing) bothin Bahawalpur. The Deputy Directors report to their respective Directors ofAgriculture (DA) (Extension) and DA (Economics and Marketing) based in Lahore,and the Director of Agricultural Engineering in Lyallpur. This latter alsodirects the Precision Land Leveling Project (PLLP) (Annex 5).
9. The three Directors and two others, in charge of disciplines notaffecting the project area, report to the Director-General (DG) of Agriculturein Lahore who is the technical and administrative head of all agriculturalactivities except research (Figure 1).
10. The Integrated Rural Development Project (IRDP) was started in 1972.Its basic concept is to post technicians of several disciplines into marakhaz(the plural of markhaz, a rural development unit) where, under the guidance ofthe markhaz office they would concentrate on such tasks that are an agreedpriority, at any given time. The markhaz area is usually about half a tehsiland corresponds to the boundaries of the Union Councils it includes. Theproject is headed by a Director, based in Lahore. In Rahimyar Khan district,only one Union Council is invclved. They have their own agricultural exten-sion staff. A graduate carries out the functions of the FA. However, otheractivities prevent full-time effort on agricultural extension. As for hisopposite numbers in the regular extension service, his principal contact withfarmers is through some appropriate ramification of plant protection: eithersupervising spraying or arranging for it to be done. The regular ExtensionService also maintain their normal establishment in the area.
Working Conditions and Methods
11. The FAs are expectecL to reside in the villages within the UnionCouncil of their posting. No Government quarters are provided, and nohousing allowance is payable. Rented accommodation is not easily available
152

ANNEX 13Page 3
in the villages and therefore most of the FAs reside, rent free, in quartersprovided by the large landlords of the area. This tends to limit theirfield of activities as the landlords who house them expect to have first callon their services. Similar arrangements are made for the beldars and someof the AOs,
12. Transport facilities are inadequate. The FAs are given a travelingand a daily allowance which is meant to cover the upkeep of bicycles and out-of-pocket expenses. AOs share 4 WD vehicles which are approaching the end oftheir useful life and are in short supply. The EADA's office is also short oftransport. Staff are therefore forced to travel by public conveyance or hiredhorse-drawn traps.
13. The extension staff's main effort is plant protection. Recordsshow that during the kharif two-thirds, and during the rabi one-third of theFAs -- and, at all times, all of the beldars -- time is spent either in iden-
tifying pest problems, actually spraying or being present in the field wherespraying is taking place. The Department's guidelines do not readily allowthe use of their sprayers, and the pesticides they sell, without close con-trol aimed to avoid accidental poisoning. Thus, time not actually spent onspraying tends to be spent in awaiting requests, and therefore other extensionactivities receive even less attention from the FAs than their time alloca-tion would suggest. Consequently, farmer contacts for purposes other thanplant protection are mainly with the AOs who consequently have some 60-70,000ac, comprising over 5,000 farms, to service: a virtually impossible task evenif transport were unrestricted.
Staff Training
14. The AO's, from whose ranks EADAs and above are eventually selected,are trained in Agricultural Universities, the oldest of which is in Lyallpurin the central Punjab. There is a FA training establishment in RahimyarKhan designed to meet the needs of the southern Punjab. It runs a two-yearcourse; entry qualifications are "matriculate" standard, attainable aftera total of 12 years' schooling.
15. In-service training courses are run twice a year, before each ofthe main crop seasons. They are run separately for Divisional, Districtand Tehsil staff. The divisional seminars are conducted by staff from thePunjab Agricultural Research Station and the Agricultural University ofLyallpur. The district-level training is done by divisional staff withsome outside assistance; tehsil-level training is conducted by districtand divisional staff only. Leading farmers are invited to participate indistrict and tehsil training courses.
153

ANNEX 13Page 4
Present Plans to Strengthen the Service
16. Plans ready for implementation consist of the following measures:
- double the number of FAs. to have two in each Union Council;
- put an EADA in charge of the tehsils and a DDA in charge ofthe district;
- post a DA (Extension) to Multan, to take charge of Bahawalpurand Multan Divisions (instead of one DA for the whole Punjab);
- provide loans for the AOs to purchase motorcycles and makebudgetary provisions to Enable the payment of an equitableallowance for their use;
With extra FAs, the FA-farmer ratio would be about 1:1,200.
17. Notable deficiencies of the plan are:
- no provision for rural housing, either for construction orthe payment of a housing allowance to meet the cost of rentedaccommodation;
- no provision of specialist staff at tehsil level and theintroduction of other disciplines, especially water manage-ment;
- no change of working methods, either to designate staffsolely for plant protection operations or to develop acloser management system 'hat would enable better train-ing of farmers in the use of pesticides.
II. Agricultural Extension Under the Project
18. While a strengthened and closely controlled and supervised agricul-tural extension service is a vital prerequisite to attaining full productionpotential from the project works, it:s establishment and support is not aproject component. A province-wide extension and research project is sched-uled for appraisal by IDA in 1977 which would include Rahimyar Khan district.
B. Research
Agricultural Research Institutes
19. Agricultural Research in the Punjab is controlled by a Director-General for Agriculture (Research). The Directors of the major institutesreport to him. Of these, the Punjab Agricultural Research Institute (PARI)
154

ANNEX 13Page 5
does most of the work relevant to the project area. The basic investigationson wheat, sugarcane, pulses, and for the time being also oilseeds, is centeredthere. Maize, sorghum and pearl millet research is done in Yusufwala, inSahiwal district. A specialist station dealing with oil crops is shortly totake over the Khanpur research station, in the project area. Adaptive research(investigations into the local suitability of the crop varieties released byPARI) is done in Bahawalpur, which does a certain amount of varietal selectionwork of its own. More adaptive research is needed on problems specific to theproject area, such as the overlap in the wheat/cotton seasons (Annex 14,para 13).
20. The Bahawalpur station has sections for cereals, cotton, tobaccoand sugarcane; for plant pathology, and enthomology; and for horticulture,dealing mainly with mangoes and citrus, the region's principal fruit crops.The achievements, recent past and imminent future varietal releases arediscussed under the separate crops (Annex 14). A soils chemistry sectionconducts fertility trials on the station and in farmers' fields. They havean analytical laboratory that undertakes the testing of farmers' soil samplesand advises on fertilizer rates.
21. A notable advance will be the launching of the oil crops researchstation. In the past, trials have been conducted in Rahimyar Khan districton sunflowers which were agronomically promising, but the project was sus-pended before marketing and processing problems could be overcome. It wouldappear that not only the traditional Brassica oilseeds, but also sunflowers,safflower and groundnuts could become important crops in the area, alleviat-ing the country's vegetable oil shortage and better utilizing land and waterunder project conditions.
C. Credit
The Present Situation
22. Prior to 1973, short, medium and long-term institutional agricul-tural credits were the sole responsibility of the cooperative banks and,mostly the Agricultural Development Bank of Pakistan (ADBP). Inadequateorganization, scarce resources, and questionable lending policies have causedADBP to concentrate on arrears recovery and not on expanding lending. Stepsto remedy these weaknesses are under way. Since 1973, the five nationalizedcommercial banks (CBs) i.e. National Bank of Pakistan Ltd. (NBP), Habib BankLtd. (HBL), United Bank Ltd. (UBL), Muslim Commercial Bank Ltd., (MCB) andAllied Bank Ltd. (ABL) have been actively engaged in agricultural finance(about 50% of all institutional credit) under the agricultural small loansscheme drawn up by the State Bank of Pakistan (SBP).
155

ANNEX 13Page 6
23. The CBs have 103 branches in the Project area. They report, throughtheir zonal or principal office in Rahimyar Khan or Bahawalpur, to their HeadOffice in Karachi where a special department deals with agricultural lendingpolicy and statistics. Bank branches are sufficiently staffed for commerciallending business, but for agricuLtural credit operations they do not havesufficient staff.
24. The CBs now provide short-term facilities for purchasing productioninputs, particularly fertilizers and medium-term loans (three to five years)primarily for tractors, tubewell3, bullocks and, in a small way only, for landleveling. The rate of interest for all loans is 12% p.a. Lending conceptsand procedures are satisfactory, and the rate of recovery acceptable. Thebanks are controlled by SBP and aiudited by firms operating to internationalstandards.
II. Development Under the Project
25. Under the project, banks would make medium-term loans for installa-tion of private tubewells, land leveling and procurement of gypsum for landreclamation. Technical departmer,t and laboratories would assist bank branchesin the evaluation of loan applications (Annex 6). The CBs would be expectedto strengthen their technical staff to cope efficiently with the expandingcredit activity. HBL and MCB branches already have, respectively, six andthree trained agricultural credit. officers (ACO); the others have none or oneonly. The requirement would be at least one ACO for each of the four (tehsils)of the district.
November 1977
156

ANNEX 13
Figure 1
Director-General of Agriculture (Field)
DA (Extension) D. Agri. Eng. DA (Econ & Mar) Director of Director of BaraniSoil Conservation (dryland) agriculture
DDA Bahawalpur Division
EADARahim Yar Khan District
Five AOs in each offour tehsils (20)
Field Assistants (84)
Beldars (147)
LO
Ln~~~~~~~~~~~~~~~~~~~~~~~~14~~~~~~~~~~~~~~~~~~~~~~~~~~~

ANNEX 14Page 1
PAKISTAN
SALINITY CONTROL AND RECLAMATION PROJECT (SCARP) VI
Draft Terms of Reference for Study of
Agricultural Pricing and Water Charges
Introduction
1. The study will be the responsiblity of the Government ofPakistan and will be carried out by a Government study group with theassistance of consultants, under the general guidance of a CoordinatingCommittee headed by the Secretary, Federal Planning Division. The Committeewill include the Federal Secretaries of Finance, Agriculture, and Waterand Power; the Additional Chief Secretaries, Planning and Development, ofthe four provinces; and a representative of the Master Planning Division,WAPDA.
2. The study will comprise two parts; (i) a study of water charges;and (ii) a study of the general level and structure of agricultural pricingand taxation, including water charges. A draft of Part I of the Study (watercharges) will be completed by June 1978, and a draft of the whole Study byDecember 1978. Background notes for the study are attached.
Part I of Study
3. The purpose of Part I of the study will be to make recommendationson the appropriate level, structure and design of water charges, taking intoaccount the current and capital cost of providing water to the farmers, theeffect of water charges on farmer incentives, the encouragement of efficientwater use, income distribution and general revenue considerations.
4. In reaching its recommendations, the study should review:
(1) The current systems of #ater charges, their history andobjectives;
(2) The role and contribution of water charges to the provincialand federal budgets in relation to: (a) the level andadequacy of expenditure3 on O&M of irrigation and drainageworks; (b) expenditures on capital investments in irrigationand drainage development; (c) other expenditures and subsi-dies to the agriculturaL sector; and (d) other taxes onagriculture;
(3) The effectiveness of waLer charges in encouraging the 158efficient use of water by the farmer;

ANNEX 14Page 2
(4) The effect of water charges on the incentives to farmersto increase crop production;
(5) The income distribution impact of water charges as theyaffect farmers with different size holdings and in dif-ferent positions on the watercourse, and under differenttenurial arrangements.
5. Taking into account 1-5 above, the study will evaluate:
(a) the economic functions of water rates as: (i) an allocativedevice in ensuring efficient water use and optimal croppingpatterns, (ii) a benefit tax on the increased income/landvalues of farmers receiving water, and (iii) a source ofrevenue;
(b) alternative systems (including relative collection costs)of imposing water charges which will fulfill the functionslisted in (a) above;
(c) appropriate principles for determining water charges,including the desirabiity and feasibility of differentialsbetween crops, seasons, SCARP and non-SCARP areas, farmsize, farm locations, water delivery costs, etc; and
(d) appropriate methods of linking water charges (or theirproposed replacement) to inflation and, as necessary,to the increased budgetary expenditures resulting fromnew projects, including the interval at which such ad-justments should be made.
Part II of the Study
6. The purpose of Part II of the Study will be to recommend an optimallevel and structure of agricultural pricing and taxation, including watercharges, consistent with the Government's revenue needs, adequate incentivesto farmers, efficiency in resource allocation, and equity and progressivityin the system. The study should indicate the relative role of differentinstruments, including water charges, in achieving these various objectives.The findings and recommendations of Part I of the study should be takeninto account in framing recommendations under Part II.
7. The study should review:
(1) The current system of taxes, subsidies and pricing policiesin agriculture (such as export and excise duties, watercharges, agricultural income tax, procurement and price-setting policies, input subsidies, etc.) their historyand objectives;
159

ANNEX 14Page 3
(2) The impact of existing taxation and pricing policies inrelation to:
(M) the structure of input and output prices facingfarmers and returns from agriculture;
(ii) allocation of resources between crops within theagriculture sector and between agriculture andother sectors;
(iii) resource transfers - transferring resources fromagriculture to the Government, and from producersto consumers; and
(iv) the incidence of existing taxes and pricing onagriculture, their equity and progressivity andeffects on income dlstribution.
(3) Alternative revenue and expenditure tools to attain givenobjectives (e.g., removing subsidies on inputs and controlson output prices to enable domestic prices to reflect worldprices more closely in order to improve resource allocation,taking into account dometstic production costs, desirableincome levels and con8uwers' purchasing power; ways ofmaking the agricultural income tax more progressive bylinking it to size of holdings/productivity of land; theappropriate relationships between alternative instruments,in particular the extent to which water charges cansupplement other taxes, etc.).
8. In light of items 1-3 above, the study should evaluate:
(i) the optimal level and structure of overall agriculturalpricing and taxation that is desirable taking intoaccount the need for raising Government revenues,equitable income distribution, maintaining incentivesto farmers and improved resource allocation, and
(ii) the reliance which should be placed on alternative pric-ing and taxation instruments, including the role ofwater charges in suth a package, taking into accountchanges in input and output prices and taxes resultingfrom a revised structure of taxation.
160
ANNEX 14Page 4
BACKGROUND NOTES
Part I of Study
9. Water charges in Pakistan are imposed under the Canal and DrainageAct of 1873, as amended. They are assessed and collected by the ProvincialIrrigation Departments and form a direct means of charging the beneficiariesof the irrigation and drainage works for services and facilities provided bythe Federal and Provincial Governments. The revenue raised accrues directlyto the Provincial Governments, and is an important component (about 30%) ofdirect tax revenue to the provinces.
10. The Canal and Drainage Act is an authorization to collect watercharges, but the system of collection and level of charges is a Provincialmatter and is not uniform throughout the country.
11. Water charges have two distinct functions:
(i) as a source of direct general revenue to the Governmentto support its expenditures on the services it providesin both the agricultural and other sectors; and
(ii) as an allocative device to ensure that the services pro-vided are efficiently utilized.
12. These factors are embodied in existing legislation which refersto the right of the Government to recover the costs of services provided,to differentiate between charges on various crops on the basis of theirvalue and the amount of water needed to grow them and to tax the actualor potential rent accruing to landowners and farmers due to the highervalue of irrigated land.
13. Water charges in Punjab are currently levied on the basis of areacropped and crops grown. Per acre water charge rates vary between crops fromRs 6.40 for fodder to Rs 33.60 for orchards. Except under special circum-stances, water deliveries are fixed on the basis of area: thus (legal) pay-ments do not affect the volume of water delivered, although those receivingmore water will, if their cropping intensity is higher, pay more.
14. In Sind, water charges are combined with other land taxes, andare related to the assessed productivity of the land. Again, no link existsbetween price and quantity.
15. Water charges on assessed land values and crop areas as a directsource of revenue are at present significant from the Provincial point ofview (constituting about 30% of direct revenues) but relatively unimportanton a national scale. Provincial recoveries, however, are less than expen-ditures on operating and maintaining the system--and these expenditures
161
ANNEX 14Page 5
are already inadequate--and thus col.tribute nothing to the substantialpast and ongoing capital expenditures on infrastructure. In addition,the severe budgetary pressures facing Pakistan require rapid and sub-stantial mobilization of resources.
16. Water charges as an allocative device appear at present tobe completely ineffective. The quantity of water received is not depen-dent on the (legal) payments made, and thus the price at the margin iszero. The marginal value, on the other hand, is often very high. Theapparent wastage and inefficient management of water appears in part tostem from inadequate farmer-knowledge of the relevant techniques. Ifwater charges are to be effective as an allocative device, they wouldapparently require: (a) very substEntial increases to bring them to alevel at which farmers are aware of the cost of using water; (b) improve-ments in delivery of water to make it demand oriented and to ensurereliable and timely delivery of water, and (c) educating farmers in thetechniques of good water management. In the longer run, such changeswould have profoundly beneficial effects.
17. As a tax on beneficiaries, water charges are at present low.While the value of water at critical periods may exceed Rs 200/ac-ft,the average cost to the farmer is less than 10% of this. While averageand marginal costs are not strictly comparable, it is clear that thebenefits of irrigation are substantially in excess of the price paidby the farmers. The value of these benefits might be measured by therelative values of irrigated and unirrigated land.
Part II of Study
18. The level and structure of water charges in Pakistan cannot bedetermined independently of agricultural pricing policy and other taxes andlevies on agriculture. There are several such taxes and levies in existenceat present, e.g., export duties, excise duties, an agricultural income tax,as well as indirect taxing of agriculture through Government monopoly trad-ing, lower than world-market prices for agricultural products, etc.
19. In determining an appropriate level and structure of agriculturalpricing and taxation, general economic and social considerations must betaken into account. There is a pressing need in Pakistan to raise additionaldomestic resources for financing development programs in agriculture andother sectors. At the same time, in devising means of raising additionalrevenues, due regard must be given to equiity and progressivity of the systemto bring about a better distribution of income as well as the provision ofadequate incentives to farmers. The level of taxation of agriculture inrelation to other sectors of the economy and its effects on incentives andresource allocation within the agricuilture sector and between sectors mustbe considered. The existence of a complex system of agricultural taxes,input subsidies, Government monopoly trading and price-setting arrangementscomplicates such an evaluation.
t62

ANNEX 14Page 6
20. A recent World Bank study indicates that subsidies to farmersare equal to about one fourth of the taxes paid by them, and that in additionmuch "taxation" takes place via price distortions (lower than world marketprices), resulting in adverse terms of trade to agriculture vis-a-vis manu-facturing. Whether such taxes and price distortions place too heavy a burdenon agriculture, whether more incentives in favor of agriculture are desirable,and what changes are required in the mix of existing levies on agriculture,needs to be explored.
November 1977
163

ANNEX 15Page 1
PAKISTAN
SALINITY CONTROL AND RECLAMATION PROJECT (SCARP) VI
Present and Future C:opping Patterns and Production
Present Production
1. The present and future cropping patterns are shown in Table 1;crop areas, yields and production iTi Tables 2 and 3. The ratio of kharif torabi crops at present is as follows:
Units II III IV VSeascnal Perennial
canal waters
Kharif/rabi 1.2 to 1 1.3 to 1 1 to 1.15 1 to 1.18
Thus, at present there is a slight edge of kharif over rabi crops in theseasonally canal irrigated areas and the reverse in the perennial areas,although far less than anticipated in the original designs.
2. The tables also show that an average of 64% of all cropped landis in wheat, cotton and sugarcane. They account for practically all thedisposable income of the farmer.
3. The present overall cropping pattern, and particularly the total areaof fodder crops, has been remarkably constant for several years, indicatingthat fodder production is in balance with the requirements of the work andmilch animals in the area. Work aninal numbers relate more to the number offarming families than to the work output expected from them: all but culti-vators having very small holdings ow:1 one pair of oxen, notwithstanding thefact that one pair can readily cope with the work requirements of 15-20 acres.Ownership of oxen is necessary to enible potential sharecroppers to obtainland (sharecroppers not owning work animals are only rarely accepted by land-owners) and for small landowners and leaseholders to participate in the tra-ditional system whereby a number of ox teams move from farm to farm, inturn to plow, level and plant the lands of the participants. Therefore,the present fodder production maintains more working animals than the croppingpattern requires, even though it may not be sufficient to provide all theextra food demanded if the animals haive to work longer hours and have lesstime to forage in stubble-fields.
164

ANEX 15Page 2
Future Piodjtction Without the ProAect
4. Tables 1 and 2 also show the situ!tion expected around 1990 if proj-ect works are not implemented. In Uni,cs II and V, the area of the major cashcrops would diminish owing to increasing waterlogging and/or salinization,and the area of the crops gi-ing a lower per acre return, but also having agreater tolerance to adverse conditions (pulses, millets rice) would ill-crease. Overall, yields on the remaining land are not D-fected to improvein Units II and V, but would rise in Units III and Y1, cwing to generallyimproving techniques.
Future With the Project
5. The expected cropping pattern. Under project conditions water sup-plies would be increased, waterlogging and salinization controlled, therebymaking extra land available for cultivation and enabling overall highercropping intensities. The ratio of cash to fodder crops would improve infavor of the cash crops. The area under fodder crops would remain r.uch asat present, and may even decrease slightly in areas where cash crops with asubstantial component of usable by-products (sugarcane tops, wheat straw)would increase. Such extra fodder would be sufficient to provide the rationsneeded for the longer and harder work required from the oxen. Table 1 showsthe expected cropping pattern in percentages of the CCA and Figures 1 to 4demonstrates graphically how the crops fit into the agricultural year.
6. In Unit III, the main increase in cropping intensities would occurin the rabi, when evapo-transpiration is lower and therefore the crops pro-duced per hour of well operation are of higher value. There would be anincrease in the wheat, oilseed and sugarcane area. In the other units wherethe kharif canal deliveries would be increased, the present ratio of kharifand rabi crops would substantially remain, although, as noted, the area offodder would decline.
7. The expected production. Although the agricultural extension ser-vice would be upgraded either under an IDA project at present being preparedor otherwise, and to standards acceptable to IDA, this factor has not beentaken into consideration in estimating future yields and production. Cropyields under project conditions were estimated to increase mainly becauseof more irrigation water and better drainage, and only marginally as aresult of a better agricultural extension service.
8. Wheat. Since the large-scale introduction of the high-yieldingdwarf varieties in the mid-1960s, there have been several new releases ofreselected seed stocks, varieties since developed and also fresh importationsfrom Mexico. As at present, there is no organized seed trade and varietal
165

ANNEX 15Page 3
maintenance program, there is large-scale mixing of varieties, not only of
the dwarfs but also of the earlier, high baking quality but lower yielding
ones with the dwarfs; samples examined in the market and in Government stores
have confirmed this. With the deve:opment envisaged under the IDA-sponsored
seeds project (620-PAK), it is expected that pure and reliable planting mater-
ial will be available in quantities commensurate with increasing demands.
9. There is a sufficient diversity of varieties to meet conditions
likely to be encountered in the pro4ect area. The main criterion is time
of planting, which can start on kharif fallows in late October and must
necessarily continue, after cotton, into the second half of December.
Plantings after the beginning of December tend to give lower yields than
November plantings; the difference is diminished, but not overcome, by
selecting suitable varieties. The reason for the yield reduction is that
rising temperatures bring about ripening by around mid-April, irrespective
of planting time and the yield is related to the growing period. Therefore,
only the more sophisticated farmers will plant wheat late and balance poten-tially lower yields with increased revenue due to higher cropping intensities.
10. Rust resistance in Pakistan, as elsewhere, is a dynamic process
and requires constant breeding and reselection to keep ahead of the mutantsof rust. This aspect of wheat breeding is well under control.
11. Yields vary greatly. Many of the better farmers report averages
over 35 md/ac (1.3 tons/ac), while the average reported yield is 14.5 md/ac(0.5 tons/ac). Many authorities consider this an under-reporting and estimate
irrigated dwarf wheat yields at 20 md/ac (0.7 tons/ac). Projecting yields byaround 1990 to average 24 md/ac (0.9 tons/ac) would therefore appear feasible,
given the currently planned seed development program and without a sub-
stantially improved extension service.
12. Cotton is the major kharif crop and the district has for long been
one of the foremost cotton-growing areas of the north Indus plain. The dis-
trict is designated an American (hir3utum) cotton area. All the varieties
are of medium staple length, the original variety release descriptions vary-
ing between 15/16" and 1-1/16". Still the most prominent is the reselectionand updating of the old 13/26, under the name of Bahawalpur Selection or BS1.
The last picking of this variety is Ln mid-December, making it almost impos-
sible to follow with wheat (para 9). Emphasis is on varieties that finishtheir growing cycle earlier and are also less branching and bushy than BLI.
Such a selection is 149 F. AC 147, an older, medium-duration variety is also
grown, although according to the cot-on zoning regulations, it should be grown
only in Multan district.
13. The principal agronomic andl genetic problem with cotton is that all
the germplasm in the present varieties is to some extent heat sensitive and
the plants do not flower until temperatures drop from their July-August peaks
of around 120 F. Therefore, planting before mid-June does not bring about
166

ANNEX 15Page 4
earlier flowering; the prolonged flowering period inherent in the varietiesmakes at least three pickings economical, thereby delaying the time the cropcan be uprooted. Consequently, until a new series of varieties are developedand released, cotton after wheat enables maximum yields to be obtained fromboth crops, but if wheat is to be planted after cotton, then either cottonyields suffer through a lost picking or wheat yields are reduced by lateplanting.
14. Cotton suffers mainly from jassids, mites and, above all, the pinkbollworm. Pest control is inadequate, mainly because there are not enoughsprayers and routinely used spares, such as washers and nozzles. Therefore,yields are a function of the more or less uncontrolled trends of the insectcycles and are further held down by inadequate plant populations, due partlyto low seed rates compounded by the use of bollworm-infested planting mater-ial. The yield range is between 10 and 15 md/ac (0.4 to 0.6 tons/ac) but thepotential is around 25-30 md/ac (0.9-1.1 tons/ac) with the existing varietiesand good, well known agronomic practices. Therefore, expected average yieldsof around 18 md/ac (0.7 tons/ac) by about 1990 would appear reasonable.
15. Sugarcane is of increasing importance. There are two sugarmills inthe district and there is a flourishing jaggery (gur) industry. The crop growswell and varieties that can tolerate the low December-January temperatureshave been evolved. With proper fertilization and pest control, two ratooncrops are feasible but usually the combined effect of root borers and potashdeficiency induces farmers to take only one ratoon. The crop is planted inMarch-April. The sugarmills open in November and first crush the ratooncrop; plant crops are normally harvested from January onwards.
16. As fertile seeds are not produced in the area, all breeding workis done in a high-elevation station in the Himalayan foothills. But fieldtrials and adaptive research is carried out in Bahawalpur and also on thesugarmill farms in the project area. The COL 54 is a popular, older variety;BL4 and BL90 are more recent, somewhat higher yielding selections.
17. Yields vary greatly. Crops, estimated to produce between 200 and1,000 md/ac (7.4 to 37 tons/ac) were seen in adjoining fields. Average yieldsare reported to be about 375 md/ac (14 tons/ac) but there is no obvious rea-son why an average of 510 md/ac (19 tons/ac) should not be readily attainablewith the project.
18. The principal pests affecting the crop are stem and root borers,both relatively easy to control. The sugarmills assist the extension serviceactively in promoting spraying and the application of granular pesticides.
19. Rice is an important crop only in the southwestern corner of theproject area, although small pockets, mostly for domestic consumption aregrown everywhere. The variety grown commercially is IR6, a high-yieldingdwarf. For domestic use, a Basmati (scented) variety is popular, the projectarea being the southern limit of its ecological range. Average yields of
167

ANNEX 15Page 5
IR6 were reported at around 20 md/ac (0.7 tons/ac) but yields in excess ofthis were frequent. Under project conditions, an average of 27 md/ac (1.0tons/ac) should be readily attainable.
20. The crop is attacked by stem borers. Zinc deficiency, increasinglyidentified, is however easily controllable.
21. Sorghum and pearl millet (jowar and bajra) are minor grain cropsand are principally planted for fodder, i.e. more closely than desirablefor maximum grain yield. Almost no varieties of higher yielding graintypes have been released and there is no hybrid seed development program.Grain yields are only about 7-8 md/ac (0.25-0.3 tons/ac) and unlikely toincrease until there is a new approach to a grain variety or hybrid produc-tion program. As apart from rice, millets are the only possible food cropsin the kharif, and before controlled barrage irrigation were of major impor-tance, it does not seem unlikely that a fresh look at agricultural develop-ment, especially if combined with a livestock and feed industry, will putnew emphasis on millet production. In this case, new genetic material isavailable to bring about a rapid increase in yields.
22. Maize is not at present an important crop. Several earlier attemptsto popularize it in the southern Pinjab produced only short-lived results.When wheat is plentiful, maize is of smaller dietary importance even thanthe millets and is mainly used green as a vegetable. Hybrids and syntheticvarieties that would boost yields have been developed and are in limiteduse, but being a minor crop, receive less than optimum attention and thepotential is only rarely realized. Under project conditions, the estimatedyield would be 20 md/ac (0.74 tons/ac) for the few farmers who would growthe crop commercially.
23. Pulse crops of importance are the chickpea in the rabi and thecluster bean (guara) in the kharif, although the latter is in the projectarea more frequently as a fodder c:_op. Chickpea yields are low, the atten-tion paid to the crop minimal and yields are likely to advance only slowlyfrom their present low level of 6 mld/ac (0.22 tons/ac).
24. The rabi fodder crop is t:he Egyptian clover (berseem) and, to alesser extent, lucerne. The varieties available are good and the expectedyield of 410 md/ac (15 tons/ac) is easily attainable.
25. Orchard crops in the area are mango and citrus. There are someexcellent grafted mango varieties t:hat yield well. Orchards are usuallysold to contractors who harvest ana, market the crop; prices attained arearound Rs 3,000 to 5,000/ha. CitrtLs orchards fetch around 1,000 to 3,000/hadepending on kind and productivity.
26. With the expected improvement in the extension service, yieldswould, overall, increase considerably above the levels assumed for theeconomic analysis of this project. The expected yields, with an improvedextension service in addition to the project works, would be as follows:
168

ANNEX 15Page 6
ton/ac md/ac ton/ac md/ac
rice 1.5 40 wheat 1.3 35cotton .9 25 rabi pulses .3 9maize 1.7 45 oil seeds .7 20millets .6 15 rabi fodder 22.0 605kharif fodder 22.0 605 sugarcane 26.0 705
other perennials /a 2.4 66
/a Aggregated average yields.
These yields are of the order at present obtained by the better farmers.
November 1977
169

ANNEX 15
PAKISTAN Table I
SALINITY CONTROL AND RECLAMATION PROJECT (SCARP) VI
Present & Future Cropping Patterns (%)
Unit II Unit III Unit IV Uhit V Project Area
P 1 w P w w p W w p w WUnit size (,000 ac) - 338 ----- 388 --- 76 ----- 468 1,270 -----
Rice 3 10 7 9 9 5 2 2 6 1 3 2 3 7 4Cotton 34 20 35 20 20 30 25 25 35 26 22 30 31 21 32Maize 1 1 3 1 1 1 1 1 2 2 2 3 1 1 2Millets 7 12 8 9 9 5 3 3 4 3 4 6 5 8 6Fodder 5 5 5 5 5 5 7 7 6 9 9 8 6 7 6
Total kharif .u 46 44 44 46 38 38 53 41 40 49 46 44 50
Wheat 24 19 35 20 20 40 28 28 37 31 26 35 26 21 37Pulses 1 5 4 1 1 2 1 1 2 1 5 2 1 5 3Oilseeds 2 3 8 2 2 6 8 8 8 10 11 10 5 6 8Fodder 14 14 10 10 10 8 8 8 7 8 8 7 10 10 8
Total rabi 41 41 57 33 33 56 45 45 54 50 50 54 42 42 56
Sugarcane 2 2 5 10 10 10 6 6 7 6 6 7 6 6 7Orchards & misc. 2 2 5 2 2 2 2 2 2 2 2 4 2 2 4Total perennial 4 4 10 12 12 12 8 8 9 8 8 11 8 8 11
Total intensity(counting peren-nials twice) 99 97 135 101 101 126 99 99 125 107 106 125 104 102 128
0~~ -
DF31
D
C>

ANNEX 15
PAKISTAN Table 2
SALINITY CONTROL & RECLAMATION PROJECT (SCARP) VI
Present & Future Crop Areas, Yields & Production
(area in ha; yields in tons/ha; production ,000 tons)
Unit II (137,580 ha) Unit III (157,790 ha)
P W W P w W
Area Yield Prod Area Yield Prod Area Yield Prod Area Yield Prod Area Yield Prod Area Yield Prod
(Th.ha) (T/ha) (Th.t) (Th.ha) (T/ha) (Th.t) (Th.ha) (T/ha) (Th.t) (Th.haj (T/ha) (Th.t) (Th.ha) (Tfha) (Th t) (Th.ha) (Tlha) (Th.t)
Rice 4.1 1.9 7.8 13.7 1.9 26.0 9.6 2.5 24.0 7.9 1.9 14.9 7.9 2.2 17.3 7.9 2.5 19 6
Cotton 46.6 1.0 46.6 27.4 1.4 38.4 48.0 1.6 76.7 47.1 1.0 47.1 47.1 1.4 65.9 47.1 1.6 75.4
Maize 1.4 1.0 1.4 1.4 1.0 1.4 4.1 1.8 7.4 1.6 1.0 1.6 1.6 1.3 2.0 1.6 1.8 2.8
Millets 9.6 0.7 6.2 16.4 0.7 10.7 11.0 0.8 8.8 7.9 0.7 5.1 7.9 0.8 6.3 7.9 0.8 6.3
Rhar FOD 6.9 26.0 178.1 6.9 28.0 191.8 6.9 37.0 253.5 7.9 28.0 219.8 7.9 34.0 266.9 7.9 37 0 290.5
Wheat 32.9 1.2 37.8 26.0 1.5 39.0 48.0 2.2 105.5 31.4 1.2 36.1 31.4 1.5 47.1 62.8 2 2 138.2
Rabi Pulses 1.4 0.6 0.8 6.9 0.6 4.1 5.5 0.7 3.8 1.6 0.6 0.9 1.6 0.6 0 9 3.1 0.7 2.2
Oilseed 2.7 0.5 1.4 4.1 0.5 2.1 11.0 0.7 8.1 3.1 0.5 1.6 3.1 0.6 1.9 9.4 0.7 7.0
Rabi FOD 19.2 25.0 479.5 19.2 29.0 556.2 13.7 37.0 506.9 15.7 25.0 392.5 15.7 34.0 533.8 12 6 37.0 464.7
Sugarcane 2.7 33.0 90.4 2.7 35.0 95.9 6.9 46.0 315.1 12.6 33.0 414.5 12.6 40.0 502.4 15.7 46.0 722 2
Other Perennial 2.7 4.0 11.0 2.7 4.0 11.0 6.9 5.0 34.3 3,1 4.0 12.6 3.1 4.0 12.6 3.1 5.0 15 7
Total cropped 130.2 - - 127.4 - - 176.6 - - 139.9 - - 139 9 - - 179.1 - -
Unit IV (30,835 ha) Unit V (187.450 ha) __
P W w P W W
Area Yield Prod Area Yield Prod Area Yield Prod Area Yield Prod Area Yield Prod Area Yield Prod
(Th.ha) (T/ha) (Th.t) (Th.ha) (T/ha) (Th.t) (Th.ha) (T/ha) (Th.t) (Th.ha) (T/ha) (Th.t) (Th ha) (T/ha) (Th.t) (Th.ha) (T/ha) (Th t)
Rice 0.6 1.9 1.2 0.6 2.2 1.4 1.9 2.5 4.7 1.9 1.9 3.6 5.7 1.9 10.8 3.8 2.5 9.5
Cotton 7.8 1.0 7.8 7.8 1.4 10.9 10.9 1.6 17.4 49.1 1.0 49.1 41.6 1.4 58.2 56.7 1.6 90.7
Maize 0.3 1.0 0.3 0.3 1.3 0.4 0.6 1.8 1.1 3.8 1.0 3.8 3.8 1.0 3.8 5.7 1.8 10.2
Millets 0.9 0.7 0.6 0.9 0.8 0.7 1.2 0.8 1.0 5.7 0.7 3.7 7.6 0.7 4.9 11.3 0.8 9.1
Khar FOD 2.2 28.0 60.8 2,2 34.0 73.8 1.9 37.0 68,8 17.0 26.0 442.3 17.0 28.0 476.3 15.1 37.0 559.4
Wheat 8.7 1.5 13.0 8.7 2.0 17.4 11.5 2.2 25.2 58.6 1.5 87.9 49.1 2.0 98.3 66 2 2.2 145.5
Rabi Pulses 0.3 0.6 0.2 0.3 0.6 0.2 0.6 0.7 0.4 1.9 0.6 1.1 9.5 0.6 5.7 3.8 0.7 2.6
Oilseed 2.5 0.5 1.2 2.5 0.6 1.5 2.5 0.7 1.8 18.9 0.5 9.5 20.8 0.6 12.5 18.9 0.7 14.0
Rabi FOD 2.5 25.0 62.0 2.5 30.0 74.4 2.2 37.0 80.3 15.1 25.0 378.0 15.1 30.0 453.6 13.2 37.0 489.5
Sugarcane 1.9 34.5 64.2 1.9 40.0 74.4 2.2 46.0 99.8 11.3 34.5 391.2 11.3 40.0 453.6 13.2 46.0 608.6
Other Perennial 0.6 4.0 2.5 0.6 5.0 3.1 1.6 5.0 7.8 3.8 4.0 15.1 3.8 5.0 18.9 7.6 5 0 37.8
Total cropped 28.3 - - 28.3 - - 37.1 - - 187.1 - - 185.3 - - 215.5 - -
9 Legend P - present situation, W - future without the project, W = future with project

ANNEX 15Table 3
PAKISTAN
SALINITY CONTROL AND RECLAMATION PROJECT (SCARP) VI
Crop Area, Yield, and Production - Total Project
CROP PRESENT FUTURE WITHOUT PROJECT FUTURE WITH PROJECTArea Yield Prod Area Yield Prod Area Yield Prod
('000 Ha) (T/Ha) ('000 T) ('000 Ha) (T/Ha) ('000 T) ('000 Ha) (T/Ha) ('000 T)
Rice 14.5 1.9 27.5 27.8 2.0 55.4 23.1 2.5 57.7
Cotton 150.6 1.0 150.6 123.8 1.4 173.4 162.6 1.6 260.2
Maize 7.0 1.0 7.0 7.0 1.1 7.6 12.0 1.8 21.5
Millets 24.0 0.7 15.6 32.8 n=7 22.6 31.4 0.8 25.1
Khar Fod 33.9 26.6 900.9 33.9 29.8 1008.8 31.7 37.0 1172.2
Wheat 131.6 1.3 174.8 115.3 1.8 201.8 188.4 2.2 414.4
Rabi Puls 5.1 0.6 3.1 18.2 0.6 10.9 13.0 0.7 9.1
Oilseed 27.3 0.5 13.6 30.5 0.6 17.9 41.8 0.7 30.9
Rabi Fod 52.5 25.0 1312.0 52.5 30.8 1618.0 41.7 37.0 1541.4
Sugar Cane 28.5 33.7 960.3 28.5 39.5 1126.3 38.0 46.0 1745.7
0th Peren 10.3 4.0 41.1 10.3 4.4 45.5 19.1 5.0 95.5
TOTAL 485.3 - - 480.6 - - 602.8 - -
10~~~~~~~~~~~~~~~~~~~ 1~~~~~~~~~~~~~~~~~~~~~~~~~~~~~~~~~~~~~~~~~~~~~~~~~~~~~~-

ANNEX 15PAKISTAN Fig. 1
SALINITY CONTROL MAD RECLAMATION PROJECT (SCARP) VI
CROPPING PATTERN UNIT II
M J J A S 0 N D J F M A M
Sugarcane & Orchards 10%
90
80 Whea 17% 2///
80~~~~~~~~~~~~~~~~~~0
*70/, /R .Fodde r 1 %///X
60
50 MilLets 8% heat 10%
4
30
Cotton 35%
20
Rice 7%
M A J S 0 N b J 'F M A M
. 4

PAKISTAN
SALINITY CONTROL AND RECLAMATION PROJECT (SCARP) VI Fig. 2Fig. 2
CROPPING PATTERN UNIT III
100 I J J A N D M A
Sugarcane S Orchards 12%90
80.
5a. 5% 7 / / / / / ~~~~~Wheat 10X///
70-
60-
-Fodder 5
407
Maize 1%30
Cotton 30%
20
10-
/ ~~Rice 5%_ ,, lAM
M J J A S O N D J F M A M

ANNEX 15PAll UTAN Fig. 3
SALINITY CONTROL AND RECLAVATTON PROJECT (SCARP) VI
CROPPING PATTERNj UNiT IV
M J J ~~A S O N D J F M A M100
Sugarcane Orchards 9%
9o
70
////// R. Fodder 7% .
60
v0 i lse e ds 8 ° /
50
49
39
20 ', 35%
10 JN
Rice 6%, heat 7%
M J J A S 0 N D J F M A m
I-.

ANNEX 15PAKISTAN Fig. 4
SALINITY CONTROL AND RECLAMATION PROJECT (SCARP) VI
CROPPING PATTERN UNIT V
100 M J J A S 0 N D J F M A M
Sugarcane & Orchards 11%90
80 /'/' ' /////////// / '
80/ / "Weat 23%
70
60 Fode 7%
O seeds 10X 50
MiLLets 6%//////////
30
20Cotton 30%
10
WO N=
-4 ~ ~ ~ ~ ~ ~ ~~A s 0

ANNEX 16
PAKISTAN
SALINITY CONTROL AND RECLAMATION PROJECT (SCARP) VI
Agricultural Inputs and Crop Budgets
Agricultural Data
1. Tables 1 to 4 show the agricultural, data on yields, cropping patternsand fertilizer requirements for the project Units in the present, future with-out and future with project situations. Tables 5 to 12 show crop enterprisebudgets for these projections, based on financial and economic prices developedin Annex 16.
2. Tables 13 to 16 show the labor and draft power requirements for eachcrop by month (per ha). In Units II and V, future without project labor anddraft power requirements (per crop, per ha) are expected to be the same as atpresent.
3. Total project labor and draft power requirements are shown in Tables17 and 18, and the estimated economic cost of labor in Table 19.
4. The economic value of production for each Unit and the project as awhole is shown in Tables 20-24. Table 25 shows the estimated economic valueof production if the extension project is introduced.
November 1977
177
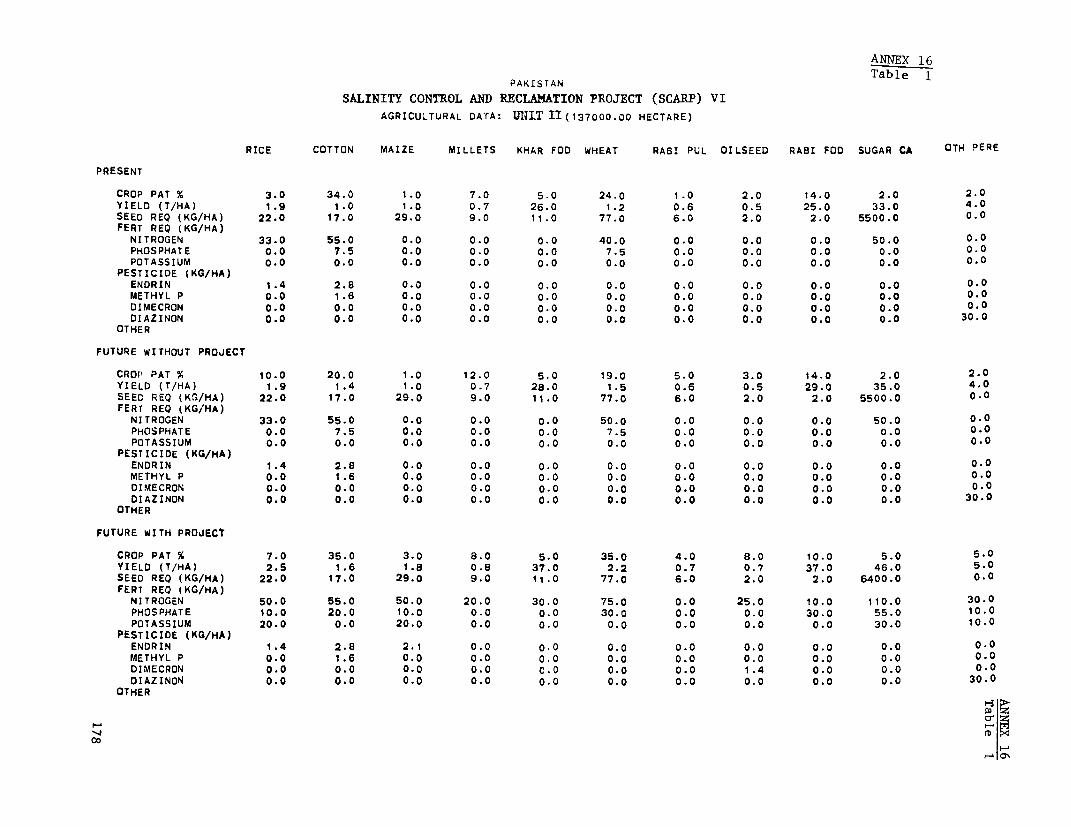
ANNEX 1 6Table 1
PAKISTAN
SALINITY CONTROL AnD RECLAMATION PROJECT (SCARP) VIAGRICULTURAL DATA: UlIlT II(137000.00 HECTARE)
RICE COTTON MAIZE MILLETS KHAR FOD WHEAT RABI PUL OILSEED RABI FOD SUGAR CA OTH PERE
PRESENT
CROP PAT X 3.0 34.0 1.0 7.0 5.0 24.0 1.0 2.0 14.0 2.0 2.0YIELD (T/HA) 1.9 1.0 1.0 0.7 26.0 1.2 0.6 0.5 25.0 33.0 4.0SEED REQ (KG/HA) 22.0 17.0 29.0 9.0 11.0 77.0 6.0 2.0 2.0 5500.0 0.0FERT REQ (KG/HA)NITROGEN 33.0 55.0 0.0 0.0 0.0 40.0 0.0 0.0 0.0 50.0 0.0PHOSPHATE 0.0 7.5 0.0 0.0 0.0 7.5 0.0 0.0 0.0 0.0 0.0POTASSIUM 0.0 0.0 0.0 0.0 0.0 0.0 0.0 0.0 0.0 0.0 0.0PESTICIDE (KG/HA)ENDRIN 1.4 2.8 0.0 0.0 0.0 0.0 0.0 0.0 0.0 0.0 0.0METHYL P 0.0 1.6 0.0 0.0 0.0 0.0 0.0 0.0 0.0 0.0 0.0DIMECRON 0.0 0.0 0.0 0.0 0.0 0.0 0.0 0.0 0.0 0.0 0.0DIAZINON 0.0 0.0 0.0 0.0 0.0 0.0 0.0 0.0 0.0 0.0 30.0OTHER
FUTURE WITHOUT PROJECT
CROP PAT % 10.0 20.0 1.0 12.0 5.0 19.0 5.0 3.0 14.0 2.0 2.0YIELD (T/HA) 1.9 1.4 1.0 0.7 28.0 1.5 0.6 0.5 29.0 35.0 4.0SEED REQ (KG/HA) 22.0 17.0 29.0 9.0 11.0 77.0 6.0 2.0 2.0 5500.0 0.0FERT REQ (KG/HA)NITROGEN 33.0 55.0 0.0 0.0 0.0 50.0 0.0 0.0 0.0 50.0 0.0PHOSPHATE 0.0 7.5 0.0 0.0 0.0 7.5 0.0 0.0 0.0 0.0 0.0POTASSIUM 0.0 0.0 0.0 0.0 0.0 0.0 0.0 0.0 0.0 0.0 0.0PESTICIDE (KG/HA)ENDRIN 1.4 2.8 0.0 0.0 0.0 0.0 0.0 0.0 0.0 0.0 0.0METHYL P 0.0 1.6 0.0 0.0 0.0 0.0 0.0 0.0 0.0 0.0 0.0DIMECRON 0.0 0.0 0.0 0.0 0.0 0.0 0.0 0.0 0.0 0.0 0.0DIAZINON 0.0 0.0 0.0 0.0 0.0 0.0 0.0 0.0 0.0 0.0 30.0OTHER
FUTURE WITH PROJECT
CROP PAT % 7.0 35.0 3.0 8.0 5.0 35.0 4.0 8.0 10.0 5.0 5.0YIELD (T/HA) 2.5 1.6 1.8 0.8 37.0 2.2 0.7 0.7 37.0 46.0 5.0SEED REQ (KG/HA) 22.0 17.0 29.0 9.0 11.0 77.0 6.0 2.0 2.0 6400.0 0.0FERT REQ (KG/HA)NITROGEN 50.0 55.0 50.0 20.0 30.0 75.0 0.0 25.0 10.0 110.0 30.0PHOSPHATE 10.0 20.0 10.0 0.0 0.0 30.0 0.0 0.0 30.0 55.0 10.0POTASSIUM 20.0 0.0 20.0 0.0 0.0 0.0 0.0 0.0 0.0 30.0 10.0PESTICIDE (KG/HA)ENDRIN 1.4 2.8 2.1 0.0 0.0 0.0 0.0 0.0 0.0 0.0 0.0METHYL P 0.0 1.6 0.0 0.0 0.0 0.0 0.0 0.0 0.0 0.0 0.0DIMECRON 0.0 0.0 0.0 0.0 C.O 0.0 0.0 1.4 0.0 0.0 0.0DIAZINON 0.0 0.0 0.0 0.0 0.0 0.0 0.0 0.0 0.0 0.0 30.0OTHER
OD..~~~~~~~~ cr fi~~~~~~~~~~~~~~~~~~~~~~~~~~~~~~~~~~~-0

ANX16PAKIStAN ~~~~~~~Table 2
PAKISTAN F l-SALINITY CONTROL AND RECLAMATION PROJECT (SCARP) VI
AGRICULTURAL DATA: UNIT III(157000.00 HECTARE)
RICE COTTON MAIZE MILLETS KHAR FOD WHEAT RABI PUL OILSEED RABI FOD SUGAR CA OTH PERE
PRESENT
CROP PAT % 5.0 30.0 1.0 5.0 5.0 20.0 1.0 2.0 10.0 8.0 2.0YIELD (T/HA) 1.9 1.0 1.0 0.7 28.0 1.2 0.6 0.5 25.0 33.0 4.0SEED REQ (KG/HA) 22.0 17.0 29.0 9.0 11.0 77.0 6.0 2.0 2.0 5500.0 0.0FERT REQ (KG/HA)NITROGEN 33.0 55.0 0.0 0.0 0.0 40.0 0.0 0.0 0.0 50.0 0.0PHOSPHATE 0.0 7.5 0.0 0.0 0.0 7.5 0.0 0.0 0.0 0.0 0.0POTASSIUM 0.0 0.0 0.0 0.0 0.0 0.0 0.0 0.0 0.0 0.0 0.0
PESTICIDE (KG/HA)ENDRIN 1.4 2.8 0.0 0.0 0.0 0.0 0.0 0.0 0.0 0.0 0.0METHYL P 0.0 1.6 0.0 0.0 0.0 0.0 0.0 0.0 0.0 0.0 0.0DIMECRON 0.0 0.0 0.0 0.0 0.0 0.0 0.0 0.0 0.0 0.0 0.0DIAZINON 0.0 0.0 0.0 0.0 0.0 0.0 0.0 0.0 0.0 0.0 30.0
OTHER
FUTURE WITHOUT PROJECT
CROP PAT % 5.0 30.0 1.0 5.0 5.0 20.0 1.0 2.0 10.0 8.0 2.0YIELD (T/HA) 2.2 1.4 1.3 0.8 34.0 1.5 0.6 0.6 34.0 40.0 4.0SEED REQ (KG/HA) 22.0 17.0 29.0 9.0 11.0 77.0 6.0 2.0 2.0 6400.0 0.0FERT REQ (KG/HA)
NITROGEN 40.0 50.0 30.0 20.0 20.0 50.0 0.0 0.0 0.0 110.0 0.0PHOSPHATE 0.0 7.5 0.0 0.0 0.0 7.5 0.0 0.0 0.0 55.0 0.0POIASSIUM 0.0 0.0 0.0 0.0 0.0 0.0 0.0 0.0 0.0 0.0 0.0
PESTICIDE (KG/HA)ENDRIN 1.1 2.8 0.0 0.0 0.0 0.0 0.0 0.0 0.0 0.0 0.0METHYL P 0.0 0.0 0.0 0.0 0.0 0.0 0.0 0.0 0.0 0.0 0.0DIMECRON o.O 0.0 0.0 0.0 0.0 0.0 0.0 1.4 0.0 0.0 0.0DIAZINON 0.0 0.0 0.0 0.0 0.0 0.0 0.0 0.0 0.0 0.0 30.0
OTHER
FUTURE WITH PROJECT
CROP PAT % 5.0 30.0 1.0 5.0 5.0 40.0 2.0 6.0 8.0 10.0 2.0YIELD (T/HA) 2.5 1.6 1.8 0.8 37.0 2.2 0.7 0.7 37.0 46.0 5.0SEED REQ (KG/HA) 22.0 17.0 29.0 9.0 11.0 77.0 6.0 2.0 2.0 6400.0 0.0FERT REQ (KG/HA)
NITROGEN 50.0 55.0 50.0 20.0 30.0 75.0 0.0 25.0 10.0 110.0 30.0PHOSPHATE 10.0 20.0 10.0 0.0 0.0 30.0 0.0 0.0 30.0 55.0 10.0POTASSIUM 20.0 0.0 20.0 0.0 0.0 0.0 0.0 0.0 0.0 30.0 10.0
PESTICIDE (KG/HA)ENDRIN 1.4 2.8 2.1 0.0 0.0 0.0 0.0 0.0 0.0 1.1 0.0METHYL P 0.0 1.6 0.0 0.0 0.0 0.0 0.0 0.0 0.0 0.0 0.0DIMECRON 0.0 0.0 0.0 0.0 0.0 0.0 0.0 1.4 0.0 0.0 0.0DIAZINON 0.0 0.0 0.0 0.0 0.0 0.0 0.0 0.0 0.0 0.- 30.0
OTHER
O,vD
N) X~~~~~~~~~~~~~~~~~~~~~~~~~~~~~~~~~~~~~~~~~~~~~~~~~~~~~~~~~~~~~~~~~~~~~~~~~-
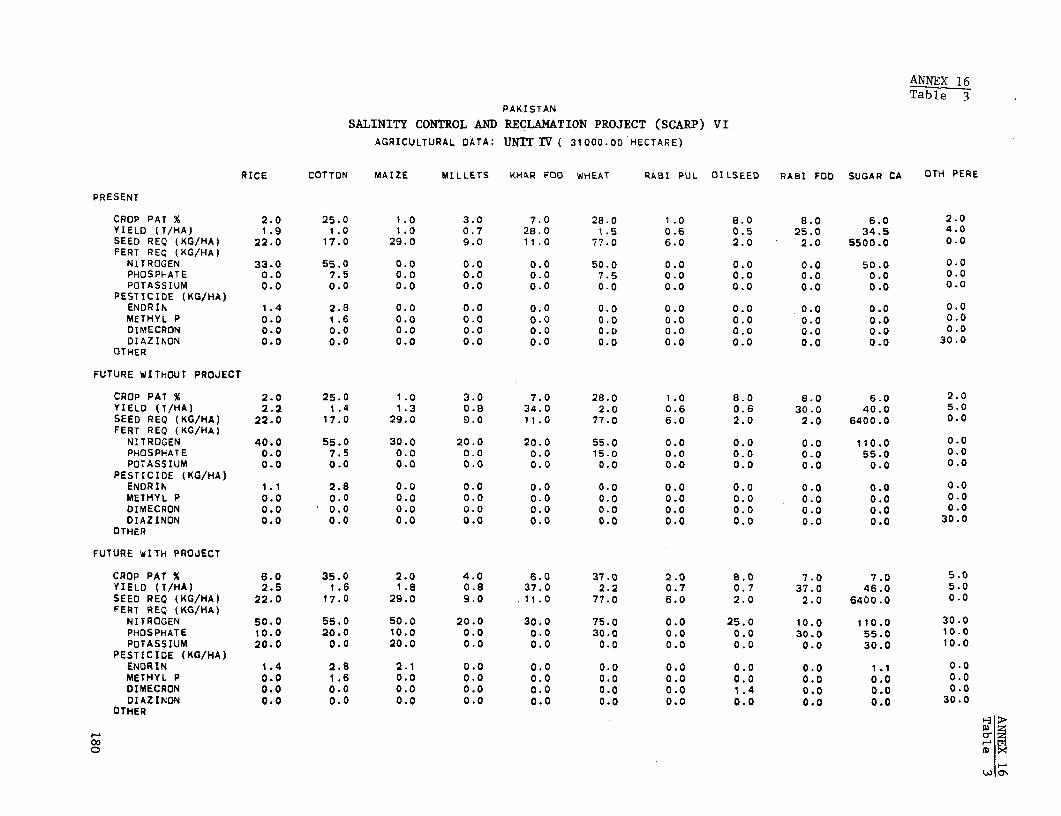
ANNEX 16Table 3
PAKISTAN
SALINITY CONTROL AND RECLAMATION PROJECT (SCARP) VI
AGRICULTURAL DATA: UNIT IV ( 31000.00 HECTARE)
RICE COTTON MAIZE MILLETS KHAR FOD WHEAT RABI PUL OILSEED RABI FOD SUGAR CA OTH PERE
PRESENT
CROP PAT % 2.0 25.0 1.0 3.0 7.0 28.0 1.0 8.0 8.0 6.0 2.0YIELD (T/HA) 1.9 1.0 1.0 0.7 28.0 1.5 0.6 0.5 25.0 34.5 4.0SEED REQ (KG/HA) 22.0 17.0 29.0 9.0 11.0 77.0 6.0 2.0 2.0 5500.0 0.0FERT REQ (KG/HA)
NITROGEN 33.0 55.0 0.0 0.0 0.0 50.0 0.0 0.0 0.0 50.0 0.0PHOSPHATE 0.0 7.5 0.0 0.0 0.0 7.5 0.0 0.0 0.0 0.0 0.0POTASSIUM 0.0 0.0 0.0 0.0 0.0 0.0 0.0 0.0 0.0 0.0 0.0
PESTICIDE (KG/HA)ENDRIN 1.4 2.8 0.0 0.0 0.0 0.0 0.0 0.0 0.0 0.0 0.0METHYL P 0.0 1.6 0.0 0.0 0.0 0.0 0.0 0.0 0.0 0.0 0.0DIMECRON 0.0 0.0 0.0 0.0 0.0 o.0 0.0 0.0 0.0 0.0 0.0DIAZINON 0.0 0.0 0.0 0.0 0.0 0.0 0.0 0.0 0.0 0.0 30.0
OTHER
FUTURE WITHOUT PROJECT
CROP PAT % 2.0 25.0 1.0 3.0 7.0 28.0 1.0 8.0 8.0 6.0 2.0YIELD (T/HA) 2.2 1.4 1.3 0.8 34.0 2.0 0.6 0.6 30.0 40.0 5.0SEED REQ (KG/HA) 22.0 17.0 29.0 9.0 11.0 77.0 6.0 2.0 2.0 6400.0 0.0FERT REQ (KG/HA)
NITROGEN 40.0 55.0 30.0 20.0 20.0 55.0 0.0 0.0 0.0 110.0 0.0PHOSPHATE 0.0 7.5 0.0 0.0 0.0 15.0 0.0 0.0 0.0 55.0 0.0POTASSIUM 0.0 0.0 0.0 0.0 0.0 0.0 0.0 0.0 0.0 0.0 0.0
PESTICIDE (KG/HA)ENDRIN 1.1 2.8 0.0 0.0 0.0 0.0 0.0 0.0 0.0 0.0 0.0METHYL P 0.0 0.0 0.0 0.0 0.0 0.0 0.0 0.0 0.0 0.0 0.0DIMECRON 0.0 0.0 0.0 0.0 0.0 0.0 0.0 0.0 0.0 0.0 0.0DIAZINON 0.0 0.0 0.0 0.0 0.0 0.0 0.0 0.0 0.0 0.0 30.0
OTHER
FUTURE WITH PROJECT
CROP PAT % 6.0 35.0 2.0 4.0 6.0 37.0 2.0 S.0 7.0 7.0 5.0YIELD (T/HA) 2.5 1.6 1.8 0.8 37.0 2.2 0.7 0.7 37.0 46.0 5.0SEED REQ (KG/HA) 22.0 17.0 29.0 9.0 11.0 77.0 6.0 2.0 2.0 6400.0 0.0FERT REQ (KG/HA)
NITROGEN 50.0 55.0 50.0 20.0 30.0 75.0 0.0 25.0 10.0 110.0 30.0PHOSPHATE 10.0 20.0 10.0 0.0 0.0 30.0 0.0 0.0 30.0 55.0 10.0POTASSIUM 20.0 0.0 20.0 0.0 0.0 0.0 0.0 0.0 0.0 30.0 10.0
PESTICIDE (KG/HA)ENDRIN 1.4 2.8 2.1 0.0 0.0 0.0 0.0 0.0 0.0 1.1 0.0METHYL P 0.0 1.6 0.0 0.0 0.0 0.0 0.0 0.0 0.0 0.0 0.0DIMECRON 0.0 0.0 0.0 0.0 0.0 0.0 0.0 1.4 0.0 0.0 0.0DIAZINON 0.0 0.0 0.0 0.0 0.0 0.0 0.0 0.0 0.0 0.0 30.0
OTHER
OD (

ANNEX 16Table 4
PAKISTAN
SALINITY CONTROL AND RECLAMATION PROJECT (SCARP) VI
AGRICULTURAL DATA: UNIT V (189000.00 HECTARE)
RICE COTTON MAIZE MILLETS KHAR FOD WHEAT RABI PUL OILSEED RABI FOD SUGAR CA OTH PERE
PRESENT
CROP PAT % 1.0 26.0 2.0 3.0 9.0 31.0 1.0 10.0 8.0 6.0 2.0YIELD (T/HA) 1.9 1.0 1.0 0.7 26.0 1.5 0.6 0.5 25.0 34.5 4.0SEED REQ (KG/HA) 22.0 17.0 29.0 9.0 11.0 77.0 6.0 2.0 2.0 5500.0 0.0FERT REQ (KG/HA)NITROGEN 33.0 55.0 0.0 0.0 0.0 50.0 0.0 0.0 0.0 50.0 0-.PHOSPHATE 0.0 7.5 0.0 0.0 0.0 7.5 0.0 0.0 0.0 0.0 0.0POTASSIUM 0.0 0.0 0.0 0.0 0.0 0.0 0.0 0.0 0.0 0.0 0.0
PESTICIDE (KG/HA)ENDRIN 1.4 2.8 0.0 0.0 0.0 0.0 0.0 0.0 0.0 0.0 0.0METHYL P 0.0 1.6 0.0 0.0 0.0 0.0 0.0 0.0 0.0 0.0 0.0DIMECRON 0.0 0.0 0.0 0.0 0.0 0.0 0.0 0.0 0.0 0.0 0.0DIAZINON 0.0 0.0 0.0 0.0 0.0 0.0 0.0 0.0 0.0 0.0 30.0
OTHER
FUTURE WITHOUT PROJECT
CROP PAT % 3.0 22.0 2.0 4.0 9.0 26.0 5.0 11.0 8.0 6.0 2.0YIELD (T/HA) 1.9 1.4 1.0 0.7 28.0 2.0 0.6 0.6 30.0 40.0 5.0SEED REQ (KG/HA) 22.0 17.0 29.0 9.0 11.0 77.0 6.0 2.0 2.0 5500.0 C.0FERT REQ (KG/HA)NITROGEN 33.0 55.0 0.0 0.0 0.0 55.0 0.0 0.0 0.0 110.0 0.0PHOSPHATE 0.0 7.5 0.0 0.0 0.0 15.0 0.0 0.0 0.0 55.0 0.0POTASSIUM 0.0 0.0 0.0 0.0 0.0 0.0 0.0 0.0 0.0 0.0 0.0
PESTICIDE (KG/HA)ENDRIN 1.4 2.8 0.0 0.0 0.0 0.0 0.0 0.0 0.0 0.0 0.0METHYL P 0.0 1.6 0.0 0.0 0.0 0.0 0.0 0.0 0.0 0.0 0.0DIMECRON 0.0 0.0 0.0 0.0 0.0 0.0 0.0 0.0 0.0 0.0 0.0DIAZINON 0.0 0.0 0.0 0.0 0.0 0.0 0.0 0.0 0.0 0.0 30.0
OTHER
FUTURE WITH PROJECT
CROP PAT % 2.0 30.0 3.0 6.0 8.0 35.0 2.0 10.0 7.0 7.0 4.0YIELD (T/HA) 2.5 1.6 1.8 0.8 37.0 2.2 0.7 0.7 37.0 46.0 5.0SEED REQ (KG/HA) 22.0 17.0 29.0 9.0 11.0 77.0 6.0 2.0 2.0 6400.0 0.0FERT REQ (KG/HA)
NITROGEN 50.0 55.0 50.0 20.0 30.0 75.0 0.0 25.0 10.0 110.0 30.0PHOSPHATE 10.0 20.0 10.0 0.0 0.0 30.0 0.0 0.0 30.0 55.0 10.0POTASSIUM 20.0 0.0 20.0 0.0 0.0 0.0 0.0 0.0 0.0 30.0 10.0
PESTICIDE (KG/HA)ENDRIN 1.4 2.8 2.1 0.0 0.0 0.0 0.0 0.0 0.0 0.0 0.0METHYL P 0.0 1.6 0.0 0.0 0.0 0.0 0.0 0.0 0.0 0.0 0.0DIMECRON 0.0 0.0 0.0 0.0 0.0 0.0 0.0 1.4 0.0 0.0 0.0DIAZINON 0.0 0.0 0.0 0.0 0.0 0.0 0.0 0.0 0.0 0.0 30.0
OTHER
- -I X

ANNEX 16
PAKISTANSALINITY CONTROL AND RECLAMATION PROJECT (SCARP) VI
FINANCIAL CROP BUDGET - UNIT II(PER HECTARE)
GROSS -------- INPUT COSTS------- COST NET LABOR ANIMAAL
CROP YIELD PRICE VALUE SEED FERTILIZER PESTICIDE OTHER TOTAL VALUE REQ REQ
(T/HA) ( RS) P RS) RS) ( RS) ( RS) ( RS) ( RS) ( RS) (DAYS) (DAYS)PRESENT
RICE 1.9 970.0 1843.0 33.0 105.6 16.6 0.0 155.2 1687.8 65.0 22.0
COTTON 1.0 3200.0 3200.0 59.5 196.4 66.2 0.0 322,1 2877.9 89.0 25.0
MAIZE 1.0 1330.0 1330.0 40.6 0.0 0.0 0.0 40.6 1289.4 47.0 10.0
MILLETS 0.7 3750.0 2437.5 12.6 0.0 0.0 0.0 12.6 2424.9 27.0 8.0
KHAR FOD 26.0 27.0 702.0 59.4 0.0 0.0 0.0 59.4 642.6 10.0 6.0
WHEAT 1.2 1195.0 1374.2 92.4 148.4 0.0 0.0 240.8 1133.4 43.0 24.0
RABI PULSE 0.6 1470.0 882.0 9.0 0.0 0.0 0.0 9.0 873.0 22.0 5.0
OILSEED 0.5 2560.0 1280.0 5.3 0.0 0.0 0.0 5.3 1274.7 24.0 10.0
RABI FOD 25.0 27.0 675.0 10.8 0.0 0.0 0.0 10.8 664.2 42.0 11.0
SUGAR CANE 33.0 145.0 4785.0 825.0 160.0 0.0 _ 3C^^ ^ 3,.u '4.0
nTH PFPeN 048UU. O.0 0.0 255.4 0.0 255.4 4544.6 300.0FUTURE WITHOUT PROJECT
RICE 1.9 1375.0 2612.5 44.0 123.8 16.6 0.0 184.4 2428.1 65.0 22.0
COTTON 1.4 3010.0 4214.0 59.5 228.8 66.2 0.0 354.4 3859.6 89.0 25.0
MAIZE 1.0 1490.0 1490.0 63.8 0.0 0.0 0.0 63.8 1426.2 47.0 10.0
MILLETS 0.7 2600.0 1690.0 18.0 0.0 O.D 0.0 18.0 1672.0 27.0 8.0
KHAR FOD 28.0 27.0 756.0 59.4 0.0 0.0 0.0 59.4 696.6 10.0 6.0
WHEAT 1.5 1335.0 2002.5 138.6 210.0 0.0 0.0 348.6 1653.9 43.0 24.0
RABI PULSE 0.6 1470.0 882.0 9.0 0.0 0.0 0.0 9.0 873.0 22.0 5,0
OILSEED 0.5 2520.0 1260.0 6.2 0.0 0.0 0.0 6.2 1253.8 24.0 10.0
RABI FOD 29.0 27.0 783.0 10.8 0.0 0.0 0.0 10.8 772.2 42.0 11.0
S'JGAR CANE 35.0 225.0 7875.0 990.0 187.5 0.0 0.0 i177.5 6697.5 137.0 47.0
OTH PEREN 4.0 1200.0 4800.0 0.0 0.0 255.4 0.0 255.4 4S44.6 300.0 12.0FUTURE WITH PROJECT
RICE 2.5 1375.0 3437.5 44.0 241.5 16.6 0.0 302.1 3135.4 86.0 33.0
COTTON 1.6 3010.0 4816.0 59.5 266.3 66.2 0.0 391.9 4424.1 121.0 33.0
MAIZE 1.8 1490.0 2682.0 63.8 241.5 24.9 0.0 330.2 2351.8 68.0 22.0MILLETS 0.8 2600.0 2080.0 18.0 75.0 0.0 0.0 93.0 1987.0 33.0 14.0
KHAR FOo 37.0 27.0 999.0 59.4 1t2.5 0.0 0.0 171,9 827.1 16.0 10.0
WHEAT 2.2 1335.0 2937.0 138.6 371.3 0.0 0.0 509.9 2427.1 56.0 31.0
RABI PULSE 0.7 1470.0 1029.0 9.0 0.0 0.0 0.0 9.0 1020.0 25.0 10.0
OILSEEO 0.7 2520.0 1864.8 6.2 93.8 68.3 0.0 168.3 1696.5 30.0 19.0
RABI FOo 37.0 27.0 999.0 10.8 127.5 0.0 0.0 138.3 860.7 52.0 14.0
SUGAR CANE 46.0 225.0 10350.0 1152.0 613.5 0.0 0.0 1765.5 8584.5 161.0 59.0
OTH PEREN 5.0 1200.0 6000.0 0.0 154.5 255.4 0.0 409.9 5590.1 300.0 12.0co
(n

ANNEX 16Table 6
PAKISTAN
SALINITY CONTROL AND RECLAMATION PROJECT (SCARP) VI
ECONOMIC CROP BUD"G - UNT II(PIR HECTARE)
GROSS ---- --- INPUT COSTS - COli NET LABOR ANIMALCROP YIELD PRICE VALUE SEED FERTILIZER PESTICIDE OTHER TOTAL VALUE REQ REQ
(T/HA) RS) ( RS) ( RS) ( RS) ( RS) ( RS) ( RS) C RS) (DAYS) (DAYS)
PRESENT
RICE 1.9 1125.0 2137.5 29.7 108.9 18.2 0.0 156.8 1980.7 65.0 22.0COTTON 1.0 4810.0 4810.0 85.0 202.1 72.6 0.0 359.7 4450.3 89.0 25.0MAIZE 1.0 1510.0 1510.0 49.3 0.0 0.0 0.0 49.3 1460.7 47.0 10.0MILLETS 0.7 4660.0 3029.0 16.7 0.0 0.0 0.0 16.7 3012.4 27.0 8.0KHAR FOD 26.0 35.0 910.0 59.4 0.0 0.0 0.0 59.4 850.6 10.0 6.0WHEAT 1.2 1530.0 1759.5 138.6 152.b 0.0 0.0 291.2 1468.3 43.0 24.0RABI PULSE 0.6 1760.0 1056.0 9.0 0.0 0.0 0.0 9.0 1047.0 22.0 5.0OILSEED 0.5 1919.0 959.5 7.3 0.0 0.0 0.0 7.3 952.2 24.0 10.0RABI FO0 25.0 35.0 875.0 10.8 0.0 0.0 0.0 10.8 964.2 42.0 11.0SUGAR CANE 33.0 145.0 4785.0 979.0 165.0 0.0 0.0 1144.0 3641.0 137.0 47.0OTH PEREN 4.0 1500.0 6000.0 0.0 0.0 282.0 0.0 282.0 5718.0 300.0 12.0
FUTURE WITHOUT PROJECT
RICE 1.9 1590.0 3021.0 50.6 130.4 18.2 0.0 199.1 2821.9 65.0 22.0COTTON 1.4 4525.0 6335.0 85.0 242.4 79.6 0.0 400.0 5935.0 89.0 25.0MAIZE 1.0 1690.0 1690.0 69.6 0.0 0.0 0.0 69.6 1620.4 47.0 10.0MILLETS 0.7 3195.0 2076.8 19.8 0.0 0.0 0.0 19.8 2057.0 27.0 8.0KHAR FOD 28.0 35.0 980.0 59.4 0.0 0.0 0.0 59.4 920.6 10.0 6.0WHEAT 1.5 1710.0 2565.0 169.4 222.6 0.0 0.0 392.0 2173.0 43.0 24.0RABI PULSE 0.6 1760.0 1056.0 9.0 0.0 0.0 0.0 9.0 1047.0 22.0 5.0OILSEED 0.5 2520.0 1260.0 9.4 0.0 0.0 0.0 9.4 1250.6 24.0 10.0RABI FOD 29.0 35.0 1015.0 10.8 0.0 0.0 0.0 10.8 1004.2 42.0 11.0SUGAR CANE 35.0 225.0 7875.0 1045.0 197.5 0.0 0.0 1242.5 6632.5 137.0 41.0OTH PEREN 4.0 1500.0 6000.0 0.0 0.0 282.0 0.0 282.0 5718.0 300.0 12.0
FUTURE WITH PROJECT
RICE 2.5 1590.0 3975.0 50.6 257.0 18.2 0.0 325.8 3649.2 86.0 33.0COTTON 1.6 4525.0 7240.0 85.0 284.3 72.6 0.0 441.8 6798.2 121.0 33.0MAIZE 1.8 1690.0 3042.0 69.6 257.0 27.3 0.0 353.9 2688.1 68.0 22.0MILLETS 0.8 3195.0 2556.0 19.8 79.0 0.0 0.0 98.8 2457.2 33.0 14.0KHAR FOD 37.0 35.0 1295.0 59.4 118.5 0.0 0.0 177.9 1117.1 16.0 10.0WHEAT 2.2 1710.0 3762.0 169.4 396.8 0.0 0.0 566.2 3195.8 56.0 31.0RABI PULSE 0.7 1760.0 1232.0 9.0 0.0 0.0 0.0 9.0 1223.0 25.0 10.0OILSEED 0.7 2520.0 1864.8 9.4 98.8 75.3 0.0 183.4 1661.4 30.0 19.0RABI FOD 37.0 35.0 1295.0 10.8 140.0 0.0 0.0 150.8 1144.2 52.0 14.0SUGAR CANE 46.0 225.0 10350.0 1216.0 657.8 0.0 0.0 1873.8 8476.3 161.0 59.0 HOTH PEREN 5.0 1500.0 7500.0 0.0 165.0 282.0 0.0 447.0 7053.0 300.0 12.0
00 ~ ~ ~ ~ ~ ~ ~ ~ ~ ~ ~ ~ ~ ~ ~ ~ ~ ~ ~~~~~~~~~~~~~~~~~0O
I-'~~~~~~~~~~~~~~~~~~~~~~~~
I,

ANNEX 16Table 7
PAKISTAN
SALINITY CONTROL AND RECLAMATION PROJECT (SCARP) VIFINANCIAL CROP BUDGET - UNIT III
(PER HECTARE)
GROSS --------- INPUT COSTS- --- COST NET LABOR ANIMALCROP YIELD PRICE VALUE SEED FERTILIZER PESTICIDE OTHER TOTAL VALUE REQ REQ(T/HA) ( RS) ( RS) ( RS) RS) ( RS) ( RS) ( RS) ( RS) (DAYS) (DAYS)PRESENT
RICE 1.9 970.0 1843.0 33.0 105.6 16.6 0.0 155.2 1687.8 65.0 22.0COTTON 1.0 3200.0 3200.0 59.5 196.4 66.2 0.0 322.1 2877.9 89.0 25.0MAIZE 1.0 1330.0 1330.0 40.6 0.0 0.0 0.0 40.6 1289.4 47.0 10.0MILLETS 0.7 3750.0 2437.5 12.6 0.0 0.0 0.0 12.6 2424.9 27.0 8.0KHAR FOD 28.0 27.0 756.0 59.4 0.0 0.o 0.0 59.4 696.6 10.0 6.0WHEAT 1.2 1195.0 1374.2 92.4 148.4 0.0 0.0 240.8 1133.4 43.0 24.0RABI PULSE 0.6 1470.0 882.0 9.0 0.0 0.0 0.0 9.0 873.0 22.0 5.0OILSEED 0.5 2560.0 1280.0 5.3 0.0 0.0 0.0 5.3 1274.7 24.0 10.0RABI FOD 25.0 27.0 675.0 10.8 0.0 0.0 0.0 10.8 664.2 42.0 47.0SUGAR CANE 33.0 145.0 4785.0 825.0 160.0 0.0 0.0 985.0 3800.0 137.0 47.0OTH PEREN 4.0 1200.0 4800.0 0.0 0.0 255.4 0.0 255.4 4r44.4 6 300 0 12-0FUTURE WITHOUT PROJECT
RICE 2.2 1375.0 3025.0 44.0 150.0 13.1 0.0 207.1 2817.9 69.0 26.0COTTON 1.4 3010.0 4214.0 59.5 210.0 33.2 0.0 302.7 3911.3 96.0 27.0MAIZE 1.3 1490.0 1937.0 63.8 112.5 0.0 0.0 176.3 1760.7 55.0 13.0MILLETS 0.8 2600.0 2080.0 18.0 75.0 0.0 0.0 93.0 1987.0 27.0 9.0KHAR FOD 34.0 27.0 918.0 59.4 75.0 0.0 0.0 134.4 783.6 10.0 7.0WHEAT 1.5 1335.0 2002.5 138.6 210.0 0.0 0.0 348.6 1653.9 48.0 26.0RABI PULSE 0.6 1470.0 882.0 9.0 0.0 0.0 0.0 9.0 873.0 22.0 g.0OILSEED 0.6 2520.0 1512.0 6.2 0.0 68.3 0.0 74.5 1437.5 26.0 15.0RABI FOD 34.0 27.0 918.0 10.8 0.0 0.0 0.0 10.8 907.2 45.0 11.0SUGAR CANE 40.0 225.0 9000.0 1152.0 577.5 0.0 0.0 1729.5 7270.5 82.0 52.0OTH PEREN 4.0 1200.0 4800.0 0.0 0.0 255.4 0.0 255.4 4544.6 300.0 12.0FUTURE WITH PROJECT
RICE 2.5 1375.0 3437.5 44.0 241.5 16.6 0.0 302.1 3135.4 86.0 33.0COTTON 1.6 3010.0 4816.0 59.5 266.3 66.2 0.0 391.9 4424.1 121.0 33.0MAIZE 1.8 1490.0 2682.0 63.8 241.5 24.9 0.0 330.2 2351.8 68.0 22.0MILLETS 0.8 2600.0 20Bo.0 18.0 75.0 0.0 0.0 93.0 1987.0 33.0 14.0KHAR FOD 37.0 27.0 999.0 59.4 112.5 0.0 0.0 171.9 827.1 16.0 10.0WHEAT 2.2 1335.0 2937.0 13B.6 371.3 0.0 0.0 509.9 2427.1 56.0 31.0RABI PULSE 0.7 1470.0 1029.0 9.0 0.0 0.0 0.0 9.0 1020.0 25.0 10.0OILSEED 0.7 2520.0 1864.8 6.2 93.8 68.3 0.0 168.3 1696.5 30.0 19.0RABI FOD 37.0 27.0 999.0 10.8 127.5 0.0 0.0 138.3 860.7 52.0 14.0SUGAR CANE 46.0 225.0 10350.0 1152.0 613.5 13.1 0.0 1778.6 8571.4 161.0 59.0OTH PEREN 5.0 1200.0 6000.0 0.0 154.5 255.4 0.0 409.9 5590.1 300.0 12.0
-PI
m~

ANNEX 16Table 8
PAKISTAN
SALINITY CONTROL AND RECLAMATION PROJECT (SCARP) VIECONOMIC CROP BUGET.- IV"T III
(PER HECTARE)
GROSS --- INPUT COSTS-- - _ COST MIT LABOR ANIMALCROP YIELD PRICE VALUE SEED FERTILIZER PESTICIDE OTHER TOTAL VALUE REO REQ
(T/HA) ( RSI ( RS) ( RS) ( RS) ( RS) ( RS) ( RS) ( RS) (DAYS) (DAYS)
PRESENT
RICE 1.9 1125.0 2137.5 29.7 108.9 18.2 0.0 156.8 1900.7 65.0 22.0COTTON 1.0 4810.0 4810.0 85.0 202.1 72.6 0.0 359.7 4450.3 89.0 25.0MAIZE 1.0 1510.0 1510.0 49.3 0.0 0.0 0.0 49.3 1460.7 47.0 10.0MILLETS 0.7 4660.0 3029.0 16.7 0.0 0.0 0.0 16.7 3012.4 27.0 8.0KHAR FOD 28.0 35.0 980.0 59.4 0.0 0.0 0.0 59.4 920.6 10.0 6.0WHEAT 1.2 1530.0 1759.5 138.6 152.6 0.0 0.0 291.2 1469.3 43.0 24.0RABI PULSE 0.6 1760.0 1056.0 9.0 0.0 0.0 0.0 9.0 1047.0 22.0 S.0OILSEED 0.5 1919.0 959.5 7.3 0.0 0.0 0.0 7.3 952.2 24.0 10.0RABI FOD 25.0 35.0 875.0 10.8 0.0 0.0 0.0 10.8 864.2 42.0 11.0SUGAR CANE 33.0 145.0 4785.0 979.0 165.0 0.0 0.0 1144.0 3641.0 137.0 47.0OTH PEREN 4.0 1500.0 6000.0 0.0 0.0 282.0 0.0 282.0 5718.0 300.0 12.0
FUTURE WITHOUT PROJECT
RICE 2.2 1590.0 3498.0 50.6 158.0 14.3 0.0 222.9 3275.1 69.0 26.0COTTON 1.4 4525.0 6335.0 85.0 222.6 36.4 0.0 344.0 5991.0 56.0 27.0MAIZE 1.3 1690.0 2197.0 69.6 118.5 0.0 0.0 188.1 2008.9 55.0 13.0MILLETS 0.8 3195.0 2556.0 19.8 79.0 0.0 0.0 98.8 2457.2 27.0 8.0KHAR FOD 34.0 35.0 1190.0 59.4 79.0 0.0 0.0 138.4 1051.6 10.0 7.0WHEAT 1.5 1710.0 2565.0 169.4 222.6 0.0 0.0 392.0 2173.0 48.0 26.0RABI PULSE 0.6 1760.0 1056.0 9.0 0.0 0.0 0.0 9.0 1047.0 22.0 9.0OILSEED 0.6 2520.0 1512.0 9.4 0.0 75.3 0.0 84.7 1427.3 26.0 15.0RABI FOD 34.0 35.0 1190.0 10.8 0.0 0.0 0.0 10.8 1179.2 45.0 11.0SUGAR CANE 40.0 225.0 9000.0 1216.0 618.8 0.0 0.0 1834.8 7165.3 82.0 52.0OTH PEREN 4.0 1500.0 6000.0 0.0 0.0 282.0 0.0 282.0 5718.0 300.0 12.0
FUTURE WITH PROJECT
RICE 2.5 1590.0 3975.0 50.5 257.0 18.2 0.0 325.8 3649.2 86.0 33.0COTTON 1.6 4525.0 7240.0 85.0 284.3 72.6 0.0 441.8 6798.2 121.0 33.0MAIZE 1.8 1690.0 3042.0 69.6 257.0 27.3 0.0 353.9 2688.1 68.0 22.0MILLETS 0.8 3195.0 2556.0 19.8 79.0 0C0 0.0 98.8 2457.2 33.0 14.0KHAR FOD 37.0 35.0 1295.0 59.4 118.5 0.0 0.0 177.9 1117.1 16.0 10.0WHEAT 2.2 1710.0 3762.0 169.4 396.B 0.0 0.0 566.2 3195.8 56.0 31.0RABI PULSE 0.7 1760.0 1232.0 9.0 0.0 0°0 0.0 9.0 1223.0 25.0 10.0OILSEED 0.7 2520.0 1864.8 9.4 98.8 75.3 0.0 183.4 1681.4 30.0 19.0RABI FOO 37.0 35.0 1295.0 10.8 140.0 0.0 0.0 150.8 1144.2 52.0 14.0SUGAR CANE 46.0 225.0 10350.0 1216.0 657.8 14.3 0.0 1888.1 8462.0 161.0 59.0 -OTH PEREN 5.0 1500.0 7500.0 0.0 165.0 282.0 0.0 447.0 7053.0 300.0 12.0
cc

ANNEX 16Table 9
PAKISTAN
SALINITY CONTROL AND RECLAMATION PROJECTS (SCARF) VIFINANCIAL CROP BUDGET - UWIT IV
(PER HECTARE)
GROSS --- INPUT COSTS---- -- --- COST NET LABOR ANIMALCROP YIELD PRICE VALUE SEED FERTILIZER PESTICIDE OTHER TOTAL VALUE REQ REQ
(T/HA) ( RS) RS) ( RS) ( RS) ( RS) ( RS) ( RS) RS) (DAYS) (DAYS)
PRESENT
RICE 1.9 970.0 1843.0 33.0 105.6 16.6 0.0 155.2 1687.8 65.0 22.0COTTON 1.0 3200.0 3200.0 59.5 196.4 66.2 0.0 322.1 2877.9 89.0 25.0MAIZE 1.0 1330.0 1330.0 40.6 0.0 0.0 0.0 40.6 1289.4 47.0 10.0MILLETS 0.7 3750.0 2437.5 12.6 0.0 0.0 0.0 12.6 2424.9 27.0 8.0KHAR FOD 28.0 27.0 756.0 59.4 0.0 0.0 0.0 59.4 696.6 10.0 6.0WHEAT t.5 1195.0 1792.5 92.4 180.4 0.0 0.0 272.8 1519.7 43.0 24.0RABI PULSE 0.6 1470.0 882.0 9.0 0.0 0.0 0.0 9.0 873.0 22.0 5.0OILSEED 0.5 2560.0 1280.0 5.3 0.0 0.0 0.0 5.3 1274.7 24.0 10.0RABI FOD 25.0 27.0 675.0 10.8 0.0 0.0 0.0 10.8 664.2 42.0 11.0SUGAR CANE 34.5 145.0 5002.5 825.0 160.0 0.0 0.0 985.0 4017.5 137.0 47.0OTH PEREN 4.0 1200.0 4800.0 0.0 0.0 255.4 0.0 255.4 4544.6 300.0 12.0
FUTURE WITHOUT PROJECT
RICE 2.2 1375.0 3025.0 44.0 150.0 13.1 0.0 207.1 2817.9 69.0 26.0COTTON 1.4 3010.0 4214.0 59.5 228.8 33.2 0.0 321.5 3892.5 96.0 27.0MAIZE 1.3 1490.0 1937.0 63.8 112.5 0.0 0.0 176.3 1760.7 55.0 13.0MILLETS 0.8 2600.0 2080.0 18.0 75.0 0.0 0.0 93.0 1987.0 27.0 8.0KHAR FOD 34.0 27.0 918.0 59.4 75.0 0.0 0.0 134.4 783.6 10.0 7.0WHEAT 2.0 1335.0 2670.0 138.6 251.3 0.0 0.0 389.9 2280.2 48.0 26.0RABI PULSE 0.6 1470.0 882.0 9.0 0.0 0.0 0.0 9.0 873.0 22.0 9.0OILSEED 0.6 2520.0 1512.0 6.2 0.0 0.0 0.0 6.2 1505.8 26.0 15.0RABI FOD 30.0 27.0 810.0 10.8 0.0 0.0 0.0 10.8 799.2 45.0 11.0SUGAR CANE 40.0 225.0 9000.0 1152.0 577.5 0.0 0.0 1729.5 7270.5 82.0 52.0OTH PEREN 5.0 1200.0 6000.0 0.0 0.0 255.4 0.0 255.4 5744.6 300.0 12.0
FUTURE WITH PROJECT
RICE 2.5 1375.0 3437.5 44.0 241.5 16.6 0.0 302.1 3135.4 86.0 33.0COTTON 1.6 3010.0 4816.0 59.5 266.3 66.2 0.0 391.9 4424.1 121.0 33.0MAIZE 1.8 1490.0 2682.0 63.8 241.5 24.9 0.0 330.2 2351.8 68.0 22.0MILLETS 0.8 2600.0 2080.0 18.0 75.0 0.0 0.0 93.0 1987.0 33.0 14.0KHAR FOD 37.0 27.0 999.0 59.4 112.5 0.0 0.0 171.9 827.1 16.0 10.0WHEAT 2.2 1335.0 2937.0 138.6 371.3 0.0 0.0 509.9 2427.1 56.0 31.0RABI PULSE 0.7 1470.0 1029.0 9.0 0.0 0.0 0.0 9.0 1020.0 25.0 10.0OILSEED 0.7 2520.0 1864.8 6.2 93.8 68.3 0.0 168.3 1696.5 30.0 19.0RABI FOD 37.0 27.0 999.0 10.8 127.5 0.0 0.0 138.3 860.7 52.0 14.0SUGAR CANE 46.0 225.0 10350.0 1152.0 613.5 13.1 0.0 1778.6 8571.4 161.0 59.0OTH PEREN 5.0 1200.0 6000.0 0.0 154.5 255.4 0.0 409.9 5590.1 300.0 12.0
0'ar
%0 (7

ANNEX 16Table i0
PAKISTAN F- -SALINITY CONTROL AND RECLAMATION PROJECT (SCARP) VI
ECONOMIC CROP BUDGET - UNIT IV(PER HECTARE)
GROSS ----- INPUT COSTS-------- C-ST NET LABOR ANIMALCROP YIELD PRICE VALUE SEED FERTILIZER PESTICIDE OTHER 'A, VALUE REQ REQ
(T/HA) ( RS) ( RS) ( RS) ( RS) ( RS) ( RS) ( RS) ( RS) (DAYS) (DAYS)
PRESENT
RICE 1.9 1125.0 2137.5 29.7 108.9 18.2 0.0 156.8 1980.7 65.0 22.0COTTON 1.0 4810.0 4810.0 85.0 202.1 72.6 0.0 359.7 4450.3 89.0 25.0MAIZE 1.0 1510.0 1510.0 49.3 0.0 0.0 0.0 49.3 1460.7 47.0 10.0MILLETS 0.7 4660.0 3029.0 16.7 0.0 0.0 0.0 16.7 3012.4 27.0 8.0KHAR FOD 28.0 35.0 980.0 59.4 0.0 0.0 0.0 59.4 920.6 10.0 6.0WHEAT 1.5 1530.0 2295.0 138.6 185.6 0.0 0.0 324.2 1970.8 43.0 24.0RABI PULSE 0.6 1760.0 1056.0 9.0 0.0 0.0 0.0 9.0 1047.0 22.0 5.0OILSEED 0.5 1919.0 959.5 7.3 0.0 0.0 0.0 7.3 952.2 24.0 10.0RABI FOD 25.0 35.0 875.0 10.8 0.0 0.0 0.0 10.8 864.2 42.0 11.0SUGAR CANE 34.5 145.0 5002.5 979.0 165.0 0.0 0.0 1144.0 3858.5 137.0 47.0OTH PEREN 4.0 1500.0 6000.0 0.0 0.0 282.0 0.0 282.0 5718.0 300.0 12.0
FUTURE WITHOUT PROJECT
RICE 2.2 1590.0 3498.0 50.6 158.0 14.3 0.0 222.9 3275.1 69.0 26.0COTTON 1.4 4525.0 6335.0 85.0 242.4 36.4 0.0 363.8 5971.2 96.0 27.0MAIZE 1.3 1690.0 2197.0 69.6 118.5 0.0 0.0 188.1 2008.9 55.0 13.0MILLETS 0.8 3195.0 2556.0 19.8 79.0 0.0 0.0 98.8 2457.2 27.0 8.0KHAR FOD 34.0 35.0 1190.0 59.4 79.0 0.0 0.0 138.4 1051.6 10.0 7.0WHEAT 2.0 1710.0 3420.0 169.4 267.5 0.0 0.0 436.9 2983.1 48.0 26.0RABI PULSE 0.6 1760.0 1056.0 9.0 0.0 0.0 0.0 9.0 1047.0 22.0 9.0OILSEED 0.6 2520.0 1512.0 9.4 0.0 0.0 0.0 9.4 1502.6 26.0 15.0RABI FOO 30.0 35.0 1050.0 10.8 0.0 0.0 0.0 10.8 1039.2 45.0 11.0SUGAR CANE 40.0 225.0 9000.0 1216.0 618.8 0.0 0.0 1834.8 7165.3 82.0 52.0OTH PEREN 5.0 1500.0 7500.0 0.0 0.0 282.0 0.0 282.0 7218.0 300.0 12.0
FUTURE WITH PROJECT
RICE 2.5 1590.0 3975.0 50.6 257.0 18.2 0.0 325.8 3649.2 86.0 33.0COTTON 1.6 4525.0 7240.0 85.0 284.3 72.6 0.0 441.8 6798.2 121.0 33.0MAIZE 1.8 1690.0 3042.0 69.6 257.0 27.3 0.0 353.9 2688.1 68.0 22.0MILLETS 0.8 3195.0 2556.0 19.8 79.0 0.0 0.0 98.8 2457.2 33.0 14.0KHAR FOD 37.0 35.0 1295.0 59.4 118.5 0.0 0.0 177.9 1117.1 16.0 10.0WHEAT 2.2 1710.0 3762.0 169.4 396.8 0.0 0.0 566.2 3195.8 56.0 31.0RABI PULSE 0.7 1760.0 1232.0 9.0 0.0 0.0 0.0 9.0 1223.0 25.0 10.0OILSEED 0.7 2520.0 1864.8 9.4 98.8 75.3 0.0 183.4 1681.4 30.0 19.0RABI FOD 37.0 35.0 1295.0 10.8 140.0 0.0 0.0 150.8 1144.2 52.0 14.0SUGAR CANE 46.0 225.0 10350.0 1216.0 657.8 14.3 0.0 1888.1 8462.0 161.0 59.0OTH PEREN 5.0 1500.0 7500.0 0.0 165.0 282.0 0.0 447.0 7053.0 300.0 12.0 H 3
I-'~~~~~~~~~~~~~~~~~~~~~~~~~~~~~~~~~~~~~~~~~~~~~~~~~~~~~~~~~~~~~~~~~~~~~~~~c
OD (DH

ANNEX 16Table 11
PAKISTAN
SALINITY CONTROL AND RECLAMATION PROJECT (SCARP) VIFINANCIAL COOP BUOGT - UNIT V
(PER HECTARE)
GROSS ---- INPUT COSTS--- --- COST NET LABOR ANIMALCROP YIELD PRICE VALUE SEED FERTILIZER PESTICIDE OTHER TOTAL VALUE REQ REQ
(T/HA) ( RS) ( RS) ( RS) ( RS) ( RS) ( RS) ( RS) ( RS) (DAYS) (DAYS)
PRESENT
RICE 1.9 970.0 1843.0 33.0 105.6 16.6 0.0 155.2 1687.8 65.0 22.0COTTON 1.0 3200.0 3200.0 59.5 196.4 66.2 0.0 322.1 2877.9 89.0 25.0MAIZE 1.0 1330.0 1330.0 40.6 0.0 0.0 0.0 40.6 1289.4 47.0 10.0MILLETS 0.7 3750.0 2437.5 12.6 0.0 0.0 0.0 12.6 2424.9 27.0 8.0KHAR FOD 26.0 27.0 702.0 59.4 0.0 0.0 0.0 59.4 642.6 10.0 6.0WHEAT 1.5 1195.0 1792.5 92.4 180.4 0.0 0.0 272.8 1519.7 43.0 24.0RABI PULSE 0.6 1470.0 882.0 9.0 0.0 0.0 0.0 9.0 873.0 22.0 5.0OILSEED 0.5 2560.0 1280.0 5.3 0.0 0.0 0.0 5.3 1274.7 24.0 10.0RABI FOD 25.0 27.0 675.0 10.8 0.0 0.0 0.0 10.8 664.2 42.0 11.0SUGAR CANE 34.5 145.0 5002.5 825.0 160.0 0.0 n o 9RS-n 'n7 5 137-0 47.0OTH PEREN 4.0 1200.0 4800.0 0.0 0.0 255.4 0.0 255.4 4544.6 300.0 12.0
FUTURE WITHOUT PROJECT
RICE 1.9 1375.0 2612.5 44.0 123.8 16.6 0.0 184.4 2428.1 65.0 22.0COTTON 1.4 3010.0 4214.0 59.5 228.8 66.2 0.0 354.4 3859.6 89.0 25.0MAIZE 1.0 1490.0 1490.0 63.8 0.0 0.0 0.0 63.8 1426.2 47.0 10.0MILLETS 0.7 2600.0 1690.0 18.0 0.0 0.0 0.0 18.0 1672.0 27.0 8.0KHAR FOD 28.0 27.0 756.0 59.4 0.0 0.0 0.0 59.4 696.6 10.0 6.0WHEAT 2.0 1335.0 2670.0 138.6 251.3 0.0 0.0 389.9 2280.2 43.0 24.0RABI PULSE 0.6 1470.0 882.0 9.0 0.0 0.0 0.0 9.0 873.0 22.0 5.0OILSEED 0.6 2520.0 1512.0 6.2 0.0 0.0 0.0 6.2 1505.8 24.0 10.0RABI FQD 30.0 27.0 810.0 10.8 0.0 0.0 0.0 10.8 799.2 42.0 11.0SUGAR CANE 40.0 225.0 9000.0 990.0 577.5 0.0 0.0 1567.5 7432.5 137.0 47.0OTH PEREN 5.0 1200.0 6000.0 0.0 0.0 255.4 0.0 255.4 5744.6 300.0 12.0
FUTURE WITH PROJECT
RICE 2.5 1375.0 3437.5 44.0 241.5 16.6 0.0 302.1 3135.4 86.0 33.0COTTON 1.6 3010.0 4816.0 59.5 266.3 66.2 0.0 391.9 4424.1 121.0 33.0MAIZE 1.8 1490.0 2682.0 63.8 241.5 24.9 0.0 330.2 2351.8 68.0 22.0MILLETS 0.8 2600.0 2080.0 18.0 75.0 0.0 0.0 93.0 1987.0 33.0 14.0KHAR FOD 37.0 27.0 999.0 59.4 112.5 0.0 0.0 171.9 827.1 16.0 10.0WHEAT 2.2 1335.0 2937.0 138.6 371.3 0.0 0.0 509.9 2427.1 56.0 31.0RABI PULSE 0.7 1470.0 1029.0 9.0 0.0 0.0 0.0 9.0 1020.0 25.0 10.0OILSEED 0.7 2520.0 1864.8 6.2 93.8 68.3 0.0 168.3 1696.5 30.0 19.0RABI FOD 37.0 27.0 999.0 10.8 127.5 0.0 0.0 138.3 860.7 52.0 14.0SUGAR CANE 46.0 225.0 10350.0 1152.0 613.5 0.0 0.0 1765.5 8584.5 161.0 59.0OTH PEREN 5.0 1200.0 6000.0 0.0 154.5 255.4 0.0 409.9 5590.1 300.0 12.0
Q~~~~~~~~~~~~~~~~~~~~~~~~~ z

PAKISTAN ANNEX 16SALINITY CONTROL AND RECLAMATION PROJECT (SCARP) VI Table 12
ECONOMIC CROP BUDGET - UNIT V(PER HECTARE)
GROSS --------- INPUT COSTS-- --- COST NfT LABOR ANIMALCROP YIELD, PRICE VALUE SEED FERTILIZER PESTICIDE OTHER TOTAL VALUE REQ REQ
(T/HA) ( RS) ( RS) ( RS) ( RS) ( RS) ( RS) ( RS) ( RS) (DAYS) (DAYS)
PRESENT
RICE 1.9 1125.0 2137.5 29.7 10.9 18.2 0.0 156.8 1980.7 65.0 22.0COTTON 1.0 4810.0 4810.0 85.0 202.1 72.6 0.0 359.7 4450.3 89.0 25.0MAIZE 1.0 1510.0 1510.0 49.3 0.0 0.0 0.0 49.3 1460.7 47.0 10.0MILLETS 0.7 4660.0 3029.0 16.7 0.0 0.0 0.0 16.7 3012.4 27.0 8.0KHAR FOD 26.0 35.0 910.0 59.4 0.0 0.0 0.0 59.4 850.6 10.0 6.0WHEAT 1.5 1530.0 2295.0 138.6 185.6 0.0 0.0 324.2 1970.8 43.0 24.0RABI PULSE 0.6 1760.0 1056.0 9.0 0.0 0.0 0.0 9.0 1047.0 22.0 5.0OILSEED 0.5 1919.0 959.5 7.3 0.0 0.0 0.0 7.3 952.2 24.0 10.0RABI FOD 25.0 35.0 875.0 10.8 0.0 0.0 0.0 10.8 864.2 42.0 11.0SUGAR CANE 34.5 145.0 5002.5 979.0 165.0 0.0 0.0 1144.0 3858.5 137.0 47.0OTH PEREN 4.0 1500.0 6000.0 0.0 0.0 282.0 0.0 282.0 5718.0 300.0 12.0
FUTURE WITHOUT PROJECT
RICE 1.9 1590.0 3021.0 50.6 130.4 18.2 0.0 199.1 2821.8 65.0 22.0COTTON 1.4 4525.0 6335.0 85.0 242,4 72.6 0.0 400.0 5935.0 89.0 25.0MAIZE 1.0 1690.0 1690.0 69.6 0.0 0.0 0.0 69.6 1620.4 47.0 10.0MILLETS 0.7 3195.0 2076.8 19.8 0.0 0.0 0.0 19.8 2057.0 27.0 8.0KHAR FOD 28.0 35.0 980.0 59.4 0.0 0.0 0.0 59.4 920.6 10.0 6.0WHEAT 2.0 1710.0 3420.0 169.4 267.5 0.0 0.0 436.9 2983.1 43.0 24.0RABI PULSE 0.6 1760.0 1056.0 9.0 0.0 0.0 0.0 9.0 1047.0 22.0 5.0OILSEED 0.6 2520.0 1512.0 9.4 0.0 0.0 0.0 9.4 1502.6 24.0 10.0RABI FOD 30.0 35.0 1050.0 10.8 0.0 0.0 0.0 10.8 1039.2 42.0 11.0SUGAR CANE 40.0 225.0 9000.0 1045.0 618.8 0.0 0.0 1663.8 7336.3 137.0 47.0OTH PEREN 5.0 1500.0 7500.0 0.0 0.0 282.0 0.0 282.0 7218.0 300.0 12.0
FUTURE WITH PROJECT
RICE 2.5 1590.0 3975.0 50.6 257.0 18.2 0.0 325.8 3649.2 86.0 33.0COTTON 1.6 4525.0 7240.0 85.0 284.3 72.6 0.0 441.8 6798.2 121.0 33.0MAIZE 1.8 1690.0 3042.0 69.6 257.0 27.3 0.0 353.9 2688.1 66.0 22.0MILLETS 0.8 3195.0 2556.0 19.8 79.0 0.0 0.0 98.8 2457.2 33.0 14.0KHAR FOD 37.0 35.0 1295.0 59.4 118.5 0.0 0.0 177.9 1117.1 16.0 10.0WHEAT 2.2 1710.0 3762.0 169.4 396.8 0.0 0.0 566.2 3195.8 56.0 31.0RABI PULSE 0.7 1760.0 1232.0 9.0 0.0 0.0 0.0 9.0 1223.0 25.0 10.0OILSEED 0.7 2520.0 1864.8 9.4 98.8 75.3 0.0 183.4 1681.4 30.0 19.0RABI FOD 37.0 35.0 1295.0 10.8 140.0 0.0 0.0 150.8 1144.2 52.0 14.0SUGAR CANE 46.0 225.0 10350.0 1216.0 657.8 0.0 0.0 1873.8 8476.3 161.0 59.0OTH PEREN 5.0 1500.0 7500.0 0.0 165.0 282.0 0.0 447.0 7053.0 300.0 12.0 _
0o

ANNEX 16Table 13PAKISTAN
SALINITY CONTROL AMD RECLAMATION PROJECT (SCARP) VI
LABOR REQUIREMENT - UNIT II & VMAN-DAYS PER HECTARE
JAN FEB MAR APR MAY JUN JUL AUG SEP OCT NOV DEC TOT
RICE P 0.0 0.0 0.0 0.0 0.0 10.0 10.0 3.0 5.0 3.0 18.0 16.0 65.0FWO 0.0 0.0 0.0 0.0 0.0 10.0 10.0 3.0 5.0 3.0 18.0 16.0 65.0FW 0.0 0.0 0.0 0.0 0.0 10.0 10.0 5.0 8.0 3.0 25.0 25.0 86.0
COTTON P 0.0 0.0 0.0 3.0 13.0 8.0 5.0 5.0 3.0 10.0 30.0 12.0 89.0FWO 0.0 0.0 0.0 3.0 13.0 8.0 5.0 5.0 3.0 10.0 30.0 12.0 89.0FW 0.0 0.0 0.0 3.0 13.0 10.0 8.0 8.0 5.0 13.0 38.0 23.0 121.0
MAIZE P 0.0 0.0 0.0 0.0 0.0 0.0 3.0 8.0 8.0 3.0 10.0 15.0 47.0FWO 0.0 0.0 0.0 0.0 0.0 0.0 3.0 8.0 8.0 3.0 10.0 15.0 47.0FW 0.0 0.0 0.0 0.0 0.0 0.0 3.0 10.0 10.0 5.0 15.0 25.0 68.0
MILLETS P 0-0 0.0 0.0 0.0 3.0 3.0 4.0 1.0 0.0 2.0 13.0 1.0 27.0FWO 0.0 0.0 0.0 0.0 3.0 3.0 4.0 1.0 0.0 2.0 13.0 1.0 27.0FW 0.0 0.0 0.0 0.0 3.0 3.0 4.0 1.0 1.0 3.0 15.0 3.0 33.0
KHAR FOD P 0.0 0.0 0.0 2.0 1.0 2.0 1.O 1.0 1.0 1.0 1.0 0.0 10.0FWO 0.0 0.0 0.0 2.0 1.0 2.0 1.0 1.0 1.0 1.0 1.0 0.0 10.0FW 0.0 0.0 0.0 2.0 1.0 3.0 2.0 2.0 2.0 2.0 2.0 0.0 16.0
WHEAT P 1.0 1.0 1.0 10.0 14.0 0.0 0.0 0.0 0.0 3.0 10.0 3.0 43.0FWO 1.0 1.0 1.0 10.0 14.0 0.0 0.0 0.0 0.0 3.0 10.0 3.0 43.0FW 1.0 1.0 1.0 18.0 18.0 0.0 0.0 0.0 0.0 2.0 10.0 5.0 56.0
RABI PUL P 1.0 3.0 8.0 3.0 0.0 0.0 0.0 0.0 0.0 3.0 3.0 1.0 22.0FWO 1.0 3.0 8.0 3.0 0.0 0.0 0.0 0.0 0.0 3.0 3.0 1.0 22.0FW 1.0 4.0 9.0 4.0 0.0 0.0 0.0 0.0 0.0 3.0 3.0 1.0 25.0
OILSEED P 5.0 5.0 5.0 3.0 0.0 0.0 0.0 0.0 0.0 3.0 3.0 0.0 24.0FWO 5.0 5.0 5.0 3.0 0.0 0.0 0.0 0.0 0.0 3.0 3.0 0.0 24.0FW 6.0 6.0 6.0 3.0 0.0 0.0 0.0 0.0 1.0 4.0 3.0 1.0 30.0
RA8I FOD P 10.0 8.0 8.0 8.0 0.0 0.0 O.C 0.0 0.0 0.0 3.0 5.0 42.0FWO 10.0 8.0 8.0 8.0 0.0 0.0 0.0 0.0 0.0 0.0 3.0 5.0 42.0FW 10.0 10.0 10.0 10.0 0.0 0.0 0.0 0.0 0.0 0.0 4.0 8.0 52.0
SUGAR CA P 28.0 28.0 25.0 3.0 0.0 0.0 0.0 0.0 0.0 5.0 23.0 25.0 137.0FWO 28.0 28.0 25.0 3.0 0.0 0.0 0.0 0.0 0.0 5.0 23.0 25.0 137.0FW 28.0 28.0 29.0 5.0 1.0 3.0 3.0 3.0 1.0 5.0 27.0 28.0 161.0
OTH PERE P 25.0 25.0 25.0 25.0 25.0 25.0 25.0 25.0 25.0 25.0 25.0 25.0 300.0FWO 25.0 25.0 25.0 25.0 25.0 25.0 25.0 25.0 25.0 25.0 25.0 25.0 300.0FW 25.0 25.0 25.0 25.0 25.0 25.0 25.0 25.0 25.0 25.0 25.0 25.0 300.0
TOTAL P 70.0 70.0 72.0 57.0 56.0 48.0 48.0 43.0 42.0 58.0 139.0 103.0 806.0TOTAL FWO 70.0 70.0 72.0 57.0 56.0 48.0 48.0 43.0 42.0 58.0 139.0 103.0 806.0TOTAL FW 71.0 74.0 80.0 70.0 61.0 54.0 55.0 54.0 53.0 65.0 167.0 144.0 948.0 ,.
tD-.
0

116PAKISTAN Table 14
SALINITY CONTROL AND RECLAMATION PROJECT (SCARP) VIANIMAL REQUIREMENT - UNITS II & V
JAN FEB MAR APR MAY JUN JUL AUG SEP OCT NOV DEC TOT
RICE P 0.0 0.0 0.0 0.0 3.0 6.0 3.0 0.0 0.0 0.0 3.0 5.0 22.0FWO 0.0 0.0 0.0 0,0 3.0 8.0 3.0 0.0 0.0 0.0 3.0 5.0 22.0FW 0.0 0.0 0.0 0.0 5.0 10.0 3.0 0.0 0.0 0.0 5.0 10.0 33.0
COTTON P 0.0 0.0 0.0 5.0 15.0 3.0 o.O 0.0 0.0 0.0 1.0 1.0 25.0FWO 0.0 0.0 0.0 5.0 15.0 3.0 0.0 0.0 0.0 0.0 1.0 1.0 25.0FW 0.0 0.0 0.0 8.0 18.0 5.0 0.0 0.0 0.0 0.0 1.0 1.0 33.0
MAIZE P 0.0 0.0 0.0 0.0 0.0 0.0 3.0 5.0 1.0 0.0 1.0 0.0 10.0FWO 0.0 0.0 0.0 0.0 0.0 0.0 3.0 5.0 1.0 0.0 1.0 0.0 10.0FW 0.0 0.0 0.0 0.0 0.0 0.0 8.0 10.0 2.0 0.0 2.0 0.0 22.0
MILLETS P 0.0 0.0 0.0 0.0 0.0 3.0 1.0 0.0 0.0 1.0 3.0 0.0 8.0FWO 0.0 0.0 0.0 0.0 0.0 3.0 1.0 0.0 0.0 1.0 3.0 0.0 8.0Fw 0.0 0.0 0.0 1.0 3.0 3.0 2.0 0.0 0.0 1.0 4.0 0.0 14.0
KHAR FOD P 0.0 0.0 0.0 1.0 1.0 1.0 1.0 0.0 1.0 1.0 0.0 0.0 6,0FWO 0.0 0.0 0.0 1.0 1.0 1.0 1.0 0.0 1.0 1.0 0.0 0.0 6.0FW 0.0 0.0 1.0 1.0 2.0 1.0 2.0 1.0 1.0 1.0 0.0 0.0 10.0
WHEAT P 0.0 0.0 0.0 3.0 5.0 0.0 0.0 0.0 0.0 8.0 8.0 0.0 24.0FWO 0.0 0.0 0.0 3.0 5.0 0.0 0.0 0.0 0.0 8.0 8.0 0.0 24.0FW 0.0 0.0 0.0 3.0 8.0 0.0 0.0 0.0 0.0 10.0 10.0 0.0 31.0
RABI PUL P 0.0 0.0 0.0 1.0 0.0 0.0 0.0 0.0 1.0 3.0 0.0 0.0 5.0FWO 0.0 0.0 0.0 1.0 0.0 0.0 0.0 0.0 1.0 3.0 0.0 0.0 5.0FW 0.0 0.0 1.0 1.0 0.0 0.0 0.0 0.0 3.0 5.0 0.0 0.0 10.0
OILSEED P 0.0 1.0 0.0 1.0 0.0 0.0 0.0 1.0 3.0 3.0 1.0 0.0 10.0FWO 0.0 1.0 0.0 1.0 0.0 0.0 0.0 1.0 3.0 3.0 1.0 0.0 10.0FW 1.0 1.0 1.0 1.0 0.0 0.0 0.0 1.0 5.0 5.0 4.0 0.0 19.0
RABI FOD P 1.0 1.0 1.0 1.0 0.0 0.0 0.0 0.0 0.0 3.0 3.0 1.0 11.0FWO 1.0 1.0 1.0 1.0 0.0 0.0 0.0 0.0 0.0 3.0 3.0 1.0 11.0FW 1.0 2.0 2.0 1.0 0.0 0.0 0.0 0.0 0.0 4.0 3.0 1.0 14.0
SUGAR CA P 8.0 8.0 8.0 5.0 1.0 1.0 0.0 0.0 0.0 0.0 8.0 8.0 47.0FWO 8.0 8.0 8.0 5.0 1.0 1.0 0.0 0.0 0.0 0.0 8.0 8.0 47.0FW 8.0 10.0 10.0 5.0 3.0 3.0 0.0 0.0 0.0 0.0 10.0 10.0 59.0
OTH PERE P 1.0 1.0 1.0 1.0 1.0 1.0 1.0 1.0 1.0 1.0 1.0 1.0 12.0FWO 1.0 1.0 1.0 1.0 1.0 1.0 1.0 1.0 1.0 1.0 1.0 1.0 12.0FW 1.0 1.0 1.0 1.0 1.0 1.0 1.0 1.0 1.0 1.0 1.0 1.0 12.0
TOTAL P 10.0 11.0 10.0 18.0 26.0 17.0 9.0 7.0 7.0 20.0 29.0 16.0 180.0TOTAL FWO 10.0 11.0 10.0 18.0 26.0 17.0 9.0 7.0 7.0 20.0 29.0 16.0 180.0TOTAL FW 11.0 14.0 16.0 22.0 40.0 23.0 16.0 13.0 12.0 27.0 40.0 23.0 257.0
I-.

ANNEX 16Table 15
PAKISTAN
SALINITY CONTROL AND RECLAMATION PROJECT (SCARF) VILABOR REQUIREMENT - UNITS III AND IV
MAN-DAYS PER HECTARE
JAN FEB MAR APR MAY JUN JUL AUG SEP OCT NOV DEC TOT
RICE P 0.0 0.0 0.0 0.0 0.0 10.0 10.0 3.0 5.0 3.0 18.0 16.0 65.0FWO 0.0 0.0 0.0 0.0 0.0 10.0 10.0 3.0 5.0 3.o 20.0 18.0 69.0FW 0.0 0.0 0.0 0.0 0.0 10.0 10.0 5.0 8.0 3.0 25.0 25.0 86.0
COTTON P 0.0 0.0 0.0 3.0 13.0 8.0 5.0 5.0 3.0 10.0 30.0 12.0 89.0FWO 0.0 0.0 0.0 3.0 13.0 8.0 5.0 5.0 3.0 11.0 30.0 18.0 96.0FW 0.0 0.0 0.0 3.0 13.0 10.0 8.0 8.0 5.0 13.0 38.0 23.o 121.0
MAIZE P 0.0 0.0 0.0 0.0 0.0 O.o 3.0 8.0 8.0 3.0 10.0 15.0 47.0FWO 0.0 0.0 0.0 0.0 0.0 0.0 3.0 8.0 10.0 3.0 13.0 18.0 55.0FW 0.0 0.0 0.0 0.0 0.0 0.0 3.0 10.0 10.0 5.0 15.0 25.0 68.0
MILLETS P 0.0 0.0 0.0 0.0 3.0 3.0 4.0 1.0 0.0 2.o 13.0 1.0 27.0FWO 0.0 0.0 0.0 0.0 3.0 3.0 4.0 1.0 0.0 2.0 13.0 1.0 27.0FW 0.0 0.0 0.0 0.0 3.0 3.0 4.0 1.0 1.0 3.0 15.0 3.0 33.0
KHAQ FCD P 0.0 0.. 0.0 2.u 1.0 2.0 1.0 1.0 1.0 1.0 1.0 0.0, 10.0FWO 0.0 0.0 0.0 2.0 1.0 2.0 1.0 1.0 1.0 1.0 1.0 0.0 10.0FW 0.0 0.0 0.0 2.0 1.0 3.0 2.0 2.0 2.0 2.0 2.0 0.0 16.0
WHEAT P 1.0 1.0 1.0 10.0 14.0 0.0 0.0 0.0 0.0 3.o 10.0 3.0 43.0FWO 1.0 1.0 1.0 12.0 15.0 0.0 0.0 0.0 0.0 3.0 10.0 5.0 48.0FW 1.0 1.0 1.0 18.0 18.0 0.0 0.0 0.0 0.0 2.0 10.0 5.0 56.0
RABI PUL P 1.0 3.0 8.0 3.0 0.0 0.0 0.0 0.0 0.0 3.0 3.0 1.0 22.0FWO 1.0 3.0 8.0 3.0 0.0 0.0 0.0 0.0 0.0 3.0 3.0 1.0 22.0FW 1.0 4.0 9.0 4.0 0.0 0.0 0.0 0.0 0.0 3.0 3.0 1.0 25.0
OILSEED P 5.0 5.0 5.0 3.0 0.0 0.0 0.0 0.0 0.0 3.0 3.0 0.0 24.0FWO 5.0 5.0 5.0 3.0 0.0 0.0 0.0 0.0 1.0 3.0 3.0 1.0 26.0FW 6.0 6.0 6.0 3.0 0.0 0.0 0.0 0.0 1.0 4.0 3.0 1.0 30.0
RA8I FOD P 10.0 8.0 8.0 8.0 0.0 0.0 0.0 0.0 0.0 0.0 3.0 5.0 42.0FWO 10.0 9.0 9.0 9.0 0.0 0.0 0.0 0.0 0.0 0.0 3.0 5.0 45.0FW 10.0 10.0 10.0 10.0 0.0 0.0 0.0 0.0 0.0 0.0 4.0 8.0 52.0
SUGAR CA P 28.0 28.0 25.0 3.0 0.0 0.0 0.0 0.0 0.0 5.0 23.0 25.0 137.0FWDeO 8.o 8.0 8.0 0.0 0.0 0.0 0.0 0.0 0.0 5.0 25.0 28.0 82.0FW 28.0 28.0 29.0 5.0 1.0 3.0 3.0 3.0 1.0 5.0 27.0 28.0 161.0
OTH PERE P 25.0 25.0 25.0 25.0 25.0 25.0 25.0 25.0 25.0 25.o 25.0 25.0 300.0FWO 25.0 25.0 25.0 25.0 25.0 25.0 25.0 25.0 25.0 25.0 25.0 25.0 300.0FW 25.0 25.0 25.0 25.0 25.0 25.0 25.0 25.0 25.0 25.0 25.0 25.0 300.0
TOTAL P 70.0 70.0 72.0 57.0 56.0 48.0 48.0 43.0 42.0 58.0 139.0 103.0 806.0TOTAL FWO 50.0 51.0 56.0 57.0 57.0 48.0 48.0 43.0 45.0 59.0 146.0 120.0 780.0TOTAL FW 71.0 74.0 80.0 70.0 61.0 54.0 55.0 54.0 53.0 65.0 167.0 144.0 948.0
'Ccl
1-H

ANNEX 16Table 16
PAKISTAN
SALINITY CONTROL AND RECLAMATION PROJECT (SCARP) VIANIMAL REQUIREMENT - UNITS III AND IV
JAN FEB MAR APR M1AY JUN JUL AUG SEP OCT NOV DEC roT
RICE P 0.0 0.0 0.0 0.0 3.0 8.0 3.0 0.0 0.0 0.0 3.0 5.0 22.0FWO 0.0 0.0 0.0 0.0 3.0 10.0 3.0 0.0 0.0 0.0 5.0 5.0 26.0FW 0.0 0.0 0.0 0.0 5.0 10.0 3.0 0.0 0.0 0.0 5.0 10.0 33.0
COTTON P 0.0 0.0 0.0 5.0 15.0 3.0 0.0 0.0 0.0 0.0 1.0 1.0 25.0FWO 0.0 0.0 0.0 5.0 15.0 5.0 0.0 0.0 0.0 0.0 1.0 1.0 27.0FW 0.0 0.0 0.0 8.0 18.0 5.0 0.0 0.0 0.0 0.0 1.0 1.0 33.0
MAIZE P 0.0 0.0 0.0 0.0 0.0 0.0 3.0 5.O 1.0 0.0 1.0 0.0 10.0FWO 0.0 0.0 0.0 0.0 0.0 0.0 3.0 8.0 1.0 0.0 1.0 0.0 13.0FW 0.0 0.0 0.0 0.0 0.0 0.0 8.0 10.0 2.0 0.0 2.0 0.0 22.,
MILLETS P 0.0 0.0 0.0 0.0 0.0 3.0 1.0 0.0 0.0 1.0 3.0 0.0 8.0FWO 0.0 0.0 0.0 0.0 0.0 3.0 1.0 0.0 0.0 1.0 3.0 0.0 8.0FW 0.0 0.0 0.0 1.0 3.0 3.0 2.0 0.0 0.0 1.0 4.0 0.0 14.0
KHAR FOD P 0.0 0.0 0.0 1.0 1.0 1.0 1.0 0.0 1.0 1.0 0.0 0.0 6.0FWO 0.0 0.0 0.0 1.0 1.0 1.0 1.0 1.0 1.0 1.0 0.0 0.0 7.0FW 0.0 0.0 1.0 1.0 2.0 1.0 2.0 1.0 1.0 1.0 0.0 0.0 10.0
WHEAT P 0.0 0.0 0.0 3.0 5.0 0.0 0.0 0.0 0.0 8.0 8.0 0.0 24.0FWO 0.0 0.0 0.0 3.0 5.0 0.0 0.0 0.0 0.0 8.0 10.0 0.0 26.0FW 0.0 0.0 0.0 3.0 8.0 0.0 0.0 0.0 0.0 10.0 1O.O 0.0 31.0
RABI PUL P 0.0 0.0 0.0 1.0 0.0 0.0 0.0 0.0 1.0 3.0 0.0 0.0 5.0FWO 0.0 0.0 0.0 1.0 0.0 0.0 0.0 0.0 3.0 5.0 0.0 0.0 9.0FW 0.0 0.0 1.0 1.0 0.0 0.0 0.0 0.0 3.0 5.0 0.0 0.0 10.0
CILSEED P 0.0 1.0 0.0 1.0 0.0 0.0 0.0 1.0 3.0 3.0 1.0 0.0 10.0FWO 0.0 1.0 1.0 1.0 0.0 0.0 0.0 1.0 4.0 4.o 3.0 0.0 15.0FW 1.0 1.0 1.0 1.0 0.0 0.0 0.0 1.0 5.0 5.0 4.0 0.0 19.0
RASI FOD P 1.0 1.0 1.0 1.0 0.0 0.0 0.0 0.0 0.0 3.0 3.0 1.0 11.0FWO 1.0 1.0 1.0 1.0 0.0 0.0 0.0 0.0 0.0 3.0 3.0 1.0 11.0FW 1.0 2.0 2.0 1.0 0.0 0.0 0.0 0.0 0.0 4.0 3.0 1.0 14.0
SUGAR CA P 8.0 8.0 8.0 5.0 1.0 1.0 0.0 0.0 0.0 0.0 8.0 8.0 47.0FWO 8.0 10.0 8.0 5.0 3.0 1.0 0.0 0.0 0.0 0.0 8.0 9.0 52.0FW 8.0 10.0 10.0 5.0 3.0 3.D 0.0 0.0 0.0 0.0 10.0 10.0 59.0
OTH PERE P 1.0 1.0 1.0 1.0 1.0 1.0 1.0 1.0 1.0 1.0 1.0 1.0 12.0FWO 1.0 1.0 1.0 1.0 1.0 1.0 1.0 1.0 1.0 1.0 1.0 1.0 12.0FW 1.0 1.0 1.0 1.0 1.0 1.0 1.0 1.0 1.0 1.0 1.0 1.0 12.0
TOTAL P 10.0 11.0 10.0 18.0 26.0 17.0 9.0 7.0 7.0 20.0 29.0 16.0 180.0TOTAL FWO 10.0 13.0 11.0 18.0 28.0 21.0 9.0 11.0 10.0 23.0 35.0 17.0 206.0TOTAL FW 11.0 14.0 16.0 22.0 40.0 23.0 16.0 13.0 12.0 27.0 40.0 23.0 257.0 H 3
a .3

ANNEX 16Table 17
PAKISTANSALINITY CONTROL AND RECLAMATION PROJECT (SCARP) VI
LABOR REQUIREMENT - TOTAL PROJECT AREA(1000 MAN-DAY)
OAN FEB MAR APR MAY JUN JUL AUG SEP OCT NOV DEC TOTRICE P 0.0 0.0 0.0 0.0 0.0 144.7 144.7 43.4 72.4 43.4 260.5 231.5 940.6FWO 0.0 0.0 0.0 0,0 0.0 278.4 278.4 83.5 139.2 83.5 518.1 462.4 1843.5FW 0.0 0.0 0.0 0.0 0.0 230.8 230.8 115.4 184.6 69.2 577.0 577.0 1984.9COTTON P 0.0 0.0 0.0 451.7 1957.4 1204.6 752.9 752.9 451.7 1505.7 4517.1 1806.8 13400.7FWO 0.0 0.0 0.0 371.5 1609.8 990.6 619.2 619.2 371.5 1293.2 3714.9 1815.1 11404.8FW 0.0 0.0 0.0 487.8 2113.8 1626.0 1300.8 1300.8 813.0 2113.8 6178.8 3739.8 19674.6MAIZE P 0.0 0.0 0.0 0.0 0.0 0.0 21.1 56.2 56.2 21.1 70.3 105.5 330.4FWO 0.0 0.0 0.0 0.0 0.0 0.0 21.1 56.2 60.0 21.1 75.9 111.1 345.4FW 0.0 0.0 0.0 0.0 0.0 0.0 35.9 119.7 119.7 59.9 179.6 299.3 814.0MILLETS P 0.0 0.0 0.0 0.0 72.1 72.1 96.2 24.0 0.0 48.1 312.5 24.0 649.1FWO 0.0 0.0 0.0 0.0 98.3 98.3 131.1 32.8 0.0 65.6 426.1 32.8 885.1FW 0.0 0.0 0.0 0.0 94.2 94.2 125.6 31.4 31.4 94.2 470.9 94.2- 1035.9KHAR FOD P 0.0 0.0 0.0 67.8 Q a 57.0 . SS. 5 J32j.Y .9 33.9 0.0 338.8Fwu U.0 0.0 0.0 67.8 33.9 67.8 33.9 33.9 33.9 33.9 33.9 0.0 338.8FW 0.0 0.0 0.0 63.4 31.7 95.0 63.4 63.4 63.4 63.4 63.4 0.0 506.9WHEAT P 131.6 131.6 131.6 1315.5 1841.7 0.0 0.0 0.0 0.0 394.6 1315.5 394.6 5656.7FWO 115.3 115.3 115.3 1232.7 1653.6 0.0 0.0 0.0 0.0 345.8 1152.5 425.9 5156.2FW 188.4 188.4 188.4 3390.7 3390.7 0.0 0.0 0.0 0.0 376.7 1883.7 941.9 10548.7RABI PUL P 5.1 15.4 41.1 15.4 0.0 0.0 0.0 0.0 0.0 15.4 15.4 5.1 113.1Fwo 18.2 54.5 145.4 54.5 0.0 0.0 0.0 0.0 0.0 54.5 54.5 18.2 400.0FW 13.0 52.1 117.2 52.1 0.0 0.0 0.0 0.0 0.0 39.1 39.1 13.0 325.5OILSEED P 136.3 136.3 136.3 81.8 0.0 0.0 0.0 0.0 0.0 81.8 81.8 0.0 654.2FWO 152.6 152.6 152.6 91.6 0.0 0.0 0.0 0o0 5.6 91.6 91.6 5.6 743.7FW 250.6 250.6 250.6 125.3 0.0 0.0 0.0 0.0 41.8 167.0 125.3 41.8 1252.8RABI FOD P 524.8 419.8 419.8 419.8 0.0 0.0 0.0 0.0 0.0 0.0 157.4 262.4 2204.2FWO 524.8 438.0 438.0 438.o 0.0 0.0 0.0 0.0 0.0 0.0 157.4 262.4 2258.7FW 416.6 416.6 416.6 416.6 0.0 0.0 0.0 0.0 0.0 0.0 166.6 333.3 2166.3SUGAR CA P 798.0 798.0 712.5 85.5 0.0 0.0 0.0 0.0 0.0 142.5 655.5 712.5 3904.5FWO 509.6 509.6 467.4 42.2 0.0 0.0 0.0 0.0 0.0 142.5 684.3 755.8 3111.5FW 1062.6 1062.6 1100.6 189.8 38.0 113.9 113.9 113.9 38.0 189.8 1024.7 1062.6 6110.0OTH PERE P 257.0 257.0 257.0 257.0 257.0 257.0 257.0 257.0 257.0 257.0 257.0 257.0 3084.0FWO 257.0 257.0 257.0 257.0 257.0 257.0 257.0 257.0 257.0 257.0 257.0 257.o 3084.0FW 477.5 477.5 477.5 477.5 477.5 477.5 477.5 477.5 477.5 477.5 477.5 477.5 5730.0TOTAL P 1852.8 1758.1 1698.3 2694.5 4162.1 1746.1 1305.7 1167.4 871.2 2543.5 7676.9 3799.5 31276.2TOTAL FWO 1577.5 1527.0 1575.7 2555.3 3652.6 1692.1 1340.6 1082.6 867.2 2388.6 7166.3 4146.2 29571.7TOTAL FW 2408.7 2447.7 2550.8 5203.0 6145.8 2637.4 2347.8 2222.0 1769.3 3650.5 11186.4 7580.2 50149.5
I.-.1
CDX

ANNEX 16Table 18PAKISTAN
SALINITY CONTROL AND RECLAMATION PROJECT (SCARP) VIANIMAL REQUIREMENT - TOTAL PROJECT AREA
(1000 PAIR-DAYS)JAN FEB MAR APR MAY JUN JUL AUG SEP OCT NOV DEC TOT
RICE P 0.0 0.0 0.0 0.0 43.4 115.8 43.4 0.0 0.0 0.0 43.4 72.4 318.3FWO 0.0 0.0 0.0 0.0 83.5 239.7 83.5 0.0 0.0 0.0 100.5 139.2 646.4FW 0.0 0.0 0.0 0.0 115.4 230.8 69.2 0.0 0.0 0.0 115.4 230.8 761.6COTTON P 0.0 0.0 0.0 752.9 2258.6 451.7 0.0 0.0 0.0 0.0 150.6 150.6 3764.3FWO 0.0 0.0 0.0 619.2 1857.5 481.2 0.0 0.0 0.0 0.0 123.8 123.8 3205.5FW 0.0 0.0 0.0 1300.8 2926.8 813.0 0.0 0.0 0.0 0.0 162.6 162.6 5365.8MAIZE P 0.0 0.0 0.0 0.0 0.0 0.0 21.1 35.2 7.0 0.0 7.0 0.0 70.3FWO 0.0 0.0 0.0 0.0 0.0 0.0 21.1 40.8 7.0 0.0 7.0 0.0 75.9FW 0.0 0.0 0.0 0.0 0.0 0.0 95.8 119.7 23.9 0.0 23.9 0.0 263.3MILLETS P 0.0 0.0 0.0 0.0 0.0 72.1 24.0 0.0 0.0 24.0 72.1 0.0 192.3FWO 0.0 0.0 0.0 0.0 0.0 98.3 32.8 0.0 0.0 32.8 98.3 0.0 262.2FW 0.0 0.0 0.0 31.4 94.2 94.2 62.8 0.0 0.0 31.4 125.6 0.0 439.5KHAR FOD P 0.0 0.0 0.0 33.9 33.9 33.9 33.9 0.0 33.9 33.9 0.0 0.0 203.3FWO 0.0 0.0 0.0 33.9 33.9 33.9 33.9 10.0 33.9 33.9 0.0 0.0 213.3FW 0.0 0.0 31.7 31.7 63.4 31.7 63.4 31.7 31.7 31.7 0.0 0.0 316.8WHEAT P 0.0 0.0 0.0 394.6 657.8 0.0 0.0 0.0 0.0 1052.4 1052.4 0.0 3157.2FWO 0.0 0.0 0.0 345.8 576.3 0.0 0.0 0.0 0.0 922.0 1002.2 0.0 2846.2FW 0.0 0.0 0.0 565.1 1507.0 0.0 0.0 0.0 0.0 1883.7 1883.7 0.0 5839.5RABI PUL P 0.0 0.0 0.0 5.1 0.0 0.0 0.0 0.0 5.1 15.4 0.0 0.0 25.7FWO 0.0 0.0 0.0 18.2 0.0 0.0 0.0 0.0 21.9 58.3 0.0 0.0 98.4FW 0.0 0.0 13.0 13.0 0.0 0.0 0.0 0.0 39.1 65.1 0.0 0.0 130.2
OILSL-O P 0.0 27.3 0.0 27.3 0.0 0.0 0.0 27.3 81.8 81.8 27.3 0.0 272.6FWO 0.0 30.5 5.6 30.5 0.0 0.0 0.0 30.5 97.2 97.2 41.8 0.0 333.3FW 41.8 41.8 41.8 41.8 0.0 0.0 0.0 41.8 208.8 208.8 167.0 0.0 793.4RABI FOD P 52.5 52.5 52.5 52.5 0.0 0.0 0.0 0.0 0.0 157.4 157.4 52.5 577.3FWO 52.5 52.5 52.5 52.5 0.0 0.0 0.0 0.0 0.0 157.4 157.4 52.5 577.3FW 41.7 83.3 83.3 41.7 0.0 0.0 0.0 0.0 0.0 166.6 125.0 41.7 583.2
SUGAR CA P 2.'8.0 228.0 228.0 142.5 28.5 28.5 0.0 0.0 0.0 0.0 228.0 228.0 1339.5FWO 22b 0 256.8 228.0 142.5 57.3 28.5 0.0 0.0 0.0 0.0 22B.0 242.4 1411.6FW 303.- 379.5 379.5 189.8 113.9 113.9 0.0 0.0 0.0 0.0 379.5 379.5 2239.1
OTH PERE P 10.3 10.3 10.3 10.3 10.3 10.3 10.3 10.3 10.3 10.3 10.3 10.3 123.4FWO 10.3 10.3 10.3 10.3 10.3 10.3 10.3 10.3 10.3 10.3 10.3 10.3 123.4FW 19.1 19.1 19.1 19.1 19.1 19.1 19.1 19.1 19.1 19.1 19.1 19.1 229.2
TOTAL P 290.8 318.0 290.8 1419.0 3032.4 712.3 132.7 72.7 138.1 1375.2 1748.5 513.7 10044.1TOTAL FWO 290.8 350.1 296.4 1252.7 2618.7 891.9 181.5 91.6 170.3 1311.9 1769.3 568.2 9793.4TOTAL FW 406.t 523.7 568.4 2234.3 4839.6 1302.6 310.2 212.2 322.6 2406.4 3001.8 833.7 16961.6
t-n~~~~~~~~~~~~~~~~~~~~~~~~~~ I..'S
U1 00 H~~~~~~~~~~~~~~~~~~~~~~~~~~~~~~~~~Od
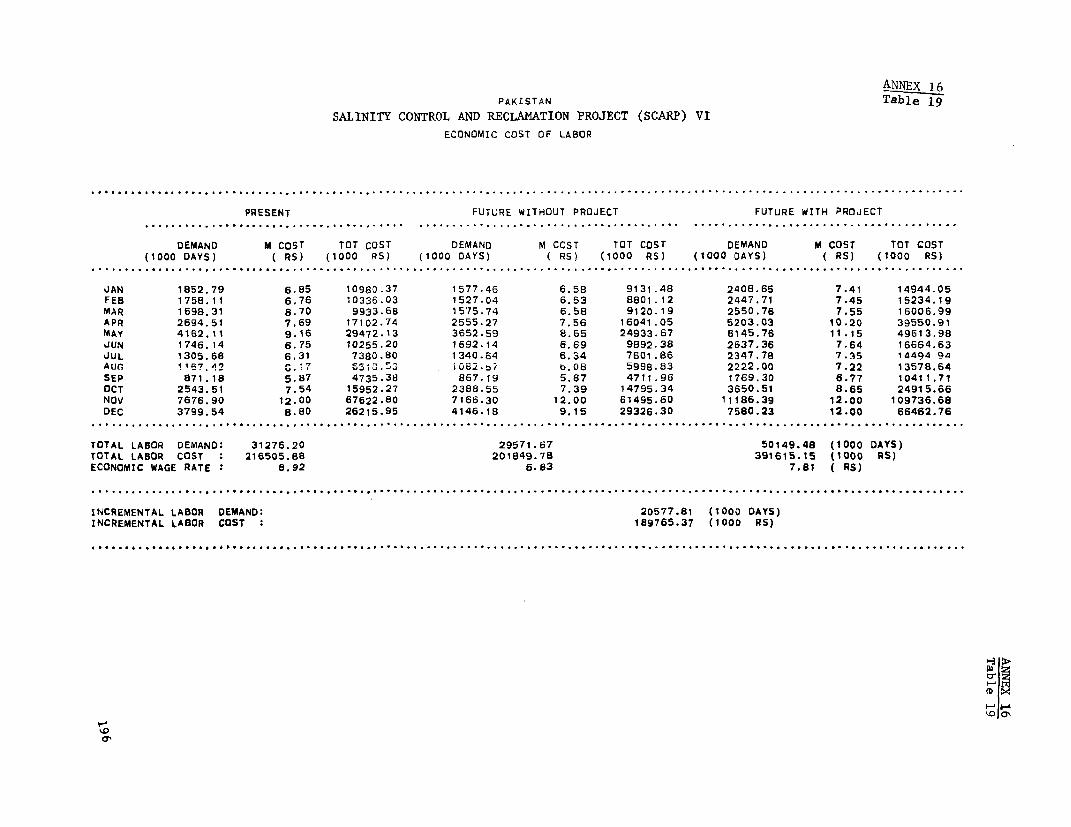
ANNEX 16PAKISTAN Table 19
SALINITY CONTROL AND RECLAMATION PROJECT (SCARP) VIECONOMIC COST OF LABOR
.-........................................................................................ I........................................
PRESENT FUTURE WITHOUT PROJECT FUTURE WITH PROJECT
DEMAND M COST TOT COST DEMAND M COST TOT COST DEMAND M COST TOT COST(1000 DAYS) ( RS) (1000 RS) (1000 DAYS) ( RS) (1000 RS) (1000 DAYS) ( RS) (1000 RS)
..................................................... .............................................................................
JAN 1852.79 6.85 10980.37 1577.46 6.58 9131.48 2408.65 7.41 14944.05FEB 1758.11 6.76 10336.03 1527.04 6.53 8801.12 2447.71 7.45 15234.19MAR 1698.31 6.70 9933.68 1575.74 6.58 9120.19 2550.76 7.55 16006.99APR 2694.51 7,69 17102.74 2555-27 7.56 16041.05 5203.03 10.20 39550.91MAY 4162.11 9.16 29472.13 3652.59 8.65 24933.67 6145.76 11.15 49613.98JUN 1746.14 6.75 10255.20 1692.14 6.69 9892.38 2637.36 7.64 16664.63JUL 1305.68 6.31 7380.80 1340.64 6.34 7601.86 2347.78 7.35 144Q4 QhAur 1167.42 O. 65,8.-S i082.D/ b.08 5998.83 2222.00 7.22 13578.64SEP 871.18 5.87 4735.38 867.19 5.87 4711.96 1769.30 6.77 10411.71OCT 2543.51 7.54 15952.27 2388.55 7.39 14795.34 3650.51 8.65 24915.66NOV 7676.90 12.00 67622.80 7166.30 12.00 61495.60 11186.39 12.00 109736.68DEC 3799.54 8.80 26215.95 4146.18 9.15 29326.30 7580.23 12.00 66462.76
. .. ..... ..... ..... ............ ............. ..... ....... ...... .... .. ...... ............ ................. . ...... ... ... ...... ... ... ...
TOTAL LABOR DEMAND: 31276.20 29571.67 50149.48 (1000 DAYS)TOTAL LABOR COST : 216505.88 201849.78 391615.15 11000 RS)ECONOMIC WAGE RATE : 6.92 6.83 7.81 ( RS)
..................................................................................................................................
INCREMENTAL LABOR DEMAND: 20577.81 (1000 DAYS)INCREMENTAL LABOR COST : 189765.37 (1000 RS)
...... ............. . . . ... .
'.0~~~~~~~~~~~~~~~~~~~~~~~~~~~~~~~~~~~~~~~~~~~~~~~~~~~~~~~~~~~~~~~~~~~~~~~~~~.(D X
ol ~ ~ ~ ~ ~ ~ ~ ~ ~ ~ ~ ~ ~ ~ ~ ~ ~ ~ ~ ~ ~ ~ ~ ~ ~ ~ ~ ~~~~~~~x
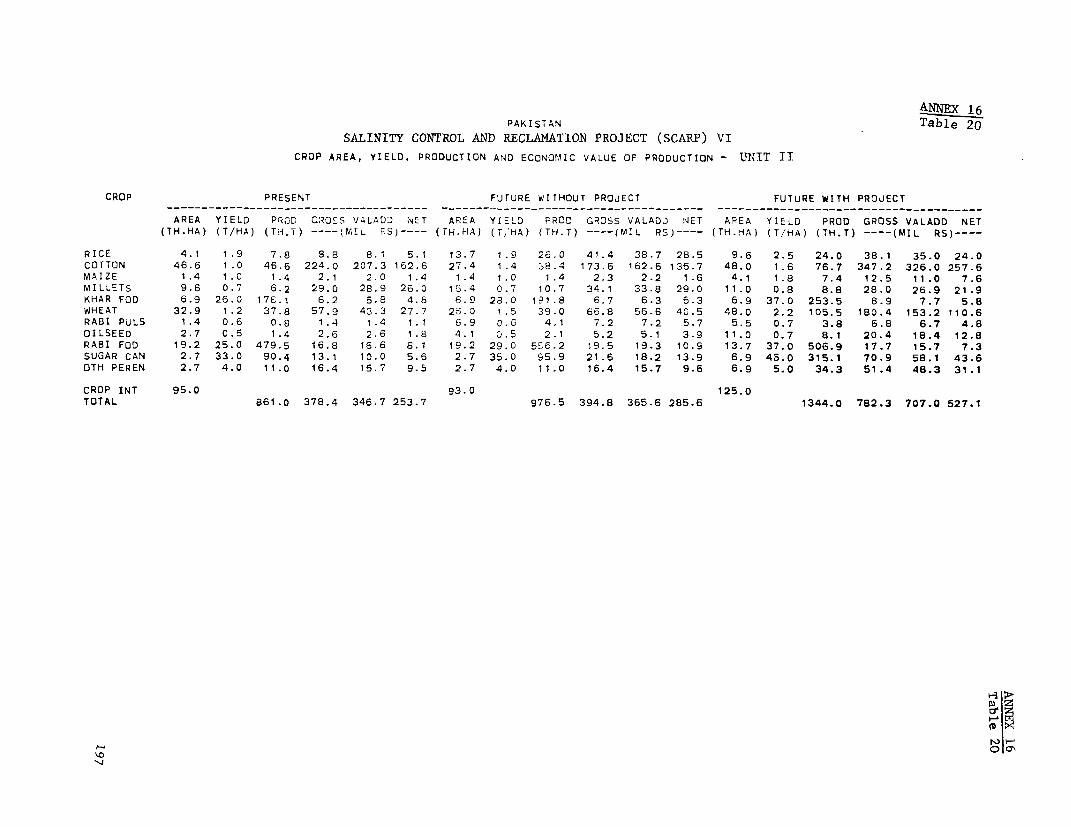
ANNEX 16
PAKISTAN Table 20SALINITY CONTROL AND RECLAMATION PROJECT (SCARP) VI
CROP AREA, YIELD, PRODUCTION AND ECONOMIC VALUE OF PRODUCTION - UNTIT II
CROP PRESENT FUTURE WITHOUT PROJECT FUTURE WITH PROJECT
AREA YIELD PROD CROSS VALADD NET AREA YIELD PROD GRCSS VALADD NET AREA YIELD PROD GROSS VALADD NET
(TH.HA) (T/HA) (TH.T) ---- (MIL PS)---- (TH.HA) (T,HA) (TH.T) ---- (MIL RS)---- (TH.HA) (T/HA) (TH.T) ---- (MIL RS)----
RICE 4.1 1.9 7.8 8.8 8.1 5.1 13.7 1.9 26.0 41.4 38.7 28.5 9.6 2.5 24.0 38.1 35.0 24.0
COTTON 46.6 1.0 46.6 224.0 207.3 162.6 27.4 1.4 38.4 173.6 162.6 136.7 48.0 1.6 76.7 347.2 326.0 257.6
MAIZE 1.4 1.0 1.4 2.1 2.0 1.4 1.4 1.0 1.4 2.3 2.2 1.6 4.1 1.8 7.4 12.5 11.0 7.6
MILLETS 9.6 0.7 6.2 29.0 28.9 26.0 13.4 0.7 10.7 34.1 33.8 29.0 11.0 0.8 8.8 28.0 26.9 21.9
KHAR FOD 6.9 26.0 176.1 6.2 5.8 4.8 6.9 28.0 191.8 6.7 6.3 5.3 6.9 37.0 253.5 8.9 7.7 5.8
WHEAT 32.9 1.2 37.8 57.9 43.3 27.7 26.0 1.5 39.0 66.8 56.6 40.5 48.0 2.2 105.5 180.4 153.2 110.6
RABI PULS 1.4 0.6 0.8 1.4 1.4 1.1 6.9 0.6 4.1 7.2 7.2 5.7 5.5 0.7 3.8 6.8 6.7 4.8
OILSEED 2.7 0.5 1.4 2.6 2.6 1.8 4.1 D.5 2.1 5.2 5.1 3.9 11.0 0.7 8.1 20.4 18.4 12.8
RABI FOD 19.2 25.0 479.5 16.8 16.6 8.1 19.2 29.0 556.2 19.5 19.3 10.9 13.7 37.0 506.9 17.7 15.7 7.3
SUGAR CAN 2.7 33.0 90.4 13.1 10.0 5.6 2.7 35.0 95.9 21.6 18.2 13.9 6.9 4S.0 315.1 70.9 58.1 43.6
OTH PEREN 2.7 4.0 11.0 16.4 15.7 9.5 2.7 4.0 11.0 16.4 15.7 9.6 6.9 5.0 34.3 51.4 48.3 31.1
CROP INT 95.0 93.0 125.0
TOTAL 861.0 378.4 346.7 253.7 976.5 394.8 365.6 285.6 1344.0 782.3 707.0 527.1
o0!
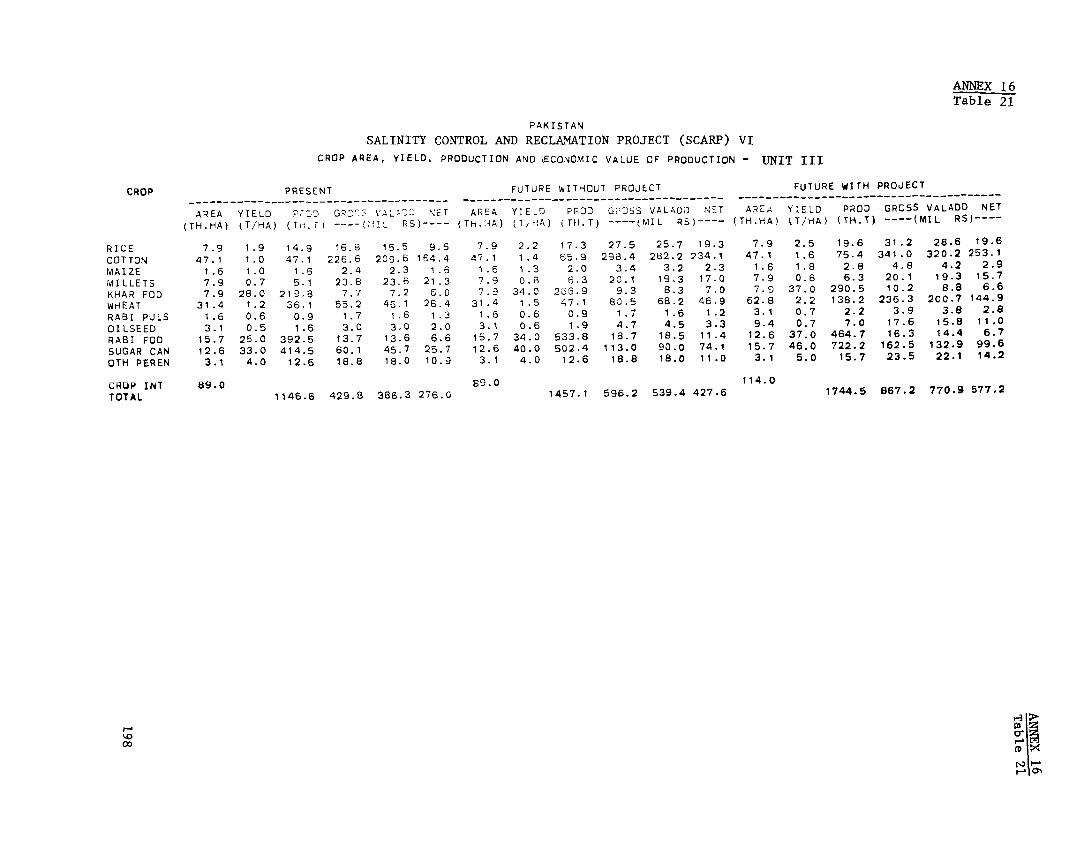
ANNEX 16Table 21
PAKISTAN
SALINITY CONTROL AND RECLAMATION PROJECT (SCARP) VICROP AREA, YIELD, PRODUCTION AND tECONOMIC VALUE OF PRODUCTION - UNIT III
CROP PRESENT FUTURE WITHOUT PROJECT FUTURE WITH PROJECT
AREA YIELD P7--.D GRCO- 'AL-D0 NET AREA YIELD PR9OD G-PSS VALADD NET AREA Y:ELD PROD GROSS VALADD NET(TH. HA) ( T/HA) ( 7._T) -- M RS)---- (TH,.HA) (T,HiA) (TH.T) ---- (MlIL RS) ---- (TH.HA) kT/HA) (TH.T) ---- (MIL RS) ----
RICE 7.9 1.9 14.9 16.8 15.5 9.6 7.9 2.2 17.3 27.5 25.7 19.3 7.9 2.5 19.6 31.2 28.6 19.6COTTON 47.1 1.0 47.1 226.6 209.6 164.4 47.1 1.4 65.9 298.4 282.2 234.1 47.1 1.6 75.4 341.0 320.2 253.1MAIZE 1.6 1.0 1.6 2.4 2.3 i.6 1.6 1.3 2.0 3.4 3.2 2.3 1.6 1.8 2.8 4.8 4.2 2.9MILLETS 7.9 0.7 5.1 23.8 23.6 21.3 7.9 O.B 6.3 20.1 19.3 17.0 7.9 0.8 6.3 20.1 19.3 15.7KHAR FOD 7.9 28.0 219.8 7.7 7.2 6.0 7.9 34.0 255 9 9.3 8.3 7.0 7.9 37.0 290.5 10.2 8.8 6.6WHEAT 31.4 1.2 36.1 55.2 46.1 26. 4 31.4 1.5 47.1 80.5 68.2 46.9 62.8 2.2 138.2 236.3 200.7 144.9RABI PULS 1.6 0.6 0.9 1.7 1.6 1.3 1.6 0.6 0.9 1.7 1.6 1.2 3.1 0.7 2.2 3.9 3.8 2.8OILSEED 3.1 0.5 1.6 3.0 3.0 2.0 3.1 0.6 1.9 4.7 4.5 3.3 9.4 0.7 7.0 17.6 15.8 11.0RABI FOD 15.7 25.0 392.5 13.7 13.6 6.6 15.7 34.0 533.8 18.7 18.5 11.4 12.6 37.0 464.7 16.3 14.4 6.7SUGAR CAN 12.6 33.0 414.5 60.1 45.7 25.7 12.6 40.0 502.4 113.0 90.0 74.1 15.7 46.0 722.2 162.5 132.9 99.6OTH PEREN 3.1 4.0 12.6 18.8 18.0 10.9 3.1 4.0 12.6 18.8 18.0 11.0 3.1 5.0 15.7 23.5 22.1 14.2
CROP INT 89.0 89.0 114.0TOTAL 1146.6 429.8 3e6.3 276.0 1457.1 596.2 539.4 427.6 1744.5 867.2 770.9 577.2
coS -
o" t.t(D1O

A EX 16PAKISTAN Table 2e
SALINITY CONTROL AND RECLAMATION PROJECT (SCARP) VICROP AREA, YIELD, PRODUCTION AND ECONOMIC VALUE OF PRODUCTION - UNIT IV
CROP PRESENT FUTURE WITHOUT PROJECT FUTURE WITH PROJECT…-- - -- - -- - - -- - - - --- - - - - - - - --- -- - - -- - - - - -- - -- - -- - - -- - - - - -- - - - - - -- - - -- - - - - - - - - -- - - - - - -- - - - - - - - - - - - - - - - - -- - - - - -- - -- -AREA YIELD PRoD GROSS VALADD NET AREA YIELD PROD GROSS VALADD NET AREA YIELD PROD GROSS VALADD NET(TH.HA) (T/HA) (TH.T) ---- (MIL RS)---- (TH.HA) (T/HA) (TH.T) ---- (MIL RS)---- (TH.HA) (T/HA) (TH.T) ---- (MIL RS)----
RICE 0.6 1.9 1.2 1.3 1.2 0.8 0.6 2.2 1.4 2.2 2.0 1.5 1.9 2.5 4.7 7.4 6.8 4.6COTTON 7.8 1.0 7-8 37.3 34.5 27.1 7.8 1.4 10.9 49.1 46.3 38.4 10.9 1.6 17.4 78.6 73.8 58.3MAIZE 0.3 1.0 0.3 0.5 0.5 0.3 0.3 1.3 0.4 0.7 0.6 0.5 0.6 1.B ?.t t.9 1.7 1.1MILLETS 0.9 0.7 0.6 2.8 2.8 2. E 0.9 0.8 0.7 2.4 2.3 2.0 1.2 0.8 1.0 3.2 3.0 2.5KHAR FOD 2.2 28.0 60.8 2.1 2.0 1.7 2.2 34.0 73.8 2.6 2.3 1.9 1.9 37.0 68.8 2.4 2.1 1.6WHEAT 8.7 1.5 13.0 19.9 17.1 11.7 8.7 2.0 17.4 29.7 25.9 20.0 11.5 2.2 25.2 43.2 36.7 26.5RABI PULS 0.3 0.6 0.2 0.3 0.3 0.3 0.3 0.6 0.2 0.3 0.3 0.2 0.6 0.7 0.4 0.8 D.8 0.5OILSEED 2.5 0.5 1.2 2.4 2.4 1.6 2.5 0.6 1.5 3.7 3.7 2.8 2.5 0.7 1.8 4.6 4.2 2.9RABI FOD 2.5 25.0 62.0 2.2 2.1 1.0 2.5 30.0 74.4 2.6 2.6 1.4 2.2 37.0 80.3 2.8 2.5 1.2SUGAR CAN 1.9 34.5 64.2 9.3 7.2 4.2 1.9 40.0 74.4 16.7 13.3 11.0 2.2 46.0 99.8 22.5 18.4 13.8OTH PEREN 0.6 4.0 2.5 3.7 3.5 2.2 0.6 5.0 3.1 4.7 4.5 3.1 1.6 5.0 7.8 11.6 10.9 7.0
CROP INT 91.0 91.0 119.0TOTAL 213.7 8t.8 73.6 53.3 258.1 114.7 103.8 82.8 308.3 178.8 160.7 120.0
(UIX£
M H~~~~~~~~~~~~~~~~~~~~~~~~~~~~~~~~~~~~~~~~~~~n.£
xv a~~~~~~~~~~~~~~~~~~~~~~~~~~~~~~~

ANNEX 16PAKISTAN Table 23
SALINITY CONTROL AND RECLAMATION PROJECT (SCARP) VICROP AREA, YIELD, PRODUCTION AND ECONOMIC VALUE OF PRODUCTION - AREA V
CROP PRESENT FUTURE WITHOUT PROJECT FUTURE WITH PROJECT…__ _ _ _ _ _ _ _ _ _ _ _ _ _ _ _ _ _ _ _ _…__ _ _ _ _ _ _ _ _ -…_ _ _ _ _ _ _ _ _ _ _ _ _ _ _ _ _ _ _ _ _ _ _ _ _ _ _ _ _ _ _ _ _ _ _ _ _ _-- - - - - - - - - - - - - - - - - - - - - -AREA YIELD PROD GROSS VALADD NET AREA YIELD PROD GROSS VALADD NET AREA YIELD PROD GROSS VALADD NET
(TH.HA) (T/HA) (TH.T) ---- (MIL RS)---- (TH.HA) (T/'HA) (TH.T) ---- (MIL RS)---- (TH.HA) (r/HA) (TH.T) ---- (MIL RS)----
RICE 1.9 1.9 3.6 4,0 3.7 2.3 5.7 1 .S 10.8 17.1 16.0 11.8 3.8 2.5 9.5 15.0 13.8 9.4COTTON 49.1 1.0 49.1 236.4 218.7 171.6 41.6 1.4 58.2 263.4 246.8 207.5 56.7 1.6 90.7 410.5 385.5 304.7MAIZE 3.8 1.0 3.8 5.7 5.5 3.8 3.8 1.0 3.8 6.4 6.1 4.4 5.7 1.8 10.2 17.2 15.2 10.4MILLET$ 5.7 0.7 3.7 17.2 17.1 15.4 7.6 0.7 4.9 15.7 15.6 13.3 11.3 0.8 9.1 29.0 27.9 22.6KHAR FOD 17.0 26.0 442.3 15.5 14.5 11.9 17.0 28.0 476.3 16.7 15.7 13.1 15.1 37.0 559.4 19.6 16.9 12.8WHEAT 58.6 1.5 87.9 134.5 115.5 78.7 49.1 2.0 98.3 168.1 146.6 116.2 66.2 2.2 145.5 248.9 211.4 152.6RABI PULS 1.9 0.6 1.1 2.0 2.0 1.6 9.5 0.6 5.7 10.0 9.9 7.8 3.8 0.7 2.6 4.7 4.6 3.3OILSEED 18.9 0.5 9.5 18.1 18.0 12.3 20.8 0.6 12.5 31.4 31.2 25.0 18.9 0.7 14.0 35.2 31.8 22.1RABI FOD 15.1 25.0 378.0 13.2 13.1 6.4 15.1 30.0 453.6 15.9 15.7 9.1 13.2 37.0 489.5 17.1 15.1 7.1SUGAR CAN 11.3 34.5 391.2 56.7 43.8 25.7 11.3 40.0 453.6 102.1 83.2 65.4 13.2 46.0 608.6 136.9 112.1 84.2OTH PEREN 3.8 4.0 15.1 22.7 21.6 13.1 3.8 5.0 18.9 28.4 27.3 18.9 7.6 5.0 37.8 56.7 53.3 34.3
CROP TMT 09.^ qu.u 114.0TOTAL 1385.3 526.0 473.4 342.7 1596.5 675.1 614.0 492.7 1976.9 990.9 887.7 663.6
0 cl
Wa.'

ANNEX 16Table 24
PAKISTAN
SALINITY CONTROL AND RECLAMATION PROJECT (SCARP) VI
CROP AREA, YIELD, PRODUCTION AND ECONOMIC VALUE OF PRODUCTION - TOTAL PROJECT
CROP PRESENT FUTURE WITHOUT PROJECT FUTURE WITH PROJECT
AREA YIELD PnOD GRCSS VA.,JDD NET ArEA YIELD PROD CROSS VALADD NET A9EA YT-LD PROD GROSS VALADD NET
(TH.HA) (T/HA) (TH.l) --- ?lL RS) ---- (TH.',A) (TI/HA) (TH.T) ---- (MI1L RS) ---- (TH.H~A) (T/HA) (Th.T) ---- (MIL RS)----
RICE 14.5 1.9 27.5 30.9 28.7 17.8 27.8 2.0 55.4 88.1 82.4 61.1 23.1 2.5 57.7 91.7 84.2 57.6
COTTON 150.6 1.0 150.6 724.2 670.1 525.7 123.8 1.4 173.4 784.5 737.9 616.7 162.6 1.6 260.2 1177.2 1105.4 873.7MAIZE 7.0 1.0 7.0 10.6 10.3 7.0 7.0 1.1 7.6 12.8 12.1 8.7 12.0 1.8 21.5 36.4 32.2 22.0MILLETS 24.0 0.7 15.6 72.8 72.4 65.3 32.8 0.7 22.6 72.3 70.9 61.4 31.4 0.8 25.1 80.2 77.1 62.6KHAR FOD 33.9 26.6 900.9 31.5 29.5 24.4 33.9 29.8 10C8.8 35.3 32.5 27.3 31.7 37.0 1172.2 41.0 35.4 26.8WHEAT 131.6 1.3 174.8 267.5 227.0 144.5 115.3 1.6 201.8 345.1 297.3 223.6 188.4 2.2 414.4 708.6 602.0 434.7RABI PULS 5.1 0.6 3.1 5.4 5.4 4.2 18.2 0.6 10.9 19.2 19.0 15.0 13.0 0.7 9.1 16.0 15.9 11.5OILSEED 27.3 0.5 13.6 26.2 26.0 17.7 30.5 0.6 17.9 45.1 44.6 35.0 41.8 0.7 30.9 77.9 70.2 48.9RABI FOD 52.5 25.0 1312.0 45.9 45.4 22.2 52.5 30.8 1618.0 56.6 56.1 32.8 41.7 37.0 1541.4 53.9 47.7 22.3SUGAR CAN 28.5 33.7 960.3 139.2 106.6 61.2 28.5 39.5 1126.3 253.4 204.7 164.4 38.0 46.0 1745.7 392.8 321.4 241.10TH PEREN 10.3 4.0 41.1 61.7 58.8 35.7 10.3 4.4 45.5 68.3 65.4 42.7 19.1 5.0 95.5 143.3 134.7 86.6
CROP INT 94.4 93.5 117.2TOTAL 3606.6 1416.0 1280.0 925.7 4288.2 1780.7 1622. 1288.7 5373.7 2819.2 2526..t1887.9
n3 k
N31I-
0

ANNEX 16
Table 25PAKISTAN
SAI,ThITY CONTROL AND RECLAMATION PROJECT (SCARP) VI
CRCP AREA, YIELD, PRODUCTION AND ECCNOMIC VALUE OF PRODUCTION - TOTAL PROJECTi/
CROP PRESENT FUTURE WITHOUT PROJECT FUTURE WITH PROJECT…-- - - - - - -- - -- - - -- - - - - - - - -- …-- -- - - - - - - - - - - -- - -- - - - - -- - - - - -- - - --- - - - - - -- - - - - -- - - - - - - - - -- - -- - - _ _ _ _ _ _ _ _ _ _ _ _ _ _ _ _ _- ___
AREA YIELD PROD GROSS VALADD NET AREA YIELD PROD GROSS VALADD NET AREA YIELD PROD GROSS VALADD NET(TH.HA) (T/HA) (TH.T) ---- (MIL RS)---- (TH.HA) (T/HA) (TH.T) ---- (MIL RS)---- (TH.HA) (T/HA) (TH.T) ---- (MIL RS)----
RICE 14.5 1.9 27.5 30.9 28.7 17.8 27.8 2.0 55.4 88.1 82.4 61.1 23.1 3.6 83.1 132.1 110.0 83.4COTTON 150.6 1.0 150.6 724.2 670.1 525.7 123.8 1.4 173.4 784.5 737.9 616.7 162.6 2.3 374.0 1692.3 1542.31310.6MAIZE 7.0 1.0 7.0 10.6 10.3 7.0 7.0 1.1 7.6 12.8 12.1 8.7 12.0 4.1 49.1 82.9 68.7 58.5MILLETS 24.0 0.7 15.6 72.8 72.4 65.3 32.8 0.7 22.6 72.3 70.9 61.4 31.4 1.4 43.9 140.4 124.8 110.3KHAR FOD 33.9 26.6 900.9 31.5 29.5 24.4 33.9 29.8 1008.8 35.3 32.5 27.3 31.7 55.0 1742.4 61.0 49.4 40.8WHEAT 131.6 1.3 174.8 267.5 227.0 144.5 115.3 1.8 201.8 345.1 297.3 223.6 188.4 2.8 527.4 901.9 737.3 570.0RABI PULS 5.1 0.6 3.1 5.4 5.4 4.2 18.2 0.6 10.9 19.2 19.0 15.o 13.0 0.8 10.4 18.3 18.2 13.8OILSEED 27.3 0.5 13.6 26.2 26.0 17.7 30.5 0.6 17.9 45.1 44.6 35.0 41.8 1.8 75.2 189.4 167.7 146.4RABI FOD 52.5 25.o 1312.0 45.9 45.4 22.2 52.5 30.8 1618.0 56.6 56.1 32.8 41.7 55.0 2291.3 80.2 67.6 42.2SUGAR CAN 28.5 33.7 960.3 139.2 106.6 61.2 28.5 39.5 1126.3 253.4 204.7 164.4 38.0 64.0 2428.8 546.5 444.2 363.9OTH PEREN 10.3 4.0 41.1 61.7 58.8 35.7 10.3 4.4 45.5 68.3 65.4 42.7 19.1 6.0 114.6 171.9 153.9 105.8
CROP INT 94.4 93.5 117 2TOTAL 360e e 120e. 0 '2DVO3 ,2,.7 4288.2 1780.7 1622. 1288.7 7740.2 4016.9 3484. 2845.7
1/ Including extension |
114 ~ ~ ~ ~ ~ ~ ~ ~ ~ ~ ~ ~ ~ ~ ~ ~ ~ ~ ~ ~ ~~~~~~~~~~~~~~uo

ANNEX 17Page 1
PAKISTAN
SALINITY CONTROL AND RECLAMATION PROJECT (SCARP) VI
Prices. Incomes and Farm Budgets
Economic Prices
1. The prices used in the economic analysis are based primarily onworld market prices, but adjustments have been made to reflect:
(a) historical relationships between world prices andactual cif or fob prices for Pakistan;
(b) transport and processing costs.
For crops which are not traded, economic prices are based on local financialprices adjusted by the ratio of economic prices to financial prices fortraded crops. Derivation of prices is described below.
Cotton
2. The economic price for cotton is based on the three main productsderived from seed cotton, namely lint, oil and cake. Processing ratios forcurrent technology in Pakistan are approximtely:
Lint 33Oil 7Cake 55Waste 5
Exports of cotton lint from Pakistan have historically fetched only 72% ofaverage world prices. On this basis, the 1976 price is Rs 12,770/ton (58U/lb),compared to an average world price of 80/lb. The estimated economic pricefor cotton seed oil allowing for transportation cost is Rs 5,780/ton and theprice of cake is Rs 1,340/ton. The economic price for cotton seed (excludingdomestic transportation handling and processing costs) is thus Rs 5,355/ton.Costs of domestic transportation are estimated at Rs 100/ton of seed cotton.Processing costs are estimated to be Rs 380/ton of seed cotton for ginning andbaling, and Rs 100/ton of seed (Rs 65/ton of seed cotton) for subsequentprocessing into oil and cake. The present net economic price of cotton istherefore Rs 4,810/ton. The 1985 prices based on Bank projections (adjusted forquality and international transport) for lint, cotton seed oil and cake areRs 10,200, Rs 5,024 and Rs 2,460/ton, respectively. With similar assumptions tothose described above concerning processing ratios and costs, the futureeconomic price of seed cotton is calculated to be Rs 4,525/ton.
203

ANNEX 17Page 2
Wheat
3. Wheat is currently imported into Pakistan. The cif cost of wheat(excluding PL 480) has historica:Lly averaged 95% of world prices, thus thepresent (1976) border price is Rs 1,390/ton. The project is situated in asurplus area which exports wheat elsewhere in Pakistan. The pattern ofinternal movements is such that production of more wheat in the project areawill save the transport costs from Karachi to Rahimyar Khan of the importedalternative. These costs, based on rail freight charges are estimated atRs 50/ton. Farm-to-market transport costs are Rs 30/ton. Thus, the economicprice of wheat is estimated at Rs 1,410/ton. In the future, Pakistan shouldbecome self sufficient in wheat, and thus the 1985 price is estimated asabove, except that the freight costs from Karachi are excluded, giving aprice of Rs 1,590/ton.
Rice
4. Coarse rice exports frcm Pakistan have historically fetched only68% of average world prices -- reflecting transport costs and quality dif-ferences. Based on 1976 prices, the fob price for rice is therefore Rs1,740/ton. Transport costs from Rahimyar Khan to the port are estimated atRs 50/ton of rice, and farm-to-market transport costs average Rs 30/ton ofpaddy. Milling costs are estimated at Rs 50/ton of rice. Assuming a millingratio of three units of paddy to two units of rice, gives a present economicprice of paddy of Rs 1,055/ton. The 1985 price on similar assumptions isestimated at Rs 1,520/ton.
Oilseeds
5. Prices paid by Pakistan for imports of brassica oilseeds have his-torically averaged 92% of world prices. Assuming transport and handling costsfor imports of Rs 50/ton and transport costs of Rs 30/ton for local produce(based on commission charged by handling agents), the economic price ofoilseed is estimated at Rs 1,920/ton at present, and Rs 2,520/ton in 1985.
Maize and Millets
6. These crops are neither imported nor exported, and internally arewheat-substitutes. The types of grain produced are not strictly comparablewith the World-traded types, being local varieties suited to local tastes.This is reflected in the domestic price structure, with maize and milletshaving the same (and occasionally higher) prices than wheat. To allow forthis, the economic price of these grains is set equal to that of wheat.
Sugarcane
7. Sugar is no longer imported into Pakistan. The economic price ofcane based on the world price, an assumed extraction ratio of 9% and transporthandling and milling costs of Rs L,620/ton of sugar (Rs 145/ton of cane)is estimated at Rs 140/ton at present, and Rs 220/ton in 1985.
204

ANNEX 17Page 3
Fodder
8. Given the heavy dependence on animal draft power and the prevalenceof milk animals, fodder is an important and valuable crop -- indeed, aroundtowns it is an important cash crop. In addition to crops grown specificallyfor fodder, several other crops also produce significant quantities of foddermaterial. All fodder produce is valued at market prices, plus a 30% premiumto reflect the difference between prevailing market prices for crops and worldprices in general.
Vegetables, Orchards, etc.
9. A large variety of crops fall into this category, and estimatedvalues have been used for the analysis.
Financial Prices
10. Financial prices are based on recent market prices in the projectarea, adjusted for transport costs to farmgate prices.
Future Prices
11. The present disparities between financial and economic prices areexpected to continue except in the case of oilseeds, where domestic priceshave recently increased rapidly to levels above world averages, but areexpected to stabilize in the future near to the economic price. For themajor crops, this is a conservative assumption for the purposes of computingfuture farm incomes, since the internal prices of some crops have recentlybeen allowed to move closer to economic prices. However, further increaseswould reduce income to GOP, especially from the taxes on cotton and rice,and would probably necessitate a balancing increase in some other agriculturaltax. Prices used in the analysis are shown in Table 1.
Incomes
12. Representative farm budgets for 5, 12.5 and 25 ac farms are shownin Table 3 for present, future-without and future-with-project situations.These are based on the cropping patterns shown in Table 2, and the cropbudgets developed in Annex 15.
13. Income from off-farm work has been computed by calculating theavailable labor per 100 ha CCA in each farm size category (based on censusdata on household sizes and farm size distribution), assuming a maximum of25 man-days/month/worker are available.
205

ANNEX 17Page 4
Farm Size Group Available Laborac man-day/month
(excluding temporary)
0 - 2.5 53.52.5 - 5.0 93.05.0 - 7.5 135.07.5 - 12.5 333.0
12.5 - 25.0 407.025.0 - 51).0 164.050.0 -150.0 67.0
150+ 6.0
14. Based on present labor demand estimates, the surplus/deficit oflabor by farm size and month (per 100 ha CCA) can be calculated -- forexample, in May, the labor requirement for 12.5 -- 25 ac farms is 450 man-days per 100 ha CCA (labor required is 15 days/ha, and this farm categorycovers 30% of CCA, i.e. 30 ha). Availability of labor on this category is407 man-days, therefore, there is a hiring requirement of 43 man-days. Thiscalculation, repeated for each farm size shows:
(1) The total hiring requirEment for the larger farms;
(2) The labor surplus from the smaller farms.
On the basis of the actual financial wage rate by month, the total paymentto hired workers is calculated (hiring requirement x wage rate). Dividingthis value by the available surplus labor gives the "probable" income of anavailable worker, which can then be distributed back over the labor surplusfarms, pro-rated by their surplus availability, to get an estimate of farmincome from hiring out labor by farm size per 100 ha CCA.
15. To convert this to income per farm, the number of farms (in each sizeclass) per 100 ha CCA is computed, and hence the income per farm can be found.Results for present and future-with-project (assuming a 30% increase in work-force) are shown in Table 4.
16. Without the project, the labor force would increase much morerapidly than demand, with the resuLt that less hired labor would be required,and there would be more competitio-a for available employment. The resultis very sensitive to the assumptionis made about migration to the urban areas,and it has therefore been assumed in the farm budgets that both the incometo and expenditures on hired labor would fall by 20% without the project.
17. The farm budgets for Uni-: III show estimated income and costs ifthe farmer purchases water from a private tubewell. To estimate the rateof return on a private tubewell, cr-op budgets and cropping patterns wereprojected for a farm having no access to tubewell water and a farm with a
206

ANNEX 17Page 5
tubewell (Table 5). The incremental value of production is Rs 350 per ac,and incremental water requirement is 14" at the crop (20" at the well). Theaverage value of rabi water is therefore estimated at Rs 300 per ac-ftat the crop, or Rs 200 per ac-ft at the well. In economic prices, cor-responding values are Rs 400 per ac-ft at the crop, Rs 280 at the well.The rate of return on a tubewell depends on the size of the holding. Sincewater is sold for approximately Rs 100 per ac-ft, but is worth doublethis on the land, the income to the owner depends on the relative amountssold and used on the land.
18. The cost to the farmer of a I cusec diesel tubewell is Rs 32,000.Of this, he pays Rs 8,000 down, and loan repayments of Rs 6,700 per yearfor 5 years, plus annual O&M cost of Rs 6,600.
19. The well is expected to need replacement after seven years, whenthe pump and motor will have a residual value of about Rs 4,000. Costscan therefore be summarized as follows:
Year Capital & Repayment /a O&M Total
0 8,000 6,600 14,6001 6,700 6,600 13,3002 6,700 6,600 13,3003 6,700 6,600 13,3004 6,700 6,600 13,3005 6,700 6,600 13,3006 6,600 6,6007 6,600 6,6008 (4,000) 6,600 2,600
/a Excluding any subsidies.
The well is expected to pump about 150 ac-ft per year. Per acre requirements(at the well) are 1.7 ac-ft in rabi. As estimated above, the owner receivesan extra Rs 200 for each ac-ft (at the well) used on his own land and Rs 100per ac-ft for water he sells.
Income for various farm sizes is estimated below:
10 ac 25 ac 50 ac
Own use (ac-ft) 17 43 85value (Rs) 3,400 8,600 17,000
Sales (ac-ft) 133 107 65value (Rs) 13,300 10,700 6,500
Total Income (Rs) 17,400 19,300 23,500
The estimated benefit and cost streams are shown below: 207

ANNEX 17Page 6
Year Costs (Rs) Benefit (Rs)
10 ac 25 ac 50 ac
0 14,6001 13,300 13,600 13,800 14,0002 13,300 14,000 14,400 15,0003 13,300 14,600 15,000 16,0004 13,300 15,300 16,000 18,0005 13,300 16,400 16,500 20,5006 6,600 17,000 18,500 22,0007 6,600 17,400 19,300 23,5008 (4,000)
Rate of Return 17% 23% 29%
Cost Recovery
20. Water charges in Punjab at present vary from crop to crop. Ratesfor the main crops are:
crop Rs/ac
Cotton 16.8Wheat 10.4Rice 14.4Sugarcane 31.2
21. On the basis of present water rates and cropping patterns, col-lections average Rs 6/ac in the non-perennial Units (II and III) and Rs 12/acin perennial units (total recoveries: Rs 10.9 M/yr).
22. The expected schedule of expenditures for operation, maintenanceand replacements of the project workcs are described in Annex 4. At fulldevelopment, the direct 0 & M costs amount to Rs 31 M/yr (excluding Unit IIIprivate tubewells) (in addition to O) & M expenditures on the existing worksamounting to Rs 25 M/yr). The discounted (at 10%) net present cost of thetotal expenditures amounts to Rs 965 M, excluding the cost of the DrainageWorks (see para 25).
23. Recoveries from beneficiaries are expected to remain at the presentlevels until one year after the completion of project works, thus the annuityrequired to recover full investment and 0 & M costs at 10% discount rate iscalculated assuming recoveries to run from Year Seven to Year 30, and amountsto approximately Rs 215 M/yr including Rs 25 M/yr to operate the existingsystem.
24. It is proposed that a stucLy of water charges and other agriculturaltaxes will be carried out. As a minimum, however, it is expected that waterrates in the province will be approximately doubled. Since SCARP areas 208

ANNEX 17Page 7
traditionally pay double the rates in non-SCARP areas, per acre recoveries(allowing for increased cropping intensity) in the project area would increasefivefold, and average Rs 62/ac in all Units except Unit III where they would beRs 31/ac. Total recoveries would thus amount to Rs 67 M/yr in the SCARP VIarea, which would cover about 31% of the annualized total project costs,including all 0 & M costs. Province-wide, however, revenues would produce asubstantial surplus (estimated at present prices to be 30% of current invest-ment levels) over and above 0 & M costs.
25. As has been the practice in previous SCARP projects, the recoveryof the capital cost of the drainage works would be spread over the entireirrigated area of Punjab. Full cost recovery, at 10% interest over 30 years,would amount to about Rs 1/ac CCA/yr.
26. A large portion of the capital costs of the proposed irrigationworks would be automatically recovered under the existing taxes on agricul-tural production. Most important of these in the SCARP VI area is the 25%ad valorem tax on exported cotton (which accounts for about 75% of all cottonproduction). The incremental income from the project beneficiaries to theGovernment from this tax is estimated at Rs 74 M per year.
27. Additional revenue would also come from the excise tax on sugarand the implicit tax on rice exports. The tax on sugar is primarily a taxon consumers since it is used to maintain the price of sugar above theworld price (while the price of cane is slightly below the world price),and is to some extent avoided by processing the cane into gur at the farmlevel. The tax on rice has only a limited effect in this area, whererelatively little is grown. Thus, the income to Government from the tax oncotton alone is used as a conservative estimate of the total incrementalincome from taxation.
28. The estimated revenue of Rs 74 M per annum would be sufficient torepay a further 34% of the irrigation investment, operation and maintenanceexpenditures in the proposed project over 30 years at 10% interest.
Project Rent
29. Table 3 shows project rent by farm size and project Unit after dueallowance for the riskiness of crop production, the cost of family labor anda management fee to the farm operator. The rent recovery is calculated onthe basis of incremental water charges divided by the project rent. In thecase of Unit II, where private tubewells would be replaced by public tubewells,the without-project payment for purchases of private tubewell water is treatedas an input cost. In Unit III where, under the project, private tubewellswould increase in number, the incremental cost of purchasing water from thesewells is included as part of the rent recovery.
30. Recovery of rent varies from Unit to Unit, and increases substantiallywith farm size. Average recoveries amount to about 23%.
209
November 1977

ANNEX 17Table
PAKISTAN
SALINITY CONTROL AND RECLAMATION PROJECT (SCARP) VI
Prices Used in Economics and Financial Analysis
Present Future (1985)Financial Economic Financial Economic
--------------------- (Rs/Ton)…-------------… --
Cotton 3,2C0 4,810 3,010 4,525
WheatGrain 1,100 1,410 1,240 1,590Fodder 95 120 95 120
1,195 1,530 1,335 1,710
RiceGrain 92) 1,055 1,325 1,520Fodder 5) 70 50 70
97') 1,125 1,375 1,590
MaizeGrain 1,25() 1,410 1,410 1,590Fodder 8t) 100 80 100
1,330 1,510 1,490 1,690
MilletsGrain 1,250 1,410 1,410 1,590Fodder 2,500C 3,250 1,190 1,605
3,75C 4,660 2,600 3,195Sugarcane
Cane 14C 140 220 220Fodder 'tops' 5 5 5 5
145 145 225 225
Oilseeds 2,560 1,920 2,520 2,520
FertilizerNitrogen 3,200 3,300 3,750 3,950Phosphate 2,720 2,750 3,000 3,350Potassium 1,185 1,250 1,200 1,300
PesticidesEndrin 11,870 13,000 11,870 13,000Methyl P. 20,600 22,620 20,600 22,620Dinecron 48,800 53,760 48,000 53,760Diazinon 8,512 9,400 8,512 9,400
210

PAKIISTAN ANNEX 17TO-ble 2
(% CCA)
Unit II Unit III U/nit IV Unit V
5 Cc 15 1/2 an 25 a. 5 ae 12 1/1 e 25 z 5 a 12 1/2 C 25 Cc9a 12 1/2 a 25 a
Ero 17 w P I 14 F 12 1 Fr W F PS 14 P1 If F 1 1 W P 4 w4 P w w4 P 14 w4 F 14 54 pI
Ri.. 4 12 4 3 10 7 2 9 3 6 13 14 2 9 3 5 9 3 2 2 4 2 2 6 5 1 7 1 3 0. 1 5 2 1 3 1
Cotto 36114239 34 20 35 33 21 33 32 1633 30120 3014 616 20 28 26 4025 25 35 23 23 33 29 24 36 26 22 30 24 17 28
olaise - - - I 1 3 2 2 5 - - - I 1. 1 2 2 2 - - - 1 1 2 2 2 3 - - - 2 3 3 5 4 4
ISillate 6 14 6 7 12 14 iSO 7 6213 6 5 9 5 4 9 4 4 4 5 3 3 4 2 2 2 5 6 5 3 4 6 1 3 7
f.dder 6 6 6 5 5 5 4 4 4 6 6 5 5 5 3 4 4 3 9 9 8 7 7 6 6 6 5 2 -12 __0 9 9 1 6 7 6
Total kharif 5415546144654 50 47 504644 4643 4242 4345~35736365334340 464455 414649 353446
Whea 27 16 37 24 19 35 23 17 32 21 16 42 20 13 40 29 23 30 304 314 40 29 29 37 26 26 34 33 2 5 40 31 2 6 35 28 22 34
Poises 1 7 4 1 5 4 i 4 4 3 6 3 1 5 2 1 3 1 2 2 2 1 1 2 1 1 1 2 7 2 1 2 1 4 1
Oilezeda 1 2 7 2 3 14 3 3 9 1 2 6 2 3 6 2 4 7 7 7 9 0 14 6 9 9 10 9 9 10 I0 15 10 1012 16
Fodder 5336312 12 12 9 12212 8a 11 11 1110 6 6 0 01_1 7 77_6 _ 9- 10_ _iO 14 - 0_ 7 -6 6 -6-
Totalre?bf 4443 6041 4157 3636353 3634 63 35228 52 49 49 61454554 4343 51 53 5i 63 5039 54- 45 44 51
Sogarocam I 1 3 2 2 5 2 2 6 6 7 8 7 10 10 7 11 11 5 5 6 4 6 7 7 7 8 5 5 6 6 6 7 7 6 8
Omhrheds& Misn. 1 i 2 2_ 2 5 3 3 7 1 1 1 2 2 2 3 5 3 i 1 1 2 2 2 3 3 3 2- _2_1 2 2 4 3L 3
Total Pw.-aial 2 2 5 4 4 10 5 5 13 7 8 9 1 2 2 16 4 4 6 6 7 8 6 9 10 10 11 6 6 -L 7 14 9 0 1
Total fotoneity 192 97 139 99 97 135 95 92 133 100 97 128 99 101 126 92 98 122 104 104 132 99 99 125 97 97 123 III 107 i31 107 106 125 100 96 119
(-ssUig peenastins)

PAKISTAN
SALINITY CONTROL AND RECLAMATION PROJECT (SCARP) VI
Farm Budgets (Rs)
5 ac 12.5 ac 25 ac
P 4/ W 4/ W4/PWWPWWUNIT II
Gross Income from Crops 4,170 4,180 8,410 10,185 10,960 21,830 20,100 22,000 43,750Net Wage Income (expenditure) 1,300 1,100 1,660 300 240 600 (1,000) (900) (2.100)
Total Farm Income 5,470 5,280 10,070 10,485 11,200 22,430 19,100 22,000 41,650
Operating Costs:Seasonal Inputs- 460 370 1,040 1,100 1,050 2,730 2,050 2,050 5,490Bullock Maintenance 2,000 2,000 2,000 2,000 2,000 2,000 4,000 4,000 4,000Water Charges 35 35 210 90 90 775 165 165 1,550Purchases of Water 170 150 - 400 355 - 800 680 -
Total Costs 2.669 25;9 ,950 3,590 3,495 5,,,C 7,015 6,895 ll,U4U
Net Value of Production 2,805 2,725 6,720 6,895 8,235 16,925 12,085 15,105 30,610
Subsistence Food Require-ments 2/ 1,800 2,340 2,340 2,100 2,730 2,730 2,400 3,120
Net Income 1,005 385 4,380 4,795 5,505 14,195 9,685 11,985 27,490
Project RentFarm Income 3/ 4,444 8,388 9,528 18,064 17,420 32,900Cost of Inputs (excluding
surface water) 2,520 3,040 3,405 4,730 6,750 9,490
Cost of Family Labor atMarket Prices 4/ 1,100 2,400 2,900 6,000 5,l0O 9,900
Net Value of Production 820 2,848 3,123 7,334 6,270 13,510
Project Rent 2,024 4,211 7,240
Increased Watercharges at % of Rent 9% 16% 19%
________________ ~~~~~~~~~~~~~~~~~~~~~~~~~~~~~~~~~~~~~~OQ Cy
1/ Including interest on seasonal loan at 12% D2/ Estimated at Rs 300 per capita, assuming 30% increase in household size in future cases.
N, 3/ Deducting 20% of Gross Crop value for risk (10%) and Management Fee (10%) 1-4
4/ P=Present, W = Future Without Project, W = Future With Project

PAKISTAN
SALINITY CONTROL AND RECLAMATION PROJECT (SCARP) VI
Farm Budgets (Rs)
5 ac 12.5 ac 25 ac
UNIT III
Gross Income from Crops 4,204 4,880 8,340 10,585 13,125 20,605 20,250 26,100 40,860
Net Wage Income (expdnditure) 1,300 1,100 1,660 300 240 600 (1,000) (900) (2,100)
Farm Income 5,504 5,980 10,000 10,885 13,365 21,205 19,250 25,200 38,760
Seasonal Inputs-/ 506 620 1,200 1,276 1,815 3,080 2,320 3,370 5,610
Bullock Maintenance 2,000 2,000 2,000 2,000 2,000 2,000 4,000 4,000 4,000
Water Charges 35 35 150 90 90 400 175 175 800
Purchases of Water 170 150 255 425 375 640 850 750 1,275
Total Costs 2,711 2,805 3,605 3,791 4,280 6,120 7,345 8,295 11,685
Net Value of Production 2,893 2,175 6,395 7,094 9,095 15,085 11,875 15,905 27,085
Subsistence Food Require-ments 2/ 1,800 2,340 2,340 2,100 2,730 2,730 2,400 3,120 3,120
Net Income 1,093 835 3,055 4,994 6,365 12,355 9,475 12,785 23,965
Project Rent
Farm Income-/ 5,004 8,332 10,740 17,129 20,160 31,010
Cost of Inputs (excludingsurface water) 2,620 3,200 3,815 5,080 7,370 9,610
Cost of Family Labor atMarket Prices 1,100 2,400 2,900 6,000 5,100 9,900
Net Value of Production 1,284 2,732 4,025 6,049 7,690 11,500
Project Rent 1,448 2,024 3,810
Incremental charges at % of Rent 15% 28% 30%
1/ Including interest on seasonal loan at 12% w
2/ Estimated at Rs 300 per capita, assuming 30% increase in household size in future cases.
3/ Deducting 20% of Gross Crop value for risk (10%) and Management Fee (10%)

PAKISTAN
SALINITY CONTROL AND RECLAMATION PROJECT (SCARP) VI
Farm Budgets (Rs)
5 ac 12.5 ac 25 ac
P w P W P W W
UNITS IV AND V
Gross Income fromC Crops 4,250 4,535 8,685 10,430 11,900 20,850 20,420 24,380 41,660Net Wage Income (expenditure) 1,300 1,200 1,660 300 270 600 (1,000) (900) (2,100)
Total Farm Income 5,550 5,735 10,345 10,730 12,170 21,450 19,420 23,480 39,560
Seasonal Inputs-/ 520 610 1,170 1,275 1,705 2,860 2,520 3,430 5,750Bullock Maintenance 2,000 2,000 2,000 2,000 2,000 2,000 4,000 4000 n ,00noWater Charges 60 60 3O0 15U 150 775 300 300 1,550
Total Costs 2,580 2,670 3,480 3,425 3,855 5,635 6,820 7,730 11,300
Net Value of Production 2,970 3,065 6,545 7,305 8,315 15,815 12,600 15,750 28,260
Subsistence Food Requirements 2/ 1,800 2,340 2,340 2,100 2,730 2,730 2,400 3,120 3,120
Net Income 1,170 725 4,205 5,205 5,585 12,085 10,200 12,630 25,140
Project Rent
Farm Income/ 4,828 8,288 9,790 17,280 18,604 31,228Cost of Inputs (excluding
surface water) 2,610 3,170 3,705 4,860 7,430 9,750Cost of Family Labor at Market
Prices 1,100 2,400 2,900 6,000 5,100 9,900
Net Value of Production 1,118 2,718 3,185 6,420 6,074 11,578
Project Rent 1,600 3,235 5,504
Increased Waterchages as % of Rent 16% 19% 23%
1/Including interest on seasonal loan at 12%2/ Estimated at Rs 300 per capita, assuming 30% increase in household size in future cases.3/ Deducting 20% of Gross Crop value for risk (10%) and Management Fee (10%)

ANNEX 17
PAKISTAN Table 4
SALINITY CONTROL AND RECLAMATION PROJECT (SCARP)VI
Hired Labor Income and Expenditure by Farm Size
Present
Size Average Area/ Ratio to Income/ FarmClass Size 100 ha CCA Farm Size 100 ha CCA Income
(ha)
0 - 1 .5 1 2 1297 648.5
1 - 3 2 7 3.5 4442 1269
3 -10 5 52 10 3515 351
10 - 20 15 20 1.3 -3138 -2413
over 20 50 20 .4 -8666 -21665
Future with Project
0 - 1 .5 1 2 2555 1277
1 - 3 2 7 3.5 5811 1660
3 - 10 5 52 10 1068 107
10 - 20 15 20 1.3 -8096 -6227
over 20 50 20 .4 -16937 -42342
215

ANNEX 17Table 5
PAKISTAN
SALINITY CONTROL AND RECLAMATION PROJECT (SCARP) VI
Yields and Cropping Patterns With and t'ithout a Tubewell
With Wells Without WellsTons/ha % Tons/ha %
Rice 2.5 5 2.5 5
Cotton 1.6 30 1.3 30
Maize 1.8 1 1.5 1
Millets 0.8 5 0.8 10
Khar. fodder 37.0 5 37.0 8
Wheat 2.2 40 1.2 10
Rabi .6ulses 0.7 2 0.5 10
Oilseeds 0.7 6 0.5 7
Rabi fodder 37.0 8 - -
Sugarcane 46.0 10 23.0 6
Other perennials 5.0 2 3.0 2
Total - 126 - 97
* Cane,perennials counted twice.
>
. m
2H1
216

ANNEX 18Page 1
PAKISTAN
SALINITY CONTROL AND RECLAMATION PROJECT (SCARP) VI
Economic Analysis
1. Based on the economic prices derived in Annex 16, the rate of returnof the project has been calculated under the following assumptions:
(a) Benefits. Only the direct economic incremental valueof production is included in the rate of return. Othereffects are discussed below (para 11).
(b) Crop production values are based on the yields and inputlevels set out in Annex 14.
(c) Labor costs are assumed to vary according to demand, witha minimum price set at Rs 5/day (compared to the financialminimum of Rs 8/day) and a maximum price set at Rs 12/day(financial equivalent Rs 18 day) (see Annex 15, Table 19).
The average price, weighted by month to take account ofvariations in demand, is Rs 6.92 at present and Rs 7.81with the project (Annex 15, Table 23). Constructionlabor has been valued at market prices.
(d) An exchange rate equal to the official rate of exchange.
2. Also included in costs is the opportunity cost of the increaseddiversions from storage which the project area would receive, estimated onthe basis of the analysis in Annex 16. This analysis shows that the averageeconomic value of water at the crop is Rs 400 per ac-ft on otherwiseunirrigated land. In estimating the opportunity cost of increased storagediversions, 75% of this figure has been used since:
(a) use of the water on already irrigated land will have a lowermarginal value;
(b) the figure of Rs 400 makes no allowance for incrementalinvestments or O&M expenditures which would be needed touse the water elsewhere.
3. The value of the extra diversions is thus computed as:
Diversion (AF) x Delivery Efficiency x 300 Rs/AFor 355,000 x .45 x 300 = Rs 47.9 M per year.
217

ANNEX 18Page 2
4. Development Phasing. Berefits directly attributable to projectworks will be realized rapidly. Yield increases would result primarily fromthe elimination of underirrigating, and increases in cropping intensity wouldalso occur relatively quickly due to the extra water supplies available.The build-up of projected benefits is also related to the project implemen-tation schedule for each Unit.
5. Unit II canal remodeling, which would provide the main source ofbenefits in kharif would be completed in Year Four, while tubewell instal-lation (which provides most of the rabi benefits) would be spread over YearsTwo, Three and Four. While benefits from canal remodeling accrue only afterthe works are completed, the tubeweLls provide partial benefits during theinstallation period. Kharif and rabi benefits are therefore consideredseparately. Without the project, i: is assumed that production would risesteadily and slowly to the values shown over a period of 15 years. With theproject, it is assumed that, after mn area receives improved kharif or rabiwater supplies, production in that season reaches 90% of future with projectlevels after six years, and thereafter improves slowly to the full withproject level of production. Table I shows the incremental benefits whichwould result from the project on the above assumption. It should be notedthat rabi benefits are prorated to begin accruing in Years Three, Four andFive to reflect the phasing of tubewell installations, while kharif benefitsfor the whole Unit begin in Year Five, as shown below.
Year Value of Production(Rs M)
Year W/O Project With Project Increment
1 253.7 253.7 02 256.0 256.0 03 258.2 260.6 /a 2.44 260.5 271.8 11.35 262.8 290.7 /b 27.96 265.0 312.9 47.97 267.3 343.9 76.68 269.5 390.4 126.99 271.8 439.9 168.110 274.1 471.9 197.811 276.3 488.5 212.212 278.6 496.2 217.613 280.0 503.9 223.914 281.7 511.5 229.815 283.6 519.4 235.816-30 285.6 527.1 241.5
/a Build up of rabi benefits from first tubewell installationsbegin.
/b Build up of kharif benefits due to completed canal remodelingbegins.
218

ANNEX 18Page 3
6. Unit III. The analysis of Unit III is very similar to the above,since project implementation follows the same pattern and benefits againdepend on canal remodeling in kharif and tubewell installation in rabi,which in this case begin immediately. Projected build-up of benefits is shownbelow.
Value of Production(Rs M)
Year W/O Project With Project Increment
1 276.0 276.0 0.02 286.8 288.1 1.33 297.6 303.2 5.64 308.3 318.9 /a 10.65 319.1 347.8 28.76 329.8 377.2 47.47 340.6 409.1 68.58 351.4 438.8 87.49 362.1 463.9 102.810 372.9 485.3 112.411 383.6 503.0 119.412 394.4 520.2 125.813 405.2 537.6 132.414 415.9 552.3 136.715 422.6 570.0 147.416-30 427.6 577.2 149.6
/a Build up of kharif benefits due to completed canalremodeling begins.
7. Unit IV and V. Analysis of these Units is simpler, since projectbenefits in both seasons stem primarily from improved canal supplies. InUnit IV, infrastructural improvements would be completed during Year Six,and the resulting benefits are projected below.
219

ANNEX 18Page 4
Unit IV Value of Production(Rs M)
Year W/0 Project With Project Increment
1 53.3 53.3 -2 55.4 55.4 -3 57.5 57.5 -4 59.6 59.6 -5 61.7 61.7 -6 63.8 67.2 3.47 65.9 74.8 8.98 68.0 82.6 14.69 70.1 92.7 22.610 72.2 97.6 25.411 74.3 102.2 27.912 76.4 106.6 30.213 78.5 110.9 32.414 80.6 115.1 34.515 81.8 117.8 36.016-30 82.8 120.0 37.2
Unit T Value of Production(Rs M)
Year W/O Project With Project Increment
1 342.7 342.7 -2 353.4 353.4 -3 364.0 364.0 -4 374.7 374.7 -5 385.3 385.3 -6 396.0 396.0 -7 406.6 422.4 15.88 417.3 460.1 42.89 427.9 497.7 69.810 438.6 558.1 119.611 449.2 595.8 146.612 459.8 616.4 156.613 470.5 631.7 161.214 481.1 646.0 164.915 486.8 654.7 167.916-30 492.7 663.6 170.9
8. Economic Rate of Return. Based on the incremental investment,operating and maintenance costs an.1 the above projeted benefits, which aresummarized in Table 1. The economLc rate of return of the project is esti-mated to be 19% over a 30 year perLod.
220
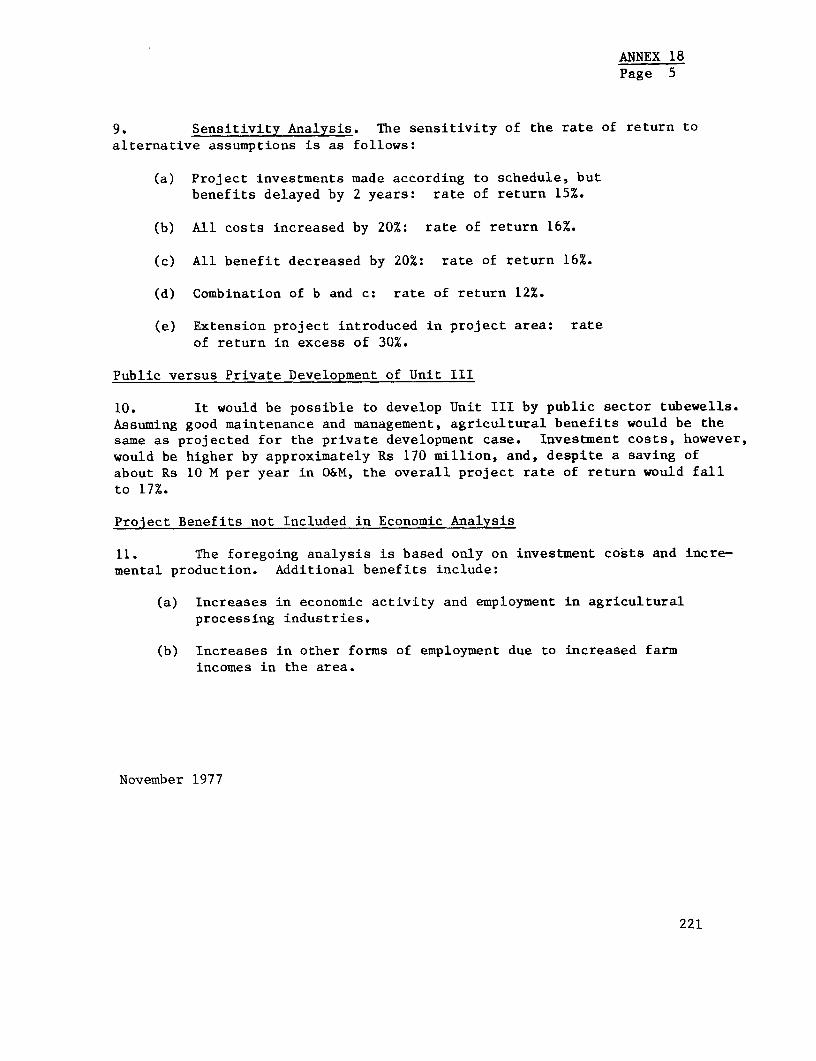
ANNEX 18Page 5
9. Sensitivity Analysis. The sensitivity of the rate of return toalternative assumptions is as follows:
(a) Project investments made according to schedule, butbenefits delayed by 2 years: rate of return 15%.
(b) All costs increased by 20%: rate of return 16%.
(c) All benefit decreased by 20%: rate of return 16%.
(d) Combination of b and c: rate of return 12%.
(e) Extension project introduced in project area: rateof return in excess of 30%.
Public versus Private Development of Unit III
10. It would be possible to develop Unit III by public sector tubewells.Assuming good maintenance and management, agricultural benefits would be thesame as projected for the private development case. Investment costs, however,would be higher by approximately Rs 170 million, and, despite a saving ofabout Rs 10 M per year in O&M, the overall project rate of return would fallto 17%.
Project Benefits not Included in Economic Analysis
11. The foregoing analysis is based only on investment costs and incre-mental production. Additional benefits include:
(a) Increases in economic activity and employment in agriculturalprocessing industries.
(b) Increases in other forms of employment due to increased farmincomes in the area.
November 1977
221

ANNEX 18Table I
PAKISTAN
SALINITY CONTROL AND RECLAMATION PROJECT (SCARP) VI
Estimated Cost and Benefit Streams
Rs M
Incremental Value ofCapital Operation, Maintenance Increased Rabi Incremental
Year Investment and Replacements Water Supplies Benefits
1978 94.1 - -
1979 193.3 1.0 1.3
1980 217.3 9.0 - 8.0
1981 242.0 19.0 14.8 21.9
1982 241.3 32.0 25.6 56.6
1983 116.3 36.4 35.8 98.7
1984 40.8 47.9 169.8
1985 46.9 47.9 271.7
1986 28.0 47.9 363.3
1987 46.4 47.9 455.1
1988 44.9 47.9 506.0
1989 52.6 47.9 530.2
1990 52.4 47.9 549.9
1991 62.8 47.9 565.6
1992 69.7 47.9 587.1
1993 55.6 47.9 599.2
1994 52.9 47.9 599.2
1995 52.9 47.9 599.2
1996 55.6 47.9 599.2
1997 413.7 47.9 599.2
1998 48.7 47.9 599.2
1999-8 51.7 47.9 599.2
2000 52.4 47.9 599.2
2001 108.2 47.9 599.2
2002 108.3 47.9 599.2
2003 55.6 47.9 599.2
2004 84.6 47.9 599.2
2005 90.3 47.9 599.2
2006 48;7 47.9 599.2
2007 48.7 47.9 599.2
2008 43.0 47.9 599.2
222

C H I P--cr 7 d I N
OP,,r1t0 ; PANJNAD,-A,
-22 PAKI5TAN o9Il 2O6
SALINITY CONTROL AND RECLAM\ATION >* hbd/
DETAILED PROJECT LOCATION gt _
N D A~~~~~~~~~~~~~~~~~~~~~~~~~~~~~
t<~~~~~~~~~~~~~~~~~~~~~~~~~~~~ Projec Area --- lnp and Uni Boundartes
lJbnro< _- WT4t r~~~~~~~~~~~~~~~~~~~~~~~ Mo,n Canals, Branches and Disjributaries
/ r r*~~~~~~~~~~~~~~~~~~~~~~~~~~~~~~~~~~~Ptn|ns .v.Fera n gram tna Chalistan De2sert
25~' I-I I
sn~~~~~~~~~~~~~~~~~~~~~~~~~~~~~ .~ ~ ~ ~ ~ ~ ~ ~ ~ ~ ~ ~ ~ ~ ~ ~ ~ ~ ~ ~ ~ ~ ~ ~ ~ ~~2-PAKIST0AN


A. ~ ~ ~ ~ ~ ~ ~ ~ ~ ~ ~ ~ ~~~~~~~~~~r- I~~~~~~~~~~~~~~~~~~~~~BRD-12600PAK IS TAN I SRt ach17
RAN / ~~~~~~~~~~~~~~~~SALINITY CONTROL AND RECLAMATION PROJC SARPM) B-GENERAL PROJECT LOCATION U 55 R
cc/cRc -.--.--.- Macr canals IRAN~~~~~~~~~~~~~~~~~~~~~~~~~~~~~~~~~~~~~~~ 5IA
5 ~~~~~~~AFGHANISTAN --P: seccs D>5
". fl~~~~~~~~~~~~~ Barroga I odwoDs A
T,b.~~~ci rcr R
N ac/Ohs/A ---- Mar roacs cocrsNcrr~~~~~~~~~~~~~~~~~~~~~hk
5 Rarlroacs y'~~~~~~~~~~~~~~~~~~~~~~~~~~~~~~~p~ F tANIS A~~ON 5 .-.. ~~~~~ rr ,KAl BUrdrL
.-- rerBra0orars' 4~
N a N ~~~~~~~~~~~~~~~~~~~~~~~~~~~~~~~~~~~~~~~~~~~~~~~~~~~~~~~~~~~~~~~~~~~~~~~~~~~e\ ~ ~ ~ ~ ~ ~ ~ ~ ~ ~ ~ ~ ~ ~ ~ ~ ~ ~ ~ .
Sc -- A~~~~~~~~~~~~~~~~~~~~~~~~~~
I N DI A RL~~~~~~~~~~~~~~~~~~~~~ C fHcIo NA
/ . N B Bad.AY %y cars >~ K --------- N>-
2~~~~~~~~~~~~~~~~~~~~~~~~~~O~~~~~~~~~ ~ r
~c I' - ccocns Kor -IT -;S
Tn Ito >7/csc 0,L lo - - hs00,
5AN
I LES I N D I A~~~~~~~~~~~~~~~~~~~~~~~