aa british insurance premium index– 2016 quarter 3 · the latest aa british insurance premium...
TRANSCRIPT

AA British Insurance Premium Index
© Automobile Association Insurance Services Limited 2016 Page 1
AA British Insurance Premium Index – 2016 quarter 3
27 October 2016
The AA British Insurance Premium Index (Index) has been tracking the quarterly movement of car and home insurance since 1994. It measures the five cheapest quotes for each 'customer' to provide an average or Shoparound index.
Motor insurance premiums 2
Home insurance premiums 7
Index motor insurance trends since 1994 10
Index home insurance trends since 1994 11
Media contact
Ian Crowder
01256 492 844 – [email protected]
The information in the Index may only be used internally by the business (Internal Business Use) on the following terms. Internal Business Use means use of the information contained in the Index in reports and submissions – that do not carry advertising – in internal business activities. It specifically excludes any commercial use and exploitation including any use whereby the user obtains direct or indirect revenue, for example as part of any publishing activity, promotion, marketing or advertising. The AA copyright notice must be displayed on all such information. Press journalists may use the Index for editorial purposes without prior permission.
Any use of the Index other than as above is not permitted without the prior written consent of the AA (contact details above).
The AA excludes all implied warranties and conditions to the fullest extent permitted by law. The AA does not in any way warrant the accuracy or completeness of the Index, and by using the Index the user acknowledges that it is relying upon its own skill in determining its suitability for any general or specific purpose and accepts that the Index may not be error free.
Automobile Association Insurance Services Limited is authorised and regulated by the Financial Conduct Authority (FCA).
AA British Insurance Premium Index
© Automobile Association Insurance Services Limited 2016 Page 2
Motor insurance premiums – 2016 quarter
Car premiums rise again
• Comprehensive quote £82 higher than a year ago
• AA warns Chancellor: "keep your hands off IPT" in Autumn Statement
• Whiplash reforms shelved – more premium rises expected
• Shopping around pushes premiums up
Car insurance premiums have continued to rise according to the latest AA British Insurance Premium Index. Over the three months ending 30 September, the Shoparound quote for a comprehensive car insurance policy increased by more than £20 to £585.84.1 This is a jump of 3.7% over the quarter.
Over 12 months, the average quoted premium has risen by 16.3%, adding almost £82 to a typical motor policy.
"We are witnessing sustained price increases once again, which is bad news for drivers," says Michael Lloyd, director of AA Insurance.
"And I can't see an immediate end to the current upward trend," he adds.
Two increases in Insurance Premium Tax (IPT) over the year have added about £18 to the average car insurance premium, and Lloyd is urging the Chancellor to keep his hands off it in the Autumn Statement.
"Motor insurance is a mandatory requirement, and there is absolutely no justification for further hikes in IPT in the Autumn Statement. Add the predicted price increases, and any additional tax could increase the number of uninsured drivers."
Lloyd also blames the persistent whiplash epidemic and the cost to insurers of price comparison site business (currently the subject of a Competition & Markets Authority study) as factors contributing to upward premium pressure.
Continued
1 The AA Shoparound index is an average of the five cheapest premiums, quoted from the broker, the direct market and price comparison sites, for each risk in a nationwide basket of risks representative of the insurance buying public. This method gives accurate quarterly price tracking.

AA British Insurance Premium Index
© Automobile Association Insurance Services Limited 2016 Page 3
"In August almost 70,000 small injury claims of up to £25,000 were made.2 And there were more than 839,000 over 12 months, of which around 750,000 were for whiplash.3
"The whiplash epidemic has dogged the British motor insurance industry for a decade and continues to do so.
"Drivers are still being pressured into making claims for often minor collisions they might have forgotten about. This is pushing up claims costs, because insurers can't prove that an injury wasn't suffered.
"I do recognise that whiplash can be a serious and debilitating condition. But the activities of claim firms makes life more difficult for those with a genuine injury."
Lloyd has reacted with "despair" that the additional and much-delayed Ministry of Justice reforms designed to curb the activities of claim firms, announced in the 2015 Autumn Statement, appear to have been shelved.4
Lloyd also believes that drivers are being poorly served by a market structure that encourages people to shop only on price, often disregarding or being unaware of the level of cover being offered.
"There's little incentive for insurers to offer low, loss-making introductory quotes on price comparison sites, because not only do they pay a fixed introductory fee that could be a substantial proportion of the premium, but there is little likelihood that such customers will remain.
"Customers don't necessarily recognise that a low initial premium is a first-year introductory discount so they go elsewhere. Inevitably this will tend to push those initial premiums up and perhaps offer greater scope for insurers to reward loyalty."
Continued
2 Data from Ministry of Justice Claims Portal.
3 Source: Association of British Insurers.
4 On 13 October 2016 the Ministry of Justice said that whiplash reforms, announced by Chancellor George Osborne in the 2015 Autumn Statement, were being shelved but "not abandoned". Whiplash claims are estimated to cost £2 billion per year.

AA British Insurance Premium Index
© Automobile Association Insurance Services Limited 2016 Page 4
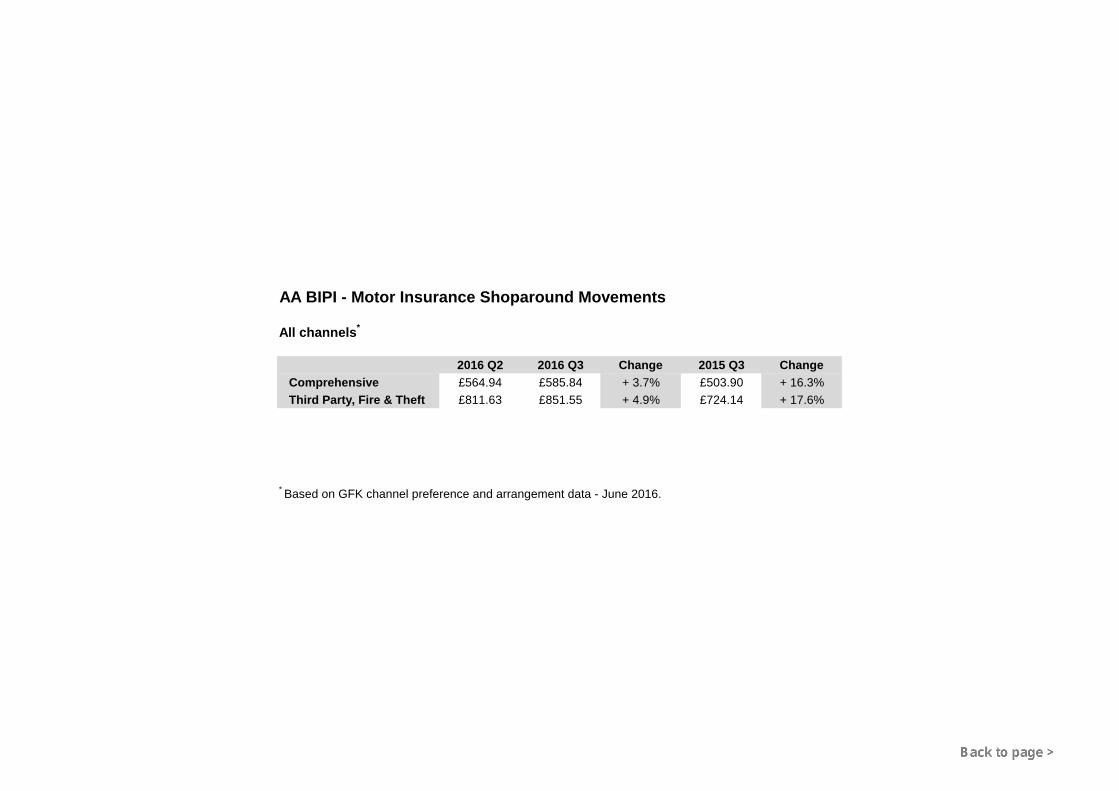
Shoparound premium summary
2016 Q2 2016 Q3 Change 2015 Q3 Change
Comprehensive £564.94 £585.84 +3.7% £503.90 +16.3%
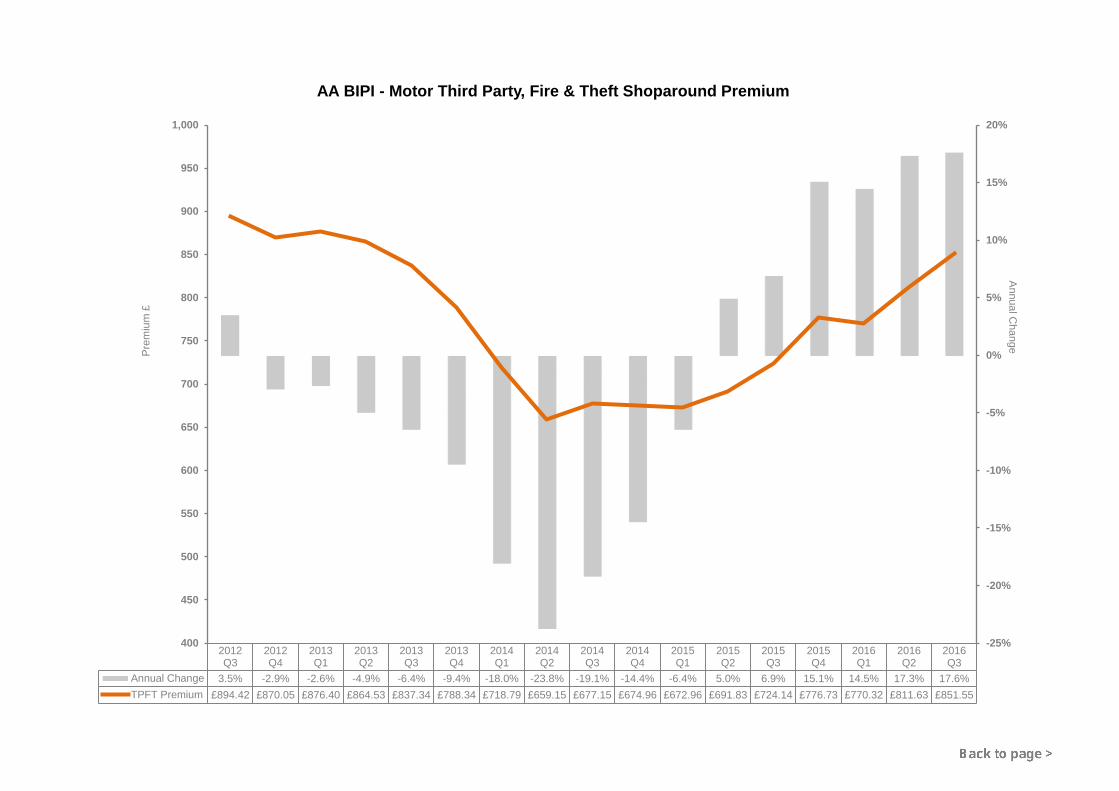
Third Party, Fire & Theft £811.63 £851.55 +4.9% £724.14 +17.6%
Third Party, Fire and Theft appears to have a higher premium than comprehensive because the basket of risks reflects the type of driver that buys such cover, typically young drivers.
Winners and losers – Shoparound by region
The data by TV regions suggest that the biggest loser this quarter is Northern Ireland (UTV). Shoparound premiums increased by over 11%, making the six counties the costliest part of the UK to insure a car at £861.79. We believe this is partly explained by less competition, with fewer insurers offering cover, as well as a different, costlier legal system for dealing with personal injuries.
On the mainland, the north-west (Granada) remains overall the most expensive place to insure a car at £802.19, despite one of the smallest premium increases over the quarter (2.8%). This is ahead of London which saw premiums increase by 3.2% to £722.57. The cheapest region to insure a car remains Scotland (STV), with a Shoparound premium of £422.10 (up 3.7%), followed by the south (Meridian) with an increase of 3.8%, taking the Shoparound premium to £497.67.
TV region 2016 Q2 2016 Q3 Change
Anglia £544.13 £567.52 +4.3%
Border & TyneTees £558.66 £573.08 +2.6%
Central £570.60 £597.42 +4.7%
Granada £780.56 £802.19 +2.8%
London £700.26 £722.57 +3.2%
Meridian £479.38 £497.67 +3.8%
STV £406.89 £422.10 +3.7%
UTV £774.25 £861.79 +11.3%
Wales £519.67 £536.14 +3.2%
West & West Country £466.36 £483.12 +3.6%
Yorkshire £627.68 £648.88 +3.4%
Continued

AA British Insurance Premium Index
© Automobile Association Insurance Services Limited 2016 Page 5
Winners and losers – Shoparound by age
Young drivers (17–22) saw their Shoparound premium rise by 3.6% over the quarter to £1,286.96. This compares with drivers aged 70 and over who saw 5.1% added to their Shoparound premium, to £474.42. The latter is partly explained by an increase in both the number and average age of drivers who find, like young drivers, fewer insurers willing to offer cover for them, as well as a greater likelihood of claims. Older passengers are more likely to suffer an injury in even a very minor collision than younger people.
The biggest premium increase was for those aged 60–69, up 5.4% to £361.04. Nevertheless, this age group still attracts the lowest average premium.
Age 2016 Q2 2016 Q3 Change
17–22 £1,242.74 £1,286.96 +3.6%
23–29 £725.86 £747.55 +3.0%
30–39 £481.87 £498.32 +3.6%
40–49 £449.22 £469.63 +4.5%
50–59 £399.93 £417.46 +4.4%
60–69 £347.49 £366.37 +5.4%
70+ £451.20 £474.42 +5.1%
Continued
AA British Insurance Premium Index
© Automobile Association Insurance Services Limited 2016 Page 6
Motor insurance premiums – summary tables and charts 2016 Q3
Download the Index (Excel file) for motor insurance
2,800 risks for car insurance
AA British Insurance Premium Index – Motor insurance trends since 1994 (chart)
All channels combined
Motor insurance Shoparound premium movements (chart)
Motor insurance Shoparound premium movements (table)
Motor insurance Shoparound premium movements – region and age (tables)
Comprehensive insurance Shoparound premium trend (chart)
Third-party insurance Shoparound premium trend (chart)

AA British Insurance Premium Index
© Automobile Association Insurance Services Limited 2016 Page 7
Home insurance premiums – 2016 quarter 3
A tale of mixed fortunes for home owners
• Contents quotes up, buildings and combined slightly down
• AA urges Chancellor to keep his hands off Insurance Premium Tax
• Overall, home premiums still lower now than in 2012
The latest AA British Insurance Premium Index shows that the average quoted premium for a typical combined home buildings and contents policy has fallen by 1.1%, or £1.75, over the three months ending 30 September.
But that fall masks big differences in movement between standalone buildings and contents policies. While the typical Shoparound quote for a buildings policy has fallen by just 0.5% (or 62p), that for a contents policy has risen by 5.8% (or £3.51).5
Over 12 months, however, all three types of home policy have seen premium increases: buildings up 13.6% to £113.59; contents up 8.4% to £64.22; and a combined buildings and contents policy up 6.1% to £158.45.
This suggests that those who buy a combined policy can often expect to save around £19 compared with buying two standalone policies from the same insurer. Yet by shopping around, it can be cheaper to buy buildings and contents policies from different providers.
Michael Lloyd, director of AA Insurance, believes that although the third-quarter results present a mixed result, the overall premium trend is upward.
"Some commentators suggest that the home insurance sector is expected to begin showing losses as the year turns," he says. 6
Continued
5 The AA Shoparound index is an average of the five cheapest premiums, quoted from the broker, the direct market and price comparison sites, for each risk in a nationwide basket of risks representative of the insurance buying public. This method gives accurate quarterly price tracking.
6 According to Ernst & Young (October 2016), the home insurance market is expected to move from a small underwriting profit at the end of this year to losses next year, assuming that there is no major flooding which would necessitate a release of insurance company reserves.

AA British Insurance Premium Index
© Automobile Association Insurance Services Limited 2016 Page 8
"Home insurance has become increasingly competitive as more customers shop around, particularly on price comparison sites. While this has tended to keep the lid on premiums, there is a cost in terms of commission paid by insurers whenever a policy is sold, which may, paradoxically, lead to premium inflation. The Competition & Markets Authority is currently consulting on comparison site pricing, and the insurance industry, including the AA, is contributing to that process."7
Lloyd notes that claims costs – particularly contents claims – have been rising. The increase in Insurance Premium Tax has in addition fuelled premium increases this year.
"I strongly urge the Chancellor to avoid penalising responsible home owners for protecting their property in the Autumn Statement," he says.
The industry is also bearing the cost of developing Flood Re, the not-for-profit fund owned and managed by the insurance industry. It makes home insurance available and affordable for those whose homes are in high flood-risk areas. Setting up Flood Re required government legislation. It is the first scheme of its kind in the world and is funded by a levy on the insurance industry.
"Fortunately, there have been no serious weather events for some time, but as winter comes on the possibility can't be ruled out. Widespread flooding or storm damage claims before the end of the year that, say, exceed £1 billion would translate into sharp premium increases next year," Lloyd adds.
He says that home insurance premiums have proven over the years to be resilient to the dramatic spikes that have affected motor premiums, and it continues to represent remarkably good value for money. He points out: "Although premiums have been steadily rising over the past year they are still significantly lower than they were in 2012."
Shoparound premium summary
2016 Q2 2016 Q3 Change 2015 Q3 Change
Buildings £114.21 £113.59 -0.5% £100.02 +13.6%
Contents £60.71 £64.22 +5.8% £59.26 +8.4%
Combined £160.20 £158.45 -1.1% £149.32 +6.1%
Continued
7 CMA study into digital comparison tools.

AA British Insurance Premium Index
© Automobile Association Insurance Services Limited 2016 Page 9
Home insurance premiums – summary tables and charts 2016 Q3
Download the Index (Excel file) for home insurance:
750 risks for home insurance
AA British Insurance Premium Index - Home insurance trends since 1994 (chart)
All channels combined
Home insurance Shoparound premium movements (chart)
Home insurance Shoparound premium movements (table)
Home insurance Shoparound premium movements – region (tables)
Home insurance Shoparound premium movements – age (tables)
Home insurance Shoparound premium movements – property type (tables)
Home insurance Shoparound premium movements – year built (tables)
Buildings insurance Shoparound premium trend (chart)
Contents insurance Shoparound premium trend (chart)

0
50
100
150
200
250
300
350
400
450
500
550
1994Q2
1995Q1
1995Q4
1996Q3
1997Q2
1998Q1
1998Q4
1999Q3
2000Q2
2001Q1
2001Q4
2002Q3
2003Q2
2004Q1
2004Q4
2005Q3
2006Q2
2007Q1
2007Q4
2008Q3
2009Q2
2010Q1
2010Q4
2011Q3
2012Q2
2013Q1
2013Q4
2014Q3
2015Q2
2016Q1
Inde
xAA British Insurance Premium Index - Car Insurance Shoparound Average Trends
Comprehensive Third Pary, Fire and Theft

0
50
100
150
1994Q2
1995Q1
1995Q4
1996Q3
1997Q2
1998Q1
1998Q4
1999Q3
2000Q2
2001Q1
2001Q4
2002Q3
2003Q2
2004Q1
2004Q4
2005Q3
2006Q2
2007Q1
2007Q4
2008Q3
2009Q2
2010Q1
2010Q4
2011Q3
2012Q2
2013Q1
2013Q4
2014Q3
2015Q2
2016Q1
Inde
x
AA British Insurance Premium Index - Home Insurance Shoparound Average Trends
Buildings Contents

AA British Insurance Premium Index - Motor Shoparound Premium All Channels
2016 Q2 2016 Q3Comprehensive £564.94 £585.84Third Party, Fire & Theft £811.63 £851.55
A base rate of 100 was set at July 1994. The British Insurance Premium Index gives a quarterly update on the movements of home insurance on 750 risks each for buildings and contents, and on 2,800 car insurance risks - 2,500 comprehensive and 300 TPFT. July 1994 and subsequent premiums are assumed average premiums rebased in line with BIPI production methods over time.
The Index shows average car insurance premiums based on open market rates from 80 of the UK's leadinginsurers and home premiums across 72 insurers. Composites, direct writers and online providers are included.
The quarterly move compares the market average premium this quarter with the previous quarter.
The shoparound premium is the average of the five lowest premiums quoted by the insurers in the marketsurvey. This more closely reflects the price paid, but does not take account of discretionary discounts offered.
All premiums shown include Insurance Premium Tax at the prevailing rate.Premiums shown for July 1994 alone are free of IPT
While it is not possible to include risks from every town in the UK, those selected are typical risks, reflectinga cross section of the insurance market. Movements by specific towns are checked separately using a basketof 250,000 risks.
0
100
200
300
400
500
600
700
800
900
Comprehensive Third Party, Fire & Theft
Prem
ium
£
2016 Q2 2016 Q3
AA BIPI - Motor Insurance Shoparound Movements
All channels*
2016 Q2 2016 Q3 Change 2015 Q3 ChangeComprehensive £564.94 £585.84 + 3.7% £503.90 + 16.3%Third Party, Fire & Theft £811.63 £851.55 + 4.9% £724.14 + 17.6%
* Based on GFK channel preference and arrangement data - June 2016.

AA BIPI - Motor Insurance Shoparound Movements
Summary by region - all channels
ShoparoundRegion 2016 Q2 2016 Q3 ChangeAnglia £544.13 £567.52 + 4.3%Border & TyneTees £558.66 £573.08 + 2.6%Central £570.60 £597.42 + 4.7%Granada £780.56 £802.19 + 2.8%London £700.26 £722.57 + 3.2%STV £406.89 £422.10 + 3.7%Meridian £479.38 £497.67 + 3.8%UTV £774.25 £861.79 + 11.3%Wales £519.67 £536.14 + 3.2%West & West Country £466.36 £483.12 + 3.6%Yorkshire £627.68 £648.88 + 3.4%
Summary by age - all channels
ShoparoundAge 2016 Q2 2016 Q3 Change17-22 £1,242.74 £1,286.96 + 3.6%23-29 £725.86 £747.55 + 3.0%30-39 £481.17 £498.32 + 3.6%40-49 £449.22 £469.63 + 4.5%50-59 £399.93 £417.46 + 4.4%60-69 £347.49 £366.37 + 5.4%70+ £451.20 £474.42 + 5.1%
Summary by age and gender - all channels
Female ShoparoundAge 2016 Q2 2016 Q3 Change17-22 £1,101.99 £1,136.09 + 3.1%23-29 £664.02 £683.27 + 2.9%30-39 £466.68 £483.48 + 3.6%40-49 £448.51 £465.96 + 3.9%50-59 £399.34 £417.35 + 4.5%60-69 £343.06 £361.04 + 5.2%70+ £421.61 £444.45 + 5.4%
Male ShoparoundAge 2016 Q2 2016 Q3 Change17-22 £1,382.62 £1,436.68 + 3.9%23-29 £792.87 £817.36 + 3.1%30-39 £495.43 £512.95 + 3.5%40-49 £449.86 £472.99 + 5.1%50-59 £400.58 £417.58 + 4.2%60-69 £351.22 £370.93 + 5.6%70+ £484.16 £507.86 + 4.9%

2012Q3
2012Q4
2013Q1
2013Q2
2013Q3
2013Q4
2014Q1
2014Q2
2014Q3
2014Q4
2015Q1
2015Q2
2015Q3
2015Q4
2016Q1
2016Q2
2016Q3
Annual change 0.1% -6.8% -6.6% -9.8% -12.4% -14.3% -16.2% -19.3% -14.7% -10.5% -6.7% 4.8% 8.4% 19.5% 20.7% 17.2% 16.3%Comp premium £621.90 £604.92 £586.03 £570.07 £544.83 £518.59 £490.81 £459.80 £464.81 £464.23 £457.78 £481.83 £503.90 £554.84 £552.45 £564.94 £585.84
-20%
-15%
-10%
-5%
0%
5%
10%
15%
20%
25%
300
350
400
450
500
550
600
650
700
750
800Annual C
hange
Prem
ium
£
AA BIPI - Motor Comprehensive Shoparound Premium
2012Q3
2012Q4
2013Q1
2013Q2
2013Q3
2013Q4
2014Q1
2014Q2
2014Q3
2014Q4
2015Q1
2015Q2
2015Q3
2015Q4
2016Q1
2016Q2
2016Q3
Annual Change 3.5% -2.9% -2.6% -4.9% -6.4% -9.4% -18.0% -23.8% -19.1% -14.4% -6.4% 5.0% 6.9% 15.1% 14.5% 17.3% 17.6%TPFT Premium £894.42 £870.05 £876.40 £864.53 £837.34 £788.34 £718.79 £659.15 £677.15 £674.96 £672.96 £691.83 £724.14 £776.73 £770.32 £811.63 £851.55
-25%
-20%
-15%
-10%
-5%
0%
5%
10%
15%
20%
400
450
500
550
600
650
700
750
800
850
900
950
1,000Annual C
hange
Prem
ium
£
AA BIPI - Motor Third Party, Fire & Theft Shoparound Premium

AA British Insurance Premium Index - Home Shoparound Premium All Channels
2016 Q2 2016 Q3Buildings £114.21 £113.59Contents £60.71 £64.22Combined £160.20 £158.45
A base rate of 100 was set at July 1994. The British Insurance Premium Index gives a quarterly update on the movements of home insurance on 750 risks each for buildings and contents, and on 2,800 car insurance risks - 2,500 comprehensive and 300 TPFT. July 1994 and subsequent premiums are assumed average premiums rebased in line with BIPI production methods over time.
The Index shows average car insurance premiums based on open market rates from 80 of the UK's leadinginsurers and home premiums across 72 insurers. Composites, direct writers and online providers are included.
The quarterly move compares the market average premium this quarter with the previous quarter.
The shoparound premium is the average of the five lowest premiums quoted by the insurers in the marketsurvey. This more closely reflects the price paid, but does not take account of discretionary discounts offered.
All premiums shown include Insurance Premium Tax at the prevailing rate.Premiums shown for July 1994 alone are free of IPT
While it is not possible to include risks from every town in the UK, those selected are typical risks, reflectinga cross section of the insurance market. Movements by specific towns are checked separately using a basketof 250,000 risks.
0
20
40
60
80
100
120
140
160
180
Buildings Contents Combined
Prem
ium
£
2016 Q2 2016 Q3

AA BIPI - Home Insurance Shoparound Movements
All channels*
2016 Q2 2016 Q3 Change 2015 Q3 ChangeBuildings £114.21 £113.59 - 0.5% £100.02 + 13.6%Contents £60.71 £64.22 + 5.8% £59.26 + 8.4%Combined £160.20 £158.45 - 1.1% £149.32 + 6.1%
* Based on GFK channel preference and arrangement data - June 2016.

AA BIPI - Home Insurance Shoparound Movements
Buildings summary by region - all channels
ShoparoundRegion 2016 Q2 2016 Q3 ChangeBorder & TyneTees £112.51 £112.93 + 0.4%Central & Granada £111.39 £110.78 - 0.6%London & Meridian £119.40 £118.97 - 0.4%STV £110.73 £110.12 - 0.5%Wales £126.11 £124.69 - 1.1%West & West Country £109.03 £107.03 - 1.8%Yorkshire & Anglia £110.80 £110.26 - 0.5%
Contents summary by region - all channels
ShoparoundRegion 2016 Q2 2016 Q3 ChangeBorder & TyneTees £57.35 £60.80 + 6.0%Central & Granada £63.40 £66.92 + 5.6%London & Meridian £61.48 £65.88 + 7.2%STV £55.83 £58.23 + 4.3%Wales £58.99 £60.80 + 3.1%West & West Country £56.91 £59.49 + 4.5%Yorkshire & Anglia £61.68 £65.20 + 5.7%
Combined summary by region - all channels
ShoparoundRegion 2016 Q2 2016 Q3 ChangeBorder & TyneTees £154.94 £153.47 - 0.9%Central & Granada £159.46 £157.23 - 1.4%London & Meridian £168.01 £166.65 - 0.8%STV £153.36 £151.45 - 1.2%Wales £168.30 £166.67 - 1.0%West & West Country £149.61 £147.83 - 1.2%Yorkshire & Anglia £156.34 £154.53 - 1.2%
AA BIPI - Home Insurance Shoparound Movements
Buildings summary by age - all channels
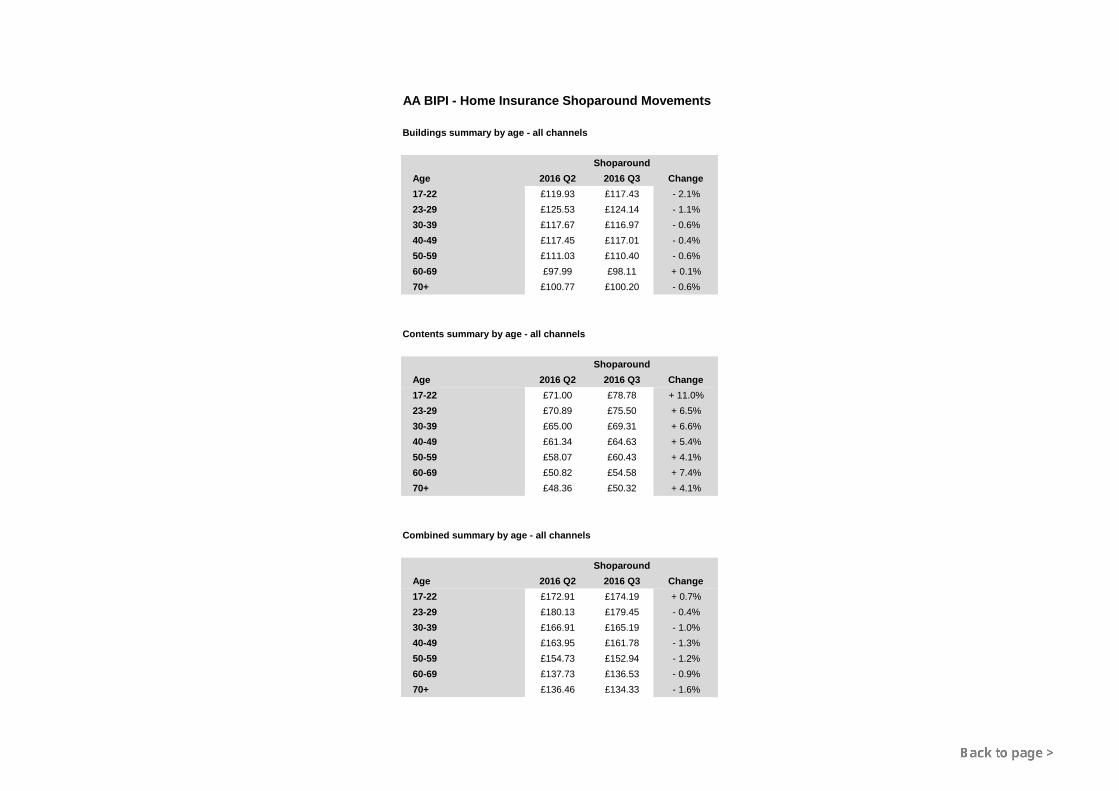
ShoparoundAge 2016 Q2 2016 Q3 Change17-22 £119.93 £117.43 - 2.1%23-29 £125.53 £124.14 - 1.1%30-39 £117.67 £116.97 - 0.6%40-49 £117.45 £117.01 - 0.4%50-59 £111.03 £110.40 - 0.6%60-69 £97.99 £98.11 + 0.1%70+ £100.77 £100.20 - 0.6%
Contents summary by age - all channels
ShoparoundAge 2016 Q2 2016 Q3 Change17-22 £71.00 £78.78 + 11.0%23-29 £70.89 £75.50 + 6.5%30-39 £65.00 £69.31 + 6.6%40-49 £61.34 £64.63 + 5.4%50-59 £58.07 £60.43 + 4.1%60-69 £50.82 £54.58 + 7.4%70+ £48.36 £50.32 + 4.1%
Combined summary by age - all channels
ShoparoundAge 2016 Q2 2016 Q3 Change17-22 £172.91 £174.19 + 0.7%23-29 £180.13 £179.45 - 0.4%30-39 £166.91 £165.19 - 1.0%40-49 £163.95 £161.78 - 1.3%50-59 £154.73 £152.94 - 1.2%60-69 £137.73 £136.53 - 0.9%70+ £136.46 £134.33 - 1.6%
AA BIPI - Home Insurance Shoparound Movements
Buildings summary by property - all channels
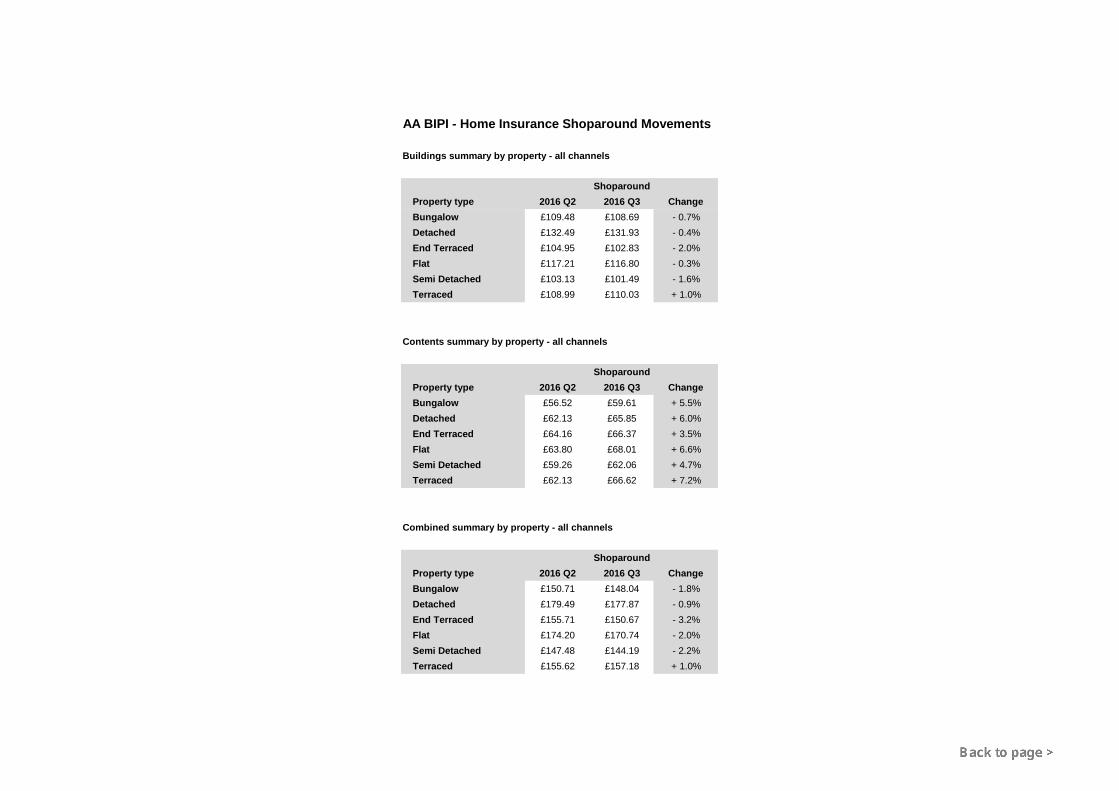
ShoparoundProperty type 2016 Q2 2016 Q3 ChangeBungalow £109.48 £108.69 - 0.7%Detached £132.49 £131.93 - 0.4%End Terraced £104.95 £102.83 - 2.0%Flat £117.21 £116.80 - 0.3%Semi Detached £103.13 £101.49 - 1.6%Terraced £108.99 £110.03 + 1.0%
Contents summary by property - all channels
ShoparoundProperty type 2016 Q2 2016 Q3 ChangeBungalow £56.52 £59.61 + 5.5%Detached £62.13 £65.85 + 6.0%End Terraced £64.16 £66.37 + 3.5%Flat £63.80 £68.01 + 6.6%Semi Detached £59.26 £62.06 + 4.7%Terraced £62.13 £66.62 + 7.2%
Combined summary by property - all channels
ShoparoundProperty type 2016 Q2 2016 Q3 ChangeBungalow £150.71 £148.04 - 1.8%Detached £179.49 £177.87 - 0.9%End Terraced £155.71 £150.67 - 3.2%Flat £174.20 £170.74 - 2.0%Semi Detached £147.48 £144.19 - 2.2%Terraced £155.62 £157.18 + 1.0%

AA BIPI - Home Insurance Shoparound Movements
Buildings summary by year built - all channels
ShoparoundYear built 2016 Q2 2016 Q3 Change<1920 £137.64 £137.74 + 0.1%1920-1945 £114.29 £114.23 - 0.1%1946-1979 £104.45 £103.54 - 0.9%1980-1999 £99.02 £97.35 - 1.7%2000+ £91.64 £88.72 - 3.2%
Contents summary by year built - all channels
ShoparoundYear built 2016 Q2 2016 Q3 Change<1920 £65.75 £70.42 + 7.1%1920-1945 £63.62 £67.51 + 6.1%1946-1979 £57.22 £60.00 + 4.9%1980-1999 £57.12 £59.93 + 4.9%2000+ £58.41 £63.69 + 9.0%
Combined summary by year built - all channels
ShoparoundYear built 2016 Q2 2016 Q3 Change<1920 £189.15 £189.15 - 0.0%1920-1945 £163.61 £161.18 - 1.5%1946-1979 £147.06 £144.64 - 1.6%1980-1999 £139.37 £137.49 - 1.4%2000+ £139.53 £137.07 - 1.8%
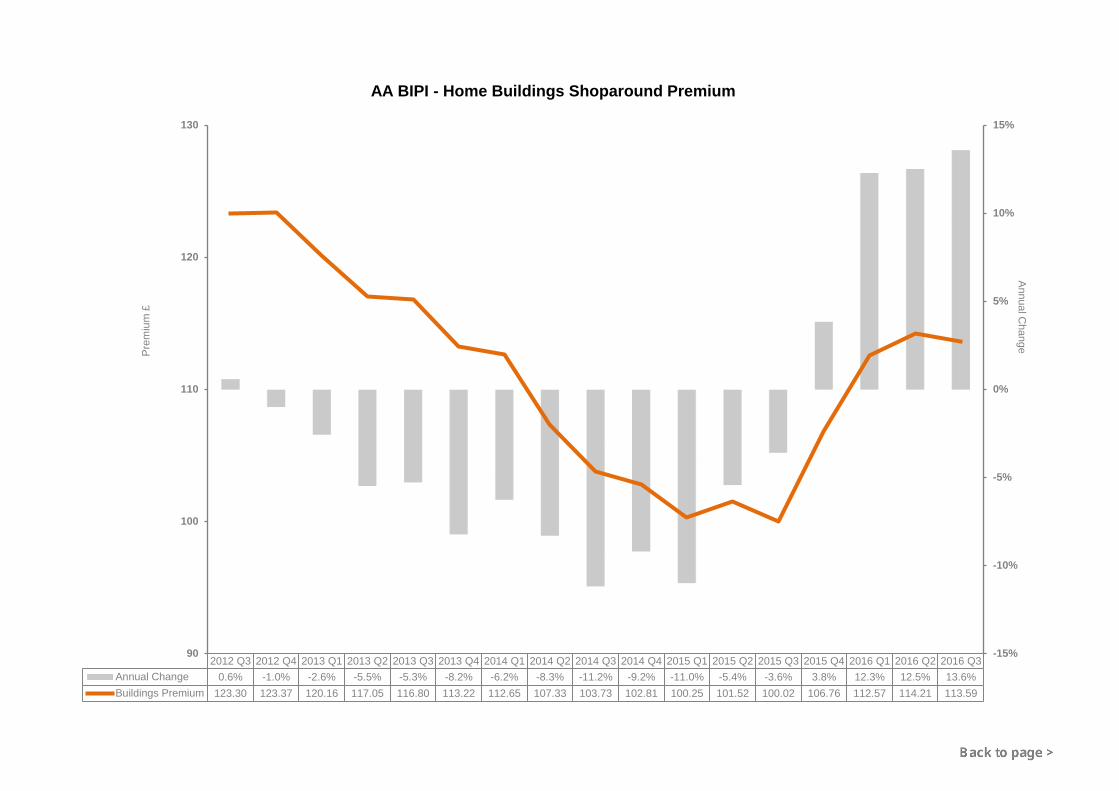
2012 Q3 2012 Q4 2013 Q1 2013 Q2 2013 Q3 2013 Q4 2014 Q1 2014 Q2 2014 Q3 2014 Q4 2015 Q1 2015 Q2 2015 Q3 2015 Q4 2016 Q1 2016 Q2 2016 Q3Annual Change 0.6% -1.0% -2.6% -5.5% -5.3% -8.2% -6.2% -8.3% -11.2% -9.2% -11.0% -5.4% -3.6% 3.8% 12.3% 12.5% 13.6%Buildings Premium 123.30 123.37 120.16 117.05 116.80 113.22 112.65 107.33 103.73 102.81 100.25 101.52 100.02 106.76 112.57 114.21 113.59
-15%
-10%
-5%
0%
5%
10%
15%
90
100
110
120
130
Annual Change
Prem
ium
£
AA BIPI - Home Buildings Shoparound Premium

2012 Q3 2012 Q4 2013 Q1 2013 Q2 2013 Q3 2013 Q4 2014 Q1 2014 Q2 2014 Q3 2014 Q4 2015 Q1 2015 Q2 2015 Q3 2015 Q4 2016 Q1 2016 Q2 2016 Q3Annual Change -2.7% -5.2% -2.6% -4.0% -3.4% -6.4% -7.9% -6.0% -8.1% -8.5% -8.2% -6.9% -4.9% -3.5% -1.2% 0.7% 8.4%Contents Premium 70.22 70.87 70.54 68.93 67.84 66.33 64.98 64.76 62.32 60.68 59.63 60.32 59.26 58.53 58.93 60.71 64.22
-10%
-8%
-6%
-4%
-2%
0%
2%
4%
6%
8%
10%
50
52
54
56
58
60
62
64
66
68
70
72
74
76
78
80Annual C
hange
Prem
ium
£
AA BIPI - Home Contents Shoparound Premium