a5 'miimlilliluhi drsni/rl-80-1 in cylindric- etc(u ... · stress intensities around...
TRANSCRIPT

A5 073 ARMY MISSILE COMMAND REDSTONE ARSENAL AL GROUND EQU--ETC F/6 14/57"Auna STRESS INTENSITIES AROUND TRANSVERSE SURFACE FLAWS IN CYLINDRIC- ETC(U)
OCT 79 j A SCHAEFFELUNCLASSIFIED DRSNI/RL-80-1 ML'm"Iimlilliluhi-EEggEEEggEEE-ElgEEElgglIrnuuII

TECHNICAL REPORT RL-80-1
(I STRESS INTENSITIES AROUNDTRANSVERSE SURFACE FLAWS IN
-CYLINDRICAL SHELLS BY PHOTOELASTIC*STRESS FREEZING
Iohn A. Schaeffel, Jr./Ground Equipment and Missile Structures Directorate
US Army Missile Laboratory DTIC. S -ELECTE
1 October 1979 S APR 1 4 8 D
L. A
niacdetc~noe A-anml, Alfa aa 36009
CApproved for public release; distribution unlimited.
L_.JC-)
SMI FORM 1021, 1 JUL 79 PREVIOUS EDITION IS ONSOLETE
66.1- 'k . 80A 4 140

11
DISPOSITION INSTRUCTIONS
DESTROY THIS REPORT WHEN IT IS NO LONGER NEEDED. DO NOTRETURN IT TO THE ORIGINATOR.
DISCLAIMER
THE FINDINGS IN THIS REPORT ARE NOT TO BE CONSTRUED AS ANOFFICIAL DEPARTMENT OF THE ARMY POSITION UNLESS SODESIGNATED BY OTHER AUTHORIZED DOCUMENTS.
TRADE NAMES
N: USE OF TRADE NAMES OR MANUFACTURERS IN THIS REPORT DOESNOT CONSTITUTE AN OFFICIAL ENDORSEMENT OR APPROVAL OFTHE USE OF SUCH COMMERCIAL HARDWARE OR SOFTWARE.

TKJ~ I
UNCLASSTFIIDSECURITY CLASSIFICATION OF THIS PAGE (WhMen Date Entered)
REPORT DOCUMENTATION PAGE BEFREAD OMLVC ORs. REPORT NUMBER
2.GOVT ACCESSION No. 3. RE ENT'S CATALOG NUMBER
RL-80-14. TITLE (Irtd S btfl.) S. F REPORT & PERIOD COVERED
, TRESS INTENSITIES AROUND PANSVERSE .URFACE ELAWS -- R-* TN gLiNDRICAL SHELLS BY PiOTOELASTIC-STRESS e
- 6. PERFORMING ONG. REPORT NUMBER
OA
. e.THQ( .. 8. CONTRACT OR GRANT NUMBER()
* j~~ Jn. A-/Schaeffel.Jr-
9 . PERFORMING ORGANIZATION NAME ANO ADDRESS 10. PROGRAM ELEMENT PROJECT, TASK
CommanderUS Army Missile Commandi ATTN: DRSMI-RLA 7P7
*Redstone Arsenal. Alabama 35809
Cozmander17 9
ATTN: DRSNI-RPT 'S. NUMBER Of PAGES
S1. MONITORING AGENCY-NAME & ADDRESS(U different from Controlling Office) IS. SECURITY CLASS. (of this tep )
UNCLASSIFIED
IS. DECLASSIFICATION/DOWNGRADINGSCNEDULE
IS. DISTRIBUTION STATEMENT (of this Repot)
-.~ Approved for public release; distribution unlimited.
4
17. DISTRIBUTION STATEMENT (of the abstract entered In Block 20, It differnt trm Report)
IS. SUPPLEMENTARY NOTES
IS. KEY WORDS (Continue an reereae if necessary and Idenltty by block numbor)
Stress Intensity Fringe OrderStress Freezing Transverse CrackPhotoelastic BirefringentIsochromatic Combined LoadingPart Circular Flaw
211, AtrACT (Coffa i m. ei ab Nsm nain..e soEIdtdfity' block nambet)---- This report documents a set of seven tests for the determination ofstress intensity factors for isotropic cylinders with transverse part-circular cracks loaded in combined uniaxial extension and internal pressure.Part-circular cracks were machined into birefringent Hysol CP5-4290 photo-elastic cylinders. The cylinders were then subjected to combined loading whilein a stress freezing cycle. Slices of the cracks were made at various anglesand analyzed with a photoelastic polariscope. A least-squares curve fit ofthe photoelastic data was used to generate k stress intensity factors. ---
DO ." 14 fllOo OF 7 NOV ems OUSOLETE UNCLASSIFIEDSECURITY CLASIFICATIOlI OF THIS PAGE (WNn Data Enteed)
Z./.. (" S, ". ,3

- UNCLASSIFIEDSUCUmPY CLASSIFICATION OF THIS PAGE(Wmn Daea Zulo.)
-2ft--. data are plotted versus slice angle into the crack for various crack
parameters. The results of the tests were compared with the results ofprevious tests in which the cylinders were loaded in either pure uniaxialtension or internal pressure.
I
4
UNCLASSIFIED
SECU04ITY CLASSIFICATION OF THIS PAGE4Whefl bat Euit.d)

m
CONTENTS
Section Page
1. Introduction ............................................................. 5
11. T heory ................................................................. 5
I. Experimentation .................................................. 8
IV. Results and D iscussion .................................................... 9
V. Summary and Conclusions ............................................... 10
R eferences ............................................................. 31
Appendix A. Test Data ................................................. 33
Appendix B. Computer Code ............................................ 41
Sym bols ......................... ..................................... 45
y'p
fist spec al
I I _
ILLUSTRATIONS
Figure Page
I. Transverse Flaw Loading Geometry for a Hollow Cylinder .................... II
, 2. Notation for the Part-Circular Surface Flaw ................................ II
* 3. Sketch of Crack-Tip Coordinates .......................................... 12
4. Typical Set of Slice Data, Illustrating the Determination of K, . . . . . . . . . . . . . . .. 13
5. Schematic Configuration for Internal Pressure and/or Extension Loading
of C ylinders ............................................................ 14
. 6. Example Slicing Scheme for a Transverse Flaw .............................. 15
7. Stress Intensity Factor Versus 0 for the Transversely-Flawed Cylinder
Loaded in Uniaxial Tension (R = 0.875 inch) ............................... 16
8. Stress Intensity Factor Versus 0 for the Transversely-Flawed Cylinder
Loaded in Uniaxial Tension (R = 1.500 inch) ............................... 17
9. Stress Intensity Factor Versus 0 for the Transversely-Flawed CylinderLoaded with Internal Pressure (R = 0.875 inch) ...... .................. 18
10. Stress Intensity Factor Versus 0 for the Transversely-Flawed Cylinder
Loaded with Internal Pressure (R = 1.500 inch) ............................. 19
II. Stress Intensity Factor Versus 0 for the Transversely-Flawed CylinderLoaded with Internal Pressure and Extension (R = 0.875 inch, A/T = .200) ...... 20
12. Stress Intensity Factor Versus 0 for the Transversely-Flawed Cyiinder
Loaded with Internal Pressure and Extension (R = 0.875 inch, A/T .400) ...... 21
2

ILLUSTRATIONS (Concluded).
Figure Page
13. Stress Intensity Factor Versus 0 for the Transversely-Flawed Cylinder
Loaded with Internal Pressure and Extension (R = 0.875 inch, A/T = .500) ..... 22
14. Stress Intensity Factor Versus 0 for the Transversely-Flawed CylinderLoaded with Internal Pressure and Extension (R = 0.875 inch, A/T = .600) ..... 23
15. Stress Intensity Factor Versus 0 for the Transversely-Flawed CylinderLoaded with Internal Pressure and Extension (R = 1.500 inch, A/T = .200) ..... 24
16. Stress Intensity Factor Versus 0 for the Transversely-Flawed Cylinder
Loaded with Internal Pressure and Extension (R = 1.500 inch, A/T = .400) ..... 25
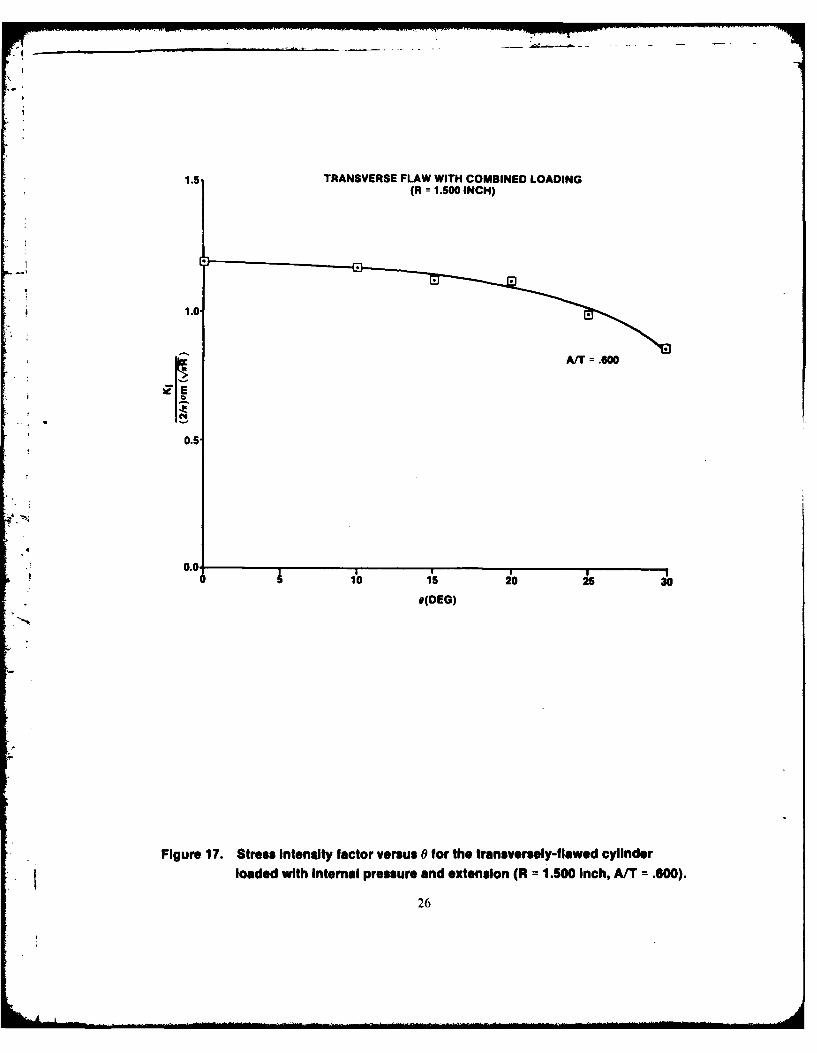
17. Stress Intensity Factor Versus 0 for the Transversely-Flawed Cylinder
Loaded with Internal Pressure and Extension (R 1.500 inch, A/T = .600) ..... 26
3

ZDIMJI PAUBJOD
1. INTRODUCTION
This work is a continuation of the efforts of M ullinix and Smith [I land Vandiver et al.
121. Their work involved the determination of stress intensity factors for homogeneous
cylinders loaded under one of three conditions: internal pressure, bending, extension and
having part circular longitudinal or transverse cracks in the outer wall. The present work
considers the problem of finding stress intensity factors under the combined loading action of
internal pressurization and extension. Transverse flaws in cylinders were considered for this
effort.
Although flaws on the surface of cylinders usually occur as semi-elliptical in shape, the
flaws in this work had to be made mechanically. This was accomplished by cutting part-
circular flaws with circular saw blades to simulate an elliptical crack. The approximation has
been made before and does not appear to offer any serious error. In this effort the assumed
stress field at the crack tip border is defined as a 50-50 stress mixture derived from internal
cylinder pressurization and extensional loading. Fifty percent of the applied stress was
obtained from internal pressurization while the remaining fifty percent was obtained from
extension.
If. THEORY
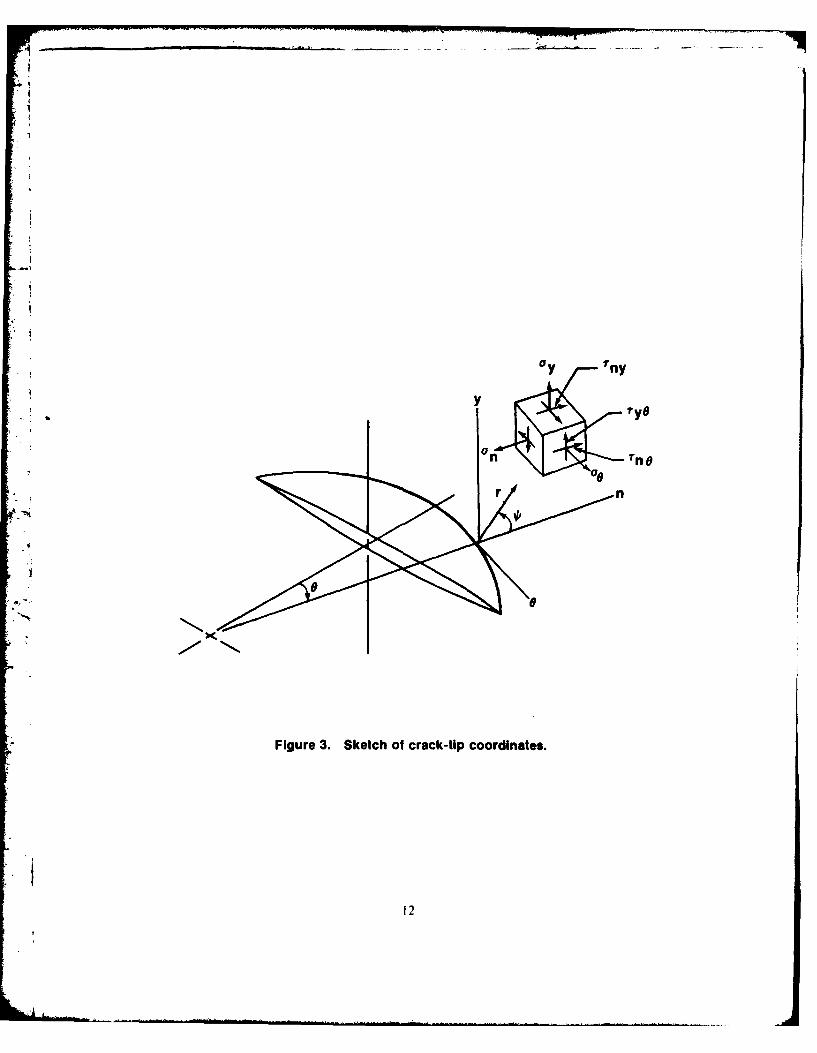
The geometry for the part-circular transverse flaw may be described by the intersection
of a circular element representing the flaw boundary with a hollow cylinder. Figures I and 2
illustrate this geometry. For the opening mode of deformation, the stress distribution near the
part-circular crack and in a plane perpendicular to the crackfront is given as [3,4,5]
a X2 Cos 1 -sinI in ! } (I)n 22 2r)
_1 0s 7 1 +sin sink
y I
(27rr)
nY (21Tr)
In Equation (I), K, is the stress intensity factor and the coordinates for the crack border
are shown in Figure 3. The effect on the stress field of the crack border curvature as well as the
5

location and shape of other boundaries is reflected in the magnitude of K1, the stress intensity
factor. It is assumed that the stresses singular in r are much larger than terms regular in r very
near the crack tip. Since experimental measurements must be made away from the crack tip
here regular terms may make a significant contribution to the total stress field then another
way of determining K, must be found. Irwin 16J developed an approximation for the regular
terms by assuming a uniform stress field, o.. was superimposed at the crack tip and parallel to
the crack plane. With his approximation the local stress field is given as
a K2 _) cos 2 1 s insin(-
I % -(2r, Cos 1 + sin I sin
Y (2Trr)~
.rfny - (2,) sin - o 2 T-
Uon does not affect the singular stress field but does alter the isochromatic fringe pattern whichis proportional to the maximum in-plane shearing stress. The maximum shearing stress, r.., is
usually determined readily from photoelasticity.
From Irwin's stress equations, the maximum shearing stress in the plane perpendicular
to the crack front, y-n, can be obtained from
2 (a n _ )2 2 (3)Tn = - + T2 ny
as
{222 r 2 (4)
2
+ a .... . ...... ....... ..... . . ......... .. .. . .il 1I

In photoelasticity, the maximum shearing stress from the stress optic law is
T fN (5)ax 2t
where,
t -thickness of the specimen measured parallel to the direction of light propagation.
N isochromatic fringe order.f photoelastic fringe constant of the material.
.In practice, ra.,, is measured along the line tA = 7r/2 where the maximum shearing stress is
known to be large. Simplification of Equation (4) with 41 = 7r/2 results in the equation
2 (6)
42 K, ,
max ~r-- o on
Only the stress intensity factor K, is used in fracture criteria. Smith et al. 17] found that by
solving Equation (6) for Tma, and truncating the results to the same order in r as Equation (2)
that
h (7)T =-- - + 0 7nax C
If an apparent value of K, Kap is defined as,
Kap =\ r , (8)
then Equation (7) can be written as
ap =K + N/ r aCn (9)
Equation (9) shows that in the region dominated by the singular stresses that there is a linear
relationship between the apparent K and the square root of r. In determining K1. the values of
K., are plotted versus r' 2 for a photoelastic slice specimen. Data points which fall on a straight
7

line are selected while all others are rejected. A least-squares straight-line curve fit is then givento the selected points and the value of K , is determined by taking the value of K, at r = 0, since
Kp = K, at r 0. Figure 4 gives an example for a typical photoelastic slice specimen.
For clarity, the results of this experimental effort are compared with those of Reference[2 1. To compute the overall stress level for experimentally subjecting a cylinder, Reference [5]
was consulted. Thresher and Smith generated graphs of stress intensity factors for surface
cracks in finite solids. Using their information along with the maximum allowable workingstress in the photoelastic material a determination of a., the nominal cylinder-wall stress, was
* made. From, a,, the maximum working internal pressure P of the cylinder was obtained from
P. T a (10)R m
where
T = Wall thickness of the cylinder.Rc = Radius of cylinder measured to the center of the cylinder wall.
For the case of pure internal pressure loading of a cylinder reported in [2],
P. = 2 T IIC
To compute the extensional loading P for the cylinder with a 50-50 stress mixture,
. • P=lo AM C (12)
while for the case reported for pure extensional loading in [2],
P = cy A ( 3Pt m c (13)
All stress levels were comparable since their ultimate determination was from the same source,
Thresher and Smith [5).
!11. EXPERIMENTATION
The determination of stress intensity factors for cylinders loaded in internal pressureand extension followed the work given in References I II and 121 which used three dimensional

photoelasticity. A series of seven combined loading tests were performed. The photoelastic
material, Hsol CP5-4290, was cast by the Hysol Corporation, Olean, New York, and used in
the experimentation. The cylinders are nominally 5.875 inch in outside diameter with a 0.75-
inch wall thickness. All the specimens had flaws oriented transverse to the cylinder axis. These
flaws were machined with a circular saw blade 0.006-inch thick. Blade radii of 0.875 and 1.500
inch were used to produce flaws of two different sizes.
For the seven tests, the internal pressure and extension loads were determined using
Equations (10) and (12). Figure 5 illustrates the apparatus for generating the internal gas
pressure and extensional loading. The uniform tension load was supplied by hanging dead
weights on the cylinder. The internal pressure load was supplied by compressed air passing
through a regulator. The gas pressure was measured by a Mercury manometer.
After the surface flaw was machined, the cylinder was annealed by thermal soaking at
280 degrees Fahrenheit for six hours followed by cooling at the rate of one degree Fahrenheit
per hour. The stress freezing of the models was accomplished using the same thermal cycle as
for annealing except under loading conditions. After the stress freezing cycle, slices
perpendicular to the crack border were removed from the model by means of band saw. Figure
6 illustrates a few of the various angles at which slices were taken. The number of slices varied
from test to test depending on the flaw size. Each slice was polished with sandpaper. The CP5-
4290 material's fringe constant was obtained from previous beam tests.
To improve resolution for analysis, slices were placed in an oil bath consisting of 75.5
percent by volume of Halowax oil and 24.5 percent mineral oil. Since the indices of refraction
of the oil and CP5-4290 were the same, light scatter was minimized. The slices were observed in
a comparator polariscope at 10X magnification.
By means of an XY-table on the polariscope. points on the slices could be located to
within ±0.0001 inch. Fractional fringe orders were obtained using Tardy compensation.
IV. RESULTS AND DISCUSSION
The specimen test parameters and dimensions for the combined uniaxial tension and
internal pressure loading tests are indicated in Table 3. Tables I and 2 were reproduced from
Reference [21 for comparison purposes and are for the separate loading cases. Figures 7-lOare
graphs of the non-dimensional stress intensity factor versus slice angle for transverse flawed
cylinders loaded either in uniaxial tension or internal pressure. Figures ll-17are graphs of the
non-dimensional stress intensity factor versus slice angle for transverse flawed cylinders

...- t .-. .,. . .. . . -. . r . . 7 .. . . ., 7 . .. . . . .. .a - -- . . .- . . .. . -- ". . .• . . . . . . .
I7
J
loaded in combined uniaxial tension and internal pressure. The combined loading case data
compares favorably with the separate uniaxial and internal pressure load cases. In general, the
data follows the same experimental trends and the stress intensity factors obtained for the
combined loading case falls within the range of the individual load cases.
V. SUMMARY AND CONCLUSIONS
A series of seven separate tests were conducted in which part circular flaws simulating
natural elliptical cracks were machined into Hysol CP5-4290 cylinders. The cylinders were
subjected to combined internal pressure and uniaxial tension loading. A photoelastic stress
freezing cycle was conducted for each cylinder. Following the stress freezing cycle each
cylinder was sliced and analyzed using a polariscope with Tardy compensation. The stress
intensity factors were shown plotted versus slice angle and were compared with a previous set
of tests reported in Reference [2] The results indicate that the more complicated combined
loading case produces results comparable to the separate loading cases. It appears that linear
superposition of solutions for each stress intensity factor case (i.e., uniaxial loading or internal
pressure loading) is valid.
-0
; I0(

411
-4-" TRANSVERSE
FLAW
Figure 1. Transverse flaw loading geometry for a hollow cylinder.
INSIDE SURFACE
RCAC
I
AA
Figure 2. Notation for the part-circular surface flaw.
0 7 r
ry
'as
Figure 3. Sketch of crack-tip coordinates.
12

* I 19-
* 185
17-
16-
00
__15-
C NOMENCLATURE0 TEST DATA USED TO
0-14- DETERMINE K1
13 ~TEST DATA REJECTED,
12-
11 1/2K1 11.5 psiIin.
0 0.1 0.2 0.3
rl/2 (In.1/ 2)
Figure 4. Typical set of slice data, illustrating the determination of K P
13

7OVEN HEATER
I IAIR LINENOMENCLATURE
EMERGENCY
AIR PRESSUREBY-PASS VALVEI
I AIRPRESSURE
REGULATOR EXTERNALAIR PRESSURE
I ISOURCE
EXTENSION
'-i LOADING
~MANOMETER• ;I 0 (MERCURY)
I FLAWED SPECIMEN IIN INTERNAL PRESSUREAND EXTENSION I
EXTERNALAIR-BLEED VALVE
OUTPUT AIR
Figure 5. Schematic configuration for internal pressure and/or extension loading ofcylinders.
14

150
300200 450
SLICE SPECIMEN
1 05

CIRCUMFERENTIAL FLAWS IN EXTENSION(R =0.875 INCH)
AA 0.55
E A/T 00.551
10.f
A/T 0.0.39
0.0 I0 10 20 30 40
O(DEG)
Figure 7. Stress Intensity factor versus e for the transversely-flawed cylinderloaded In unlaxial tension (R = 0.875 Inch).

2.5- CIRCUMFERENTIAL FLAWS IN EXTENSION(R I-1.5 INCH)
2.0-
A/T =1.10
~-A/T =0.693
A/T =0.430
A/T 0.201
Is0 20 30 40B (deg)
Figure 8. Stress Intensity factor versus 8 for the transversly-flawed cylinderloaded In unlaxial tension (R = 1.500 Inch).
17

CIRCUMFERENTIAL FLAW WITH INTERNAL PRESSURE1.5R =0.875 INCH
0.0 0.531
.0.5
Figure 9. Stress Intensity factor versus 6 for the transversely-flawed cylinderloaded with Internal pressure (A = 0.875 Inch).
LI

CIRCUMFERENTIAL FLAW WITH INTERNAL PRESSURE1.5(R =1.50 INCH)
0 A/T =0.940
A/T =0.684
.. A/T =0.443
tA/T 0.200
010 20 30 40
0 (DEG)
Figure 10. Stress Intensity factor versus 0 for the transversely-flawed cylinderloaded with Internal pressure (R = 1.500 Inch).
19

1.5 TRANSVERSE FLAW WITH COMBINED LOADING(R 0.875 INCH)
.5- A/T .200
40
10 150 20
O(DEG)
Figure 11. Stress Intensity factor versus 0 for the transversely-f Iawedcyllnderloaded with Internal pressure and extension (R = 0.875 Inch, A/T =.200).
20)

TRANSVERSE FLAW WITH COMBINED LOADING1.5(R 0.875 INCH)
0 5' 101' io 2
* (DEG)
Figure 12. Stress Intensity factor versus 0 for the transversely-flawed-cylinderloaded with Internal pressure and extenision (R = 0.875 Inch, A/T = .400).
21

1.5- TRANSVERSE FLAW WITH COMBINED LOADING(R =0.875 INCH)
A/T =.500
0.5
0.1*010i 1 20 25 ib
O(DEG)
Figure 13. Stress Intensity factor versus 0 for the transversely-flawedcyllnder
loaded with Internal pressure and extension (R =0.875 Inch, A/T = .500).
22

1.5 TRANSVERSE FLAW WITH COMBINED LOADING(R =0.875 INCH)
A/T = .600
1.0
0.5
0.00 15 2b 25 30
e(DEG)
Figure 14. Stress Intensity factor versus 6 for the transversely-flawed cylinderloaded with Internal pressure and extension (R = 0.875 Inch, A/T = .600).
23

1.5 TRANSVERSE FLAW WITH COMBINED LOADING(R =1.500 INCH)
1.0-
AIT .200
0.0105
0 5 01
*(DEG)
FIgure 15. Stress Intensity factor versus 0 for the transversely-flawed cylinder
* loaded with Internal pressure and extension (R = 1.500, Inch, A/T = .200).
24

1.5 TRANSVERSE FLAW WITH COMBINED LOADING(R = .500 INCH)
1.0.
A/T= .400
0.5.
0.0 II0 5 10 15 20
O(DEG)
Figure 16. Stress Intensity factor versus 0 for the transveraoiy-ftawed-cyinder
loaded with Internal pressure and extension (R = 1.500 Inch, A/T = .400).
25
................................ .......
1.5 TRANSVERSE FLAW WITH COMBINED LOADING(R =1.500 INCH)
1.0.
AIT =.600
0.5
0.0 IP 5 1 1 20 25 3
e(DEG)
Figure 17. Stress Intensity factor versus 0 for the transversely-f lawed cylinder
loaded with Internal pressure and extension (R = 1.500 Inch, A/T = .600).26

-4 4 g .
0
C4
LU Z
t;)
luz.- co I.
0z - d 6 6 6 6 6 6 6_
z - -
0aco xo co .
r- Z14 IQ .- -4-
u0
0 ~ U) c;. d c;c c%;004 c "J
LL, 4 N1..
IL
us ILS ..
27

ID w
w Occ 40)
(A0) caC
W Z
IL --
z W
ZWJ
Zw
z 0
* L..A u
I.L.
28

zz
0:5
LX
* I-
z Us CMr 8P0i00
z
2W
4(0 . n L -
00n ... a
2W 0 CL
1229

. W O .Z).T/IO ?AM BIAJ~So'f nrLMd
REFERENCES
I. Mullinix, B. R. and Smith, D. G., An Experimental Determination of the Stress Intensity
Around Surface Flaws Embedded in Hollow Cylinders Subjected to Bending, Technical
Report RL-74-7, US Army Missile Command, Redstone Arsenal, Alabama, February
1974.
2. Vandiver, T. L., Schaeffel, J. A., and Smith. D. G., Stress Intensities Around Surface
Flaws in Cylindrical Shells by Stress Freezing, Technical Report T-79-11, US Army
Missile Research and Development Command, Redstone Arsenal, Alabama, 15
December 1978.
3. Kassir, M. and Sil, G. C., -Three-Dimensional Stress Distribution Around an Elliptical
Crack Under Arbitrary Loading," Journal of Applied Mechanics, Vol. 33, No. 3,September 1966, pp. 601-611.
4. Sneddon, 1. N., "The Distribution of Stress in the Neighborhood of a Crack in an ElasticSolid," Proceedings of the Royal Society, Series A, Vol. 187, 1946, pp. 229-260.
5. Thresher, R. W. and Smith, F. W., "Stress-Intensity Factors for a Surface Crack in aN "Finite Solid," Journal of Applied Mechanics, Series E, Vol. 39, No. 1, March 1972, pp.
195-200.
6. Irwin, G. R., "Discussion of the Dynamic Stress Distribution Surrounding a Running
Crack - A Photoelastic Analysis," Proceedings, Society, for Experimental Stress
Analysis, Vol. 16, No. 1, 1958, pp. 93-96.
7. Smith, C. W., McGowan, J. J., and Peters, W. H., "A Study of Crack-Tip Nonlinearities
in Frozen Stress Fields," Experimental Mechanics, Vol. 18, No. 8, August 1978.
31
*1 iE=ED1D Pnom BLAIEMOT numJ
* I
* 1
APPENDIX A
TEST DATA
3
.*
33

amile PAu BLwKIOL fmJm
' his appendix contains a summary of all the test data presented in this report. The test
nomenclature is as follows:
T Extension loading test.PC Internal pressure loading test.PE Combined internal pressure and extension loading test.
The test nomenclature follows the test number. For example, I PE refers to the first test run of aflaw in the transverse orientation subjected to combined internal pressure and extensionloading.
TEST NO. ITA/T 0.206 R 0.875 Inch gi 10.74 pei
KANGLE
SLICE NO. (DEG) KI 2/i am(V ;W)
1 0 7.1788 0.6332 10 6.0309 0.5323 15 4.6534 0.4104 20 4.4673 0.394
TEST NO. 2T
A/T 0.390 R 0.875 Inch am 10.32 psi
KIANGLE
SLICE NO. (DEG) KI 2/i 0m(V )
1 0 10.7465 0.9862 10 10.6959 0.9813 15 9.9365 0.9124 20 9.3772 0.8605 25 8,7716 0.805
35

TEST NO. 3T
A/T .1. R 0.875 inch Cm 9.72 psi
KIANGLE
SLICE NO (DEG) KI 2/w, Om(V/-)
1 0 11,9434 1,1642 15 12,6552 1.2333 1 20 113063 1.1024 25 12,4901 1.2175 30 12.2604 1.195
TEST NO. 4T
A/T = 0.674 R 0.875 inch om 9.84 pi
K
ANGLESLICE NO (DEG) IK 12/w Om(Vr)
1 0 12.0330 1.1583 , 20 14.8617 1.4314 20 13.7995 1.3295 30 13.1259 1.264
wL
TEST NO. 5T
t A/T = 0.201 R = 1,50 Inch om = 9.46 psi
KIANGLE
SLICE NO (DEG) KI 2/w Um(V )
0 5.4174 0.4132 10 51066 0,3893 20 40967 j0312
TEST NO. 6T
A/T 0.4-30 R 1.50 inch Cm z 8.416 psi
K1ANGLE
SLICE NO (DEG) KI 2/ v m(v)
1 0 105044 09032 10 98152 0.8443 15 86668 07454 20 85062 07315 25 76702 0659
30
ikL_

TEST NO. 7TA/T 0.693 R 1.50 Inch m 0.133 psi
K IANGLE
SLICE NO (DEG) KI 2/i am(V R)
1 0 148162 1.3182 10 14,1479 1.2583 15 14,2745 1.2704 25 13.2439 1.1785 30 13.0841 1.164
TEST NO. STA/T 1.10 R = 1.50 Inch am = 5.162 psi
KANGLE
SLICE NO. (DEG) KI 2/w vm(Vr )
1 15 16.5615 2.3212 20 13.6390 1.9123 30 120614 1.6914 40 11.7697 1.649
TEST NO. 2PCA/T = 0.388 R = 0.875 Inch am 5.93 psi
K I
ANGLESLICE NO (DEG) KI 21w m(,)
2 10 4.9448 0.78993 15 4.4775 0.71534 20 4.6233 0.73855 25 4.3932 0.7018
TEST NO. 3PC
A/T - 0.531 R - 0.875 inch am 5.27 psi
ANGLE _____
SLICE NO . (DEG) K, 2/, Om(V-
1 0 47515 0.85463 15 5.0981 091694 1 20 54732 0.98445 25 50620 091046 30 56509 1 01637 38 58497 1 0521
37

TEST NO. 4PC.A/T 0674 R 0.875 Inch am 9.91 psi
K IANGLE
SLICE NO (DEG) KI 2/s am(vf-R)
1 0 10.3759 0.99202 10 11.0626 1.05763 15 11 1789 1.06874 20 12.5803 1.2027
TEST NO. 5PC
A/T = 0.200 R 1.500 inch am z 11.13 psi
K I
ANGLESLICE NO. (DEG) KI 2/i Om(v,-R)
1 0 9.0737 0.58962 10 8.6878 0.56453 15 9.1832 0.59674 20 9,0818 0.5901
TEST NO. 6PC
A/T = 0.443 R = 1.500 Inch am = 9.92 psi
K1
ANGLESLICE NO. (DEG) KI 2/i om(V'R)
1 0 8.4709 0.61792 10 8.7018 0.63473 15 9.1253 0.66564 20 7.0955 0.5175
TEST NO. 7PC
A/T -0.684 R 1.500 Inch am = 8.68 psi
K1ANGLE
SLICE NO (DEG) KI 2/i am(,,R)
1 0 89268 0.74452 10 106402 0.88743 15 96247 080274 25 9.2004 . 0.76735 30 11 8390 0,9874
3 8
__ftsd

TEST NO. 8PCA/T : 0.940 R 1.500 inch am 7.54 psi
KANGLE KI
SLICE NO. (DEG) 2/w cm(V )
1 15 10.2689 0.98452 20 10.1580 0.97393 30 11.8707 1.13814 40 104856 1.0053
TEST NO. IPEA/T 0.200 R .875 inch am 13.93 psi
ANGLE
SLICE NO. (DEG) KI 2/w am(Vr)
1-1 00 12.1381 .8261-2 100 11.3646 .7731-3 150 10.4009 .7071-4 20' 8.7351 .594
TEST NO. 2PEA/T = .400 R .875 inch am = 11.88 psi
K I
ANGLESLICE NO. (DEG) KI 2/* Om(Vw)
2-1 00 12.7124 1.0142-2 100 13.1542 1.0492-3 150 11.8315 .9442-4 200 12.5060 .9972-5 25' 11.3443 .9052-6 30' 11.3930 .909
TEST NO. 3PEA/T = .500 R .875 Inch am = 11.165 psi
KIANGLE 2
SLICE NO. (DEG) KI 2/w cm(v ) !
3-1 00 12.2987 1.0443-2 100 13.0904 1.1113-3 15' 12.9064 1 0953-4 200 12.9740 1.1013-5 250 12.1957 1.0353-6 30' 119617 1015
39

TEST NO. 4PEA/T .600 R .875 inch m 2 pi
ANGLE -I --. K
SLICE NO (DEG) K 21w am(V'ro
4-1 0 12.5119 1 1534-2 10, 12.6121 1,1624-3 15' 12.8565 1 1854-4 200 13.3028 1 2264-5 250 12.8078 1.1804-6 300 12.7277 1.173
TEST NO. 5PEA/T = .200 RO 1.500 Inch am = 10.98 psi]
K IANGLE K / moAR
SLICE No. (DEG) K /
5-1 0. 10.0986 .6665-2 50 9.5187 .6275-3 100 9.1719 45-4 150 7,9137 1522
TEST NO. 6PEA/T 0.400 R 1.500 inch am 9.94 psi
K1
SLICE NO. (DEGEK2i) 1 y
6-1 00. 106769 7776-2 100 106978 I779
6-3 15' 102661 7476-4 200 92705 675
TEST NO. 7PE m 86 9A/T = .600 R 1.500 Inchm 869pi
K1ANGLE K 2iC('~
SLICE NO. (DEG) I2wa(-/,R
7-1 00 144033 1,1997-2 100 13,8254 1 1517-3 150 13 5577 1.1297-4 200 135130 1 1257-5 250 11 4605 9547-6 30' 103812 .864
40

APPENDIX B
COMPUTER CODE
41

$ EMEDING PAG BAIMPZOT MAX)~
I he computer code shown on the folIlowAing pages %% as used co analyze the photoelastic
data. I he code uses the technique presented in Section II. With at least squares straight-line
curse lit ol the experimental data.
C ---------- PHO'iOELASVICITY CODE-CYLINDERSDIMENSION AN(50).AR(50).AT(50).AK(50),ID(50)W RIT E(5.22)
22 FORMAT(' NO. OF SLICES?)READ(5.I) N
I FORMAT(3)DO 19 I=I.N.iM=14F= 1.56WRITE(5,25)
25 FORM AT(' SLICE TFIICKNESS?')READ(5,26) T
26 FORMAT(FIO.0)W RITE(5,27)
27 FORM AT(' INPUT N-F6.0')DO 4 J=J, M,JIREAD(5,3) AN(J)
*3 FOR M AT(F6. 0)IF(i.LE.9) AR(J)=FLOAT(J-I )*.005+.OIOiF(J.GT.9) AR(J)=FLOAT(J-9)*.0lO+.050
4 CONTINUEAMAX=O.DOS5 J=I.M,IAT(J)=F*AN(J )I(2.*T)AK(J)=AT(i)*SQRT(8.*3. 141 59*AR(J))IF(AK(J).GT.AM AX) AMAX=AK(J)
5 AR(J)=SQRT(AR(JI))6 CALL IPOKE("170410,"I)
CALL IPOKE("170410,-0)DO 7 J=l,M.IIY=INT(AK(J)* 1000./AMAX)IX=INT(AR(J)* 1000.! AR(M))CALL IPOKE(-1704l2,IX)CALL IPOKE("170414,IY)
7 CALL IPOKE("170414,0O)ITEST=l PEEK("I 77570)IF(ITEST.EQ.0) 0-1-0 6WRITE(5.8)
43

8 f:OR.MA'I' M). 01 1)1*I-LETE SAM PLIHS'R FA1)(5,9) NI1)
9 FORMATI13)I F(N). E Q.0) G O] 0 20DO I I J=QN). IR EA DO, 10) 1ID)(.
10 FORMAT(13)I I CON-11N U E20 CONTINUE
X2=0.X2:=O.Y0=0.
DO 14 J=I,M, I- - IF(ND.EQ.O) GOTO 21
DO 13 K=I,ND,l*13 IF(J.EQ.ID(K)) GOTO 14
21 XI=XI+AR(J)X2=X2+AR(i )**2.Y0O=YO+AK(i)YI=Y I+AK(J)*AR(J)
14 CONTINUEAK I=(X2*YO-Y I*X1)/ (FLOAT( M-ND)*X2-XI*XI)WRITE(5,15) I
15 FORMAT(' SLICE NO. -'13)DO 18 J=1,M,IAR(J)=AR(J )**2.WRITE (5,16) AR(J),AN(J),AT(J),AK(J)
16 FORMAT(' R=',FIO.4,5X,'N='FIO.4,5X,I 'TMAX=',F I0.45X,'KAPP='F 10.4)
18 CONTINUEWRITE(5,17) AK I
17 FORMAT(' Kl=',F14.4)19 CONTINUE
STOPEND
44

" - . - n- m - - - - -- - - -- - - --'. .. . . .. . . ..
LIST OF SYMBOLS
A Crack depth at deepest point (semi-minor diameter for elliptical flaw)A, Nominal cross-sectional area of cylindera Half-length of crack on outside surface of wallD Distance from center of circular flaw to surface of the wallD Ratio of Distance D to radius of circular flaw Rd Distance from center of cylinder to center of circular flawf Photoelastic fringe constantK1,S 1 Mode I stress intensity factorN Isochromatic fringe order
* P Total load on cylinder loaded in tensionP, Internal cylinder pressureR Radius of circular flawR Radius of cylinder measured to center of cylinder wallr, i Polar coordinates centered at crack tipT Wall thickness of the cylindert Thickness of a slice analyzedy, n. 0 Coordinate system shown in Figure 3
SUam Nominal cylinder-wall stresso. Uniform stress at the crack tipay, an, ao Normal stress componentsrny, TY.ry0 Shear stress components
Tmax Maximum shearing stress in the plane perpendicular to the crack borderN' Omax Maximum flaw angle (Figure 2)
45

PwzD ml; PaG BLAmmuNO nLmJ
DISTRIBUTIONNo. of
Copies
* HeadquartersSAC/NRI (Stinfo Library)Offutt Air Force Base, Nebraska 68113
Commander (Code 233)Naval Weapons CenterATTN: Library DivisionChina Lake, California 93555
Department of the ArmyUS Army Research OfficeATTN: Information Processing OfficeP. O. Box 12211Research Triangle Park, North Carolina 27709
ADTC (DLDSL)Eglin Air Force Base, Florida 32542 1
University of CaliforniaLos Alamos Scientif:z LaboratoryATTN: Reports LibraryP. 0. Box 1663
" Los Alamos, New Mexico 87545
LibraryUS Army War CollegeCarlisle Barracks, Pennsylvania 17013
Tennessee Technological UniversityDepartment of Engineering ScienceATTN: Dallas G. SmithCookeville, Tennessee 38501
Defense Technical Information CenterCameron StationAlexandria, Virginia 22314 12
47

DISTRIBUTION (Continued)
No. ofCopies
Defense Metals Information CenterBattelle Memorial Institute505 King AvenueColumbus, Ohio 43201
CommanderUS Army Foreign Science and Technology CenterATTN: DRXST-SD3220 Seventh Street, NECharlottesville, Virginia 22901
Office of Chief of Research and DevelopmentDepartment of the ArmyATTN: DARD-ARS-PWashington, DC 20301
CommanderUS Army Natick LaboratoriesKansas StreetATTN: STSNLT-EQRNatick, Massachusetts 01760
CommanderUS Army Mobility EquipmentResearch and Development CenterFort Belvoir, Virginia 22060
N "Commander
Edgewood ArsenalATTN: SAREA-TS-AAberdeen Proving Ground, Maryland 21010
CommanderPicatinny ArsenalATTN: SARPA-TS-S, Mr. M. CostelloDover, New Jersey 07801
CommanderWatervliet ArsenalWatervliet, New York 12189
CommanderUS Army Test and Evaluation CommandATTN: DRSTE-RAAberdeen Proving Ground, Maryland 21005
4N

4,,1
DISTRIBUTION (Continued)
No. ofCopies
Director
Air Force Materiel Laboratory
ATTN: APML-DO-Library 1Wright-Patterson AFB, Ohio 45433
* Director, Army Materials and Mechanics Research CenterATTN: DRXMR-PL 1
-MT, Mr. Farrow 1Watertown, Massachusetts 02172
Technical LibraryNaval Ordnance StationIndian Head, Maryland 20640 1
CommanderUS Army Materiel Development and Readiness Command 1ATTN: DRCMT 1Washington, DC 20315
US Army Research and Standardization Group (Europe)ATTN: DRXSN-E-RX, Dr. Alfred K. Nedoluha 2Box 65FPO New York 09510
US Army Materiel Development and Readiness CommandATTN: Mr. Edward Sedlak 1
Dr. James Bender 15001 Eisenhower AvenueAlexandria, Virginia 22333
Headquarters, Department of the ArmyOffice of the Deputy Chief of Staff for Research andDevelopment and AcquisitionATTN: DAMA-ARZ 2Room 3A474, PentagonWashington, DC 20310
DirectorDefense Research and EngineeringATTN: Mr. Leonard R. Weisberg 2Room 3D1079, PentagonWashington, DC 20301
49

-I
DISTRIBUTION (Concluded)
4No. of
Copies
DirectorDefense Advanced Research Projects Agency1400 Wilson BoulevardArlington, Virginia 22209 1
tCommanderUS Army Research OfficeATTN: DRXRO-PH, Dr. R. Lontz 2P. 0. Box 12211Research Triangle Park, North Carolina 27709
IIT Research InstituteATTN: GACIAC10 West 35th StreetChicago, Illinois 60616 1
US Army Materiel Systems Analysis ActivityATTN: DRXSY-MP
*' Aberdeen Proving Ground, Maryland 21005
DRSMI-LP , Mr. Voigt 1-R Dr. Kobler 1-RL , Mr. Comus 1
* -RLA, Mr. Pettey 1Mr. Schaeffel 50
-RPR 3N -RPT (Record Set) 1
-RPT (Reference Copy) 1
50