a worldwide perspective on precision agriculture adoption
TRANSCRIPT

A Worldwide Perspective on Precision Agriculture Adoption
Source: Waldner et al., Remote Sensing, 2015
Is Precision Agriculture
Adoption Linked to
Farm Field Size?

Just in case you are
wondering about Harper
Adams University:
• Harper Adams is a British
public agricultural
research and teaching
university established in
1901
• 200 km northwest of
London in Shropshire
• 5000 students in Agri-
business, Ag Engineering,
Food Science, Animal
Science and Veterinary
Science.
• Campus within a 550
hectare working farm
James Lowenberg-DeBoer, Elizabeth Creak Professor
of Agri-Tech Applied Economics,
Harper Adams University, Newport, Shropshire, UK

Objectives:1) Summarize worldwide
Precision Agriculture
adoption.
2) Develop hypotheses to
understand PA adoption
patterns.
3) Discuss key adoption
challenges in the next
decadeSource: Lowenberg-DeBoer, SAE, 1998

Sparse Data Warning:
• No country systematically collects official data on use of
precision ag technology.
• Only a few governments (i.e. USA, Australia, UK) sporadically
do surveys of PA adoption. Alternative sampling methods may
not provide representative data.
• Manufacturers and PA dealers usually do not reveal sales data –
proprietary information!
• Our knowledge of PA adoption comes from piecing together
data from sporadic and geographically dispersed surveys.
• It is essential to look at adoption by specific practice or
technology. PA is a toolbox. Farmers choose what is useful.

Retailers Adopted GPS Guidance Rapidly for Internal Business Use (% of Retailers)
• Lightbars rapidly adopted starting in late 1990s.
• Autosteer rapidly adopted starting in about 2004.
• Both are easy to use and have short run benefits
24%
42% 44%
56%61%
64%67% 68%
73%
79%
66% 65% 63%
55%
5% 6%
20%27%
37%
53% 63% 61%
83%78%
4% 2% 3% 5%4%
4%
6% 5%8%
11%16%
20%
37%34%
2% 3%1%
3% 3%7%
15%20%
9%
39%
53%
74% 73%
0%
10%
20%
30%
40%
50%
60%
70%
80%
90%
100%
20
00
20
01
20
02
20
03
20
04
20
05
20
06
20
07
20
08
20
09
20
10
20
11
20
12
20
13
20
14
20
15
20
16
20
17
GPS guidance
GPS guidance with manual control/lightbar
GPS guidance with auto control/ autosteer
GPS for logistics
Telemetry - field-home office
GPS-enabled sprayer boom/nozzle control

Retailers Slower to Adopt Sensing Technologies
• Return for sensing technologies more complicated—no return until data is turned into a decision
• Percent of retailers -Note % scale compared to previous slide
6
12%
19% 20%
24% 18% 20%
20% 19%
27%
35%
32%
41%43%
16%18%
22%20%
28%
30%
30%
39%
51% 52%
6%8%
11%
6%
9%
13%
13%12%
14%
22%16%
24%
4%7%
6%
9%
3% 3%
7%
0%
10%
20%
30%
40%
50%
60%
20
00
20
01
20
02
20
03
20
04
20
05
20
06
20
07
20
08
20
09
20
10
20
11
20
12
20
13
20
14
20
15
20
16
20
17
Field mapping (GIS) for legal/ billing/insur.
Satellite/aerial imagery for internal use
Soil electrical conductivity mapping
UAVs
Chlorophyll/greenness sensors
Other vehicle-mounted soil sensors for mapping

Ag Retailers Slower to Offer Data Gathering Technologies to Customers (% of Retailers)
• Data collection technologies are foundation of data-driven farming
• Intensive soil sampling services have become almost standard practice.
• After many years over 50% offer satellite imagery
• 2020 numbers are their projections
7
33%
45%
38%36%
44%
52%
47%45%45%
40%
53%52% 52%
57%
67%
82%85%
29%
38%37%
34%
41%
50%42%
33%
39%
35%
47% 44%47%
49%
57%
78%83%
24%
29% 23%18%
24%
30%28%29%
27%26%
34% 39%36%
42%
51% 57%
67%
15%20%
15%11%
16%23% 22%
24%23%
19% 24%
29%
29%
27%
41%
48%
12% 13%15%
19%15%
26%
23%
25%
33%
48%
59%
71%
24% 23%
28%
36%39%
14% 13%
19%
34%
45%
32%
59%
0%
10%
20%
30%
40%
50%
60%
70%
80%
90%
100%
19
97
19
98
19
99
20
00
20
01
20
02
20
03
20
04
20
05
20
06
20
07
20
08
20
09
20
10
20
11
20
12
20
13
20
14
20
15
20
16
20
17
20
18
20
19
20
20
Grid or zone soil sampling
Field mapping (with GIS)
Yield monitor and other data analysis
Yield monitor sales/support
Satellite/aerial imagery
Guidance/autosteer sales & support
Soil EC mapping
UAV or drone imagery

Dealer Offerings of Variable Rate Technologies
• % of Retailers
• VRT is the action side of data technologies for data-driven farming
• Most dealers offer VRT services.
• Farmer up take of VRT has been slower
• 2020 are projections
8
81% 84%
20%
32%32%29%
50%
45%
41%43%
47%
43%
56%56%
54% 54%
69%
9%
15% 14%16%
20%
26%23%22%
25%25%
33% 39%42% 42%
64%
33%37%
34% 33%36%
33%
44%44% 45% 45%
59%
67%70%
10%12%12%14%
16%13%
23%23%
22% 22%
27%
17%
42%
3%3% 4% 3% 2%
6% 5% 6%9% 6%
15%
18%
23% 24%
50%
56%
66%
0%
10%
20%
30%
40%
50%
60%
70%
80%
90%
100%
19
97
19
98
19
99
20
00
20
01
20
02
20
03
20
04
20
05
20
06
20
07
20
08
20
09
20
10
20
11
20
12
20
13
20
14
20
15
20
16
20
17
20
18
20
19
20
20
VRT fertilizer application
VRT Fertilizer, single nutrient
VRT Fertilizer, multiple nutrient
VRT lime application
VRT pesticide application
VRT seeding prescriptions

Farmer Adoption of GNSS Guidance in the USA
• USDA ARMS data has an irregular survey cycle with different crops each year, but it is probably the best data available.
• Easy to imagine that the cloud of data points forms a classic “S” shaped adoption curve for GNSS guidance
• Other data suggests that sprayer boom control, seederrow shut offs and other GNSS guidance related technology has been adopted rapidly by farmers as well as dealers.
Source: Based on data from USDA ARMS - https://data.ers.usda.gov/reports.aspx?ID=17883
5%
15%
45%
5%
20%
45%
10%
35%
11%
23%
26%
53%
4%
49%
0%
10%
20%
30%
40%
50%
60%
2000 2002 2004 2006 2008 2010 2012 2014
Percent of Planted Area on which GPS Guidance Used, USA 2000
to 2013
Corn Soy Winter Wheat Cotton Rice Peanuts

Farmer Adoption of Variable Rate Technology (VRT)
• Farmer use of VRT on cereals and oilseeds rarely exceeds 20% anywhere.
• In spite of widespread availability of VRT services, intense publicity, and subsidies in some counties and states, VRT use by US farmers shows only a slight upward trend.
• The >20% adoption of VRT in the 2010-12 period was during a period of high grain prices. Evidence suggests that farmers have cut back on VRT since to reduce costs. Source: Based on data from USDA ARMS - https://data.ers.usda.gov/reports.aspx?ID=17883
8%
12% 12%
9%
12%
22%
7%
8%
7%
5%
8%
22%
2%
3%
8%
14%
3%4%
5%6%
5%
6%
21%
1%
3%
18%
0%
5%
10%
15%
20%
25%
1996 1998 2000 2002 2004 2006 2008 2010 2012 2014
VRT for Any Purpose by Crop 1998-2013
% of planted area
Corn Soy Winter Wheat Cotton Rice Peanuts
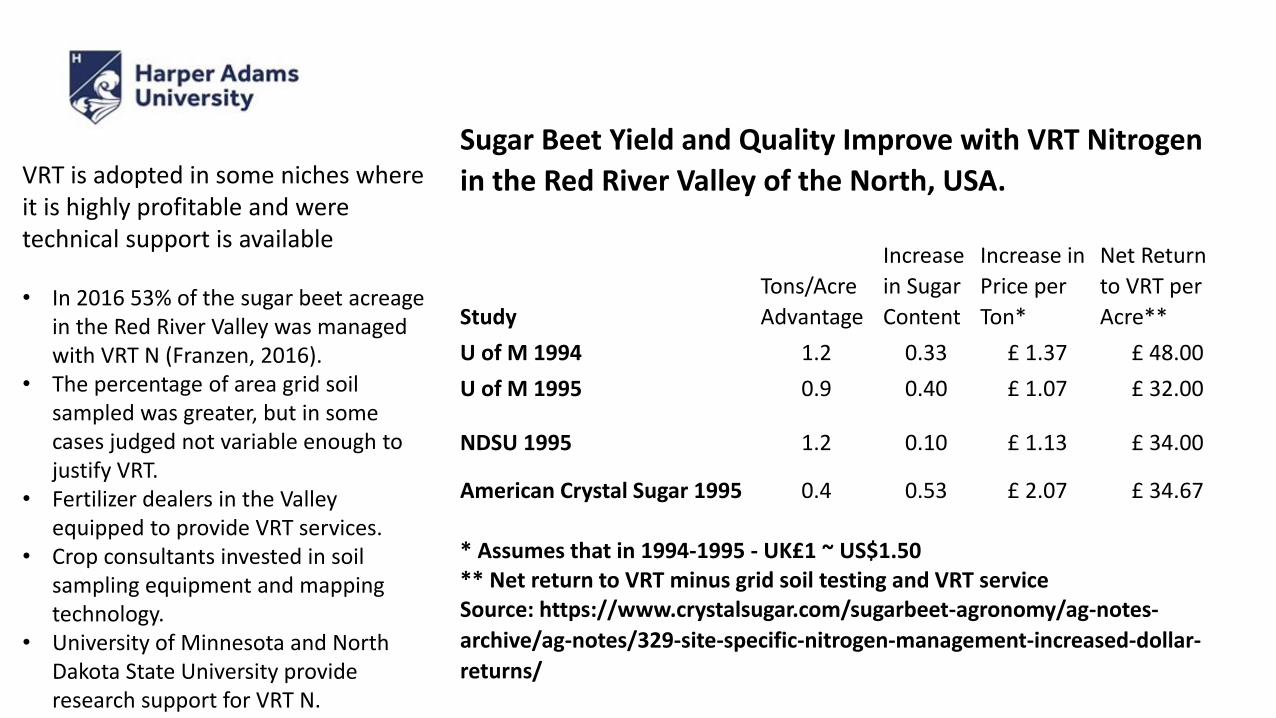
VRT is adopted in some niches where it is highly profitable and were technical support is available
• In 2016 53% of the sugar beet acreage in the Red River Valley was managed with VRT N (Franzen, 2016).
• The percentage of area grid soil sampled was greater, but in some cases judged not variable enough to justify VRT.
• Fertilizer dealers in the Valley equipped to provide VRT services.
• Crop consultants invested in soil sampling equipment and mapping technology.
• University of Minnesota and North Dakota State University provide research support for VRT N.
Sugar Beet Yield and Quality Improve with VRT Nitrogen
in the Red River Valley of the North, USA.
Study
Tons/Acre
Advantage
Increase
in Sugar
Content
Increase in
Price per
Ton*
Net Return
to VRT per
Acre**
U of M 1994 1.2 0.33 £ 1.37 £ 48.00
U of M 1995 0.9 0.40 £ 1.07 £ 32.00
NDSU 1995 1.2 0.10 £ 1.13 £ 34.00
American Crystal Sugar 1995 0.4 0.53 £ 2.07 £ 34.67
* Assumes that in 1994-1995 - UK£1 ~ US$1.50** Net return to VRT minus grid soil testing and VRT serviceSource: https://www.crystalsugar.com/sugarbeet-agronomy/ag-notes-
archive/ag-notes/329-site-specific-nitrogen-management-increased-dollar-
returns/

Farmer Adoption Estimated by Retailers in their Market
• % acres in the retailer’s market area, not % farmers
• GPS guidance becoming standard
• For yield monitor data always a question of use
• 2020 are projections
12
14% 16%20%
22%26%
32%33%
43%
3% 4% 6%
7%9% 9%
13%15%
18% 19%
33%
6%
22%
12% 13%15%
19% 21%17% 18%
22%
27%30%
34%37%
41%
45%
62%
3% 4%
2%
9%17%
3%
4%
3%10%
4% 6%
11%15%
21%
30%
34%
52%
60%
72%
0%
10%
20%
30%
40%
50%
60%
70%
80%
90%
100%
20
00
20
01
20
02
20
03
20
04
20
05
20
06
20
07
20
08
20
09
20
10
20
11
20
12
20
13
20
14
20
15
20
16
20
17
20
18
20
19
20
20
Yield monitor w/ GPS
Satellite or aerial imagery
UAV or drone imagery
Grid or zone soil sampling
Soil EC mapping
Chlorophyll/greenness sensors for N management
Guidance/autosteer

Farmer VRT Adoption Estimated by Retailers
• % acres, not % farmers, in the retailer’s market area
• Substantially higher estimates than USDA and other sources
• Farmer interest in VRT seeding remarkable
• 2020 are projections
13
38%
54%
8%
7%
9% 11%13%15%15%
19% 22%
27% 26% 27% 31%
5%
6% 7% 8%10%10%
13%16% 18%
22%24%
32%
8% 9%11%
15%16%
18% 16%
22%24%
33% 33%31%
41% 40%
51%
2% 3%
4%5% 6%8% 7%
10%9%
10%13% 13% 14%
3%
13%
2% 2% 4%3% 3% 4% 5%
7%9% 10%
13%
30%
0%
10%
20%
30%
40%
50%
60%
20
00
20
01
20
02
20
03
20
04
20
05
20
06
20
07
20
08
20
09
20
10
20
11
20
12
20
13
20
14
20
15
20
16
20
17
20
18
20
19
20
20
VRT nutrient application
VRT single nutrient application
VRT multiple nutrient application
VRT lime application
VRT pesticide application
VRT seeding prescription

Nutrient Management and Hybrid/Variety Selection Dominate Decisions Based on Farm Data
• 58% of retailers manage and/or archive yield, soil test and other data for farmers.
• 17% pool that data within their customer base.
• 10% pool that data beyond their customers
• Only 13% of retailers do not help customers with farm data
14
17%
18%
29%
20%
31%
25%
33%
23%
37%
55%
85%
44%
39%
34%
40%
39%
45%
38%
42%
37%
30%
10%
29%
32%
28%
32%
22%
27%
27%
30%
25%
11%
3%
10%
11%
9%
7%
8%
3%
3%
4%
2%
5%
1%
0% 20% 40% 60% 80% 100%
Nitrogen decisions
P and K decisions
Liming decisions
Overall hybrid or variety selection
Variable hybrid or variety placement in field
Overall crop planting rates
Variable seeding rate prescriptions
Pesticide selection (herbicides, insecticides, or…
Cropping sequence/rotation decisions
Irrigation decisions
Other
% of respondents
No answer No influence Some influence Major influence on decision

Profitability of Precision Service Offerings
• % of Retailers
• VRT fertilizer related services usually profitable
• Sensing services (e.g. UAV, satellite/aerial imagery, soil EC, chlorophyll sensors) less profitable
11%
6%
5%
7%
27%
19%
19%
17%
26%
30%
23%
5%
22%
31%
23%
29%
26%
13%
5%
4%
4%
6%
9%
9%
14%
16%
29%
12%
5%
8%
0%
6%
20%
10%
45%
21%
11%
20%
25%
32%
37%
39%
36%
27%
27%
28%
33%
42%
27%
27%
44%
31%
68%
80%
69%
42%
39%
35%
31%
22%
14%
38%
61%
38%
27%
44%
24%
20%
0% 20% 40% 60% 80% 100%
Field mapping (with GIS)
VRT fertilizer or lime presc
VRT fertilizer appl
VRT lime appl
VRT pesticide appl
VRT seeding presc
Yield monitor sales/support
Yield monitor and other data analysis
Satellite/aerial imagery
UAV
Guidance/autosteer sales and support
Grid or zone soil sampling
Soil EC mapping
Chlorophyll/greenness sensors
Precision planter equip sales
Telematics equip sales
Profit/cost mapping
% of respondents who offer the service
Don't know Not breaking even Breaking even Making a profit

PA Adoption by Medium and Small Scale Farmers in the USA
• The initial wave of PA technology was designed mainly for large scale, mechanized grain producers.
• Not surprisingly, PA adoption has been concentrated among those large scale producers.
• As PA technology prices decline with mass production and the technology becomes easier to use, the expectation is that it will be used by all mechanized farms.
8
16
2428
8
16
24
3230
51
61
81
0
10
20
30
40
50
60
70
80
90
Smallest Small Med-Small Medium
Maximum Area by Crop for Each Farm Size, hectares
Maize, 2016 Soy, 2012 Rice, 2013
USDA ARMS data is collected by crop.
Analysis focused on the smallest 15% of farms
by crop. What is considered small differs by
crop.
Source: Schimmelpfennig, IaDB, 2017

Like larger farms, small and medium farms in the US are adopting guidance
0%
10%
20%
30%
40%
50%
60%
70%
80%
Maize AutoSteer Maize SoilMapping
Maize VRT fert Maize YieldMapping
Rice AutoSteer Rice Soil mapping Rice VRT fert Rice Yield Mapping Soy AutoSteer Soy Soil Mapping Soy VRT fert Soy Yield Mapping
PA Adoption by Crop & Technology
for Small and Medium Farms, %
Smallest Small Med-Small Medium
The smallest US rice
farms are bigger than
the smallest corn and
soybean farms and
consequently are
adopting guidance

Precision Agriculture In the UK
• Overall, UK adoption of PA is modest, % of farms in 2012:• GPS - 22%• Soil Mapping – 20%• VRT – 16%• Yield Mapping – 11%
• As almost everywhere PA adoption is greater on larger farms and on those specialized in cereals and oilseeds.
• UK pattern similar to rest of the world, but UK has more smaller livestock and mixed farms, and fewer large arable farms which lead PA adoption everywhere
0%
5%
10%
15%
20%
25%
30%
35%
GPS (a) Soil mapping Variable rateapplication
Yield mapping
17% 17%
12%
9%
24%
21%19%
12%
32%
24%
22%
14%
Proportion of UK Holdings Using PA Techniques
Small Medium Large
Source: DEFRA 2012 Farming Practices Survey
In UK data farm size defined by number of workers:
• Small <2 workers
• Medium - 2 or 3 workers
• Large – over 3 workers

• Strong interest in PA for sugar cane
driven by economics & environmental
concerns.
• Public sector research in PA for
viticulture and some adoption of
selective harvest.
• Australia led development of GPS
guidance in part motivated by soil
compaction and profitability of
controlled traffic.
• CSIRO adoptions studies show:
o As in USA, GPS guidance widely
used.
o Many have yield monitors, but do
not use data.
o Note – “Vary Fertilizer Rates”
includes manual variation.
o Lack of technical support identified
as key constraint.Source: Llewellyn & Ouzman, CSIRO, 2014
Precision Agriculture in Australia

• Larger farms in
Latin America have
been part of PA from
the early 1990s.
• Argentine data
collected in terms of
number of machines
• Rapid growth in
GPS guidance
• Variable rate
fertilizer is less than
20% of crop areaSources: Ricardo Melchiori, INTA, Parana, Argentina
Precision Agriculture in Argentina

Precision Agriculture in Brazil
• Strong interest in Precision Ag for sugar – both guidance and
VRT
• Growth in use of GPS guidance
• Interest in VRT fertilizer, but often very coarse resolution (e.g. 5
ha grids).
• Adoption slowed by:
o High cost of technology – in part due to taxes and import
tarifs
o “No Frills” preference because of high capital costs and
composition of the labor force
o Has been more profitable to bring new land into farm
production than to intensify on existing land

Source: J. P. Molin, INFO AG , 2015
79
58
30
28 Variable rate seed
application
Variable rate chemicals
application
Variable rate fertilizer
application
Soil fertility
mapping
5545
Do you use some PA technique?N = 992
No
Yes
N = 443
All indications in %. Based on number of interviews.
Forty Five% of Brazilian grain farmers in 2013
used something from the PA toolbox
Based on Kleffmann Group telephone interviews with 992 large scale farmers in 2013.

and
• Largely because of high soil
testing costs Brazilian
farmers use very large soil
test grid sizes.
• In the 2013 survey 14 %
used larger than 9 ha.
• Almost 50% used larger than
4 ha.
• The grid size used in by
these Brazilian farmers is
larger than the average field
size on many European
farms.

Rethinking Precision Agriculture in Africa
• Use of GNSS guidance and classic PA
technology on farms in South Africa and on
some large scale estates elsewhere.
• Traditional African agriculture is very site-
specific, but manual, so PA technology from
the Americas and Australia does not solve
their problems.
• Rethinking PA for African smallholder
farmers to identify uses that solve African
problems. Some ideas:
➢ Handheld soil nutrient sensors.
➢ Using cell phones to communicate
remote sensing and other sensor based
weather & pest management
information.
• In most areas little or no ag inputs supply
infrastructure, so no PA services or support.

Precision Agriculture in Europe
• PA technology developed in the Americas or Australia often not a good fit, in part because of
smaller farm size.
• European PA adoption estimates are “soft” because only the UK government collects random
sample data. In other countries number are based on on-line survey and other methods
• Interest in GNSS guidance growing especially in areas with relatively large farm size such as
eastern Germany
• Use of on-the-go sensing for fertilizer application probably highest in the world because:
o Relatively higher N prices
o Higher grain prices
o Environmental regulation limits N use in some countries
o Government support for N sensor use
• Growing interest in PA technologies that fit European farming, including:
o Controlled traffic
o Precision livestock, especially robotic milking
o Precision horticulture and viticulture

8%
4%3%
32%
9%
4%3%
8% 8%
0%
5%
10%
15%
20%
25%
30%
35%
Germany Denmark Finland
PA in N. Europe, 2011
Variable Rate Fertilizer GPS Autoguidance Robotic Milking
“The most successful example of PA on
arable land is the use of Controlled Traffic
Farming (CTF), which has been able to
reduce machinery and input costs up to 75%
in some cases, whilst also increasing crop
yield.” (EU Directorate-General for Internal
Policies – Agriculture & Rural Dev., 2014)
Source: Lartey et al. (Computers & Electronics
in Agriculture, 2011) – Survey of farmers in
four European countries
European Farmers Taking Time to find PA
Technology that Fits Their Needs

PA Adoption Summary –GNSS Guidance Success Story
• GNSS guidance being widely adopted on mechanized farms almost everywhere.
• Sprayer boom control, seed row shut offs and other technology linked to GNSS guidance being widely adopted.
• Hypothesis #1 - Investment in GPS guidance and related technologies cashflowed by reduction in overlap and more efficient field operations. Other benefits (e.g. reduced fatigue, flexibility in hiring) are unquantified side effects.
• Hypothesis #2 – GPS guidance technology is not disruptive and consequently is easily sold through existing agribusiness channels

Variable Rate Technology Adoption has Lagged
• Variable Rate Technology (VRT) being adopted in niches where it is highly profitable. For example, sugar beet growers in the USA, in the Red River Valley of the North, Minnesota and North Dakota.
• VRT adoption for all broad acre crops only rarely exceeds 20% of area or farms.
• Hypothesis #3 - Constraints to VRT adoption include:• High cost of site specific information (e.g. grid or zone soil sampling)
• Cost of developing individualized prescription maps
• Lack of demonstrated value – impact on yields and profits often hard to see
• Cost of being wrong (and over applying) is often small because environmental impacts not measured
• VRT is disruptive technology that would require substantial changes in agronomic practices and in business models.

Challenge #1 - On-the-go sensors & fertilizer application
29
Source: Fritzmeirer-umwelttechnik.com
• The hypothesis is that VRT fertilizer adoption has lagged
for bulk commodities because of current technology is
knowledge intensive, requires human intervention at
several points and yields only modest benefits.
• The most likely technical solution is on-the-go fertilizer
sensor and applicator combinations that embody current
knowledge and reduce need for direct human
intervention.
• Combining on-the-go sensors measurements with some
estimate of crop response capacity (e.g. soil depth, yield
maps) can fine tune the fertilizer application.
• Currently most advanced for nitrogen application, but
could be developed for P, K, lime and micronutrients.

Challenge #2 – Pest management at the individual plant level
https://www.harper-adams.ac.uk/news/203084/field-robot-event-comes-to-uk-for-the-first-time
https://www.deere.co.uk/en/our-company/news-and-media/press-releases/2017/sep/deere-and-company-to-acquire-blue-river-technology.html
John Deere Blue River “see and spray” tech.
Field robot competition at Harper Adams University in June 2017
• The future of crop pest management may use
conventional pesticides, but in much smaller
quantities, because they are applied only to specific
weeds, insects or diseased plants.
• That plant or insect specific application might be
by large scale equipment or small robots.
• Robotic pesticide application could be adapted to
small farms.

Challenge #3 - Proof of Concept for Big Data and Artificial Intelligence in Agriculture
• In theory “Big Data” gives us the opportunity to systematically learn from cropping experience, but lack objective data on distribution of benefits.
• In practice, the use of big data in agriculture are limited by the lack of a good business model for farmer data pooling. Some options:• Paying farmers for data in cash or discounts on inputs
• Benchmarking relativeto other farmers in their area and other analysis
• Cooperative models that commit to sharing benefits of data pooling with farmers
• Given the transactions costs of pooling farm data, the Big Data proof of concept may come very large farms in places like the Ukraine, Kazakhstan, or Brazil, rather than pooling data from medium and small. The transactions costs would be lower.
31

Challenge #4 – The biggest PA market opportunity is low cost technology for small and medium farms
For example, soil or optical fertilizer sensors:
• In the developing world soil tests are expensive and not easily available.
• Smallholder farmers lack information about the type and amount of fertilizer that their crops need.
• Research has show the potential of handheld nitrogen senors on medium and small farms, But the cost of the sensors is still too high.
• To achieve widespread use an N sensor should cost < US$10.
• To attain the required price threshold the sensor will probably be a cell phone app or accessory
32
Research in the Yaqui Valley of Mexico shows that use of sensor based nitrogen management can improve farm profits and benefit the environment
Source: CIMMYT

James Lowenberg-DeBoer
Elizabeth Creak Professor of Agri-Tech Applied Economics
Take home message:• GPS guidance and related technology is being adopted worldwide by
mechanized agriculture because it is easy to use, benefits are seen quickly, and it does not disrupt agribusiness structure.
• VRT adoption for bulk commodity crops has lagged worldwide because it is more complicated, technology is not mature, and it is more disruptive.
• Precision agriculture adoption challenges in the next decade include:
• On-the-go sensors and application for fertilizer
• Plant level pest management
• Proof of concept for value of Big Data and artificial intelligence in agriculture
• Precision agriculture technology for small and medium farms