a world of care - cdn.cse.lk · vision to be sri lanka’s corporate inspiration at all times...
TRANSCRIPT


We do not inherit the earth from our ancestors, we borrow it from our children.
At Hayleys, we know that there is more to life than just the pursuit
A World of CareThe World of Hayleys

ContentsHayleys at a Glance 5. 6. 8. Snapshot of Our Businesses
12. 16. 18. Our History
Leadership and Governance 20. 24. 30. 34. 48.
Our Strategy 54. 56. 58. 60. 61. 63. 64.
Management Discussion and Analysis 66. 70. 74. 78. 82. 86. 90. 94. 98. 102. Leisure
106. 110. 114. Others
Our Value Creation Report 118. 122. 123. 131. 137. 140. 149.
150. 151. 152. 153. 154. 155.
Financial Reports 158. 159. 160. 161. 162. 164. 169. 172. 265. 266. 267. 269. 272. 274. Quarterly Analysis
275. 279. 285. 286. 288. 292. 293. 295.

VisionTo be Sri Lanka’s corporate inspiration at all times
Delivering superior shareholder value by unleashing the full potential of our people and achieving leadership in all our domestic and global businesses
Mission
ValuesINTEGRITY
ENDURING CUSTOMER VALUE
A WILL TO WIN
RESPECT FOR PEOPLE
GOOD CITIZENSHIP
TEAMWORK
ACCOUNTABILITY
Scope and Boundary
Reporting Enhancements
information
Standards and Principles
External Assurance
Feedback
“ We have placed
specific focus on
improving shareholder
communications and
through this year’s
report we aim to
provide a balanced and
concise assessment of
our performance
”
Report Preamble
Hayleys PLC | Annual Report 2015-164
Report Preamble > Hayleys at a Glance > Leadership and Governance > Our Strategy > Management Discussion and Analysis > Our Value Creation Report > Financial Statements
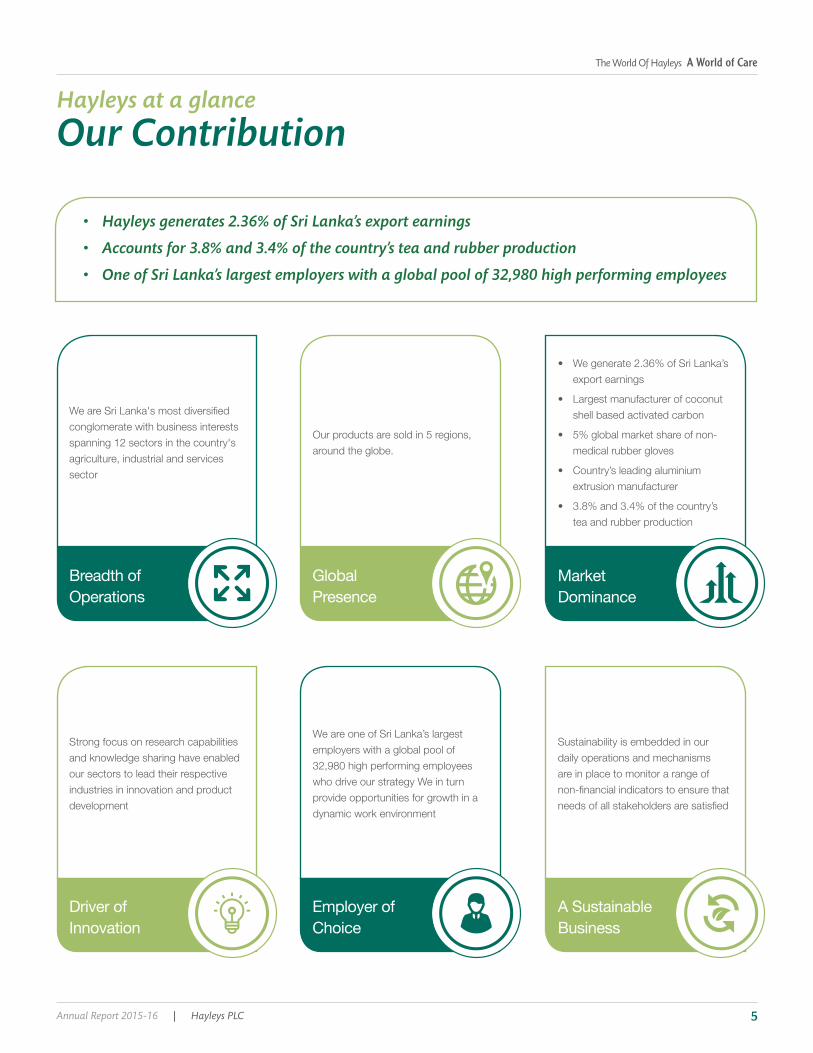
Breadth of Operations
Driver of Innovation
Global Presence
Employer of Choice
Market Dominance
A Sustainable Business
•
•
•
•
•
Our ContributionHayleys at a glance
• Hayleys generates 2.36% of Sri Lanka’s export earnings
• Accounts for 3.8% and 3.4% of the country’s tea and rubber production
• One of Sri Lanka’s largest employers with a global pool of 32,980 high performing employees
Annual Report 2015-16 | Hayleys PLC 5
The World Of Hayleys A World of Care

Operational Highlights
2016 2015 Change %
8
11
8
Net assets per share
8
Others
1
Others
Group employment
Hayleys at a glance
Hayleys PLC | Annual Report 2015-166
Report Preamble > Hayleys at a Glance > Leadership and Governance > Our Strategy > Management Discussion and Analysis > Our Value Creation Report > Financial Statements
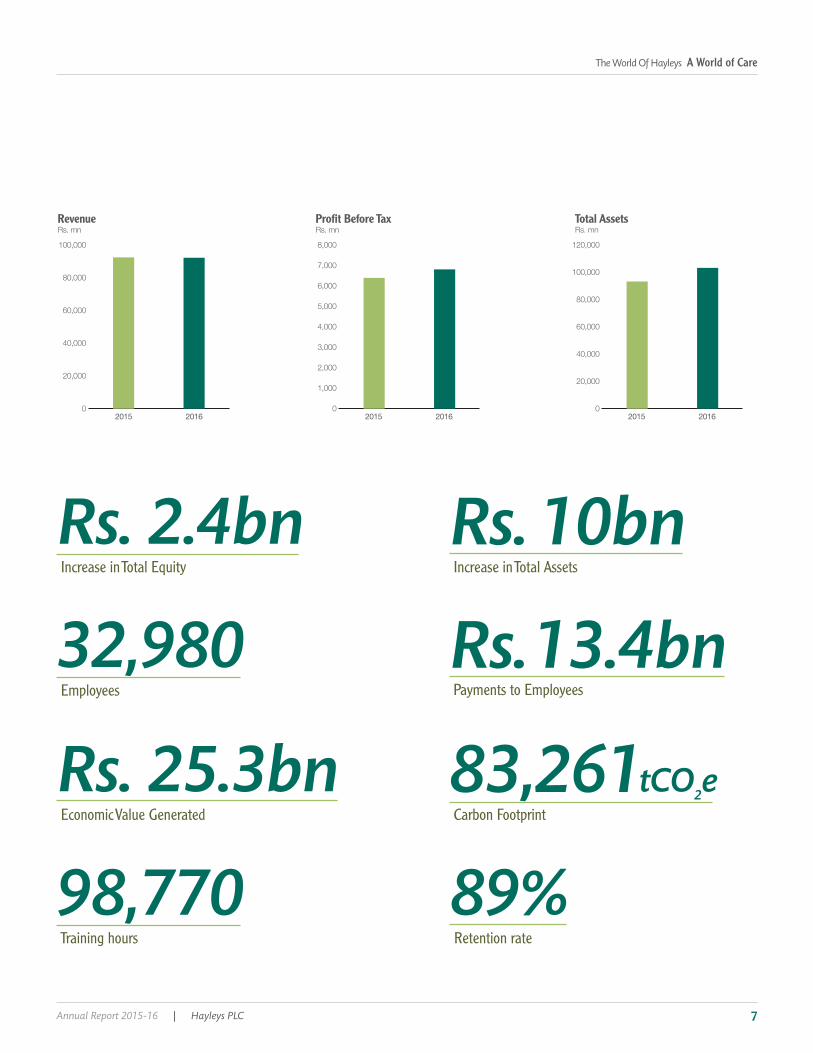
Rs. 10bn
Rs. 13.4bn
83,261
Rs. 2.4bn
98,770 89%
32,980
Rs. 25.3bn
Increase in Total Assets
Payments to Employees
Carbon Footprint
Increase in Total Equity
Training hours Retention rate
Employees
Economic Value Generated
0
20,000
40,000
60,000
80,000
100,000
2015 2016
Rs. mnRevenue
0
1,000
2,000
3,000
4,000
5,000
6,000
7,000
8,000
2015 2016
Rs. mnProfit Before Tax
0
20,000
40,000
60,000
80,000
100,000
120,000
2015 2016
Rs. mnTotal Assets
tCO2e
Annual Report 2015-16 | Hayleys PLC 7
The World Of Hayleys A World of Care

Snapshot of Our Businesses
Snapshot of Our Businesses
Snapshot of Our Businesses
Hayleys at a glance
Hayleys at a glance
Hayleys at a glance
Eco Solutions
Hand Protection
Purification
We are ranked among the world’s top 5 producers in the hand protection industry and
Revenue
Rs. 3.8 bnProfit before tax
Rs. 92 mn
Revenue
Rs. 12.7 bnProfit before tax
Rs. 584 mn
Revenue
Rs. 11.7 bnProfit before tax
Rs.1.1 bn
Products/Activities
Brushware
Products/Activities
Products/Activities
Employees
4%
Employees
5%
Employees
5%
Carbon footprint
3%
Carbon footprint
21%
Carbon footprint
7%
4% 1%
14%
13%
7%
13%
Hayleys PLC | Annual Report 2015-168
Report Preamble > Hayleys at a Glance > Leadership and Governance > Our Strategy > Management Discussion and Analysis > Our Value Creation Report > Financial Statements

Snapshot of Our Businesses
Snapshot of Our Businesses
Hayleys at a glance
Hayleys at a glance
Textiles
Construction Materials
Plantations
Sri Lanka’s premier manufacturer of aluminium extrusions commanding a dominant
Revenue
Rs. 8.4 bnProfit before tax
Rs. 253 mn
Revenue
Rs. 3.9 bnProfit before tax
Rs. 801 mn
Revenue
Rs.9.1 bnProfit before tax
Rs. 50 mn
Products/Activities
Products/Activities
Aluminium systems
Products/Activities
Employees
3%
Employees
2%
Employees
58%
Carbon footprint
26%
Carbon footprint
5%
Carbon footprint
12%
9% 3%
4%
10%
9%
1%
Annual Report 2015-16 | Hayleys PLC 9
The World Of Hayleys A World of Care

Hayleys at a glanceSnapshot of Our Businesses
Snapshot of Our Businesses
Snapshot of Our Businesses
Hayleys at a glance
Hayleys at a glance
Agriculture
Consumer Products
Leisure
We are an industry pioneer in agricultural innovation and provide a wide range
We own and operate 7 resort properties through the Amaya Resorts chain,
Revenue
Rs. 11.0 bnProfit before tax
Rs. 1.1 bn
Revenue
Rs. 5.7 bnProfit before tax
Rs. 117 mn
Revenue
Rs. 4.5 bnProfit before tax
Rs. 679 mn
Products/Activities
Animal Health
Products/Activities
Products/Activities
operations
Employees
5%
Employees
1%
Employees
5%
Carbon footprint
4%
Carbon footprint
0.1%
Carbon footprint
15%
12% 13%
6%
5%
1%
8%
Report Preamble > Hayleys at a Glance > Leadership and Governance > Our Strategy > Management Discussion and Analysis > Our Value Creation Report > Financial Statements
Hayleys PLC | Annual Report 2015-1610

Snapshot of Our Businesses
Snapshot of Our Businesses
Hayleys at a glance
Hayleys at a glance
Industry Inputs and Power & Energy
Transportation & Logistics
Others
capacity of 35 MW of hydro and wind power plants
Sri Lanka’s leading player in the transportation and logistics industry, we provide the entire gamut of transportation related services
Revenue
Rs. 3.6 bnProfit before tax
Rs. 1.1 bn
Revenue
Rs. 15.8 bnProfit before tax
Rs. 1.5 bn
Revenue
Rs. 2 bnProfit before tax
Rs. 1.1 bn
Products/Activities
Products/Activities
Products/Activities
Employees
1%
Employees
8%
Employees
3%
Carbon footprint
0.1%
Carbon footprint
7%
Carbon footprint
0.1%
4% 13%
17%
2%
18%
13%
Annual Report 2015-16 | Hayleys PLC 11
The World Of Hayleys A World of Care

Awards & AccreditationHayleys at a glance
Sector
Eco Solutions
•
•
•
•
•
•
HandProtection
•
•
•
•
•
•
•
•
Purification
•
Textiles
•
•
•
•
Plantations
TTEL•
•
•
•
Agriculture
•
•
Consumer
•
Report Preamble > Hayleys at a Glance > Leadership and Governance > Our Strategy > Management Discussion and Analysis > Our Value Creation Report > Financial Statements
Hayleys PLC | Annual Report 2015-1612

Sector
Transportation
•
•
•
Sector Awards
Others
•
•
Eco Solutions
•
Purification
•
Textiles
•
ConstructionMaterials
•
•
•
•
•
Annual Report 2015-16 | Hayleys PLC 13
The World Of Hayleys A World of Care

Awards & AccreditationHayleys at a glance
Sector Awards
Plantations
KVPL•
•
•
•
•
Mabroc•
•
•
TTEL•
•
•
•
•
•
•
•
Agriculture
•
•
•
•
•
Report Preamble > Hayleys at a Glance > Leadership and Governance > Our Strategy > Management Discussion and Analysis > Our Value Creation Report > Financial Statements
Hayleys PLC | Annual Report 2015-1614

Sector Awards
Leisure
The Kingsbury•
•
•
•
•
Hunas Falls•
•
Amaya Lake•
Amaya Beach•
•
•
•
•
Transportation
•
•
•
•
•
Annual Report 2015-16 | Hayleys PLC 15
The World Of Hayleys A World of Care

Global FootprintHayleys at a glance
60.1%Revenue
Revenue15.2%
14.1 bn
Revenue14.3%
13.1 bn
Revenue60.7%
56 bn
Revenue2%
1.8 bn
Revenue5.9%
5.5 bn
Revenue1.9%
1.8 bn
Report Preamble > Hayleys at a Glance > Leadership and Governance > Our Strategy > Management Discussion and Analysis > Our Value Creation Report > Financial Statements
Hayleys PLC | Annual Report 2015-1616
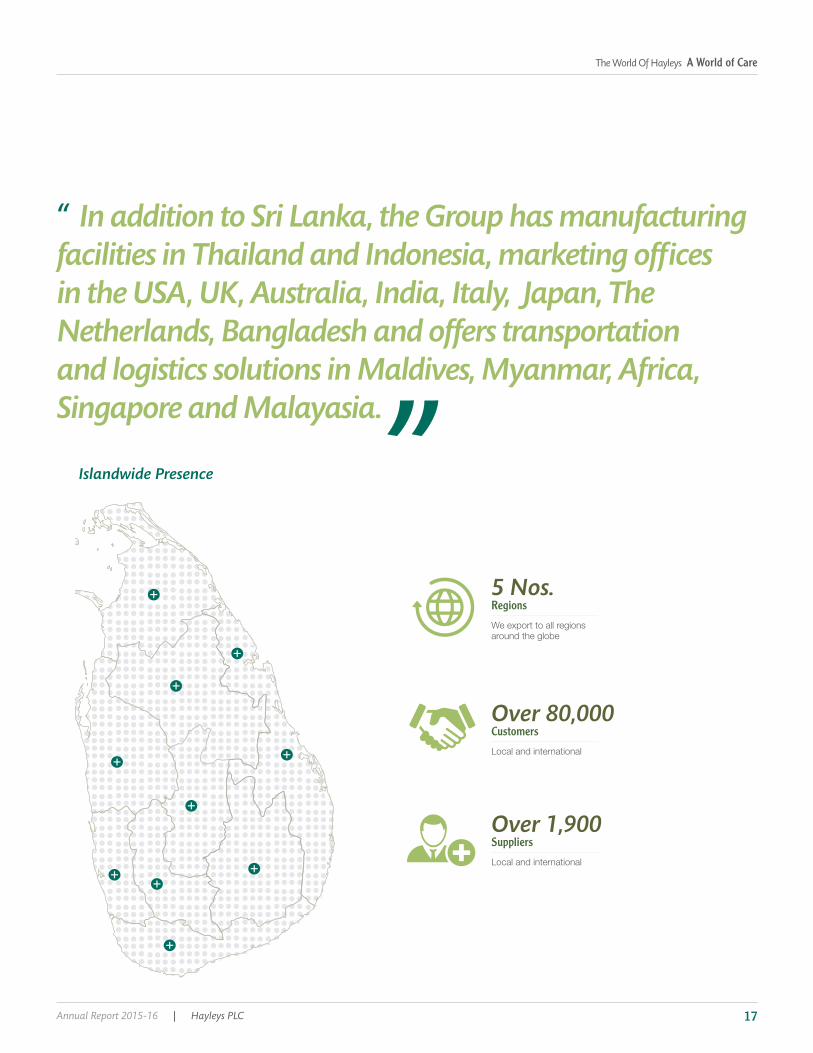
“ In addition to Sri Lanka, the Group has manufacturing
facilities in Thailand and Indonesia, marketing offices
in the USA, UK, Australia, India, Italy, Japan, The
Netherlands, Bangladesh and offers transportation
and logistics solutions in Maldives, Myanmar, Africa,
Singapore and Malayasia.
”Islandwide Presence
Regions5 Nos.
CustomersOver 80,000
SuppliersOver 1,900
Annual Report 2015-16 | Hayleys PLC 17
The World Of Hayleys A World of Care

1878
1958
1954
1968
1973
Bayer of Germany, is
Hayley forms
Our History
Report Preamble > Hayleys at a Glance > Leadership and Governance > Our Strategy > Management Discussion and Analysis > Our Value Creation Report > Financial Statements
Hayleys at a glance
Hayleys PLC | Annual Report 2015-1618
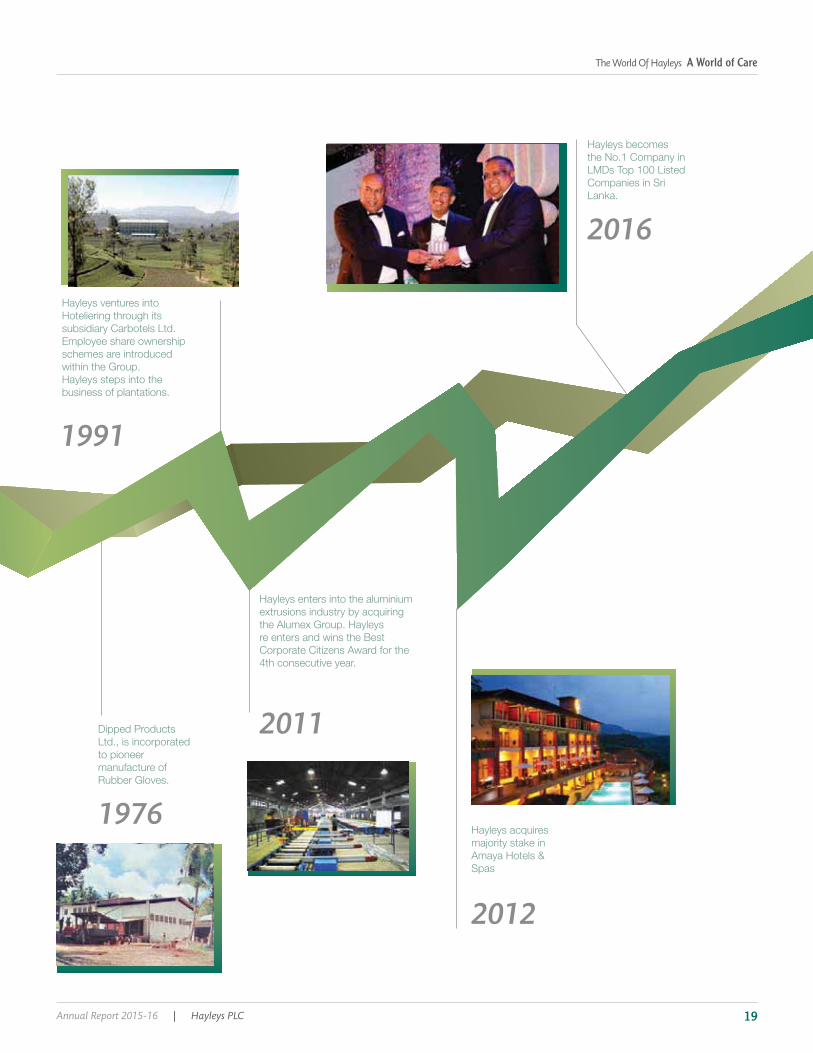
Hayleys steps into the
1991
1976
2011
2016
2012
to pioneer
Hayleys enters into the aluminium
majority stake in
Spas
Annual Report 2015-16 | Hayleys PLC 19
The World Of Hayleys A World of Care

Chairman’s Message
A GP margin growth of 6% and Profit before tax of Rs.6.8 bn recorded for the year reflect the leaner operating models enabling business sectors to compete effectively. Profit after tax was Rs. 5.1 bn, an increase of 4% over the previous year.
Report Preamble > Hayleys at a Glance > Leadership and Governance > Our Strategy > Management Discussion and Analysis > Our Value Creation Report > Financial Statements
Leadership and Governance
Hayleys PLC | Annual Report 2015-1620

Performance & Growth
Portfolio Review
Annual Report 2015-16 | Hayleys PLC 21
The World Of Hayleys A World of Care

Chairman’s Message
“ Hayleys Group has
transformed over the
past 6 years becoming
the No.1 Company in
the LMD’s top 100 listed
companies
”
Report Preamble > Hayleys at a Glance > Leadership and Governance > Our Strategy > Management Discussion and Analysis > Our Value Creation Report > Financial Statements
Leadership and Governance
Hayleys PLC | Annual Report 2015-1622
Moving Forward
Acknowledgements
Mohan Pandithage
Annual Report 2015-16 | Hayleys PLC 23
The World Of Hayleys A World of Care
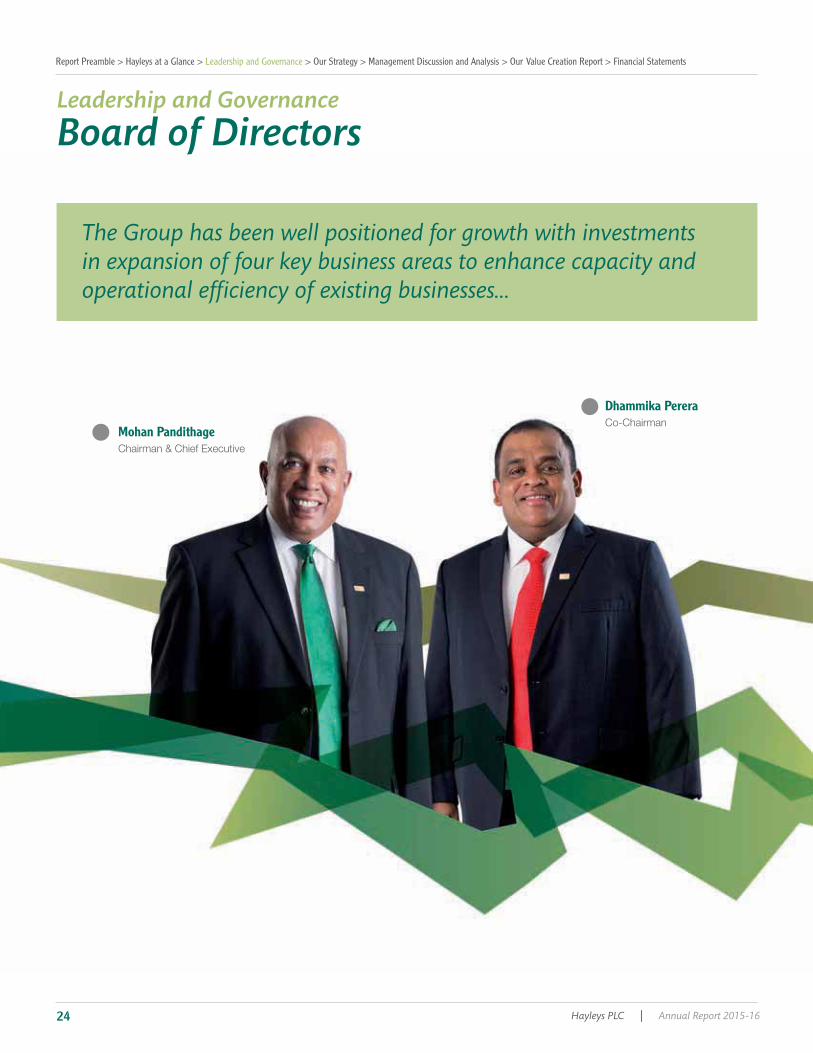
The Group has been well positioned for growth with investments
in expansion of four key business areas to enhance capacity and
operational efficiency of existing businesses...
Mohan Pandithage
Dhammika Perera
Board of DirectorsLeadership and Governance
Report Preamble > Hayleys at a Glance > Leadership and Governance > Our Strategy > Management Discussion and Analysis > Our Value Creation Report > Financial Statements
Hayleys PLC | Annual Report 2015-1624
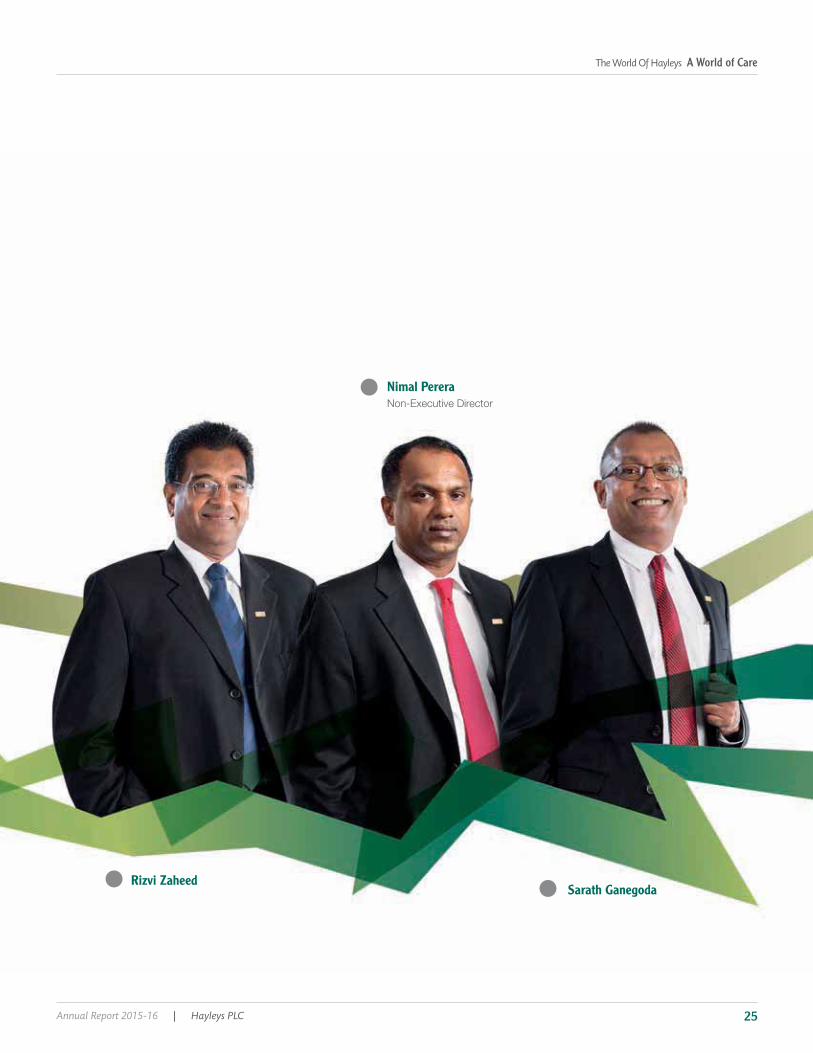
Rizvi ZaheedSarath Ganegoda
Nimal Perera
Annual Report 2015-16 | Hayleys PLC 25
The World Of Hayleys A World of Care

Board of Directors
Rajitha Kariyawasan
Dr. Harsha Cabral, PC
Dr. Mahesha Ranasoma
Leadership and Governance
Report Preamble > Hayleys at a Glance > Leadership and Governance > Our Strategy > Management Discussion and Analysis > Our Value Creation Report > Financial Statements
Hayleys PLC | Annual Report 2015-1626

Lalin Samarawickrama
Ruwan Waidyaratne
Hisham Jamaldeen
Annual Report 2015-16 | Hayleys PLC 27
The World Of Hayleys A World of Care
Board of DirectorsLeadership and Governance
Mohan PandithageChairman & Chief Executive
Dhammika PereraCo- Chairman- Non Executive
Rizvi Zaheed
Nimal PereraNon-Executive Director
Sarath Ganegoda
Rajitha Kariyawasan
Dr. Harsha Cabral, PCIndependent Non-Executive Director
Report Preamble > Hayleys at a Glance > Leadership and Governance > Our Strategy > Management Discussion and Analysis > Our Value Creation Report > Financial Statements
Hayleys PLC | Annual Report 2015-1628
Dr. Mahesha Ranasoma
Lalin Samarawickrama
Ruwan Waidyaratne
Hisham JamaldeenIndependent Non-Executive Director
Annual Report 2015-16 | Hayleys PLC 29
The World Of Hayleys A World of Care
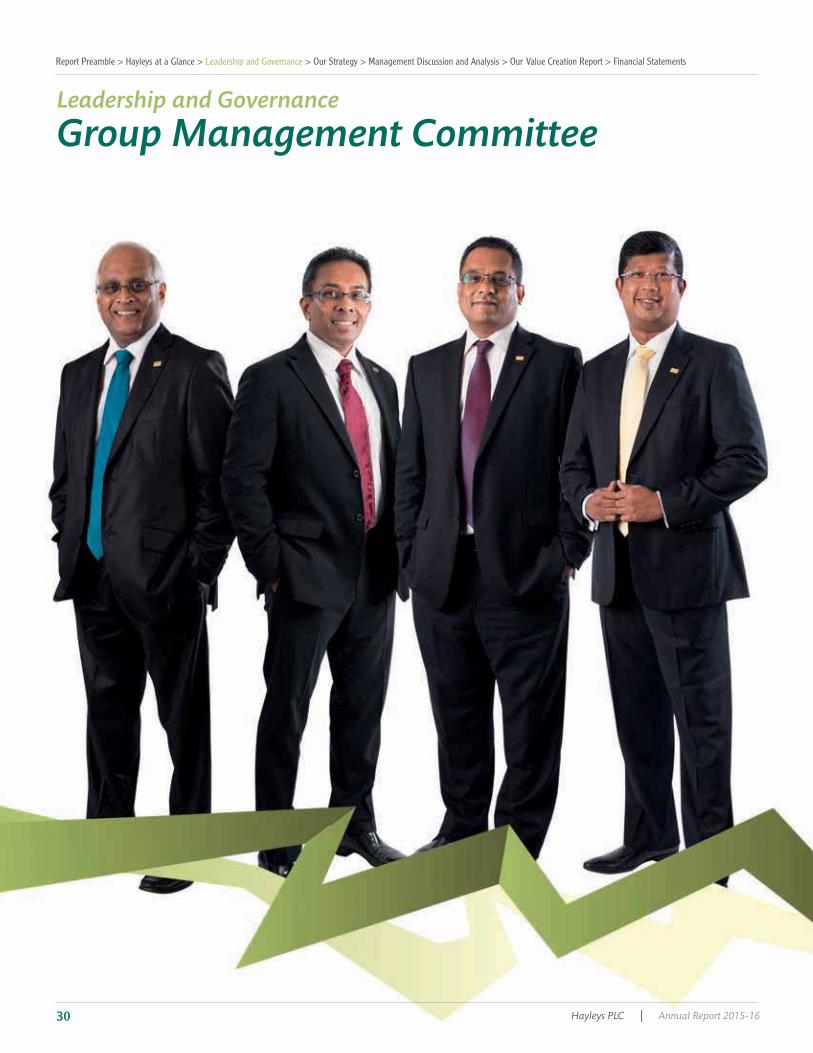
Group Management CommitteeLeadership and Governance
Report Preamble > Hayleys at a Glance > Leadership and Governance > Our Strategy > Management Discussion and Analysis > Our Value Creation Report > Financial Statements
Hayleys PLC | Annual Report 2015-1630
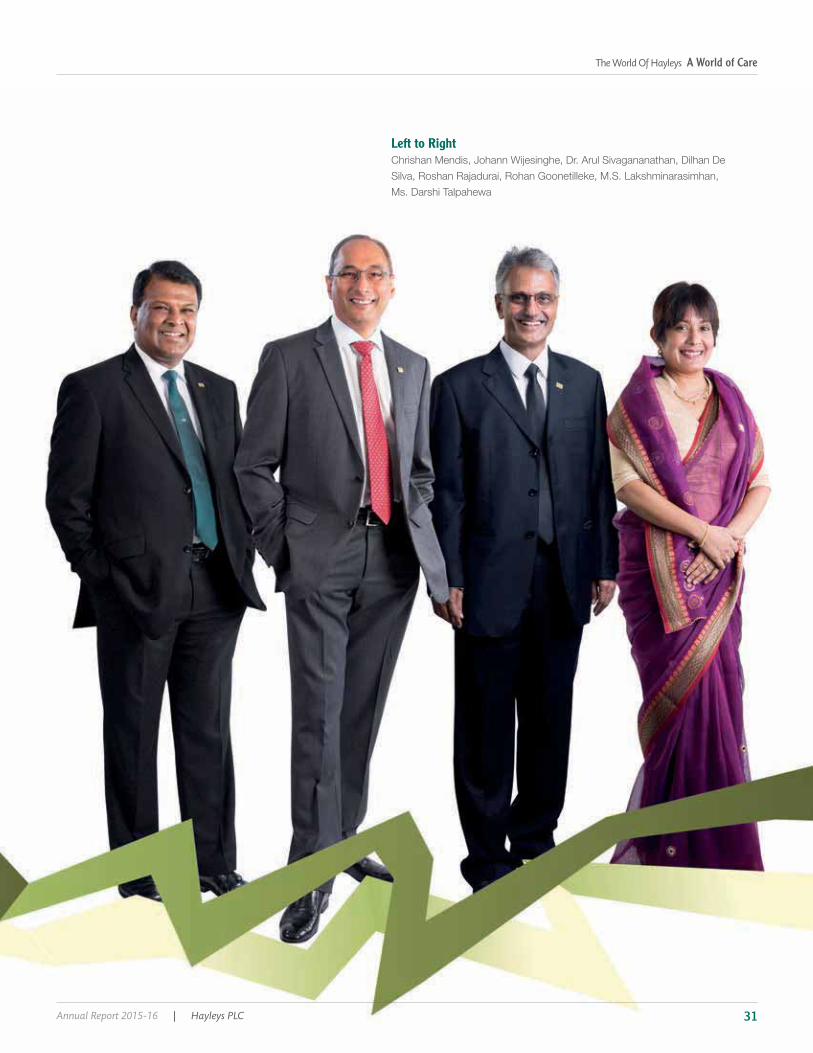
Left to Right
Annual Report 2015-16 | Hayleys PLC 31
The World Of Hayleys A World of Care

Mohan Pandithage
Rizvi Zaheed
Sarath Ganegoda
Rajitha Kariyawasan
Dr. Mahesha Ranasoma
Lalin Samarawickrama
Ruwan Waidyaratne
Chrishan Mendis
Johann Wijesinghe
Dr. Arul Sivagananathan
Dilhan De Silva
Roshan Rajadurai
Group Management CommitteeLeadership and Governance
Report Preamble > Hayleys at a Glance > Leadership and Governance > Our Strategy > Management Discussion and Analysis > Our Value Creation Report > Financial Statements
Hayleys PLC | Annual Report 2015-1632
Rohan Goonetilleke
M.S. Lakshminarasimhan
Darshi Talpahewa
Annual Report 2015-16 | Hayleys PLC 33
The World Of Hayleys A World of Care

Leadership and Governance
Corporate Governance
Centralised Services
Group Listed Companies/Sectors
Report Preamble > Hayleys at a Glance > Leadership and Governance > Our Strategy > Management Discussion and Analysis > Our Value Creation Report > Financial Statements
Hayleys PLC | Annual Report 2015-1634
Area of Governance # of Principles
An Effective Board (Principle A.1)
Board Committee Areas of Oversight Composition & Executive support
Audit Committee
Nominations Committee
Annual Report 2015-16 | Hayleys PLC 35
The World Of Hayleys A World of Care
Board Committee Areas of Oversight Composition & Executive support
Remuneration Committee
Related Party Transaction Review Committee
Finance and Investment Committee
Regular Meetings (Principle A 1.1)
Directors Board Audit Committee
Remuneration Committee
Nomination Committee
Related Party Transaction
Review Committee
Finance and Investment Committee
Total No. of Meetings 13 08 02 06 02 01
Leadership and GovernanceCorporate Governance
Report Preamble > Hayleys at a Glance > Leadership and Governance > Our Strategy > Management Discussion and Analysis > Our Value Creation Report > Financial Statements
Hayleys PLC | Annual Report 2015-1636
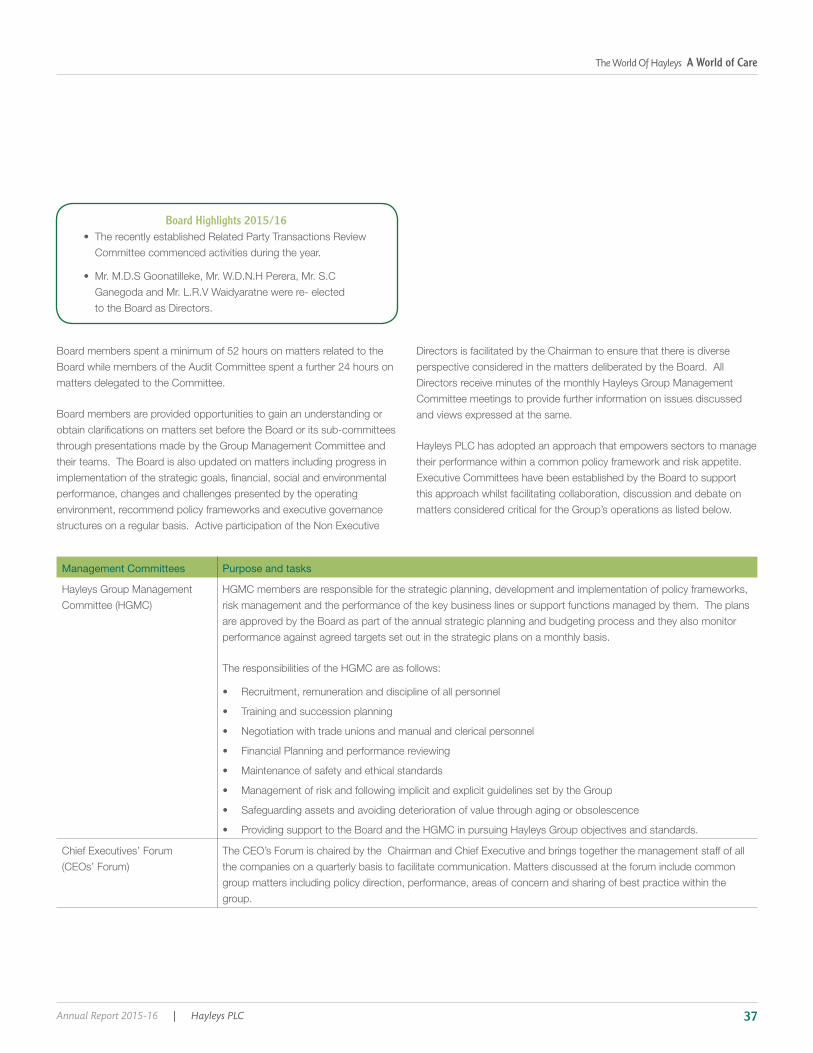
Board Highlights 2015/16•
•
Management Committees Purpose and tasks
•
•
•
•
•
•
•
•
Annual Report 2015-16 | Hayleys PLC 37
The World Of Hayleys A World of Care
Management Committees Purpose and tasks
Board Responsibilities (Principle A 1.2)
Key Board Responsibilities
Act in Accordance with laws (Principle A.1.3)
Access to Advice and Services of Company Secretary (Principle A.1.4)
Board Meetings and Board Committee Meetings
General Meetings
Leadership and GovernanceCorporate Governance
Report Preamble > Hayleys at a Glance > Leadership and Governance > Our Strategy > Management Discussion and Analysis > Our Value Creation Report > Financial Statements
Hayleys PLC | Annual Report 2015-1638
Articles of Association of the Company
Reports, Accounts, Documentation
Corporate Governance
Stock Exchange/Securities and Exchange Commission of Sri Lanka Rules (CSE /SEC Rules)
Returns with Registrar of Companies
Others
Independent judgement (Principle A.1.5)
Dedicate Adequate Time and Effort to Matters of the Board and the Company (Principle A.1.6)
Training for Directors (Principle A.1.7)
Division of Responsibilities between the Chairman and CEO (Principle A.2)
Role of Co-Chairman
Annual Report 2015-16 | Hayleys PLC 39
The World Of Hayleys A World of Care
The Chairman’s Role (Principle A.3)
Role of Chairman
Financial Acumen (Principle A.4)
Board Balance (Principle A.5)
Leadership and GovernanceCorporate Governance
Report Preamble > Hayleys at a Glance > Leadership and Governance > Our Strategy > Management Discussion and Analysis > Our Value Creation Report > Financial Statements
Hayleys PLC | Annual Report 2015-1640

Supply of Relevant Information (Principle A.6)
Appointments to the Board (Principles A.7)
Re-Election (Principle A.8)
Appraisal of Board Performance (Principle A.9)
Disclosure of Information with Respect to Directors (Principle A.10)
Annual Report 2015-16 | Hayleys PLC 41
The World Of Hayleys A World of Care

Appraisal of Chief Executive Officer (Principle A.11)
Directors’ Remuneration Procedure (Principle B.1)
Level & Make Up of Remuneration (Principle B.2)
Disclosure of Remuneration (Principle B.3)
Relations with Shareholders (Principle C.1)
Leadership and GovernanceCorporate Governance
Report Preamble > Hayleys at a Glance > Leadership and Governance > Our Strategy > Management Discussion and Analysis > Our Value Creation Report > Financial Statements
Hayleys PLC | Annual Report 2015-1642
Communication with Shareholders (Principle C.2.)
Material Transactions (Principle C.3)
Accountability & Audit (Principle D.1)
Internal Control (Principle D.2)
Annual Report 2015-16 | Hayleys PLC 43
The World Of Hayleys A World of Care
Leadership and GovernanceCorporate Governance
Hayleys
Way
Audit Committee (Principle D.3)
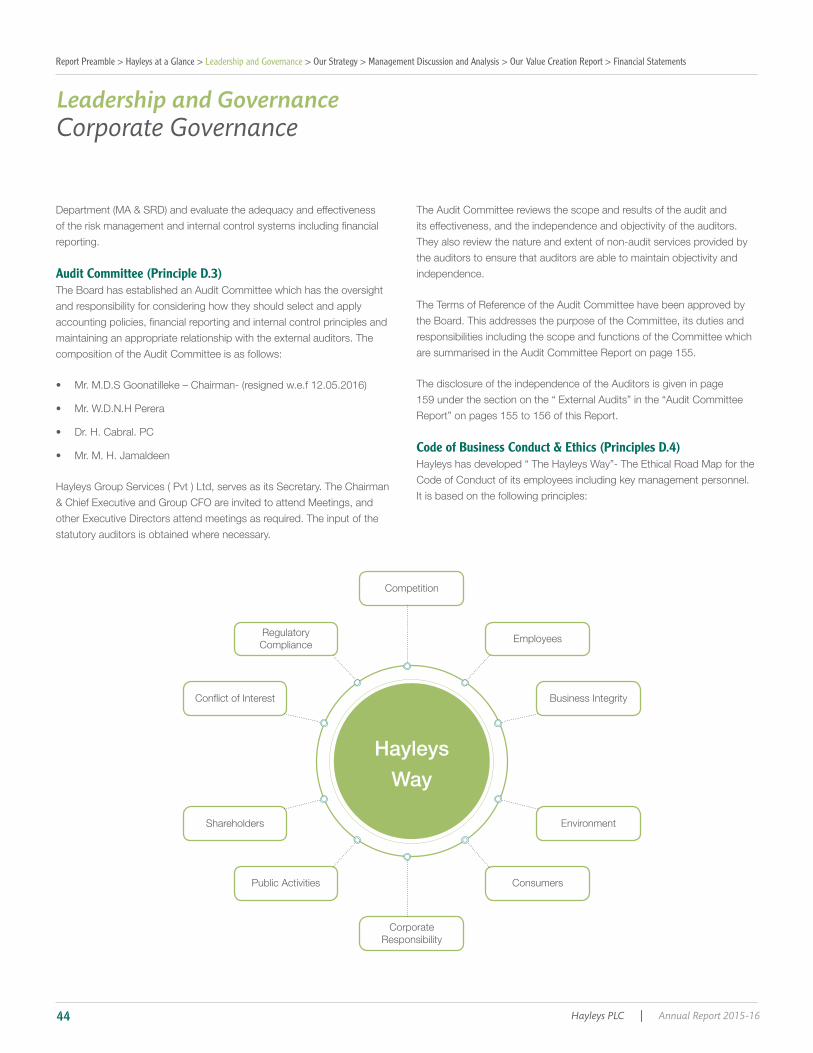
Code of Business Conduct & Ethics (Principles D.4)
Report Preamble > Hayleys at a Glance > Leadership and Governance > Our Strategy > Management Discussion and Analysis > Our Value Creation Report > Financial Statements
Hayleys PLC | Annual Report 2015-1644

Corporate Governance Disclosures (Principle D.5)
Institutional Shareholders (Principles E 1 & 2)
Other Investors (Principles F1 & 2)
Sustainability Reporting (Principle G)
Annual Report 2015-16 | Hayleys PLC 45
The World Of Hayleys A World of Care
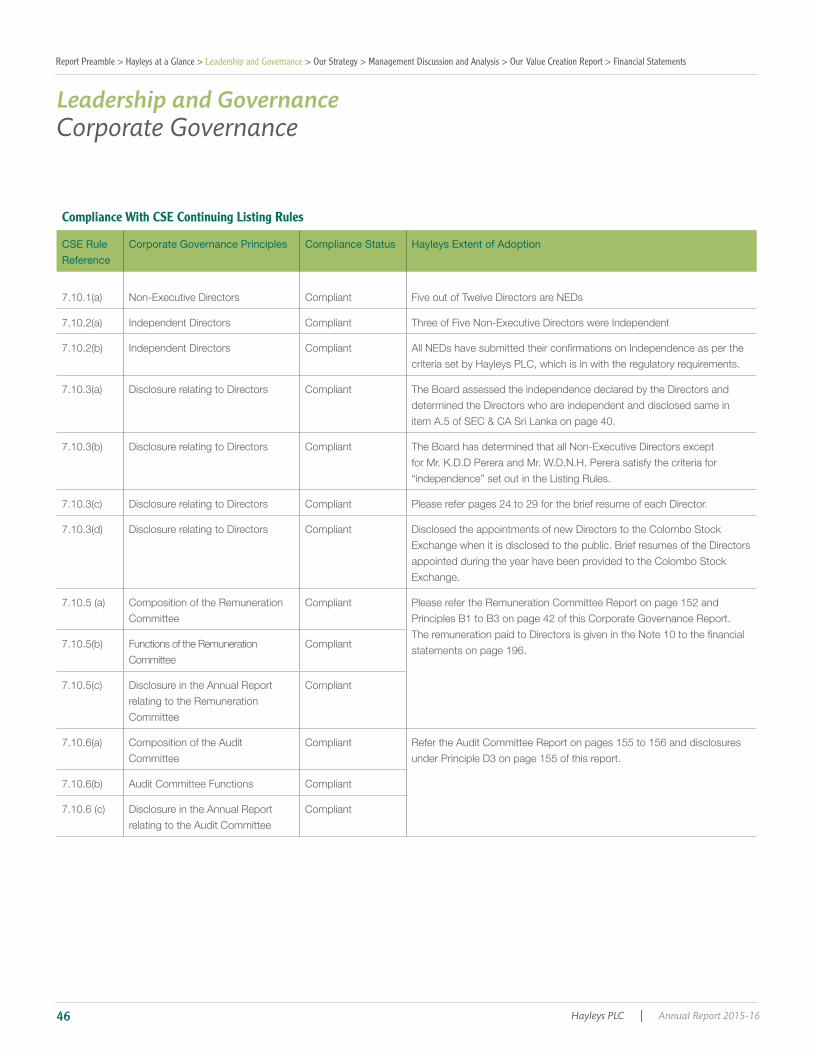
Compliance With CSE Continuing Listing Rules
CSE Rule Reference
Corporate Governance Principles Compliance Status Hayleys Extent of Adoption
Leadership and GovernanceCorporate Governance
Report Preamble > Hayleys at a Glance > Leadership and Governance > Our Strategy > Management Discussion and Analysis > Our Value Creation Report > Financial Statements
Hayleys PLC | Annual Report 2015-1646
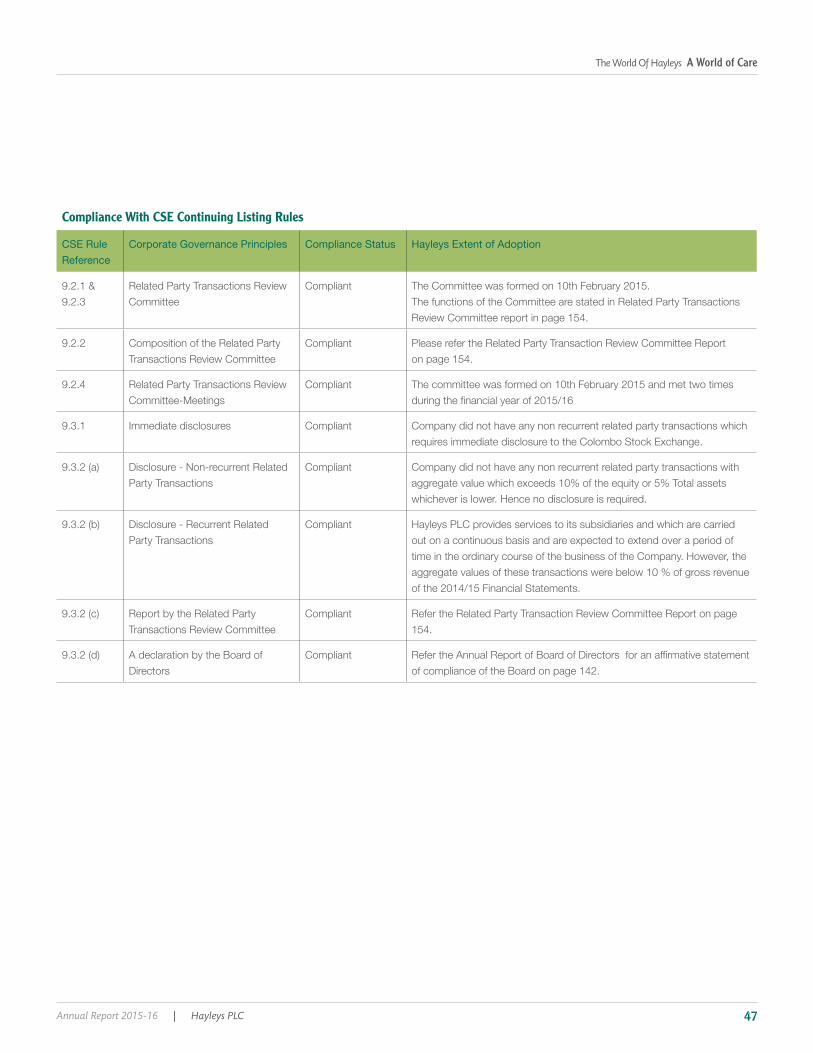
Compliance With CSE Continuing Listing Rules
CSE Rule Reference
Corporate Governance Principles Compliance Status Hayleys Extent of Adoption
Annual Report 2015-16 | Hayleys PLC 47
The World Of Hayleys A World of Care

Managing RiskLeadership and Governance
Risk Governance
Risk Identification & Management
Portfolio Concentration
Acceptance & Mitigation
Individual Businesses
1st Line
Assurance & Policy Formulation
Hayleys PLC Board & Audit Committee
3rd Line
Risk Monitoring & Management
Sector Level Boards & Audit Committees
2nd Line
Report Preamble > Hayleys at a Glance > Leadership and Governance > Our Strategy > Management Discussion and Analysis > Our Value Creation Report > Financial Statements
Hayleys PLC | Annual Report 2015-1648
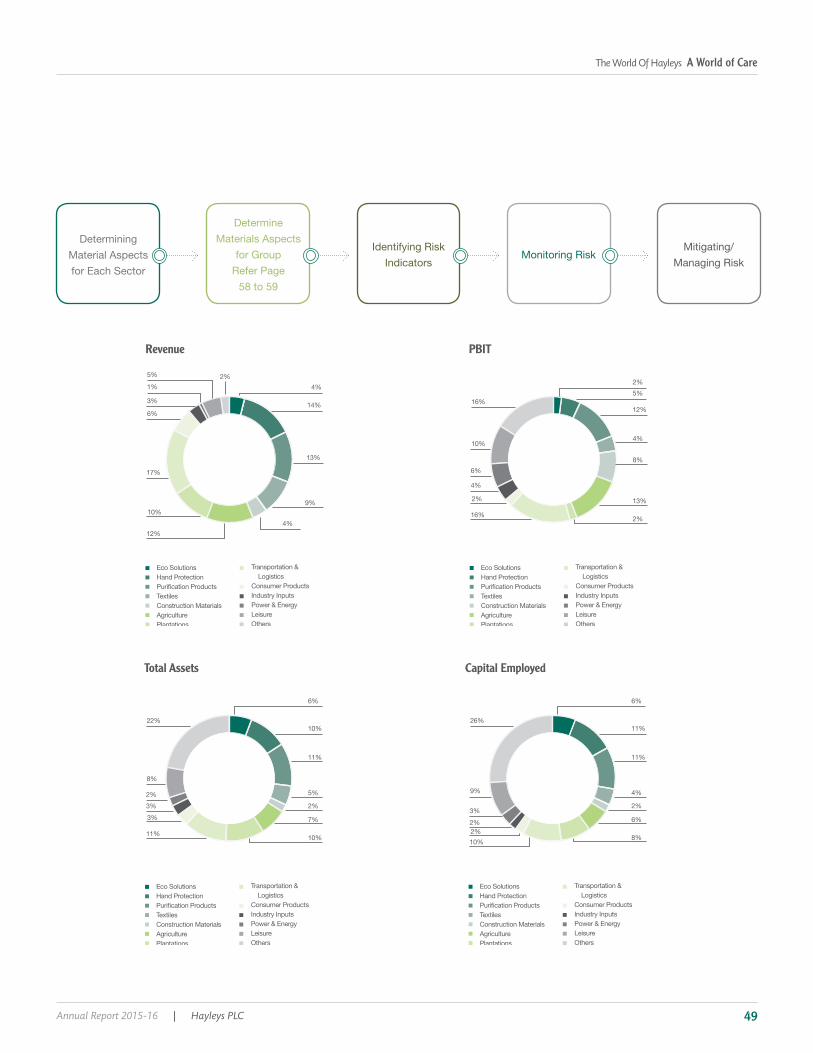
Determining Material Aspects for Each Sector
Monitoring RiskMitigating/
Managing Risk
Determine Materials Aspects
for Group Refer Page
58 to 59
Identifying Risk Indicators
1%
5%
6%
4%
14%
13%
17%
10%
12%
Revenue
9%
4%
3%
2%
Eco SolutionsHand Protection
TextilesConstruction Materials AgriculturePlantations
Transportation &Logistics
Consumer Products Industry InputsPower & EnergyLeisure Others
16%
2%5%
12%
4%
2%
16%
PBIT
4%
8%
13%
2%
10%
Eco SolutionsHand Protection
TextilesConstruction Materials AgriculturePlantations
Transportation &Logistics
Consumer Products Industry InputsPower & EnergyLeisure Others
6%
22%
6%
10%
3%3%
11%
Total Assets
11%
5%
2%
7%
10%
8%
Eco SolutionsHand Protection
TextilesConstruction Materials AgriculturePlantations
Transportation &Logistics
Consumer Products Industry InputsPower & EnergyLeisure Others
2%
26%
6%
11%
2%2%10%
Capital Employed
11%
4%
2%
6%
8%
9%
Eco SolutionsHand Protection
TextilesConstruction Materials AgriculturePlantations
Transportation &Logistics
Consumer Products Industry InputsPower & EnergyLeisure Others
3%
Annual Report 2015-16 | Hayleys PLC 49
The World Of Hayleys A World of Care

Principal Risks & Uncertainties
Risk Impact Mitigating Activities Net Risk Assessment
Geopolitical Risk •
•
•
• risk
Government Policy •
•
Availability of Raw Material
•
•
•
•
Supply and Affordability of Energy
footprint
•
•
•
•
•
for further information
Low
Managing RiskLeadership and Governance
Report Preamble > Hayleys at a Glance > Leadership and Governance > Our Strategy > Management Discussion and Analysis > Our Value Creation Report > Financial Statements
Hayleys PLC | Annual Report 2015-1650

Risk Impact Mitigating Activities Net Risk Assessment
Availability of Water •
•
•
•
•
for further information
Employee Health & Safety
•
•
implementation of the same
•
•
Low
Employee Relations •
•
•
•
•
for further information
Low
Effluents & Waste •
•
•
•
Low
Annual Report 2015-16 | Hayleys PLC 51
The World Of Hayleys A World of Care
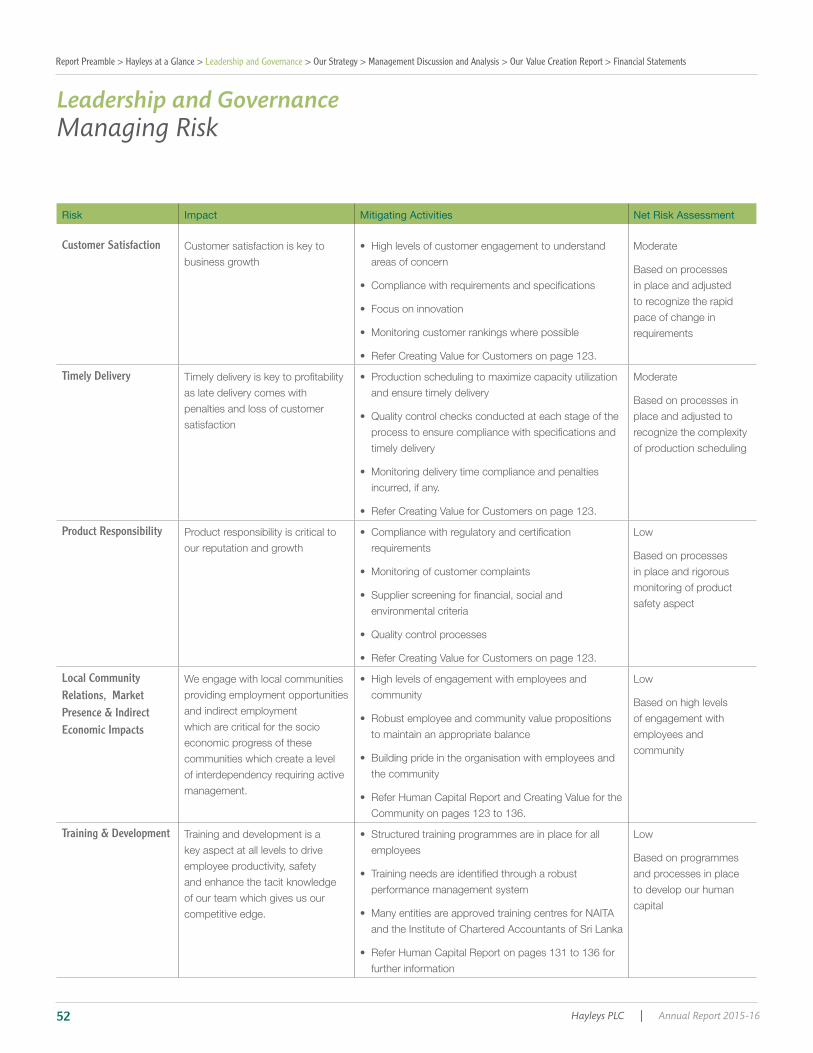
Risk Impact Mitigating Activities Net Risk Assessment
Customer Satisfaction •
•
•
•
•
Timely Delivery •
•
•
•
Product Responsibility •
•
•
•
•
Low
Local Community Relations, Market Presence & Indirect Economic Impacts
•
•
•
•
Low
Training & Development •
employees
•
•
•
further information
Low
Managing RiskLeadership and Governance
Report Preamble > Hayleys at a Glance > Leadership and Governance > Our Strategy > Management Discussion and Analysis > Our Value Creation Report > Financial Statements
Hayleys PLC | Annual Report 2015-1652
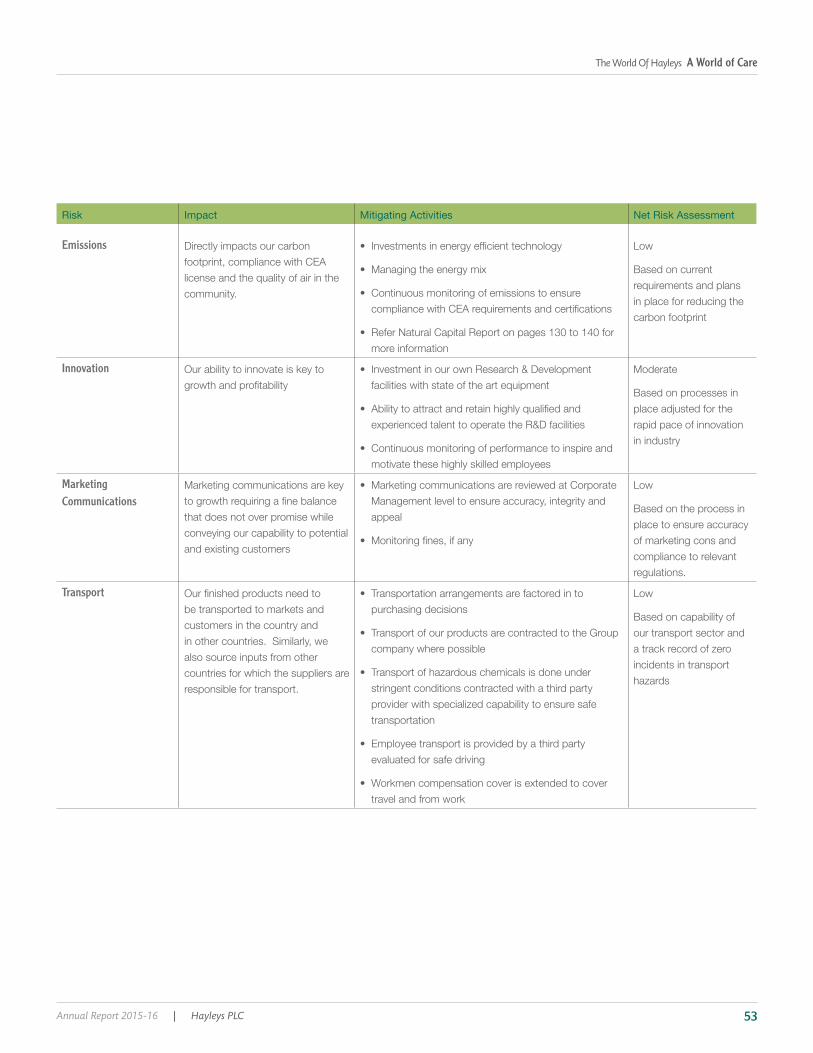
Risk Impact Mitigating Activities Net Risk Assessment
Emissions •
•
•
•
more information
Low
Innovation •
•
•
Marketing Communications
•
appeal
•
Low
Transport •
•
•
transportation
•
•
Low
Annual Report 2015-16 | Hayleys PLC 53
The World Of Hayleys A World of Care
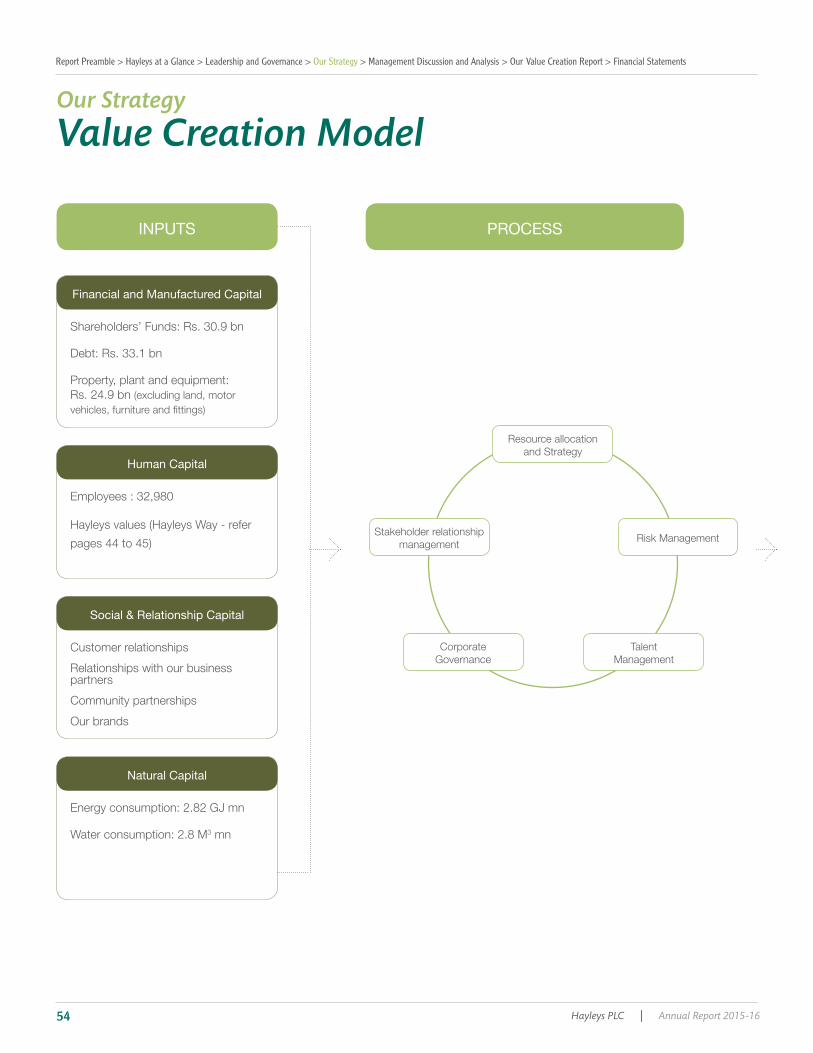
INPUTS PROCESS
Financial and Manufactured Capital
Human Capital
Social & Relationship Capital
Natural Capital
partners
3 mn
Value Creation ModelOur Strategy
Report Preamble > Hayleys at a Glance > Leadership and Governance > Our Strategy > Management Discussion and Analysis > Our Value Creation Report > Financial Statements
Hayleys PLC | Annual Report 2015-1654
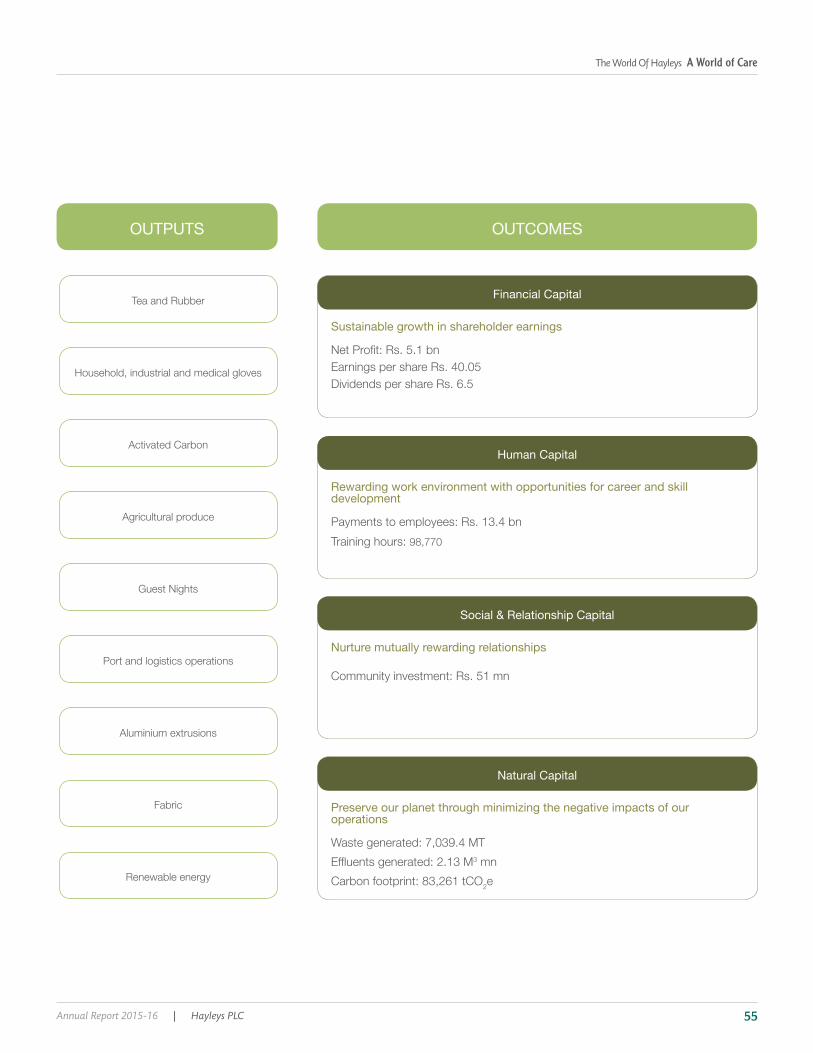
OUTPUTS OUTCOMES
Human Capital
Social & Relationship Capital
Natural Capital
Financial Capital
Sustainable growth in shareholder earnings
Rewarding work environment with opportunities for career and skill development
Nurture mutually rewarding relationships
Preserve our planet through minimizing the negative impacts of our operations
3 mn
e
Annual Report 2015-16 | Hayleys PLC 55
The World Of Hayleys A World of Care
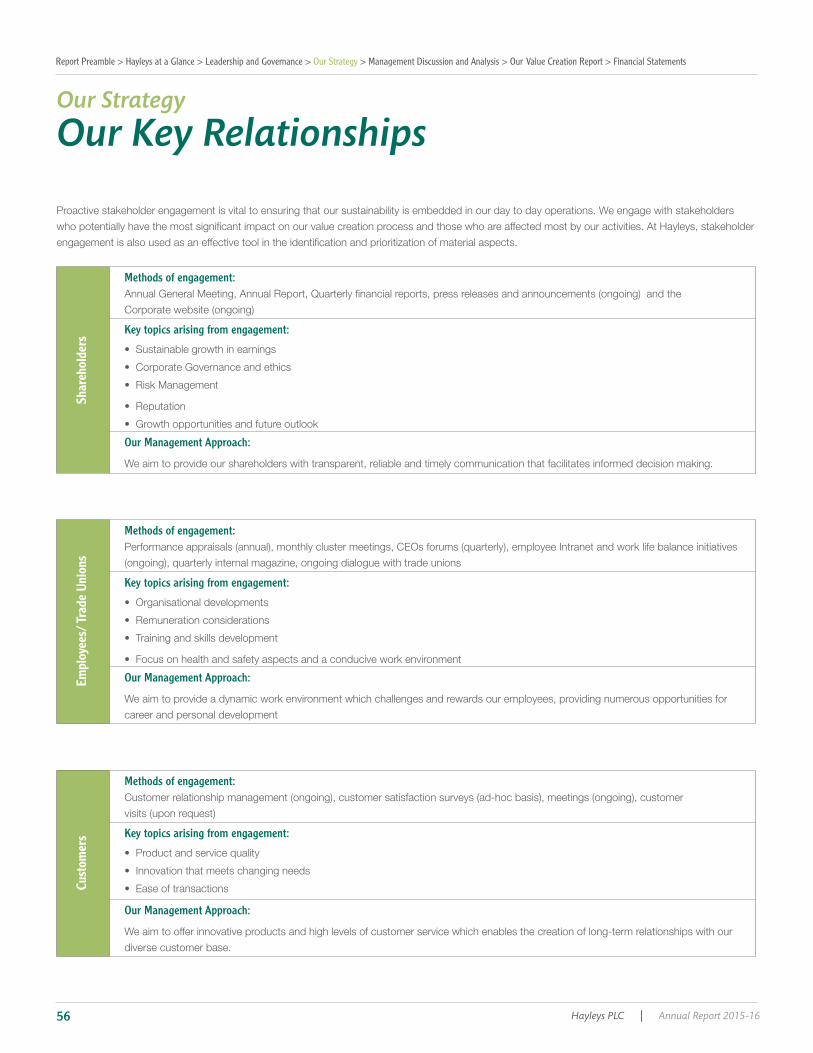
Our Key RelationshipsOur Strategy
Methods of engagement:
Key topics arising from engagement:
•
•
•
•
•
Our Management Approach:
Methods of engagement:
Key topics arising from engagement:
•
•
•
•
Our Management Approach:
Methods of engagement:
Key topics arising from engagement:
•
•
•
Our Management Approach:
Shar
ehol
ders
Empl
oyee
s/ Tr
ade
Unio
nsCu
stom
ers
Report Preamble > Hayleys at a Glance > Leadership and Governance > Our Strategy > Management Discussion and Analysis > Our Value Creation Report > Financial Statements
Hayleys PLC | Annual Report 2015-1656

Methods of engagement:
Key topics arising from engagement:
•
•
•
•
Our Management Approach:
Methods of engagement:
Key topics arising from engagement:
•
•
•
Our Management Approach:
Methods of engagement:
Key topics arising from engagement:
•
•
Our Management Approach:
Busi
ness
Par
tner
sLo
cal C
omm
uniti
esTh
e Go
vern
men
t
Annual Report 2015-16 | Hayleys PLC 57
The World Of Hayleys A World of Care

Determining Material IssuesOur StrategyOur Strategy
Identify matters impacting the value creation process with
reference to the stock of capitals and stakeholders
impacted
Determining matters to be
disclosed in the Integrated Report of the company
Evaluate their
Hayleys PLC and its business
sectors and the impacted stakeholders
Prioritize matters based on their
relative importance
Report Preamble > Hayleys at a Glance > Leadership and Governance > Our Strategy > Management Discussion and Analysis > Our Value Creation Report > Financial Statements
Hayleys PLC | Annual Report 2015-1658

Material aspect Corresponding GRI Requirement UNGC Principle
Aspect Boundary
Critical
High Impact
Significant Impact
Annual Report 2015-16 | Hayleys PLC 59
The World Of Hayleys A World of Care

Strategic FrameworkOur StrategyOur Strategy
Availability of Raw Materials Availability of Water
Geo-political Risk Food Security Technology
Eco
Syst
em D
eclin
e
Gov
ernm
ent P
olic
y
Clim
ate
Cha
nge
Dem
ogra
phic
s
Ener
gy
Wea
lth
Growth
Sustained Profitability
Corporate Responsibility
Health and Sanitation
Report Preamble > Hayleys at a Glance > Leadership and Governance > Our Strategy > Management Discussion and Analysis > Our Value Creation Report > Financial Statements
Hayleys PLC | Annual Report 2015-1660
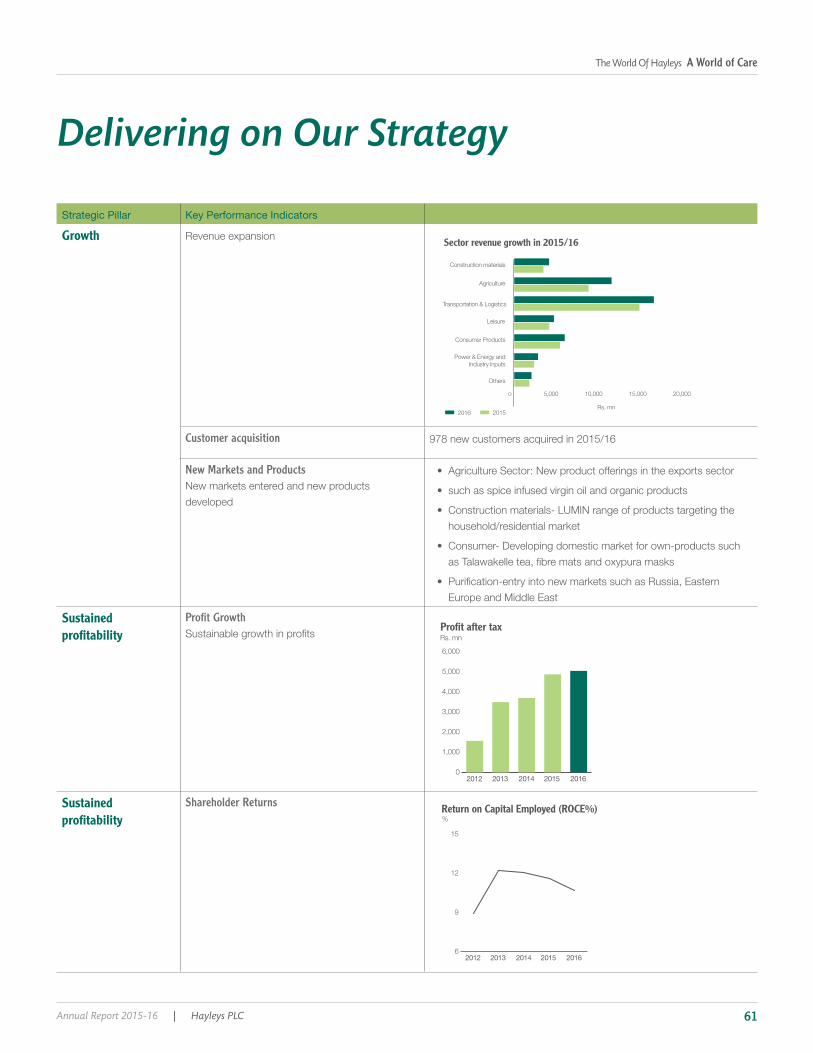
Delivering on Our Strategy
Strategic Pillar Key Performance Indicators
Growth
Customer acquisition
New Markets and Products
Sustained profitability
Profit Growth
Sustained profitability
Shareholder Returns
Others
Rs. mn
0 5,000 10,000 15,000 20,000
Sector revenue growth in 2015/16
2016 2015
Power & Energy andIndustry Inputs
Consumer Products
Leisure
Transportation & Logistics
Agriculture
Construction materials
0
1,000
2,000
3,000
4,000
5,000
6,000
Rs. mn
2012 2013 2014 2015 2016
Profit after tax
%
2012 2013 2014 2015 20166
9
12
15
Return on Capital Employed (ROCE%)
Annual Report 2015-16 | Hayleys PLC 61
The World Of Hayleys A World of Care
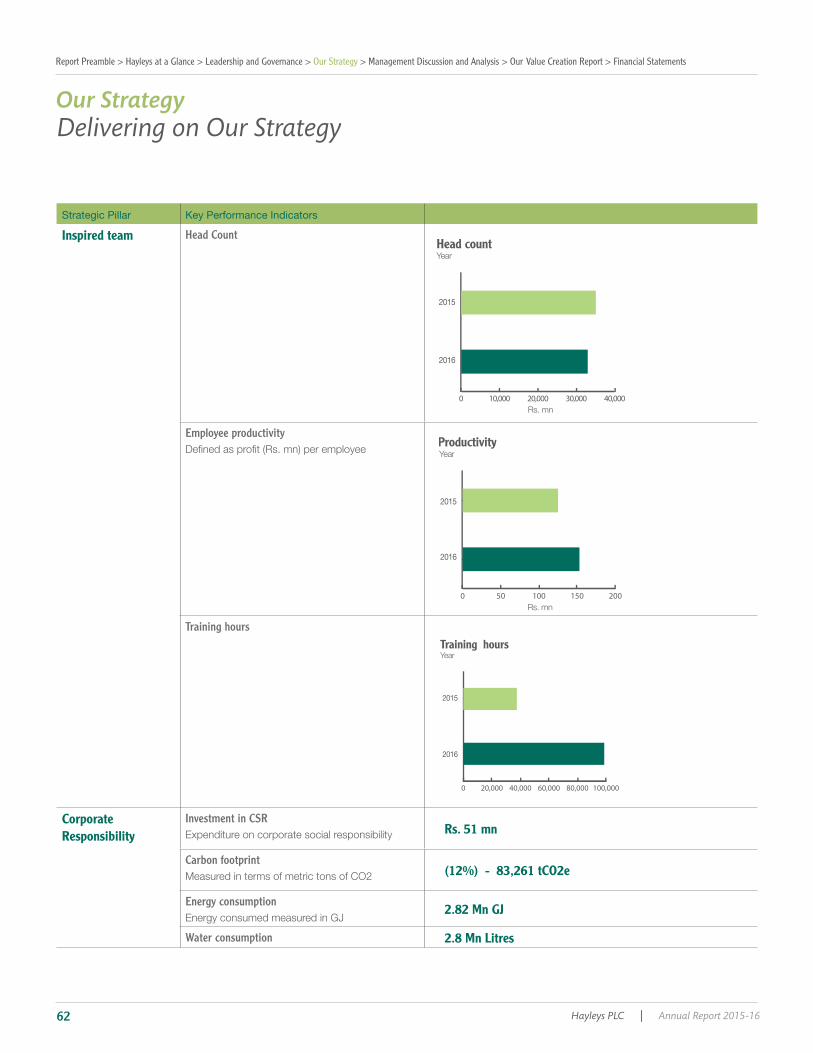
Our StrategyDelivering on Our Strategy
Strategic Pillar Key Performance Indicators
Inspired team Head Count
Employee productivity
Training hours
Corporate Responsibility
Investment in CSR Rs. 51 mn
Carbon footprint (12%) - 83,261 tCO2e
Energy consumption 2.82 Mn GJ
Water consumption 2.8 Mn Litres
2015
2016
Head countYear
0 10,000 20,000 30,000 40,000Rs. mn
2016
2015
ProductivityYear
Rs. mn0 50 100 150 200
2016
2015
Training hours
0 20,000 40,000 60,000 80,000 100,000
Year
Report Preamble > Hayleys at a Glance > Leadership and Governance > Our Strategy > Management Discussion and Analysis > Our Value Creation Report > Financial Statements
Hayleys PLC | Annual Report 2015-1662

Sustainability at Hayleys
Concern for the Environment
Employee welfare and development
Local Community Engagement
Annual Report 2015-16 | Hayleys PLC 63
The World Of Hayleys A World of Care

Our Commitment to the Sustainability Development Goals
Our Strategy
SDG Around the World* Hayleys’ Commitment•
•
•
•
•
•
•
•
•
•
•
•
•
•
•
•
•
•
•
•
•
without
•
• as toilets or latrines
•
•
•
•
•
•
•
•
Report Preamble > Hayleys at a Glance > Leadership and Governance > Our Strategy > Management Discussion and Analysis > Our Value Creation Report > Financial Statements
Hayleys PLC | Annual Report 2015-1664

SDG Around the World* Hayleys’ Commitment•
•
•
•
•
•
•
•
•
•
•
•
•
•
•
•
•
•
•
•
•
•
•
• are lost
•
•
•
•
•
•
•
•
•
•
Annual Report 2015-16 | Hayleys PLC 65
The World Of Hayleys A World of Care

Operating EnvironmentManagement Discussion and Analysis
Economic Review
Sri Lanka
Clusters in Sector
Sri Lanka World Emerging &
Developing Markets
Emerging &
Developing Asia
Source: IMP World Economic Outlook April 2016
Interest Rates
0
2
4
6
8
10
Group Revenue Industry
ServicesAgriculture
%
2011 2012 2013 2014 20152
4
6
8
10
12
%GDP Growth
million
2011 2012 2013 2014 20150
10
20
30
40
50
60
70
80
InvestmentConsumption
Consumption & Investment
Source: Central Bank data
Source: Central Bank data
Report Preamble > Hayleys at a Glance > Leadership and Governance > Our Strategy > Management Discussion and Analysis > Our Value Creation Report > Financial Statements
Hayleys PLC | Annual Report 2015-1666
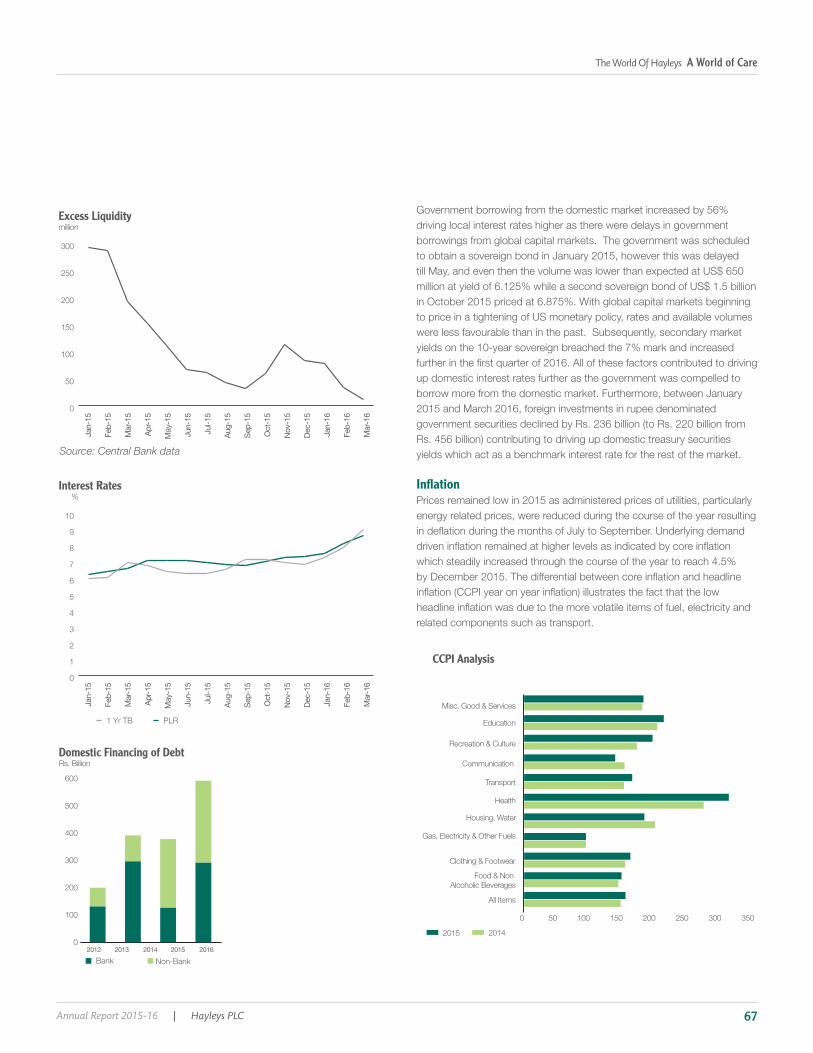
Inflation
millionExcess Liquidity
0
50
100
150
200
250
300
Jan-
15
Feb-
15
Mar
-15
Apr-1
5
May
-15
Jun-
15
Jul-1
5
Aug-
15
Sep-
15
Oct
-15
Nov-
15
Dec-
15
Jan-
16
Feb-
16
Mar
-16
%
1 Yr TB PLR
Interest Rates
0
1
2
3
4
5
6
7
8
9
10
Jan-
15
Feb-
15
Mar
-15
Apr-1
5
May
-15
Jun-
15
Jul-1
5
Aug-
15
Sep-
15
Oct
-15
Nov-
15
Dec-
15
Jan-
16
Feb-
16
Mar
-16
0
100
200
300
400
500
600
Bank Non-Bank
Rs. Billion
2012 2013 2014 2015 2016
Domestic Financing of Debt
Source: Central Bank data
All Items
Food & Non Alcoholic Beverages
Clothing & Footwear
Health
Transport
Communication
Recreation & Culture
Education
Misc. Good & Services
Gas, Electricity & Other Fuels
0 50 100 150 200 250 300 350
CCPI Analysis
2015 2014
Housing, Water
Annual Report 2015-16 | Hayleys PLC 67
The World Of Hayleys A World of Care
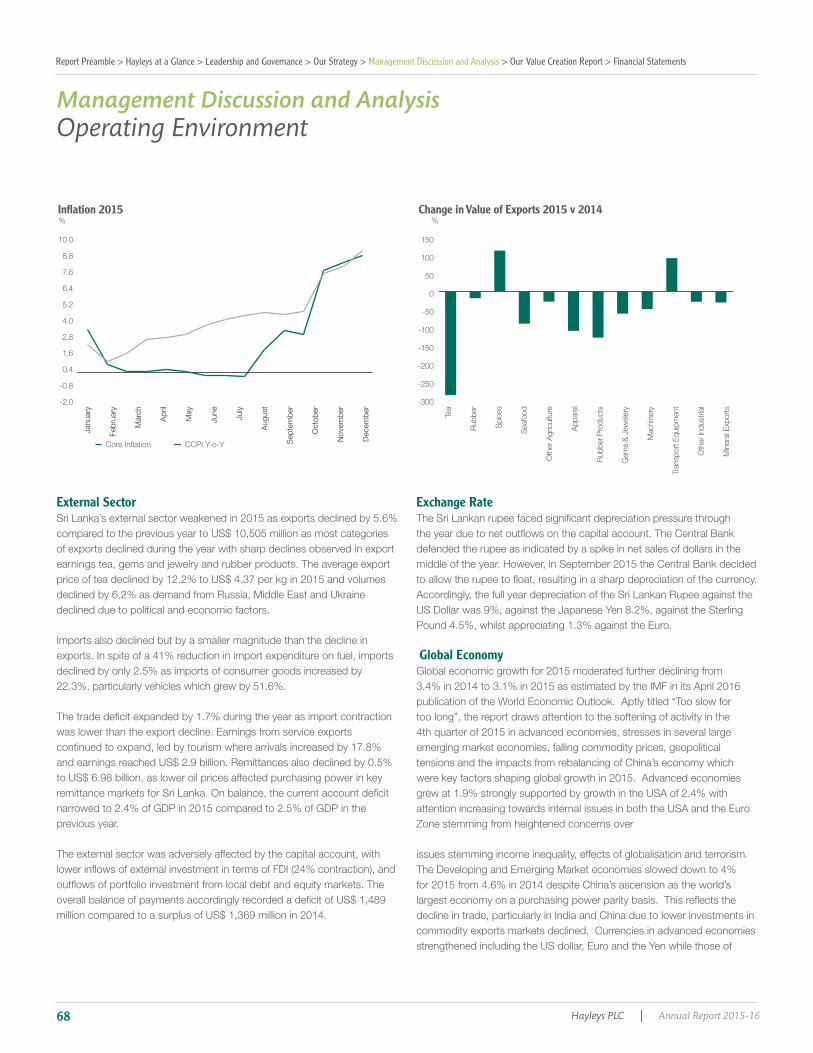
Exchange Rate
Global Economy
%
CCPI Y-o-Y
Inflation 2015
-2.0
-0.8
0.4
1.6
2.8
4.0
5.2
6.4
7.6
8.8
10.0
Janu
ary
Febr
uary
Mar
ch
April
May
June July
Augu
st
Sept
embe
r
Oct
ober
Nove
mbe
r
Dece
mbe
r
%Change in Value of Exports 2015 v 2014
-300
-250
-200
-150
-100
-50
0
50
100
150
Tea
Rub
ber
Spi
ces
Sea
food
Oth
er A
gric
ultu
re
App
arel
Rub
ber P
rodu
cts
Gem
s &
Jew
eler
y
Mac
hine
ry
Tran
spor
t Equ
ipm
ent
Oth
er In
dust
rial
Min
eral
Exp
orts
External Sector
Operating EnvironmentManagement Discussion and Analysis
Report Preamble > Hayleys at a Glance > Leadership and Governance > Our Strategy > Management Discussion and Analysis > Our Value Creation Report > Financial Statements
Hayleys PLC | Annual Report 2015-1668
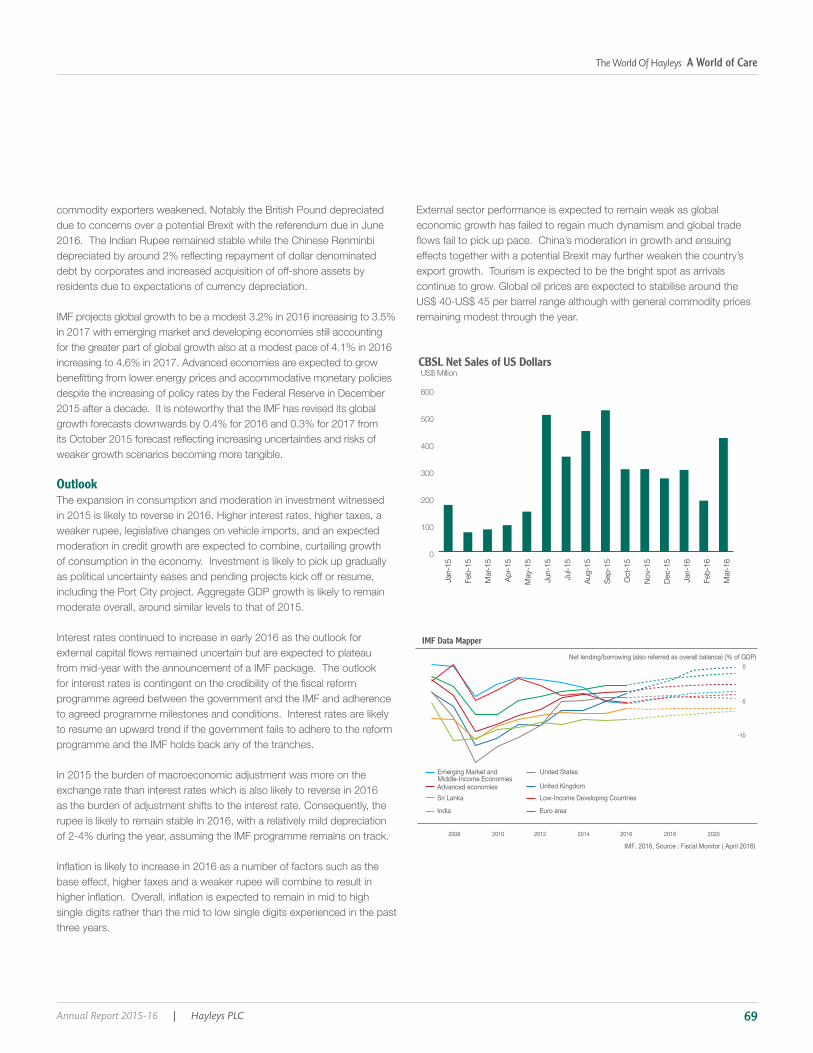
Outlook
IMF Data Mapper
2008 2010 2012 2014 2016 2018 2020
-10
-5
0
IMF, 2016, Source : Fiscal Monitor ( April 2016)
Emerging Market and Middle-Income EconomiesAdvanced economiesSri Lanka
India
United States
United KingdomLow-Income Developing Countries
Euro area
Net lending/borrowing (also referred as overall balance) (% of GDP)
US$ MillionCBSL Net Sales of US Dollars
0
100
200
300
400
500
600
Jan-
15
Feb-
15
Mar
-15
Apr-1
5
May
-15
Jun-
15
Jul-1
5
Aug-
15
Sep-
15
Oct
-15
Nov-
15
Dec-
15
Jan-
16
Feb-
16
Mar
-16
Annual Report 2015-16 | Hayleys PLC 69
The World Of Hayleys A World of Care

Sector Review
Eco Solutions
4% 1% 6% 4% 3%Revenue PBT Assets Employees Carbon Footprint
Clusters in Sector Operations Highlights
Contribution to Sector Revenue
Contribution to Sector PBT
Brush ware
Hayleys PLC | Annual Report 2015-1670
Report Preamble > Hayleys at a Glance > Leadership and Governance > Our Strategy > Management Discussion and Analysis > Our Value Creation Report > Financial Statements
Hayleys PLC | Annual Report 2015-1670

Operating Context
Material challenges in 2016•
•
•
0
5,000
10,000
15,000
20,000
Value added fibre exports
Raw fibre exports
Rs. mn
2013 2014 2015 2016
Fibre exports
Cluster revenue performance
0
1,000
2,000
3,000
4,000
5,000
6,000
7,000
8,000
Coir tw
ine
Tawashi
brushes
Coir broom
s and brushes
Coir fibre
pith/dust
Moulded coir
piths
Husk chips
Geotextiles
Coir m
ats and rugs
Rs. mn
Annual Report 2015-16 | Hayleys PLC 71Annual Report 2015-16 | Hayleys PLC 71
The World Of Hayleys A World of Care
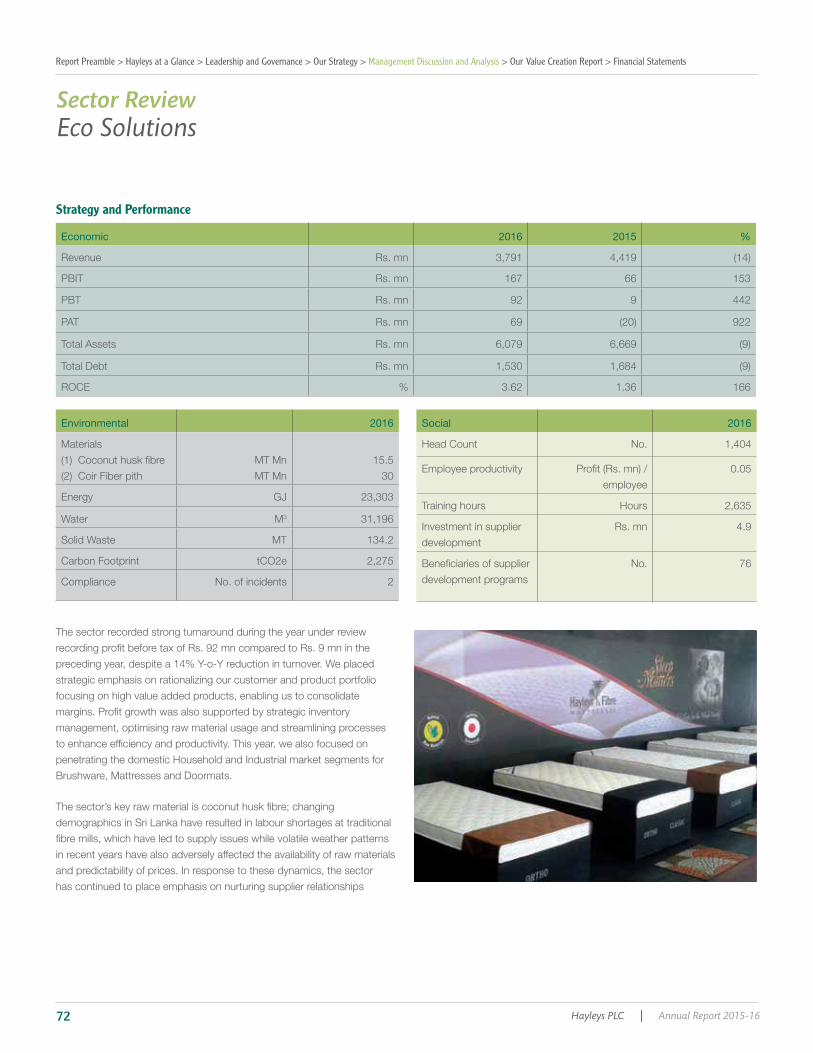
Strategy and Performance
Economic 2016 2015 %
Environmental 2016
3
Social 2016
employee
Hours
Eco SolutionsSector Review
Report Preamble > Hayleys at a Glance > Leadership and Governance > Our Strategy > Management Discussion and Analysis > Our Value Creation Report > Financial Statements
Hayleys PLC | Annual Report 2015-1672

Way Forward
0
300
600
900
1200
1500
2014 2015 2016Headcount Productivity
Number
-0.12
-0.10
-0.08
-0.06
-0.04
-0.02
0.00
0.02
0.04
0.06
Profit/Employee
0
500
1,000
1,500
2,000
2,500
3,000
Carbon Footprint
tCO2e
2014 2015 2016
0
1,000
2,000
3,000
4,000
5,000
6,000
7,000
8,000
2014 2015 2016Revenue Assets ROCE (%)
Rs. mn.
0
1
2
3
4
5
%
Annual Report 2015-16 | Hayleys PLC 73
The World Of Hayleys A World of Care

Hand Protection
14% 7% 10% 5% 21%Revenue PBT Assets Employees Carbon Footprint
150
155
160
165
170
175
180
185
190
195
200
Consumption expenditure
USD mn
2011 2012 2013 2014 2015
Glove export earnings
Operating Context
Sector Review
Report Preamble > Hayleys at a Glance > Leadership and Governance > Our Strategy > Management Discussion and Analysis > Our Value Creation Report > Financial Statements
Hayleys PLC | Annual Report 2015-1674
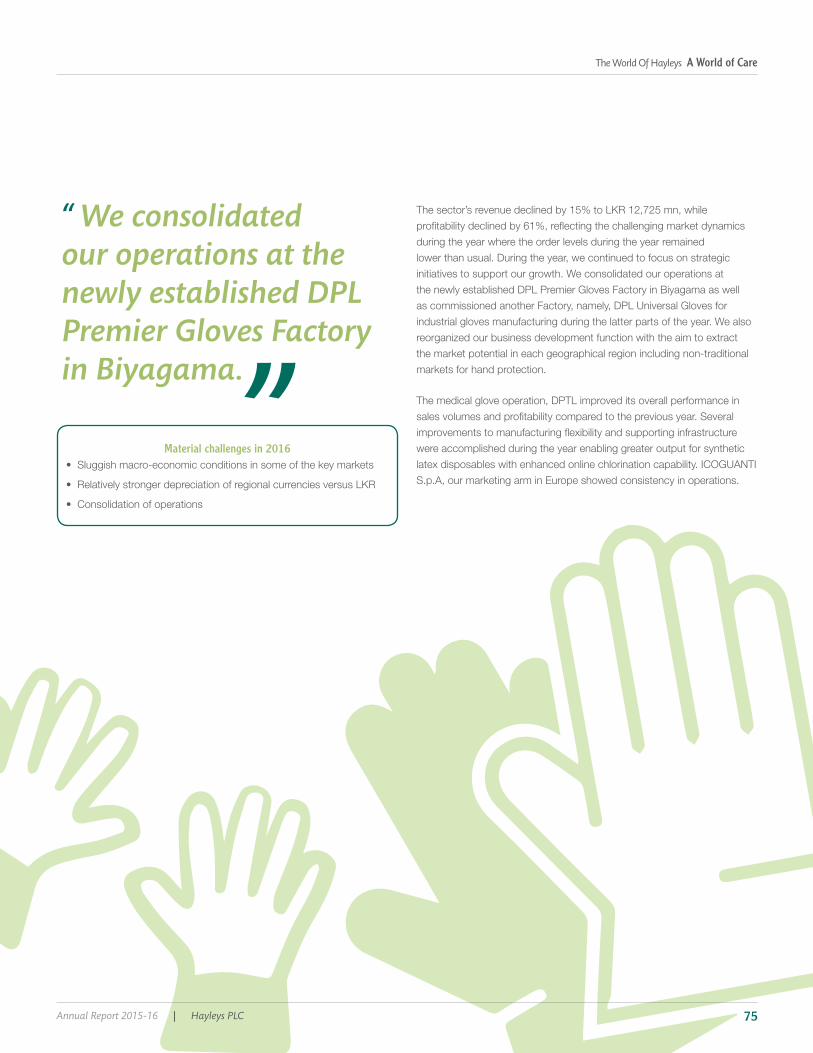
“ We consolidated
our operations at the
newly established DPL
Premier Gloves Factory
in Biyagama.
”Material challenges in 2016
Annual Report 2015-16 | Hayleys PLC 75
The World Of Hayleys A World of Care

Hand Protection
Strategy and Performance
Economic 2016 2015 %
Environmental 2016
3
Social 2016
Hours
Sector Review
Report Preamble > Hayleys at a Glance > Leadership and Governance > Our Strategy > Management Discussion and Analysis > Our Value Creation Report > Financial Statements
Hayleys PLC | Annual Report 2015-1676

Way Forward
0
500
1,000
1,500
2,000
2,500
2014 2015 2016Headcount Productivity
Number
0.00
0.25
0.50
0.75
1.00
Profit/Employee
0
5,000
10,000
15,000
20,000
Carbon Footprint
tCO2e
2014 2015 2016
0
3,000
6,000
9,000
12,000
15,000
2014 2015 2016Revenue Assets ROCE (%)
Rs. mn.
0
5
10
15
20
%
Annual Report 2015-16 | Hayleys PLC 77
The World Of Hayleys A World of Care

Purification
13% 13% 11% 5% 7%Revenue PBT Assets Employees Carbon Footprint
Clusters in Sector Operations Highlights
Contribution to Sector Revenue
Contribution to Sector PBT
Sector Review
Report Preamble > Hayleys at a Glance > Leadership and Governance > Our Strategy > Management Discussion and Analysis > Our Value Creation Report > Financial Statements
Hayleys PLC | Annual Report 2015-1678
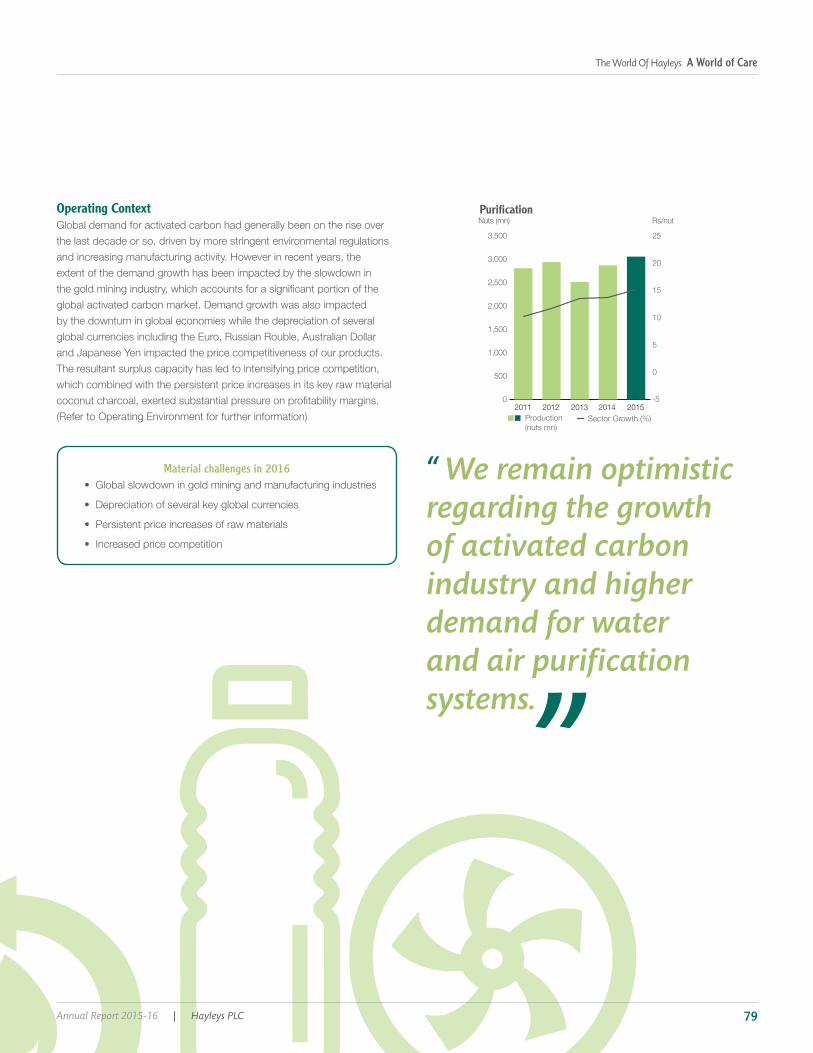
“ We remain optimistic
regarding the growth
of activated carbon
industry and higher
demand for water
and air purification
systems.
”
Operating Context
Material challenges in 2016•
•
•
•
0
500
1,000
1,500
2,000
2,500
3,000
3,500
Production (nuts mn)
Nuts (mn)
2011 2012 2013 2014 2015-5
0
5
10
15
20
25
Rs/nut
Sector Growth (%)
Purification
Annual Report 2015-16 | Hayleys PLC 79
The World Of Hayleys A World of Care

Purification
Strategy and Performance
Economic 2016 2015 %
Environmental 2016
3
Social 2016
Hours
Sector Review
Report Preamble > Hayleys at a Glance > Leadership and Governance > Our Strategy > Management Discussion and Analysis > Our Value Creation Report > Financial Statements
Hayleys PLC | Annual Report 2015-1680
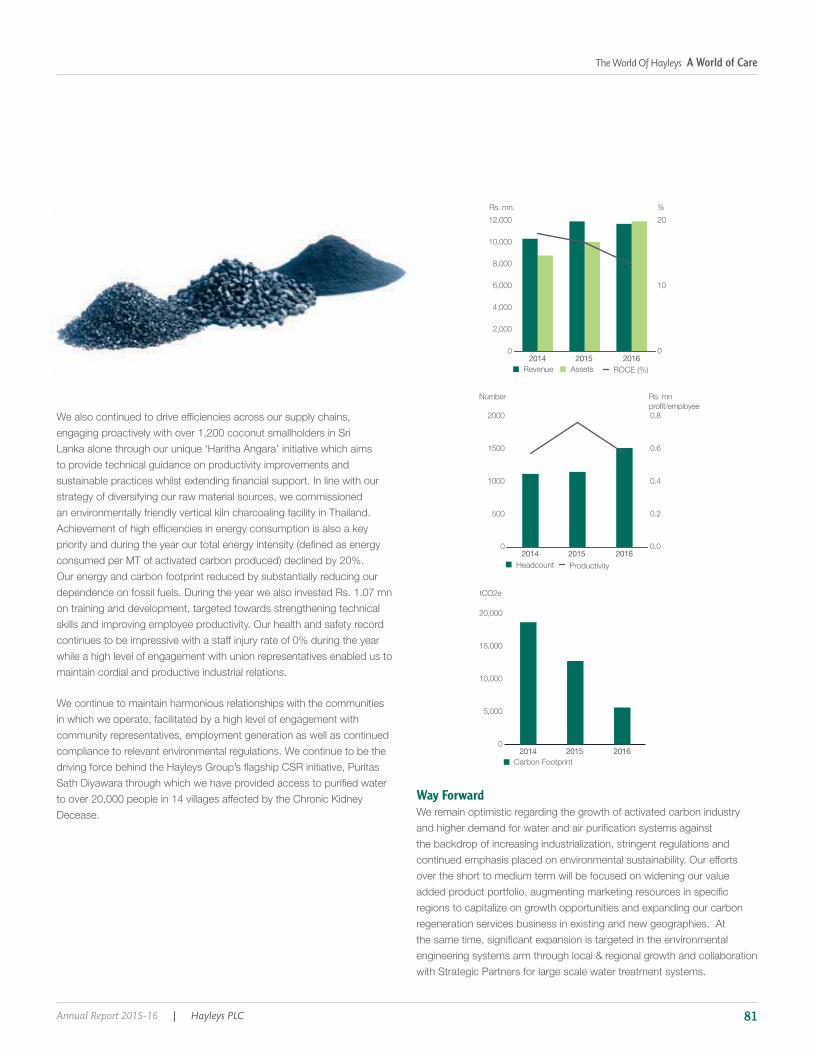
Way Forward
0
500
1000
1500
2000
2014 2015 2016Headcount Productivity
Number
0.0
0.2
0.4
0.6
0.8
Rs. mn profit/employee
0
5,000
10,000
15,000
20,000
Carbon Footprint
tCO2e
2014 2015 2016
0
2,000
4,000
6,000
8,000
10,000
12,000
2014 2015 2016Revenue Assets ROCE (%)
Rs. mn.
0
10
20
%
Annual Report 2015-16 | Hayleys PLC 81
The World Of Hayleys A World of Care

Textiles
9% 3% 5% 3% 26%Revenue PBT Assets Employees Carbon Footprint
Sector Review
Report Preamble > Hayleys at a Glance > Leadership and Governance > Our Strategy > Management Discussion and Analysis > Our Value Creation Report > Financial Statements
Hayleys PLC | Annual Report 2015-1682

“ Hayleys Fabric
delivered a profit of
Rs. 253 mn, a growth of
193% over the previous
year as it pursued its
strategy of moving to
higher value polyester
blend fabric.
”
Operating ContextMaterial challenges in 2016
• Stagnant demand in key overseas markets
• Dynamics of regional competitiveness
• Duplication of Company innovations by regional competitors
Annual Report 2015-16 | Hayleys PLC 83
The World Of Hayleys A World of Care

Textiles
Strategy and Performance
Economic 2016 2015 %
Environmental 2016
3
Social 2016
Hours
Sector Review
Report Preamble > Hayleys at a Glance > Leadership and Governance > Our Strategy > Management Discussion and Analysis > Our Value Creation Report > Financial Statements
Hayleys PLC | Annual Report 2015-1684
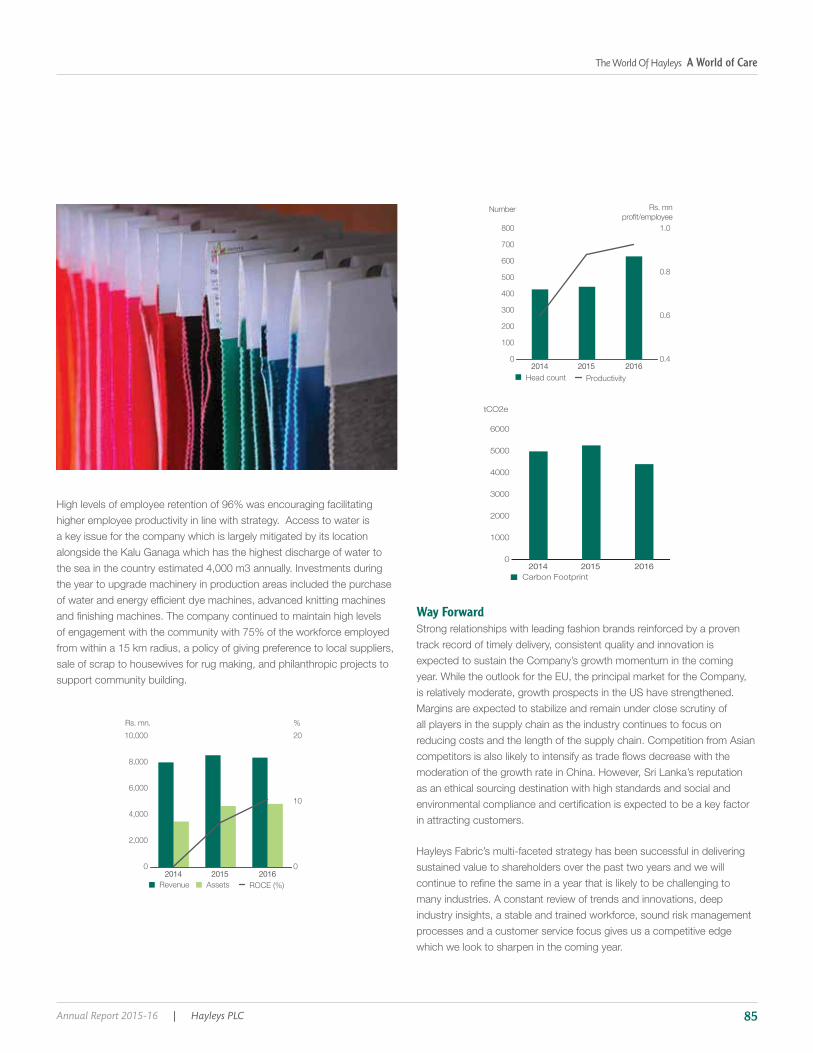
Way Forward
0
2,000
4,000
6,000
8,000
10,000
2014 2015 2016Revenue Assets ROCE (%)
Rs. mn.
0
10
20
%
0
1000
2000
3000
4000
5000
6000
Carbon Footprint
tCO2e
2014 2015 2016
0
100
200
300
400
500
600
700
800
2014 2015 2016Head count Productivity
Number
0.4
0.6
0.8
1.0
Rs. mn profit/employee
Annual Report 2015-16 | Hayleys PLC 85
The World Of Hayleys A World of Care

4% 9% 2% 2% 5%Revenue PBT Assets Employees Carbon Footprint
Construction MaterialsSector Review
0
2
4
6
8
10
Contribution to GDP (%)
%
2011 2012 2013 2014 2015-5
0
5
10
15
20
25
%
Sector Growth (%)
Contribution and Sector Growth
0
10
20
30
40
50
60
Production Consumption
Tonnes mn
2012 2013 2014 2015 20160
500
1,000
1,500
2,000
2,500
Sector Growth (%)
USD/Tonne
Production, Consumption and Sector Growth
Report Preamble > Hayleys at a Glance > Leadership and Governance > Our Strategy > Management Discussion and Analysis > Our Value Creation Report > Financial Statements
Hayleys PLC | Annual Report 2015-1686
“ Alumex turned in a
year of record growth
and profitability
achieving revenue and
profit growth of 20%
and 23% respectively
in comparison to the
previous year.
”
Operating Context
Material challenges in 2016
Annual Report 2015-16 | Hayleys PLC 87
The World Of Hayleys A World of Care
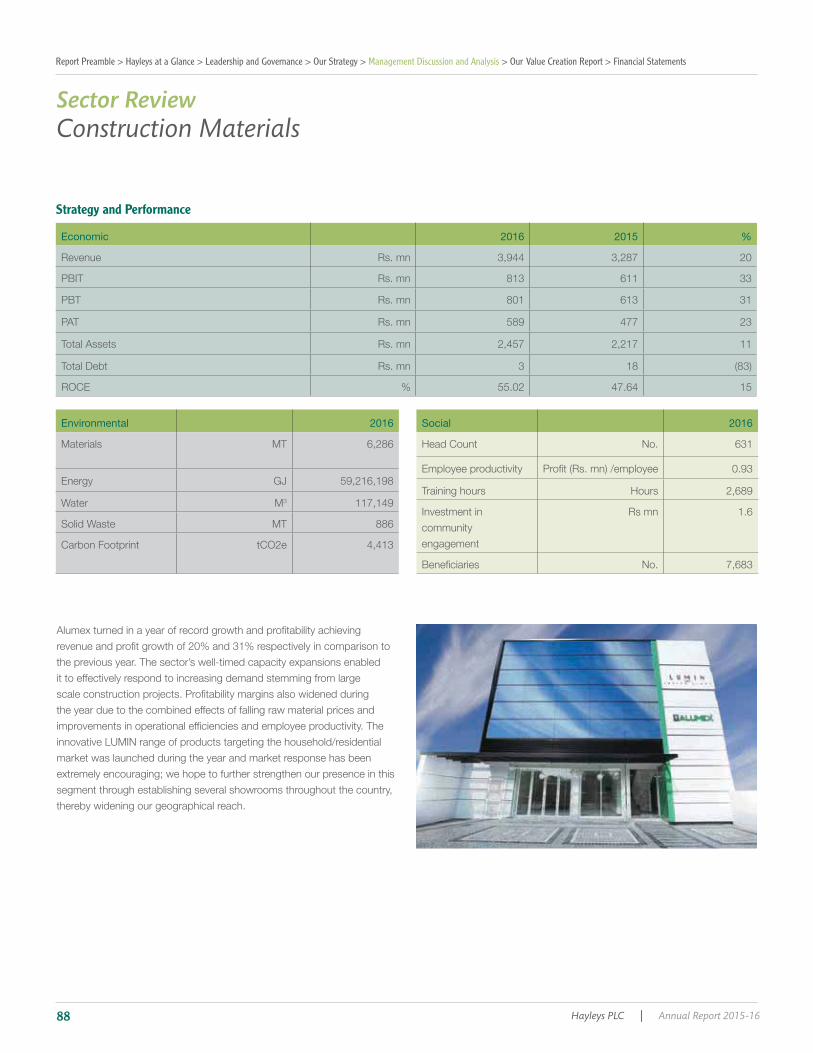
Construction Materials
Strategy and Performance
Economic 2016 2015 %
813 33
31
11
3 18
Environmental 2016
3
Social 2016
Hours
Sector Review
Report Preamble > Hayleys at a Glance > Leadership and Governance > Our Strategy > Management Discussion and Analysis > Our Value Creation Report > Financial Statements
Hayleys PLC | Annual Report 2015-1688

Way Forward
0
100
200
300
400
500
2014 2015 2016Headcount Productivity
Number
0.5
1.0
1.5
2.0
Profit/Employee
0
1,000
2,000
3,000
4,000
5,000
Carbon Footprint
tCO2e
2014 2015 2016
0
500
1,000
1,500
2,000
2,500
3,000
3,500
4,000
2014 2015 2016Revenue Assets ROCE (%)
Rs. mn.
30
40
50
60
%
Annual Report 2015-16 | Hayleys PLC 89
The World Of Hayleys A World of Care

10% 1% 10% 58% 12%Revenue PBT Assets Employees Carbon Footprint
Clusters in Sector Operations Highlights
Contribution to Sector Revenue
Contribution to Sector PBT
PlantationsSector Review
Report Preamble > Hayleys at a Glance > Leadership and Governance > Our Strategy > Management Discussion and Analysis > Our Value Creation Report > Financial Statements
Hayleys PLC | Annual Report 2015-1690
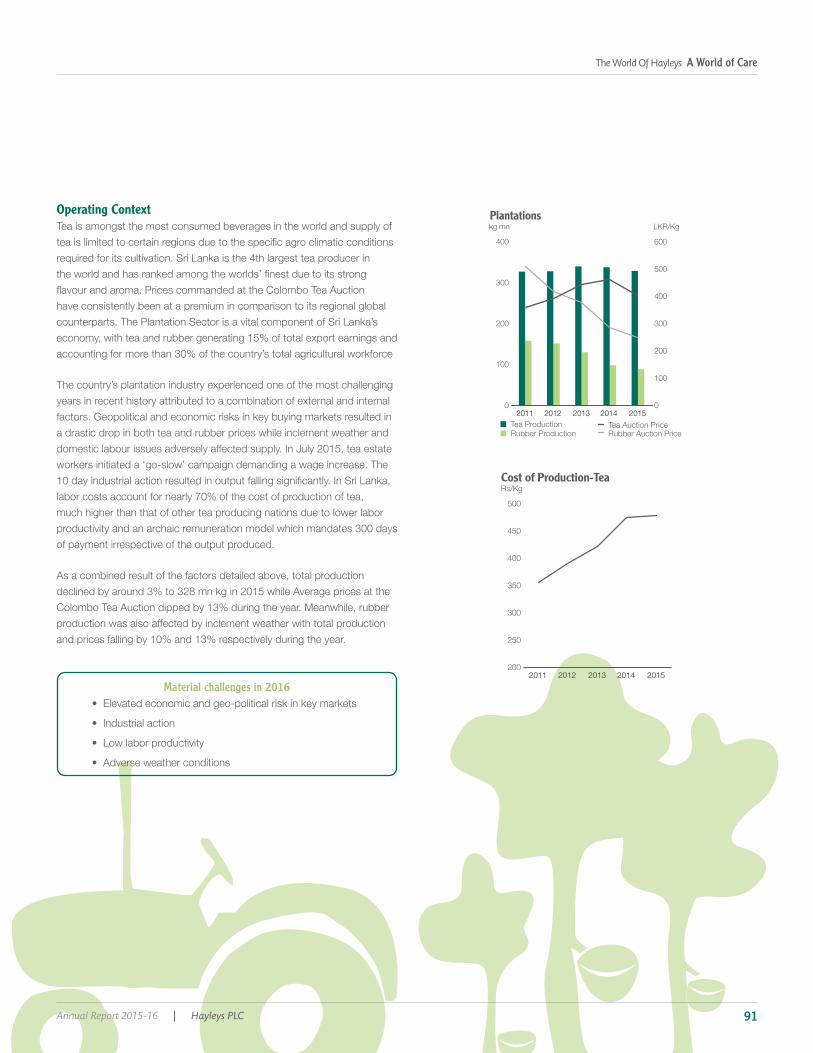
Operating Context
Material challenges in 2016•
•
•
•
0
100
200
300
400
Tea ProductionRubber Production
kg mn
2011 2012 2013 2014 20150
100
200
300
400
500
600
Tea Auction PriceRubber Auction Price
LKR/KgPlantations
Rs/Kg
2011 2012 2013 2014 2015200
250
300
350
400
450
500
Cost of Production-Tea
Annual Report 2015-16 | Hayleys PLC 91
The World Of Hayleys A World of Care

Plantations
Strategy and Performance
Economic 2016 2015 %
Environmental 2016
KG
KG
3
Social 2016
Hours
Sector Review
Report Preamble > Hayleys at a Glance > Leadership and Governance > Our Strategy > Management Discussion and Analysis > Our Value Creation Report > Financial Statements
Hayleys PLC | Annual Report 2015-1692
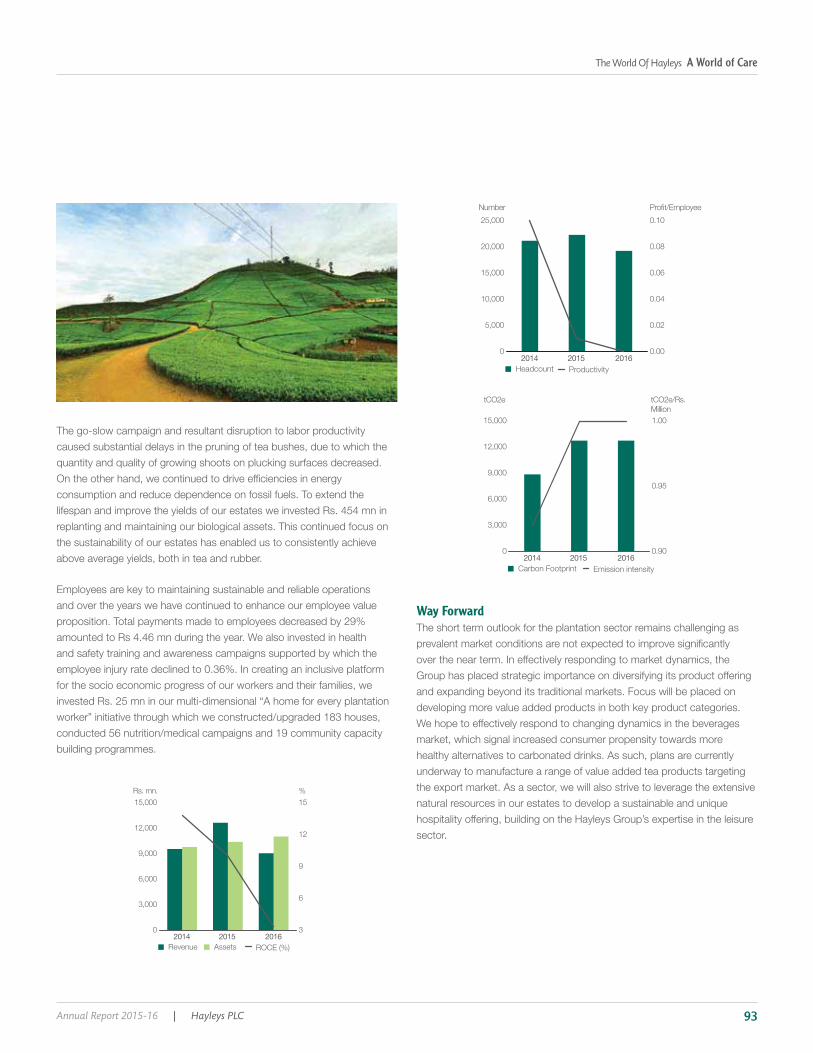
Way Forward
0
3,000
6,000
9,000
12,000
15,000
2014 2015 2016Revenue Assets ROCE (%)
Rs. mn.
3
6
9
12
15
%
0
3,000
6,000
9,000
12,000
15,000
2014 2015 2016Carbon Footprint Emission intensity
tCO2e
0.90
0.95
1.00
tCO2e/Rs. Million
0
5,000
10,000
15,000
20,000
25,000
2014 2015 2016Headcount Productivity
Number
0.00
0.02
0.04
0.06
0.08
0.10
Profit/Employee
Annual Report 2015-16 | Hayleys PLC 93
The World Of Hayleys A World of Care
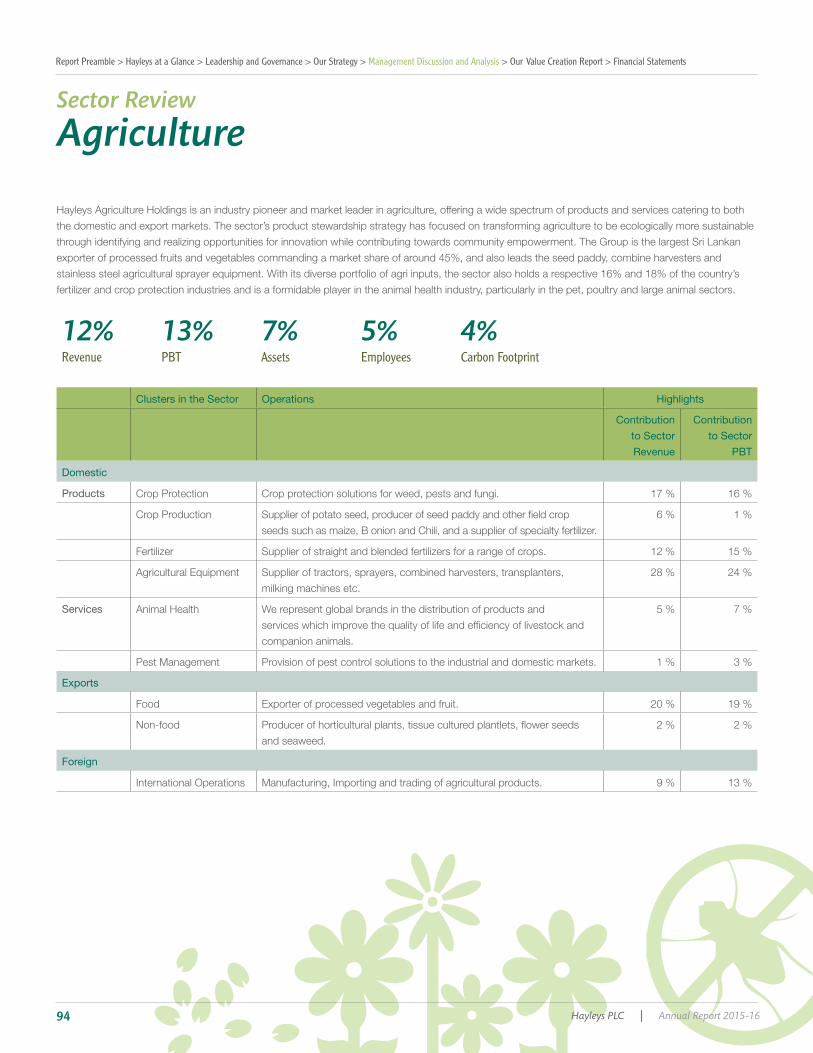
Agriculture
12% 13% 7% 5% 4%Revenue PBT Assets Employees Carbon Footprint
Clusters in the Sector Operations Highlights
Contribution to Sector Revenue
Contribution to Sector
PBT
Domestic
Products
Services Animal Health
Exports
Foreign
Sector Review
Report Preamble > Hayleys at a Glance > Leadership and Governance > Our Strategy > Management Discussion and Analysis > Our Value Creation Report > Financial Statements
Hayleys PLC | Annual Report 2015-1694

Operating Context
Material challenges in 2016
10,000
10,500
11,000
11,500
Agriculture exports Total exports
USD mn
2013 2014 20152,250
2,500
2,750
3,000
Agricultural Exports
Agriculture Growth
-15
-10
-5
0
5
10
15
20
25
30
Vegetables
Growth rate (%)
Rice
Fruits
Anim
al Production
Coconut
Forestry and Logging
Spices
Cereals
Marine Fishing
Tea
Rubber
Fresh Water Fishing
Annual Report 2015-16 | Hayleys PLC 95
The World Of Hayleys A World of Care

Agriculture
Strategy and Performance
Economic 2016 2015 %
31
33
Environmental 2016
3
3,111
Social 2016
Hours
Sector Review
Report Preamble > Hayleys at a Glance > Leadership and Governance > Our Strategy > Management Discussion and Analysis > Our Value Creation Report > Financial Statements
Hayleys PLC | Annual Report 2015-1696
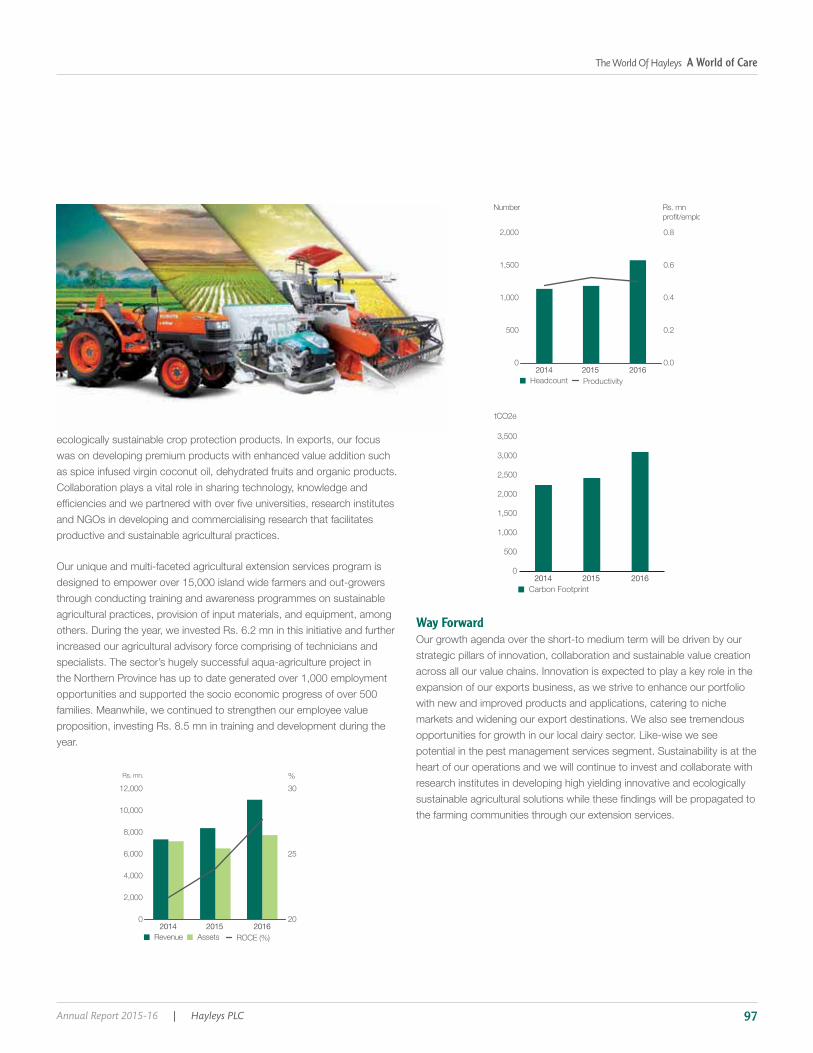
Way Forward
0
2,000
4,000
6,000
8,000
10,000
12,000
2014 2015 2016Revenue Assets ROCE (%)
Rs. mn.
20
25
30
%
0
500
1,000
1,500
2,000
2014 2015 2016Headcount Productivity
Number
0.0
0.2
0.4
0.6
0.8
Rs. mn profit/emplo
0
500
1,000
1,500
2,000
2,500
3,000
3,500
Carbon Footprint
tCO2e
2014 2015 2016
Annual Report 2015-16 | Hayleys PLC 97
The World Of Hayleys A World of Care
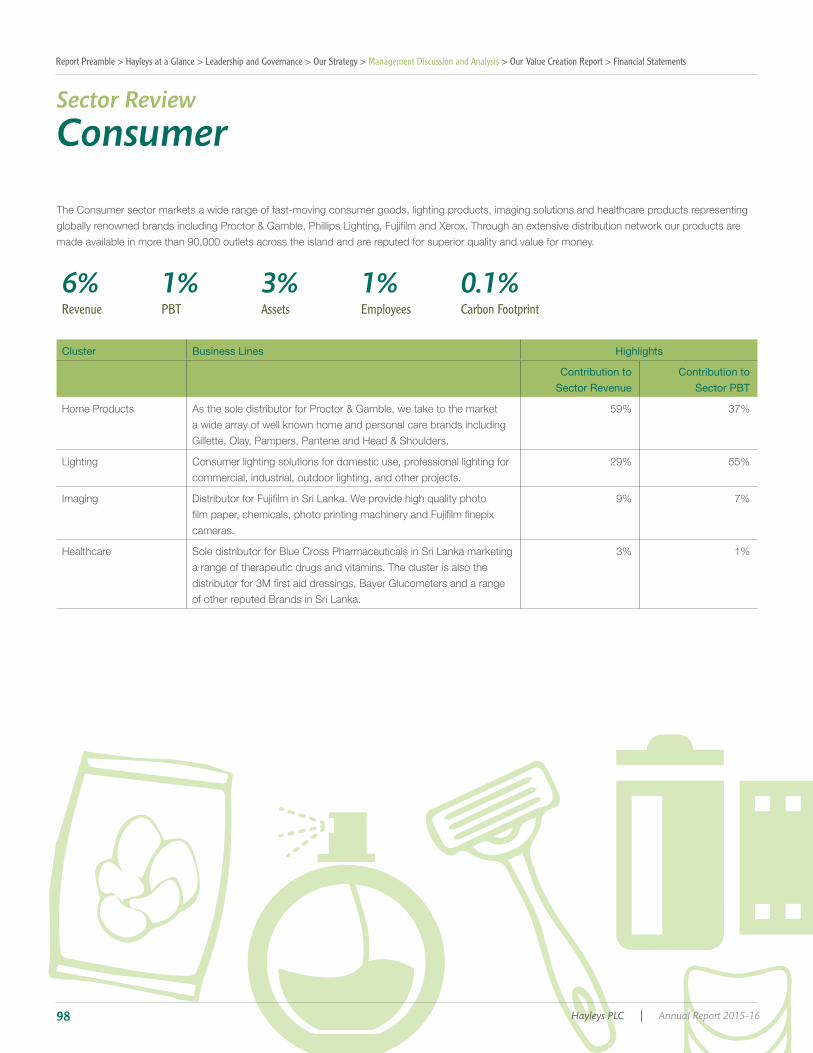
Consumer
6% 1% 3% 1% 0.1%Revenue PBT Assets Employees Carbon Footprint
Cluster Business Lines Highlights
Contribution to Sector Revenue
Contribution to Sector PBT
Sector Review
Report Preamble > Hayleys at a Glance > Leadership and Governance > Our Strategy > Management Discussion and Analysis > Our Value Creation Report > Financial Statements
Hayleys PLC | Annual Report 2015-1698

“ As a key strategic
initiative during the
year, we focussed
on strengthening
the market presence
of the Group’s own
products.
”
Operating Context
Material challenges in 2016•
•
0
1,000
2,000
3,000
4,000
5,000
6,000
7,000
8,000
Consumption expenditure
Rs. mn
2011 2012 2013 2014 2015
Consumption expenditure
Annual Report 2015-16 | Hayleys PLC 99
The World Of Hayleys A World of Care
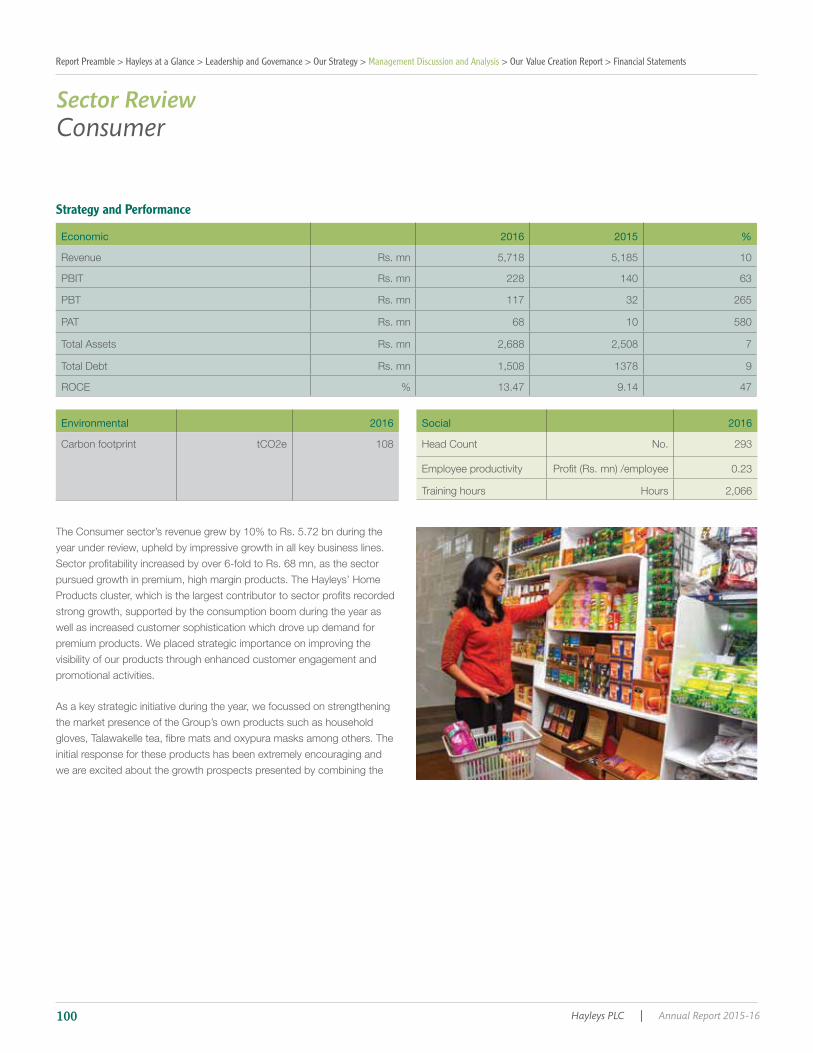
Consumer
Strategy and Performance
Economic 2016 2015 %
Environmental 2016 Social 2016
Hours
Sector Review
Report Preamble > Hayleys at a Glance > Leadership and Governance > Our Strategy > Management Discussion and Analysis > Our Value Creation Report > Financial Statements
Hayleys PLC | Annual Report 2015-16100

Way Forward
0
50
100
150
200
250
300
2014 2015 2016Headcount Productivity
Number
0.00
0.05
0.10
0.15
0.20
0.25Profit/Employee
0
50
100
150
200
250
300
Carbon Footprint
tCO2e
2014 2015 2016
0
1,000
2,000
3,000
4,000
5,000
6,000
2014 2015 2016Revenue Assets ROCE (%)
Rs. mn.
9
12
15
%
Annual Report 2015-16 | Hayleys PLC 101
The World Of Hayleys A World of Care
Leisure
5% 8% 8% 5% 15%Revenue PBT Assets Employees Carbon Footprint
Clusters in Sector Operations Highlights
Contribution to Sector Revenue
Contribution to Sector PBT
Sector Review
Report Preamble > Hayleys at a Glance > Leadership and Governance > Our Strategy > Management Discussion and Analysis > Our Value Creation Report > Financial Statements
Hayleys PLC | Annual Report 2015-16102

“ The last few years
have also seen a
gradual shift in the
country’s source
markets with China and
India emerging as top
contributors.
”
Operating Context
Material challenges in 2016•
0
500,000
1,000,000
1,500,000
2,000,000
Tourist Arrivals
No.
2011 2012 2013 2014 201570
71
72
73
74
75
76
77
78
79
80
%
Occupancy rate (Graded Units)
Sri Lanka Tourism
Annual Report 2015-16 | Hayleys PLC 103
The World Of Hayleys A World of Care
Leisure
Strategy and Performance
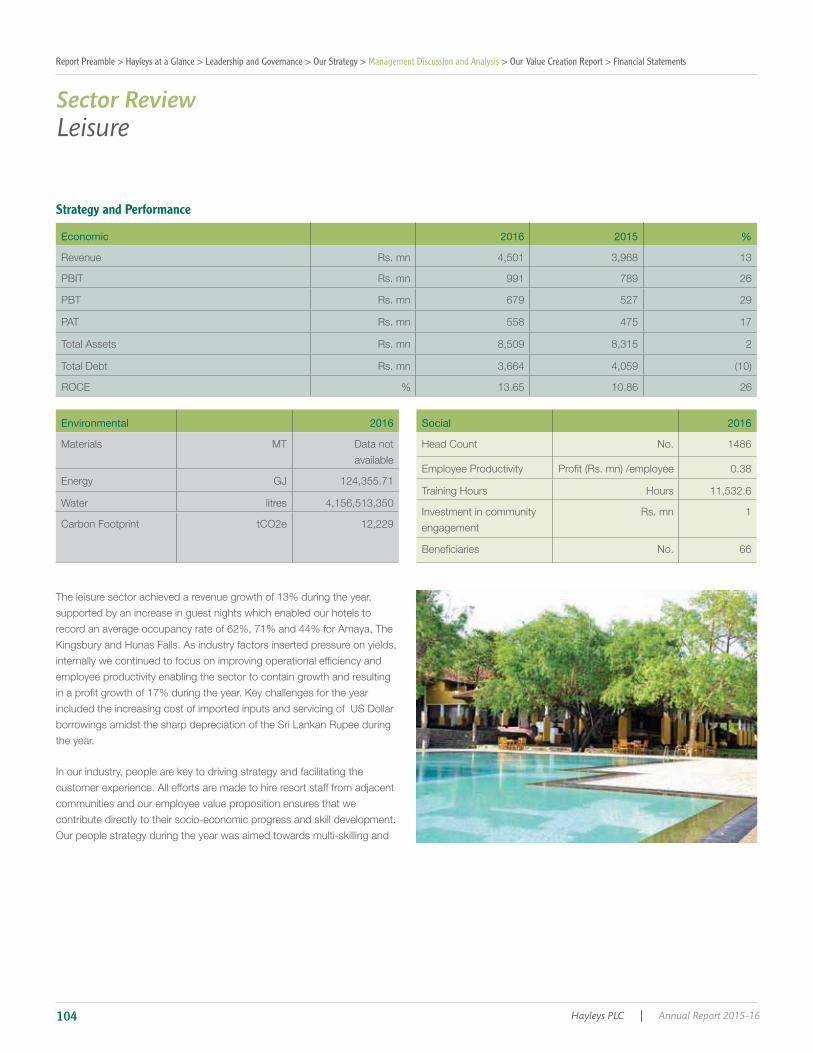
Economic 2016 2015 %
13
Environmental 2016
litres
Social 2016
Hours
1
Sector Review
Report Preamble > Hayleys at a Glance > Leadership and Governance > Our Strategy > Management Discussion and Analysis > Our Value Creation Report > Financial Statements
Hayleys PLC | Annual Report 2015-16104

Way Forward
0
2,000
4,000
6,000
8,000
10,000
2014 2015 2016Revenue Assets ROCE (%)
Rs. mn.
0
10
20%
0
300
600
900
1,200
1,500
2014 2015 2016Head count Productivity
Number
0.30
0.35
0.40
Profit/Employee
0
3,000
6,000
9,000
12,000
15,000
Carbon Footprint
tCO2e
2014 2015 2016
Annual Report 2015-16 | Hayleys PLC 105
The World Of Hayleys A World of Care
4% 13% 5% 1% 0.1%Revenue PBT Assets Employees Carbon Footprint
Clusters in Sector Operations Highlights
Contribution to Sector Revenue
Contribution to Sector PBT
Solar
Solutions
Solutions
“ Our team consists of
273 employees who are
a driving factor behind
our success.
”
Industry Inputs and Power & Energy Sector Review
Report Preamble > Hayleys at a Glance > Leadership and Governance > Our Strategy > Management Discussion and Analysis > Our Value Creation Report > Financial Statements
Hayleys PLC | Annual Report 2015-16106

Operating Context
Material challenges in 2016
0
300
600
900
1,200
1,500
NCRE % contribution to power mix
GwH
2012 2013 2014 20156
8
10
12
%Contribution to power mix
Hydro Thermal- Fuel
Rs. mn
34%
17%
11%38%
Contribution
Thermal-Coal
NCRE
Annual Report 2015-16 | Hayleys PLC 107
The World Of Hayleys A World of Care
Industry Inputs and Power & Energy
Strategy and Performance
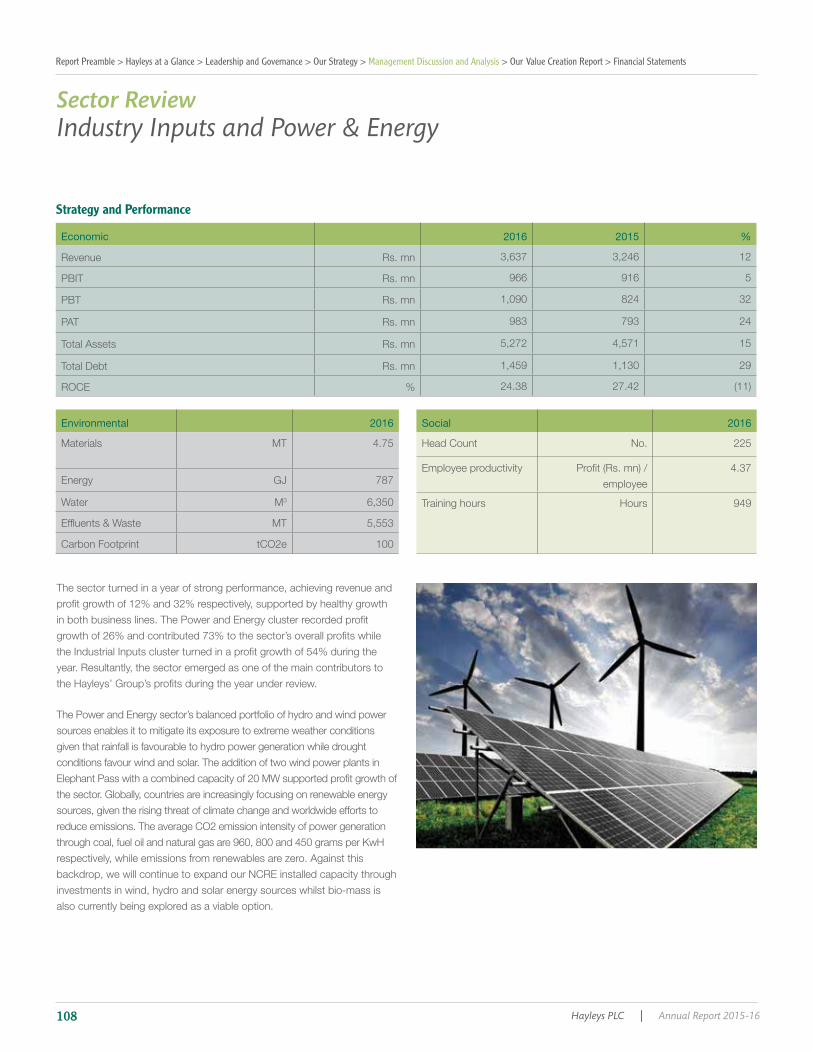
Economic 2016 2015 %
Environmental 2016
3
Social 2016
employee
Hours
Sector Review
Report Preamble > Hayleys at a Glance > Leadership and Governance > Our Strategy > Management Discussion and Analysis > Our Value Creation Report > Financial Statements
Hayleys PLC | Annual Report 2015-16108

Way Forward
0
500
1,000
1,500
2,000
2,500
3,000
2014 2015 2016Head count Productivity
Number
0.3
0.4
0.5
Profit/Employee
0
2,000
4,000
6,000
8,000
10,000
Carbon Footprint
tCO2e
2014 2015 2016
0
5,000
10,000
15,000
20,000
2014 2015 2016Revenue Assets ROCE (%)
Rs. mn.
0
25
%
Annual Report 2015-16 | Hayleys PLC 109
The World Of Hayleys A World of Care
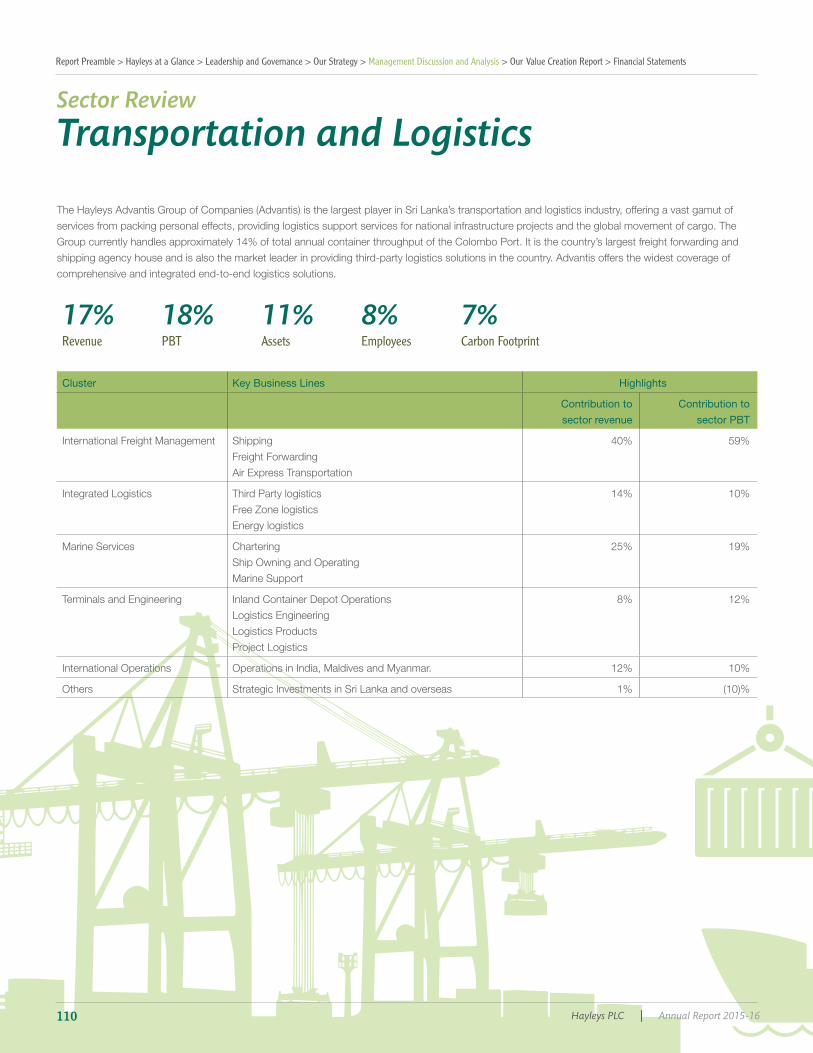
Transportation and LogisticsSector Review
Report Preamble > Hayleys at a Glance > Leadership and Governance > Our Strategy > Management Discussion and Analysis > Our Value Creation Report > Financial Statements
17% 18% 11% 8% 7%Revenue PBT Assets Employees Carbon Footprint
Cluster Key Business Lines Highlights
Contribution to sector revenue
Contribution to sector PBT
Others
Hayleys PLC | Annual Report 2015-16110
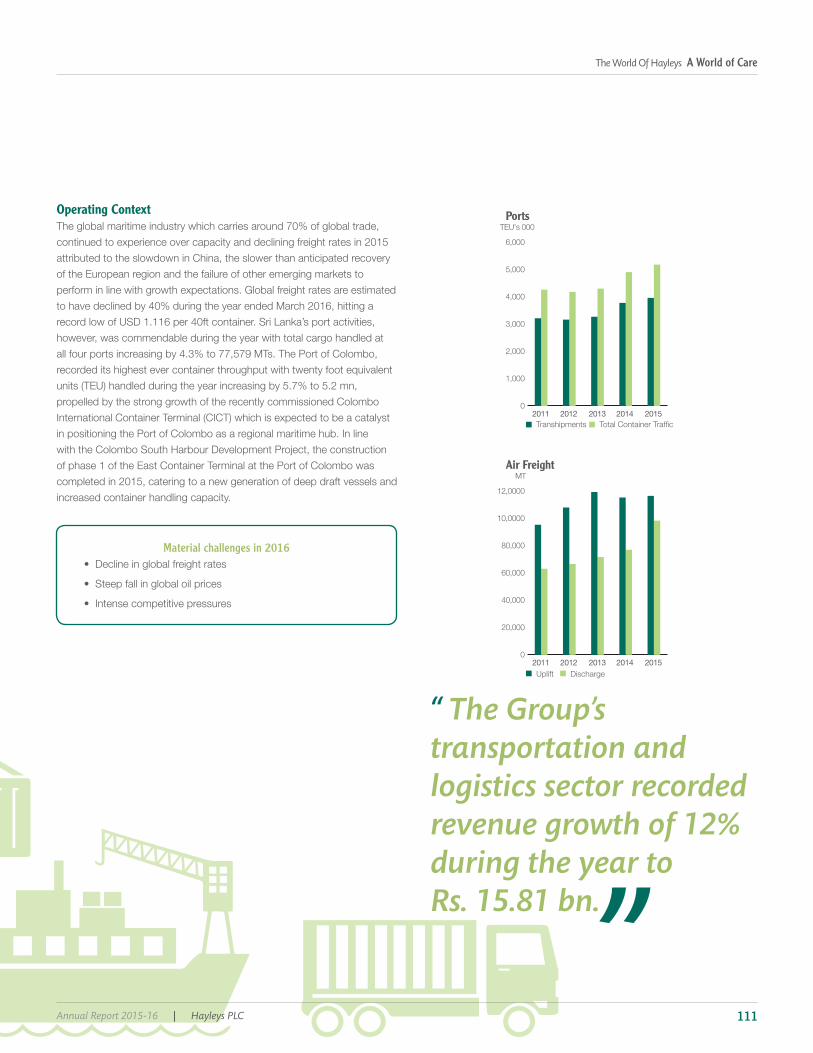
Operating Context
Material challenges in 2016
0
20,000
40,000
60,000
80,000
10,0000
12,0000
Uplift Discharge
MT
2011 2012 2013 2014 2015
Air Freight
0
1,000
2,000
3,000
4,000
5,000
6,000
Transhipments Total Container Traffic
TEU's 000
2011 2012 2013 2014 2015
Ports
“ The Group’s
transportation and
logistics sector recorded
revenue growth of 12%
during the year to
Rs. 15.81 bn.
”Annual Report 2015-16 | Hayleys PLC 111
The World Of Hayleys A World of Care

The Group’s transportation and logistics sector recorded revenue growth
Hayleys Group. Performance was upheld by increasing contributions
from the sector’s international operations and the Integrated Logistics
the specialised free-zone warehousing facility in Katunayake, turned in a
year of strong performance with 100% capacity utilisation. The success of
the facility can be attributed to the state of the art warehousing services
third party logistics.
prolonged decline in global freight rates which continued to insert pressure
the backdrop of increased domestic and trans-shipment volumes at
the Colombo Port while marine support arm continued to be adversely
intensive, and during the year we engaged in several initiatives to improve
Transportation and Logistics
Strategy and Performance
Economic 2016 2015 %
Revenue Rs. mn 15,812 14,181 12
PBIT Rs. mn 1,578 1,347 17
PBT Rs. mn 1,545 1,333 16
PAT Rs. mn 1,106 988 12
Total Assets Rs. mn 11,225 8,844 27
Total Debt Rs. mn 3,569 1,848 93
ROCE % 20.76 23.48 (12)
Environmental 2016
Energy GJ 72,287
Water 3 80,000
Carbon Footprint tCO2e 6168
Social 2016
Head Count No. 2,714
Employee Productivity 0.41
Training Hours Hours 670
Rs. mn 11.83
No. over 4,000
Sector Review
Report Preamble > Hayleys at a Glance > Leadership and Governance > Our Strategy > Management Discussion and Analysis > Our Value Creation Report > Financial Statements
Hayleys PLC | Annual Report 2015-16112
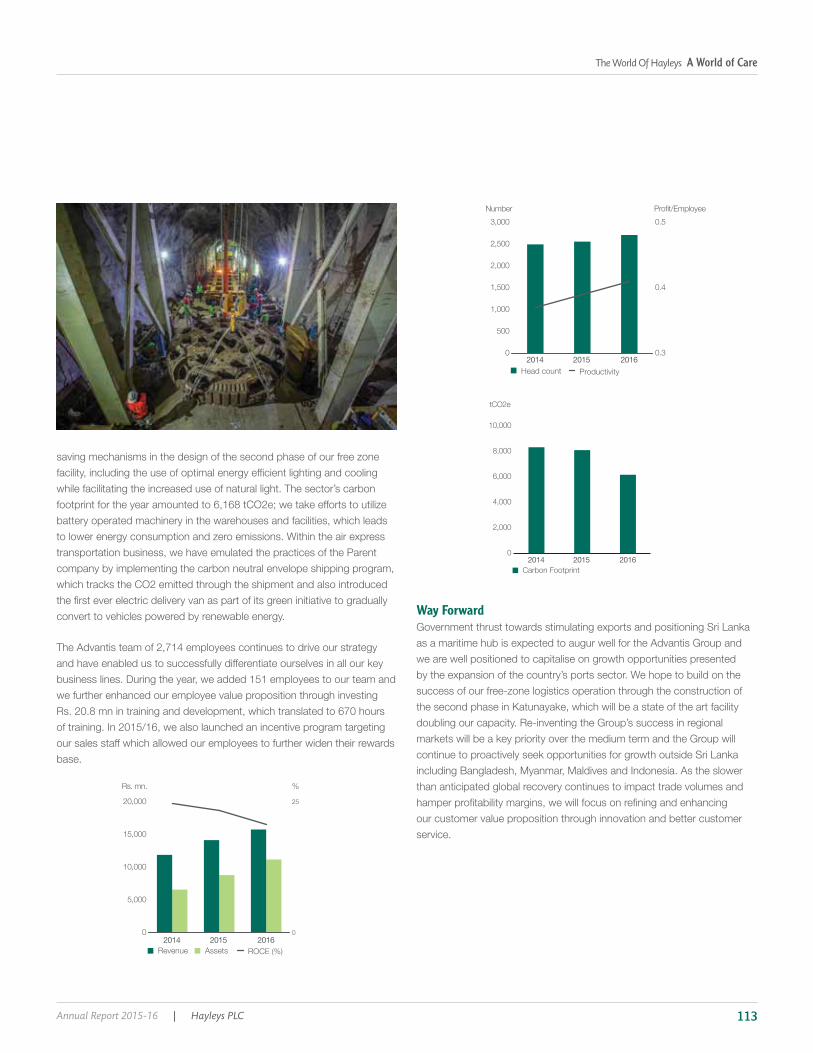
Way Forward
we are well positioned to capitalise on growth opportunities presented
success of our free-zone logistics operation through the construction of
the second phase in Katunayake, which will be a state of the art facility
doubling our capacity. Re-inventing the Group’s success in regional
markets will be a key priority over the medium term and the Group will
than anticipated global recovery continues to impact trade volumes and
our customer value proposition through innovation and better customer
service.
saving mechanisms in the design of the second phase of our free zone
while facilitating the increased use of natural light. The sector’s carbon
battery operated machinery in the warehouses and facilities, which leads
transportation business, we have emulated the practices of the Parent
company by implementing the carbon neutral envelope shipping program,
which tracks the CO2 emitted through the shipment and also introduced
convert to vehicles powered by renewable energy.
The Advantis team of 2,714 employees continues to drive our strategy
business lines. During the year, we added 151 employees to our team and
we further enhanced our employee value proposition through investing
Rs. 20.8 mn in training and development, which translated to 670 hours
base.
0
500
1,000
1,500
2,000
2,500
3,000
2014 2015 2016Head count Productivity
Number
0.3
0.4
0.5
Profit/Employee
0
2,000
4,000
6,000
8,000
10,000
Carbon Footprint
tCO2e
2014 2015 2016
0
5,000
10,000
15,000
20,000
2014 2015 2016Revenue Assets ROCE (%)
Rs. mn.
0
25
%
Annual Report 2015-16 | Hayleys PLC 113
The World Of Hayleys A World of Care

Others
2% 13% 22% 3% 0.1%Revenue PBT Assets Employees Carbon Footprint
Clusters in Sector Operations Highlights
Contribution to Sector Revenue
Contribution to Sector PBT
systems
Sector Review
Report Preamble > Hayleys at a Glance > Leadership and Governance > Our Strategy > Management Discussion and Analysis > Our Value Creation Report > Financial Statements
Hayleys PLC | Annual Report 2015-16114

Operating Context “ The latest addition
to the Hayleys
Group’s growing
business interests,
Fentons Limited,
was acquired by the
Group in March 2016
at a total investment
of Rs 250 mn.
”
Annual Report 2015-16 | Hayleys PLC 115
The World Of Hayleys A World of Care
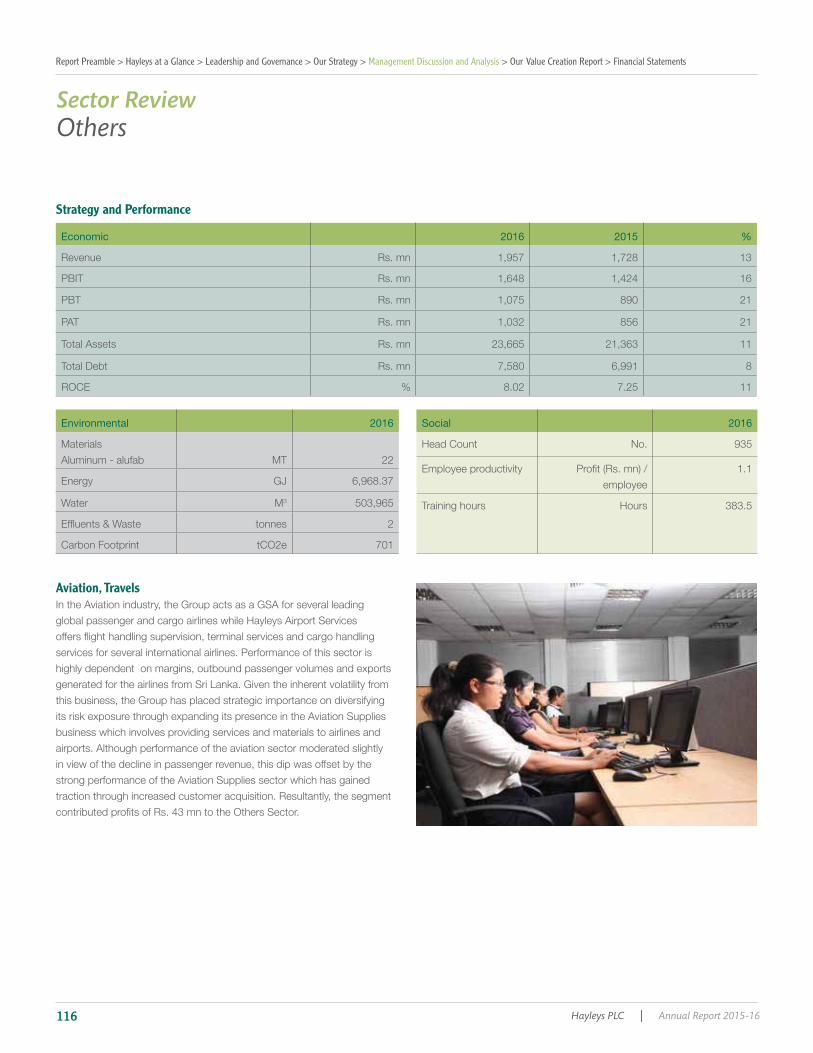
Aviation, Travels
Others
Strategy and Performance
Economic 2016 2015 %
13
11
8
11
Environmental 2016
3
tonnes
Social 2016
employee
Hours
Sector Review
Report Preamble > Hayleys at a Glance > Leadership and Governance > Our Strategy > Management Discussion and Analysis > Our Value Creation Report > Financial Statements
Hayleys PLC | Annual Report 2015-16116
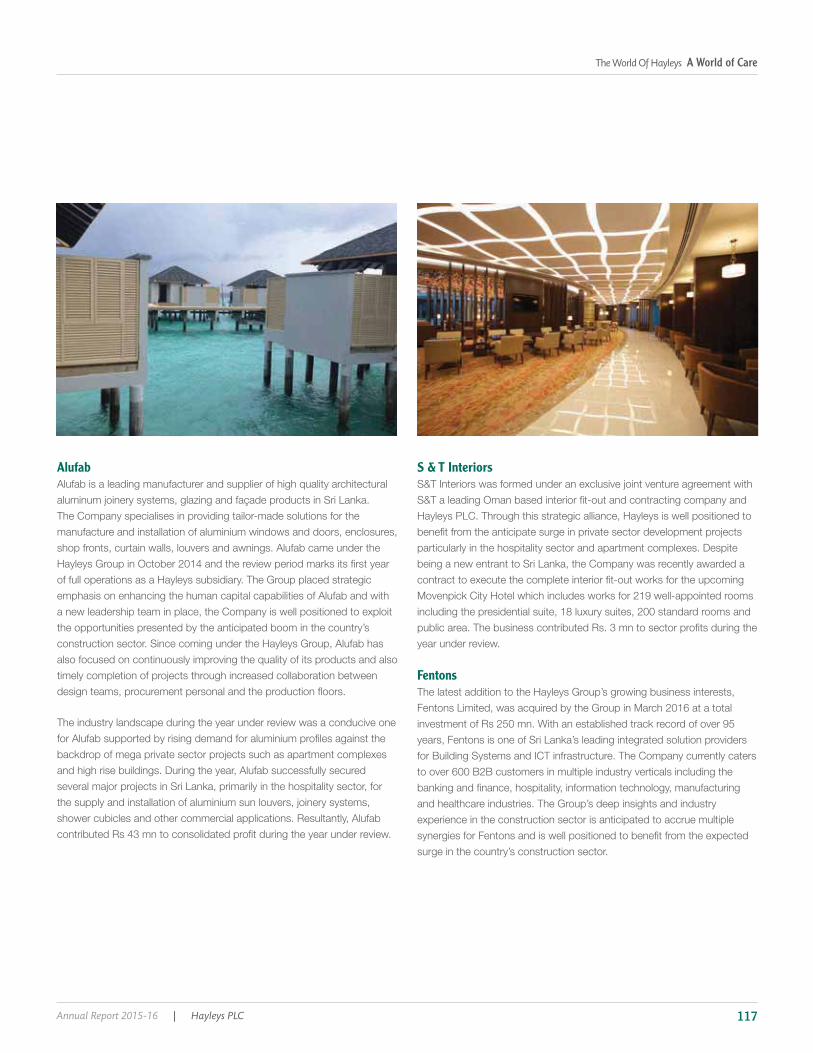
Alufab S & T Interiors
Fentons
Annual Report 2015-16 | Hayleys PLC 117
The World Of Hayleys A World of Care

Our Value Creation Report
Financial Capital
Overview
Our Financial Capital
6.5%
16.4 %
8.3%
10.7%
6.0%
Profit for the year
Earnings per share
Dividend per share
Total Assets
Shareholders’ Funds
0
20,000
40,000
60,000
80,000
10,0000
12,0000
2015 2016Assets
Rs. MnAssets
0
20,000
40,000
60,000
80,000
10,0000
2015 2016Revenue
Rs. MnRevenue
0
1,000
2,000
3,000
4,000
5,000
6,000
2015 2016Profit for the year
Rs. MnProfit for the year
Report Preamble > Hayleys at a Glance > Leadership and Governance > Our Strategy > Management Discussion and Analysis > Our Value Creation Report > Financial Statements
Hayleys PLC | Annual Report 2015-16118
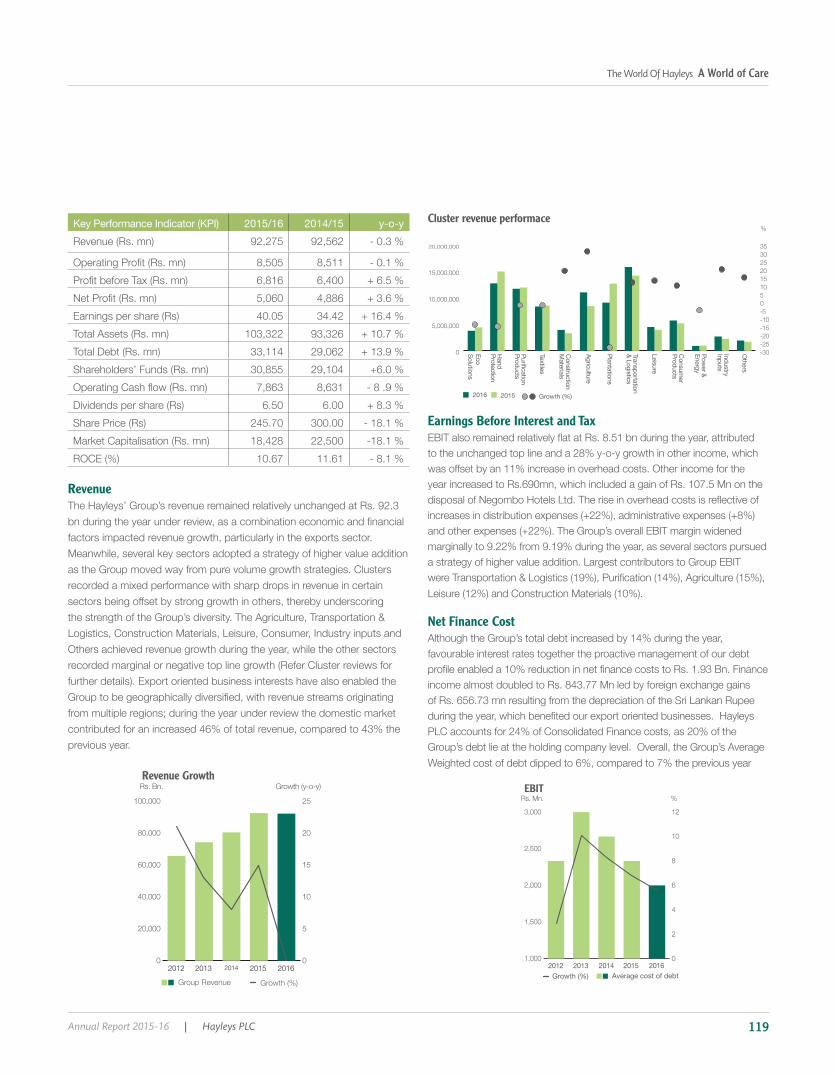
Key Performance Indicator (KPI) 2015/16 2014/15 y-o-yRevenue (Rs. mn) 92,275 92,562 - 0.3 %
Operating Profit (Rs. mn) 8,505 8,511 - 0.1 %Profit before Tax (Rs. mn) 6,816 6,400 + 6.5 %Net Profit (Rs. mn) 5,060 4,886 + 3.6 %Earnings per share (Rs) 40.05 34.42 + 16.4 %Total Assets (Rs. mn) 103,322 93,326 + 10.7 %Total Debt (Rs. mn) 33,114 29,062 + 13.9 %Shareholders’ Funds (Rs. mn) 30,855 29,104 +6.0 %Operating Cash flow (Rs. mn) 7,863 8,631 - 8 .9 %Dividends per share (Rs) 6.50 6.00 + 8.3 %Share Price (Rs) 245.70 300.00 - 18.1 %Market Capitalisation (Rs. mn) 18,428 22,500 -18.1 %ROCE (%) 10.67 11.61 - 8.1 %
RevenueThe Hayleys’ Group’s revenue remained relatively unchanged at Rs. 92.3 bn during the year under review, as a combination economic and financial factors impacted revenue growth, particularly in the exports sector. Meanwhile, several key sectors adopted a strategy of higher value addition as the Group moved way from pure volume growth strategies. Clusters recorded a mixed performance with sharp drops in revenue in certain sectors being offset by strong growth in others, thereby underscoring the strength of the Group’s diversity. The Agriculture, Transportation & Logistics, Construction Materials, Leisure, Consumer, Industry inputs and Others achieved revenue growth during the year, while the other sectors recorded marginal or negative top line growth (Refer Cluster reviews for further details). Export oriented business interests have also enabled the Group to be geographically diversified, with revenue streams originating from multiple regions; during the year under review the domestic market contributed for an increased 46% of total revenue, compared to 43% the previous year.
Earnings Before Interest and TaxEBIT also remained relatively flat at Rs. 8.51 bn during the year, attributed to the unchanged top line and a 28% y-o-y growth in other income, which was offset by an 11% increase in overhead costs. Other income for the year increased to Rs.690mn, which included a gain of Rs. 107.5 Mn on the disposal of Negombo Hotels Ltd. The rise in overhead costs is reflective of increases in distribution expenses (+22%), administrative expenses (+8%) and other expenses (+22%). The Group’s overall EBIT margin widened marginally to 9.22% from 9.19% during the year, as several sectors pursued a strategy of higher value addition. Largest contributors to Group EBIT were Transportation & Logistics (19%), Purification (14%), Agriculture (15%), Leisure (12%) and Construction Materials (10%).
Net Finance CostAlthough the Group’s total debt increased by 14% during the year, favourable interest rates together the proactive management of our debt profile enabled a 10% reduction in net finance costs to Rs. 1.93 Bn. Finance income almost doubled to Rs. 843.77 Mn led by foreign exchange gains of Rs. 656.73 mn resulting from the depreciation of the Sri Lankan Rupee during the year, which benefited our export oriented businesses. Hayleys PLC accounts for 24% of Consolidated Finance costs, as 20% of the Group’s debt lie at the holding company level. Overall, the Group’s Average Weighted cost of debt dipped to 6%, compared to 7% the previous year
Cluster revenue performace
0
5,000,000
10,000,000
15,000,000
20,000,000
2016 2015
Eco Solutions
Hand Protection
Purification Products
Construction M
aterials
Transportation & Logistics
Agriculture
Plantations
Leisure
Others
Power &
Energy
IndustryInputs
Consumer
Products
Textiles
-30-25-20-15-10-505101520253035
Growth (%)
%
0
2
4
6
8
10
12
2012 2013 2014 2015 2016Average cost of debt
Rs. Mn. %
1,000
1,500
2,000
2,500
3,000
EBIT
Growth (%)
0
20,000
40,000
60,000
80,000
100,000
Group Revenue Growth (%)
Rs. Bn.
2012 2013 2014 2015 20160
5
10
15
20
25
Growth (y-o-y)Revenue Growth
Annual Report 2015-16 | Hayleys PLC 119
The World Of Hayleys A World of Care
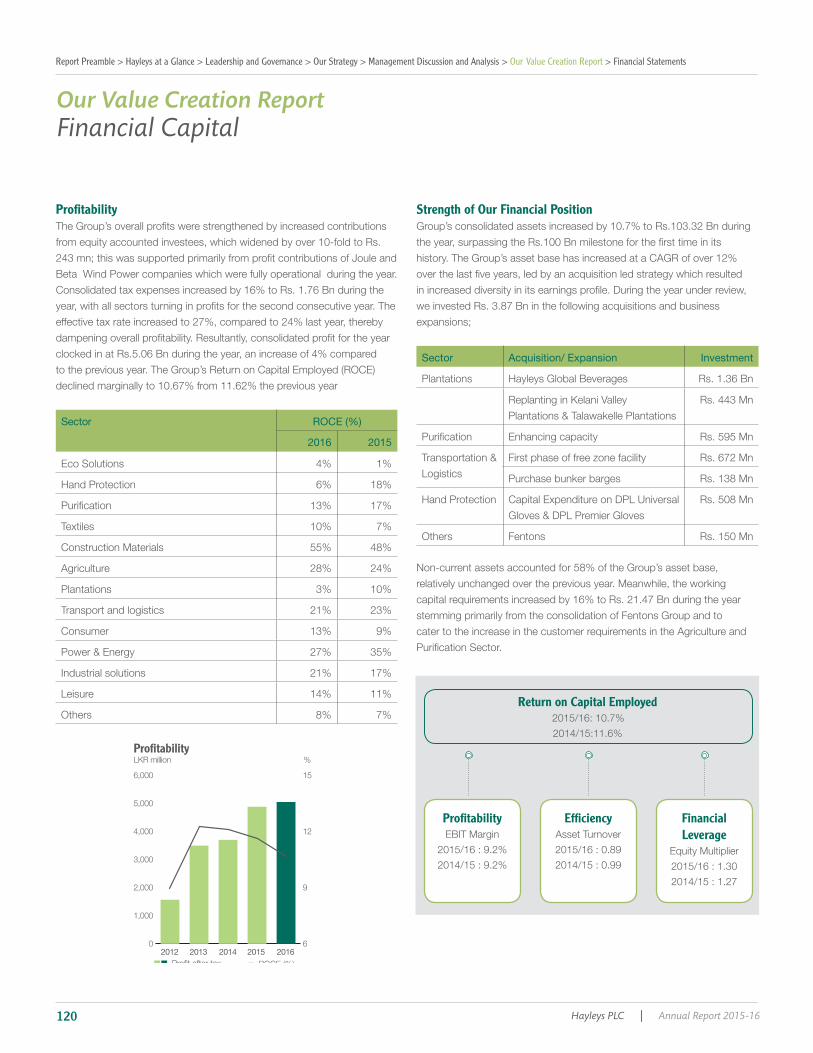
Profitability
Sector ROCE (%)
2016 2015
Leisure
Others
Strength of Our Financial Position
Sector Acquisition/ Expansion Investment
Others
Our Value Creation ReportFinancial Capital
Return on Capital Employed
Profitability Efficiency FinancialLeverage
0
1,000
2,000
3,000
4,000
5,000
6,000
Profit after tax
LKR million
2012 2013 2014 2015 2016
Profitability
6
9
12
15
%
ROCE (%)
Report Preamble > Hayleys at a Glance > Leadership and Governance > Our Strategy > Management Discussion and Analysis > Our Value Creation Report > Financial Statements
Hayleys PLC | Annual Report 2015-16120

Capital Structure
Cash Flow
Shareholder Returns
Rs. 2016 2015
Net Assets per share
Fibre Hand Protection Purification Products Textiles Construction Materials AgriculturePlantations Transportation & Logistics
Consumer Products Power and EnergyLeisure Others
4%
23%
5%7%
10%
7%
0%11%
5%11%
Sector-wise breakdown of borrowings
8%
9%
Shareholders funds Long term borrowingsShort term borrowings
15%
26% 59%
Group funding profile
0
20
40
60
80
100
120
Non-current assets
Current assets
Rs bn
2012 2013 2014 2015 2016
Total Assets Composition
Annual Report 2015-16 | Hayleys PLC 121
The World Of Hayleys A World of Care
Our Value Creation Report
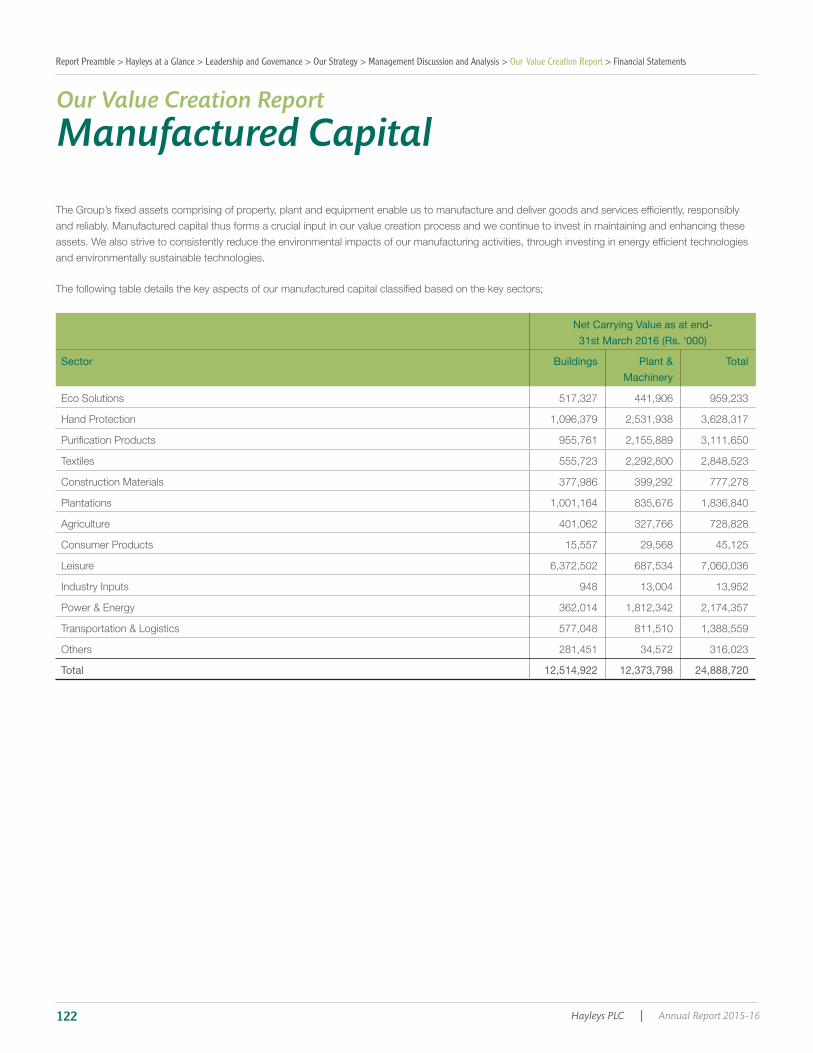
Manufactured Capital
Net Carrying Value as at end- 31st March 2016 (Rs. ‘000)
Sector Buildings Plant & Machinery
Total
Leisure
Others
Total
Report Preamble > Hayleys at a Glance > Leadership and Governance > Our Strategy > Management Discussion and Analysis > Our Value Creation Report > Financial Statements
Hayleys PLC | Annual Report 2015-16122

Our Value Creation Report
Social and Relationship Capital
Overview
Our Customers and Network
Innovation
Sector Innovation
Product and Service Responsibility
Customer Satisfaction and Service Quality
Suppliers and Business Partners
Customers
Quality
Annual Report 2015-16 | Hayleys PLC 123
The World Of Hayleys A World of Care

Engagement
Supplier Development and Sustainability
Sector Initiative
Our Network
Operators
Suppliers
Our Value Creation ReportSocial and Relationship Capital
Report Preamble > Hayleys at a Glance > Leadership and Governance > Our Strategy > Management Discussion and Analysis > Our Value Creation Report > Financial Statements
Hayleys PLC | Annual Report 2015-16124
Community Engagement
Health and SanitationPuritas Sath Diyawara
Winner of Asia Responsible
Entrepreneurship Awards- 2015
Health and Sanitation Developing livelihoods Improving living conditions
Others
Quality of Life
Winner of Asia Responsible
Entrepreneurship Awards- 2015
Annual Report 2015-16 | Hayleys PLC 125
The World Of Hayleys A World of Care

plants
Awareness sessions
Treatment plant and water distribution
Knowledge Dissemination
Livelihood Development
Promoting Healthand Sanitation
Company Village District No. of People Investment Completion
1
Balayawewa
3 Kiriketuwewa Sinhala
Ataweerawewa
Billewa
8 Ananthapuram
Nelumwewa
Neriyakulam
11
Our Value Creation ReportSocial and Relationship Capital
Report Preamble > Hayleys at a Glance > Leadership and Governance > Our Strategy > Management Discussion and Analysis > Our Value Creation Report > Financial Statements
Hayleys PLC | Annual Report 2015-16126

‘Going Beyond…
Health Camps and Awareness Programs
Developing Livelihoods
Firstlight by Dipped Products
Project Description:
• Fair Price for Field Latex:
• Technical support and Education:
• Provision of Input Material:
• Community Capacity Building:
Investment and Results:
Seaweed Project by Hayleys Agriculture
Project description:
•
Annual Report 2015-16 | Hayleys PLC 127
The World Of Hayleys A World of Care

•
•
Investment and Results:
Socio Economic Development in the Northern Province - by Hayleys AgricultureBackground and Rationale:
Investment and Results:
Awards: A
Athwela by Rileys
Haritha Angara by HaycarbBackground and Rationale:
Our Value Creation ReportSocial and Relationship Capital
Winner of Asia Responsible Entrepreneurship Awards-
2015 (Social Empowerment)
Report Preamble > Hayleys at a Glance > Leadership and Governance > Our Strategy > Management Discussion and Analysis > Our Value Creation Report > Financial Statements
Hayleys PLC | Annual Report 2015-16128
Fabricator Training Programs by Alumex
•
Investment and Results:
Improving Living ConditionsHome for Every Plantation Worker
Living Environment
Empowerment of Youth
Community Capacity Building
Health and Nutrition
Living Environment:
Health and Nutrition:
Youth Empowerment:
Community Capacity Building:
Investment and Results
Annual Report 2015-16 | Hayleys PLC 129
The World Of Hayleys A World of Care
Our Value Creation ReportSocial and Relationship Capital
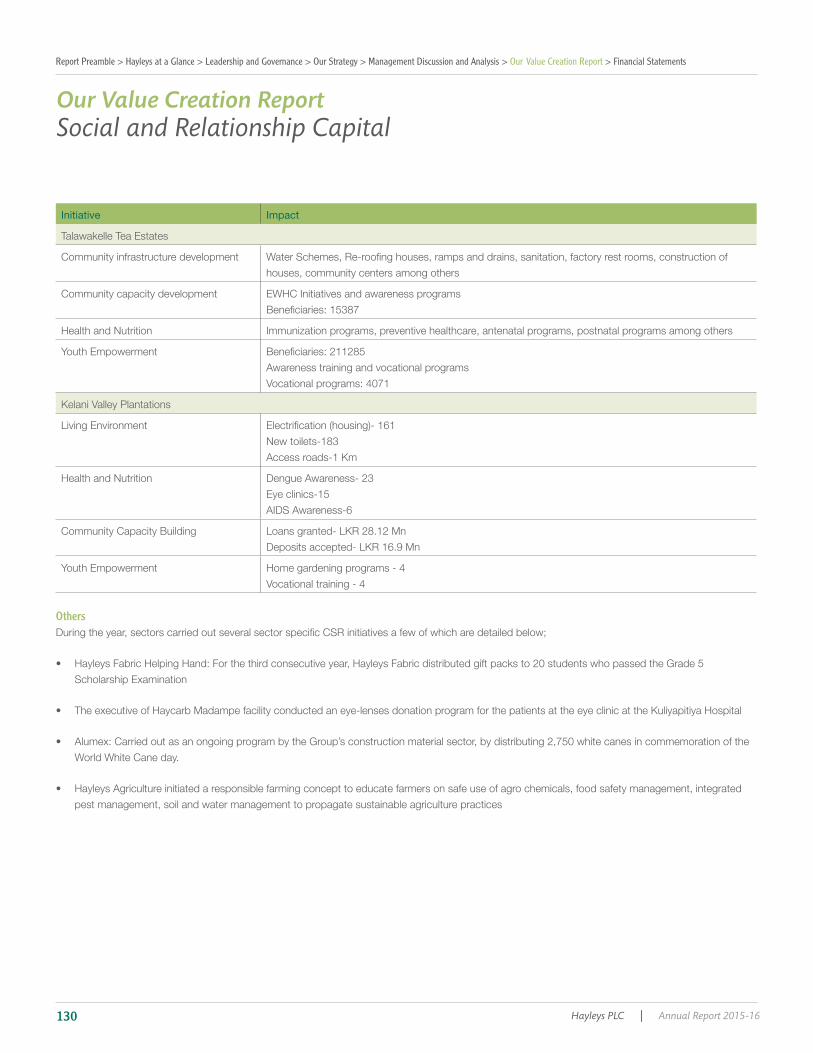
Initiative Impact
Others
Report Preamble > Hayleys at a Glance > Leadership and Governance > Our Strategy > Management Discussion and Analysis > Our Value Creation Report > Financial Statements
Hayleys PLC | Annual Report 2015-16130
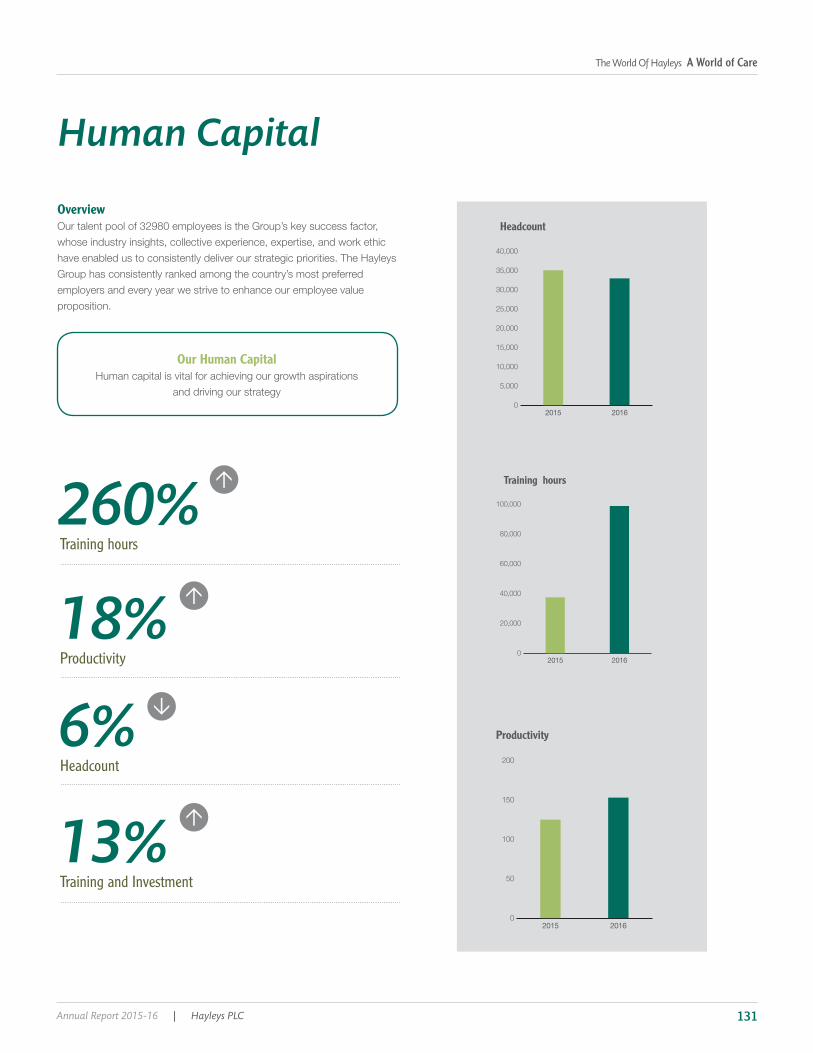
Human Capital
Overview
6%
13%
260%
18%
Headcount
Training and Investment
Training hours
Productivity
Our Human Capital
0
50
100
150
200
2015 2016
Productivity
0
5,000
10,000
15,000
20,000
25,000
30,000
35,000
40,000
2015 2016
Headcount
0
20,000
40,000
60,000
80,000
100,000
2015 2016
Training hours
Annual Report 2015-16 | Hayleys PLC 131
The World Of Hayleys A World of Care
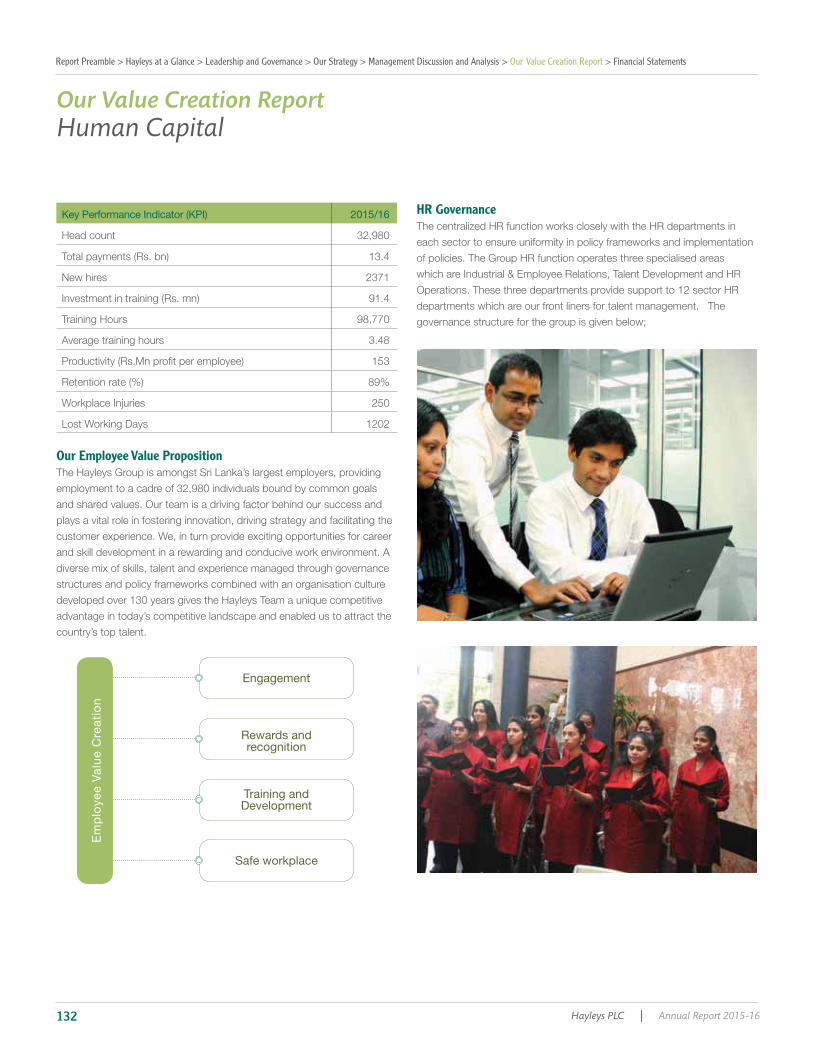
Key Performance Indicator (KPI) 2015/16
New hires
Our Employee Value Proposition
HR Governance
Engagement
Rewards andrecognition
Training andDevelopment
Safe workplace
Empl
oyee
Val
ue C
reat
ion
Our Value Creation ReportHuman Capital
Report Preamble > Hayleys at a Glance > Leadership and Governance > Our Strategy > Management Discussion and Analysis > Our Value Creation Report > Financial Statements
Hayleys PLC | Annual Report 2015-16132
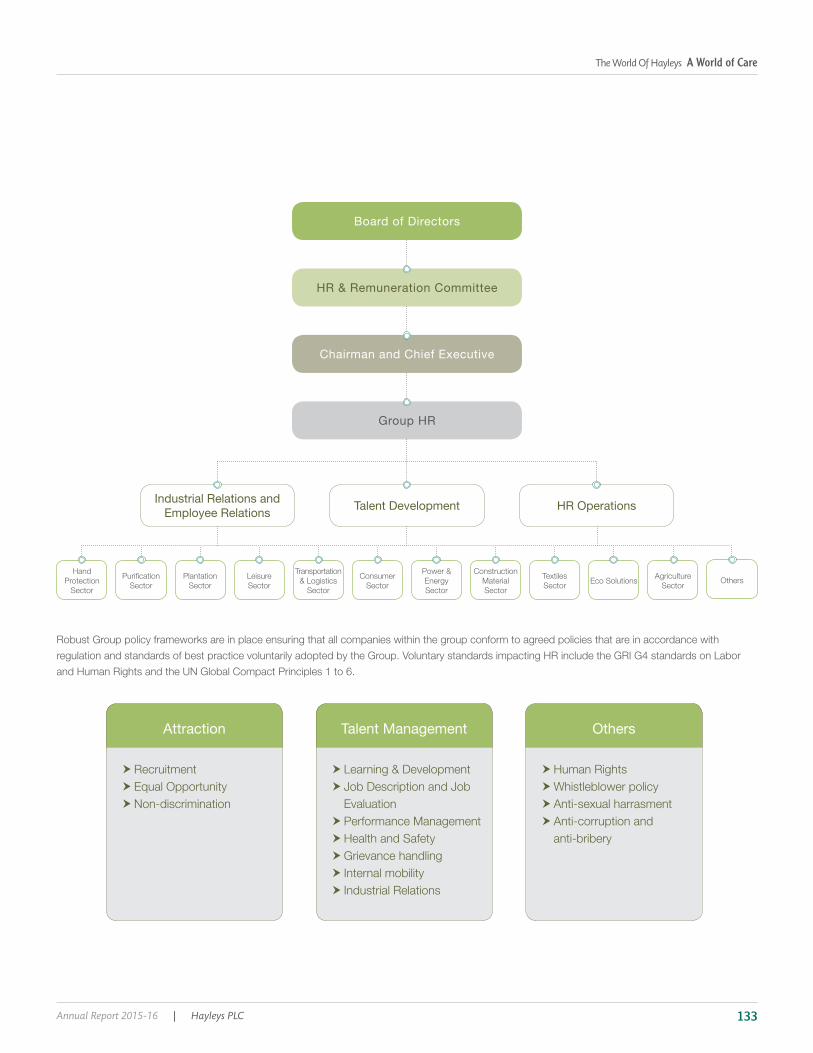
Group HR
Chairman and Chief Executive
HR & Remuneration Committee
Board of Directors
Industrial Relations and Employee Relations Talent Development HR Operations
Leisure
Others
Attraction Talent Management Others
Annual Report 2015-16 | Hayleys PLC 133
The World Of Hayleys A World of Care
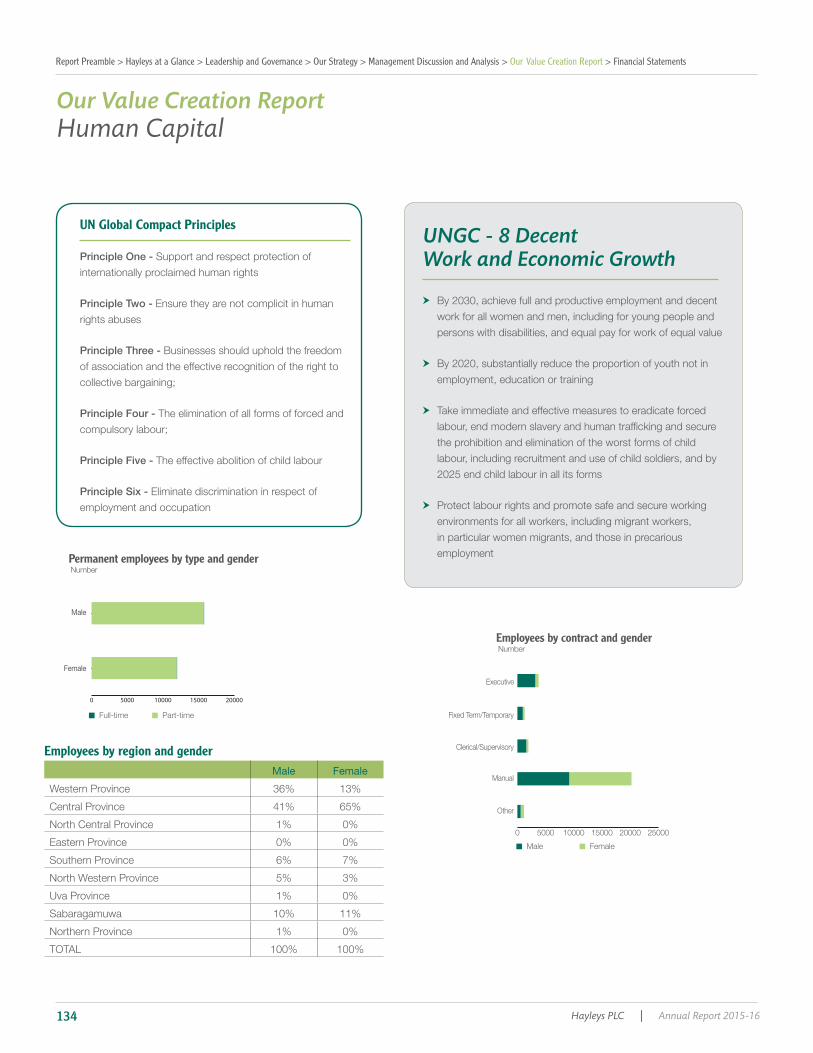
UN Global Compact Principles
Employees by region and genderMale Female
employment
UNGC - 8 Decent Work and Economic Growth
0 5000 10000 15000 20000 25000
Male Female
Executive
Fixed Term/Temporary
Manual
Clerical/Supervisory
Other
Employees by contract and genderNumber
Full-time Part-time
Female
Male
Permanent employees by type and genderNumber
0 5000 10000 15000 20000
Our Value Creation ReportHuman Capital
Report Preamble > Hayleys at a Glance > Leadership and Governance > Our Strategy > Management Discussion and Analysis > Our Value Creation Report > Financial Statements
Hayleys PLC | Annual Report 2015-16134

Talent Attraction
The Hayleys Way - Code of Conduct
Integrity Competition Employees Environment Consumer
Engagement
0
500
1000
1500
2000
Less than 30
30-50 years Above 50
New hires by age
0
500
1000
1500
2000
Female Male
New hires by gender
Annual Report 2015-16 | Hayleys PLC 135
The World Of Hayleys A World of Care

Compensation and Benefits
Training and Development
Average Training hours
Leisure
Health and Safety
Sector No. of Formal Committees
Workforce Representation
1
1
3
1
1
Health and Safety at the Workplace Total Number
Industrial Relations
Sector Collective agreement in place
% of employees covered by collective agreement
Minimum notice periods regarding operational changes
1 month
1 month
Our Value Creation ReportHuman Capital
Report Preamble > Hayleys at a Glance > Leadership and Governance > Our Strategy > Management Discussion and Analysis > Our Value Creation Report > Financial Statements
Hayleys PLC | Annual Report 2015-16136

Natural Capital
Overview
Key Performance Indicator (KPI) 2015/16
3
3
The Group’s Approach to Environmental Sustainability
Environmental Management Framework
The Precautionary Principle
Managing Our Natural InputsRaw Materials
Our Natural Capital
Annual Report 2015-16 | Hayleys PLC 137
The World Of Hayleys A World of Care

GJ 2015/16
Water
Water withdrawal by Source M3
Effluents and Waste
Sector Type of Raw Material 2015/16Aluminum Billets
Energy
Sector Initiative
Power & Energy
Plantations
Textiles
Eco Solutions
Leisure
Hand Protection
lamps
Natural CapitalOur Value Creation Report
Report Preamble > Hayleys at a Glance > Leadership and Governance > Our Strategy > Management Discussion and Analysis > Our Value Creation Report > Financial Statements
Hayleys PLC | Annual Report 2015-16138
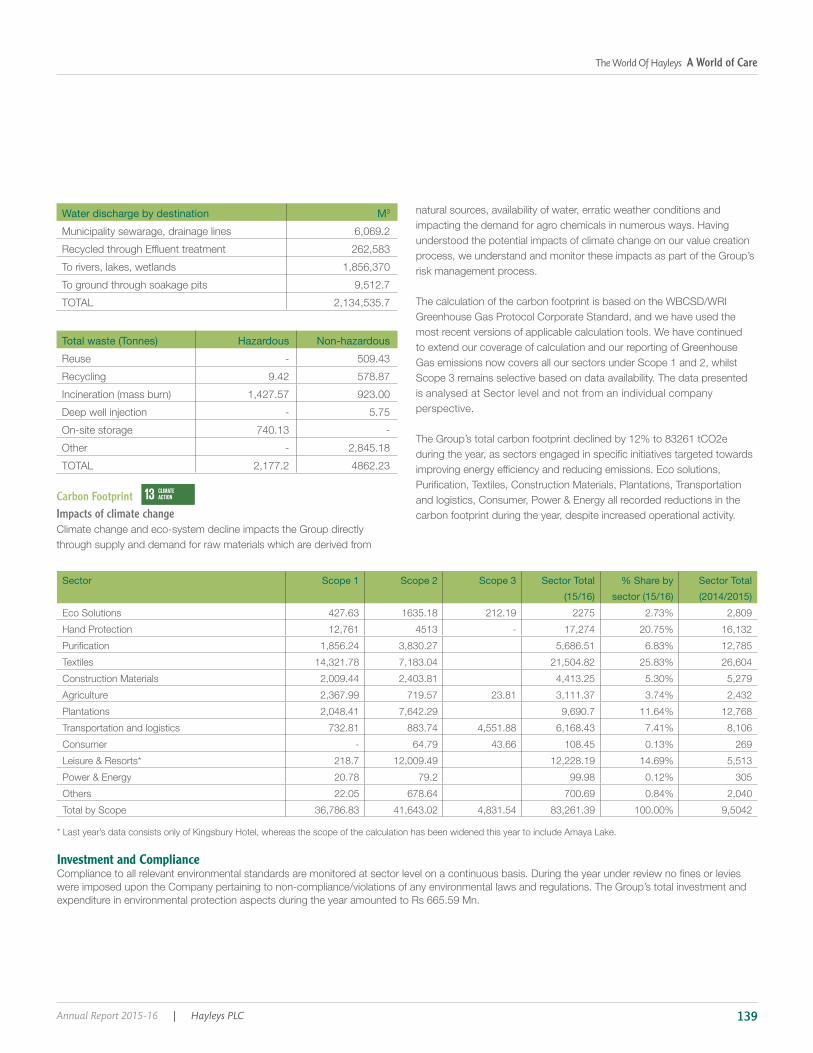
Water discharge by destination M3
Total waste (Tonnes) Hazardous Non-hazardous
Other
Carbon FootprintImpacts of climate change
Sector Scope 1 Scope 2 Scope 3 Sector Total (15/16)
% Share by sector (15/16)
Sector Total (2014/2015)
Others
Investment and Compliance
Annual Report 2015-16 | Hayleys PLC 139
The World Of Hayleys A World of Care
Annual Report of the Board of Directors
1. General
2. Review of the Business2.1 Principle Business activities of the Company and the Group .
2.2 Review of operations of the Company and the Group
2.3 Financial Statements of the Company and the Group
2.4 Auditors’ Report
2.5 Accounting Policies and changes during the year
2.6 Entries in the Interests Register
2.6.1 Directors’ interest in transactions
2.6.2 Directors’ interests in shares
Hayleys PLC
Report Preamble > Hayleys at a Glance > Leadership and Governance > Our Strategy > Management Discussion and Analysis > Our Value Creation Report > Financial Statements
Hayleys PLC | Annual Report 2015-16140
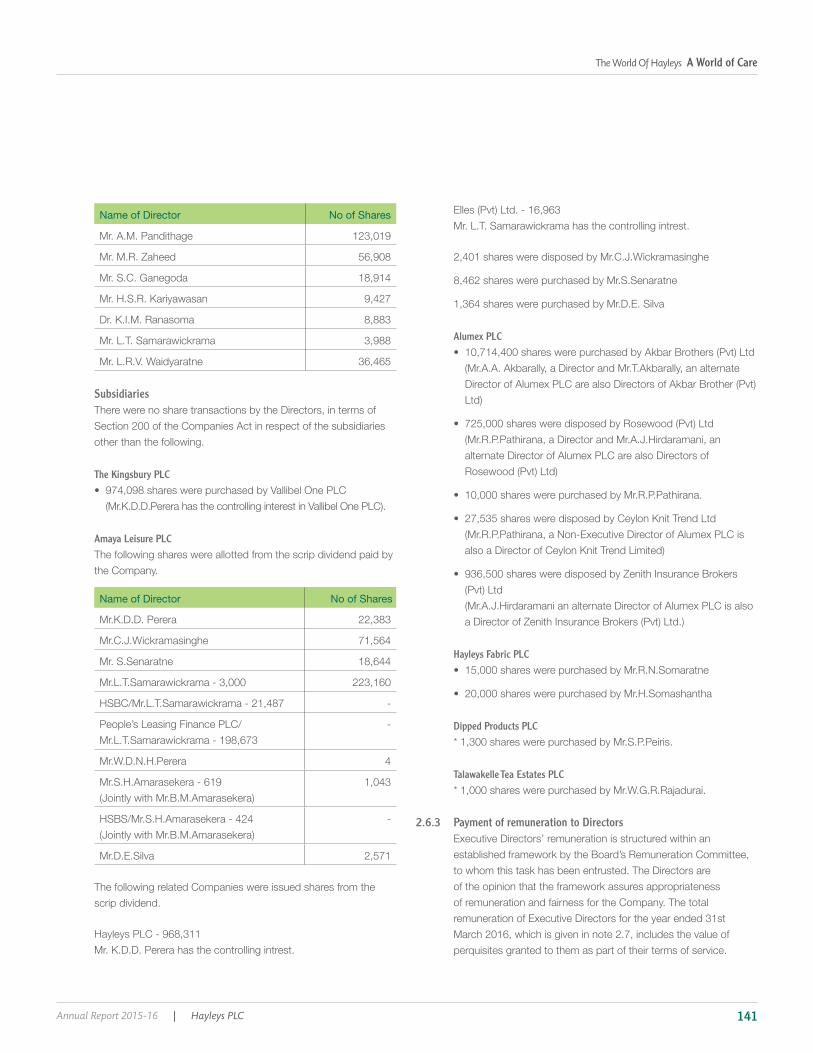
Name of Director No of Shares
8,883
Subsidiaries
The Kingsbury PLC
Amaya Leisure PLC
Name of Director No of Shares
Alumex PLC
Hayleys Fabric PLC
Dipped Products PLC
Talawakelle Tea Estates PLC
2.6.3 Payment of remuneration to Directors
of the opinion that the framework assures appropriateness
Annual Report 2015-16 | Hayleys PLC 141
The World Of Hayleys A World of Care
Annual Report of the Board of Directors
2.6.4 Insurance & Indemnity
2.7 Directors’ remuneration
2.8 Corporate Donations
3. Future Developments
4. Group Revenue and International trade
5. Dividends and Reserves5.1 Dividends
5.2 Reserves
6. Property, plant and equipment
Report Preamble > Hayleys at a Glance > Leadership and Governance > Our Strategy > Management Discussion and Analysis > Our Value Creation Report > Financial Statements
Hayleys PLC | Annual Report 2015-16142

7. Market value of Freehold land
8. Issue of Shares and Debentures8.1 Issue of Shares and Debentures by the Company
8.2 Issue of Shares and Debentures by subsidiaries and equity accounted investees.
8.3 Stated Capital and Debentures
9. Share Information
10. Substantial Shareholdings10.1 Major shareholdings
10.2 Public holding
11. Directors Hayleys PLC
Executive Directors
Non-Executive Directors
Non-Executive Independent Directors
Subsidiaries
Annual Report 2015-16 | Hayleys PLC 143
The World Of Hayleys A World of Care
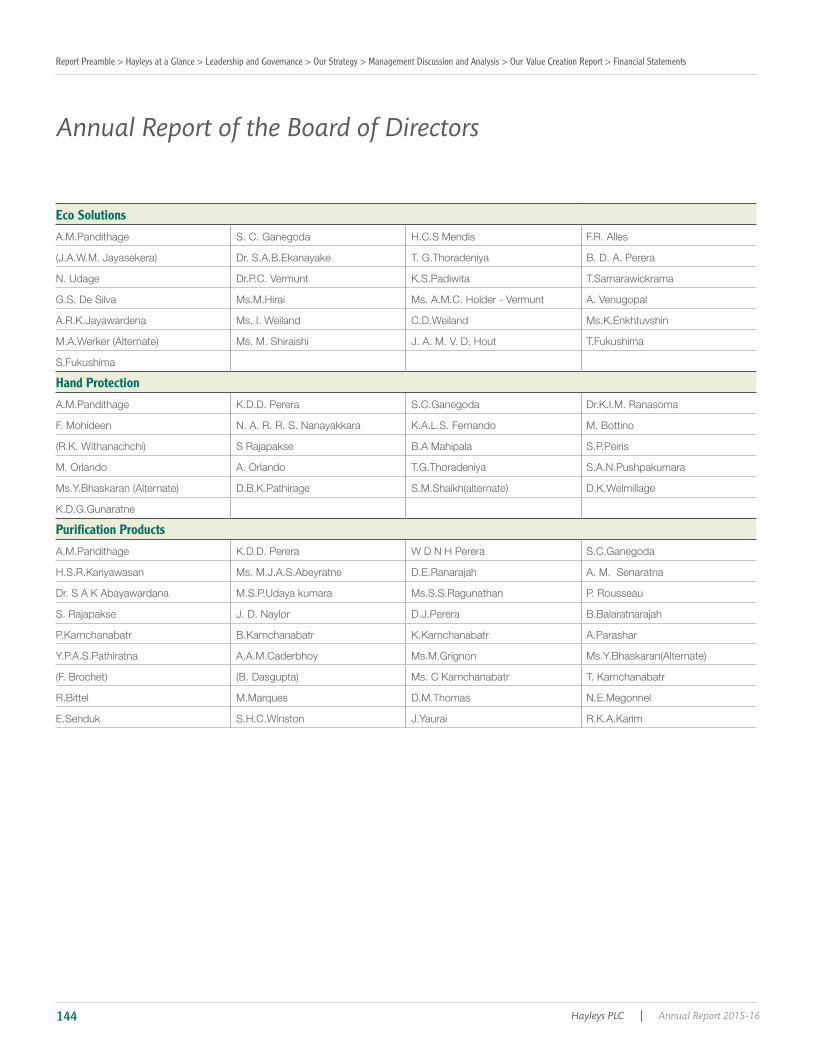
Annual Report of the Board of Directors
Eco Solutions
Hand Protection
Purification Products
Report Preamble > Hayleys at a Glance > Leadership and Governance > Our Strategy > Management Discussion and Analysis > Our Value Creation Report > Financial Statements
Hayleys PLC | Annual Report 2015-16144

Construction Materials
Agriculture
Plantations
Industry Inputs
Power & Energy
Consumer Products
Annual Report 2015-16 | Hayleys PLC 145
The World Of Hayleys A World of Care

Others
Transportation & Logistics
Leisure
Textiles
Annual Report of the Board of Directors
Report Preamble > Hayleys at a Glance > Leadership and Governance > Our Strategy > Management Discussion and Analysis > Our Value Creation Report > Financial Statements
Hayleys PLC | Annual Report 2015-16146
18. Events after the reporting date
19. Going concern
20. Exposure to risk
21. Appointment of Auditors
22. Auditors’ Remuneration and Interest in contracts
12. Disclosure of Directors’ dealing in Shares and Debentures
13. Employee share ownership plans
14. Directors’ disclosure of interest
15. Related Party Transactions
16. Environmental Protection
17. Statutory payments
Annual Report 2015-16 | Hayleys PLC 147
The World Of Hayleys A World of Care

The Auditors of the company and its Subsidiaries, have confirmed that they do not have any relationships (other than that of Auditor) with, or interests in, the Company or any of its Subsidiaries other than those disclosed above.
23. Ratios and Market price informationThe ratios relating to equity and debt as required by the listing requirements of the Colombo Stock Exchange are given in pages 270 to 271 of this Report.
24. Employees & Industrial RelationsThe Group has a structure and a culture that recognizes the aspirations, competencies and commitment of its employees. Career growth and advancement within the Group is promoted.
Details of Group’s human resource practices and employee and industrial relationships are given in Social Performance section of the Sustainability Review.
The number of persons employed by the Group at year-end was 32,980 (35,093).
25. ShareholdersIt is the Group’s policy to endeavour to ensure equitable treatment to its shareholders.
26. Internal ControlsThe Directors acknowledge their responsibility for the Group’s system of internal control. The system is designed to give assurance, inter alia, regarding the safeguarding of assets, the maintenance of proper accounting records and the reliability of financial information generated. However, any system can only ensure reasonable and not absolute assurance that errors and irregularities are either prevented or detected within a reasonable time period.
The Board, having reviewed the system of internal controls, is satisfied with the Group’s adherence to and effectiveness of these controls for the period up to the date of signing the Financial Statements.
27. Corporate GovernanceThe Company has complied with the Corporate Governance rules laid down under the listing rules of the Colombo Stock Exchange. The Corporate Governance Report on pages 34 to 47 discusses this further.
28. Annual General MeetingThe Annual General Meeting will be held at Balmoral Ballroom, The Kingsbury Hotel , No. 48, Janadhipathi Mawatha, Colombo 01, at 10.00 a.m. on Wednesday, 29th June 2016. The Notice of the Annual General Meeting appears on page 292
For and on behalf of the Board
A.M.Pandithage Chairman & Chief Executive Director
S.C.Ganegoda Director
Hayleys Group Services (Pvt) Ltd Secretaries
20th May 2016
Comparative figures are shown in brackets.
Annual Report of the Board of Directors
Report Preamble > Hayleys at a Glance > Leadership and Governance > Our Strategy > Management Discussion and Analysis > Our Value Creation Report > Financial Statements
Hayleys PLC | Annual Report 2015-16148
Chairman/Chief Executive’s and Group Chief Financial Officer’s Responsibility Statement
Annual Report 2015-16 | Hayleys PLC 149
The World Of Hayleys A World of Care
Directors’ Statement on internal controls
Conclusion
Mohan Pandithage
Report Preamble > Hayleys at a Glance > Leadership and Governance > Our Strategy > Management Discussion and Analysis > Our Value Creation Report > Financial Statements
Hayleys PLC | Annual Report 2015-16150
Nomination Committee Report
Composition of the Committee
The duties of the Committee
Re- election of Directors at the Annual General Meeting
Mohan Pandithage
Annual Report 2015-16 | Hayleys PLC 151
The World Of Hayleys A World of Care

Remuneration Committee Report
Composition of the Committee
The Scope of the Committee
Remuneration Policy
Meetings
Report Preamble > Hayleys at a Glance > Leadership and Governance > Our Strategy > Management Discussion and Analysis > Our Value Creation Report > Financial Statements
Hayleys PLC | Annual Report 2015-16152
Statement of Directors’ Responsibilities
Compliance Report
Hayleys Group Services (Pvt) Ltd.
Secretaries
Annual Report 2015-16 | Hayleys PLC 153
The World Of Hayleys A World of Care
Related Party Transactions Review Committee ReportComposition of the Committee
The duties of the Committee
Meetings
Report Preamble > Hayleys at a Glance > Leadership and Governance > Our Strategy > Management Discussion and Analysis > Our Value Creation Report > Financial Statements
Hayleys PLC | Annual Report 2015-16154
Audit Committee Report
Composition of the Audit Committee
Charter of the Audit Committee
Meetings of the Audit Committee
The Objective and role of the Audit Committee
Tasks of the Audit Committee Financial Reporting System
Internal Audits
Annual Report 2015-16 | Hayleys PLC 155
The World Of Hayleys A World of Care

Subsidiary Company Audit Committees
External Audits
Appointment of External Auditors
Support to the Committee
Ethics and Good Governance
Sri Lanka Accounting Standards
Audit Committee Report
Report Preamble > Hayleys at a Glance > Leadership and Governance > Our Strategy > Management Discussion and Analysis > Our Value Creation Report > Financial Statements
Hayleys PLC | Annual Report 2015-16156
The World Of Hayleys A World of Care
Annual Report 2015-16 | Hayleys PLC 157
A World of CareThe World Of Hayleys
Financial Reports 158. Financial Calendar 159. Independent Auditors’ Report 160. 161. Statement of Comprehensive Income 162. Statement of Financial Position 164. Statement of Changes in Equity 169. Statement of Cash Flows 172. Notes to the Financial Statements 265. Ten Year Summary 266. Value of Real estate 267. Country Report 269. Share Information 272. History of Dividends and Scrip Issues 274. Quarterly Analysis 275. Group Companies 279. GRI Content Index Tool 285. Group Value Addition and Distribution 286. Glossary of Financial Terms 288. Corporate Information 292. Notice of Meeting 293. Form of Proxy 295. Investor Feedback Form

1st Quarter Report 7th August, 2015
2nd Quarter Report 6th November, 2015
3rd Quarter Report 10th February, 2016
4th Quarter Report 20th May, 2016
Annual Report 2015/16 3rd June, 2016
65th Annual General Meeting 29th June, 2016
First and Final Dividend Proposed 29th June, 2016
First and Final Dividend Payable 11th July, 2016
Financial Calendar 2015/16
The World Of Hayleys A World of Care
Annual Report 2015-16 | Hayleys PLC 159
INDEPENDENT AUDITORS’ REPORTTO THE SHAREHOLDERS OF HAYLEYS PLCReport on the Financial Statements
statement of comprehensive income, statement of changes in equity
Board’s Responsibility for the Financial Statements
that are free from material misstatement, whether due to fraud or error.
Auditors’ Responsibility
based on our audit. We conducted our audit in accordance with Sri
ethical requirements and plan and perform the audit to obtain reasonable
misstatement.
An audit involves performing procedures to obtain evidence about the
selected depend on the auditor’s judgment, including the assessment of
due to fraud or error. In making those risk assessments, the auditor
considers internal control relevant to the entity’s preparation of the
procedures that are appropriate in the circumstances, but not for the
purpose of expressing an opinion on the effectiveness of the entity’s
internal control. An audit also includes evaluating the appropriateness of
Independent Auditors’ Report
accounting policies used and the reasonableness of accounting estimates
made by Board, as well as evaluating the overall presentation of the
appropriate to provide a basis for our audit opinion.
Opinion
Report on other legal and regulatory requirements
state the following:
stated above.
- we have obtained all the information and explanations that were
required for the audit and, as far as appears from our examination,
proper accounting records have been kept by the Company,
the requirements of Section 151 and 153 of the Companies Act
No. 7 of 2007.
20 May 2016
Colombo
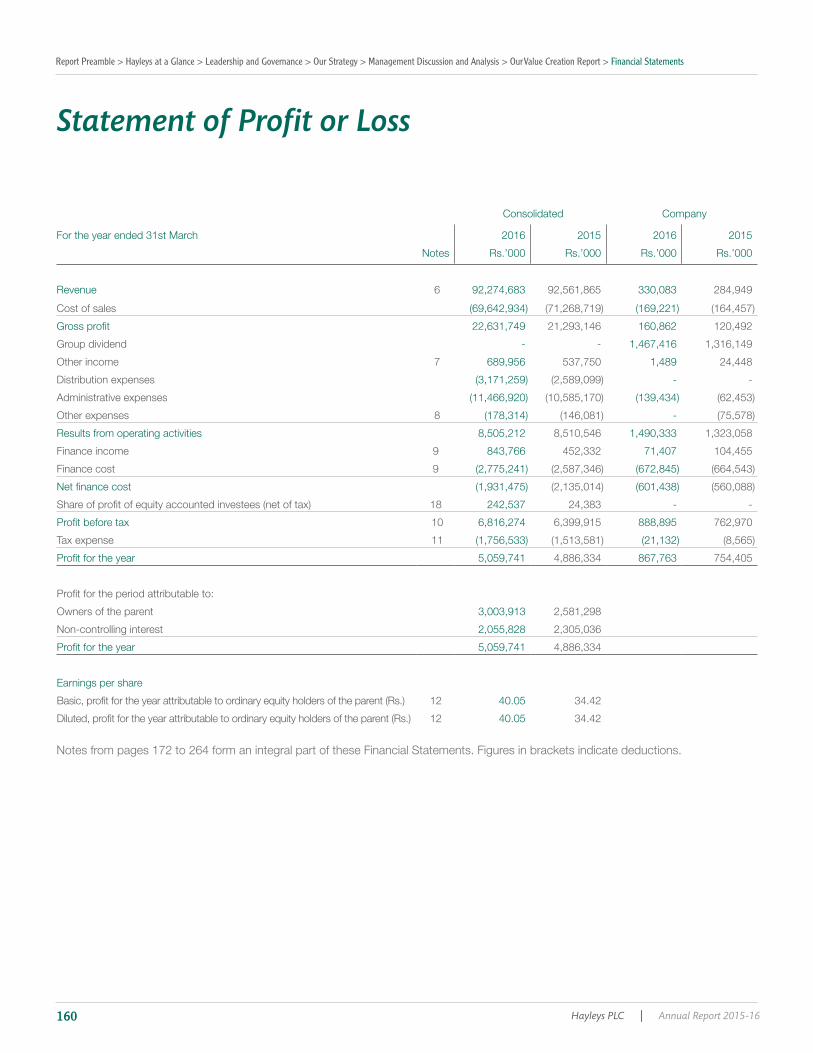
Report Preamble > Hayleys at a Glance > Leadership and Governance > Our Strategy > Management Discussion and Analysis > Our Value Creation Report > Financial Statements
Hayleys PLC | Annual Report 2015-16160
Statement of Profit or Loss
Consolidated Company
For the year ended 31st March 2016 2015 2016 2015
Notes Rs.’000 Rs.’000 Rs.’000 Rs.’000
Revenue 6 92,274,683 92,561,865 330,083 284,949
Cost of sales
22,631,749 21,293,146 160,862 120,492
Group dividend - - 1,467,416 1,316,149
Other income 7 689,956 537,750 1,489 24,448
Distribution expenses - -
Administrative expenses
Other expenses 8 -
Results from operating activities 8,505,212 8,510,546 1,490,333 1,323,058
Finance income 9 843,766 452,332 71,407 104,455
Finance cost 9
18 242,537 24,383 - -
10 6,816,274 6,399,915 888,895 762,970
Tax expense 11
5,059,741 4,886,334 867,763 754,405
Owners of the parent 3,003,913 2,581,298
Non-controlling interest 2,055,828 2,305,036
5,059,741 4,886,334
Earnings per share
12 40.05 34.42
12 40.05 34.42
Notes from pages 172 to 264 form an integral part of these Financial Statements. Figures in brackets indicate deductions.

The World Of Hayleys A World of Care
Annual Report 2015-16 | Hayleys PLC 161
Statement of Comprehensive Income
Consolidated Company
For the year ended 31st March 2016 2015 2016 2015
Notes Rs.’000 Rs.’000 Rs.’000 Rs.’000
5,059,741 4,886,334 867,763 754,405
Other comprehensive income
Revaluation of land - 3,108,054 - 1,453,000
Share of other comprehensive income of equity accounted investees - 119,796 - -
28 80,652
Income tax on other comprehensive income 11 50,304 5,392 - -
Net exchange differences on translation of foreign operations 367,727 - -
Share of other comprehensive income of equity accounted investees 867 - -
20,555 - -
Total other comprehensive income for the year, net of tax 32,360 3,089,804 1,533,652
Total comprehensive income for the year, net of tax 5,092,101 7,976,138 797,069 2,288,057
Total comprehensive income for the year attributable to :
Owners of the parent 2,972,574 5,319,922
Non- controlling interest 2,119,527 2,656,216
5,092,101 7,976,138
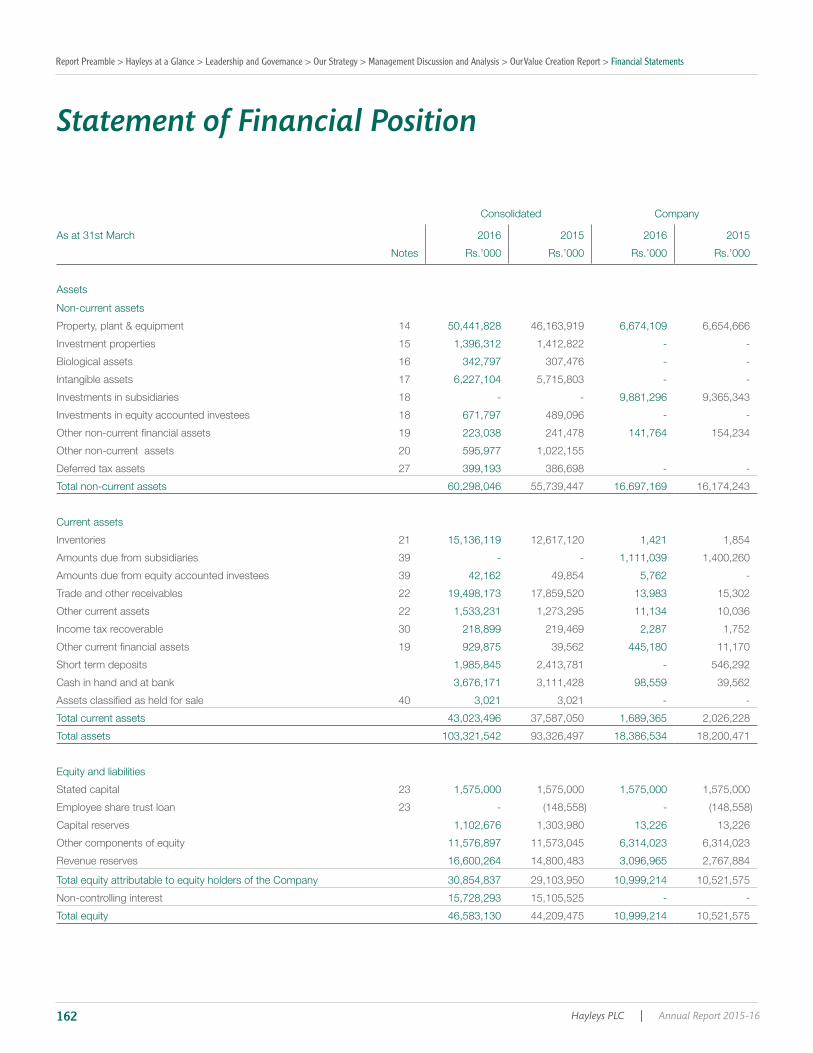
Report Preamble > Hayleys at a Glance > Leadership and Governance > Our Strategy > Management Discussion and Analysis > Our Value Creation Report > Financial Statements
Hayleys PLC | Annual Report 2015-16162
Statement of Financial Position
Consolidated Company
As at 31st March 2016 2015 2016 2015
Notes Rs.’000 Rs.’000 Rs.’000 Rs.’000
Assets
Non-current assets
Property, plant & equipment 14 50,441,828 46,163,919 6,674,109 6,654,666
Investment properties 15 1,396,312 1,412,822 - -
Biological assets 16 342,797 307,476 - -
Intangible assets 17 6,227,104 5,715,803 - -
Investments in subsidiaries 18 - - 9,881,296 9,365,343
Investments in equity accounted investees 18 671,797 489,096 - -
19 223,038 241,478 141,764 154,234
Other non-current assets 20 595,977 1,022,155
Deferred tax assets 27 399,193 386,698 - -
Total non-current assets 60,298,046 55,739,447 16,697,169 16,174,243
Current assets
Inventories 21 15,136,119 12,617,120 1,421 1,854
Amounts due from subsidiaries 39 - - 1,111,039 1,400,260
Amounts due from equity accounted investees 39 42,162 49,854 5,762 -
Trade and other receivables 22 19,498,173 17,859,520 13,983 15,302
Other current assets 22 1,533,231 1,273,295 11,134 10,036
Income tax recoverable 30 218,899 219,469 2,287 1,752
19 929,875 39,562 445,180 11,170
Short term deposits 1,985,845 2,413,781 - 546,292
Cash in hand and at bank 3,676,171 3,111,428 98,559 39,562
40 3,021 3,021 - -
Total current assets 43,023,496 37,587,050 1,689,365 2,026,228
Total assets 103,321,542 93,326,497 18,386,534 18,200,471
Equity and liabilities
Stated capital 23 1,575,000 1,575,000 1,575,000 1,575,000
Employee share trust loan 23 - -
Capital reserves 1,102,676 1,303,980 13,226 13,226
Other components of equity 11,576,897 11,573,045 6,314,023 6,314,023
Revenue reserves 16,600,264 14,800,483 3,096,965 2,767,884
Total equity attributable to equity holders of the Company 30,854,837 29,103,950 10,999,214 10,521,575
Non-controlling interest 15,728,293 15,105,525 - -
Total equity 46,583,130 44,209,475 10,999,214 10,521,575
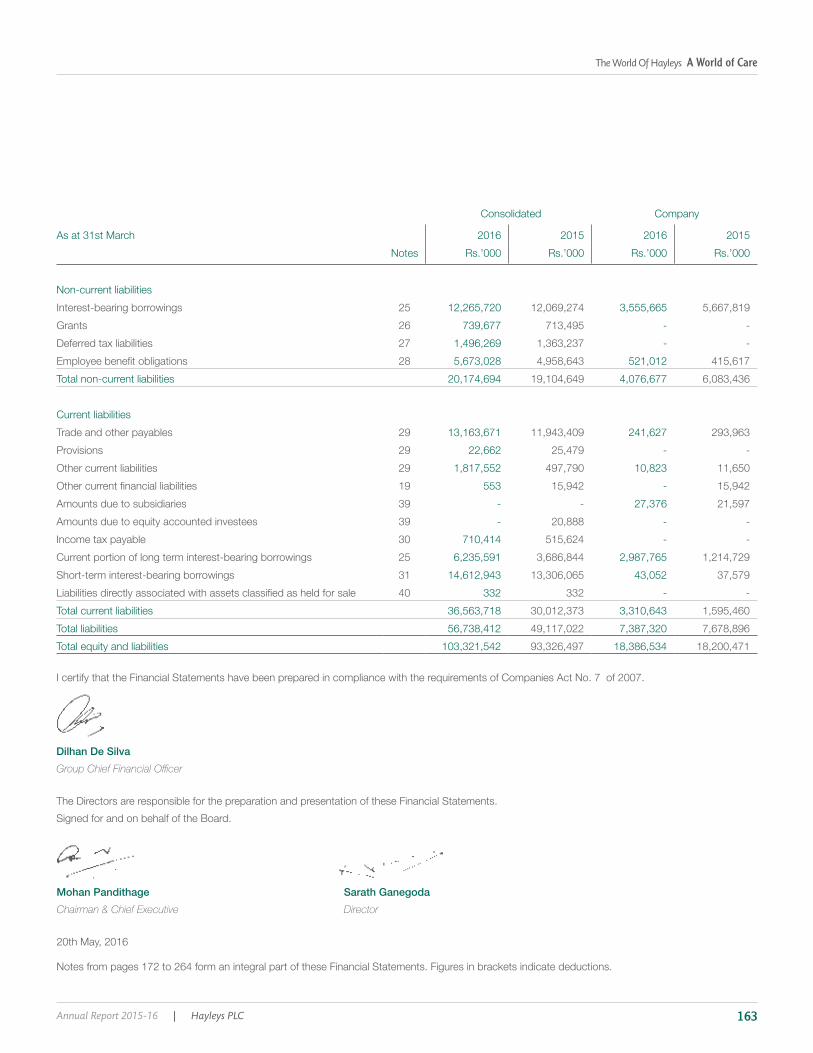
The World Of Hayleys A World of Care
Annual Report 2015-16 | Hayleys PLC 163
Consolidated Company
As at 31st March 2016 2015 2016 2015
Notes Rs.’000 Rs.’000 Rs.’000 Rs.’000
Non-current liabilities
Interest-bearing borrowings 25 12,265,720 12,069,274 3,555,665 5,667,819
Grants 26 739,677 713,495 - -
Deferred tax liabilities 27 1,496,269 1,363,237 - -
28 5,673,028 4,958,643 521,012 415,617
Total non-current liabilities 20,174,694 19,104,649 4,076,677 6,083,436
Current liabilities
Trade and other payables 29 13,163,671 11,943,409 241,627 293,963
Provisions 29 22,662 25,479 - -
Other current liabilities 29 1,817,552 497,790 10,823 11,650
19 553 15,942 - 15,942
Amounts due to subsidiaries 39 - - 27,376 21,597
Amounts due to equity accounted investees 39 - 20,888 - -
Income tax payable 30 710,414 515,624 - -
Current portion of long term interest-bearing borrowings 25 6,235,591 3,686,844 2,987,765 1,214,729
Short-term interest-bearing borrowings 31 14,612,943 13,306,065 43,052 37,579
40 332 332 - -
Total current liabilities 36,563,718 30,012,373 3,310,643 1,595,460
Total liabilities 56,738,412 49,117,022 7,387,320 7,678,896
Total equity and liabilities 103,321,542 93,326,497 18,386,534 18,200,471
I certify that the Financial Statements have been prepared in compliance with the requirements of Companies Act No. 7 of 2007.
Dilhan De Silva
The Directors are responsible for the preparation and presentation of these Financial Statements.
Signed for and on behalf of the Board.
Mohan Pandithage Sarath Ganegoda
Chairman & Chief Executive Director
20th May, 2016
Notes from pages 172 to 264 form an integral part of these Financial Statements. Figures in brackets indicate deductions.
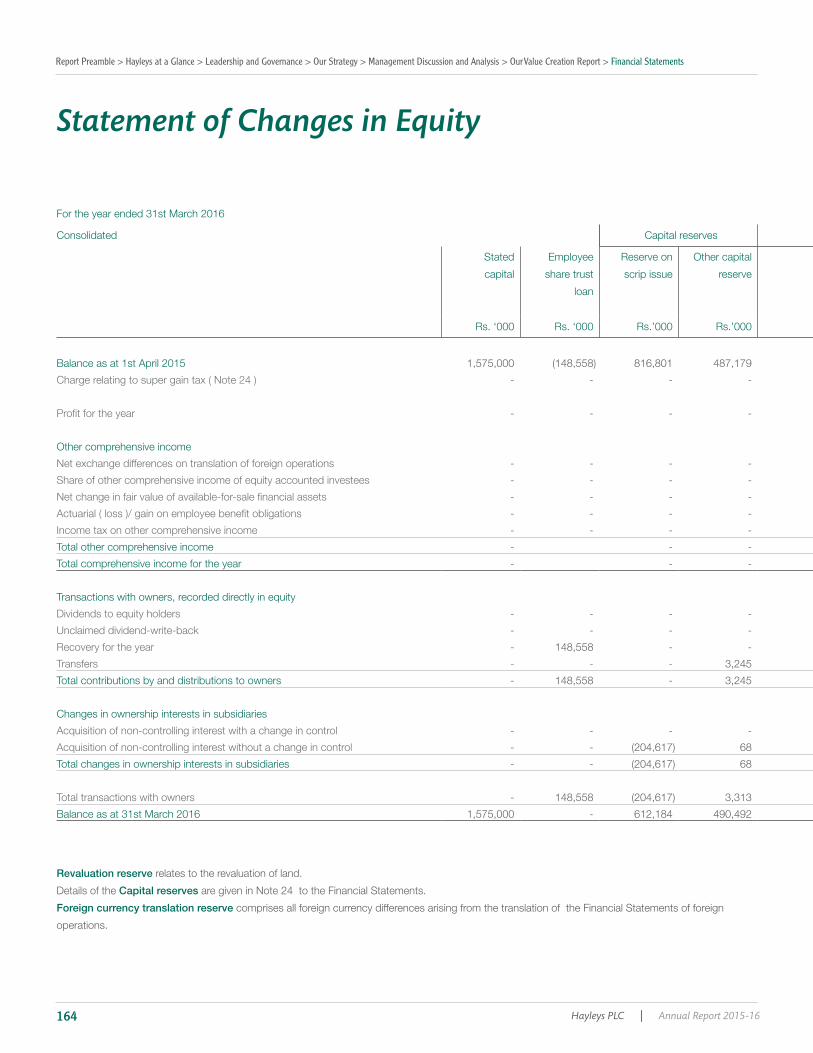
Report Preamble > Hayleys at a Glance > Leadership and Governance > Our Strategy > Management Discussion and Analysis > Our Value Creation Report > Financial Statements
Hayleys PLC | Annual Report 2015-16164
For the year ended 31st March 2016
Consolidated Capital reserves
Stated
capital
Employee
share trust
loan
Reserve on
scrip issue
Other capital
reserve
Rs. ‘000 Rs. ‘000 Rs.’000 Rs.’000
Balance as at 1st April 2015 1,575,000 816,801 487,179
- - - -
- - - -
Other comprehensive income
Net exchange differences on translation of foreign operations - - - -
Share of other comprehensive income of equity accounted investees - - - -
- - - -
- - - -
Income tax on other comprehensive income - - - -
Total other comprehensive income - - -
Total comprehensive income for the year - - -
Transactions with owners, recorded directly in equity
Dividends to equity holders - - - -
Unclaimed dividend-write-back - - - -
Recovery for the year - 148,558 - -
Transfers - - - 3,245
Total contributions by and distributions to owners - 148,558 - 3,245
Changes in ownership interests in subsidiaries
Acquisition of non-controlling interest with a change in control - - - -
Acquisition of non-controlling interest without a change in control - - 68
Total changes in ownership interests in subsidiaries - - 68
Total transactions with owners - 148,558 3,313
Balance as at 31st March 2016 1,575,000 - 612,184 490,492
Statement of Changes in Equity
Revaluation reserve relates to the revaluation of land.
Details of the Capital reserves are given in Note 24 to the Financial Statements.
Foreign currency translation reserve comprises all foreign currency differences arising from the translation of the Financial Statements of foreign
operations.
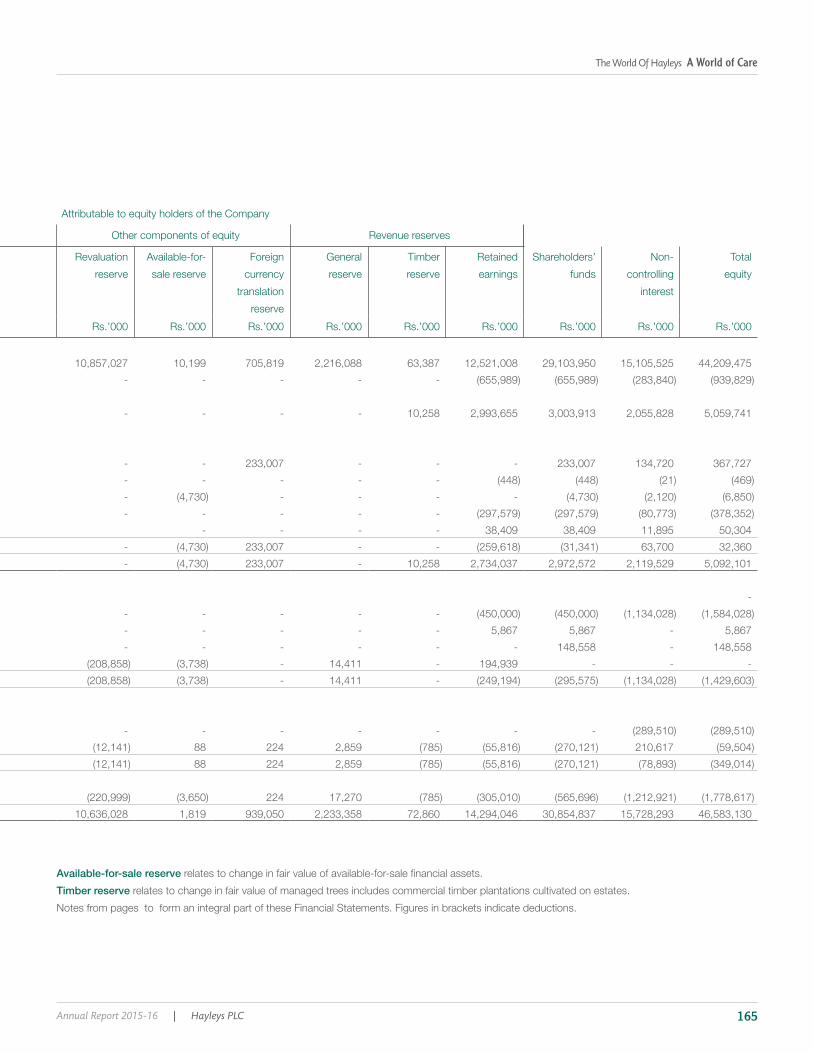
The World Of Hayleys A World of Care
Annual Report 2015-16 | Hayleys PLC 165
Attributable to equity holders of the Company
Other components of equity Revenue reserves
Revaluation
reserve
Available-for-
sale reserve
Foreign
currency
translation
reserve
General
reserve
Timber
reserve
Retained
earnings
Shareholders’
funds
Non-
controlling
interest
Total
equity
Rs.’000 Rs.’000 Rs.’000 Rs.’000 Rs.’000 Rs.’000 Rs.’000 Rs.’000 Rs.’000
10,857,027 10,199 705,819 2,216,088 63,387 12,521,008 29,103,950 15,105,525 44,209,475
- - - - -
- - - - 10,258 2,993,655 3,003,913 2,055,828 5,059,741
- - 233,007 - - - 233,007 134,720 367,727
- - - - -
- - - - -
- - - - -
- - - - 38,409 38,409 11,895 50,304
- 233,007 - - 63,700 32,360
- 233,007 - 10,258 2,734,037 2,972,572 2,119,529 5,092,101
-
- - - - -
- - - - - 5,867 5,867 - 5,867
- - - - - - 148,558 - 148,558
- 14,411 - 194,939 - - -
- 14,411 -
- - - - - - -
88 224 2,859 210,617
88 224 2,859
224 17,270
10,636,028 1,819 939,050 2,233,358 72,860 14,294,046 30,854,837 15,728,293 46,583,130
Available-for-sale reserve
Timber reserve relates to change in fair value of managed trees includes commercial timber plantations cultivated on estates.
Notes from pages to form an integral part of these Financial Statements. Figures in brackets indicate deductions.

Report Preamble > Hayleys at a Glance > Leadership and Governance > Our Strategy > Management Discussion and Analysis > Our Value Creation Report > Financial Statements
Hayleys PLC | Annual Report 2015-16166
For the year ended 31st March 2015
Consolidated Capital reserves
Stated
capital
Employee
share trust
loan
Reserve on
scrip issue
Other capital
reserve
Rs. ‘000 Rs. ‘000 Rs.’000 Rs.’000
Balance as at 1st April 2014 1,575,000 816,773 612,907
- - - -
Other comprehensive income
Net exchange differences on translation of foreign operations - - - -
Share of other comprehensive income of equity accounted investees - - - -
- - - -
Revaluation of land - - - -
- - - -
Income tax on other comprehensive income - - - -
Total other comprehensive income - - - -
Total comprehensive income for the year - - - -
Transactions with owners, recorded directly in equity
Dividends to equity holders - - - -
Recovery for the year - 339,703 - -
Transfers - - 3,484
Total contributions by and distributions to owners - 339,703 3,484
Changes in ownership interests in subsidiaries
Acquisition of non-controlling interest with a change in control - - - -
Acquisition of non-controlling interest without a change in control - - 47,815
Total changes in ownership interests in subsidiaries - - 47,815
Total transactions with owners - 339,703 28
Balance as at 31st March 2015 1,575,000 816,801 487,179
Statement of Changes in Equity
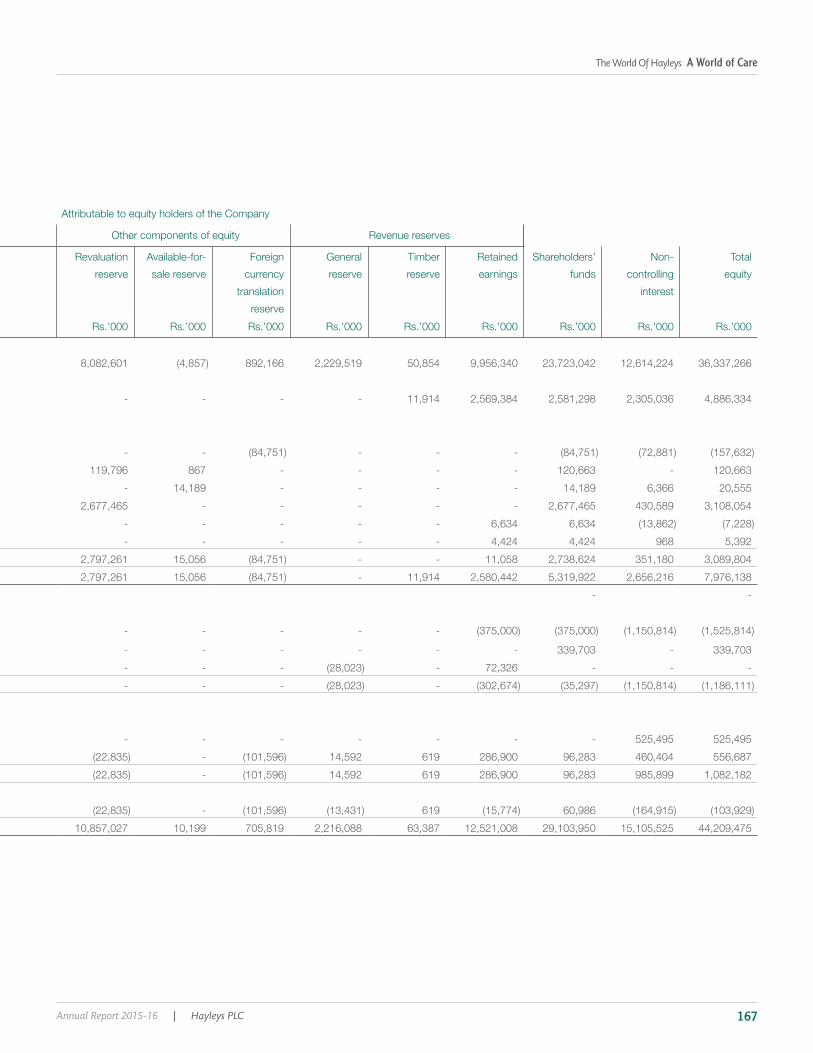
The World Of Hayleys A World of Care
Annual Report 2015-16 | Hayleys PLC 167
Attributable to equity holders of the Company
Other components of equity Revenue reserves
Revaluation
reserve
Available-for-
sale reserve
Foreign
currency
translation
reserve
General
reserve
Timber
reserve
Retained
earnings
Shareholders’
funds
Non-
controlling
interest
Total
equity
Rs.’000 Rs.’000 Rs.’000 Rs.’000 Rs.’000 Rs.’000 Rs.’000 Rs.’000 Rs.’000
8,082,601 892,166 2,229,519 50,854 9,956,340 23,723,042 12,614,224 36,337,266
- - - - 11,914 2,569,384 2,581,298 2,305,036 4,886,334
- - - - -
119,796 867 - - - - 120,663 - 120,663
- 14,189 - - - - 14,189 6,366 20,555
2,677,465 - - - - - 2,677,465 430,589 3,108,054
- - - - - 6,634 6,634
- - - - - 4,424 4,424 968 5,392
2,797,261 15,056 - - 11,058 2,738,624 351,180 3,089,804
2,797,261 15,056 - 11,914 2,580,442 5,319,922 2,656,216 7,976,138
- -
- - - - -
- - - - - - 339,703 - 339,703
- - - - 72,326 - - -
- - - -
- - - - - - - 525,495 525,495
- 14,592 619 286,900 96,283 460,404 556,687
- 14,592 619 286,900 96,283 985,899 1,082,182
- 619 60,986
10,857,027 10,199 705,819 2,216,088 63,387 12,521,008 29,103,950 15,105,525 44,209,475
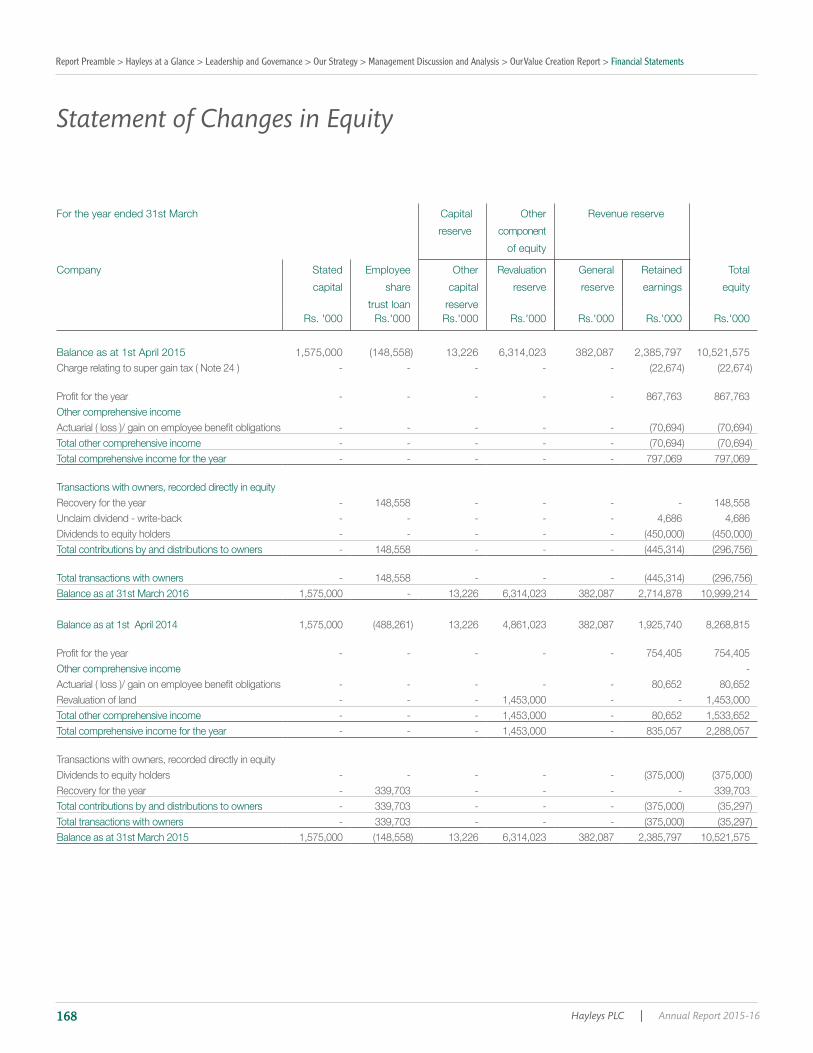
Report Preamble > Hayleys at a Glance > Leadership and Governance > Our Strategy > Management Discussion and Analysis > Our Value Creation Report > Financial Statements
Hayleys PLC | Annual Report 2015-16168
Statement of Changes in Equity
For the year ended 31st March Capital
reserve
Other
component
of equity
Revenue reserve
Company Stated
capital
Employee
share
trust loan
Other
capital
reserve
Revaluation
reserve
General
reserve
Retained
earnings
Total
equity
Rs. '000 Rs.'000 Rs.'000 Rs.'000 Rs.'000 Rs.'000 Rs.'000
Balance as at 1st April 2015 1,575,000 13,226 6,314,023 382,087 2,385,797 10,521,575 - - - - -
- - - - - 867,763 867,763 Other comprehensive income
- - - - - Total other comprehensive income - - - - - Total comprehensive income for the year - - - - - 797,069 797,069
Transactions with owners, recorded directly in equityRecovery for the year - 148,558 - - - - 148,558 Unclaim dividend - write-back - - - - - 4,686 4,686 Dividends to equity holders - - - - - Total contributions by and distributions to owners - 148,558 - - -
Total transactions with owners - 148,558 - - - Balance as at 31st March 2016 1,575,000 - 13,226 6,314,023 382,087 2,714,878 10,999,214
Balance as at 1st April 2014 1,575,000 13,226 4,861,023 382,087 1,925,740 8,268,815
- - - - - 754,405 754,405 Other comprehensive income -
- - - - - 80,652 80,652 Revaluation of land - - - 1,453,000 - - 1,453,000 Total other comprehensive income - - - 1,453,000 - 80,652 1,533,652 Total comprehensive income for the year - - - 1,453,000 - 835,057 2,288,057
Transactions with owners, recorded directly in equityDividends to equity holders - - - - - Recovery for the year - 339,703 - - - - 339,703 Total contributions by and distributions to owners - 339,703 - - - Total transactions with owners - 339,703 - - - Balance as at 31st March 2015 1,575,000 13,226 6,314,023 382,087 2,385,797 10,521,575
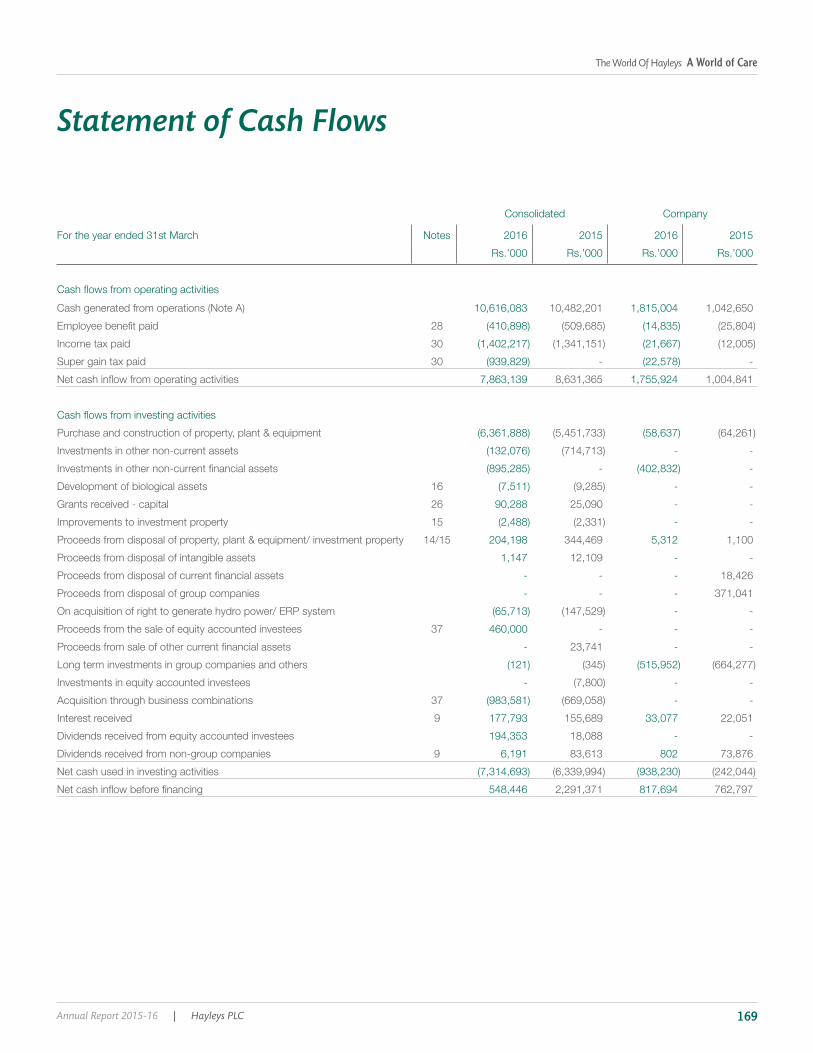
The World Of Hayleys A World of Care
Annual Report 2015-16 | Hayleys PLC 169
Statement of Cash Flows
Consolidated Company
For the year ended 31st March Notes 2016 2015 2016 2015
Rs.’000 Rs.’000 Rs.’000 Rs.’000
10,616,083 10,482,201 1,815,004 1,042,650
28
Income tax paid 30
Super gain tax paid 30 - -
7,863,139 8,631,365 1,755,924 1,004,841
Purchase and construction of property, plant & equipment
Investments in other non-current assets - -
- -
Development of biological assets 16 - -
Grants received - capital 26 90,288 25,090 - -
Improvements to investment property 15 - -
Proceeds from disposal of property, plant & equipment/ investment property 14/15 204,198 344,469 5,312 1,100
Proceeds from disposal of intangible assets 1,147 12,109 - -
- - - 18,426
Proceeds from disposal of group companies - - - 371,041
On acquisition of right to generate hydro power/ ERP system - -
Proceeds from the sale of equity accounted investees 37 460,000 - - -
- 23,741 - -
Investments in equity accounted investees - - -
Acquisition through business combinations 37 - -
Interest received 9 177,793 155,689 33,077 22,051
Dividends received from equity accounted investees 194,353 18,088 - -
Dividends received from non-group companies 9 6,191 83,613 802 73,876
Net cash used in investing activities
548,446 2,291,371 817,694 762,797

Report Preamble > Hayleys at a Glance > Leadership and Governance > Our Strategy > Management Discussion and Analysis > Our Value Creation Report > Financial Statements
Hayleys PLC | Annual Report 2015-16170
Consolidated Company
For the year ended 31st March Notes 2016 2015 2016 2015
Rs.’000 Rs.’000 Rs.’000 Rs.’000
- -
Recovery of employee share trust loan 148,558 339,703 148,558 339,703
Dividend paid to non-controlling interest - -
Proceeds from non-controlling intrest on issue of right in subsidiary - 215,976 - -
Proceeds from interest-bearing borrowings 25 6,799,581 6,260,150 1,442,000 3,000,000
Repayment of interest-bearing borrowings 25
Forward contract liability payment
Debenture redemption - - -
Debenture issue fee - -
Dividends paid to equity holders of parent 13
1,183,954
2,058,092 1,946,751
Cash and cash equivalents at the beginning of the year 548,275
55,507 548,275
Notes from pages 172 to 264 form an integral part of these Financial Statements. Figures in brackets indicate deductions.
Statement of Cash Flows

The World Of Hayleys A World of Care
Annual Report 2015-16 | Hayleys PLC 171
Consolidated Company
For the year ended 31st March Notes 2016 2015 2016 2015
Rs.’000 Rs.’000 Rs.’000 Rs.’000
A. Cash generated from operations
6,816,274 6,399,915 888,895 762,970
Adjustments for:
9 1,931,475 2,135,014 601,438 560,088
18 - -
Depreciation on property, plant & equipment 14 2,514,125 2,433,786 35,370 32,624
Depreciation on investment properties 15 6,076 5,998 - -
Impairment of property, plant & equipment 14 27,405 16,520 - -
Change in fair value of biological assets 16 - -
7/8
- -
- - - -
Scrip dividend - - -
Gain on bargain purchase of subsidiary 7 - - -
Amortisation of intangible assets 8 140,626 120,802 - -
398,280 - -
Impairment of trade & other receivables 22 56,646 - -
21 112,715 - -
Impairment of other non-current assets 20 33,254 42,981 - -
Gain on the disposal of equity accounted investees 7 - - -
28 645,178 813,861 49,536 71,513
Grants amortised 7 - -
Impairment of investments in subsidiaries - - - 75,000
12,175,677 11,678,875 1,573,750 1,401,199
283,942
432
1,013,155
10,616,083 10,482,201 1,815,004 1,042,650
B. Analysis of cash and cash equivalents
Cash in hand and at bank 3,677,286* 3,112,543* 98,559 39,562
Short - term deposits 1,985,845 2,413,781 - 546,292
5,663,131 5,526,324 98,559 585,854
Short-term interest bearing borrowings 31
Cash and cash equivalents 55,507 548,275
* Includes discontinued operations.
Report Preamble > Hayleys at a Glance > Leadership and Governance > Our Strategy > Management Discussion and Analysis > Our Value Creation Report > Financial Statements
Hayleys PLC | Annual Report 2015-16172
Notes to the Financial Statements
1. Corporate Information
1.1 Reporting Entity
are given on page 288.
1.2 Consolidated Financial Statements
for the year ended 31st March 2016 encompasses the Company,
1.3 Nature of Operations and Principal Activities of the Company and the Group
Descriptions of the nature of operations and principal activities of
the Company, its Subsidiaries and Equity Accounted Investees
are given on page 288 and on pages 275 to 277. There were no
1.4 Approval of Financial Statements
2016 were authorised for issue by the Directors on 20th May
2016.
1.5 Responsibility for Financial Statements The responsibility of the Directors in relation to the Financial
Statements is set out in the Statement of Directors’ Responsibility
Report in the Annual Report.
2. Basis of Preparation
2.1. Statement of Compliance The Consolidated Financial Statements have been prepared
Standards Act No. 15 of 1995, which requires compliance with
requirements of the Companies Act No. 07 of 2007.
2.2 Basis of Measurement The Consolidated Financial Statements have been prepared on
the historical cost basis, except for;
•
which are measured at cost at the time of the acquisition and
subsequently carried at fair value
•
loss which are measured at fair value.
•
assets which are measured at fair value.
• Consumable biological assets which are measured at fair
value
succeeding notes.
Consolidated Financial Statements.
2.3. Functional and Presentation Currency
Subsidiaries whose functional currencies are different as they
34.
indicated.
2.4 Materiality and Aggregation Each material class of similar items is presented separately in the
Consolidated Financial Statements. Items of a dissimilar nature or
function are presented separately unless they are immaterial.
3 Basis of Consolidation Subsidiaries and Equity accounted investees are disclosed in Note
18 to the Financial Statements.
3.1 Subsidiaries Subsidiaries are those entities controlled by the Group. Control
is achieved when the Group is exposed, or rights to variable
returns from its involvement with the investee and when it has the

The World Of Hayleys A World of Care
Annual Report 2015-16 | Hayleys PLC 173
ability to affect those returns through its power over the investee.
Group has:
•
• Exposure, or rights, to variable returns from its involvement
with the investee
• The ability to use its power over the investee to affect its
returns
Generally, there is a presumption that a majority of voting rights
results in control. To support this presumption and when the
Group has less than a a majority of the voting or similar rights
of an investee, the Group considers all relevant facts and
circumstances in assessing whether it has the power over an
investee.
•
the investee.
• Rights arising from other contractual arrangements
• The Group’s voting rights and potential voting right.
The Group re-assesses whether or not it controls an investee
if facts and circumstances indicate that there are changes to
one or more of the three elements of control. Consolidation of
a subsidiary begins when the Group obtains control over the
subsidiary and ceases when the Group loses control of the
subsidiary. Assets, liabilities, income and expenses of a subsidiary
acquired or disposed of during the year are included in the
Consolidated Financial Statements from the date the Group gains
control until the date the Group ceases to control the subsidiary.
statements of subsidiaries to bring their accounting policies into
line with the Group’s accounting policies.
A change in the ownership interest of a subsidiary, without a loss
of control, is accounted for as an equity transaction.
If the Group loses control over a subsidiary, it derecognises the
interest and other components of equity while any resultant gain
investment retained is recognised at fair value.
3.1.1 Business combination and goodwill
Business combinations are accounted for using the acquisition
method. The cost of an acquisition is measured as the aggregate
of the consideration transferred, measured at acquisition date
fair value and the amount of any non-controlling interest in the
acquiree. For each business combination, the Group elects
whether to measures the non-controlling interest in the acquire
either at fair value or at the proportionate share of the acquiree’s
Transaction costs, other than those associated with the issue
of debt or equity securities that the Group incurs in connection
with a business combinations are expensed and included in
administrative expenses.
designation in accordance with the contractual terms, economic
circumstances and pertinent conditions as at the acquisition date.
This includes the separation of embedded derivatives in host
contracts by the acquire.
If the business combination is achieved in stages, any previously held
equity interest is remeasured at its acquisition date fair value and any
Any contingent consideration to be transferred by the acquirer will
be recognised at fair value at the acquisition date. Subsequent
changes in the fair value of the contingent consideration
which is deemed to be an asset or liability, will be recognised
Subsequent settlement is accounted for within equity. In instances
where the contingent consideration does not fall within the scope
aggregate of the consideration transferred and the amount
assumed. If the fair value of the net assets acquired is in excess
of the aggregate consideration transferred, the Group re-assesses
all of the liabilities assumed and reviews the procedures used to
Report Preamble > Hayleys at a Glance > Leadership and Governance > Our Strategy > Management Discussion and Analysis > Our Value Creation Report > Financial Statements
Hayleys PLC | Annual Report 2015-16174
Notes to the Financial Statements
measure the amounts to be recognised at the acquisition date. If
the reassessment still results in an excess of the fair value of net
assets acquired over the aggregate consideration transferred,
After initial recognition, goodwill is measured at cost less any
accumulated impairment losses. For the purpose of impairment
testing, goodwill acquired in a business combination is, from the
acquisition date, allocated to each of the Group’s cash-generating
irrespective of whether other assets or liabilities of the acquiree are
assigned to those units.
Where goodwill has been allocated to a cash-generating unit
the goodwill associated with the disposed operation is included in
the carrying amount of the operation when determining the gain
or loss on disposal. Goodwill disposed of in this circumstance is
measured based on the relative values of the disposed operation
and the portion the cash- generating unit retained.
3.1.2 Non - controlling interests
Income are attributed to equity holders of the parent of the Group
and to the non-controlling interests, even if this results in the non-
3.1.3 Equity accounted investees (Investment in associates and joint ventures)
control or joint control over those policies.
A joint venture is a type of joint arrangement whereby the parties
that have joint control of the arrangement have rights to the net
assets of the joint venture. Joint control is the contractually agreed
sharing of control of an arrangement, which exists only when
decisions about the relevant activities require unanimous consent
of the parties sharing control.
joint control is similar to those necessary to determine control over
subsidiaries.
The Group’s investments in its associates and joint venture are
accounted for using the equity method.
Under the equity method, the investment in an associate or a joint
venture is initially recognised at cost. The carrying amount of the
investment is adjusted to recognise changes in the Group’s share
of net assets of the associate or joint venture since the acquisition
date. Goodwill relating to the associate or joint venture is included
in the carrying amount of the investment and is not tested for
impairment separately.
the results of operations of the associate or joint venture. Any
change in Other Comprehensive Income of those investees is
presented as part of the Group’s Other Comprehensive Income.
In addition, when there has been a change recognised directly in
the equity of the associate or joint venture, the Group recognises
its share of any changes, when applicable, in the Statement of
Changes in Equity. Unrealised gains and losses resulting from
transactions between the Group and the associate or joint venture
are eliminated to the extent of the interest in the associate or joint
venture.
associate and a joint venture is shown on the face of the
subsidiaries of the associate or joint venture.
The Financial Statements of the associate or joint venture are
prepared for the same reporting period as the Group. When
necessary, adjustments are made to bring the accounting policies
in line with those of the Group.
After application of the equity method, the Group determines
whether it is necessary to recognise an impairment loss on its
investment in its associate or joint venture. At each reporting date,
the Group determines whether there is objective evidence that the
investment in the associate or joint venture is impaired. If there is
such evidence, the Group calculates the amount of impairment as
the difference between the recoverable amount of the associate or
joint venture and its carrying value, and then recognises the loss
control over the joint venture, the Group measures and recognises
any retained investment at its fair value. Any difference between
the carrying amount of the associate or joint venture upon loss
retained investment and proceeds from disposal is recognised in

The World Of Hayleys A World of Care
Annual Report 2015-16 | Hayleys PLC 175
3.1.4 Transactions eliminated on consolidation
All intra-group assets and liabilities, equity, income, expenses
Group are eliminated in full on consolidation.
Unrealised gains arising from transactions with equity accounted
investees are eliminated against the investment to the extent
of the Group’s interest in the investee. Unrealised losses are
eliminated in the same way as unrealised gains, but only to the
extent that there is no evidence of impairment.
3.1.5 Foreign currency
3.1.5.1 Foreign currency transactions
Transactions in foreign currencies are translated to the respective
functional currencies of Group entities at exchange rates
applicable on the dates of the transaction.
Monetary assets and liabilities denominated in foreign currencies
at the reporting date are retranslated at the functional currency
spot rate of exchange ruling at the reporting date. Foreign
currency differences arising on retranslation are recognised in the
terms of historical cost in a foreign currency are translated at the
exchange rate that prevailed at the date of the initial transaction.
Non-monetary items measured at fair value in a foreign currency
are translated using the exchange rates at the date when the
fair value is determined. The gain or loss arising on retranslation
of non-monetary items is treated in line with the recognition of
differences on items whose fair value gain or loss is recognised in
3.1.5.2 Foreign operations
• assets and liabilities of foreign operations, including goodwill
and fair value adjustments arising on the acquisition are
prevailing at the reporting date;
• Income and expenses are translated at the average exchange
rates for the period.
The exchange differences arising on translation for Consolidation
are recognised in Other Comprehensive Income. When a foreign
operation is disposed of, the relevant amount in the translation
of a subsidiary that includes a foreign operation, the relevant
proportion of such cumulative amount is reattributed to non-
controlling interest. In any other partial disposal of a foreign
Any goodwill arising on the acquisition of a foreign operation
and any fair value adjustments to the carrying amounts of assets
and liabilities arising on the acquisition are treated as assets and
liabilities of the foreign operation.
3.1.6 Consolidation of subsidiaries with different accounting periods
The Financial Statements of all subsidiaries in the Group other
than those mentioned in Note 36 to the Financial Statements are
the same date as the Financial Statements of the parent.
information then the parent uses the most recent Financial
Statements of the subsidiaries and it’s adjusted for the effects of
of those Financial Statements and the date of the Consolidated
Financial Statements. The difference between the date of the
subsidiary’s Financial Statements and that of the Consolidated
Financial Statements will not be more than three months.
3.1.7 Current versus non-current classification
The Group presents assets and liabilities in the Statement of
asset is current when it is:
• Expected to be realised or intended to sold or consumed in a
normal operating cycle
• Held primarily for the purpose of trading
• Expected to be realised within twelve months after the
reporting period, or
• Cash or cash equivalent unless restricted from being
exchanged or used to settle a liability for at least twelve
months after the reporting period

Report Preamble > Hayleys at a Glance > Leadership and Governance > Our Strategy > Management Discussion and Analysis > Our Value Creation Report > Financial Statements
Hayleys PLC | Annual Report 2015-16176
A liability is current when:
• It is expected to be settled in a normal operating cycle
• It is held primarily for the purpose of trading
• It is due to be settled within twelve months after the reporting
period, or
• There is no unconditional right to defer the settlement of the
liability for at least twelve months after the reporting period
assets and liabilities.
3.1.8 Fair value measurement
or where fair values are disclosed are summarised in the following
notes:
•
assumptions Note 19
• Quantitative disclosures of fair value measurement hierarchy
Note 19
•
•
Fair value is the price that would be received to sell an asset or
paid to transfer a liability in an orderly transaction between market
participants at the measurement date. The fair value measurement
is based on the presumption that the transaction to sell the asset
or transfer the liability takes place either:
• In the principal market for the asset or liability, or
• In the absence of a principal market, in the most
advantageous market for the asset or liability
The principal or the most advantageous market must be
accessible by the Group.
The fair value of an asset or a liability is measured using the
assumptions that market participants would use when pricing
the asset or liability, assuming that market participants act in their
economic best interest.
account a market participant’s ability to generate economic
it to another market participant that would use the asset in its
highest and best use.
The Group uses valuation techniques that are appropriate in
measure fair value, maximising the use of relevant observable
inputs and minimising the use of unobservable inputs.
All assets and liabilities for which fair value is measured or
value hierarchy, described as follows, based on the lowest level
•
markets for identical assets or liabilities
•
directly or indirectly observable
•
unobservable
For assets and liabilities that are recognised in the Financial
Statements at fair value on a recurring basis, the Group
determines whether transfers have occurred between levels in
For the purpose of fair value disclosures, the Group has
determined classes of assets and liabilities on the basis of the
nature, characteristics and risks of the asset or liability and the
level of the fair value hierarchy as explained above.
3.2 Assets and Bases of Their Valuation
3.2.1 Property, plant & equipment
and Equipment’ in accounting for its owned assets which are held
Notes to the Financial Statements
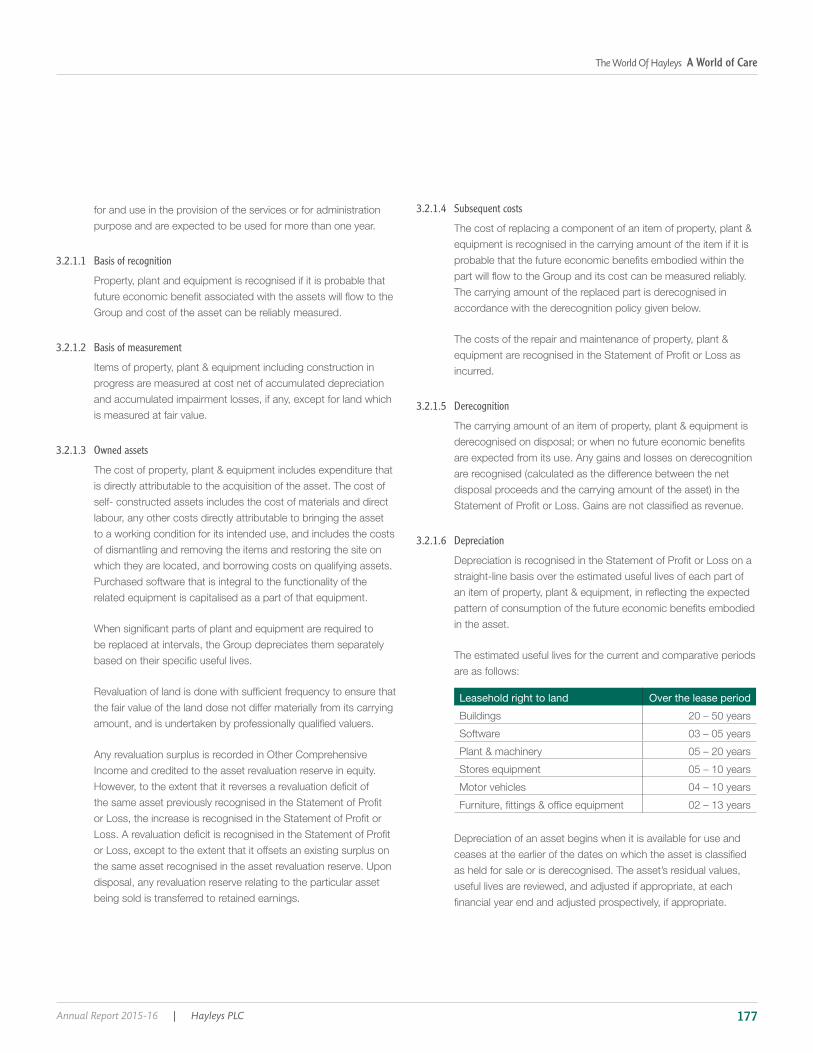
The World Of Hayleys A World of Care
Annual Report 2015-16 | Hayleys PLC 177
for and use in the provision of the services or for administration
purpose and are expected to be used for more than one year.
3.2.1.1 Basis of recognition
Property, plant and equipment is recognised if it is probable that
Group and cost of the asset can be reliably measured.
3.2.1.2 Basis of measurement
Items of property, plant & equipment including construction in
progress are measured at cost net of accumulated depreciation
and accumulated impairment losses, if any, except for land which
is measured at fair value.
3.2.1.3 Owned assets
The cost of property, plant & equipment includes expenditure that
is directly attributable to the acquisition of the asset. The cost of
self- constructed assets includes the cost of materials and direct
labour, any other costs directly attributable to bringing the asset
to a working condition for its intended use, and includes the costs
of dismantling and removing the items and restoring the site on
which they are located, and borrowing costs on qualifying assets.
Purchased software that is integral to the functionality of the
related equipment is capitalised as a part of that equipment.
be replaced at intervals, the Group depreciates them separately
the fair value of the land dose not differ materially from its carrying
Any revaluation surplus is recorded in Other Comprehensive
Income and credited to the asset revaluation reserve in equity.
the same asset recognised in the asset revaluation reserve. Upon
disposal, any revaluation reserve relating to the particular asset
being sold is transferred to retained earnings.
3.2.1.4 Subsequent costs
The cost of replacing a component of an item of property, plant &
equipment is recognised in the carrying amount of the item if it is
The carrying amount of the replaced part is derecognised in
accordance with the derecognition policy given below.
The costs of the repair and maintenance of property, plant &
incurred.
3.2.1.5 Derecognition
The carrying amount of an item of property, plant & equipment is
are expected from its use. Any gains and losses on derecognition
3.2.1.6 Depreciation
straight-line basis over the estimated useful lives of each part of
in the asset.
The estimated useful lives for the current and comparative periods
are as follows:
Leasehold right to land Over the lease period Buildings 20 – 50 years
Software 03 – 05 years
Plant & machinery 05 – 20 years
Stores equipment 05 – 10 years
Motor vehicles 04 – 10 years
02 – 13 years
Depreciation of an asset begins when it is available for use and
as held for sale or is derecognised. The asset’s residual values,
useful lives are reviewed, and adjusted if appropriate, at each

Report Preamble > Hayleys at a Glance > Leadership and Governance > Our Strategy > Management Discussion and Analysis > Our Value Creation Report > Financial Statements
Hayleys PLC | Annual Report 2015-16178
3.2.1.7 Leased assets
a lease is based on the substance of the arrangement at the
inception of the lease. The arrangement is, or contains, a lease if
asset or assets and the arrangement conveys a right to use the
3.2.1.8 Group as a lessee
operating lease. A lease that transfers substantially all the risks
Finance leases are capitalised at the commencement of the
lease at the fair value of the leased property or, if lower, at the
lease liability so as to achieve a constant rate of interest on the
remaining balance of the liability. Finance charges are recognised
A leased asset is depreciated over the useful life of the asset.
However, if there is no reasonable certainty that the Group
will obtain ownership by the end of the lease term, the asset
is depreciated over the shorter of the estimated useful life of
the asset and the lease term. Operating lease payments are
3.2.1.9 Group as a lessor for operating leases
operating leases. Initial direct costs incurred in negotiating an
operating lease are added to the carrying amount of the leased
asset and recognised over the lease term on the same basis as
rental income. Contingent rents are recognised as revenue in the
period in which they are earned.
3.2.2 Investment property
Investment property is property held either to earn rental income
or for capital appreciation or both, but not for sale in the ordinary
course of business, use in the production or supply of goods or
services or for administrative purposes.
Investment property is measured at its cost less accumulated
depreciation and accumulated impairment losses, if any. Cost
includes expenditure that is directly attributable to the acquisition
of the investment property. The cost of self- constructed
investment property includes the cost of materials and direct
labour, any other costs directly attributable to bringing the
investment property to a working condition for their intended use
and capitalised borrowing costs.
Investment properties are derecognised either when they have
been disposed of or when the investment property is permanently
from its disposal. The difference between the net disposal
proceeds and the carrying amount of the asset is recognised in
there is a change in use. Transfers between investment property,
owner- occupied property do not change the carrying amount of
to investment property is transferred at the carrying value, which
would be the deemed cost for subsequent accounting purposes.
3.2.3 Intangible assets
3.2.3.1 Basis of recognition
An Intangible asset is recognised if it is probable that future
and cost of the asset can be reliably measured.
3.2.3.2 Basis of measurement
Intangible assets acquired separately are measured on initial
recognition at cost. The costs of intangible assets acquired
in a business combination are their fair value as at the date
of acquisition.Following initial recognition, intangible assets
are carried at cost less any accumulated amortisation and
accumulated impairment losses.Internally generated intangible
assets, excluding capitalised development costs, are not
3.2.3.3 Useful economic lives and amortisation
Notes to the Financial Statements

The World Of Hayleys A World of Care
Annual Report 2015-16 | Hayleys PLC 179
economic life and assessed for impairment whenever there
is an indication that the intangible asset may be impaired.
The amortisation period and the amortisation method for an
end of each reporting period. Changes in the expected useful
life or the expected pattern of consumption of future economic
amortisation period or method, as appropriate, and are treated as
changes in accounting estimates. The amortisation expense on
of the intangible assets.
but are tested for impairment annually, either individually or at the
continues to be supportable. If not, the change in useful life from
3.2.3.4 De-recognition of intangible assets
Intangible assets are de-recognised on disposal or when no future
arising from de-recognition of an intangible asset are measured as
the difference between the net disposal proceeds and the carrying
3.2.3.5 Leasehold rights
In respect of operating leases acquired under a business
combination where the Group is lessee, Group determines
whether the terms of each operating lease are favourable or
unfavourable relative to market terms. The Group recognises an
intangible asset if the terms of an operating lease are favourable
relative to market terms and a liability if the terms are unfavourable
favourable lease terms.
3.2.3.6 Research and development
Research costs are expensed as incurred. Development
expenditures on an individual project are recognised as an
intangible asset when the Group can demonstrate:
• The technical feasibility of completing the intangible asset so
that it will be available for use or sale
• Its intention to complete and its ability to use or sell the asset
•
• The availability of resources to complete the asset
• The ability to measure reliably the expenditure during
development
Following initial recognition of the development expenditure
as an asset, the asset is carried at cost less any accumulated
amortisation and accumulated impairment losses. Amortisation
of the asset begins when development is complete and the asset
is available for use. It is amortised over the period of expected
period of development, the asset is tested for impairment annually
if there are indicators of impairment.
3.2.3.7 Brand name
Brands acquired as part of a business combination, are
useful life, are reviewed for impairment, annually or more frequently
if events or changes in circumstances indicate that the carrying
value may be impaired.
3.2.3.8 Customer list
The present value of the income anticipated deriving from repeat
customer lists of travel agents as at the acquisition date is
recognised as an intangible asset based on a valuation carried out
by an independent valuer. Subsequent to initial recognition, the
intangible asset is carried at cost less accumulated amortisation
and accumulated impairment losses. Customer list recognised
at the acquisition date will be amortised over the period over
which income is anticipated to derive from repeat customers
and reviewed annually for any impairment in value if there are
indicators of impairment.
3.2.3.9 Other intangible assets
Other intangible assets that are acquired by the Group, which
amortisation and accumulated impairment losses.
3.2.3.10 Subsequent expenditure
Subsequent expenditure is capitalised only when it increases the
Report Preamble > Hayleys at a Glance > Leadership and Governance > Our Strategy > Management Discussion and Analysis > Our Value Creation Report > Financial Statements
Hayleys PLC | Annual Report 2015-16180
it relates. All other expenditure, including expenditure on internally
incurred.
3.2.3.11 Amortisation
over the estimated useful lives of intangible assets, other than
goodwill and brand name, from the date on which they are available
for use. The estimated useful lives for the current and comparative
periods are as follows:
• Right to generate hydro power - 15- 20 years
•
• ERP Systems - 5-10 years
•
3.3 Financial instruments
another entity.
3.3.1 Financial assets
3.3.1.1 Initial recognition and measurement
and receivables, held-to-maturity investments, available-for-
instruments in an effective hedge, as appropriate. The Group
recognition.
loss, transaction costs that are attributable to the acquisition of
assets within a time frame established by regulation or convention
trade date, i.e., the date that the Group commits to purchase or
sell the asset.
deposits, trade and other receivables, loans and other receivables,
amounts due from subsidiaries, amounts due from equity
3.3.1.2 Subsequent measurement
• Held-to-maturity investments
Financial assets at fair value through profit or loss
purpose of selling or repurchasing in the near term. Derivatives,
held for trading unless they are designated as effective hedging
position at fair value with net changes in fair value recognised in
Financial assets designated upon initial recognition at fair value
than derivatives, to determine whether the intention to sell them
in the near term is still appropriate. When in rare circumstances
inactive markets and management’s intention to sell them in the
receivables, available-for-sale or held to maturity depends on the
fair value option at designation, these instruments cannot be
Notes to the Financial Statements

The World Of Hayleys A World of Care
Annual Report 2015-16 | Hayleys PLC 181
Derivatives embedded in host contracts are accounted for as
separate derivatives and recorded at fair value if their economic
characteristics and risks are not closely related to those of the
host contracts and the host contracts are not held for trading or
derivatives are measured at fair value with changes in fair value
only occurs if there is a change in the terms of the contract that
required.
Loans and receivables
subsequently measured at amortised cost using the effective
is calculated by taking into account any discount or premium
on acquisition and fees or costs that are an integral part of the
for loans and in other expenses for receivables.
Held-to-maturity investments
when the Group has the positive intention and ability to hold them
to maturity. After initial measurement, held-to-maturity investments
are measured at amortised cost using the effective interest rate,
less impairment.
Amortised cost is calculated by taking into account any discount
or premium on acquisition and fees or costs that are an integral
Available-for-sale financial assets
that may be sold in response to needs for liquidity or in response to
changes in the market conditions.
are subsequently measured at fair value with unrealised gains
or losses recognised as other comprehensive income in the
available-for-sale reserve until the investment is derecognised,
at which time the cumulative gain or loss is recognised in other
operating income, or the investment is determined to be impaired,
is reported as interest income using the effective interest rate
method.
The Group evaluates whether the ability and intention to sell
appropriate. When, in rare circumstances, the Group is unable
foreseeable future, the Group may elect to reclassify these
hold these assets for the foreseeable future or until maturity.
new amortised cost and any previous gain or loss on the asset
that has been recognised in equity is amortised to the Statement
the EIR. Any difference between the new amortised cost and the
maturity amount is also amortised over the remaining life of the
asset using the effective interest rate. If the asset is subsequently
determined to be impaired, then the amount recorded in equity is
3.3.1.3 Derecognition
•
Or
•
the asset or has assumed an obligation to pay the received

Report Preamble > Hayleys at a Glance > Leadership and Governance > Our Strategy > Management Discussion and Analysis > Our Value Creation Report > Financial Statements
Hayleys PLC | Annual Report 2015-16182
has transferred substantially all the risks and rewards of the
substantially all the risks and rewards of the asset, but has
transferred control of the asset.
from an asset or has entered into a pass-through arrangement,
it evaluates if and to what extent it has retained the risks and
rewards of ownership. When it has neither transferred nor
retained substantially all of the risks and rewards of the asset,
nor transferred control of the asset, the asset is recognised to
the extent of the Group’s continuing involvement in the asset. In
that case, the Group also recognises an associated liability. The
transferred asset and the associated liability are measured on a
retained.
Continuing involvement that takes the form of a guarantee over
the transferred asset is measured at the lower of the original
carrying amount of the asset and the maximum amount of
consideration that the Group could be required to repay.
3.3.1.4 Impairment of financial assets
The Group assesses, at each reporting date, whether there is any
assets is impaired. An impairment exists is one or more events
can be reliably estimated. Evidence of impairment may include
indications that the debtors or a group of debtors is experiencing
principal payments, the probability that they will enter bankruptcy
that there is a measurable decrease in the estimated future cash
correlate with defaults.
3.3.1.4.1 Financial assets carried at amortised cost
assesses whether objective evidence of impairment exists
If the Group determines that no objective evidence of impairment
assets with similar credit risk characteristics and collectively
assesses them for impairment. Assets that are individually
assessed for impairment and for which an impairment loss is,
or continues to be, recognised are not included in a collective
assessment of impairment.
difference between the asset’s carrying amount and the present
asset’s original effective interest rate. If a loan has a variable
interest rate, the discount rate for measuring any impairment loss
is the current EIR.
The carrying amount of the asset is reduced through the use of
an allowance account and the amount of the loss is recognised
to be accrued on the reduced carrying amount and is accrued
for the purpose of measuring the impairment loss. The interest
written off when there is no realistic prospect of future recovery
and all collateral has been realised or has been transferred to
the Group. If, in a subsequent year, the amount of the estimated
impairment loss increases or decreases because of an event
occurring after the impairment was recognised, the previously
recognised impairment loss is increased or reduced by adjusting
the allowance account. If a future write-off is later recovered, the
3.3.1.4.2 Available-for-sale financial assets
each reporting date whether there is objective evidence that an
investment or a group of investments is impaired.
decline in the fair value of the investment below its cost.
and ‘prolonged’ against the period in which the fair value has been
below its original cost. When there is evidence of impairment,
the cumulative loss – measured as the difference between the
acquisition cost and the current fair value, less any impairment
Notes to the Financial Statements

The World Of Hayleys A World of Care
Annual Report 2015-16 | Hayleys PLC 183
loss on that investment previously recognised in the Statement
losses on equity investments are not reversed through the
impairment are recognised directly in other comprehensive
income.
judgment. In making this judgment, the Group evaluates among
other factors, the duration or extent to which the fair value of the
investment is less than its cost.
3.3.2 Financial liabilities
3.3.2.1 Initial recognition and measurement
payables or as derivatives designated as hedging instruments in
an effective hedge, as appropriate.
case of loans and borrowings and payables, directly attributable
transaction costs.
contracts, amounts due to equity accounted investees and
3.3.2.2 Subsequent measurement
Financial liabilities at fair value through profit or loss
incurred for the purpose of repurchasing in the near term. This
by the Group that are not designated as hedging instruments in
designated as effective hedging instruments. Gains or losses on
Financial liabilities designated upon initial recognition at fair
or loss.
Loans and borrowings
After initial recognition, interest bearing loans and borrowings are
subsequently measured at amortised cost using the EIR method.
when the liabilities are derecognised as well as through the EIR
amortisation process.
Amortised cost is calculated by taking into account any discount
or premium on acquisition and fees or costs that are an integral
Financial guarantee contracts
Financial guarantee contracts issued by the Group are those
contracts that require a payment to be made to reimburse the
make a payment when due in accordance with the terms of a
initially as a liability at fair value, adjusted for transaction costs
that are directly attributable to the issuance of the guarantee.
Subsequently, the liability is measured at the higher of the
best estimate of the expenditure required to settle the present
obligation at the reporting date and the amount recognised less
cumulative amortisation.
3.3.2.3 Derecognition
liability is discharged or cancelled or expires. When an existing
substantially different terms, or the terms of an existing liability are
as the derecognition of the original liability and the recognition of
a new liability. The difference in the respective carrying amounts is
3.3.3 Offsetting of financial instruments
amount reported in the Statement of Financial Position if, and
only if:
Report Preamble > Hayleys at a Glance > Leadership and Governance > Our Strategy > Management Discussion and Analysis > Our Value Creation Report > Financial Statements
Hayleys PLC | Annual Report 2015-16184
• There is a currently enforceable legal right to offset the
recognised amounts And
• There is an intention to settle on a net basis, or to realise the
assets and settle the liabilities simultaneously
3.3.4 Derivative financial instruments
3.3.4.1 Initial recognition and subsequent measurement
currency contracts, to hedge its foreign currency risks. Such
on the date on which a derivative contract is entered into and
are subsequently remeasured at fair value. Derivatives are carried
liabilities when the fair value is negative.
Any gains or losses arising from changes in the fair value of
3.3.5 Fair value of financial instruments
at each reporting date is determined by reference to quoted market
value is determined using appropriate valuation techniques. Such
techniques may include:
• Using recent arm’s length market transactions
• Reference to the current fair value of another instrument that
is substantially the same
•
details as to how they are measured are provided in Note 19 to
the Financial Statements.
3.3.6 Non-current assets held for sale
Non-current assets, or disposal groups comprising assets and
liabilities, that are expected to be recovered primarily through sale
components of a disposal group, are remeasured in accordance
with the Group’s accounting policies. Thereafter generally the
assets, or disposal group, are measured at the lower of their
carrying amount and fair value less cost to sell. Any impairment
to remaining assets and liabilities on pro rata basis, except that
biological assets, which continue to be measured in accordance
with the Group’s accounting policies. Impairment losses on initial
recognised in excess of any cumulative impairment loss.
3.3.7 Inventories
Inventories are measured at the lower of cost and net realisable
value.
Costs incurred in bringing each product to its present location and
condition are accounted for as follows:
• All inventory items, except manufactured inventories and
work-in-progress are measured at weighted average directly
attributable cost.
• Manufactured inventories and work- in-progress are
measured at weighted average factory cost which includes
all direct expenditure and appropriate share of production
overhead based on normal operating capacity but excluding
borrowing costs.
Net realisable value is the estimated selling price in the ordinary
course of business less, the estimated cost of completion and the
estimated costs necessary to make the sale.
3.3.8 Impairment of non- financial assets
The Group assesses, at each reporting date, whether there is an
indication that an asset may be impaired. If any indication exists,
or when annual impairment testing for an asset is required, the
Group estimates the asset’s recoverable amount. An asset’s
recoverable amount is the higher of an asset’s or CGU’s fair
value less costs of disposal and its value in use. The recoverable
amount is determined for an individual asset, unless the asset
those from other assets or groups of assets. When the carrying
amount of an asset or CGU exceeds its recoverable amount,
the asset is considered impaired and is written down to its
recoverable amount.
Notes to the Financial Statements
The World Of Hayleys A World of Care
Annual Report 2015-16 | Hayleys PLC 185
discounted to their present value using a pre-tax discount rate
less costs of disposal, recent market transactions are taken into
valuation model is used. These calculations are corroborated
by valuation multiples, quoted share prices for publicly traded
companies or other available fair value indicators.
The Group bases its impairment calculation on detailed budgets
and forecast calculations, which are prepared separately for each
of the Group’s CGUs to which the individual assets are allocated.
These budgets and forecast calculations generally cover a period
Impairment losses of continuing operations are recognised in the
the function of the impaired asset, except for properties previously
revalued with the revaluation taken to Other Comprehensive
Income. For such properties, the impairment is recognised in Other
Comprehensive Income up to the amount of any previous revaluation.
For assets excluding goodwill, an assessment is made at each
reporting date to determine whether there is an indication that
previously recognised impairment losses no longer exist or have
decreased. If such indication exists, the Group estimates the
asset’s or CGU’s recoverable amount. A previously recognised
impairment loss is reversed only if there has been a change in the
assumptions used to determine the asset’s recoverable amount
since the last impairment loss was recognised. The reversal
is limited so that the carrying amount of the asset does not
exceed its recoverable amount, nor exceed the carrying amount
that would have been determined, net of depreciation, had no
impairment loss been recognised for the asset in prior years. Such
asset is carried at a revalued amount, in which case, the reversal
is treated as a revaluation increase.
Goodwill is tested for impairment annually as at 31 March and
when circumstances indicate that the carrying value may be
impaired. Impairment is determined for goodwill by assessing the
the goodwill relates. When the recoverable amount of the CGU is
less than its carrying amount, an impairment loss is recognised.
Impairment losses relating to goodwill cannot be reversed in future
periods.
impairment annually as at 31 March at the CGU level, as
appropriate, and when circumstances indicate that the carrying
value may be impaired.
Formers - Provision for impairment
In respect of formers, a 10% provision on the written down value
3.3.9 Cash and cash equivalents
Cash in hand and at bank and short-term deposits in the Statement
of Financial Position comprise cash at banks and on hand and
short-term deposits with a maturity of three months or less, which are
For the purpose of the Statement of Cash Flows, cash and
cash equivalents consist of cash and short-term deposits, as
borrowings as they are considered an integral part of the Group’s
cash management.
3.4 Liabilities and Provisions3.4.1 Employee benefits
3.4.1.1 Defined contribution plans
entity and will have no legal or constructive obligation to pay
further amounts. Obligations for contributions to Provident
and Trust Funds covering all employees are recognised as an
which services are rendered by employees.
The Group contributes 12% and 3% of gross emoluments to employees
as Provident Fund and Trust Fund contribution respectively.
3.4.1.2 Defined benefit plans
Report Preamble > Hayleys at a Glance > Leadership and Governance > Our Strategy > Management Discussion and Analysis > Our Value Creation Report > Financial Statements
Hayleys PLC | Annual Report 2015-16186
will be paid, and that have terms to maturity approximating to
determined on an actuarial basis using a number of assumptions.
obligations.
Provision has been made for retirement gratuities from the beginning
the liability to an employee arises only on completion of 5 years of
continued service.
The liability is not externally funded. This liability is computed on
the following basis:
Up to 20 1/2
20 up to 25 3/4
25 up to 30 1
30 up to 35 1 1/4
Over 35 1 ½
3.4.2 Recognition of actuarial gains or losses
Actuarial gains or losses are recognised in full in the Other
Comprehensive Income.
3.4.3 Short-term benefits
undiscounted basis and are expensed as the related service is
provided.
3.4.4 Provisions
Provisions are recognised when the Group has a present
estimate can be made of the amount of the obligation. When the
Group expects some or all of a provision to be reimbursed, the
reimbursement is recognised as a separate asset, but only when
the reimbursement is virtually certain. The expense relating to any
reimbursement.
If the effect of the time value of money is material, provisions
used, the increase in the provision due to the passage of time is
3.4.5 Warranties
Provisions for warranty-related costs are recognised when
the product is sold or service provided to the customer. Initial
recognition is based on historical experience. The initial estimate
of warranty-related costs is revised annually.
3.4.6 Capital commitments and contingencies
Capital commitments and contingent liabilities of the Group are
disclosed in the Note 32 to the Financial Statements.
3.4.7 Ordinary shares
attributable to the issue of ordinary shares are recognised as a
deduction from equity, net of any tax effects.
3.5 Statement of Profit or Loss
the function of expenses method is adopted.
3.5.1 Revenue
Revenue is recognised to the extent that it is probable that the
reliably measured, regardless of when the payment is received.
Revenue is measured at the fair value of the consideration
terms of payment and excluding taxes or duty. The Group has
concluded that it is the principal in all of its revenue arrangements
since it is the primary obligor in all the revenue arrangements, has
pricing latitude, and is also exposed to inventory and credit risks.
Notes to the Financial Statements

The World Of Hayleys A World of Care
Annual Report 2015-16 | Hayleys PLC 187
Sale of goods
Revenue from the sale of goods is measured at the fair value of the
consideration received or receivable, net of returns and allowances,
trade discounts and volume rebates. Revenue is recognised when
to the buyer, recovery of the consideration is probable, the associated
costs and possible return of goods can be estimated reliably, there
is no continuing management involvement with the goods, and the
amount of revenue can be measured reliably.
Rendering of services
in proportion to the stage of completion of the transaction at the
reporting date.
Hospitality revenue
Room revenue generated by the hospitality sector is recognised on
the rooms occupied on a daily basis. Food and beverage revenue is
recognised at the time of related sale.
Rental income
Dividend
entity’s right to receive payment is established, which in the case of
quoted securities is the ex-dividend date.
Commission
When the Group acts in the capacity of an agent rather than
as the principal in a transaction, the revenue recognised is the
commission earned by the Group.
Grants
Grants are recognised initially as deferred income when there is
a reasonable assurance that they will be received and that the
Group will comply with the conditions associated with the grant.
Grants that compensate the Group for expenses incurred are
in which the expenses are recognised. Grants that compensate
on a systematic basis over the useful life of the asset.
Gains and losses
Gains and losses on disposal of an item of property, plant &
equipment are determined by comparing the net sales proceeds
with the carrying amounts of property, plant & equipment and are
Other income
3.5.2 Expenses
basis of a direct association between the cost incurred and the
running of the business has been charged to income in arriving at the
which the expenditure is incurred.
3.5.2.1 Operating leases
loss on a straight-line basis over the term of the lease.
3.5.2.2 Borrowing costs
which they are incurred, except to the extent that they are directly
attributable to the acquisition, construction or production of a
qualifying asset, in which case they are capitalised as part of the
cost of that asset.
3.5.2.3 Finance income and finance cost
Finance income comprises interest income on funds invested
Finance cost comprise interest expense on borrowings, unwinding

Report Preamble > Hayleys at a Glance > Leadership and Governance > Our Strategy > Management Discussion and Analysis > Our Value Creation Report > Financial Statements
Hayleys PLC | Annual Report 2015-16188
allocated to each period during the lease term so as to produce a
constant periodic rate of interest on the remaining balance of the
liability.
Foreign currency gains and losses are reported on a
net basis.
3.5.3 Tax expense
Tax expense comprises current and deferred tax. Current tax and
except to the extent that it relates to a business combination, or
items recognised directly in Equity or in Other Comprehensive
Income.
3.5.3.1 Current tax
Current income tax assets and liabilities are measured at the
amount expected to be recovered from or paid to the taxation
authorities. The tax rates and tax laws used to compute the
amount are those that are enacted or substantively enacted at
the reporting date in the countries where the Group operates and
generates taxable income.
Current tax relating to items recognised directly in Other
Comprehensive Income is recognised in Other Comprehensive
periodically evaluates positions taken in the tax returns with
respect to situations in which applicable tax regulations are
subject to interpretation and establishes provisions where
appropriate.
3.5.3.2 Deferred tax
Deferred tax is provided using the liability method on temporary
differences between the tax bases of assets and liabilities and
reporting date.
Deferred tax liabilities are recognised for all taxable temporary
differences, except:
• When the deferred tax liability arises from the initial recognition
of goodwill or an asset or liability in a transaction that is not
a business combination and, at the time of the transaction,
• In respect of taxable temporary differences associated with
investments in subsidiaries, equity accounted investee and
interests in joint ventures, when the timing of the reversal
of the temporary differences can be controlled and it is
probable that the temporary differences will not reverse in the
foreseeable future.
Deferred tax assets are recognised for all deductible temporary
differences, the carry forward of unused tax credits and any
unused tax losses. Deferred tax assets are recognised to the
which the deductible temporary differences, and the carry forward
of unused tax credits and unused tax losses can be utilised,
except:
• When the deferred tax asset relating to the deductible
temporary difference arises from the initial recognition of
an asset or liability in a transaction that is not a business
combination and, at the time of the transaction, affects neither
• In respect of deductible temporary differences associated with
investments in subsidiaries, equity accounted investee and
interests in joint ventures, deferred tax assets are recognised
only to the extent that it is probable that the temporary
differences will reverse in the foreseeable future and taxable
can be utilised.
The carrying amount of deferred tax assets is reviewed at each
reporting date and reduced to the extent that it is no longer
all or part of the deferred tax asset to be utilised. Unrecognised
deferred tax assets are reassessed at each reporting date and are
recognised to the extent that it has become probable that future
Deferred tax assets and liabilities are measured at the tax rates
that are expected to apply in the year when the asset is realised or
the liability is settled, based on tax rates that have been enacted
or substantively enacted at the reporting date.
Deferred tax relating to items recognised outside the Statement
underlying transaction either in other comprehensive income or
directly in equity.
Notes to the Financial Statements

The World Of Hayleys A World of Care
Annual Report 2015-16 | Hayleys PLC 189
Deferred tax assets and deferred tax liabilities are offset if a legally
enforceable right exists to set off current tax assets against current
tax liabilities and the deferred taxes relate to the same taxable
entity and the same taxation authority.
not satisfying the criteria for separate recognition at that date,
would be recognised subsequently if new information about facts
and circumstances changed. The adjustment would either be
Tax on dividend income from subsidiaries is recognised as an
same time as the liability to pay the related dividend is recognised.
3.5.3.3 Sales tax
Revenues, expenses and assets are recognised net of the amount
of sales tax, except:
• When the sales tax incurred on a purchase of assets or
services is not recoverable from the taxation authority, in
which case, the sales tax is recognised as part of the cost
of acquisition of the asset or as part of the expense item, as
applicable
• Receivables and payables that are stated with the amount
of sales tax. The net amount of sales tax recoverable from,
or payable to, the taxation authority is included as part of
receivables or payables in the Statement of Financial Position.
4. General
4.1 Events Occurring After the Reporting Date All material post reporting date events have been considered and
where appropriate adjustments or disclosures have been made in
the respective notes to the Financial Statements.
4.2 Earnings Per Share
loss attributable to ordinary shareholders of the Company by the
weighted average number of ordinary shares outstanding during
or loss attributable to ordinary shareholders and the weighted
average number of ordinary shares outstanding for the effects of
all dilutive potential ordinary shares.
4.3 Standards Issued but not yet Effective
accounting requirements. It also carries forward the guidance on
39.
after 1 January 2018, with early adoption permitted.
determining whether, how much and when revenue is recognised.
after 1 January 2018, with early adoption permitted.
Pending the completion of the detailed impact analysis, possible
as of the reporting date.
The following amendments and improvements are not expected
Statements.
• Accounting for Acquisitions of Interests in Joint Operations
•
• Equity Method in Separate Financial Statements
• Sale or Contribution of Assets between an Investor and its
•
standards

Report Preamble > Hayleys at a Glance > Leadership and Governance > Our Strategy > Management Discussion and Analysis > Our Value Creation Report > Financial Statements
Hayleys PLC | Annual Report 2015-16190
• Investment Entities: Applying the Consolidation Exception
•
4.4 Plantations The plantation companies in the Group adopt certain accounting
policies, which differ from that of the rest of the Group, since their
of the Group. The accounting policies adopted are in accordance
biological assets.
the Group are given below.
4.4.1 Property, plant & equipment
4.4.1.1 Permanent land development costs
Permanent land development costs are those costs incurred in
major infrastructure development and building new access roads
on leased lands.The costs have been capitalised and amortised
over the shorter of useful lives or remaining lease periods.
Permanent impairments to land development costs are charged
carrying amounts of such assets in the year of occurrence after
ascertaining the loss.
4.4.1.2 Biological asset
immature biological assets. Mature biological assets are those that
harvests. Immature biological assets are those that have not yet
assets and consumable biological assets. Bearer biological
asset includes tea and rubber trees, those that are not intended
to be sold or harvested, however used to grow for harvesting
agricultural produce from such biological assets. Consumable
biological assets includes managed timber trees those that are to
be harvested as agricultural produce or sold as biological assets.
The main variables in DCF model concerns
Variable Comment
Currency valuation Rs.
Timber content
girth, height and considering the growth
of the each spice in different geographical
regions. Factor all the prevailing statutory
regulations enforced
against harvesting of timber coupled with
forestry plan of the Group
Economic
useful life
Estimated based on the normal life span of
each species by factoring the forestry plan of
the Group
Selling price
market price. Factor all the conditions to
condition
Planting cost Estimated costs for the further development
of immature areas are deducted.
Discount Rate
discount rates: Timber trees 17.5%
the entity controls the assets as a result of past event, it is
be measured reliably.
The bearer biological assets are measured at cost less
accumulated depreciation and accumulated impairment losses, if
The managed timber trees are measured on initial recognition and
at the end of each reporting period at its fair value less cost to sell in
of young plants as the impact on biological transformation of such
plants to price during this period is immaterial. The fair value of timber
trees are measured using DCF method taking in to consideration the
current market prices of timber, applied to expected timber content
of a tree at the maturity by an independent professional valuer. All
Notes to the Financial Statements
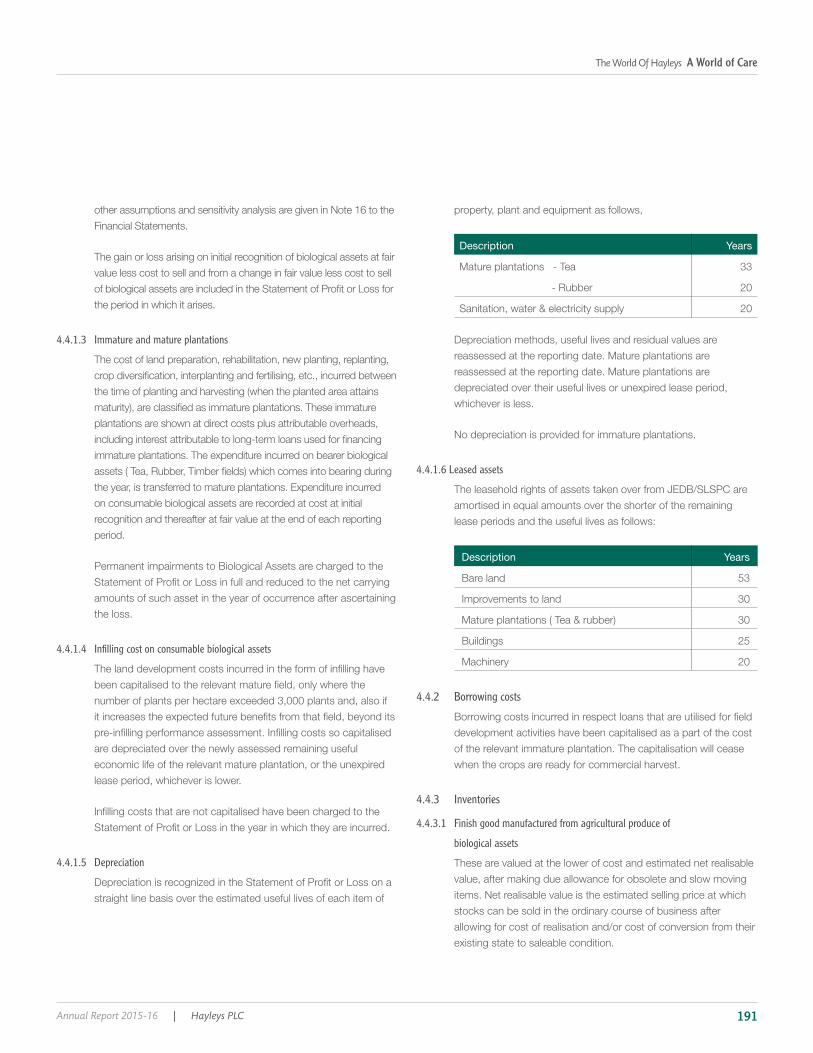
The World Of Hayleys A World of Care
Annual Report 2015-16 | Hayleys PLC 191
other assumptions and sensitivity analysis are given in Note 16 to the
Financial Statements.
The gain or loss arising on initial recognition of biological assets at fair
value less cost to sell and from a change in fair value less cost to sell
the period in which it arises.
4.4.1.3 Immature and mature plantations
The cost of land preparation, rehabilitation, new planting, replanting,
plantations are shown at direct costs plus attributable overheads,
immature plantations. The expenditure incurred on bearer biological
the year, is transferred to mature plantations. Expenditure incurred
on consumable biological assets are recorded at cost at initial
recognition and thereafter at fair value at the end of each reporting
period.
Permanent impairments to Biological Assets are charged to the
amounts of such asset in the year of occurrence after ascertaining
the loss.
4.4.1.4 Infilling cost on consumable biological assets
number of plants per hectare exceeded 3,000 plants and, also if
are depreciated over the newly assessed remaining useful
economic life of the relevant mature plantation, or the unexpired
lease period, whichever is lower.
4.4.1.5 Depreciation
straight line basis over the estimated useful lives of each item of
property, plant and equipment as follows,
Description Years
Mature plantations - Tea 33
- Rubber 20
Sanitation, water & electricity supply 20
Depreciation methods, useful lives and residual values are
reassessed at the reporting date. Mature plantations are
reassessed at the reporting date. Mature plantations are
depreciated over their useful lives or unexpired lease period,
whichever is less.
No depreciation is provided for immature plantations.
4.4.1.6 Leased assets
amortised in equal amounts over the shorter of the remaining
lease periods and the useful lives as follows:
Description Years
Bare land 53
Improvements to land 30
30
Buildings 25
Machinery 20
4.4.2 Borrowing costs
development activities have been capitalised as a part of the cost
of the relevant immature plantation. The capitalisation will cease
when the crops are ready for commercial harvest.
4.4.3 Inventories
4.4.3.1 Finish good manufactured from agricultural produce of
biological assets
These are valued at the lower of cost and estimated net realisable
value, after making due allowance for obsolete and slow moving
items. Net realisable value is the estimated selling price at which
stocks can be sold in the ordinary course of business after
allowing for cost of realisation and/or cost of conversion from their
existing state to saleable condition.
Report Preamble > Hayleys at a Glance > Leadership and Governance > Our Strategy > Management Discussion and Analysis > Our Value Creation Report > Financial Statements
Hayleys PLC | Annual Report 2015-16192
4.4.3.2 Input material, spares and consumables
At actual cost on weighted average basis.
4.4.3.3 Agricultural produce harvested from biological assets
Agricultural produce harvested from its biological assets are
measured at their fair value less cost to sell at the point of harvest.
produce are valued by adding the cost of conversion to the fair
value of the agricultural produce.
4.4.4 Grants and subsidies
Grants and subsidies are recognised at their fair value where there
is a reasonable assurance the grant / subsidy will be received
and all attaching conditions, if any, will be complied with. When
the grant or subsidy relates to an income item is recognised as
income over the periods necessary to match them to the costs to
which it is intended to compensate on a systematic basis.
Grants and subsidies related to assets, including non- monetary
grants at fair value are deducted at arriving at the carrying value of
4.5 Statement of Cash Flows The Statement of Cash Flows has been prepared using the
received, which are related to purchase and construction of
investing activities.
separately in the Company Cash Flow Statement.
4.6 Segment Reporting An operating segment is a component of the Group that engages
in business activities from which it may earn revenues and
incur expenses, including revenues and expenses that relate
to transactions with any of the Group’s other components. All
operating segments’ operating results are reviewed regularly by
the Chairman to make decisions about resources to be allocated
to the segment and assess its performance, and for which
Segment results that are reported to the Chairman include items
directly attributable to a segment as well as those that can be
allocated on a reasonable basis.
Segment capital expenditure is the total cost incurred during the
period to acquire property, plant and equipment, and intangible
assets other than goodwill.
5 Critical Accounting Estimates and Judgements
assumptions that affect the application of accounting policies and
the reported amounts of assets, liabilities, income and expenses.
Judgements and estimates are based on historical experience
and other factors,including expectations that are believed to be
reasonable under the circumstances. Hence actual experience
and results may differ from these judgements and estimates.
Estimates and underlying assumptions are reviewed on an
ongoing basis. Revisions to accounting estimates are recognised
in the period in which the estimates are revised if the revision
affects only that period and any future periods.
critical judgements in applying accounting policies that have the
statements is included in the following notes.
5.1 Going Concern The Directors have made an assessment of the Group’s
has the resources to continue in business for the foreseeable
future. Furthermore, management is not aware of any material
ability to continue as a going concern. Therefore, the Financial
Statements continue to be prepared on the going concern basis.
5.2 Measurement of the Recoverable Amount of Cash-Generating Units Containing Goodwill
The Group tests annually whether goodwill has suffered any
impairment, in accordance with the accounting policy stated in
Note 3.3.8. The basis of determining the recoverable amounts of
cash generating units and key assumptions used are given in Note
17 to the Financial Statements.
Notes to the Financial Statements
The World Of Hayleys A World of Care
Annual Report 2015-16 | Hayleys PLC 193
5.3 Taxation Uncertainties exist with respect to the interpretation of complex
tax regulation, changes in tax laws, and the amount and timing
of future taxable income. Given the wide range of international
business relationships and the long-term nature and the
complexity of existing contractual agreements, differences
arising between the actual results and the assumptions made,
or future changes to such assumptions, could necessitate future
adjustments to tax income and expense already recorded. The
Group establish provisions, based on reasonable estimates, for
possible consequences of audits by the tax authorities of the
respective countries in which it operates. The amount of such
provisions is based on various factors, such as experience of
previous tax audits and differing interpretations of tax regulations
by the taxable entity and the responsible tax authority. Such
differences of interpretation may arise on a wide variety of issues
depending on the conditions prevailing in the respective domicile
of the Group companies.
judgement is required to determine the amount of deferred tax
assets that can be recognised, based on upon the likely timing
planning strategies.
5.4 Measurement of the Employee Benefit Obligations
on a number of factors that are determined on an actuarial
in Note 28 to the Financial Statements. Any changes in these
obligations.
5. 5 Impairment of property, plant and equipment and intangible assets other than goodwill
The impairment analysis is principally based upon discounted
assets. Factors like lower than anticipated sales and resulting
could lead to impairment. Further details are disclosed in Note 14
and 17 to the Financial Statements.
5.6 Revaluation of Land The Group measures lands which are recognised as property,
plant & equipment at revalued amount with change in value being
recognised in the Statement of Other comprehensive income. The
valuer has used valuation techniques such as open market value.
Further details on Revaluation of land are disclosed in Note 14 to
the Financial Statements.
5.7 Fair Valuation of Biological Assets The group measures consumable Biological Assets at fair
value with changes in value being recognised in the statement
of income. Fair valuation involves assumptions which are
uncertainties.
5.8 Consolidation of Entities with the Group Holds 50% of the Voting Rights
Group holds 50% of the issued share capital of Carbokarn Co
consideration of the agreements with partners and the current
operating arrangement.
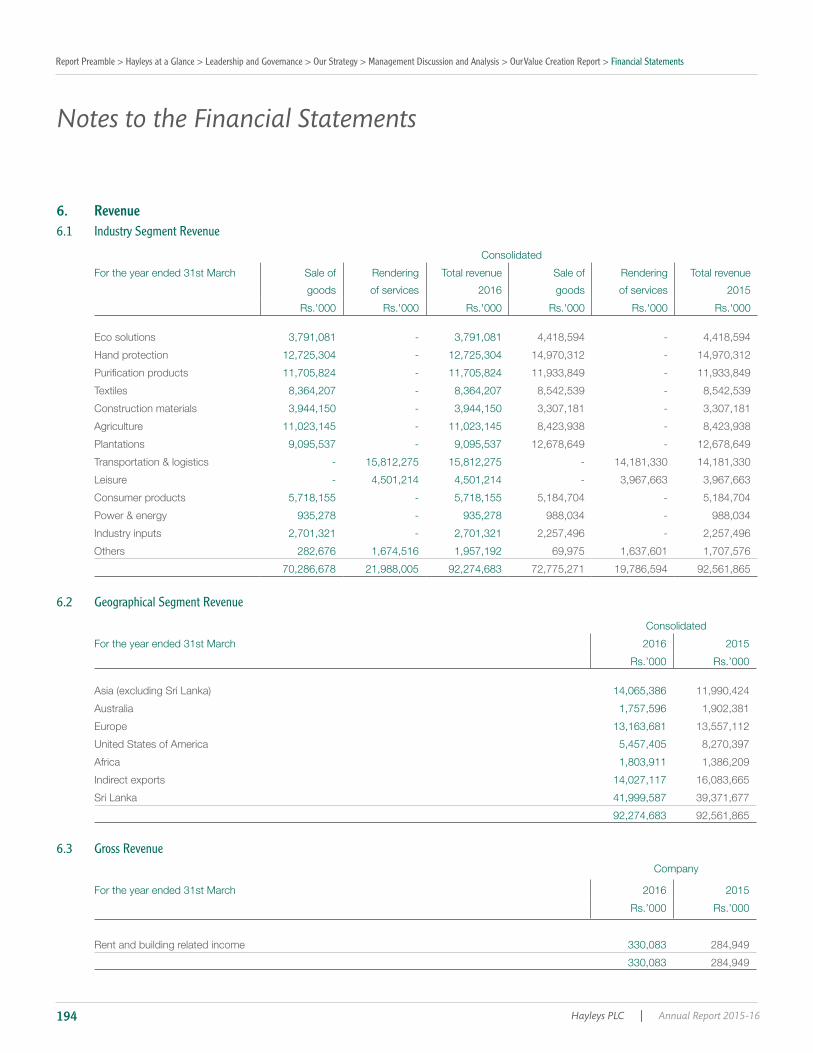
Report Preamble > Hayleys at a Glance > Leadership and Governance > Our Strategy > Management Discussion and Analysis > Our Value Creation Report > Financial Statements
Hayleys PLC | Annual Report 2015-16194
6. Revenue6.1 Industry Segment Revenue
Consolidated
For the year ended 31st March Sale of
goods
Rendering
of services
Total revenue
2016
Sale of
goods
Rendering
of services
Total revenue
2015
Rs.'000 Rs.'000 Rs.'000 Rs.'000 Rs.'000 Rs.'000
Eco solutions 3,791,081 - 3,791,081 4,418,594 - 4,418,594
Hand protection 12,725,304 - 12,725,304 14,970,312 - 14,970,312
11,705,824 - 11,705,824 11,933,849 - 11,933,849
Textiles 8,364,207 - 8,364,207 8,542,539 - 8,542,539
Construction materials 3,944,150 - 3,944,150 3,307,181 - 3,307,181
Agriculture 11,023,145 - 11,023,145 8,423,938 - 8,423,938
Plantations 9,095,537 - 9,095,537 12,678,649 - 12,678,649
Transportation & logistics - 15,812,275 15,812,275 - 14,181,330 14,181,330
- 4,501,214 4,501,214 - 3,967,663 3,967,663
Consumer products 5,718,155 - 5,718,155 5,184,704 - 5,184,704
Power & energy 935,278 - 935,278 988,034 - 988,034
Industry inputs 2,701,321 - 2,701,321 2,257,496 - 2,257,496
Others 282,676 1,674,516 1,957,192 69,975 1,637,601 1,707,576
70,286,678 21,988,005 92,274,683 72,775,271 19,786,594 92,561,865
6.2 Geographical Segment Revenue
Consolidated
For the year ended 31st March 2016 2015
Rs.’000 Rs.’000
14,065,386 11,990,424
Australia 1,757,596 1,902,381
Europe 13,163,681 13,557,112
United States of America 5,457,405 8,270,397
Africa 1,803,911 1,386,209
Indirect exports 14,027,117 16,083,665
41,999,587 39,371,677
92,274,683 92,561,865
6.3 Gross RevenueCompany
For the year ended 31st March 2016 2015
Rs.’000 Rs.’000
Rent and building related income 330,083 284,949
330,083 284,949
Notes to the Financial Statements
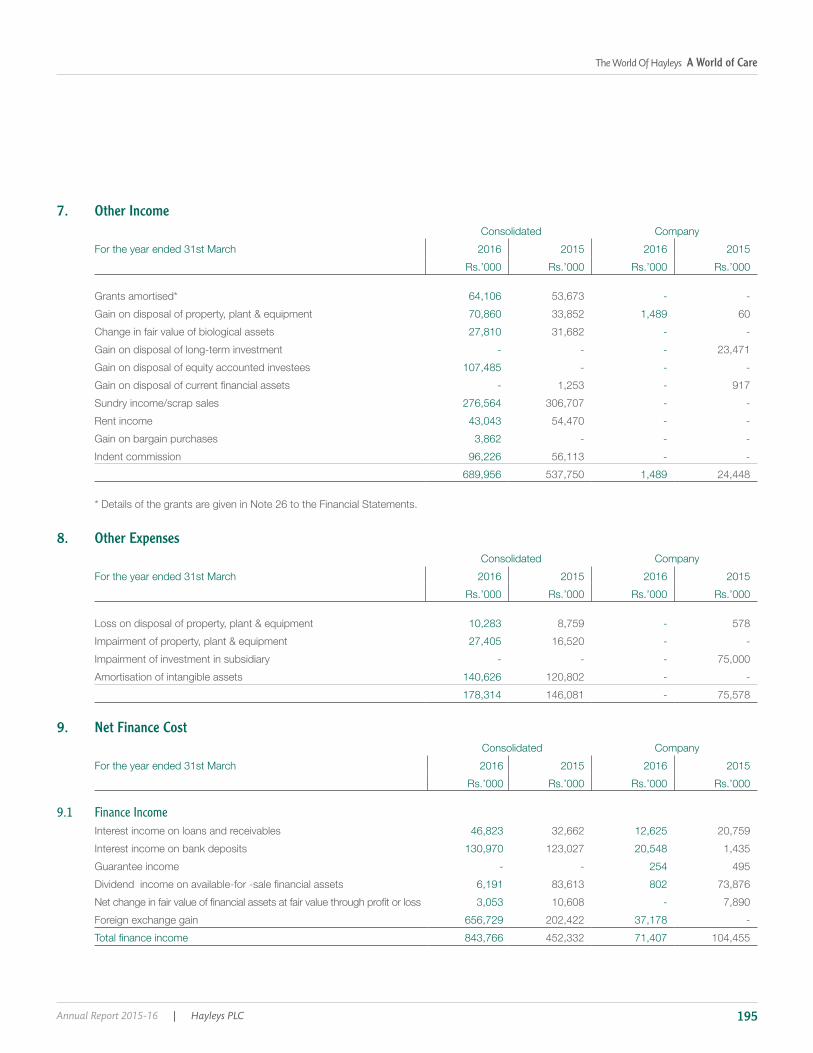
The World Of Hayleys A World of Care
Annual Report 2015-16 | Hayleys PLC 195
7. Other IncomeConsolidated Company
For the year ended 31st March 2016 2015 2016 2015
Rs.’000 Rs.’000 Rs.’000 Rs.’000
Grants amortised* 64,106 53,673 - -
Gain on disposal of property, plant & equipment 70,860 33,852 1,489 60
Change in fair value of biological assets 27,810 31,682 - -
Gain on disposal of long-term investment - - - 23,471
Gain on disposal of equity accounted investees 107,485 - - -
- 1,253 - 917
Sundry income/scrap sales 276,564 306,707 - -
Rent income 43,043 54,470 - -
Gain on bargain purchases 3,862 - - -
Indent commission 96,226 56,113 - -
689,956 537,750 1,489 24,448
* Details of the grants are given in Note 26 to the Financial Statements.
8. Other ExpensesConsolidated Company
For the year ended 31st March 2016 2015 2016 2015
Rs.’000 Rs.’000 Rs.’000 Rs.’000
10,283 8,759 - 578
Impairment of property, plant & equipment 27,405 16,520 - -
Impairment of investment in subsidiary - - - 75,000
Amortisation of intangible assets 140,626 120,802 - -
178,314 146,081 - 75,578
9. Net Finance Cost Consolidated Company
For the year ended 31st March 2016 2015 2016 2015
Rs.’000 Rs.’000 Rs.’000 Rs.’000
9.1 Finance IncomeInterest income on loans and receivables 46,823 32,662 12,625 20,759
Interest income on bank deposits 130,970 123,027 20,548 1,435
Guarantee income - - 254 495
6,191 83,613 802 73,876
3,053 10,608 - 7,890
Foreign exchange gain 656,729 202,422 37,178 -
843,766 452,332 71,407 104,455
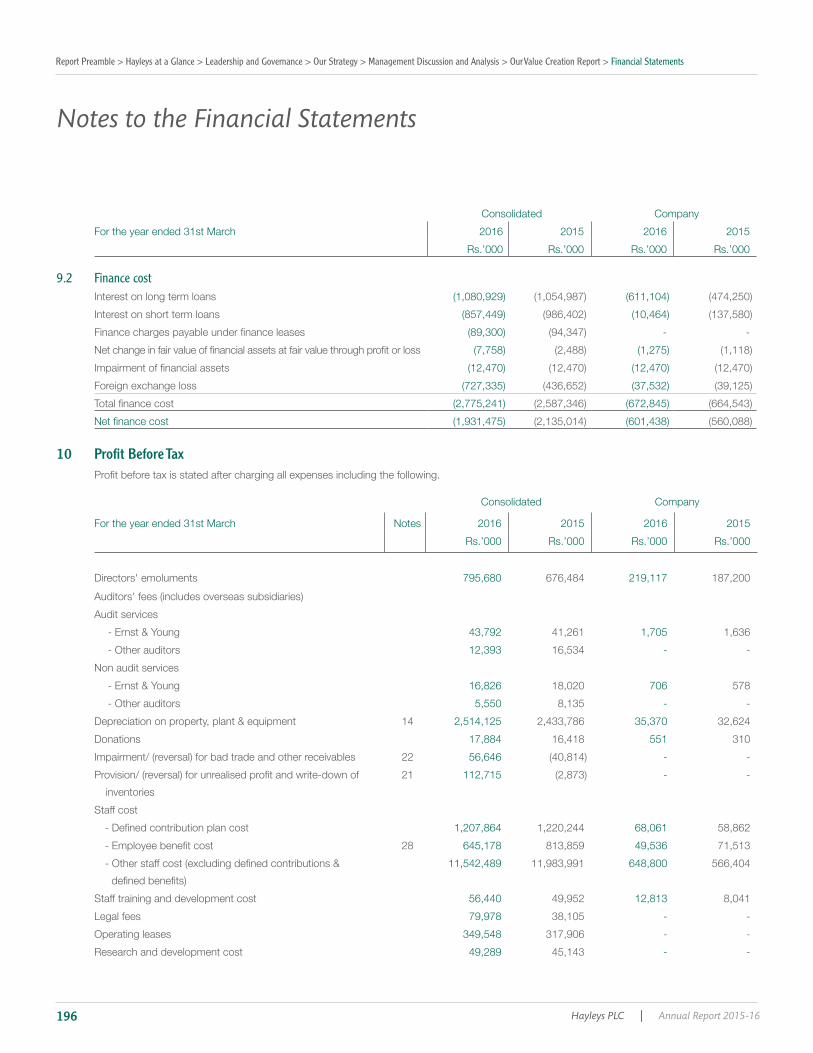
Report Preamble > Hayleys at a Glance > Leadership and Governance > Our Strategy > Management Discussion and Analysis > Our Value Creation Report > Financial Statements
Hayleys PLC | Annual Report 2015-16196
Notes to the Financial Statements
Consolidated Company
For the year ended 31st March 2016 2015 2016 2015
Rs.’000 Rs.’000 Rs.’000 Rs.’000
9.2 Finance costInterest on long term loans
Interest on short term loans
- -
Foreign exchange loss
10 Profit Before Tax
Consolidated Company
For the year ended 31st March Notes 2016 2015 2016 2015
Rs.’000 Rs.’000 Rs.’000 Rs.’000
Directors' emoluments 795,680 676,484 219,117 187,200
Audit services
- Ernst & Young 43,792 41,261 1,705 1,636
- Other auditors 12,393 16,534 - -
Non audit services
- Ernst & Young 16,826 18,020 706 578
- Other auditors 5,550 8,135 - -
Depreciation on property, plant & equipment 14 2,514,125 2,433,786 35,370 32,624
Donations 17,884 16,418 551 310
22 56,646 - -
inventories
21 112,715 - -
Staff cost
1,207,864 1,220,244 68,061 58,862
28 645,178 813,859 49,536 71,513
11,542,489 11,983,991 648,800 566,404
Staff training and development cost 56,440 49,952 12,813 8,041
79,978 38,105 - -
Operating leases 349,548 317,906 - -
Research and development cost 49,289 45,143 - -

The World Of Hayleys A World of Care
Annual Report 2015-16 | Hayleys PLC 197
11 Taxation
11.1 Tax Expense
Consolidated
For the year ended 31st March 2016 2015
Rs.’000 Rs.’000
Current income tax
Parent 3,672 4,094
Subsidiaries 1,315,747 1,064,244
1,319,419 1,068,338
Under provision in respect of previous years 59,075 80,396
Irrecoverable ESC 4,410 406
Deferred tax expense
Origination of temporary differences
Parent - -
Subsidiaries 142,342 93,555
142,342 93,555
Tax on dividend income 231,287 270,885
1,756,533 1,513,581
11.2 Consolidated Statement of Other Comprehensive Income
Consolidated
For the year ended 31st March 2016 2015
Rs.’000 Rs.’000
Deferred tax related to items credited directly to other comprehensive income during the year :
Income tax credited directly to other comprehensive income
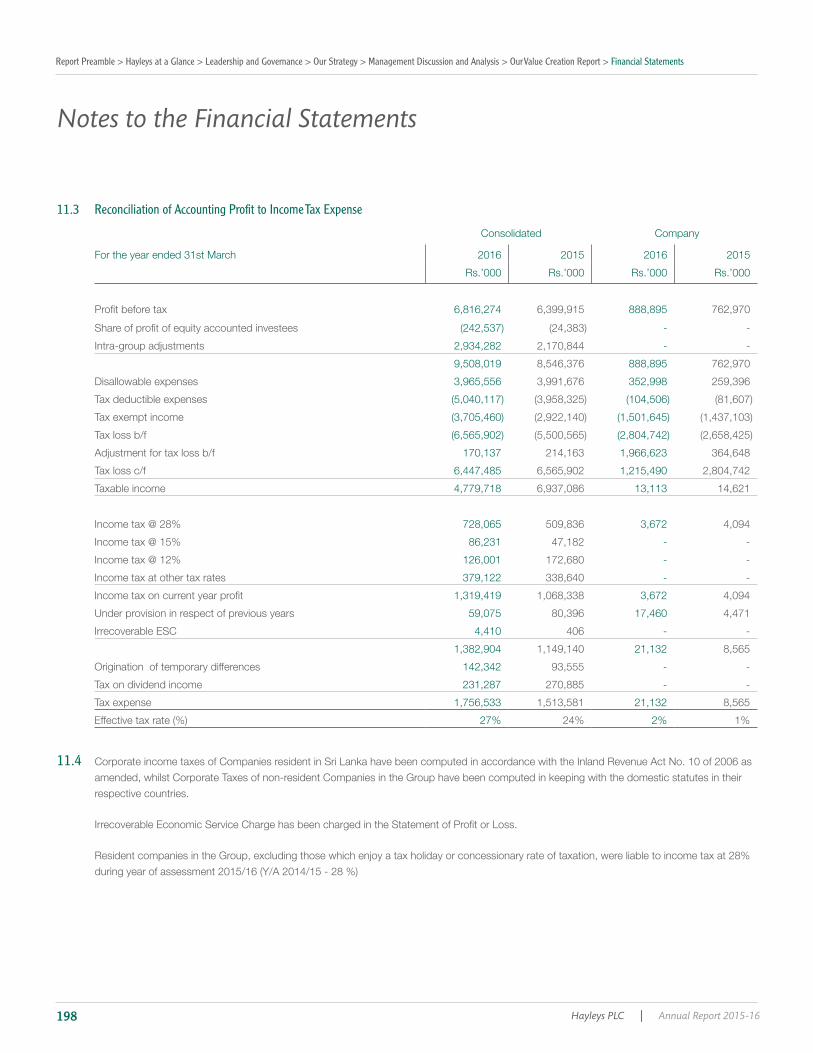
Report Preamble > Hayleys at a Glance > Leadership and Governance > Our Strategy > Management Discussion and Analysis > Our Value Creation Report > Financial Statements
Hayleys PLC | Annual Report 2015-16198
11.3 Reconciliation of Accounting Profit to Income Tax Expense
Consolidated Company
For the year ended 31st March 2016 2015 2016 2015
Rs.’000 Rs.’000 Rs.’000 Rs.’000
6,816,274 6,399,915 888,895 762,970
- -
Intra-group adjustments 2,934,282 2,170,844 - -
9,508,019 8,546,376 888,895 762,970
Disallowable expenses 3,965,556 3,991,676 352,998 259,396
Tax deductible expenses
Tax exempt income
Tax loss b/f
Adjustment for tax loss b/f 170,137 214,163 1,966,623 364,648
Tax loss c/f 6,447,485 6,565,902 1,215,490 2,804,742
Taxable income 4,779,718 6,937,086 13,113 14,621
Income tax @ 28% 728,065 509,836 3,672 4,094
Income tax @ 15% 86,231 47,182 - -
Income tax @ 12% 126,001 172,680 - -
Income tax at other tax rates 379,122 338,640 - -
1,319,419 1,068,338 3,672 4,094
Under provision in respect of previous years 59,075 80,396 17,460 4,471
Irrecoverable ESC 4,410 406 - -
1,382,904 1,149,140 21,132 8,565
Origination of temporary differences 142,342 93,555 - -
Tax on dividend income 231,287 270,885 - -
Tax expense 1,756,533 1,513,581 21,132 8,565
27% 24% 2% 1%
11.4amended, whilst Corporate Taxes of non-resident Companies in the Group have been computed in keeping with the domestic statutes in their
respective countries.
Resident companies in the Group, excluding those which enjoy a tax holiday or concessionary rate of taxation, were liable to income tax at 28%
Notes to the Financial Statements
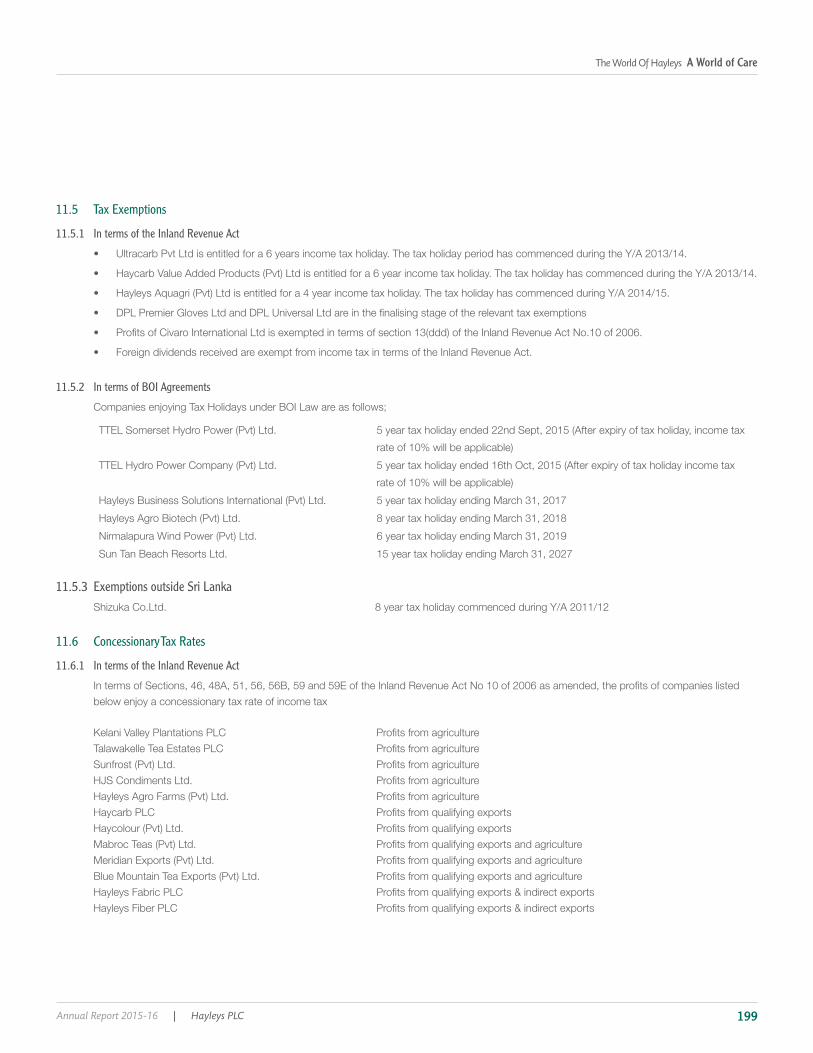
The World Of Hayleys A World of Care
Annual Report 2015-16 | Hayleys PLC 199
11.5 Tax Exemptions
11.5.1 In terms of the Inland Revenue Act
• Foreign dividends received are exempt from income tax in terms of the Inland Revenue Act.
11.5.2 In terms of BOI Agreements
5 year tax holiday ending March 31, 2017
8 year tax holiday ending March 31, 2018
6 year tax holiday ending March 31, 2019
15 year tax holiday ending March 31, 2027
11.5.3 Exemptions outside Sri Lanka
11.6 Concessionary Tax Rates
11.6.1 In terms of the Inland Revenue Act
below enjoy a concessionary tax rate of income tax
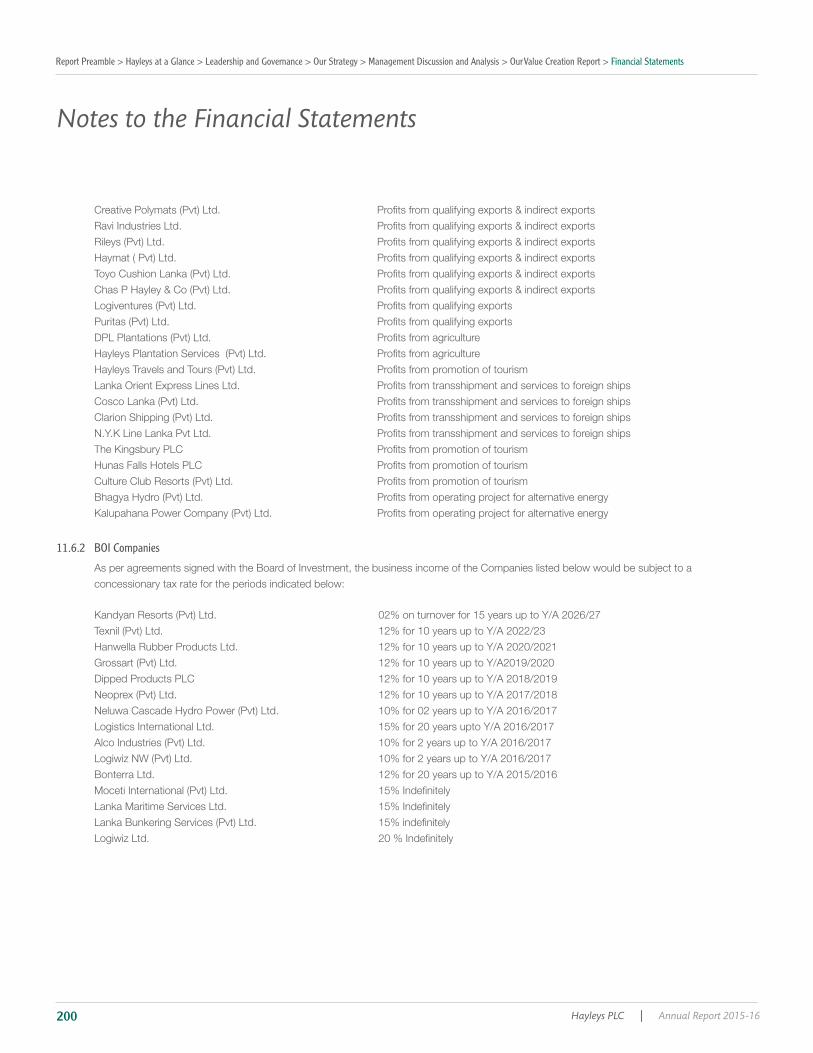
Report Preamble > Hayleys at a Glance > Leadership and Governance > Our Strategy > Management Discussion and Analysis > Our Value Creation Report > Financial Statements
Hayleys PLC | Annual Report 2015-16200
11.6.2 BOI Companies
As per agreements signed with the Board of Investment, the business income of the Companies listed below would be subject to a
concessionary tax rate for the periods indicated below:
Notes to the Financial Statements

The World Of Hayleys A World of Care
Annual Report 2015-16 | Hayleys PLC 201
11.6.3 Non-Resident Companies
Corporate Income Taxes of non-resident companies are:
PT Mapalus Makawanua Charcoal Industry 25%
Haycarb USA Inc 34%
ICOGUANTI S.p.A. 27.5%
Haylex BV 20%
Haylex Japan 36%
PT Haycarb Palu Mitra 25%
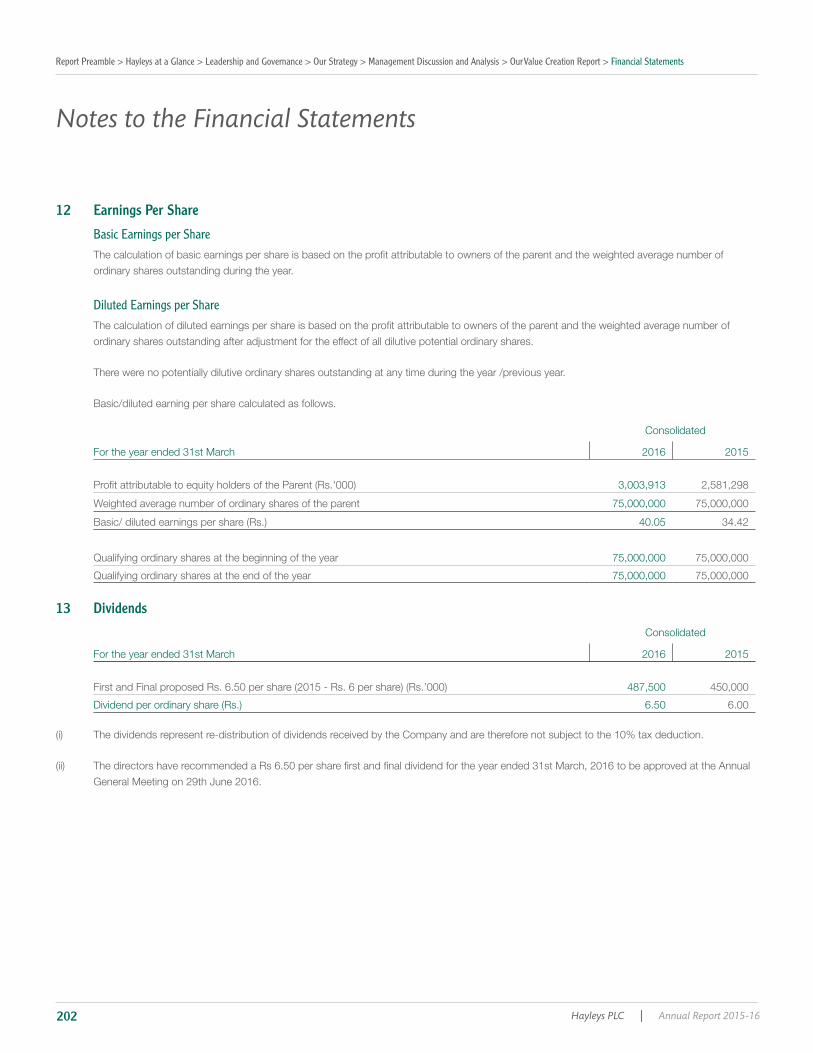
Report Preamble > Hayleys at a Glance > Leadership and Governance > Our Strategy > Management Discussion and Analysis > Our Value Creation Report > Financial Statements
Hayleys PLC | Annual Report 2015-16202
12 Earnings Per Share
Basic Earnings per Share
ordinary shares outstanding during the year.
Diluted Earnings per Share
ordinary shares outstanding after adjustment for the effect of all dilutive potential ordinary shares.
There were no potentially dilutive ordinary shares outstanding at any time during the year /previous year.
Basic/diluted earning per share calculated as follows.
Consolidated
For the year ended 31st March 2016 2015
3,003,913 2,581,298
Weighted average number of ordinary shares of the parent 75,000,000 75,000,000
40.05 34.42
Qualifying ordinary shares at the beginning of the year 75,000,000 75,000,000
Qualifying ordinary shares at the end of the year 75,000,000 75,000,000
13 Dividends
Consolidated
For the year ended 31st March 2016 2015
487,500 450,000
6.50 6.00
General Meeting on 29th June 2016.
Notes to the Financial Statements
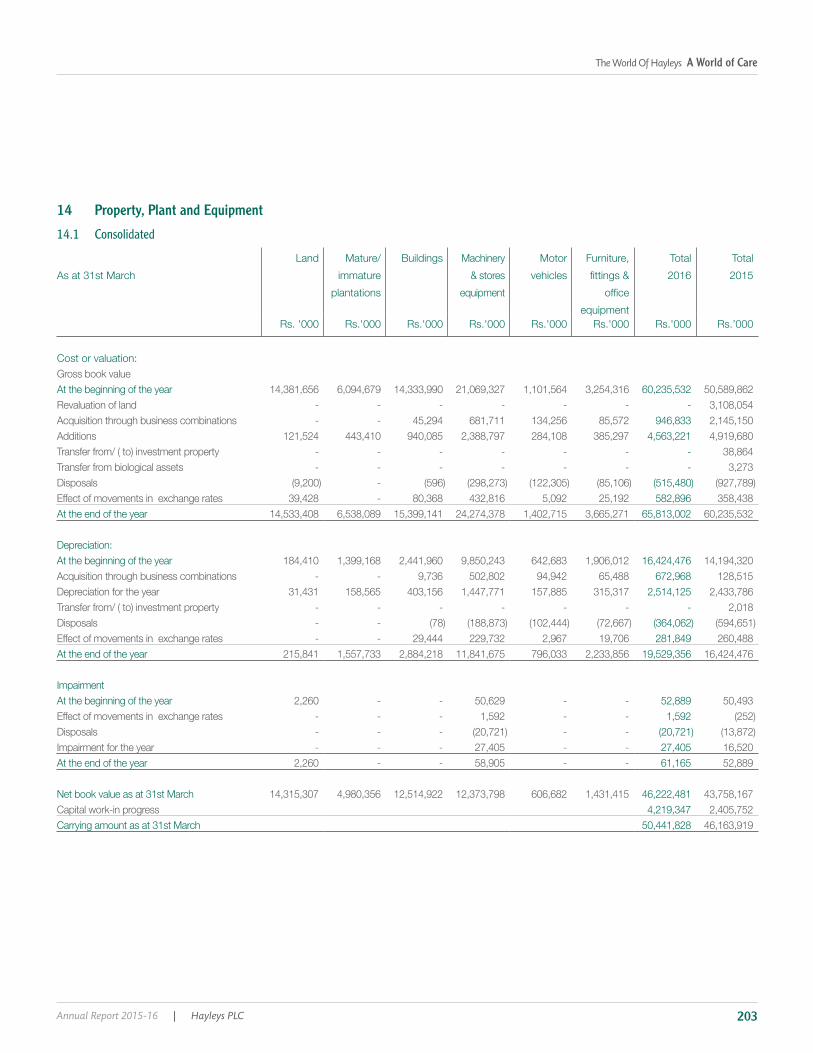
The World Of Hayleys A World of Care
Annual Report 2015-16 | Hayleys PLC 203
14 Property, Plant and Equipment
14.1 Consolidated
As at 31st March
Mature/
immature
plantations
Buildings Machinery
& stores
equipment
Motor
vehicles
Furniture,
equipment
Total
2016
Total
2015
Rs. '000 Rs.'000 Rs.'000 Rs.'000 Rs.'000 Rs.'000 Rs.'000 Rs.’000
Cost or valuation:Gross book valueAt the beginning of the year 14,381,656 6,094,679 14,333,990 21,069,327 1,101,564 3,254,316 60,235,532 50,589,862 Revaluation of land - - - - - - - 3,108,054 Acquisition through business combinations - - 45,294 681,711 134,256 85,572 946,833 2,145,150 Additions 121,524 443,410 940,085 2,388,797 284,108 385,297 4,563,221 4,919,680
- - - - - - - 38,864 Transfer from biological assets - - - - - - - 3,273 Disposals - Effect of movements in exchange rates 39,428 - 80,368 432,816 5,092 25,192 582,896 358,438 At the end of the year 14,533,408 6,538,089 15,399,141 24,274,378 1,402,715 3,665,271 65,813,002 60,235,532
Depreciation:At the beginning of the year 184,410 1,399,168 2,441,960 9,850,243 642,683 1,906,012 16,424,476 14,194,320 Acquisition through business combinations - - 9,736 502,802 94,942 65,488 672,968 128,515 Depreciation for the year 31,431 158,565 403,156 1,447,771 157,885 315,317 2,514,125 2,433,786
- - - - - - - 2,018 Disposals - - Effect of movements in exchange rates - - 29,444 229,732 2,967 19,706 281,849 260,488 At the end of the year 215,841 1,557,733 2,884,218 11,841,675 796,033 2,233,856 19,529,356 16,424,476
ImpairmentAt the beginning of the year 2,260 - - 50,629 - - 52,889 50,493 Effect of movements in exchange rates - - - 1,592 - - 1,592 Disposals - - - - - Impairment for the year - - - 27,405 - - 27,405 16,520 At the end of the year 2,260 - - 58,905 - - 61,165 52,889
Net book value as at 31st March 14,315,307 4,980,356 12,514,922 12,373,798 606,682 1,431,415 46,222,481 43,758,167 Capital work-in progress 4,219,347 2,405,752 Carrying amount as at 31st March 50,441,828 46,163,919

Report Preamble > Hayleys at a Glance > Leadership and Governance > Our Strategy > Management Discussion and Analysis > Our Value Creation Report > Financial Statements
Hayleys PLC | Annual Report 2015-16204
14.2 Company
As at 31st March
Freehold
land
Buildings Machinery
& stores
equipment
Motor
vehicles
Furniture,
equipment
Total
2016
Total
2015
Rs.'000 Rs.'000 Rs.'000 Rs.'000 Rs.'000 Rs.'000 Rs.’000
Cost or valuation:
At the beginning of the year 6,321,000 274,527 45,730 46,215 286,890 6,974,362 5,444,245
Revaluation of land - - - - - - 1,453,000
Additions - - 55 21,400 10,020 31,475 80,393
Disposals - - -
At the end of the year 6,321,000 274,527 45,785 55,341 293,326 6,989,979 6,974,362
Depreciation
At the beginning of the year - 55,757 37,945 11,538 217,380 322,620 291,655
Depreciation for the year - 5,507 1,536 4,629 23,698 35,370 32,624
Disposals - - -
At the end of the year - 61,264 39,481 7,616 237,595 345,956 322,620
Net book value as at 31st March 6,321,000 213,263 6,304 47,725 55,731 6,644,023 6,651,742
Capital work in progress - - - - - 30,086 2,924
Carrying amount as at 31st March - - - - - 6,674,109 6,654,666
14.3 Carrying Value
Consolidated Company
As at 31st March 2016 2015 2016 2015
Rs.’000 Rs.’000 Rs.’000 Rs.’000
At cost 32,420,027 28,621,231 353,109 333,666
At valuation 11,453,645 11,457,692 6,321,000 6,321,000
6,568,156 6,084,996 - -
50,441,828 46,163,919 6,674,109 6,654,666
Notes to the Financial Statements

The World Of Hayleys A World of Care
Annual Report 2015-16 | Hayleys PLC 205
Consolidated
As at 31st March
Cost Accumulated
depreciation/
amortisation
Carrying
value
2016
Carrying
value
2015
Rs.’000 Rs.’000 Rs.’000 Rs.’000
704,527 106,413 598,114 577,497
Mature/Immature Plantation 4,315,367 1,062,660 3,252,707 3,002,733
Buildings 2,993,528 348,768 2,644,760 2,439,695
Machinery & Store Equipment's 49,201 49,201 - 15,288
Motor Vehicles 233,294 162,484 70,810 49,641
6,807 5,042 1,765 142
Total 8,302,724 1,734,568 6,568,156 6,084,996
Unexpired lease periods of land:
31 Years
31 Years
84 Years /77 Years / 19 Years
29 Years
53 Years
26 Years
92 Years
the last date of revaluation:
Company Revaluation surplus
As at 31st March 2016 2015
Rs.’000 Rs.’000
6,314,023 6,314,023
677,100 677,100
179,519 179,519
128,827 128,827
463,225 463,225
123,676 123,676
70,973 70,973
164,439 164,439
50,925 50,925
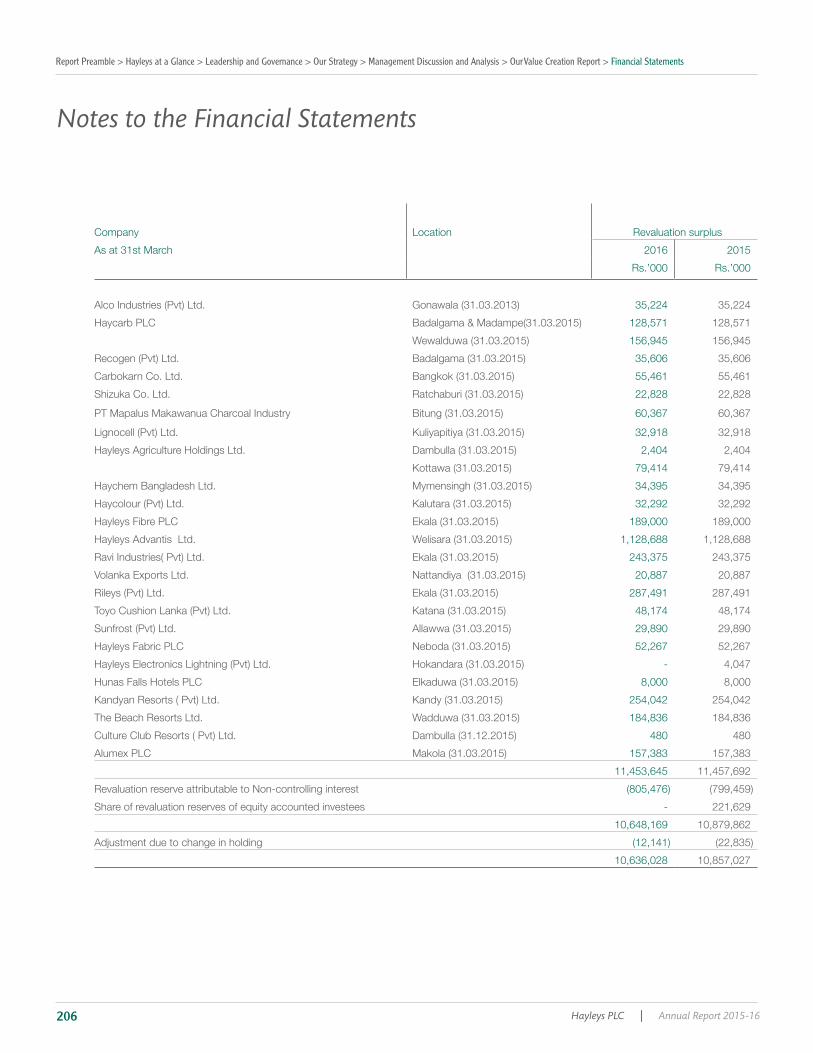
Report Preamble > Hayleys at a Glance > Leadership and Governance > Our Strategy > Management Discussion and Analysis > Our Value Creation Report > Financial Statements
Hayleys PLC | Annual Report 2015-16206
Company Revaluation surplus
As at 31st March 2016 2015
Rs.’000 Rs.’000
35,224 35,224
128,571 128,571
156,945 156,945
35,606 35,606
55,461 55,461
22,828 22,828
PT Mapalus Makawanua Charcoal Industry 60,367 60,367
32,918 32,918
2,404 2,404
79,414 79,414
34,395 34,395
32,292 32,292
189,000 189,000
1,128,688 1,128,688
243,375 243,375
20,887 20,887
287,491 287,491
48,174 48,174
29,890 29,890
52,267 52,267
- 4,047
8,000 8,000
254,042 254,042
184,836 184,836
480 480
157,383 157,383
11,453,645 11,457,692
Revaluation reserve attributable to Non-controlling interest
Share of revaluation reserves of equity accounted investees - 221,629
10,648,169 10,879,862
Adjustment due to change in holding
10,636,028 10,857,027
Notes to the Financial Statements

The World Of Hayleys A World of Care
Annual Report 2015-16 | Hayleys PLC 207
was determined based on transactions observed in the market, appropriately adjusted for differences in the nature, location or condition of the
information is provided on page 266. There are no tax implications or tax liabilities pertaining to revaluation of land.
Financial Statements.
respectively have been pledged as security for term loans obtained. The details are shown in Note 25 to the Financial Statements.
Consolidated Company
As at 31st March 2016 2015 2016 2015
Rs.’000 Rs.’000 Rs.’000 Rs.’000
Buildings 88,435 80,995 - -
Machinery and equipment 2,836,812 2,581,027 38,642 38,702
1,210,954 1,307,736 169,643 159,065
Motor vehicles 301,158 205,590 3 12,277
4,437,359 4,175,348 208,288 210,044
14.4 Capital Expenditure Commitments The approximate amounts of capital expenditure approved by the Directors as at 31st March 2016 were: Capital expenditure contracted for
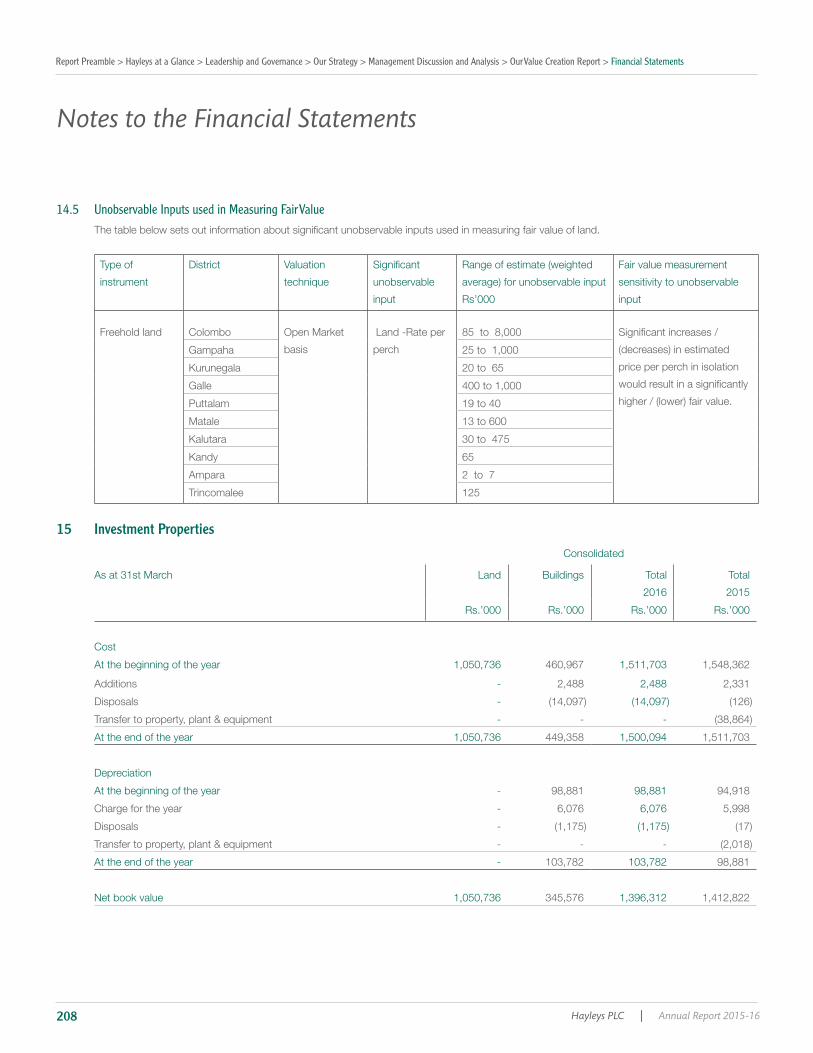
Report Preamble > Hayleys at a Glance > Leadership and Governance > Our Strategy > Management Discussion and Analysis > Our Value Creation Report > Financial Statements
Hayleys PLC | Annual Report 2015-16208
14.5 Unobservable Inputs used in Measuring Fair Value
Type of
instrument
District Valuation
technique unobservable
input Rs’000
Fair value measurement
sensitivity to unobservable
input
Freehold land Colombo Open Market
basis perch
85 to 8,000
price per perch in isolation
Gampaha 25 to 1,000
20 to 65
Galle 400 to 1,000
Puttalam 19 to 40
Matale 13 to 600
30 to 475
65
Ampara 2 to 7
Trincomalee 125
15 Investment Properties
Consolidated
As at 31st March Buildings Total
2016
Total
2015
Rs.’000 Rs.’000 Rs.’000 Rs.’000
Cost
At the beginning of the year 1,050,736 460,967 1,511,703 1,548,362
Additions - 2,488 2,488 2,331
Disposals -
Transfer to property, plant & equipment - - -
At the end of the year 1,050,736 449,358 1,500,094 1,511,703
Depreciation
At the beginning of the year - 98,881 98,881 94,918
Charge for the year - 6,076 6,076 5,998
Disposals -
Transfer to property, plant & equipment - - -
At the end of the year - 103,782 103,782 98,881
Net book value 1,050,736 345,576 1,396,312 1,412,822
Notes to the Financial Statements
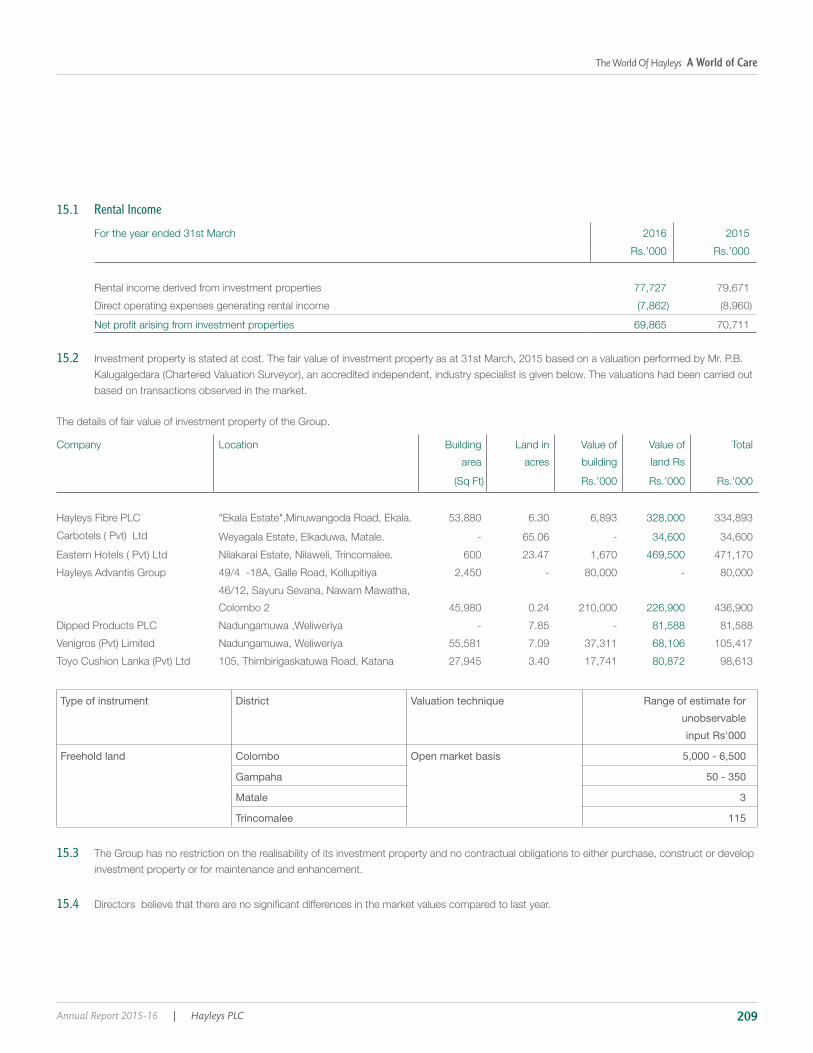
The World Of Hayleys A World of Care
Annual Report 2015-16 | Hayleys PLC 209
15.1 Rental Income
For the year ended 31st March 2016 2015
Rs.’000 Rs.’000
Rental income derived from investment properties 77,727 79,671
Direct operating expenses generating rental income
69,865 70,711
15.2 Investment property is stated at cost. The fair value of investment property as at 31st March, 2015 based on a valuation performed by Mr. P.B.
based on transactions observed in the market.
The details of fair value of investment property of the Group.
Company Building
area acres
Value of
building
Value of
land Rs
Total
Rs.’000 Rs.’000 Rs.’000
"Ekala Estate",Minuwangoda Road, Ekala. 53,880 6.30 6,893 328,000 334,893
Weyagala Estate, Elkaduwa, Matale. - 65.06 - 34,600 34,600
Nilakarai Estate, Nilaweli, Trincomalee. 600 23.47 1,670 469,500 471,170
Hayleys Advantis Group 2,450 - 80,000 - 80,000
46/12, Sayuru Sevana, Nawam Mawatha,
Colombo 2 45,980 0.24 210,000 226,900 436,900
Nadungamuwa ,Weliweriya - 7.85 - 81,588 81,588
Nadungamuwa, Weliweriya 55,581 7.09 37,311 68,106 105,417
27,945 3.40 17,741 80,872 98,613
Type of instrument District Valuation technique Range of estimate for unobservable input Rs'000
Freehold land Colombo Open market basis 5,000 - 6,500
Gampaha 50 - 350
Matale 3
Trincomalee 115
15.3 The Group has no restriction on the realisability of its investment property and no contractual obligations to either purchase, construct or develop
investment property or for maintenance and enhancement.
15.4
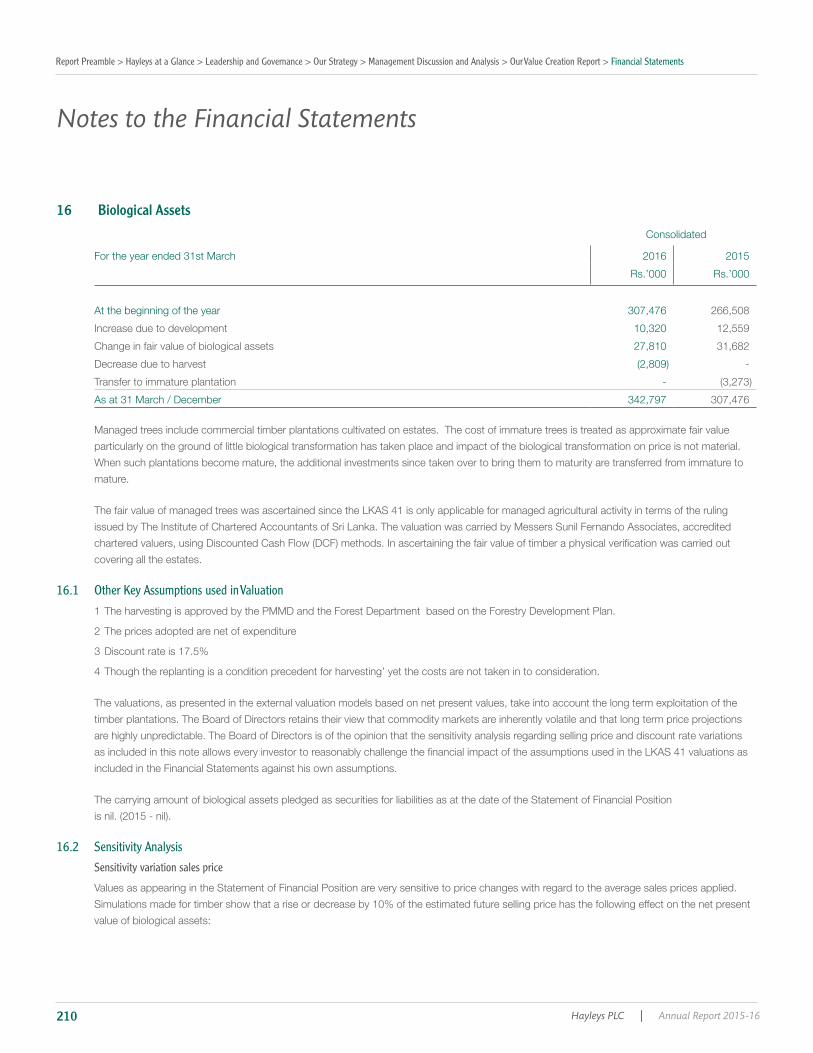
Report Preamble > Hayleys at a Glance > Leadership and Governance > Our Strategy > Management Discussion and Analysis > Our Value Creation Report > Financial Statements
Hayleys PLC | Annual Report 2015-16210
16 Biological Assets
Consolidated
For the year ended 31st March 2016 2015
Rs.’000 Rs.’000
At the beginning of the year 307,476 266,508
Increase due to development 10,320 12,559
Change in fair value of biological assets 27,810 31,682
Decrease due to harvest -
Transfer to immature plantation -
As at 31 March / December 342,797 307,476
Managed trees include commercial timber plantations cultivated on estates. The cost of immature trees is treated as approximate fair value
particularly on the ground of little biological transformation has taken place and impact of the biological transformation on price is not material.
When such plantations become mature, the additional investments since taken over to bring them to maturity are transferred from immature to
mature.
covering all the estates.
16.1 Other Key Assumptions used in Valuation
1 The harvesting is approved by the PMMD and the Forest Department based on the Forestry Development Plan.
2 The prices adopted are net of expenditure
3 Discount rate is 17.5%
4 Though the replanting is a condition precedent for harvesting’ yet the costs are not taken in to consideration.
The valuations, as presented in the external valuation models based on net present values, take into account the long term exploitation of the
timber plantations. The Board of Directors retains their view that commodity markets are inherently volatile and that long term price projections
are highly unpredictable. The Board of Directors is of the opinion that the sensitivity analysis regarding selling price and discount rate variations
included in the Financial Statements against his own assumptions.
The carrying amount of biological assets pledged as securities for liabilities as at the date of the Statement of Financial Position
16.2 Sensitivity Analysis
Sensitivity variation sales price
Values as appearing in the Statement of Financial Position are very sensitive to price changes with regard to the average sales prices applied.
Simulations made for timber show that a rise or decrease by 10% of the estimated future selling price has the following effect on the net present
value of biological assets:
Notes to the Financial Statements
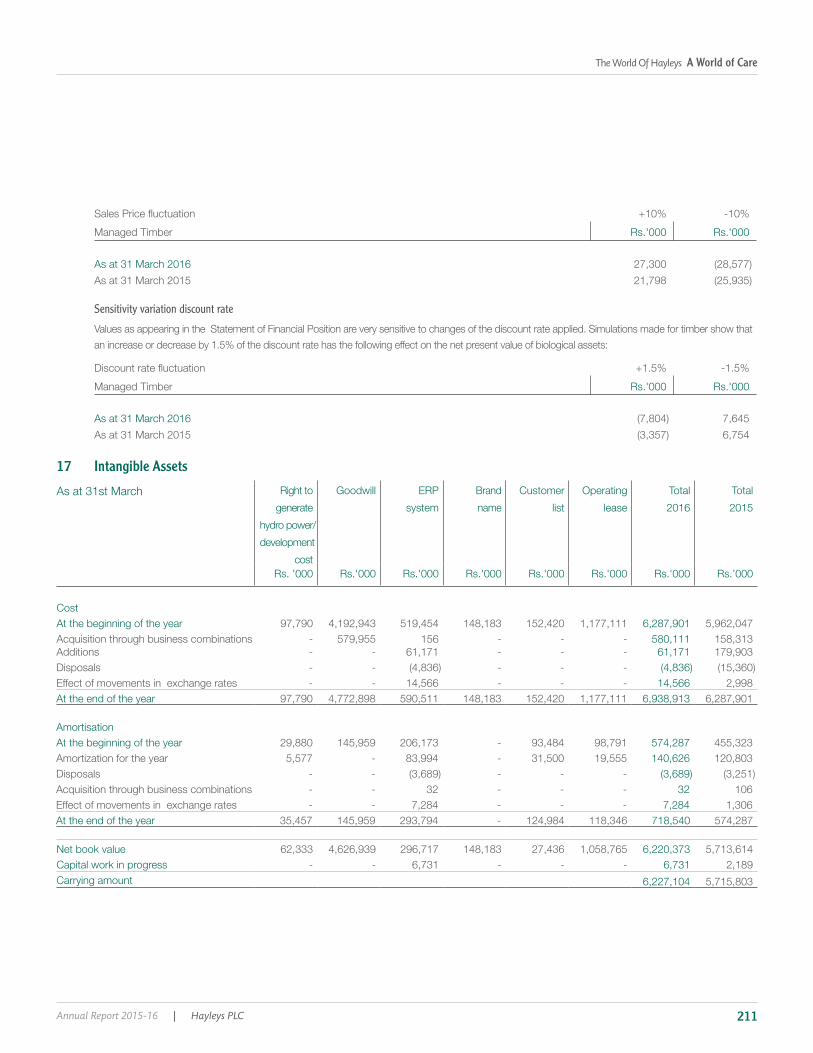
The World Of Hayleys A World of Care
Annual Report 2015-16 | Hayleys PLC 211
+10% -10%
Managed Timber Rs.'000 Rs.'000
As at 31 March 2016 27,300
As at 31 March 2015 21,798
Sensitivity variation discount rate
Values as appearing in the Statement of Financial Position are very sensitive to changes of the discount rate applied. Simulations made for timber show that
an increase or decrease by 1.5% of the discount rate has the following effect on the net present value of biological assets:
+1.5% -1.5%
Managed Timber Rs.'000 Rs.'000
As at 31 March 2016 7,645
As at 31 March 2015 6,754
17 Intangible Assets
As at 31st March Right to
generate
hydro power/
development
cost
Goodwill ERP
system
Brand
name
Customer
list
Operating
lease
Total
2016
Total
2015
Rs. '000 Rs.'000 Rs.'000 Rs.'000 Rs.'000 Rs.'000 Rs.'000 Rs.’000
Cost At the beginning of the year 97,790 4,192,943 519,454 148,183 152,420 1,177,111 6,287,901 5,962,047 Acquisition through business combinations - 579,955 156 - - - 580,111 158,313 Additions - - 61,171 - - - 61,171 179,903 Disposals - - - - - Effect of movements in exchange rates - - 14,566 - - - 14,566 2,998 At the end of the year 97,790 4,772,898 590,511 148,183 152,420 1,177,111 6,938,913 6,287,901
AmortisationAt the beginning of the year 29,880 145,959 206,173 - 93,484 98,791 574,287 455,323
5,577 - 83,994 - 31,500 19,555 140,626 120,803 Disposals - - - - - Acquisition through business combinations - - 32 - - - 32 106 Effect of movements in exchange rates - - 7,284 - - - 7,284 1,306 At the end of the year 35,457 145,959 293,794 - 124,984 118,346 718,540 574,287
Net book value 62,333 4,626,939 296,717 148,183 27,436 1,058,765 6,220,373 5,713,614 Capital work in progress - - 6,731 - - - 6,731 2,189 Carrying amount 6,227,104 5,715,803

Report Preamble > Hayleys at a Glance > Leadership and Governance > Our Strategy > Management Discussion and Analysis > Our Value Creation Report > Financial Statements
Hayleys PLC | Annual Report 2015-16212
17.1 The aggregate carrying amount of goodwill allocated to each unit is as follows
Rs. Mn
97
Dipped Products' Group Companies 33
Advantis Group Companies 433
Haycarb Group Companies 202
8
633
134
1,052
1,553
20
Fentons Group Companies 461
4,627
Methods used in estimating recoverable amounts are given below
the unit and key assumptions used are given below.
Business Growth - Based on historical growth rate and business plan
Discount Rate - Average market borrowing rate adjusted for risk premium
Margin - Based on current margin and business plan
17.2 There has been no impairment of intangible assets.
17.3 The remaining amortisation period of right to generate hydro power excluding development cost amounted to Rs. 35,772 mn.
Remaining amortisation period Carrying
amount
71 months 2,512
92 months 1,718
131 months 22,331
26,561
Notes to the Financial Statements

The World Of Hayleys A World of Care
Annual Report 2015-16 | Hayleys PLC 213
17.4
17.5
in the future booming leisure sector.
17.5
The established customer lists of Amaya Hotels is acknowledged as a key component in generation of revenue through travel agents and tour
operators.
The management is of the opinion that the company is capable of retaining the travel agents through business relationship strategies and this
18 Investments
18.1 Company Investment in Subsidiaries
As at 31st March % Holding No. of Shares Value Rs.’000
2016 2015 2016 Movement 2015 2016 Movement 2015
Investee
Quoted investments*
68 68 20,125,103 - 20,125,103 47,204 - 47,204
65 65 5,200,000 - 5,200,000 3,575 - 3,575
42 42 25,210,938 - 25,210,938 408,490 - 408,490
59 59 122,487,023 - 122,487,023 1,355,791 - 1,355,791
40 40 20,334,545 - 20,334,545 2,161,551 - 2,161,551
51 51 152,644,500 - 152,644,500 1,277,353 - 1,277,353
63 63 7,538,454 - 7,538,454 174,292 - 174,292
46 46 112,307,057 - 112,307,057 1,864,073 - 1,864,073
465,847,620 - 465,847,620 7,292,329 - 7,292,329
Unquoted Investments
100 100 6 - 6 - - -
Haylex BV 100 100 1,000 - 1,000 25,733 - 25,733
100 100 999,920 - 999,920 698 - 698
86 86 10,791,694 1,500 10,790,194 15,935 46 15,889
100 100 10,000 - 10,000 100 - 100
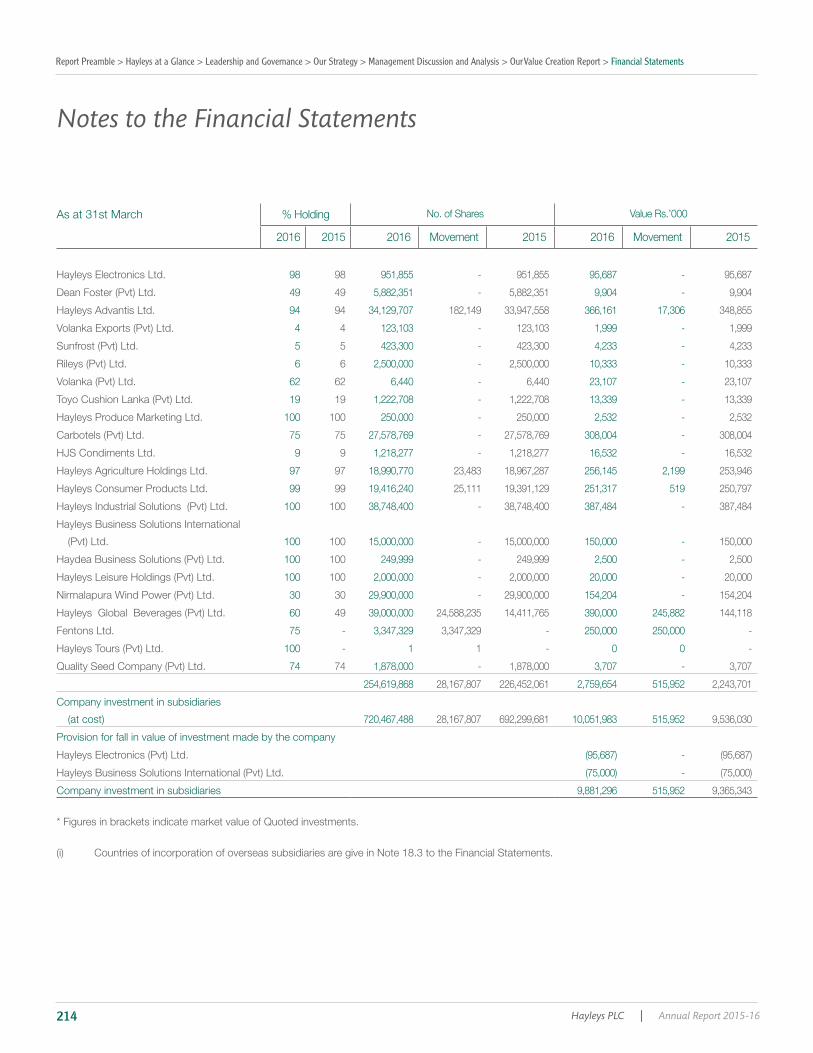
Report Preamble > Hayleys at a Glance > Leadership and Governance > Our Strategy > Management Discussion and Analysis > Our Value Creation Report > Financial Statements
Hayleys PLC | Annual Report 2015-16214
As at 31st March % Holding No. of Shares Value Rs.’000
2016 2015 2016 Movement 2015 2016 Movement 2015
98 98 951,855 - 951,855 95,687 - 95,687
49 49 5,882,351 - 5,882,351 9,904 - 9,904
94 94 34,129,707 182,149 33,947,558 366,161 17,306 348,855
4 4 123,103 - 123,103 1,999 - 1,999
5 5 423,300 - 423,300 4,233 - 4,233
6 6 2,500,000 - 2,500,000 10,333 - 10,333
62 62 6,440 - 6,440 23,107 - 23,107
19 19 1,222,708 - 1,222,708 13,339 - 13,339
100 100 250,000 - 250,000 2,532 - 2,532
75 75 27,578,769 - 27,578,769 308,004 - 308,004
9 9 1,218,277 - 1,218,277 16,532 - 16,532
97 97 18,990,770 23,483 18,967,287 256,145 2,199 253,946
99 99 19,416,240 25,111 19,391,129 251,317 519 250,797
100 100 38,748,400 - 38,748,400 387,484 - 387,484
Hayleys Business Solutions International
100 100 15,000,000 - 15,000,000 150,000 - 150,000
100 100 249,999 - 249,999 2,500 - 2,500
100 100 2,000,000 - 2,000,000 20,000 - 20,000
30 30 29,900,000 - 29,900,000 154,204 - 154,204
60 49 39,000,000 24,588,235 14,411,765 390,000 245,882 144,118
75 - 3,347,329 3,347,329 - 250,000 250,000 -
100 - 1 1 - 0 0 -
74 74 1,878,000 - 1,878,000 3,707 - 3,707
254,619,868 28,167,807 226,452,061 2,759,654 515,952 2,243,701
Company investment in subsidiaries
720,467,488 28,167,807 692,299,681 10,051,983 515,952 9,536,030
Provision for fall in value of investment made by the company
-
-
Company investment in subsidiaries 9,881,296 515,952 9,365,343
* Figures in brackets indicate market value of Quoted investments.
Notes to the Financial Statements

The World Of Hayleys A World of Care
Annual Report 2015-16 | Hayleys PLC 215
18.2 Investment In Equity Accounted Investees
Investor
As at 31st March
Investee % Holding No. of Shares Value Rs.’000
2016 2015 2016 Movement 2015 2016 Movement 2015
Unquoted Investments
- 30 - 60,000 - 127,794
Hayleys Advantis Group
30 30 195,000 - 195,000 1,950 - 1,950
50 50 803,394 - 803,394 8,034 - 8,034
49 49 2,450,000 - 2,450,000 24,500 - 24,500
30 30 780,000 - 780,000 7,800 - 7,800
25 - 26,250,000 26,250,000 - 262,500 262,500 -
25 - 26,250,000 26,250,000 - 262,500 262,500 -
567,284 397,206 170,078
567,284 397,206 170,078
* Joint venture
** Associates
Consolidated
Investment at cost Others Net Asset
As at 31st March 2016 2015 2016 2015 2016 2015 2016 2015
Rs.'000 Rs.'000 Rs.'000 Rs.'000 Rs.'000 Rs.'000 Rs.'000 Rs.'000
- 127,794 11,215 7,268 111,915 - 348,227
1,950 1,950 97 7,168 16,758
8,034 8,034 14,285 5,952 33,995 54,230 39,947
7,800 7,800 3,445 3 - 7,800 11,249 7,803
24,500 24,500 10,352 11,063 - 65,297 86,713 76,361
262,500 - 105,405 - 150,038 - 255,443 -
262,500 - 106,957 - 150,038 - 256,994 -
567,284 170,078 242,537 24,383 217,376 671,797 489,096
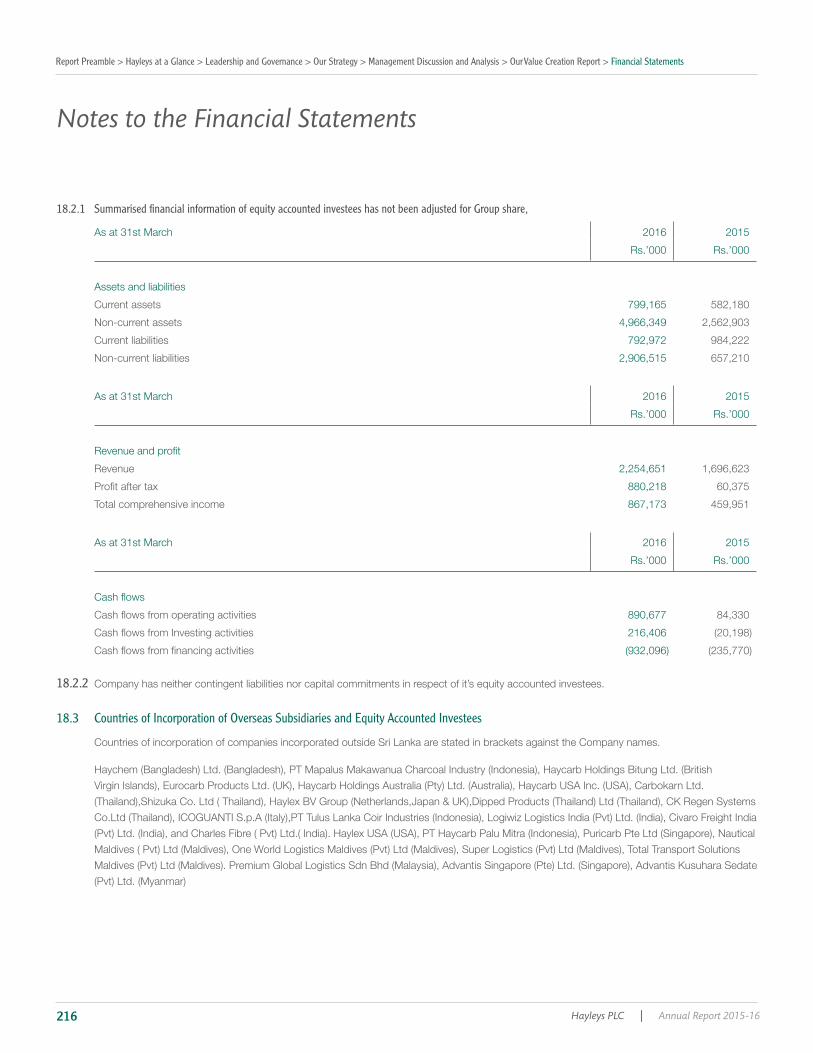
Report Preamble > Hayleys at a Glance > Leadership and Governance > Our Strategy > Management Discussion and Analysis > Our Value Creation Report > Financial Statements
Hayleys PLC | Annual Report 2015-16216
18.2.1 Summarised financial information of equity accounted investees has not been adjusted for Group share,
As at 31st March 2016 2015
Rs.’000 Rs.’000
Assets and liabilities
Current assets 799,165 582,180
Non-current assets 4,966,349 2,562,903
Current liabilities 792,972 984,222
Non-current liabilities 2,906,515 657,210
As at 31st March 2016 2015
Rs.’000 Rs.’000
Revenue 2,254,651 1,696,623
880,218 60,375
Total comprehensive income 867,173 459,951
As at 31st March 2016 2015
Rs.’000 Rs.’000
890,677 84,330
216,406
18.2.2 Company has neither contingent liabilities nor capital commitments in respect of it’s equity accounted investees.
18.3 Countries of Incorporation of Overseas Subsidiaries and Equity Accounted Investees
UANTI
Notes to the Financial Statements

The World Of Hayleys A World of Care
Annual Report 2015-16 | Hayleys PLC 217
18.4. Inter-Company Shareholdings
% Holding No. of Shares
Investor Investee 2016 2015 2016 2015
1 1 75,000 75,000
3 3 169,267 169,267
2 2 14,975 14,975
100 100 12,000,000 12,000,000
38 38 3,920 3,920
1 1 488,369 488,369
- - 80 80
5 5 14,213,900 14,213,900
21 21 10,764,915 10,252,300
100 100 4,000,000 4,000,000
100 100 4,200,000 4,200,000
100 100 8,000,000 8,000,000
100 100 1,500,000 1,500,000
100 100 55,000,000 55,000,000
100 100 4,000,000 4,000,000
99 99 4,516,248 4,516,248
100 100 7,500,000 7,500,000
61 61 2,016,667 2,016,667
73 73 18,152,000 18,152,000
100 100 45,000,000 45,000,000
100 100 35,000,000 35,000,000
72 72 24,626,900 24,626,900
67 67 13,400,000 13,400,000
7 7 4,068,746 4,068,746
100 100 100,000 100,000
100 100 40,000,000 40,000,000
100 100 150,000 150,000
25 25 9,290,341 9,290,341
50 50 250,000 250,000
100 100 700,000 700,000
100 100 37,000,000 37,000,000
Haycarb USA Inc. 100 100 3,600,000 3,600,000
100 100 1,400,000 1,400,000
PT Mapalus Makawanua Charcoal Industry
2 2 707 707

Report Preamble > Hayleys at a Glance > Leadership and Governance > Our Strategy > Management Discussion and Analysis > Our Value Creation Report > Financial Statements
Hayleys PLC | Annual Report 2015-16218
% Holding No. of Shares
Investor Investee 2016 2015 2016 2015
100 100 25,000,000 25,000,000
6 6 147,000 147,000
PT.Haycarb Palu Mitra 60 60 1,290,000 1,290,000
100 100 150,000 150,000
100 100 200,000 200,000
49 49 2,450,000 2,450,000
100 100 50,000 50,000
PT Mapalus Makawana Charcoal Industry
98 98 36,935 36,935
93 93 2,329,894 2,329,894
100 100 14,999,999 4,999,999
100 100 1,500,000 1,500,000
100 100 7,499,999 7,499,999
59 59 7,399,343 7,399,343
93 93 7,445,000 7,445,000
100 100 90,702 90,702
2 2 3,472,257 3,472,257
51 51 1,275,000 1,275,000
20 20 500,000 500,000
16 16 1,015,602 1,015,602
50 50 803,394 803,394
19 19 7,750,000 7,750,000
100 100 60,000 60,000
100 100 3,000,001 3,000,001
100 100 320,001 320,001
21 21 21,100,000 21,100,000
100 100 42,067,241 38,067,241
25 25 26,250,000 26,250,000
25 25 26,250,000 26,250,000
100 100 11,910,001 11,910,001
75 75 17,750,000 17,750,000
51 51 3,519,000 3,519,000
51 51 3,060,000 3,060,000
Hayleys Advantis Group 1 1 50,000 50,000
2 2 5,036,850 5,036,850
31 31 12,250,000 12,250,000
1 1 567,000 567,000
100 100 9,994 9,994
Notes to the Financial Statements
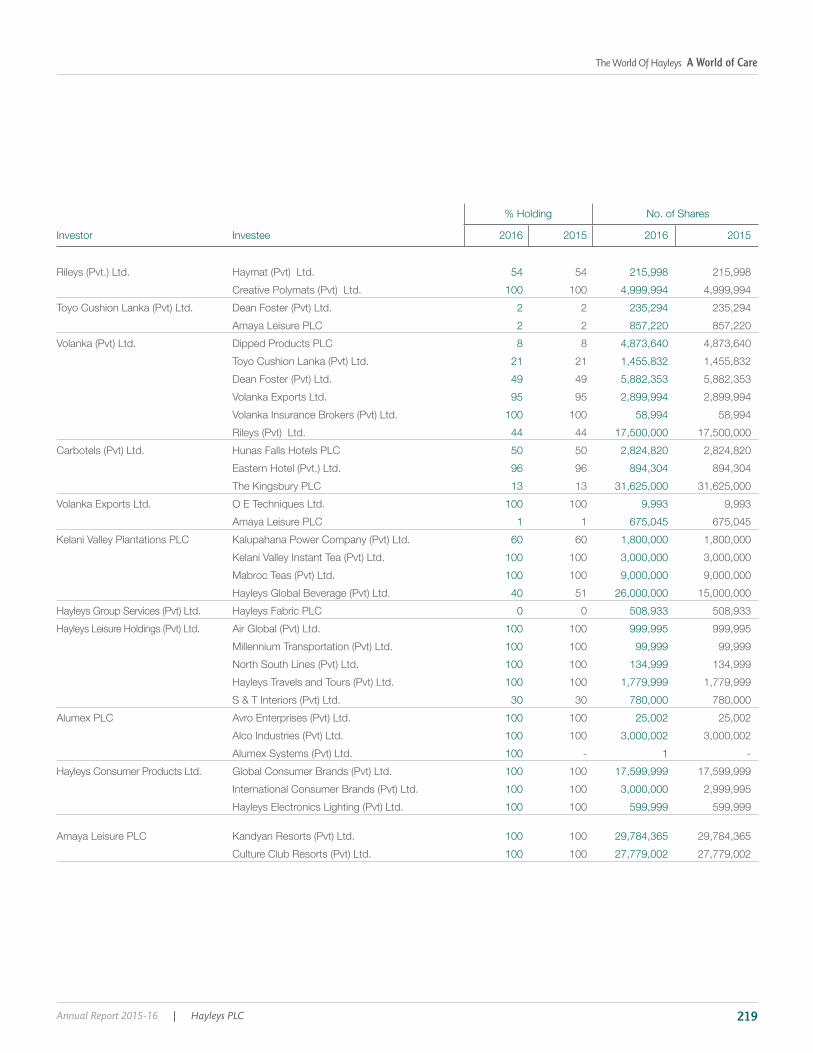
The World Of Hayleys A World of Care
Annual Report 2015-16 | Hayleys PLC 219
% Holding No. of Shares
Investor Investee 2016 2015 2016 2015
54 54 215,998 215,998
100 100 4,999,994 4,999,994
2 2 235,294 235,294
2 2 857,220 857,220
8 8 4,873,640 4,873,640
21 21 1,455,832 1,455,832
49 49 5,882,353 5,882,353
95 95 2,899,994 2,899,994
100 100 58,994 58,994
44 44 17,500,000 17,500,000
50 50 2,824,820 2,824,820
96 96 894,304 894,304
13 13 31,625,000 31,625,000
100 100 9,993 9,993
1 1 675,045 675,045
60 60 1,800,000 1,800,000
100 100 3,000,000 3,000,000
100 100 9,000,000 9,000,000
40 51 26,000,000 15,000,000
0 0 508,933 508,933
100 100 999,995 999,995
100 100 99,999 99,999
100 100 134,999 134,999
100 100 1,779,999 1,779,999
30 30 780,000 780,000
100 100 25,002 25,002
100 100 3,000,002 3,000,002
100 - 1 -
100 100 17,599,999 17,599,999
100 100 3,000,000 2,999,995
100 100 599,999 599,999
100 100 29,784,365 29,784,365
100 100 27,779,002 27,779,002
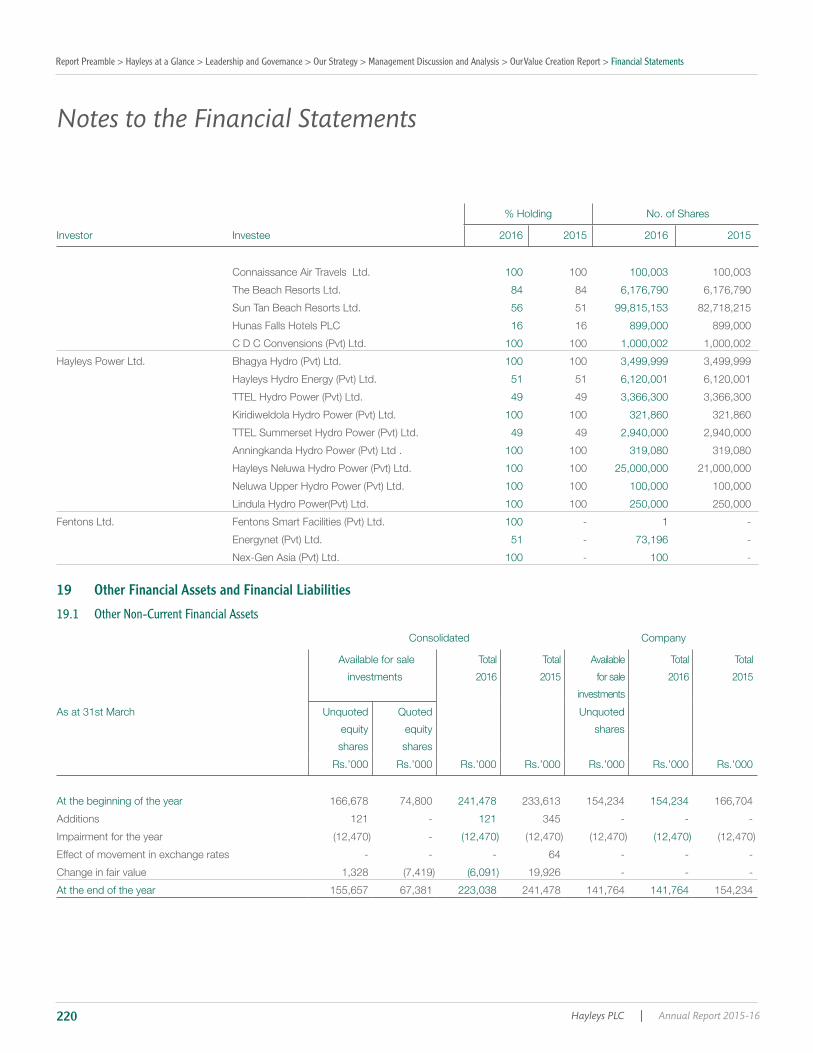
Report Preamble > Hayleys at a Glance > Leadership and Governance > Our Strategy > Management Discussion and Analysis > Our Value Creation Report > Financial Statements
Hayleys PLC | Annual Report 2015-16220
% Holding No. of Shares
Investor Investee 2016 2015 2016 2015
100 100 100,003 100,003
84 84 6,176,790 6,176,790
56 51 99,815,153 82,718,215
16 16 899,000 899,000
100 100 1,000,002 1,000,002
100 100 3,499,999 3,499,999
51 51 6,120,001 6,120,001
49 49 3,366,300 3,366,300
100 100 321,860 321,860
49 49 2,940,000 2,940,000
100 100 319,080 319,080
100 100 25,000,000 21,000,000
100 100 100,000 100,000
100 100 250,000 250,000
100 - 1 -
51 - 73,196 -
100 - 100 -
19 Other Financial Assets and Financial Liabilities
19.1 Other Non-Current Financial Assets
Consolidated Company
Available for sale
investments
Total
2016
Total
2015
Available
for sale
investments
Total
2016
Total
2015
As at 31st March Unquoted
equity
shares
Quoted
equity
shares
Unquoted
shares
Rs.’000 Rs.’000 Rs.’000 Rs.’000 Rs.’000 Rs.’000 Rs.’000
At the beginning of the year 166,678 74,800 241,478 233,613 154,234 154,234 166,704
Additions 121 - 121 345 - - -
Impairment for the year -
Effect of movement in exchange rates - - - 64 - - -
Change in fair value 1,328 19,926 - - -
At the end of the year 155,657 67,381 223,038 241,478 141,764 141,764 154,234
Notes to the Financial Statements

The World Of Hayleys A World of Care
Annual Report 2015-16 | Hayleys PLC 221
19.1.1 Investment Details
Number of shares Value
Investor Investee
2016 2015
Total
2016
Total
2015
Rs.’000 Rs.’000
Unquoted equity shares - Available for sale Investments
24,940,613 24,940,613 99,763 112,233
3,810,182 3,810,182 42,000 42,000
350,000 350,000 3,500 3,500
255,000 255,000 2,550 2,550
Haycarb Group Barrik Gold Corporation - Aus 27.20 each 3,456 3,456 171 158
Hayleys Advantis Group 38,571 38,571 10,223 8,787
Total 155,657 166,678
The unquoted equity shares do not have a quoted market price in active market and the fair value is carried at cost.
Quoted equity shares - Available for sale investments
220 220 22 24
Hayleys Advantis Group Ceybank Unit Trust 200,000 200,000 4,794 5,754
Pyramid Unit Trust 200,000 200,000 6,480 6,912
Comtrust Equity Fund 200,000 200,000 3,873 4,212
521,600 521,600 52,212 57,898
Total 67,381 74,800

Report Preamble > Hayleys at a Glance > Leadership and Governance > Our Strategy > Management Discussion and Analysis > Our Value Creation Report > Financial Statements
Hayleys PLC | Annual Report 2015-16222
19.2 Other Current Financial Assets
Consolidated
Available for sale
investments
Financial instruments at fair value through Total
2016
Total
2015
As at 31st March Quoted
equity
shares
Foreign
exchange
forward
contract
Quoted
equity
shares
Unit Trust
Rs.'000 Rs.'000 Rs.'000 Rs.'000 Rs.’000
At the beginning of the year 2,410 407 36,745 - 39,562 53,388
Additions - 32,453 - 862,832 895,285 -
Acquisition through business combinations - - 483 - 483 -
Disposals - - - - -
Change in fair value 2,965 8,662
At the end of the year 1,660 32,453 29,965 865,797 929,875 39,562
Company
As at 31st March Foreign
exchange
forward
contract
Quoted
equity
shares
Unit trust 2016 2015
Rs.'000 Rs.'000 Rs.’000
At the beginning of the year - 11,170 - 11,170 21,906
Additions 32,453 - 402,832 435,285 -
Disposals - - - -
Change in fair value - 556 6,772
At the end of the year 32,453 9,339 403,388 445,180 11,170
Notes to the Financial Statements
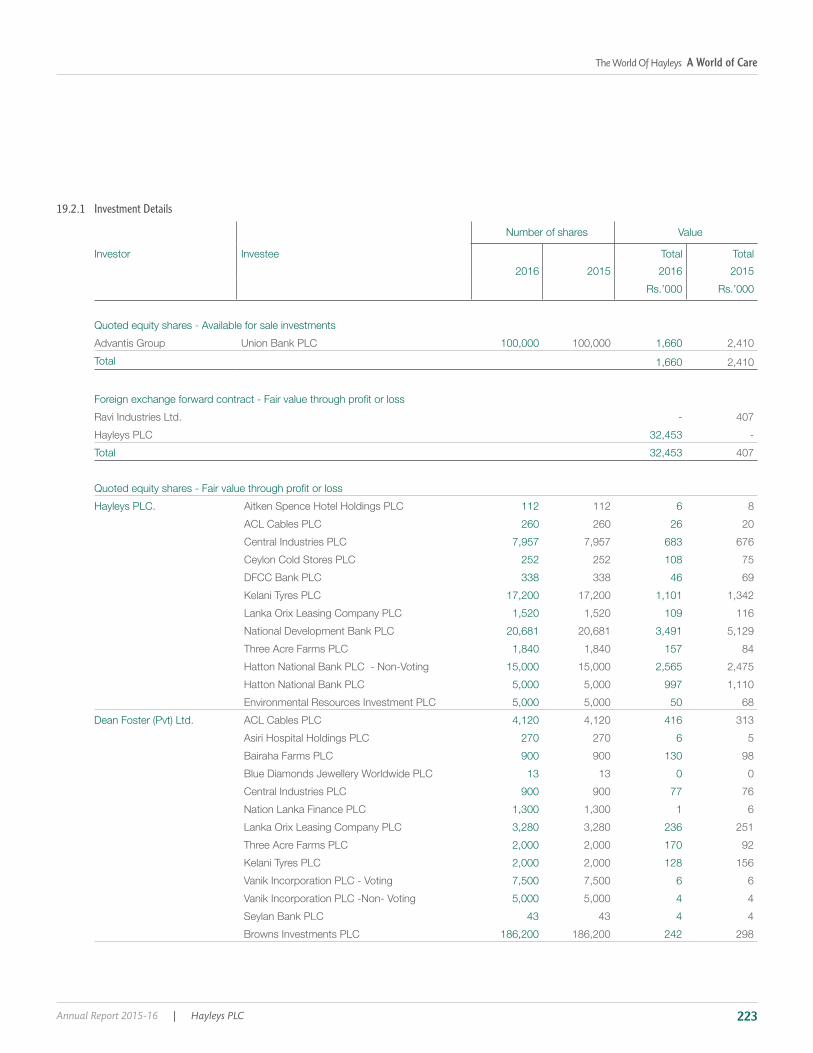
The World Of Hayleys A World of Care
Annual Report 2015-16 | Hayleys PLC 223
19.2.1 Investment Details
Number of shares Value
Investor Investee
2016 2015
Total
2016
Total
2015
Rs.’000 Rs.’000
Quoted equity shares - Available for sale investments
Advantis Group 100,000 100,000 1,660 2,410
Total 1,660 2,410
- 407
32,453 -
Total 32,453 407
112 112 6 8
260 260 26 20
7,957 7,957 683 676
252 252 108 75
338 338 46 69
17,200 17,200 1,101 1,342
1,520 1,520 109 116
20,681 20,681 3,491 5,129
1,840 1,840 157 84
15,000 15,000 2,565 2,475
5,000 5,000 997 1,110
5,000 5,000 50 68
4,120 4,120 416 313
270 270 6 5
900 900 130 98
13 13 0 0
900 900 77 76
1,300 1,300 1 6
3,280 3,280 236 251
2,000 2,000 170 92
2,000 2,000 128 156
7,500 7,500 6 6
5,000 5,000 4 4
43 43 4 4
186,200 186,200 242 298
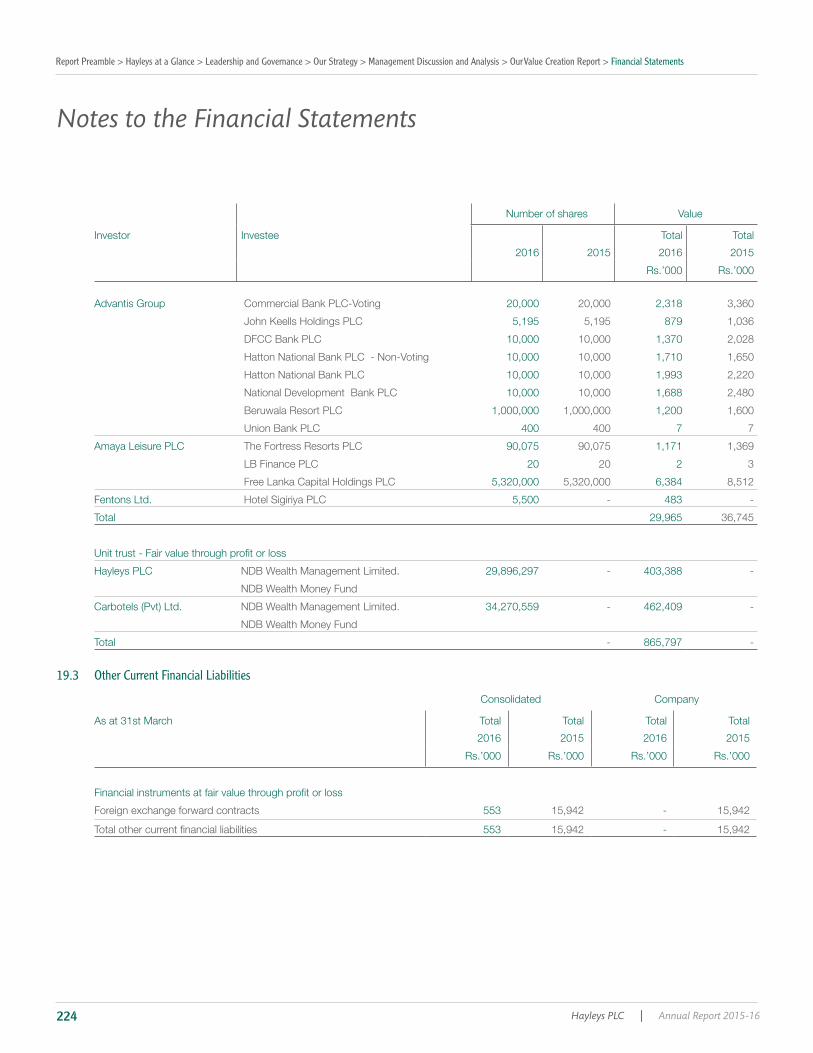
Report Preamble > Hayleys at a Glance > Leadership and Governance > Our Strategy > Management Discussion and Analysis > Our Value Creation Report > Financial Statements
Hayleys PLC | Annual Report 2015-16224
Number of shares Value
Investor Investee
2016 2015
Total
2016
Total
2015
Rs.’000 Rs.’000
Advantis Group 20,000 20,000 2,318 3,360
5,195 5,195 879 1,036
10,000 10,000 1,370 2,028
10,000 10,000 1,710 1,650
10,000 10,000 1,993 2,220
10,000 10,000 1,688 2,480
1,000,000 1,000,000 1,200 1,600
400 400 7 7
90,075 90,075 1,171 1,369
20 20 2 3
5,320,000 5,320,000 6,384 8,512
5,500 - 483 -
Total 29,965 36,745
29,896,297 - 403,388 -
NDB Wealth Money Fund
34,270,559 - 462,409 -
NDB Wealth Money Fund
Total - 865,797 -
19.3 Other Current Financial Liabilities
Consolidated Company
As at 31st March Total
2016
Total
2015
Total
2016
Total
2015
Rs.’000 Rs.’000 Rs.’000 Rs.’000
Foreign exchange forward contracts 553 15,942 - 15,942
553 15,942 - 15,942
Notes to the Financial Statements
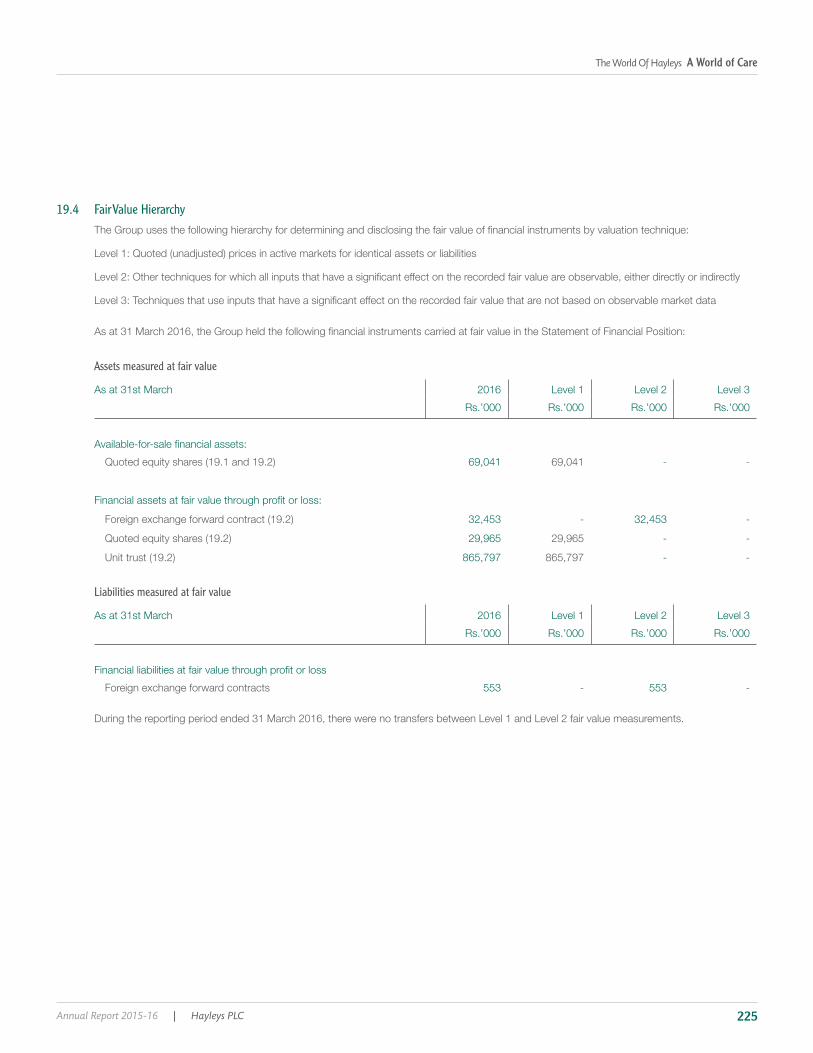
The World Of Hayleys A World of Care
Annual Report 2015-16 | Hayleys PLC 225
19.4 Fair Value Hierarchy
Assets measured at fair value
As at 31st March 2016
Rs.’000 Rs.’000 Rs.’000 Rs.’000
69,041 69,041 - -
32,453 - 32,453 -
29,965 29,965 - -
865,797 865,797 - -
Liabilities measured at fair value
As at 31st March 2016
Rs.’000 Rs.’000 Rs.’000 Rs.’000
Foreign exchange forward contracts 553 - 553 -

Report Preamble > Hayleys at a Glance > Leadership and Governance > Our Strategy > Management Discussion and Analysis > Our Value Creation Report > Financial Statements
Hayleys PLC | Annual Report 2015-16226
Fair Values
Financial Statements.
Consolidated Company
As at 31st March Carrying value
2016
Fair value Carrying value
2016
Fair value
Rs.’000 Rs.’000 Rs.’000 Rs.’000
Financial Assets
Available for sale investments 223,038 223,038 141,764 141,764
Available for sale investments 1,660 1,660 - -
928,215 928,215 445,180 445,180
Trade and other receivables 19,498,173 19,498,173 13,983 13,983
Amounts due from subsidiaries - - 1,111,039 1,111,039
Amounts due from equity accounted investees 42,162 42,162 5,762 5,762
Short term deposits 1,985,845 1,985,845 - -
Cash in hand and at bank 3,676,171 3,676,171 98,559 98,559
26,355,264 26,355,264 1,816,287 1,816,287
Interest-bearing borrowings* 18,501,311 18,487,943 6,543,430 6,546,416
Trade and other payables 13,163,671 13,163,671 241,627 241,627
Amounts due to subsidiaries - - 27,375 27,375
553 553 - -
Short-term interest-bearing borrowings 14,612,943 14,612,943 43,052 43,052
46,278,479 46,265,111 6,855,484 6,858,470
orderly transaction between market participant at the measurement date.
The following methods and assumptions were used to estimate the fair values:
- Cash in hand and at bank and short term deposits, trade receivables and trade payables approximate their carrying amounts largely due to
the short term maturities of these instruments.
- Fair value of quoted equity shares is based on price quotations at the reporting date.
Notes to the Financial Statements

The World Of Hayleys A World of Care
Annual Report 2015-16 | Hayleys PLC 227
20 Other Non Current Assets
Consolidated
As at 31st March Formers Others Total
2016
Total
2015
Rs.’000 Rs.’000 Rs.’000 Rs.’000
Cost 517,462 353,033 870,495 1,263,419
Provision for impairment
249,059 346,918 595,977 1,022,155
21 Inventories
Consolidated Company
As at 31st March 2016 2015 2016 2015
Rs.’000 Rs.’000 Rs.’000 Rs.’000
Raw materials & consumables 5,324,095 4,617,873 1,421 1,854
Produce stocks 948,119 1,228,711 - -
Nurseries 19,446 22,316 - -
Work-in-progress 1,346,125 958,621 - -
Finished goods 7,576,541 6,206,217 - -
Goods-in-transit 569,183 118,056 - -
15,783,508 13,151,794 1,421 1,854
Provision for write-down of inventories - -
- -
15,136,119 12,617,120 1,421 1,854
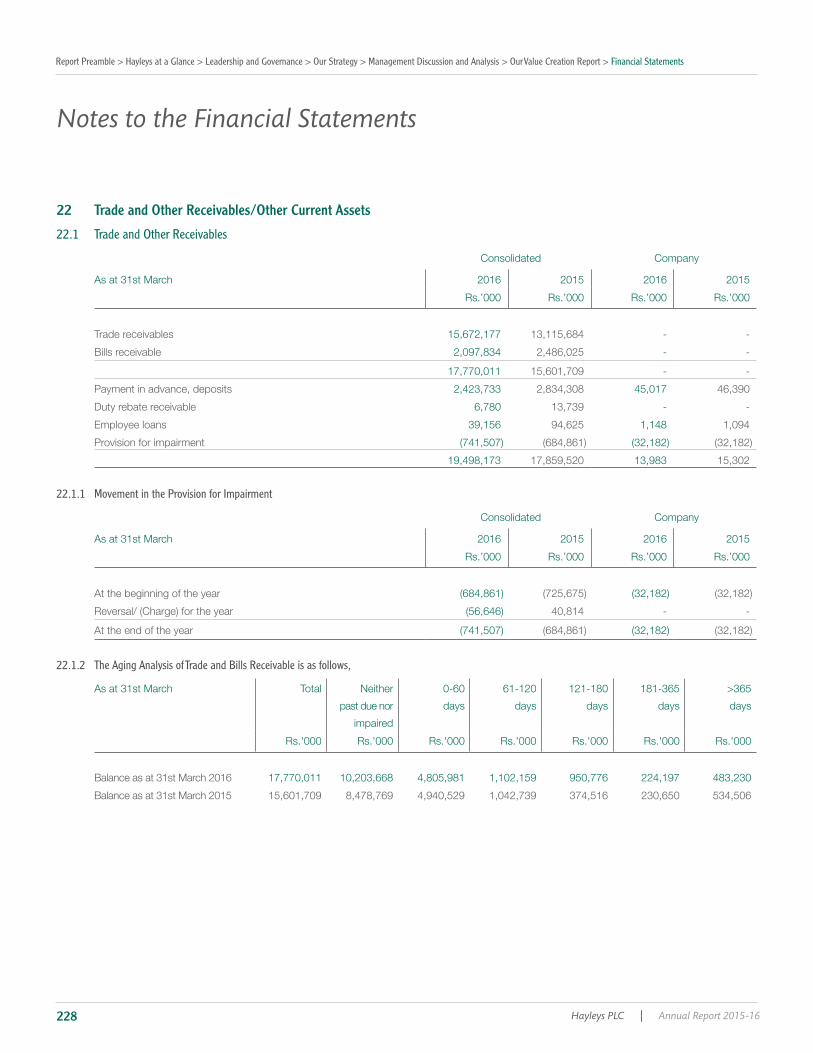
Report Preamble > Hayleys at a Glance > Leadership and Governance > Our Strategy > Management Discussion and Analysis > Our Value Creation Report > Financial Statements
Hayleys PLC | Annual Report 2015-16228
22 Trade and Other Receivables/Other Current Assets
22.1 Trade and Other Receivables
Consolidated Company
As at 31st March 2016 2015 2016 2015
Rs.’000 Rs.’000 Rs.’000 Rs.’000
Trade receivables 15,672,177 13,115,684 - -
Bills receivable 2,097,834 2,486,025 - -
17,770,011 15,601,709 - -
Payment in advance, deposits 2,423,733 2,834,308 45,017 46,390
Duty rebate receivable 6,780 13,739 - -
Employee loans 39,156 94,625 1,148 1,094
Provision for impairment (741,507) (684,861) (32,182) (32,182)
19,498,173 17,859,520 13,983 15,302
22.1.1 Movement in the Provision for Impairment
Consolidated Company
As at 31st March 2016 2015 2016 2015
Rs.’000 Rs.’000 Rs.’000 Rs.’000
At the beginning of the year (684,861) (725,675) (32,182) (32,182)
Reversal/ (Charge) for the year (56,646) 40,814 - -
At the end of the year (741,507) (684,861) (32,182) (32,182)
22.1.2 The Aging Analysis of Trade and Bills Receivable is as follows,
As at 31st March Total Neither
past due nor
impaired
0-60
days
61-120
days
121-180
days
181-365
days
>365
days
Rs.'000 Rs.'000 Rs.'000 Rs.'000 Rs.'000 Rs.'000 Rs.'000
Balance as at 31st March 2016 17,770,011 10,203,668 4,805,981 1,102,159 950,776 224,197 483,230
Balance as at 31st March 2015 15,601,709 8,478,769 4,940,529 1,042,739 374,516 230,650 534,506
Notes to the Financial Statements

The World Of Hayleys A World of Care
Annual Report 2015-16 | Hayleys PLC 229
22.1.3 Currency-wise Analysis of Trade and Other Receivables
Consolidated Company
As at 31st March 2016 2015 2016 2015
Rs.’000 Rs.’000 Rs.’000 Rs.’000
10,790,582 9,658,702 13,983 15,302
Australian Dollars 83,862 179,269 - -
Pounds Sterling 146,877 342,938 - -
United States Dollars 5,016,913 4,718,199 - -
Euro 2,069,142 1,918,021 - -
Thai Baht 124,111 155,216 - -
Indian Rupees 30,935 31,764 - -
219,153 324,115 - -
Bangladesh Taka 451,089 232,857 - -
Others 565,509 298,440 - -
19,498,173 17,859,520 13,983 15,302
22.2 Other Current Assets
Consolidated Company
As at 31st March 2016 2015 2016 2015
Rs.’000 Rs.’000 Rs.’000 Rs.’000
Prepayments 1,179,366 844,056 11,134 10,036
42,791 21,288 - -
VAT receivables 208,987 249,051 - -
Other tax receivables 102,087 158,900 - -
1,533,231 1,273,295 11,134 10,036
23 Stated Capital
Company
As at 31st March 2016 2015
Rs.’000 Rs.’000
Issued & fully paid - ordinary shares
At the beginning of the year 1,575,000 1,575,000
At the end of the year 1,575,000 1,575,000
The holders of ordinary shares are entitled to receive dividends as declared from time to time and are entitled to one vote per share at meetings of
the Company.
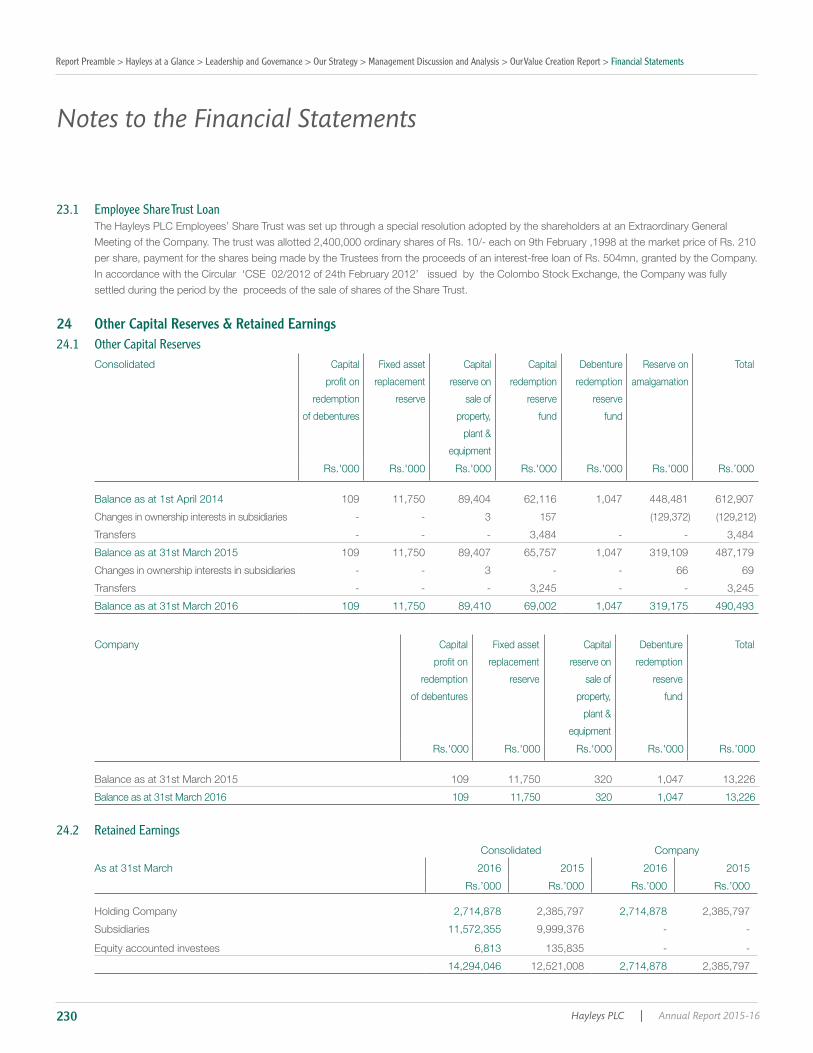
Report Preamble > Hayleys at a Glance > Leadership and Governance > Our Strategy > Management Discussion and Analysis > Our Value Creation Report > Financial Statements
Hayleys PLC | Annual Report 2015-16230
23.1 Employee Share Trust Loan
Meeting of the Company. The trust was allotted 2,400,000 ordinary shares of Rs. 10/- each on 9th February ,1998 at the market price of Rs. 210
per share, payment for the shares being made by the Trustees from the proceeds of an interest-free loan of Rs. 504mn, granted by the Company.
In accordance with the Circular ‘CSE 02/2012 of 24th February 2012’ issued by the Colombo Stock Exchange, the Company was fully
settled during the period by the proceeds of the sale of shares of the Share Trust.
24 Other Capital Reserves & Retained Earnings24.1 Other Capital Reserves
Consolidated Capital
redemption
of debentures
Fixed asset
replacement
reserve
Capital
reserve on
sale of
property,
plant &
equipment
Capital
redemption
reserve
fund
Debenture
redemption
reserve
fund
Reserve on
amalgamation
Total
Rs.'000 Rs.'000 Rs.'000 Rs.'000 Rs.'000 Rs.'000 Rs.’000
Balance as at 1st April 2014 109 11,750 89,404 62,116 1,047 448,481 612,907
Changes in ownership interests in subsidiaries - - 3 157
Transfers - - - 3,484 - - 3,484
Balance as at 31st March 2015 109 11,750 89,407 65,757 1,047 319,109 487,179
Changes in ownership interests in subsidiaries - - 3 - - 66 69
Transfers - - - 3,245 - - 3,245
Balance as at 31st March 2016 109 11,750 89,410 69,002 1,047 319,175 490,493
Company Capital
redemption
of debentures
Fixed asset
replacement
reserve
Capital
reserve on
sale of
property,
plant &
equipment
Debenture
redemption
reserve
fund
Total
Rs.'000 Rs.'000 Rs.'000 Rs.'000 Rs.’000
Balance as at 31st March 2015 109 11,750 320 1,047 13,226
Balance as at 31st March 2016 109 11,750 320 1,047 13,226
24.2 Retained EarningsConsolidated Company
As at 31st March 2016 2015 2016 2015
Rs.’000 Rs.’000 Rs.’000 Rs.’000
Holding Company 2,714,878 2,385,797 2,714,878 2,385,797
Subsidiaries 11,572,355 9,999,376 - -
Equity accounted investees 6,813 135,835 - -
14,294,046 12,521,008 2,714,878 2,385,797
Notes to the Financial Statements

The World Of Hayleys A World of Care
Annual Report 2015-16 | Hayleys PLC 231
24.3 Super Gain Tax
was liable for Super Gain Tax of Rs. 939.8 mn and Rs. 22.6 mn respectively. According to the Act, the Super Gain Tax was deemed to be
an expenditure in the Financial Statements relating to the year of assessment which commenced on 1 April 2013. The Act supersedes the
25 Interest Bearing Borrowings
Consolidated Company
As at 31st March 2016 2015 2016 2015
Rs.’000 Rs.’000 Rs.’000 Rs.’000
25.1 Total Non-Current Portion of Interest Bearing Borrowings
Finance lease obligations 611,063 598,736 - -
Debentures 1,991,065 3,979,481 1,991,065 3,979,481
9,663,592 7,491,057 1,564,600 1,688,338
Total non-current interest-bearing borrowings 12,265,720 12,069,274 3,555,665 5,667,819
Consolidated Company
As at 31st March 2016 2015 2016 2015
Rs.’000 Rs.’000 Rs.’000 Rs.’000
25.2 Current Portion of Interest Bearing Borrowings
Finance lease obligations 76,297 70,705 - -
Debentures 1,998,176 - 1,998,176 -
4,161,118 3,616,139 989,589 1,214,729
Total current interest-bearing borrowings 6,235,591 3,686,844 2,987,765 1,214,729
25.3 Finance Lease Obligations
Consolidated
As at 31st March 2016 2015
Rs.’000 Rs.’000
At the beginning of the year 2,654,242 2,753,853
New leases obtained 17,863 9,456
2,672,105 2,763,309
Acquisition through business combinations 36,666 5,507
Effect of movement in exchange rates 1,775 30
Repayments
At the end of the year 2,591,995 2,654,242
Finance charge unamortised
Net lease obligation 687,360 669,441
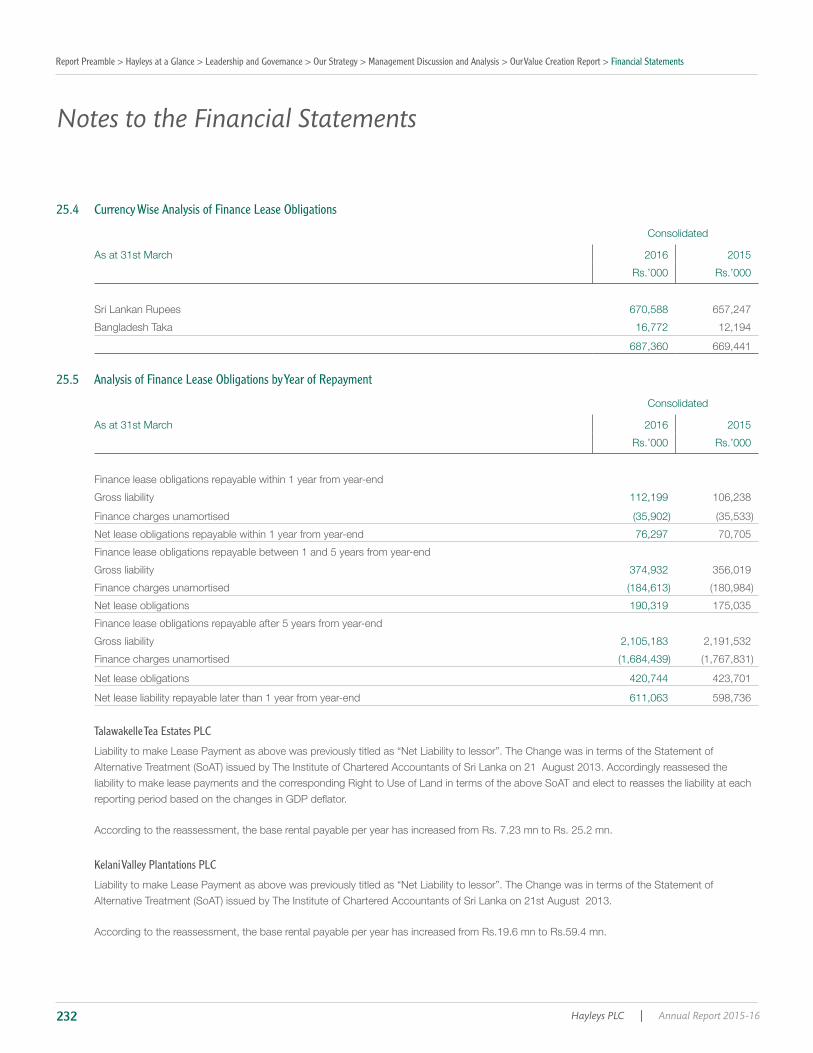
Report Preamble > Hayleys at a Glance > Leadership and Governance > Our Strategy > Management Discussion and Analysis > Our Value Creation Report > Financial Statements
Hayleys PLC | Annual Report 2015-16232
25.4 Currency Wise Analysis of Finance Lease Obligations
Consolidated
As at 31st March 2016 2015
Rs.’000 Rs.’000
670,588 657,247
Bangladesh Taka 16,772 12,194
687,360 669,441
25.5 Analysis of Finance Lease Obligations by Year of Repayment
Consolidated
As at 31st March 2016 2015
Rs.’000 Rs.’000
Finance lease obligations repayable within 1 year from year-end
Gross liability 112,199 106,238
Finance charges unamortised
Net lease obligations repayable within 1 year from year-end 76,297 70,705
Finance lease obligations repayable between 1 and 5 years from year-end
Gross liability 374,932 356,019
Finance charges unamortised
Net lease obligations 190,319 175,035
Finance lease obligations repayable after 5 years from year-end
Gross liability 2,105,183 2,191,532
Finance charges unamortised
Net lease obligations 420,744 423,701
Net lease liability repayable later than 1 year from year-end 611,063 598,736
Talawakelle Tea Estates PLC
According to the reassessment, the base rental payable per year has increased from Rs. 7.23 mn to Rs. 25.2 mn.
Kelani Valley Plantations PLC
According to the reassessment, the base rental payable per year has increased from Rs.19.6 mn to Rs.59.4 mn.
Notes to the Financial Statements

The World Of Hayleys A World of Care
Annual Report 2015-16 | Hayleys PLC 233
25.6 Debentures
Consolidated Company
As at 31st March 2016 2015 2016 2015
Rs.’000 Rs.’000 Rs.’000 Rs.’000
At the beginning of the year 3,979,481 2,040,000 3,979,481 2,000,000
Issued during the year - 2,000,000 - 2,000,000
Repayments during the year - - -
At the end of the year 3,979,481 4,000,000 3,979,481 4,000,000
Amortisation of debenture issue expense 9,760 9,760
Net Debentures 3,989,241 3,979,481 3,989,241 3,979,481
Repayable within one year 1,998,176 - 1,998,176 -
Repayable after one year 1,991,065 3,979,481 1,991,065 3,979,481
Listed Debentures
Details regarding the listed debentures are as follows;
Debenture 1 -
Debenture 2 -
Debenture 3 -
25.7 Currency wise Analysis of Debentures
Consolidated Company
As at 31st March 2016 2015 2016 2015
Rs.’000 Rs.’000 Rs.’000 Rs.’000
3,989,241 3,979,481 3,989,241 3,979,481
3,989,241 3,979,481 3,989,241 3,979,481

Report Preamble > Hayleys at a Glance > Leadership and Governance > Our Strategy > Management Discussion and Analysis > Our Value Creation Report > Financial Statements
Hayleys PLC | Annual Report 2015-16234
25.8 Analysis of Debentures by Year of RepaymentConsolidated Company
As at 31st March 2016 2015 2016 2015
Rs.’000 Rs.’000 Rs.’000 Rs.’000
- 1,983,484 - 1,983,484
1,991,065 1,995,997 1,991,065 1,995,997
1,991,065 3,979,481 1,991,065 3,979,481
25.9 Long term BorrowingsConsolidated Company
As at 31st March 2016 2015 2016 2015
Rs.’000 Rs.’000 Rs.’000 Rs.’000
At the beginning of the year 11,107,196 9,114,759 2,903,067 2,986,214
Acquisitions through business combinations 546,009 968,729 - -
Effect of movements in exchange rates 391,994 44,041 36,300 30,599
Adjustment for USD loan facility fee 6,338 6,337 6,339 6,337
New loans obtained 6,799,581 4,260,150 1,442,000 1,000,000
18,851,118 14,394,016 4,387,706 4,023,150
Repayments
At the end of the year 13,824,710 11,107,196 2,554,189 2,903,067
Repayable after one year 9,663,592 7,491,057 1,564,600 1,688,338
25.9.1 Rs. 1,442 mn, 1,327 mn, 896 mn, 540 mn, respectively.
25.10 Currency wise Analysis of Long Term BorrowingsConsolidated Company
As at 31st March 2016 2015 2016 2015
Rs.’000 Rs.’000 Rs.’000 Rs.’000
6,910,370 6,193,069 866,667 2,243,333
United States Dollars 6,781,358 4,742,962 1,687,522 659,734
Euro 103,477 121,227 - -
Bangladesh Taka 26,928 36,732 - -
Thai Baht 2,577 13,206 - -
13,824,710 11,107,196 2,554,189 2,903,067
Notes to the Financial Statements
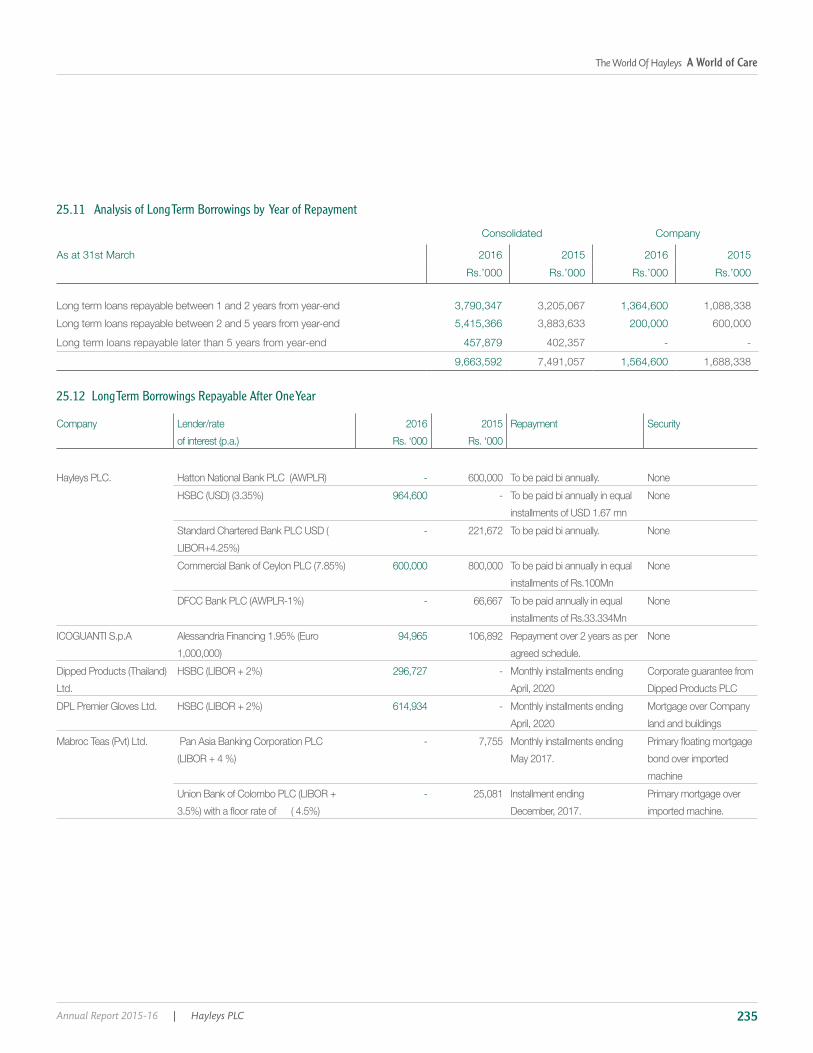
The World Of Hayleys A World of Care
Annual Report 2015-16 | Hayleys PLC 235
25.11 Analysis of Long Term Borrowings by Year of Repayment
Consolidated Company
As at 31st March 2016 2015 2016 2015
Rs.’000 Rs.’000 Rs.’000 Rs.’000
3,790,347 3,205,067 1,364,600 1,088,338
5,415,366 3,883,633 200,000 600,000
457,879 402,357 - -
9,663,592 7,491,057 1,564,600 1,688,338
25.12 Long Term Borrowings Repayable After One Year
Company 2016
Rs. ‘000
2015
Rs. ‘000
Repayment Security
- 600,000 To be paid bi annually. None
964,600 - To be paid bi annually in equal
installments of USD 1.67 mn
None
- 221,672 To be paid bi annually. None
600,000 800,000 To be paid bi annually in equal
installments of Rs.100Mn
None
- 66,667 To be paid annually in equal
installments of Rs.33.334Mn
None
ICOGUANTI S.p.A 94,965 106,892 Repayment over 2 years as per
agreed schedule.
None
296,727 - Monthly installments ending
April, 2020
Corporate guarantee from
614,934 - Monthly installments ending
April, 2020
Mortgage over Company
land and buildings
- 7,755 Monthly installments ending
May 2017. bond over imported
machine
- 25,081 Installment ending
December, 2017.
Primary mortgage over
imported machine.

Report Preamble > Hayleys at a Glance > Leadership and Governance > Our Strategy > Management Discussion and Analysis > Our Value Creation Report > Financial Statements
Hayleys PLC | Annual Report 2015-16236
Company 2016
Rs. ‘000
2015
Rs. ‘000
Repayment Security
- 9,333 Monthly installments ending
March, 2017.
Primary mortgage over
the leashold rights of four
estates. 109,922 - Monthly installments
ending 2021.
47,441 Monthly installments
commenced on February 2016
Primary mortgage over the
leasehold rights, buildings,
plant & mechinery of three
estates.
with a cap of 14%
38,862 47,230 Monthly installments
ending 2021.
None
with a cap of 14%
83,333 100,000 Monthly installments
ending 2023.
None
with a cap of 14%
44,359 - Monthly installments
ending 2023.
None
7,929 27,691 Monthly installments over 5
years commencing June, 2011
None
6,511 29,997 Monthly installments over 5
years commencing July, 2012
None
21,269 36,396 60 equal monthly installments
commencing June, 2013.
None
22,620 38,707 60 equal monthly installments
commencing July, 2013.
None
51,675 - 60 equal monthly installments
commencing from March 2016
None
9,130 22,670 47 equal monthly installments
commencing November, 2013.
None
41,448 79,853 60 equal monthly installments
commencing September,2012.
Mortgage over the share
Value Added Products
Rs.400 mn.
25,537 49,198 12 grace period plus
60 Monthly installments
commencing July 2014.
None
42,638 81,625 12 grace period plus
60 Monthly installments
commencing July 2014.
None
Notes to the Financial Statements
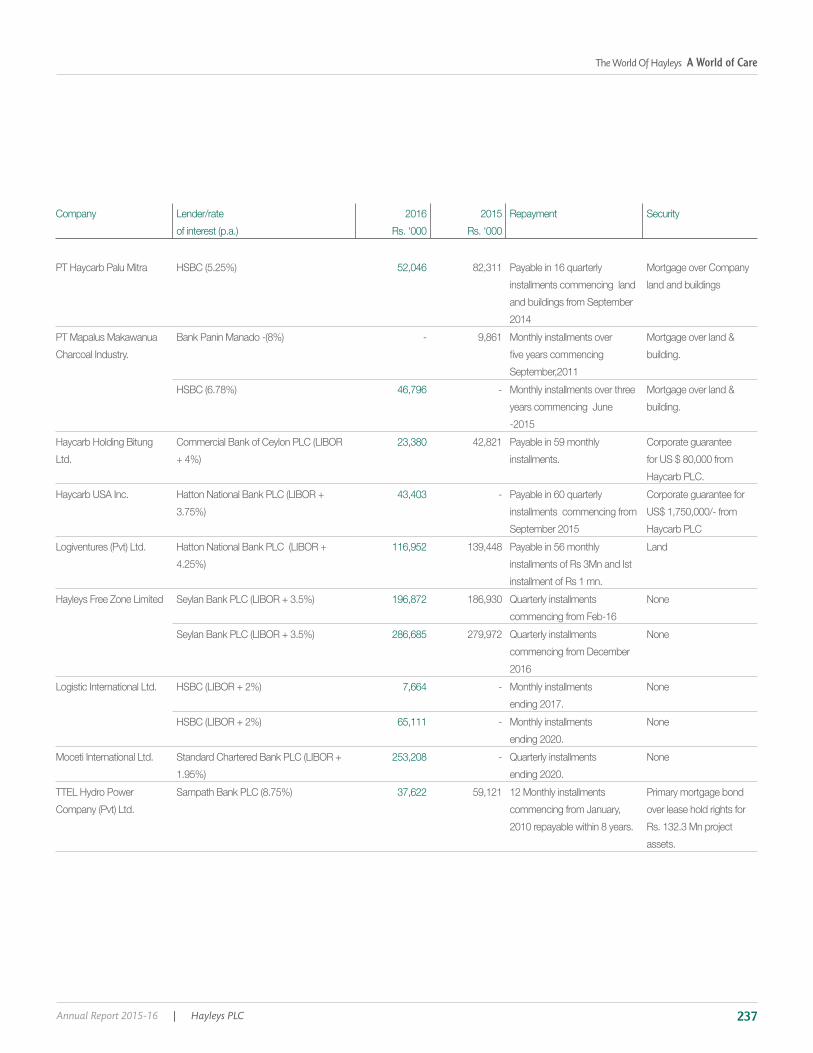
The World Of Hayleys A World of Care
Annual Report 2015-16 | Hayleys PLC 237
Company 2016
Rs. ‘000
2015
Rs. ‘000
Repayment Security
PT Haycarb Palu Mitra 52,046 82,311 Payable in 16 quarterly
installments commencing land
and buildings from September
2014
Mortgage over Company
land and buildings
PT Mapalus Makawanua
Charcoal Industry.
- 9,861 Monthly installments over
September,2011
Mortgage over land &
building.
46,796 - Monthly installments over three
years commencing June
-2015
Mortgage over land &
building.
Haycarb Holding Bitung 23,380 42,821 Payable in 59 monthly
installments.
Corporate guarantee
Haycarb USA Inc. 43,403 - Payable in 60 quarterly
installments commencing from
September 2015
Corporate guarantee for
116,952 139,448 Payable in 56 monthly
installments of Rs 3Mn and Ist
installment of Rs 1 mn.
196,872 186,930 Quarterly installments
commencing from Feb-16
None
286,685 279,972 Quarterly installments
commencing from December
2016
None
7,664 - Monthly installments
ending 2017.
None
65,111 - Monthly installments
ending 2020.
None
253,208 - Quarterly installments
ending 2020.
None
37,622 59,121 12 Monthly installments
commencing from January,
2010 repayable within 8 years.
Primary mortgage bond
over lease hold rights for
Rs. 132.3 Mn project
assets.
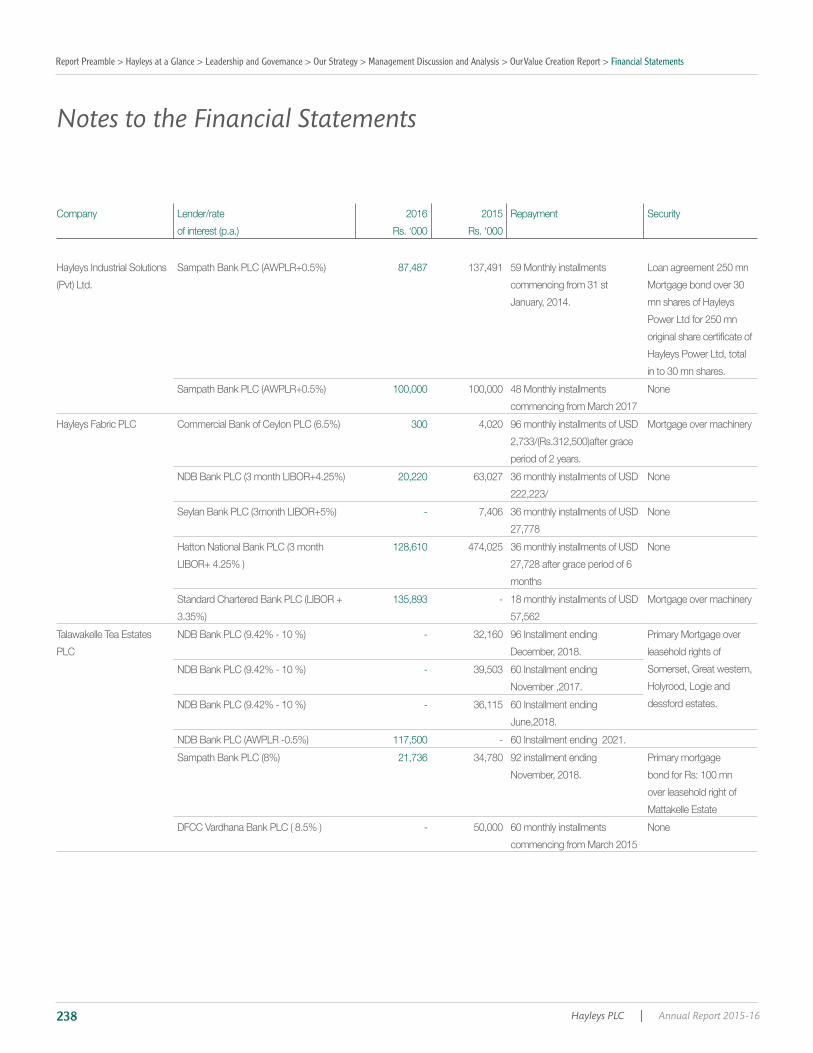
Report Preamble > Hayleys at a Glance > Leadership and Governance > Our Strategy > Management Discussion and Analysis > Our Value Creation Report > Financial Statements
Hayleys PLC | Annual Report 2015-16238
Company 2016
Rs. ‘000
2015
Rs. ‘000
Repayment Security
Hayleys Industrial Solutions 87,487 137,491 59 Monthly installments
commencing from 31 st
January, 2014.
Mortgage bond over 30
mn shares of Hayleys
in to 30 mn shares.
100,000 100,000 48 Monthly installments
commencing from March 2017
None
300 4,020 96 monthly installments of USD
period of 2 years.
Mortgage over machinery
20,220 63,027 36 monthly installments of USD
222,223/
None
- 7,406 36 monthly installments of USD
27,778
None
128,610 474,025 36 monthly installments of USD
27,728 after grace period of 6
months
None
135,893 - 18 monthly installments of USD
57,562
Mortgage over machinery
Talawakelle Tea Estates - 32,160 96 Installment ending
December, 2018.
Primary Mortgage over
leasehold rights of
Somerset, Great western,
dessford estates.
- 39,503 60 Installment ending
November ,2017.
- 36,115 60 Installment ending
June,2018.
117,500 - 60 Installment ending 2021.
21,736 34,780 92 installment ending
November, 2018.
Primary mortgage
bond for Rs: 100 mn
over leasehold right of
Mattakelle Estate
- 50,000 60 monthly installments
commencing from March 2015
None
Notes to the Financial Statements

The World Of Hayleys A World of Care
Annual Report 2015-16 | Hayleys PLC 239
Company 2016
Rs. ‘000
2015
Rs. ‘000
Repayment Security
1,519 7,793 Installment ending September,
2017.
Primary Mortgage over
475 2,375 Quarterly installments from
September 2012.
Primary Mortgage over
78,538 88,877 Quarterly installments from
September 2012.
Primary Mortgage over
- 1,682 Equal monthly installments from
October 2011.
Primary Mortgage over
- 2,639 Equal monthly installments from
March 2011.
Primary Mortgage over
21,429 35,714 One year grace period loan
repayment start date from
January 2012.
115,000 - 60 Installment ending 2021. None
112,500 - 60 Installment ending 2021. Corporate guarantee for
Rs.250 mn from Volanka
- 1,042 June 2010 to June 2016 Mortgage over machinery
- 2,042 36 monthly installments ending
May, 2016.
None
398,990 605,050 6 year including 1& 1/2 yea
grace period
Mortgage on leasehold
right of the land.
964,567 1,111,000 Semi annual repayment
on each 15th of June and
December respectively
commencing on 15th June
2015. for 12 installments
Mortgage on leasehold
furniture, equipment and
technical equipment.
- 4,200 60 monthly equal installment. Registered mortgage over
land and building
20,338 22,438 60 monthly equal installment. None
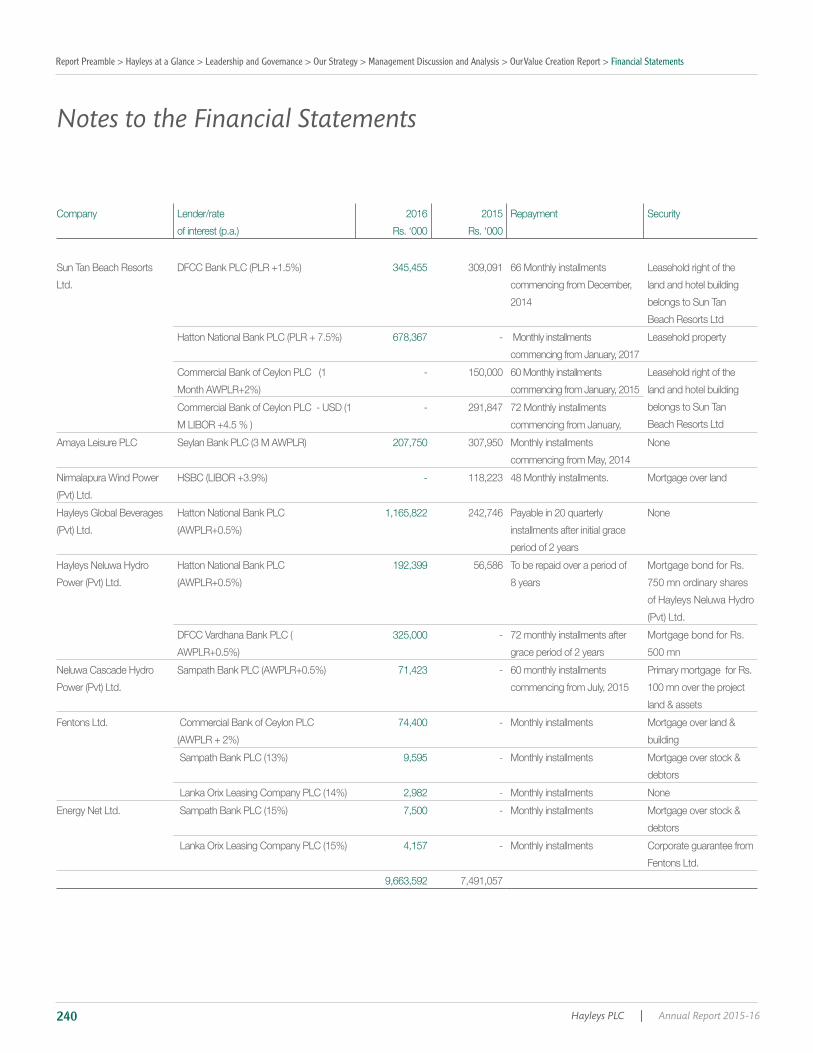
Report Preamble > Hayleys at a Glance > Leadership and Governance > Our Strategy > Management Discussion and Analysis > Our Value Creation Report > Financial Statements
Hayleys PLC | Annual Report 2015-16240
Company 2016
Rs. ‘000
2015
Rs. ‘000
Repayment Security
Sun Tan Beach Resorts 345,455 309,091 66 Monthly installments
commencing from December,
2014
land and hotel building
belongs to Sun Tan
678,367 - Monthly installments
commencing from January, 2017
- 150,000 60 Monthly installments
commencing from January, 2015 land and hotel building
belongs to Sun Tan - 291,847 72 Monthly installments
commencing from January,
207,750 307,950 Monthly installments
commencing from May, 2014
None
Nirmalapura Wind Power - 118,223 48 Monthly installments. Mortgage over land
Hayleys Global Beverages 1,165,822 242,746 Payable in 20 quarterly
installments after initial grace
period of 2 years
None
Hayleys Neluwa Hydro 192,399 56,586 To be repaid over a period of
8 years
Mortgage bond for Rs.
750 mn ordinary shares
of Hayleys Neluwa Hydro
325,000 - 72 monthly installments after
grace period of 2 years
Mortgage bond for Rs.
500 mn
Neluwa Cascade Hydro 71,423 - 60 monthly installments
commencing from July, 2015
Primary mortgage for Rs.
100 mn over the project
land & assets
74,400 - Monthly installments Mortgage over land &
building
9,595 - Monthly installments Mortgage over stock &
debtors
2,982 - Monthly installments None
7,500 - Monthly installments Mortgage over stock &
debtors
4,157 - Monthly installments Corporate guarantee from
9,663,592 7,491,057
Notes to the Financial Statements

The World Of Hayleys A World of Care
Annual Report 2015-16 | Hayleys PLC 241
26 Grants
Consolidated
As at 31st March 2016 2015
Rs.’000 Rs.’000
At the beginning of the year 713,495 742,077
Grants received during the year 90,288 25,091
Amortised during the year
At the end of the year 739,677 713,495
26.1 Grants Received for the Group is as follows:
Development, Asian Development Bank, Social Welfare Project, Estate Infrastructures Development Project , Plantation Development Support
Project Ceylon Electricity Board, Tea Board and Rubber Development Division of the Ministry of Plantations Industry.
boiler to dendro thermal power.
27 Deferred Taxation
Consolidated
As at 31st March 2016 2015
Rs.’000 Rs.’000
27.1. Deferred Tax AssetsDeferred tax assets 399,193 386,698
Deferred tax liabilities 1,496,269 1,363,237
1,097,076 976,539
27. 2 Net Deferred Tax liability At the beginning of the year 976,539 867,755
142,342 93,555
Amount reversed during the year- Other Comprehensive Income
Acquisition through business combinations 14,220 12,607
Effect of movements in exchange rates 14,279 8,014
At the end of the year 1,097,076 976,539
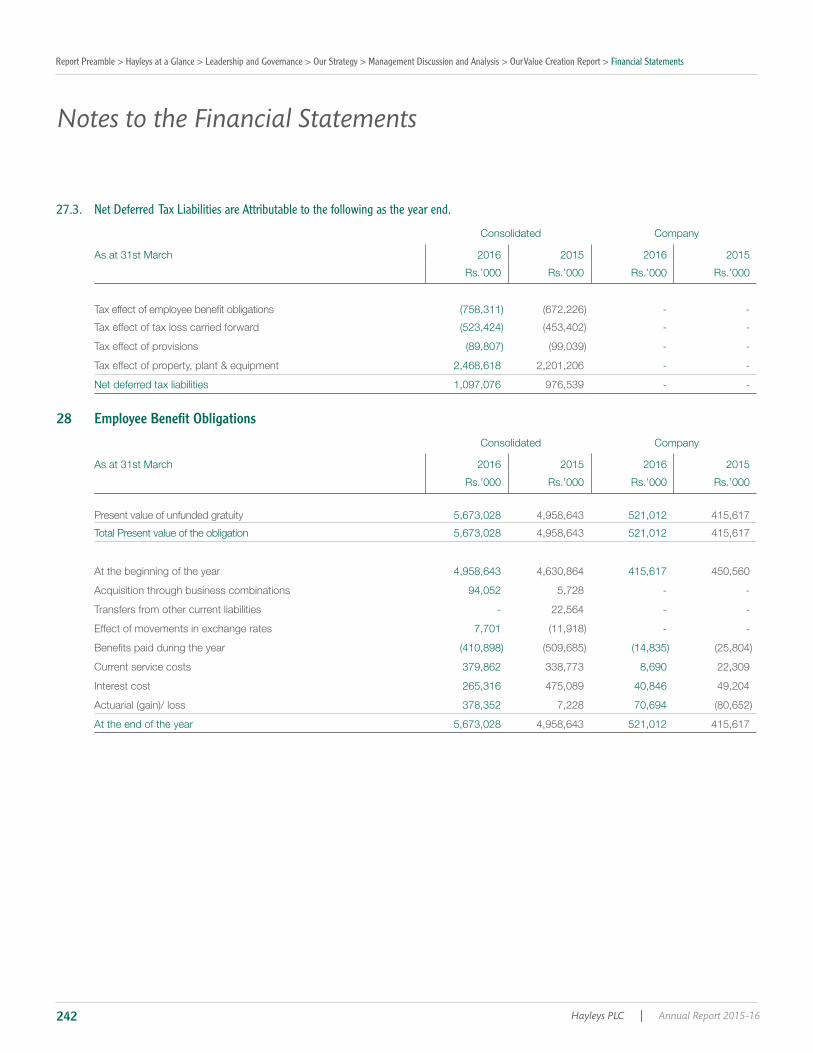
Report Preamble > Hayleys at a Glance > Leadership and Governance > Our Strategy > Management Discussion and Analysis > Our Value Creation Report > Financial Statements
Hayleys PLC | Annual Report 2015-16242
27.3. Net Deferred Tax Liabilities are Attributable to the following as the year end.
Consolidated Company
As at 31st March 2016 2015 2016 2015
Rs.’000 Rs.’000 Rs.’000 Rs.’000
- -
Tax effect of tax loss carried forward - -
Tax effect of provisions - -
Tax effect of property, plant & equipment 2,468,618 2,201,206 - -
Net deferred tax liabilities 1,097,076 976,539 - -
28 Employee Benefit Obligations
Consolidated Company
As at 31st March 2016 2015 2016 2015
Rs.’000 Rs.’000 Rs.’000 Rs.’000
Present value of unfunded gratuity 5,673,028 4,958,643 521,012 415,617
Total Present value of the obligation 5,673,028 4,958,643 521,012 415,617
At the beginning of the year 4,958,643 4,630,864 415,617 450,560
Acquisition through business combinations 94,052 5,728 - -
Transfers from other current liabilities - 22,564 - -
Effect of movements in exchange rates 7,701 - -
Current service costs 379,862 338,773 8,690 22,309
Interest cost 265,316 475,089 40,846 49,204
378,352 7,228 70,694
At the end of the year 5,673,028 4,958,643 521,012 415,617
Notes to the Financial Statements

The World Of Hayleys A World of Care
Annual Report 2015-16 | Hayleys PLC 243
Consolidated Company
As at 31st March 2016 2015 2016 2015
Rs.’000 Rs.’000 Rs.’000 Rs.’000
The expense is recognised in the following line items in the Statement of
Cost of sales 133,928 173,902 2,238 1,424
Administrative expenses 511,250 639,960 47,298 70,089
645,178 813,862 49,536 71,513
2016 2015
Rate of discount 11% 10%
Salary increase 10% 9%
Assumptions regarding future mortality are based on the A1967/70 for Staff/Executive and A1949/52 for Worker, issued by the Institute of
The demographic assumptions underlying the valuation are with respect to retirement age early withdrawals from service and retirement on
medical grounds.
Gratuity Act no 12 of 1983, applying the basis of computation given on pages 185 to 186.
28.1 Sensitivity Analysis - Salary Escalation Rate/Discount Rate
A Sensitivity was carried out as follows,
A one percentage point change in the salary escalation rate Consolidated Company
+1% -1% +1% -1%
5,899,484 5,102,499 549,715 498,748
A one percentage point change in the discount rate Consolidated Company
+1% -1% +1% -1%
5,109,068 5,844,582 498,945 549,973

Report Preamble > Hayleys at a Glance > Leadership and Governance > Our Strategy > Management Discussion and Analysis > Our Value Creation Report > Financial Statements
Hayleys PLC | Annual Report 2015-16244
28.2 Distribution of Employee Benefit Obligation Over Future Working Lifetime
Consolidated Company
As at 31st March 2016 2015 2016 2015
Rs.’000 Rs.’000 Rs.’000 Rs.’000
517,912 727,903 30,349 121,132
Over 1 year and less than or equal 5 years 1,477,294 1,050,207 172,537 200,583
Over 5 year and less than or equal 10 years 1,746,245 1,902,433 243,898 93,902
Over 10 years 1,931,577 1,278,100 74,228 -
Total 5,673,028 4,958,643 521,012 415,617
29 Trade and Other Payables/ Provisions
29.1 Trade and Other Payables
Consolidated Company
As at 31st March 2016 2015 2016 2015
Rs.’000 Rs.’000 Rs.’000 Rs.’000
Trade payables 5,097,696 5,102,530 - -
Bills payable 1,562,341 1,162,739 - -
Other payables including accrued expenses 6,404,512 5,475,937 189,844 244,482
Unclaimed dividends 99,122 202,203 51,783 49,481
13,163,671 11,943,409 241,627 293,963
29.2 Currency Wise Analysis of Trade and Other Payables
Consolidated Company
As at 31st March 2016 2015 2016 2015
Rs.’000 Rs.’000 Rs.’000 Rs.’000
6,644,536 6,061,535 241,627 293,963
Pounds Sterling 35,169 101,335 - -
United States Dollars 4,086,631 3,186,229 - -
Euro 804,985 1,104,993 - -
Thai Baht 1,128,905 1,118,371 - -
Bangladesh Taka 133,380 96,234 - -
Others 330,065 274,712 - -
13,163,671 11,943,409 241,627 293,963
Notes to the Financial Statements

The World Of Hayleys A World of Care
Annual Report 2015-16 | Hayleys PLC 245
29.3 ProvisionsConsolidated
As at 31st March Maintenance
warranties **
Other Total
2016
Total
2015
Rs.’000 Rs.’000 Rs.’000 Rs.’000
At the beginning of the year 10,855 14,624 25,479 28,792
Arising during the year 2,145 21,897 24,042 19,458
Utilised
At the end of the year 10,383 12,279 22,662 25,479
a warranty provision in the Financial Statements for any warranty claim which may arrise on machines sold.
29.4 Other Current LiabilitiesConsolidated Company
As at 31st March 2016 2015 2016 2015
Rs.’000 Rs.’000 Rs.’000 Rs.’000
Other tax payable 115,605 87,319 10,823 11,650
Payments received in advance 1,701,947 410,471 - -
1,817,552 497,790 10,823 11,650
30 Income TaxConsolidated Company
As at 31st March 2016 2015 2016 2015
Rs.’000 Rs.’000 Rs.’000 Rs.’000
30.1 Income Tax Recoverable 218,899 219,469 2,287 1,752
30.2 Income Tax Payable At the beginning of the year 296,155 202,589 1,688
1,319,419 1,068,338 3,672 4,094
Irrecoverable economic service charge 4,410 406 - -
Under provision in respect of previous years 59,075 80,396 17,460 4,471
Tax on dividend 231,287 270,885 - -
Acquisition through business combinations 13,941 - -
Effect of movements in exchange rates 14,168 752 - -
Payments made during the year
491,515 296,155
Income tax recoverable 218,899 219,469 2,287 1,752
At the end of the year 710,414 515,624 - -

Report Preamble > Hayleys at a Glance > Leadership and Governance > Our Strategy > Management Discussion and Analysis > Our Value Creation Report > Financial Statements
Hayleys PLC | Annual Report 2015-16246
31 Short-Term Interest Bearing Borrowings
Consolidated Company
As at 31st March 2016 2015 2016 2015
Rs.’000 Rs.’000 Rs.’000 Rs.’000
7,964,397 6,882,112 43,052 37,579
Australian Dollars 1,216 11,725 - -
Pounds Sterling 273,624 38,606 - -
United States Dollars 5,082,734 4,843,571 - -
Euro 598,625 661,613 - -
Thai Baht 111,309 448,359 - -
Indonesian Rupiah 329,400 266,220 - -
Bangladesh Taka 251,638 153,859 - -
14,612,943 13,306,065 43,052 37,579
32 Contingent Liabilities and Commitments32.1 Contingent Liabilities. Company
Financial Statements.
Group
32.2 Commitments Group
As at 31st March 2016 2015
Rs.’000 Rs.’000
Repayable within one year 62,257 66,823
Repayable after one year less than 5 years 169,621 176,054
Repayable after 5 years 543,443 545,355
775,121 788,232
Notes to the Financial Statements

The World Of Hayleys A World of Care
Annual Report 2015-16 | Hayleys PLC 247
33 Foreign currency translation The principal exchange rates used for translation purposes were:
Average As at 31st March
As at 31st March 2016 2015 2016 2015
Rs.’000 Rs.’000 Rs.’000 Rs.’000
United States Dollar 139.58 131.36 144.69 133.32
Australian Dollar 102.55 113.97 110.87 101.94
Pound Sterling 209.63 211.09 207.90 197.24
Thai Baht 3.96 4.04 4.08 4.08
Bangladesh Taka 1.78 1.69 1.84 1.71
Euro 153.92 165.02 163.95 144.29
Indian Rupee 2.12 2.14 2.17 2.12
Indonesian Rupiah 0.0102 0.0108 0.0108 0.0102
9.0782 8.4567 9.4052 8.4876
34 Functional Currency
currency is different as they operate in different economic environments.
Company Functional Currency
USDTaka
PT Mapalus Makawanua Charcoal Industry RupiahUSD
Pounds Sterling Australian Dollars
Haymark Inc. USDThai Baht
Haylex BV Group Euro, Yen & USD Thai Baht
Thai BahtICOGUANTI S.p.A Euro
RupiahIndian Rupees
USDIndian Rupees
Thai BahtIndian Rupees
RupiahHaylex USA USD
RinggitSingapore Dollar

Report Preamble > Hayleys at a Glance > Leadership and Governance > Our Strategy > Management Discussion and Analysis > Our Value Creation Report > Financial Statements
Hayleys PLC | Annual Report 2015-16248
35 Events Occurring After the Reporting Date Other than those mentioned below, no circumstances have arisen since the reporting date, which would require adjustments to, or disclosure in
the Financial Statements.
35.1
35.2Details of above issue as follows,
- An issue of up to 20,000,000 senior, unsecured, listed, redeemable, rated, three year debentures at an issue price of Rs. 100 each.
- Date of opening of the subscription list will be 25th May 2016.
36 Companies with Different Accounting Years The Financial Statements of, Haylex BV Group, has been prepared for the year ended 31st December and ICOGUANTI S.p.A has prepared for
the period ended 29th February. These Companies have been consolidated based on the Financial Statements drawn up to 31st December and
29th February since their effect is not material to the Group.
36.1 Effect on Consolidation of Companies with Different Accounting Years
Financial year end of ICOGUANTI S.p.A changed to 29th February, from December 31. Accordingly Financial Statements of ICOGUANTI S.p.A
for the 14 months period from January 1, 2015 to February 29th, 2016 have been consolidated with Group Financial Statements.
01.01.2015 -
31.03.2015
01.04.2015 -
31.03.2016
01.01.2015 -
31.03.2016
3 Months 12 Months 15 Months
Revenue 1,186,291 4,066,682 5,252,973
90,220 274,678 364,898
54,374 168,602 222,976
Notes to the Financial Statements
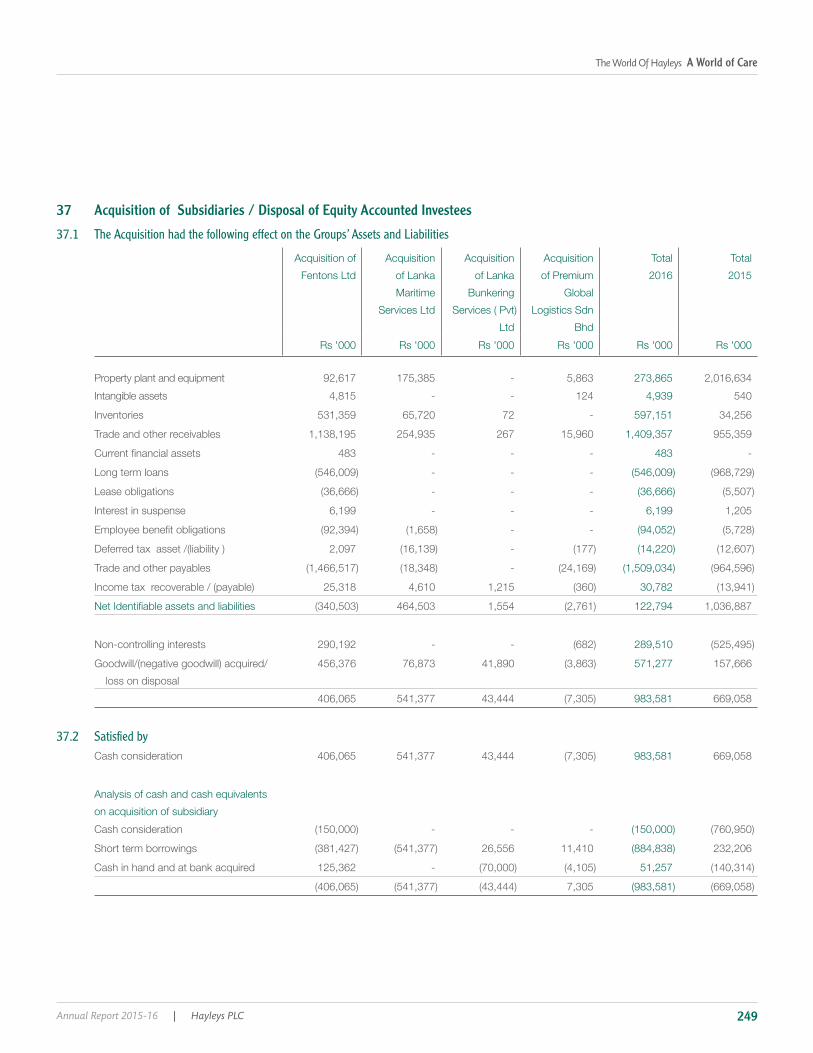
The World Of Hayleys A World of Care
Annual Report 2015-16 | Hayleys PLC 249
37 Acquisition of Subsidiaries / Disposal of Equity Accounted Investees
37.1 The Acquisition had the following effect on the Groups’ Assets and Liabilities
Acquisition of Acquisition
Maritime
Acquisition
Bunkering
Acquisition
of Premium
Global
Bhd
Total
2016
Total
2015
Rs '000 Rs '000 Rs '000 Rs '000 Rs '000 Rs '000
Property plant and equipment 92,617 175,385 - 5,863 273,865 2,016,634
Intangible assets 4,815 - - 124 4,939 540
Inventories 531,359 65,720 72 - 597,151 34,256
Trade and other receivables 1,138,195 254,935 267 15,960 1,409,357 955,359
483 - - - 483 -
- - -
- - -
Interest in suspense 6,199 - - - 6,199 1,205
- -
2,097 -
Trade and other payables -
25,318 4,610 1,215 30,782
464,503 1,554 122,794 1,036,887
Non-controlling interests 290,192 - - 289,510
loss on disposal
456,376 76,873 41,890 571,277 157,666
406,065 541,377 43,444 983,581 669,058
37.2 Satisfied by Cash consideration 406,065 541,377 43,444 983,581 669,058
Analysis of cash and cash equivalents
on acquisition of subsidiary
Cash consideration - - -
Short term borrowings 26,556 11,410 232,206
Cash in hand and at bank acquired 125,362 - 51,257
7,305

Report Preamble > Hayleys at a Glance > Leadership and Governance > Our Strategy > Management Discussion and Analysis > Our Value Creation Report > Financial Statements
Hayleys PLC | Annual Report 2015-16250
37.3 The Following Acquisition Made During the Year
37.4
As at 31st March 2016
Rs.’000
Share of net assets disposed 352,515
107,485
460,000
Cash consideration 460,000
38 Principal Subsidiaries with Material Non-Controlling Interests
inter-company eliminations, is set out below.
As at 31st March Dipped
Products
Haycarb Alumex Hayleys
Advantis
Rs'000 Rs'000 Rs'000 Rs'000
Current assets 6,799,392 7,197,683 1,548,204 6,089,083
Non-current assets 10,444,601 4,731,919 908,740 5,135,688
Total assets 17,243,993 11,929,602 2,456,944 11,224,771
-
Current liabilities 4,303,192 5,244,082 816,836 5,431,966
Non-current liabilities 4,380,128 759,559 165,470 1,761,065
Total liabilities 8,683,320 6,003,641 982,306 7,193,031
-
Equity attributable to the owners of the company 3,835,225 3,502,808 635,971 2,982,414
Non-controlling interests 4,725,448 2,423,153 838,667 1,049,326
Non-controlling interest in % 44 32 44 5
Revenue 18,794,051 11,705,825 3,995,449 15,812,275
342,047 853,223 589,123 1,105,857
151,612 430,948 328,142 630,417
190,435 422,275 260,981 475,440
Total comprehensive income 433,323 728,324 582,849 1,051,793
Dividend paid to non-controlling interests 239,446 148,561 299,303 362,650
Notes to the Financial Statements
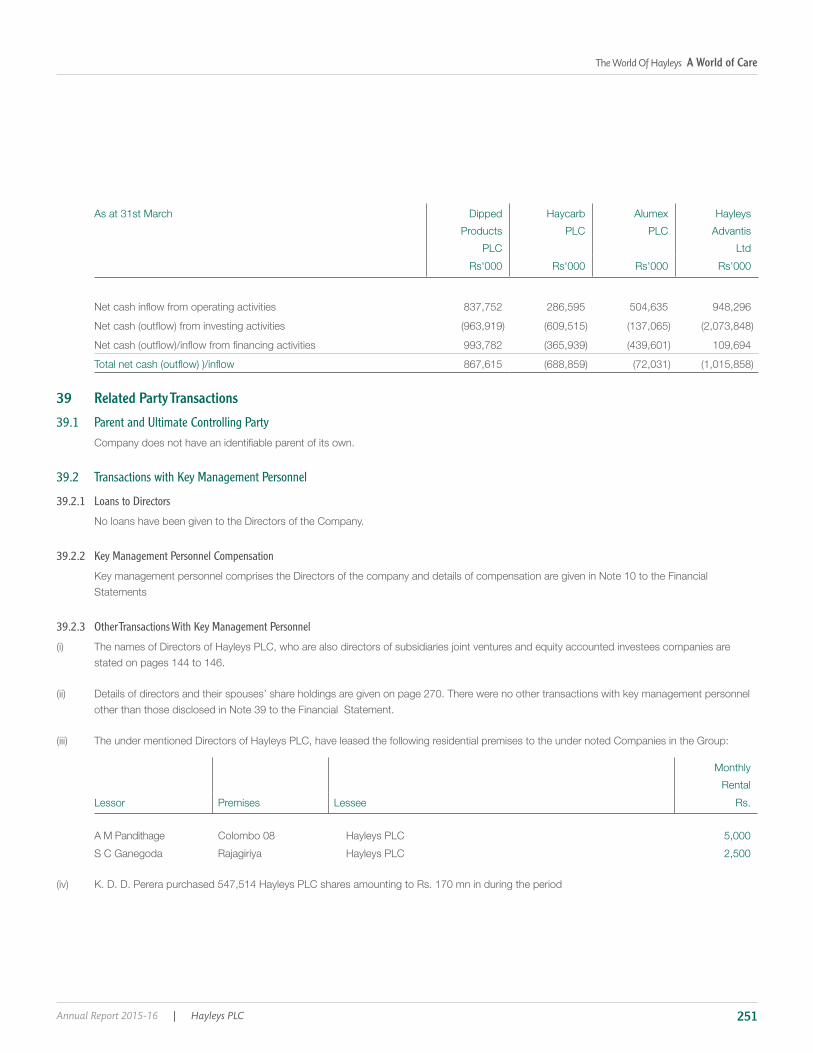
The World Of Hayleys A World of Care
Annual Report 2015-16 | Hayleys PLC 251
As at 31st March Dipped
Products
Haycarb Alumex Hayleys
Advantis
Rs'000 Rs'000 Rs'000 Rs'000
837,752 286,595 504,635 948,296
993,782 109,694
867,615
39 Related Party Transactions
39.1 Parent and Ultimate Controlling Party
39.2 Transactions with Key Management Personnel
39.2.1 Loans to Directors
No loans have been given to the Directors of the Company.
39.2.2 Key Management Personnel Compensation
Statements
39.2.3 Other Transactions With Key Management Personnel
stated on pages 144 to 146.
other than those disclosed in Note 39 to the Financial Statement.
Monthly
Rental
Premises Rs.
A M Pandithage Colombo 08 5,000
S C Ganegoda Rajagiriya 2,500

Report Preamble > Hayleys at a Glance > Leadership and Governance > Our Strategy > Management Discussion and Analysis > Our Value Creation Report > Financial Statements
Hayleys PLC | Annual Report 2015-16252
39.3 Transactions with Subsidiaries , Equity Accounted Investees & Other Related Companies Relationships with subsidiaries and equity accounted investees are explained in Note 18 and also under Group Companies in pages 275 and 277
expenses such as on export shipping, secretarial, data processing, personnel and administration functions. Such costs are allocated to
subsidiary and equity accounted investees. Details are given below.
2016
Rs’000
2015
Rs’000
Subsidiaries Subsidiaries
Business segment Rent Common
expenses
Purchase of
goods and
services
Rent Common
expenses
Purchase of
goods and
services
Eco solutions 8,543 96,137 1,721 5,327 113,985 1,486
Hand protection 18,836 178,961 4 15,255 117,558 -
28,976 116,824 2,794 24,069 100,307 167
Textiles - 78,219 1,281 - 76,986 -
Construction materials - 34,268 - 942 28,795 177
Agriculture 18,550 96,337 2,475 15,216 86,020 118
Plantations 22,771 64,890 252 18,965 56,035 236
Industry inputs 13,796 54,730 3,501 11,477 59,972 1,968
Power & energy - 11,702 - - 13,812 -
Transportation & logistics 76,089 127,999 8,543 64,784 114,292 7,862
Consumer products 21,803 73,338 7,932 18,593 75,405 589
- 117,596 12,796 21,377 165,293 21,793
Others 46,037 78,500 33,382 12,471 38,830 8,606
255,401 1,129,501 74,681 208,476 1,047,290 43,002
Notes to the Financial Statements
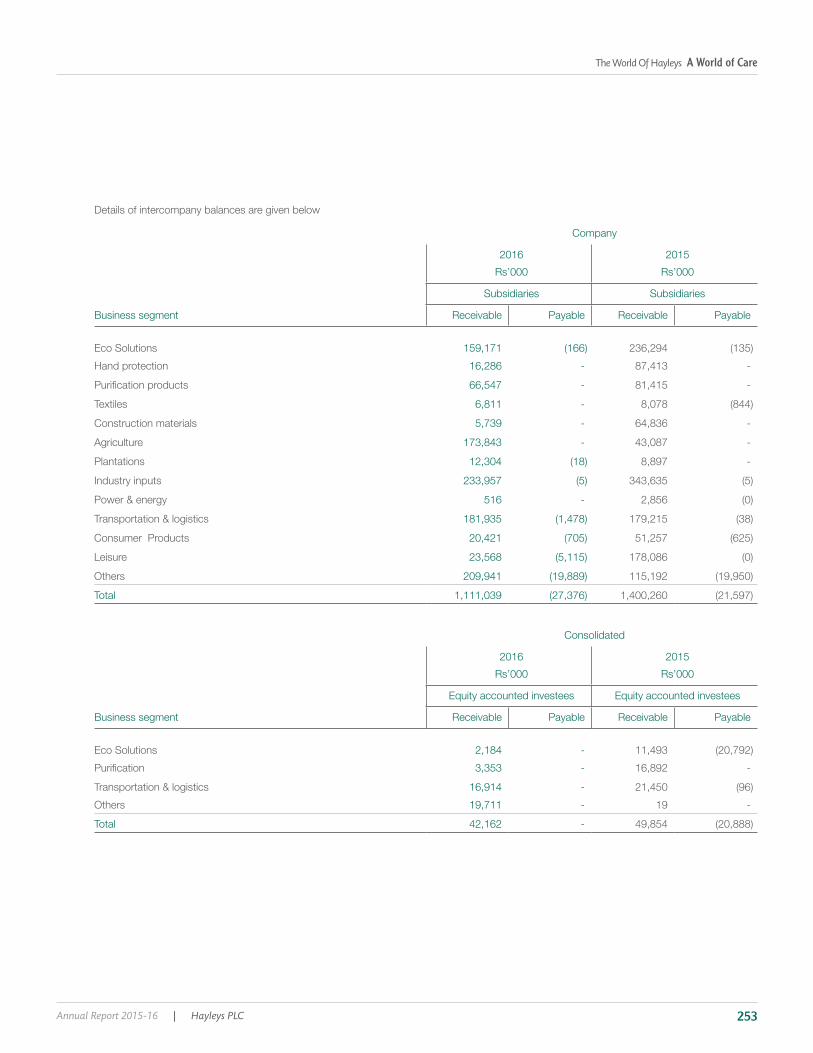
The World Of Hayleys A World of Care
Annual Report 2015-16 | Hayleys PLC 253
Details of intercompany balances are given below
Company
2016
Rs’000
2015
Rs’000
Subsidiaries Subsidiaries
Business segment Receivable Payable Receivable Payable
Eco Solutions 159,171 236,294
Hand protection 16,286 - 87,413 -
66,547 - 81,415 -
Textiles 6,811 - 8,078
Construction materials 5,739 - 64,836 -
Agriculture 173,843 - 43,087 -
Plantations 12,304 8,897 -
Industry inputs 233,957 343,635
Power & energy 516 - 2,856
Transportation & logistics 181,935 179,215
Consumer Products 20,421 51,257
23,568 178,086
Others 209,941 115,192
Total 1,111,039 1,400,260
Consolidated
2016
Rs’000
2015
Rs’000
Equity accounted investees Equity accounted investees
Business segment Receivable Payable Receivable Payable
Eco Solutions 2,184 - 11,493
3,353 - 16,892 -
Transportation & logistics 16,914 - 21,450
Others 19,711 - 19 -
Total 42,162 - 49,854
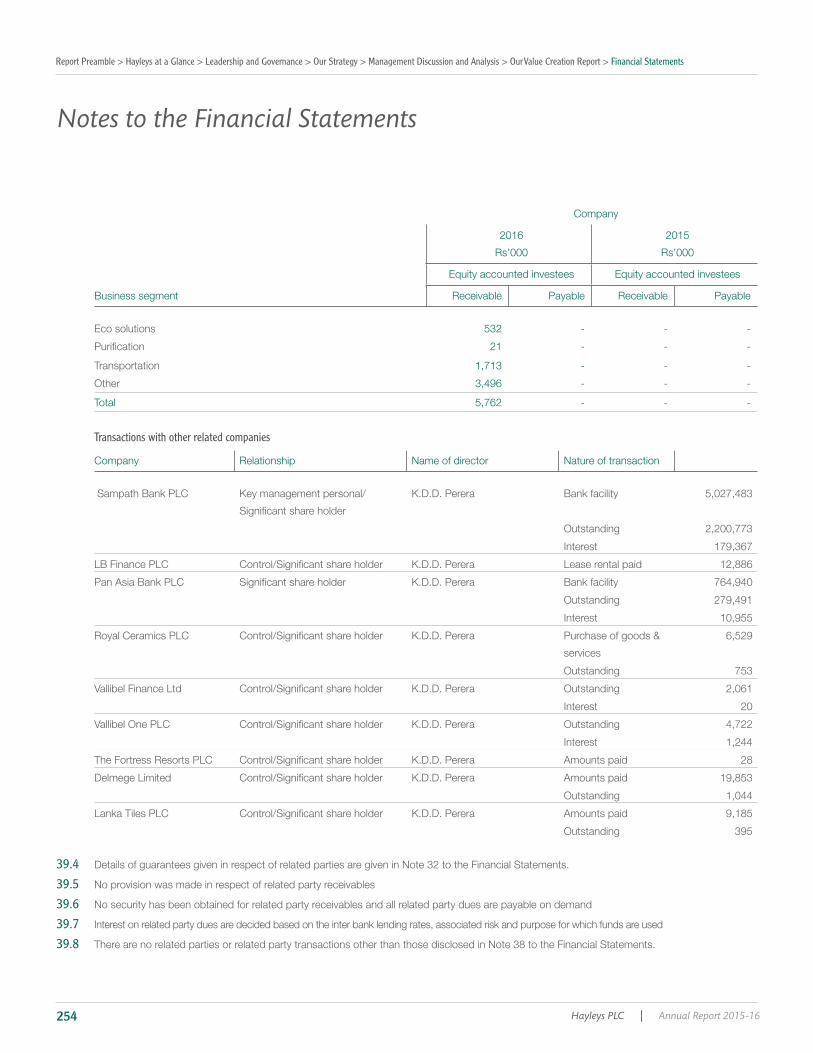
Report Preamble > Hayleys at a Glance > Leadership and Governance > Our Strategy > Management Discussion and Analysis > Our Value Creation Report > Financial Statements
Hayleys PLC | Annual Report 2015-16254
Company
2016
Rs’000
2015
Rs’000
Equity accounted investees Equity accounted investees
Business segment Receivable Payable Receivable Payable
Eco solutions 532 - - -
21 - - -
Transportation 1,713 - - -
Other 3,496 - - -
Total 5,762 - - -
Transactions with other related companies
Company Relationship Name of director Nature of transaction
Bank facility 5,027,483
Outstanding 2,200,773
Interest 179,367
12,886
Bank facility 764,940
Outstanding 279,491
Interest 10,955
Purchase of goods &
services
6,529
Outstanding 753
Outstanding 2,061
Interest 20
Outstanding 4,722
Interest 1,244
Amounts paid 28
Amounts paid 19,853
Outstanding 1,044
Amounts paid 9,185
Outstanding 395
39.4 Details of guarantees given in respect of related parties are given in Note 32 to the Financial Statements.
39.5 No provision was made in respect of related party receivables
39.6 No security has been obtained for related party receivables and all related party dues are payable on demand
39.7 Interest on related party dues are decided based on the inter bank lending rates, associated risk and purpose for which funds are used
39.8 There are no related parties or related party transactions other than those disclosed in Note 38 to the Financial Statements.
Notes to the Financial Statements
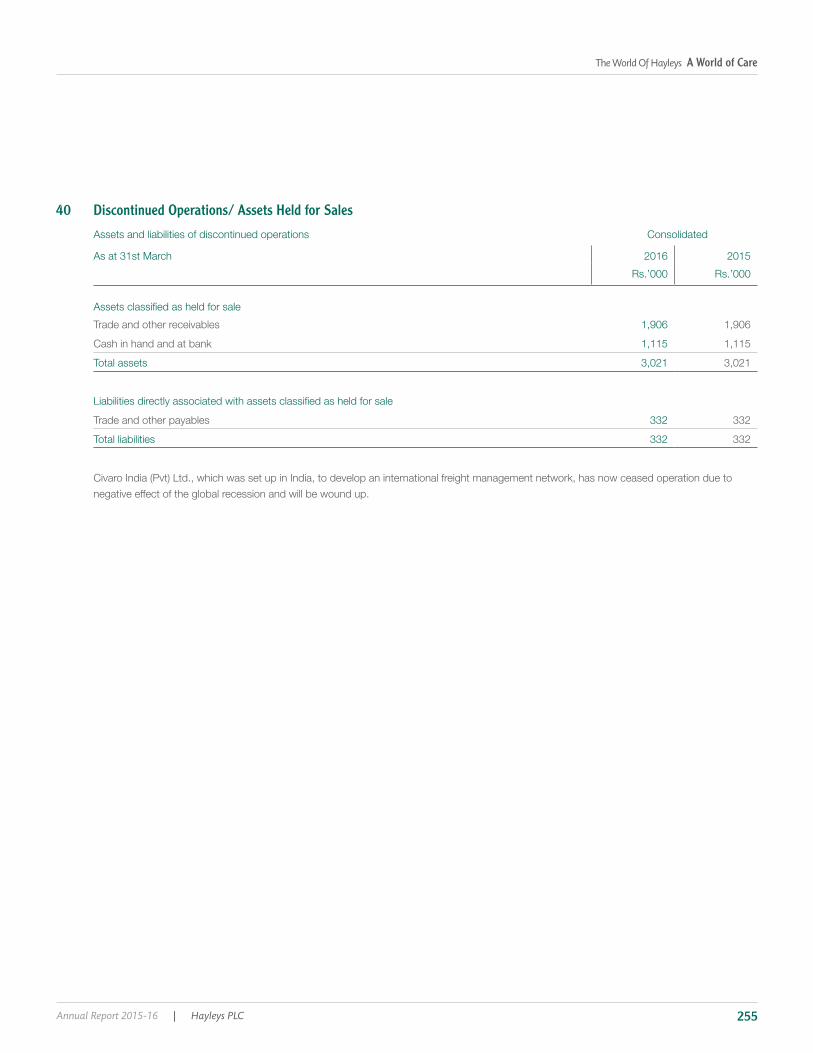
The World Of Hayleys A World of Care
Annual Report 2015-16 | Hayleys PLC 255
40 Discontinued Operations/ Assets Held for Sales
Assets and liabilities of discontinued operations Consolidated
As at 31st March 2016 2015
Rs.’000 Rs.’000
Trade and other receivables 1,906 1,906
Cash in hand and at bank 1,115 1,115
Total assets 3,021 3,021
Trade and other payables 332 332
Total liabilities 332 332
negative effect of the global recession and will be wound up.

Report Preamble > Hayleys at a Glance > Leadership and Governance > Our Strategy > Management Discussion and Analysis > Our Value Creation Report > Financial Statements
Hayleys PLC | Annual Report 2015-16256
41. Segment Analysis The segment information is based on two segmental formats. The business segment is considered as the primary format and based on the
management structure of the Group. The management are of the view that the Chairman is considered the Chief Operating decision maker and
resources are allocated and performance assessed based on the sectors, Therefore each sector which falls under the purview of a different
GMC member is considered a separate segment. The geographical format is considered as a secondary format and is based on the location of
For the year ended 31st March,
Eco solutions Hand protection Textiles Construction materials Plantation Agriculture
In Rs ‘000 2016 2015 2016 2015 2016 2015 2016 2015 2016 2015 2016 2015 2016 2015
Revenue
Total 4,439,109 5,051,875 12,729,461 14,986,012 11,705,824 11,933,848 8,364,207 8,542,539 3,995,449 3,307,181 9,391,870 13,259,531 11,388,353 8,824,925
Intra Group revenue (648,028) (633,280) (4,157) (15,700) - - - - (51,299) (20,327) (296,333) (580,882) (365,208) (400,987)
External revenue 3,791,081 4,418,595 12,725,304 14,970,312 11,705,824 11,933,848 8,364,207 8,542,539 3,944,150 3,286,854 9,095,537 12,678,649 11,023,145 8,423,938
Segment results
Results from operating activities
166,912 65,843 542,032 1,553,944 1,216,377 1,304,071 369,597 222,357 813,113 611,452 217,904 566,124 1,287,233 1,038,627
(89,180) (62,296) 41,858 (50,457) (136,319) (245,008) (116,550) (135,957) (11,853) 1,347 (168,197) (208,148) (196,785) (221,938)
accounted investees 14,285 5,952 - - 10,352 11,063 - - - - - - - -
92,016 9,499 583,890 1,503,487 1,090,410 1,070,126 253,047 86,400 801,260 612,799 49,707 357,976 1,090,448 816,689
Tax 22,753 29,754 112,398 299,979 220,910 196,404 (4,528) (2,919) 212,137 135,805 58,288 101,282 306,554 185,015
Depreciation on property, 76,956 75,679 422,225 577,650 314,677 310,063 252,954 235,814 107,499 78,334 381,637 331,255 119,923 110,964
Impairment of property, plant 2,260 32,256 14,259
Depreciation on investment properties
640 700 2,210 2,445
Amortisation of intangible assets
496 373 20,020 15,226 33,185 28,874
accounted investees) 6,024,697 6,629,365 10,742,937 10,736,977 11,842,889 9,963,299 4,830,816 4,661,082 2,456,944 2,217,037 11,056,538 10,432,619 7,779,246 6,558,825
accounted investees 54,230 39,947 86,713 76,361
Additions to Property Plant & 55,643 121,257 1,337,436 1,143,823 664,231 1,206,705 423,859 227,663 132,507 364,497 562,816 718,871 192,494 72,318
Improvements to Biological assets
10,320 12,559
Additions to Intangible assets 22,715 24,906 3,474 46,873 240
Additions to Investment Property
Non Interest bearing liabilities
Deferred tax Liabilities 18,742 17,991 37,495 38,167 76,126 40,582 188,347 195,115 85,948 98,664 483,090 456,372 24,056 25,518
296,834 289,614 546,491 463,606 289,052 257,636 278,298 220,911 79,522 64,279 2,141,113 2,047,901 407,909 325,966
Trade and other payables 216,393 309,832 1,711,267 2,001,006 2,073,940 1,485,060 769,957 976,990 633,237 638,501 698,702 776,633 1,865,636 1,375,441
Cash Flow
Operating Activities 274,786 (271,108) 842,088 1,388,558 286,595 621,034 377,079 (182,912) 504,635 489,555 1,680,974 1,230,608 880,805 705,425
Investment Activities (29,346) (69,740) (868,012) (1,154,951) (609,515) (631,892) (395,688) (225,009) (137,065) (331,377) (3,438,903) (2,108,293) 133,024 179,916
Financing Activities (6,100) 123,896 893,538 (676,306) (365,939) (421,683) (350,228) 1,337,999 (439,601) (208,654) 1,780,184 650,990 (755,222) (629,384)
Notes to the Financial Statements
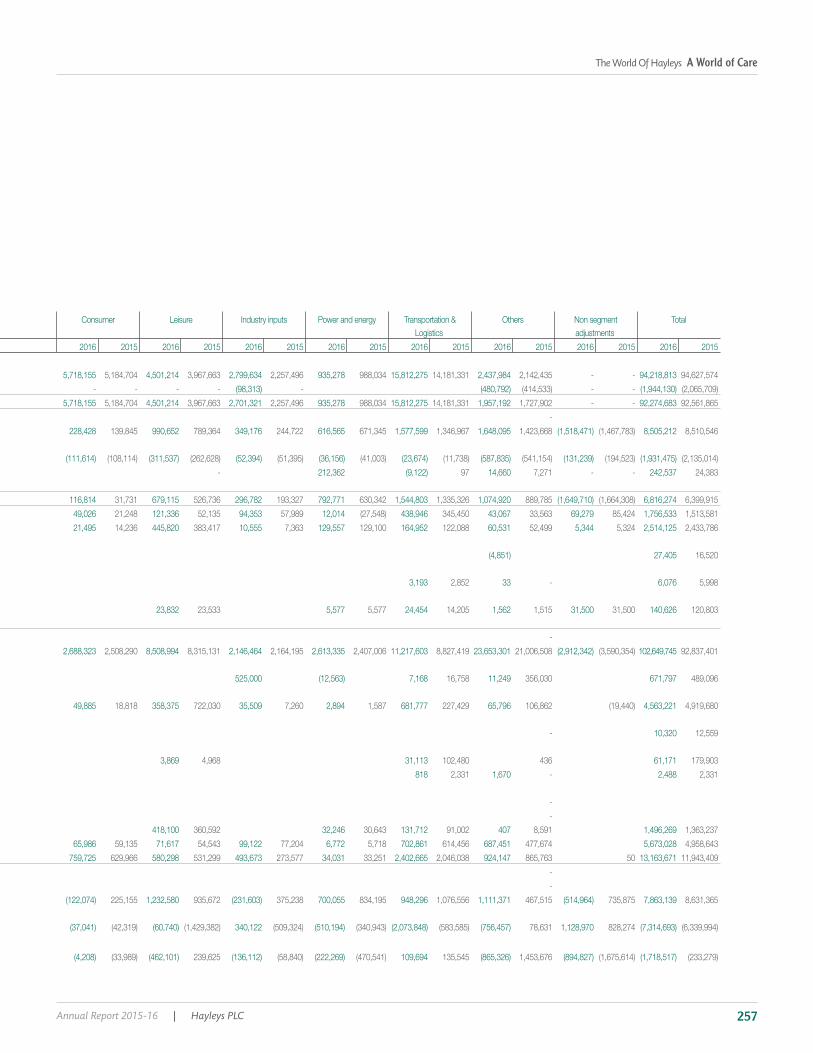
The World Of Hayleys A World of Care
Annual Report 2015-16 | Hayleys PLC 257
Consumer Leisure Industry inputs Power and energy Transportation & Logistics
Others Non segment adjustments
Total
2016 2015 2016 2015 2016 2015 2016 2015 2016 2015 2016 2015 2016 2015 2016 2015
5,718,155 5,184,704 4,501,214 3,967,663 2,799,634 2,257,496 935,278 988,034 15,812,275 14,181,331 2,437,984 2,142,435 - - 94,218,813 94,627,574
- - - - (98,313) - (480,792) (414,533) - - (1,944,130) (2,065,709)
5,718,155 5,184,704 4,501,214 3,967,663 2,701,321 2,257,496 935,278 988,034 15,812,275 14,181,331 1,957,192 1,727,902 - - 92,274,683 92,561,865
-
228,428 139,845 990,652 789,364 349,176 244,722 616,565 671,345 1,577,599 1,346,967 1,648,095 1,423,668 (1,518,471) (1,467,783) 8,505,212 8,510,546
(111,614) (108,114) (311,537) (262,628) (52,394) (51,395) (36,156) (41,003) (23,674) (11,738) (587,835) (541,154) (131,239) (194,523) (1,931,475) (2,135,014)
- 212,362 (9,122) 97 14,660 7,271 - - 242,537 24,383
116,814 31,731 679,115 526,736 296,782 193,327 792,771 630,342 1,544,803 1,335,326 1,074,920 889,785 (1,649,710) (1,664,308) 6,816,274 6,399,915
49,026 21,248 121,336 52,135 94,353 57,989 12,014 (27,548) 438,946 345,450 43,067 33,563 69,279 85,424 1,756,533 1,513,581
21,495 14,236 445,820 383,417 10,555 7,363 129,557 129,100 164,952 122,088 60,531 52,499 5,344 5,324 2,514,125 2,433,786
(4,851) 27,405 16,520
3,193 2,852 33 - 6,076 5,998
23,832 23,533 5,577 5,577 24,454 14,205 1,562 1,515 31,500 31,500 140,626 120,803
-
2,688,323 2,508,290 8,508,994 8,315,131 2,146,464 2,164,195 2,613,335 2,407,006 11,217,603 8,827,419 23,653,301 21,006,508 (2,912,342) (3,590,354) 102,649,745 92,837,401
525,000 (12,563) 7,168 16,758 11,249 356,030 671,797 489,096
49,885 18,818 358,375 722,030 35,509 7,260 2,894 1,587 681,777 227,429 65,796 106,862 (19,440) 4,563,221 4,919,680
- 10,320 12,559
3,869 4,968 31,113 102,480 436 61,171 179,903
818 2,331 1,670 - 2,488 2,331
-
-
418,100 360,592 32,246 30,643 131,712 91,002 407 8,591 1,496,269 1,363,237
65,986 59,135 71,617 54,543 99,122 77,204 6,772 5,718 702,861 614,456 687,451 477,674 5,673,028 4,958,643
759,725 629,966 580,298 531,299 493,673 273,577 34,031 33,251 2,402,665 2,046,038 924,147 865,763 50 13,163,671 11,943,409
-
-
(122,074) 225,155 1,232,580 935,672 (231,603) 375,238 700,055 834,195 948,296 1,076,556 1,111,371 467,515 (514,964) 735,875 7,863,139 8,631,365
(37,041) (42,319) (60,740) (1,429,382) 340,122 (509,324) (510,194) (340,943) (2,073,848) (583,585) (756,457) 78,631 1,128,970 828,274 (7,314,693) (6,339,994)
(4,208) (33,989) (462,101) 239,625 (136,112) (58,840) (222,269) (470,541) 109,694 135,545 (865,326) 1,453,676 (894,827) (1,675,614) (1,718,517) (233,279)
Report Preamble > Hayleys at a Glance > Leadership and Governance > Our Strategy > Management Discussion and Analysis > Our Value Creation Report > Financial Statements
Hayleys PLC | Annual Report 2015-16258
42 Financial Risk Management
1 Credit risk
3 Market risk
This note presents information about the Group’s exposure to each of the above risks, the Group’s objectives, policies and processes for
measuring and managing risk, and the Group’s management of capital. Further quantitative disclosures are included throughout these
Financial Risk Management Framework
which includes developing and monitoring the Group’s Financial risk management policies.
carried out by Group Treasury that have the appropriate skills and experience.
ad hoc reviews of Financial risk management policies and procedures, the results of which are reported to the Group Audit Committee.
Credit Risk
Trade and other receivables
The Group has established a credit policy under which each new customer is analysed individually for creditworthiness before the Group’s
standard payment and delivery terms and conditions are offered. The Group’s review includes external ratings, when available, and in some cases
bank references. Purchase limits are established for each customer, which represents the maximum open amount without requiring approval from
the Management; these limits are reviewed quarterly. Customers that fail to meet the Group’s benchmark creditworthiness may transact with the
Group only on a prepayment basis. Outstanding customer receivables are regularly monitored at the individual sector and Group Management
Notes to the Financial Statements

The World Of Hayleys A World of Care
Annual Report 2015-16 | Hayleys PLC 259
In monitoring customer credit risk, customers are grouped according to their credit characteristics, including whether they are an individual or
The Group establishes an allowance for impairment that represents its estimate of incurred losses in respect of trade and other receivables.
at Note 22 to the Financial Statements.
Investments
policy. Investments of surplus funds are made only with approved counterparties and within credit limits assigned to each counterparty. The
Cash in hand and at bank and cash equivalents
credit exposure on these assets.
Respective credit ratings of banks which group cash balances held are as follows;
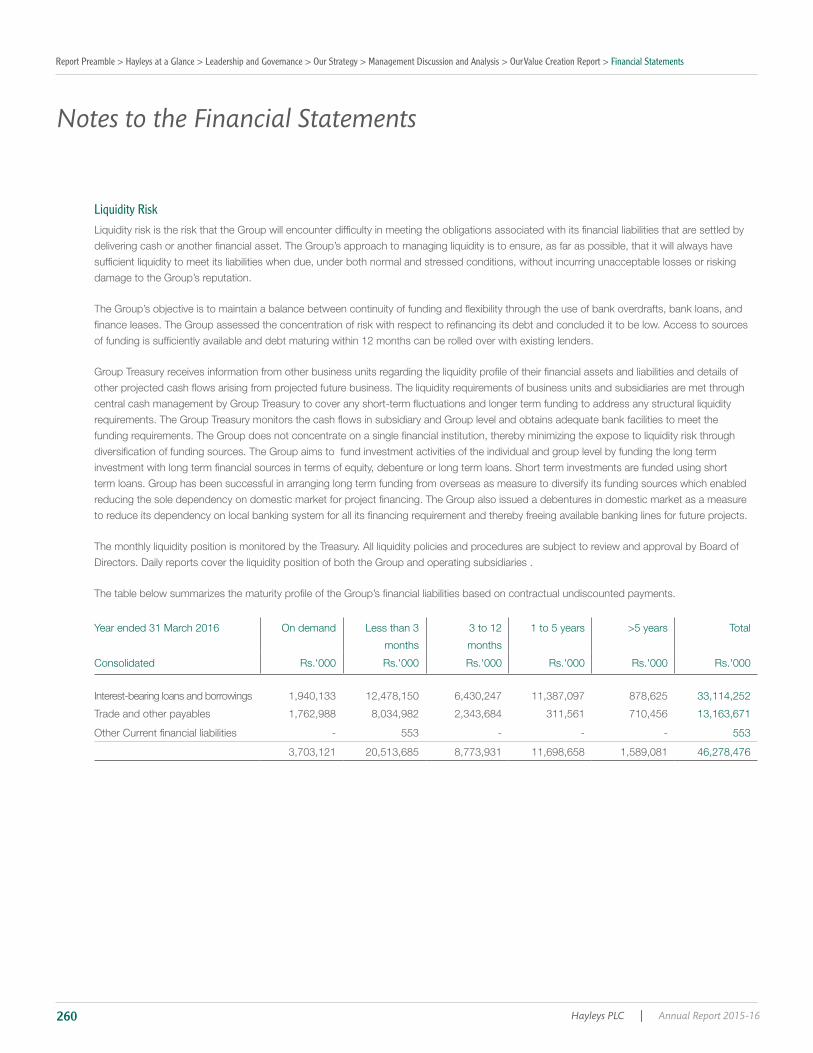
Report Preamble > Hayleys at a Glance > Leadership and Governance > Our Strategy > Management Discussion and Analysis > Our Value Creation Report > Financial Statements
Hayleys PLC | Annual Report 2015-16260
Liquidity Risk
damage to the Group’s reputation.
term loans. Group has been successful in arranging long term funding from overseas as measure to diversify its funding sources which enabled
The monthly liquidity position is monitored by the Treasury. All liquidity policies and procedures are subject to review and approval by Board of
Directors. Daily reports cover the liquidity position of both the Group and operating subsidiaries .
Year ended 31 March 2016 On demand
months
3 to 12
months
1 to 5 years >5 years Total
Consolidated Rs.'000 Rs.'000 Rs.'000 Rs.'000 Rs.'000 Rs.'000
Interest-bearing loans and borrowings 1,940,133 12,478,150 6,430,247 11,387,097 878,625 33,114,252
Trade and other payables 1,762,988 8,034,982 2,343,684 311,561 710,456 13,163,671
- 553 - - - 553
3,703,121 20,513,685 8,773,931 11,698,658 1,589,081 46,278,476
Notes to the Financial Statements

The World Of Hayleys A World of Care
Annual Report 2015-16 | Hayleys PLC 261
Year ended 31 March 2016 On demand
Months
3 to 12
months
1 to 5 years >5 years Total
Company Rs.'000 Rs.'000 Rs.'000 Rs.'000 Rs.'000 Rs.'000
Interest-bearing loans and borrowings 43,053 746,941 2,240,824 3,555,664 6,586,482
Trade and other payables 141,334 87,120 11,271 - 1,902 241,627
184,387 834,061 2,252,095 3,555,664 1,902 6,828,109
Year ended 31 March 2015 On demand
Months
3 to 12
months
1 to 5 years >5 years Total
Consolidated Rs.'000 Rs.'000 Rs.'000 Rs.'000 Rs.'000 Rs.'000
Interest-bearing loans and borrowings 988,946 12,330,166 3,673,797 11,243,216 826,058 29,062,183
Trade and other payables 1,959,767 8,400,668 1,320,780 210,599 51,594 11,943,409
- 15,942 - - - 15,942
2,948,713 20,746,776 4,994,577 11,453,815 877,652 41,021,534
Year ended 31 March 2015 On demand
Months
3 to 12
months
1 to 5 years >5 years Total
Company Rs.'000 Rs.'000 Rs.'000 Rs.'000 Rs.'000 Rs.'000
Interest-bearing loans and borrowings 37,579 303,682 911,047 5,667,819 - 6,920,127
Trade and other payables 123,993 167,974 206 - 1,790 293,963
- 15,942 - - - 15,942
161,572 487,598 911,253 5,667,819 1,790 7,230,032
Market Risk
prices comprise four types of risk: interest rate risk, currency risk, commodity price risk and other price risk, such as equity price risk. Financial
return.
The sensitivity analyses in the following sections relate to the position as at 31 March 2016 and 2015.

Report Preamble > Hayleys at a Glance > Leadership and Governance > Our Strategy > Management Discussion and Analysis > Our Value Creation Report > Financial Statements
Hayleys PLC | Annual Report 2015-16262
Interest rate risk
Interest rate sensitivity
The following table demonstrates the sensitivity to a reasonably possible change in interest rates on that portion of loans and borrowings
as follows:
Consolidated Increase/
decrease in
base point
before tax
Rs.’000
2016 + 150 117,059
- 150
2015 + 150 92,931
- 150
Company Increase/
decrease in
base point
before tax
Rs.’000
2016 + 150 -
- 150 -
2015 + 150 13,325
- 150
Foreign currency risk
exchange rates. The Group is exposed to currency risk on sales, purchases and borrowings and net investments in foreign subsidiaries that
are denominated in a currency other than the respective functional currencies of the Group. These currencies primarily are the Euro, US Dollars
on a regular basis.
Notes to the Financial Statements

The World Of Hayleys A World of Care
Annual Report 2015-16 | Hayleys PLC 263
Foreign currency sensitivity
The following tables demonstrate the sensitivity to a reasonably possible change in the US dollar and Euro exchange rate, with all other variables
The Group’s exposure to foreign currency changes for all other currencies is not material.
Consolidated Increase/
decrease in
base point
before tax
Rs.’000
2016
USD + 5%
Euro + 5% 28,103
USD - 5% 546,691
Euro - 5%
2015
USD + 5%
Euro + 5% 1,509
USD - 5% 402,728
Euro - 5%
Company Increase/
decrease in
base point
before tax
Rs.’000
2016
USD + 5%
USD - 5% 84,376
2015
USD + 5%
USD - 5% 32,987
Commodity Risk
The Group is affected by the volatility of certain commodities. Its operating activities require the ongoing purchase and manufacturing process.
strategy regarding commodity price risk and its mitigation. The sectors constantly monitor the Raw material price levels of Charcoal, Rubber,
Aluminum and Yarn for downwards trends and invest in bulk purchase when low prices are prevalent. Management may revise the selling price
based on the commodity prices whenever possible.
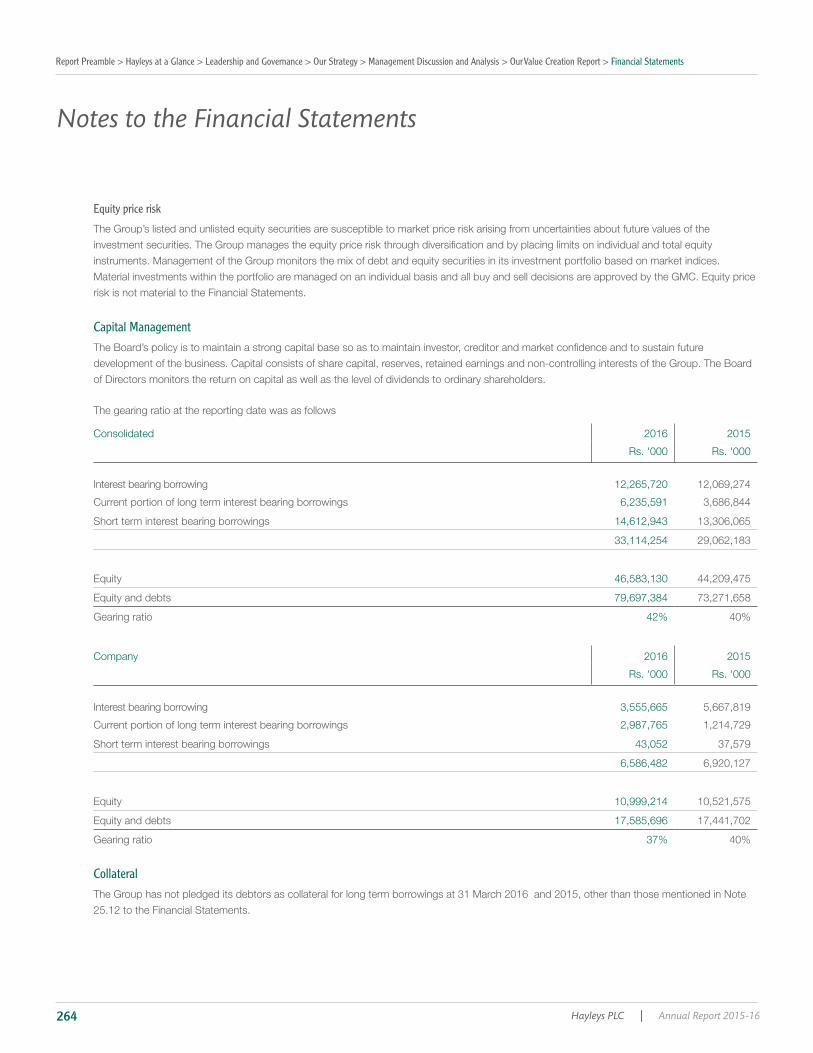
Report Preamble > Hayleys at a Glance > Leadership and Governance > Our Strategy > Management Discussion and Analysis > Our Value Creation Report > Financial Statements
Hayleys PLC | Annual Report 2015-16264
Notes to the Financial Statements
Equity price risk
The Group’s listed and unlisted equity securities are susceptible to market price risk arising from uncertainties about future values of the
instruments. Management of the Group monitors the mix of debt and equity securities in its investment portfolio based on market indices.
Material investments within the portfolio are managed on an individual basis and all buy and sell decisions are approved by the GMC. Equity price
risk is not material to the Financial Statements.
Capital Management
development of the business. Capital consists of share capital, reserves, retained earnings and non-controlling interests of the Group. The Board
of Directors monitors the return on capital as well as the level of dividends to ordinary shareholders.
The gearing ratio at the reporting date was as follows
Consolidated 2016 2015
Rs. '000 Rs. '000
Interest bearing borrowing 12,265,720 12,069,274
Current portion of long term interest bearing borrowings 6,235,591 3,686,844
Short term interest bearing borrowings 14,612,943 13,306,065
33,114,254 29,062,183
Equity 46,583,130 44,209,475
Equity and debts 79,697,384 73,271,658
Gearing ratio 42% 40%
Company 2016 2015
Rs. '000 Rs. '000
Interest bearing borrowing 3,555,665 5,667,819
Current portion of long term interest bearing borrowings 2,987,765 1,214,729
Short term interest bearing borrowings 43,052 37,579
6,586,482 6,920,127
Equity 10,999,214 10,521,575
Equity and debts 17,585,696 17,441,702
Gearing ratio 37% 40%
Collateral The Group has not pledged its debtors as collateral for long term borrowings at 31 March 2016 and 2015, other than those mentioned in Note
25.12 to the Financial Statements.
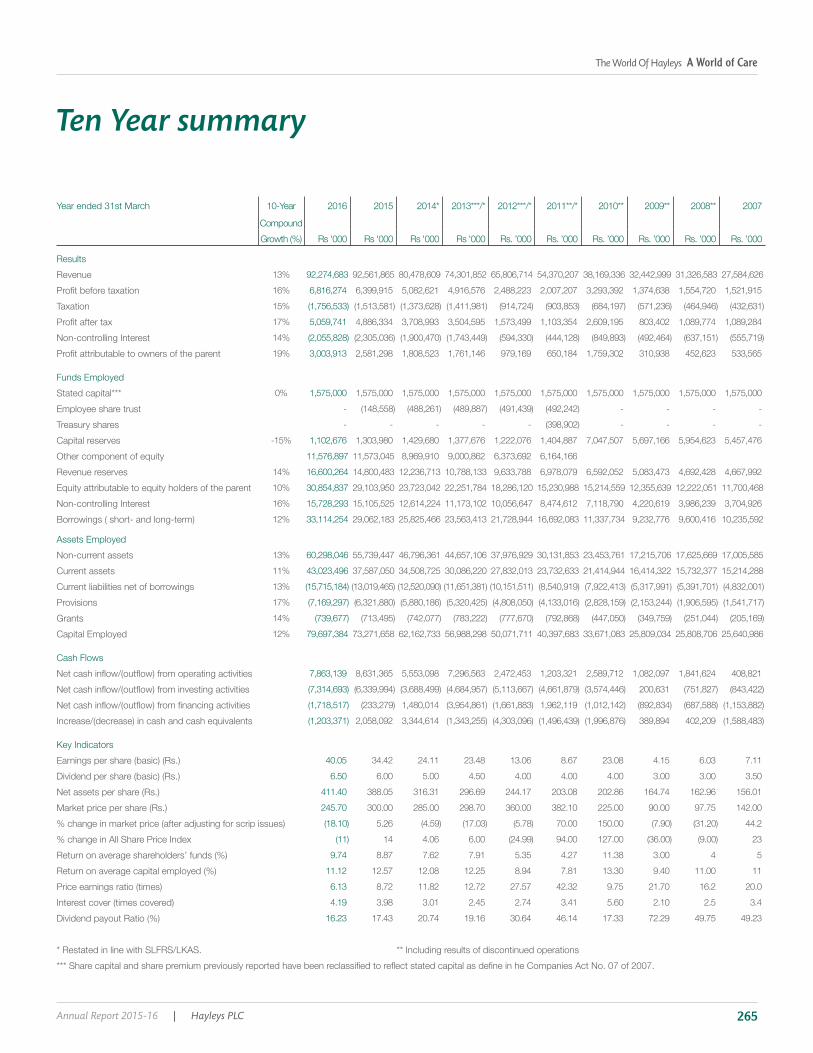
The World Of Hayleys A World of Care
Annual Report 2015-16 | Hayleys PLC 265
Ten Year summary
Year ended 31st March 10-Year
Compound
2016 2015 2014* 2013***/* 2012***/* 2011**/* 2010** 2009** 2008** 2007
Rs '000 Rs '000 Rs '000 Rs '000 Rs. ’000 Rs. ’000 Rs. ’000 Rs. ’000 Rs. ’000 Rs. ’000
Results
Revenue 13% 92,274,683 92,561,865 80,478,609 74,301,852 65,806,714 54,370,207 38,169,336 32,442,999 31,326,583 27,584,626
16% 6,816,274 6,399,915 5,082,621 4,916,576 2,488,223 2,007,207 3,293,392 1,374,638 1,554,720 1,521,915
Taxation 15%
17% 5,059,741 4,886,334 3,708,993 3,504,595 1,573,499 1,103,354 2,609,195 803,402 1,089,774 1,089,284
Non-controlling Interest 14%
19% 3,003,913 2,581,298 1,808,523 1,761,146 979,169 650,184 1,759,302 310,938 452,623 533,565
Funds Employed
Stated capital*** 0% 1,575,000 1,575,000 1,575,000 1,575,000 1,575,000 1,575,000 1,575,000 1,575,000 1,575,000 1,575,000
Employee share trust - - - - -
Treasury shares - - - - - - - - -
Capital reserves -15% 1,102,676 1,303,980 1,429,680 1,377,676 1,222,076 1,404,887 7,047,507 5,697,166 5,954,623 5,457,476
Other component of equity 11,576,897 11,573,045 8,969,910 9,000,862 6,373,692 6,164,166
Revenue reserves 14% 16,600,264 14,800,483 12,236,713 10,788,133 9,633,788 6,978,079 6,592,052 5,083,473 4,692,428 4,667,992
Equity attributable to equity holders of the parent 10% 30,854,837 29,103,950 23,723,042 22,251,784 18,286,120 15,230,988 15,214,559 12,355,639 12,222,051 11,700,468
Non-controlling Interest 16% 15,728,293 15,105,525 12,614,224 11,173,102 10,056,647 8,474,612 7,118,790 4,220,619 3,986,239 3,704,926
12% 33,114,254 29,062,183 25,825,466 23,563,413 21,728,944 16,692,083 11,337,734 9,232,776 9,600,416 10,235,592
Assets Employed
Non-current assets 13% 60,298,046 55,739,447 46,796,361 44,657,106 37,976,929 30,131,853 23,453,761 17,215,706 17,625,669 17,005,585
Current assets 11% 43,023,496 37,587,050 34,508,725 30,086,220 27,832,013 23,732,633 21,414,944 16,414,322 15,732,377 15,214,288
Current liabilities net of borrowings 13%
Provisions 17%
Grants 14%
Capital Employed 12% 79,697,384 73,271,658 62,162,733 56,988,298 50,071,711 40,397,683 33,671,083 25,809,034 25,808,706 25,640,986
Cash Flows
7,863,139 8,631,365 5,553,098 7,296,563 2,472,453 1,203,321 2,589,712 1,082,097 1,841,624 408,821
200,631
1,480,014 1,962,119
2,058,092 3,344,614 389,894 402,209
40.05 34.42 24.11 23.48 13.06 8.67 23.08 4.15 6.03 7.11
6.50 6.00 5.00 4.50 4.00 4.00 4.00 3.00 3.00 3.50
411.40 388.05 316.31 296.69 244.17 203.08 202.86 164.74 162.96 156.01
245.70 300.00 285.00 298.70 360.00 382.10 225.00 90.00 97.75 142.00
5.26 70.00 150.00 44.2
% change in All Share Price Index 14 4.06 6.00 94.00 127.00 23
9.74 8.87 7.62 7.91 5.35 4.27 11.38 3.00 4 5
11.12 12.57 12.08 12.25 8.94 7.81 13.30 9.40 11.00 11
6.13 8.72 11.82 12.72 27.57 42.32 9.75 21.70 16.2 20.0
4.19 3.98 3.01 2.45 2.74 3.41 5.60 2.10 2.5 3.4
16.23 17.43 20.74 19.16 30.64 46.14 17.33 72.29 49.75 49.23
** Including results of discontinued operations
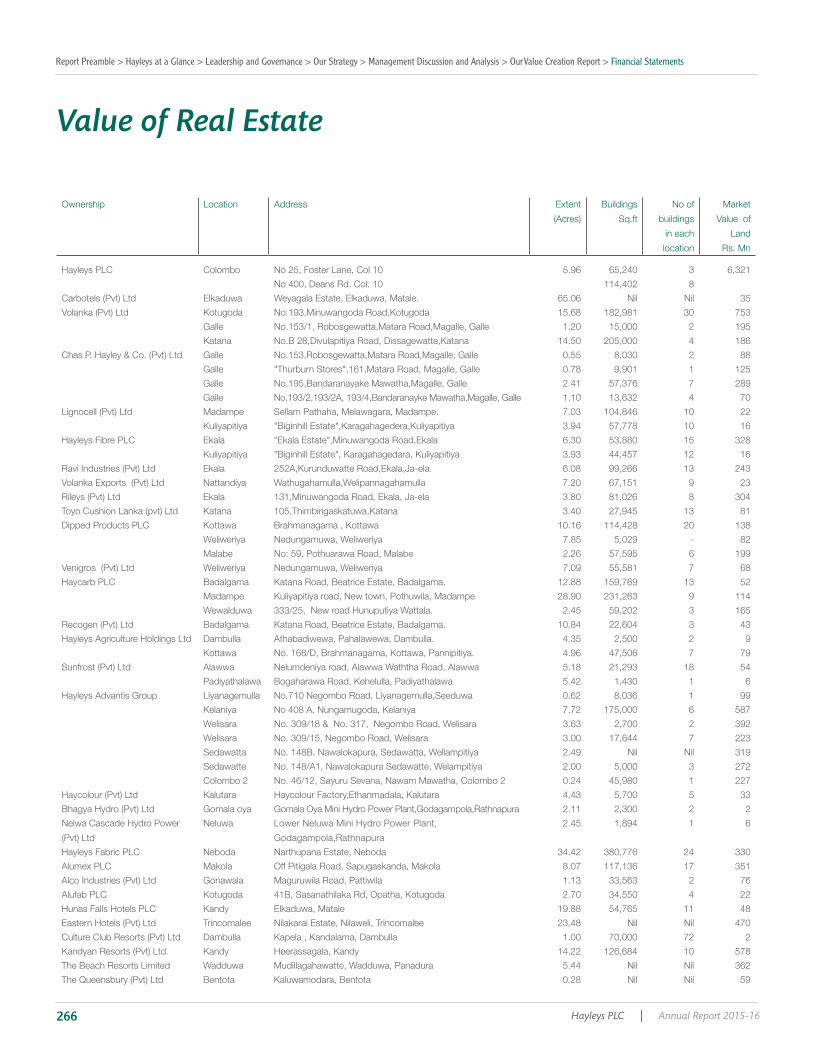
Report Preamble > Hayleys at a Glance > Leadership and Governance > Our Strategy > Management Discussion and Analysis > Our Value Creation Report > Financial Statements
Hayleys PLC | Annual Report 2015-16266
Ownership Location Address Extent
(Acres)
Buildings
Sq.ft
No of
buildings
in each
location
Market
Value of
Land
Rs. Mn
Hayleys PLC Colombo No 25, Foster Lane, Col 10 5.96 65,240 3 6,321
No 400, Deans Rd. Col. 10 114,402 8
Carbotels (Pvt) Ltd Elkaduwa Weyagala Estate, Elkaduwa, Matale. 65.06 Nil Nil 35
Volanka (Pvt) Ltd Kotugoda No.193,Minuwangoda Road,Kotugoda 15.68 182,981 30 753
Galle No.153/1, Robosgewatta,Matara Road,Magalle, Galle 1.20 15,000 2 195
Katana No.B 28,Divulapitiya Road, Dissagewatte,Katana 14.50 205,000 4 186
Chas P. Hayley & Co. (Pvt) Ltd Galle No.153,Robosgewatta,Matara Road,Magalle, Galle 0.55 8,030 2 88
Galle "Thurburn Stores",161,Matara Road, Magalle, Galle 0.78 9,901 1 125
Galle No.195,Bandaranayake Mawatha,Magalle, Galle 2.41 57,376 7 289
Galle No.193/2,193/2A, 193/4,Bandaranayke Mawatha,Magalle, Galle 1.10 13,632 4 70
Lignocell (Pvt) Ltd Madampe Sellam Pathaha, Melawagara, Madampe. 7.03 104,846 10 22
Kuliyapitiya "Biginhill Estate",Karagahagedera,Kuliyapitiya 3.94 57,778 10 16
Hayleys Fibre PLC Ekala "Ekala Estate",Minuwangoda Road,Ekala 6.30 53,880 15 328
Kuliyapitiya "Biginhill Estate", Karagahagedara, Kuliyapitiya 3.93 44,457 12 16
Ravi Industries (Pvt) Ltd Ekala 252A,Kurunduwatte Road,Ekala,Ja-ela. 6.08 99,266 13 243
Volanka Exports (Pvt) Ltd Nattandiya Wathugahamulla,Welipannagahamulla 7.20 67,151 9 23
Rileys (Pvt) Ltd Ekala 131,Minuwangoda Road, Ekala, Ja-ela 3.80 81,026 8 304
Toyo Cushion Lanka (pvt) Ltd Katana 105,Thimbirigaskatuwa,Katana 3.40 27,945 13 81
Dipped Products PLC Kottawa Brahmanagama , Kottawa 10.16 114,428 20 138
Weliweriya Nedungamuwa, Weliweriya 7.85 5,029 - 82
Malabe No: 59, Pothuarawa Road, Malabe 2.26 57,595 6 199
Venigros (Pvt) Ltd Weliweriya Nedungamuwa, Weliweriya 7.09 55,581 7 68
Haycarb PLC Badalgama Katana Road, Beatrice Estate, Badalgama. 12.88 159,769 13 52
Madampe Kuliyapitiya road, New town, Pothuwila, Madampe 28.90 231,263 9 114
Wewalduwa 333/25, New road Hunuputiya Wattala. 2.45 59,202 3 165
Recogen (Pvt) Ltd Badalgama Katana Road, Beatrice Estate, Badalgama. 10.84 22,604 3 43
Hayleys Agriculture Holdings Ltd Dambulla Athabadiwewa, Pahalawewa, Dambulla. 4.35 2,500 2 9
Kottawa No. 168/D, Brahmanagama, Kottawa, Pannipitiya. 4.96 47,506 7 79
Sunfrost (Pvt) Ltd Alawwa Nelumdeniya road, Alawwa Waththa Road, Alawwa 5.18 21,293 18 54
Padiyathalawa Bogaharawa Road, Kehelulla, Padiyathalawa 5.42 1,430 1 6
Hayleys Advantis Group Liyanagemulla No.710 Negombo Road, Liyanagemulla,Seeduwa 0.62 8,036 1 99
Kelaniya No 408 A, Nungamugoda, Kelaniya 7.72 175,000 6 587
Welisara No. 309/18 & No. 317, Negombo Road, Welisara 3.63 2,700 2 392
Welisara No. 309/15, Negombo Road, Welisara 3.00 17,644 7 223
Sedawatta No. 148B, Nawalokapura, Sedawatta, Wellampitiya 2.49 Nil Nil 319
Sedawatte No. 148/A1, Nawalokapura Sedawatte, Welampitiya 2.00 5,000 3 272
Colombo 2 No. 46/12, Sayuru Sevana, Nawam Mawatha, Colombo 2 0.24 45,980 1 227
Haycolour (Pvt) Ltd Kalutara Haycolour Factory,Ethanmadala, Kalutara 4.43 5,700 5 33
Bhagya Hydro (Pvt) Ltd Gomala oya Gomala Oya Mini Hydro Power Plant,Godagampola,Rathnapura 2.11 2,300 2 2
Nelwa Cascade Hydro Power
(Pvt) Ltd
Neluwa Lower Neluwa Mini Hydro Power Plant,
Godagampola,Rathnapura
2.45 1,894 1 6
Hayleys Fabric PLC Neboda Narthupana Estate, Neboda 34.42 380,776 24 330
Alumex PLC Makola Off Pitigala Road, Sapugaskanda, Makola 8.07 117,136 17 351
Alco Industries (Pvt) Ltd Gonawala Maguruwila Road, Pattiwila 1.13 33,563 2 76
Alufab PLC Kotugoda 41B, Sasanathilaka Rd, Opatha, Kotugoda 2.70 34,550 4 22
Hunas Falls Hotels PLC Kandy Elkaduwa, Matale 19.88 54,765 11 48
Eastern Hotels (Pvt) Ltd Trincomalee Nilakarai Estate, Nilaweli, Trincomalee 23.48 Nil Nil 470
Culture Club Resorts (Pvt) Ltd Dambulla Kapela , Kandalama, Dambulla 1.00 70,000 72 2
Kandyan Resorts (Pvt) Ltd Kandy Heerassagala, Kandy 14.22 126,684 10 578
The Beach Resorts Limited Wadduwa Mudillagahawatte, Wadduwa, Panadura 5.44 Nil Nil 362
The Queensbury (Pvt) Ltd Bentota Kaluwamodara, Bentota 0.28 Nil Nil 59
Value of Real Estate
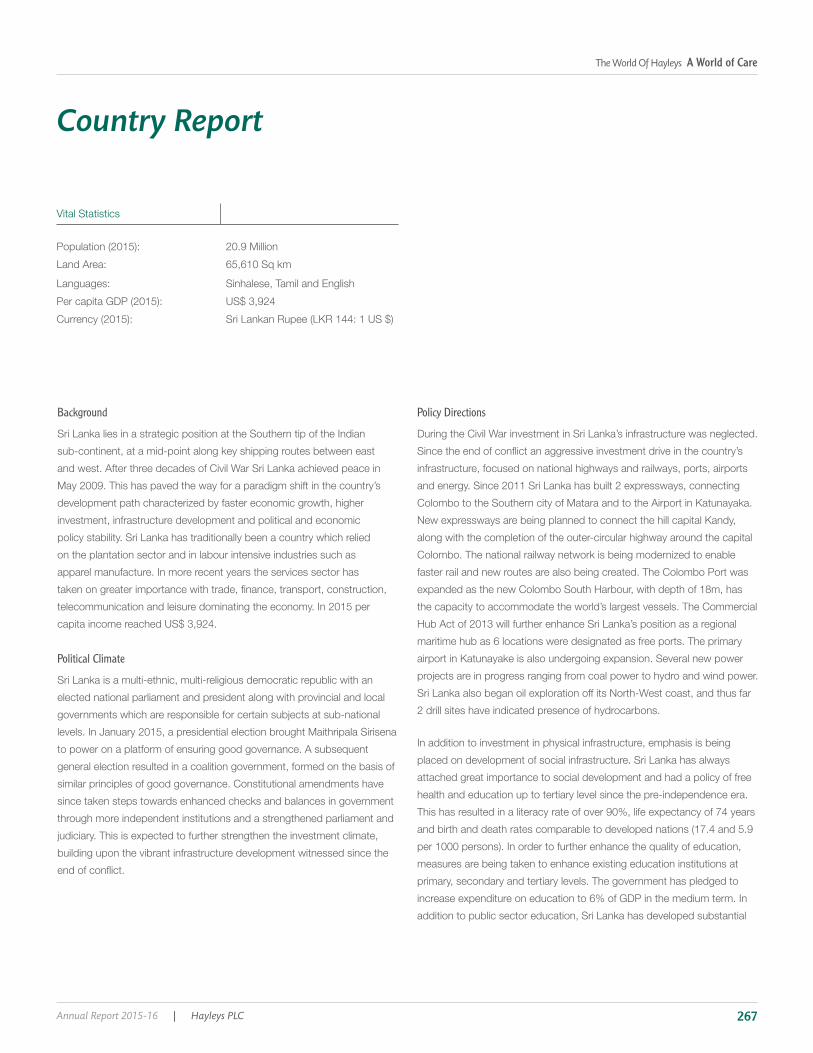
The World Of Hayleys A World of Care
Annual Report 2015-16 | Hayleys PLC 267
Country Report
Vital Statistics
20.9 Million
65,610 Sq km
Sinhalese, Tamil and English
Background
sub-continent, at a mid-point along key shipping routes between east
May 2009. This has paved the way for a paradigm shift in the country’s
investment, infrastructure development and political and economic
on the plantation sector and in labour intensive industries such as
apparel manufacture. In more recent years the services sector has
telecommunication and leisure dominating the economy. In 2015 per
Political Climate
elected national parliament and president along with provincial and local
governments which are responsible for certain subjects at sub-national
levels. In January 2015, a presidential election brought Maithripala Sirisena
to power on a platform of ensuring good governance. A subsequent
general election resulted in a coalition government, formed on the basis of
similar principles of good governance. Constitutional amendments have
since taken steps towards enhanced checks and balances in government
through more independent institutions and a strengthened parliament and
judiciary. This is expected to further strengthen the investment climate,
building upon the vibrant infrastructure development witnessed since the
Policy Directions
infrastructure, focused on national highways and railways, ports, airports
along with the completion of the outer-circular highway around the capital
faster rail and new routes are also being created. The Colombo Port was
expanded as the new Colombo South Harbour, with depth of 18m, has
the capacity to accommodate the world’s largest vessels. The Commercial
maritime hub as 6 locations were designated as free ports. The primary
projects are in progress ranging from coal power to hydro and wind power.
2 drill sites have indicated presence of hydrocarbons.
In addition to investment in physical infrastructure, emphasis is being
attached great importance to social development and had a policy of free
health and education up to tertiary level since the pre-independence era.
This has resulted in a literacy rate of over 90%, life expectancy of 74 years
measures are being taken to enhance existing education institutions at
primary, secondary and tertiary levels. The government has pledged to
increase expenditure on education to 6% of GDP in the medium term. In
Report Preamble > Hayleys at a Glance > Leadership and Governance > Our Strategy > Management Discussion and Analysis > Our Value Creation Report > Financial Statements
Hayleys PLC | Annual Report 2015-16268
Along with investments in infrastructure, successive governments
has a relatively low income tax regime with reduced taxes on corporate
5% of GDP in the medium term, as envisaged in the Fiscal Management
rates and lead to longer term macroeconomic stability. The Central Bank
has also outlined a plan to gradually liberalise the capital account, making
market has developed rapidly, with a number of banks following the
sovereign in tapping the global bond market, and the domestic corporate
Economic Climate
economic environment, the domestic economy has enjoyed a peace
dividend that has resulted in high growth averaging above 7% per annum,
back of structural reforms.
during the war economic growth was maintained at an average of around
5%. With the recent policy reforms, developments in infrastructure and
increased investment, the economy is well on target to securing a long
term growth path well above past trends.
has developed close political and economic ties with China, with a Free
Trade Agreement under negotiation and strong aviation and shipping
links already in place. In parallel, the new government has strengthened
diplomatic and economic ties with key trading partners the US and the EU,
which creates a suitable balance for economic and geopolitical objectives
of the country. Greater economic and political integration with key global
the drivers of global economic growth in the medium to long term.
Country Report
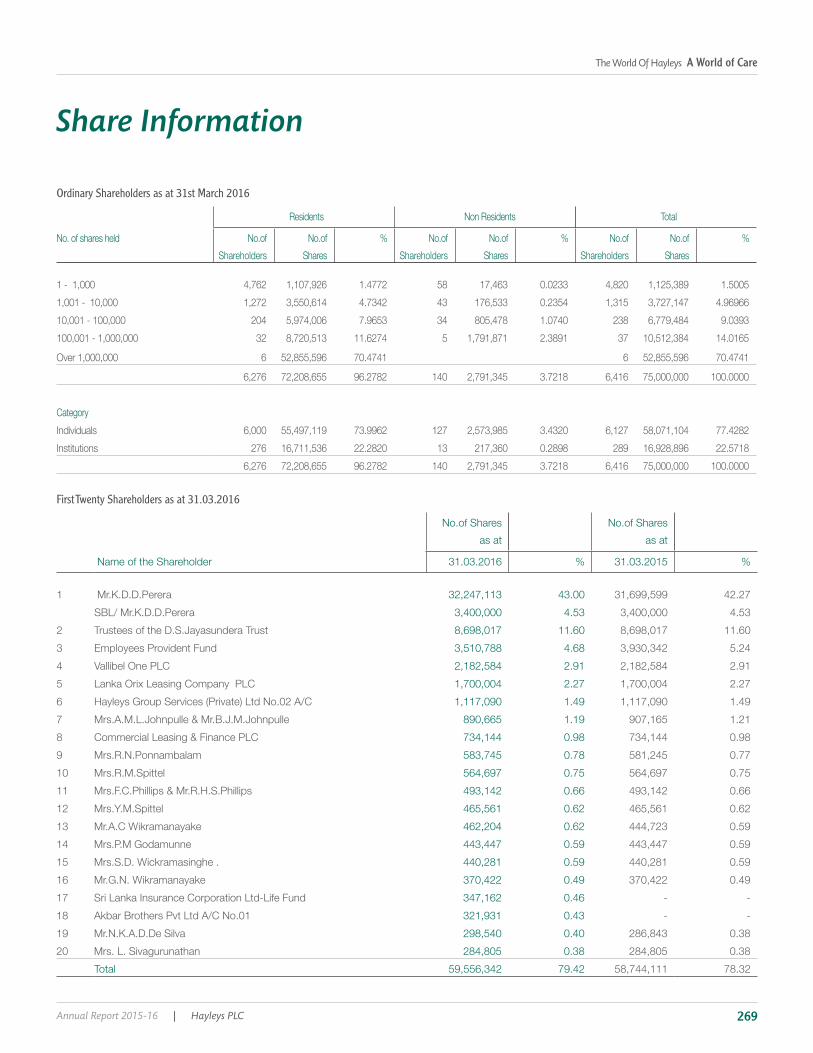
The World Of Hayleys A World of Care
Annual Report 2015-16 | Hayleys PLC 269
Share Information
Ordinary Shareholders as at 31st March 2016
Residents Non Residents Total
No. of shares held No.of
Shareholders
No.of
Shares
% No.of
Shareholders
No.of
Shares
% No.of
Shareholders
No.of
Shares
%
1 - 1,000 4,762 1,107,926 1.4772 58 17,463 0.0233 4,820 1,125,389 1.5005
1,001 - 10,000 1,272 3,550,614 4.7342 43 176,533 0.2354 1,315 3,727,147 4.96966
10,001 - 100,000 204 5,974,006 7.9653 34 805,478 1.0740 238 6,779,484 9.0393
100,001 - 1,000,000 32 8,720,513 11.6274 5 1,791,871 2.3891 37 10,512,384 14.0165
Over 1,000,000 6 52,855,596 70.4741 6 52,855,596 70.4741
6,276 72,208,655 96.2782 140 2,791,345 3.7218 6,416 75,000,000 100.0000
Category
Individuals 6,000 55,497,119 73.9962 127 2,573,985 3.4320 6,127 58,071,104 77.4282
Institutions 276 16,711,536 22.2820 13 217,360 0.2898 289 16,928,896 22.5718
6,276 72,208,655 96.2782 140 2,791,345 3.7218 6,416 75,000,000 100.0000
First Twenty Shareholders as at 31.03.2016
No.of Shares
as at
No.of Shares
as at
Name of the Shareholder 31.03.2016 % 31.03.2015 %
1 32,247,113 43.00 31,699,599 42.27
3,400,000 4.53 3,400,000 4.53
2 Trustees of the D.S.Jayasundera Trust 8,698,017 11.60 8,698,017 11.60
3 Employees Provident Fund 3,510,788 4.68 3,930,342 5.24
4 2,182,584 2.91 2,182,584 2.91
5 1,700,004 2.27 1,700,004 2.27
6 1,117,090 1.49 1,117,090 1.49
7 890,665 1.19 907,165 1.21
8 734,144 0.98 734,144 0.98
9 Mrs.R.N.Ponnambalam 583,745 0.78 581,245 0.77
10 Mrs.R.M.Spittel 564,697 0.75 564,697 0.75
11 Mrs.F.C.Phillips & Mr.R.H.S.Phillips 493,142 0.66 493,142 0.66
12 Mrs.Y.M.Spittel 465,561 0.62 465,561 0.62
13 Mr.A.C Wikramanayake 462,204 0.62 444,723 0.59
14 Mrs.P.M Godamunne 443,447 0.59 443,447 0.59
15 Mrs.S.D. Wickramasinghe . 440,281 0.59 440,281 0.59
16 Mr.G.N. Wikramanayake 370,422 0.49 370,422 0.49
17 347,162 0.46 - -
18 321,931 0.43 - -
19 298,540 0.40 286,843 0.38
20 284,805 0.38 284,805 0.38
Total 59,556,342 79.42 58,744,111 78.32
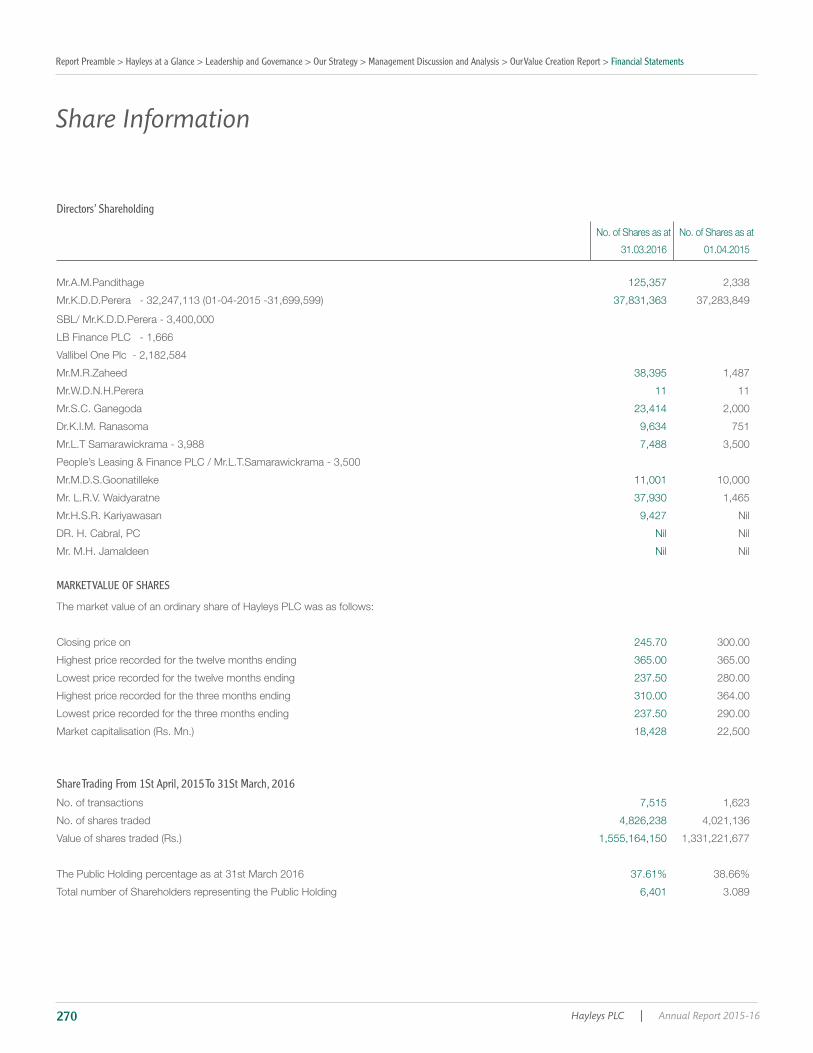
Report Preamble > Hayleys at a Glance > Leadership and Governance > Our Strategy > Management Discussion and Analysis > Our Value Creation Report > Financial Statements
Hayleys PLC | Annual Report 2015-16270
Directors’ Shareholding
No. of Shares as at
31.03.2016
No. of Shares as at
01.04.2015
Mr.A.M.Pandithage 125,357 2,338
37,831,363 37,283,849
Vallibel One Plc - 2,182,584
Mr.M.R.Zaheed 38,395 1,487
Mr.W.D.N.H.Perera 11 11
Mr.S.C. Ganegoda 23,414 2,000
9,634 751
7,488 3,500
Mr.M.D.S.Goonatilleke 11,001 10,000
37,930 1,465
9,427 Nil
DR. H. Cabral, PC Nil Nil
Mr. M.H. Jamaldeen Nil Nil
MARKET VALUE OF SHARES
Closing price on 245.70 300.00
Highest price recorded for the twelve months ending 365.00 365.00
237.50 280.00
Highest price recorded for the three months ending 310.00 364.00
237.50 290.00
18,428 22,500
Share Trading From 1St April, 2015 To 31St March, 2016
No. of transactions 7,515 1,623
No. of shares traded 4,826,238 4,021,136
1,555,164,150 1,331,221,677
The Public Holding percentage as at 31st March 2016 37.61% 38.66%
Total number of Shareholders representing the Public Holding 6,401 3.089
Share Information

The World Of Hayleys A World of Care
Annual Report 2015-16 | Hayleys PLC 271
Listed Debentures Details regarding the listed debentures are as follows;
Debenture 1 -
Listed, rated, senior, unsecured, redeemable Debentures at 14.25% p.a. payable quarterly and redeemable on 9th July, 2016
Interest rate of comparable Government Securities as at 31st March, 2016, 9.30% (Net of tax)
Debenture Trading Information For The Twelve Months Ended - 31.03.2016
No. of Transactions 5
No. of Debentures traded 109,400
Highest Price 1,056.22
Lowest Price 1,000.34
Last Traded Price 1,015.00
Interest yield - Last traded 9.90%
Yield to maturity - Last traded 13.78%
Debenture Trading Information For The Three Months Ended - 31.03.2016
No. of Transactions 3
No. of Debentures traded 14,100
Highest Price 1,015.00
Lowest Price 1,000.34
Last Traded Price 1,015.00
Interest yield - Last traded 9.90%
Yield to maturity - Last traded 13.78%
Debenture 2 -
Listed, rated, unsecured, redeemable Debentures at 7.60% p.a. payable semi annually and redeemable on 6th March, 2019 Interest rate of comparable
Government Securities as at 31st March, 2016, 11.69% (Net of tax)
Debenture Trading Information For The Twelve Months Ended - 31.03.2016
There were no transactions during the period.
Debenture 3 -
Listed ,rated, unsecured, redeemable Debentures at 7.85% p.a. payable semi annually and redeemable on 6th March, 2020 Interest rate of comparable
Government Securities as at 31st March, 2016, 11.73% (Net of tax)
Debenture Trading Information For The Twelve Months Ended - 31.03.2016
There were no transactions during the period.
Ratios 2016 2015
Debt/ equity ratio 0.60 0.66
Quick asset ratio 0.51 1.27
Interest cover 2.40 2.16
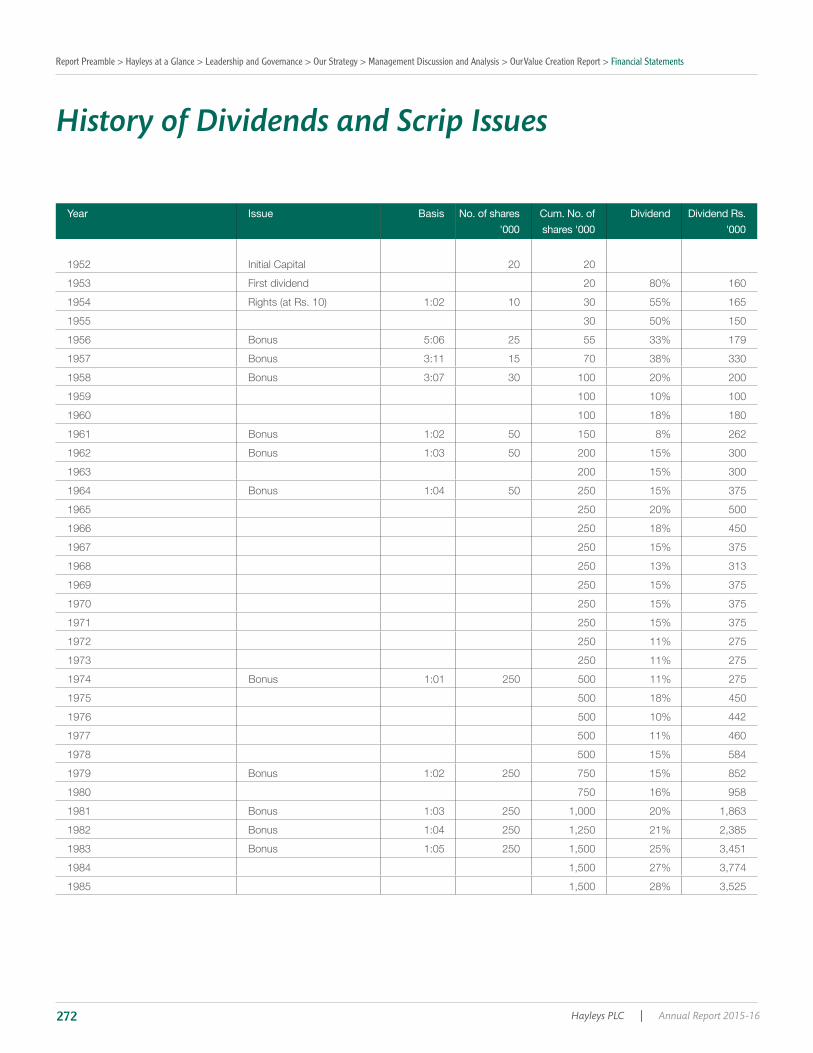
Report Preamble > Hayleys at a Glance > Leadership and Governance > Our Strategy > Management Discussion and Analysis > Our Value Creation Report > Financial Statements
Hayleys PLC | Annual Report 2015-16272
History of Dividends and Scrip Issues
Year Issue Basis No. of shares'000
Cum. No. ofshares '000
Dividend Dividend Rs.'000
1952 Initial Capital 20 20
1953 First dividend 20 80% 160
1954 1:02 10 30 55% 165
1955 30 50% 150
1956 Bonus 5:06 25 55 33% 179
1957 Bonus 3:11 15 70 38% 330
1958 Bonus 3:07 30 100 20% 200
1959 100 10% 100
1960 100 18% 180
1961 Bonus 1:02 50 150 8% 262
1962 Bonus 1:03 50 200 15% 300
1963 200 15% 300
1964 Bonus 1:04 50 250 15% 375
1965 250 20% 500
1966 250 18% 450
1967 250 15% 375
1968 250 13% 313
1969 250 15% 375
1970 250 15% 375
1971 250 15% 375
1972 250 11% 275
1973 250 11% 275
1974 Bonus 1:01 250 500 11% 275
1975 500 18% 450
1976 500 10% 442
1977 500 11% 460
1978 500 15% 584
1979 Bonus 1:02 250 750 15% 852
1980 750 16% 958
1981 Bonus 1:03 250 1,000 20% 1,863
1982 Bonus 1:04 250 1,250 21% 2,385
1983 Bonus 1:05 250 1,500 25% 3,451
1984 1,500 27% 3,774
1985 1,500 28% 3,525

The World Of Hayleys A World of Care
Annual Report 2015-16 | Hayleys PLC 273
Year Issue Basis No. of shares'000
Cum. No. ofshares '000
Dividend Dividend Rs.'000
1986 Bonus 1:03 500 2,000 33% 6,600
1987 Bonus 1:02 1,000 3,000 33% 9,900
1988 Bonus 1:03 1,000 4,000 33% 13,200
1989 Bonus 1:04 1,000 5,000 33% 16,500
1990 Bonus 1:05 1,000 6,000 33% 19,800
1991 Bonus 1:04 1,500 7,500 33% 24,750
1992 Bonus 1:05 1,500 9,000 33% 29,700
1993 Bonus 1:06 1,500 10,500 30% 31,500
1994 Bonus 4:21 2,000
1:05 2,500 15,000 30% 40,500
1995 Bonus 1:05 3,000 18,000 30% 54,000
1996 Bonus 1:09 2,000 20,000 30% 60,000
1997 Bonus 1:10 2,000 22,000 30% 66,000
1998 Bonus 1:11 2,000 24,000
2,400 26,400 30% 79,200
1999 Bonus 1:06 4,400 30,800 30% 92,400
2000 Bonus 1:14 2,200 33,000 30% 99,000
2001 1:11 3,000 36,000 35% 126,000
2002 1:09 4,000 40,000 35% 140,000
2003 1:08 5,000 45,000 35% 157,500
2004 1:09 5,000 50,000 35% 175,000
2005 1:10 5,000 55,000
Bonus 4:11 20000 75,000 35% 262,500
2006 75,000 35% 262,500
2007 75,000 Rs.3.50 p.s 262,500
2008 75,000 Rs.3.00 p.s 225,000
2009 75,000 Rs.3.00 p.s 225,000
2010 75,000 Rs.4.00 p.s 300,000
2011 75,000 Rs.4.00 p.s 300,000
2012 75,000 Rs.4.00 p.s 300,000
2013 75,000 Rs.4.50 p.s 337,500
2014 75,000 Rs.5.00 p.s 375,000
2015 75,000 Rs.6.00 p.s 450,000
2016 75,000 Rs.6.50 p.s 487,500

Report Preamble > Hayleys at a Glance > Leadership and Governance > Our Strategy > Management Discussion and Analysis > Our Value Creation Report > Financial Statements
Hayleys PLC | Annual Report 2015-16274
Quarterly Analysis
Quarter 01 Quarter 02 Quarter 03 Quarter 04
Rs.'000 Rs.'000 Rs.'000 Rs.'000
Revenue 22,023 44,020 67,625 92,275
Profit before tax 1,191 2,720 4,225 6,816
Tax expense 268 652 1,176 1,757
Profit after tax 923 2,067 3,049 5,060
Profit attrributable to owners of the parent 523 1,152 1,686 3,004
Profit attrributable to non-controlling interest 400 915 1,363 2,056
Total comprehensive income for the period, net of tax 768 2,052 3,299 5,092
Non Current Assets 56,080 57,689 58,600 60,298
Current Assets 38,162 37,066 39,036 43,023
Non current liabilities 18,870 17,915 19,463 20,175
Current liabilities 30,947 31,608 32,682 36,564
Rs. Rs. Rs. Rs.
Market Value of Shares
Closing share price 344.00 326.20 307.40 245.70
Basic earnings per share 6.97 15.36 22.48 40.05
Diluted earnings per share 6.97 15.36 22.48 40.05
Highest price recorded for the three months ending 364.50 365.00 337.80 310.00
Lowest price recorded for the three months ending 300.00 322.10 305.00 237.50
Market capitalisation (Rs. Mn.) 25,800 24,465 23,055 18,428
Share Trading Information
No. of transactions 484 3,785 6,378 7,515
No. of shares traded 779,350 2,378,496 3,937,204 4,826,238
Value of shares traded (Rs) 264,615,480 807,399,565 1,311,069,293 1,555,164,150

The World Of Hayleys A World of Care
Annual Report 2015-16 | Hayleys PLC 275
Sub sector Company Nature of the Business
Eco solutions Industrial and household brushware
Cleaning devices
Moulded rubber products
Value added coir-based products
Value added coir-based products
Services
Coir and treated rubber timber products
Investments
Coir-based products and essential oil
Needled and rubberised coir products
Trading in coir-based products
Hand protection Dipped Products Group General purpose and speciality rubber gloves
Haycarb Group
Textiles
Construction material Alumex Group Aluminium extrusions
Plantations Plantation Management
Plantation Management
Processed tea and rubber
Processed black and green tea
Manufacture of ready- to - drink tea powder
Mabroc Group Export of bulk and retail packed tea
Manufacturing instant tea and tea extract
Agriculture Crop production and protection materials, agricultural
equipment and animal health products
Agricultural machinery and equipment
Crop protection chemicals
Fresh/processed vegetables
Retailed-packed, processed vegetables
Group Companies

Report Preamble > Hayleys at a Glance > Leadership and Governance > Our Strategy > Management Discussion and Analysis > Our Value Creation Report > Financial Statements
Hayleys PLC | Annual Report 2015-16276
Group Companies
Sub sector Company Nature of the Business
Planting material
Horticultural tissue culture products
Fertiliser
Growing/ exporting dry seaweed for carrageenan
Consumer Products
and FMCG products
Manufacturers, importers, retailers
Electrical and general engineering products
Travel Agency and Destination Management
Industry Inputs Engineering and projects, power generation, pigments and
industrial raw materials
Supplying health care equipment
Textile dyestuff and binders
Marketing of power generating equipment
Power & Energy Hydropower
Hydropower
Hydropower
Windpower
Hydropower
Hydropower
Hydropower
Hydropower investments
Hydropower
Hydropower
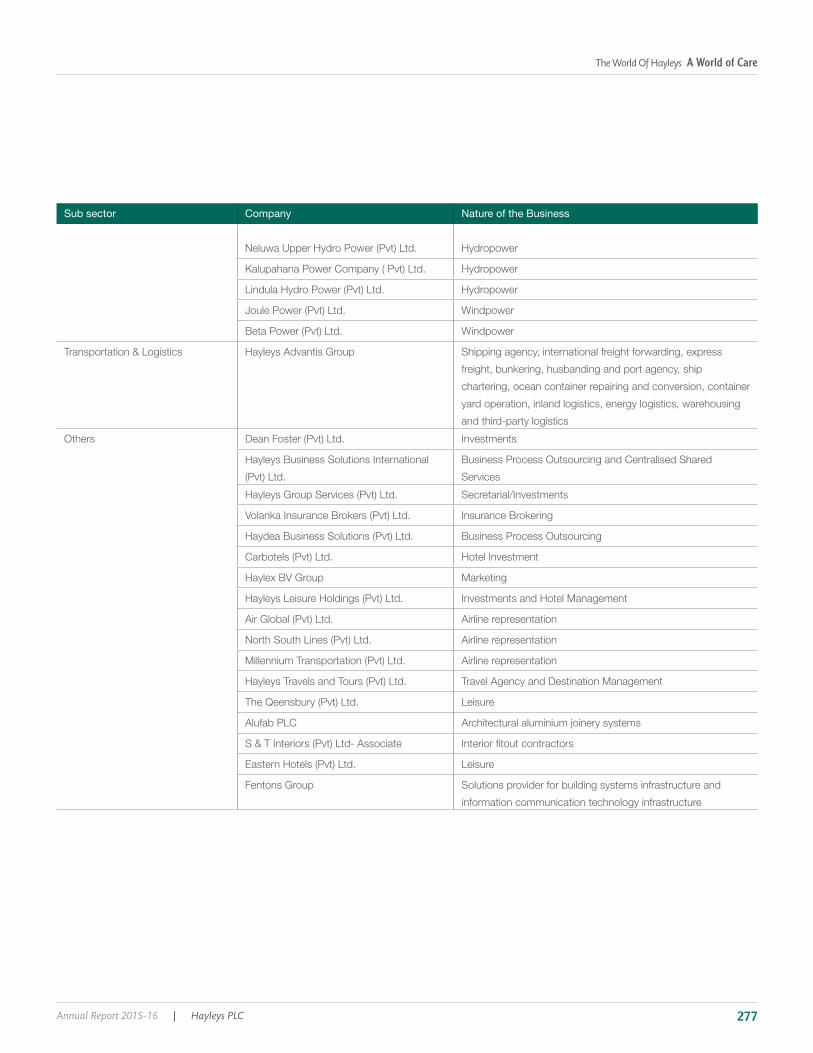
The World Of Hayleys A World of Care
Annual Report 2015-16 | Hayleys PLC 277
Sub sector Company Nature of the Business
Hydropower
Hydropower
Hydropower
Windpower
Windpower
Hayleys Advantis Group Shipping agency, international freight forwarding, express
freight, bunkering, husbanding and port agency, ship
chartering, ocean container repairing and conversion, container
yard operation, inland logistics, energy logistics, warehousing
and third-party logistics
Others Investments
Hayleys Business Solutions International Business Process Outsourcing and Centralised Shared
Services
Secretarial/Investments
Insurance Brokering
Business Process Outsourcing
Hotel Investment
Haylex BV Group Marketing
Investments and Hotel Management
Airline representation
Airline representation
Airline representation
Travel Agency and Destination Management
Architectural aluminium joinery systems
Fentons Group Solutions provider for building systems infrastructure and
information communication technology infrastructure

Report Preamble > Hayleys at a Glance > Leadership and Governance > Our Strategy > Management Discussion and Analysis > Our Value Creation Report > Financial Statements
Hayleys PLC | Annual Report 2015-16278
Independent Assurance Report
Independent Assurance Report to the Board of Directors of Hayleys PLC on the Sustainability Reporting Under the Integrated Annual Report 2015-16Introduction and scope of the engagement
an independent assurance on the following elements of the sustainability
prepared in accordance with the requirements of the Global Reporting Initiative G4 ‘In accordance’ - Core guidelines.
Basis of our work and level of assurance We performed our procedures to provide limited assurance in accordance
‘Assurance Engagements Other than Audits or Reviews of Historical Financial Information’, issued by the Institute of Chartered Accountants of
The evaluation criteria used for this limited assurance engagement are
related information in particular, the requirements to achieve GRI G4 ‘In accordance’ – Core guideline publication, publicly available at GRI’s global
Our engagement provides limited assurance as well as reasonable assurance. A limited assurance engagement is substantially less in scope than a reasonable assurance engagement conducted in accordance with
in a reasonable assurance engagement.
Management of the Company’s responsibility for the ReportThe management of the Company is responsible for the preparation of the self-declaration, the information and statements contained within the Report, and for maintaining adequate records and internal controls that are designed to support the sustaining reporting process in line with the GRI Sustainability Reporting Guidelines.
Ernst & Young’s responsibilityOur responsibility is to express a conclusion as to whether we have become aware of any matter that causes us to believe that the Report is not prepared in accordance with the requirements of the Global Reporting Initiative G4 ‘In accordance’ – Core guidelines. This report is made solely to the Company in accordance with our engagement letter dated 17 May 2016. We disclaim any assumption of responsibility for any reliance on this report to any person other than the Company or for any purpose other than that for which it was prepared. In conducting our engagement, we have complied with the independence requirements of the Code for Ethics
Key assurance procedures We planned and performed our procedures to obtain the information
included:
and Construction Material to complete the sustainability assurance process for the company. We visited some of the selected sectorial
• We have performed the assurance process based on a sample by
Plantation
Construction Materials
• Interviewing relevant the company’s personnel to understand the process for collection, analysis, aggregation and presentation of data.
• Reviewing and validation of the information contained in the Report.
• Checking the calculations performed by the Company on a sample basis through recalculation.
Our procedures did not include testing electronic systems used to collect and aggregate the information.
Limitations and considerationsEnvironmental and social performance data are subject to inherent limitations given their nature and the methods used for determining, calculating and estimating such data.
ConclusionBased on the procedures performed, as described above, we conclude that;
the Company for the year ended 31 March 2016.
• Nothing has come to our attention that causes us to believe that other information presented in the Report are not fairly presented, in all material respects, in accordance with the Company’s sustainability practices and policies some of which are derived from GRI-G4-‘In accordance’ Core Sustainability Reporting Guidelines.
Chartered Accountants20th May 2016Colombo
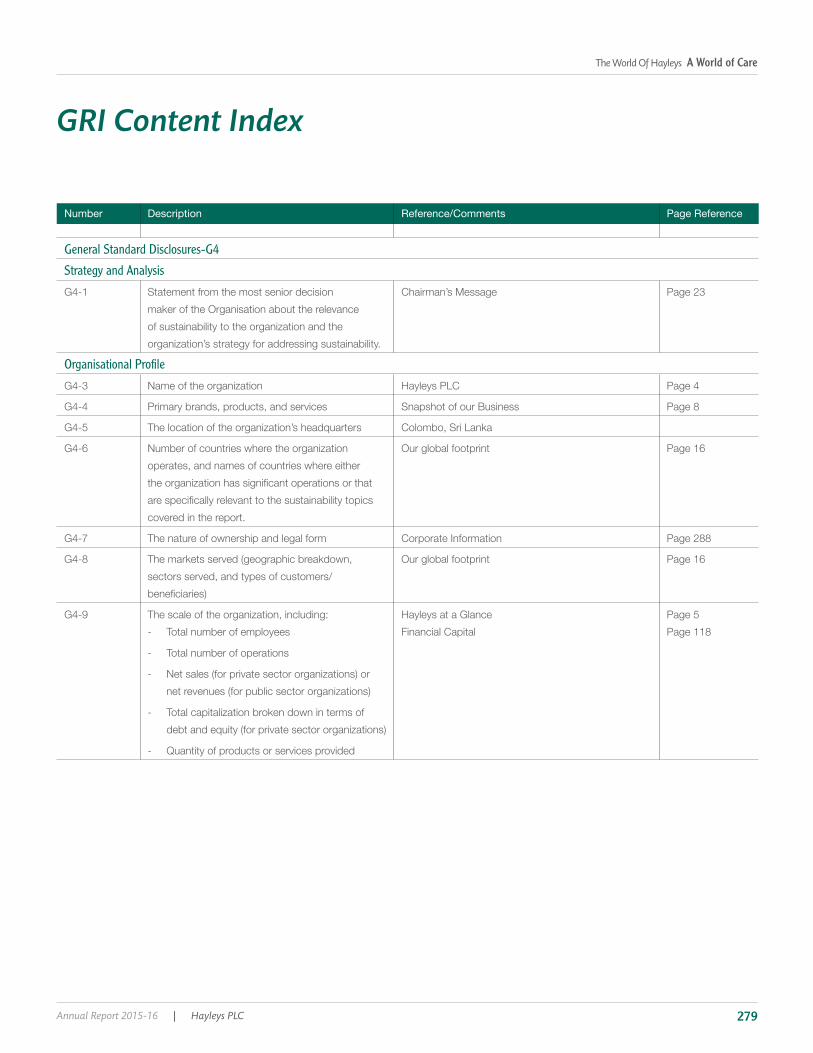
The World Of Hayleys A World of Care
Annual Report 2015-16 | Hayleys PLC 279
Number Description Reference/Comments Page Reference
General Standard Disclosures-G4
Strategy and Analysis
G4-1 Statement from the most senior decision
maker of the Organisation about the relevance
Chairman’s Message Page 23
Organisational Profile
G4-3 Page 4
G4-4 Primary brands, products, and services Snapshot of our Business Page 8
G4-5
G4-6
operates, and names of countries where either
covered in the report.
Our global footprint Page 16
G4-7 The nature of ownership and legal form Corporate Information Page 288
G4-8
sectors served, and types of customers/
Our global footprint Page 16
G4-9
- Total number of employees
- Total number of operations
- Quantity of products or services provided
Hayleys at a Glance
Financial Capital
Page 5
Page 118
GRI Content Index

Report Preamble > Hayleys at a Glance > Leadership and Governance > Our Strategy > Management Discussion and Analysis > Our Value Creation Report > Financial Statements
Hayleys PLC | Annual Report 2015-16280
Number Description Reference/Comments Page Reference
G4-10 a. The total number of employees by employment
contract and gender.
b. The total number of permanent employees by
employment type and gender.
c. The total workforce by employees and
supervised workers and by gender.
d. The total workforce by region and gender.
e. Report whether a substantial portion of the
or by individuals other than employees or
supervised workers, including employees and
supervised employees of contractors.
employment in the tourism or agricultural
Human Capital Page 131
G4-11 The percentage of total employees covered by
collective bargaining agreements.
Human Capital Page 136
G4-12 Cluster Reviews Pages 72-116
G4-13
ownership, or its supply chain, including:
- Changes in the location of, or changes in,
operations, including facility openings, closings,
and expansions
- Changes in the share capital structure and other
capital formation, maintenance, and alteration
- Changes in the location of suppliers, the
structure of the supply chain, or in relationships
with suppliers, including selection and
termination
Notes to the Financial Statements Page 172
G4-14 Whether and how the precautionary approach or Natural Capital Page 137
G4-15
and social charters, principles, or other initiatives
endorses.
Report preamble Page 4
GRI Content Index

The World Of Hayleys A World of Care
Annual Report 2015-16 | Hayleys PLC 281
Number Description Reference/Comments Page Reference
G4-16 • Our Network Page 124
Identified Material Aspects and Boundaries
G4-17
documents.
b. Report whether any entity included in the
or equivalent documents is not covered by the
report.
Notes to the Financial Statements Page 172
G4-18
content and the Aspect Boundaries.
Content.
Determining Materiality Page 58
G4-19 Determining Materiality Page 59
G4-20 For each material Aspect, the Aspect Boundary Determining Materiality Page 59
G4-21 For each material Aspect, report the Aspect Determining Materiality Page 59
G4-22 The effect of any restatements of information
provided in previous reports, and the reasons for
such restatements.
There are no restatements
G4-23
in the Scope and Aspect Boundaries.
Determining Materiality Page 59
Stakeholder Engagement
G4-24 Page 56
G4-25
stakeholders with whom to engage.
Page 56
G4-26
engagement
Page 56
G4-27
through stakeholder engagement
Page 56
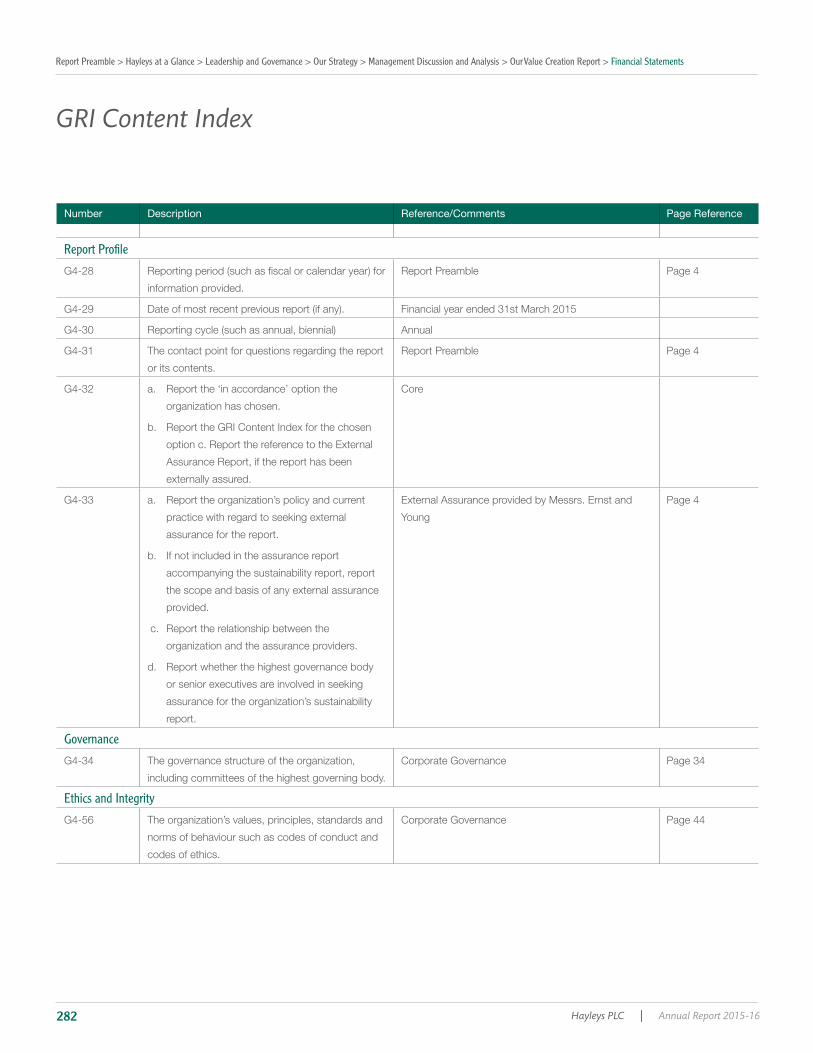
Report Preamble > Hayleys at a Glance > Leadership and Governance > Our Strategy > Management Discussion and Analysis > Our Value Creation Report > Financial Statements
Hayleys PLC | Annual Report 2015-16282
GRI Content Index
Number Description Reference/Comments Page Reference
Report Profile
G4-28
information provided.
Report Preamble Page 4
G4-29 Financial year ended 31st March 2015
G4-30 Annual
G4-31 The contact point for questions regarding the report
or its contents.
Report Preamble Page 4
G4-32 a. Report the ‘in accordance’ option the
b. Report the GRI Content Index for the chosen
option c. Report the reference to the External
Assurance Report, if the report has been
externally assured.
Core
G4-33
practice with regard to seeking external
assurance for the report.
b. If not included in the assurance report
accompanying the sustainability report, report
the scope and basis of any external assurance
provided.
c. Report the relationship between the
d. Report whether the highest governance body
or senior executives are involved in seeking
report.
External Assurance provided by Messrs. Ernst and
Young
Page 4
Governance
G4-34
including committees of the highest governing body.
Corporate Governance Page 34
Ethics and Integrity
G4-56
norms of behaviour such as codes of conduct and
codes of ethics.
Corporate Governance Page 44

The World Of Hayleys A World of Care
Annual Report 2015-16 | Hayleys PLC 283
Number Description Reference/Comments Page Reference
Specific Standard Disclosures
Economic Aspects
Economic Performance
G4-EC1 Direct economic value generated Consolidated value added statement Page 285
G4-EC2 Financial implications and other risks and
opportunities for the Organisation’s activities due to
climate change
Natural Capital Page 139
G4-EC3 Human Capital Page 136
Environmental Aspects
Materials
G4-EN1 Materials used by weight or volume Natural Capital Page 138
Energy
G4-EN3 Natural Capital Page 138
Water
G4-EN8 Total water withdrawal by source Natural Capital Page 138
Emissions
G4-EN15 Natural Capital Page 139
G4-EN16 Natural Capital Page 139
G4-EN18 Natural Capital Page 139
G4-EN19 Natural Capital Page 139
Effluents and Waste
G4-EN22 Total water discharge by quality and destination Natural Capital Page 139
G4-EN23 Total weight of waste by type and disposal method Natural Capital Page 139
Compliance
G4-EN29
of non-monetary sanctions for non-compliance with
environmental laws and regulations
There were no violations of environmental laws
and regulations during the year due to our strict
compliance programme. Consequently there were no
Page 138
Overall
G4-EN31 Total environmental protection expenditures and
investments by type
Natural Capital Page 139
Social Aspects
Employment: Labour practices and Decent Work
Total number and rates of new employee hires
and employee turnover by age group, gender, and
region
Human Capital Page 135

Report Preamble > Hayleys at a Glance > Leadership and Governance > Our Strategy > Management Discussion and Analysis > Our Value Creation Report > Financial Statements
Hayleys PLC | Annual Report 2015-16284
GRI Content Index
Number Description Reference/Comments Page Reference
Employment: Occupational health and safety
Type of injury and rates of injury, occupational
diseases, lost days, and absenteeism, and total
number of work-related fatalities, by region and by
gender
Human Capital Page 136
Employment: Training and Education
Average hours of training per year per employee by
gender, and by employee category
Human Capital Page 136
Percentage of employees receiving regular
performance and career development reviews, by
gender and by employee category
Human Capital Page 136
Human Rights: Child Labour
G4-HR5
measures taken to contribute to the effective
abolition of child labour
Human Capital Page 135
Society: Local Communities
G4-SO1 Percentage of operations with implemented local
community engagement, impact assessments, and
development programs
Community Engagement Page 125
Product Responsibility: Customer Health and Safety
G4-PR1
categories for which health and safety impacts are
assessed for improvement
Product and Service Responsibility Page 123

The World Of Hayleys A World of Care
Annual Report 2015-16 | Hayleys PLC 285
Group Value Addition and Distribution
Consolidated
2015/16 2014/15
Rs. Mn Rs. Mn
Value Created
Revenue 92,275 92,562
Cost of materials & Services bought in
25,321 25,071
Share % Share %
Value Distributed
To Employees as remuneration 53 13,396 56 14,018
To Government Revenue 10 2,657 6 1,615
2,385 1,317
Overseas 272 298
To Shareholders as Dividend 2 488 2 450
16 3,987 18 4,441
Interest on borrowings 1,931 2,136
Non-controlling interest 2,056 2,305
81 20,527 82 20,524
Value retained for expansion & growth
Depreciation 10 2,520 10 2,440
9 2,274 8 2,107
19 4,794 18 4,547
100 25,321 100 25,071
To Employees as remuneration
To Government Revenue
To Shareholders as Dividend
To Lenders of capital
Depreciation
Profit retained
10%
10% 53%
16%
9%
2%
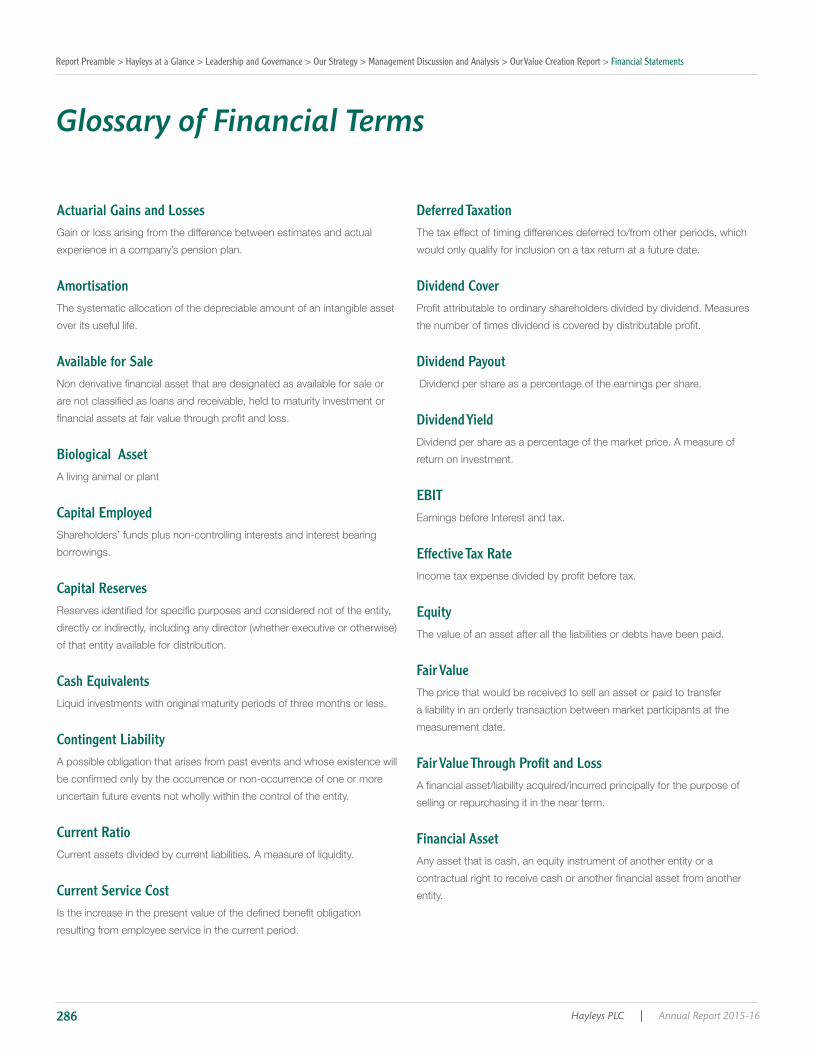
Report Preamble > Hayleys at a Glance > Leadership and Governance > Our Strategy > Management Discussion and Analysis > Our Value Creation Report > Financial Statements
Hayleys PLC | Annual Report 2015-16286
Actuarial Gains and Losses Gain or loss arising from the difference between estimates and actual
experience in a company’s pension plan.
AmortisationThe systematic allocation of the depreciable amount of an intangible asset
over its useful life.
Available for Sale
Biological AssetA living animal or plant
Capital EmployedShareholders’ funds plus non-controlling interests and interest bearing
borrowings.
Capital Reserves
of that entity available for distribution.
Cash Equivalents
Contingent LiabilityA possible obligation that arises from past events and whose existence will
uncertain future events not wholly within the control of the entity.
Current RatioCurrent assets divided by current liabilities. A measure of liquidity.
Current Service Cost
resulting from employee service in the current period.
Deferred TaxationThe tax effect of timing differences deferred to/from other periods, which
would only qualify for inclusion on a tax return at a future date.
Dividend Cover
Dividend Payout Dividend per share as a percentage of the earnings per share.
Dividend YieldDividend per share as a percentage of the market price. A measure of
return on investment.
EBITEarnings before Interest and tax.
Effective Tax Rate
EquityThe value of an asset after all the liabilities or debts have been paid.
Fair ValueThe price that would be received to sell an asset or paid to transfer
a liability in an orderly transaction between market participants at the
measurement date.
Fair Value Through Profit and Loss
selling or repurchasing it in the near term.
Financial AssetAny asset that is cash, an equity instrument of another entity or a
entity.
Glossary of Financial Terms
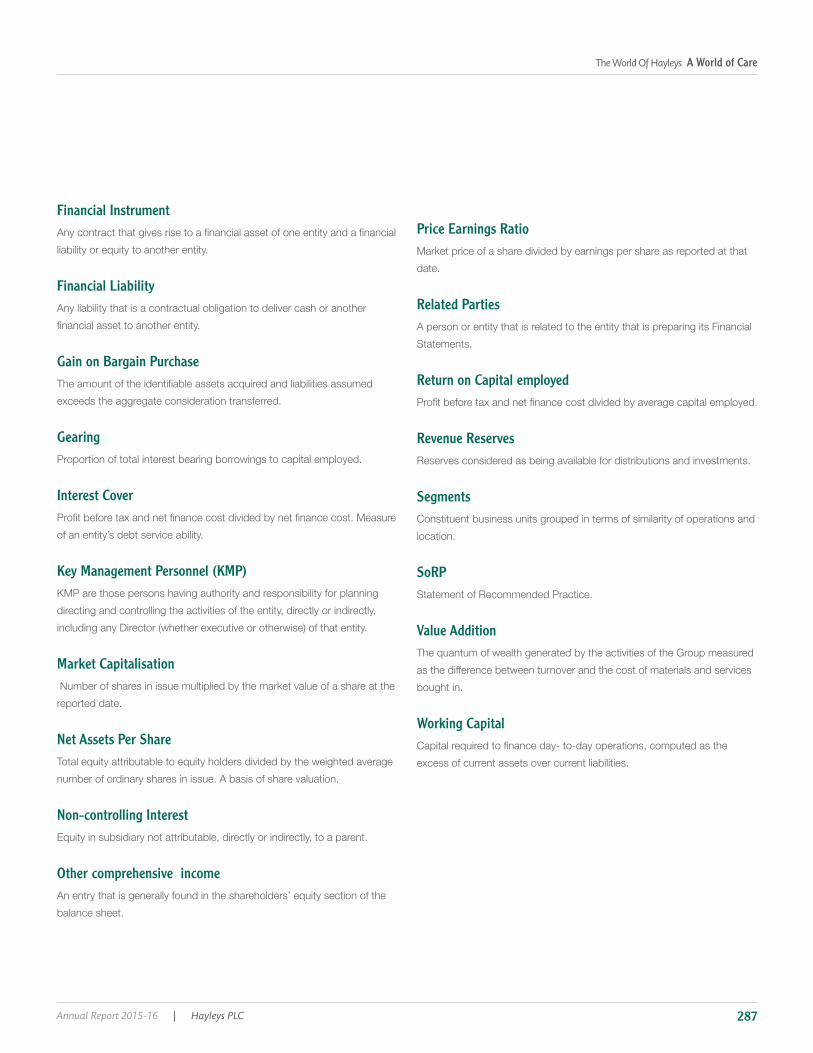
The World Of Hayleys A World of Care
Annual Report 2015-16 | Hayleys PLC 287
Financial Instrument
liability or equity to another entity.
Financial LiabilityAny liability that is a contractual obligation to deliver cash or another
Gain on Bargain Purchase
exceeds the aggregate consideration transferred.
GearingProportion of total interest bearing borrowings to capital employed.
Interest Cover
of an entity’s debt service ability.
Key Management Personnel (KMP)
directing and controlling the activities of the entity, directly or indirectly,
Market Capitalisation Number of shares in issue multiplied by the market value of a share at the
reported date.
Net Assets Per Share Total equity attributable to equity holders divided by the weighted average
number of ordinary shares in issue. A basis of share valuation.
Non-controlling Interest Equity in subsidiary not attributable, directly or indirectly, to a parent.
Other comprehensive income An entry that is generally found in the shareholders’ equity section of the
balance sheet.
Price Earnings RatioMarket price of a share divided by earnings per share as reported at that
date.
Related PartiesA person or entity that is related to the entity that is preparing its Financial
Statements.
Return on Capital employed
Revenue ReservesReserves considered as being available for distributions and investments.
SegmentsConstituent business units grouped in terms of similarity of operations and
location.
SoRPStatement of Recommended Practice.
Value AdditionThe quantum of wealth generated by the activities of the Group measured
as the difference between turnover and the cost of materials and services
bought in.
Working Capital
excess of current assets over current liabilities.

Report Preamble > Hayleys at a Glance > Leadership and Governance > Our Strategy > Management Discussion and Analysis > Our Value Creation Report > Financial Statements
Hayleys PLC | Annual Report 2015-16288
Name Of Company
Company Number PQ 22
Principal Activities Holding Company carrying out investments in and providing management and services to Hayleys Group Companies
Stock Exchange Listing The ordinary shares of the Company are listed with the Colombo
Registered Office Hayley Building, P.O. Box 70, 400, Deans Road,
Website: http://www.hayleys.com
Directors A M Pandithage – Chairman & Chief Executive
M R Zaheed W D N H Perera S C Ganegoda
Dr. H Cabral, PC
M H Jamaldeen
Group Management Committee A M Pandithage – Chief Executive M R Zaheed S C Ganegoda
H C S Mendis S J Wijesignhe
Dr A Sivagananathan
W G R Rajadurai E R P Goonetilleke
Audit Committee
W D N H PereraDr H Cabral, PCM H Jamaldeen
Remuneration CommitteeDr H Cabral, PC – Chairman
W D N H Perera
M H Jamaldeen
Nomination CommitteeA M Pandithage – Chairman
W D N H PereraDr H Cabral, PC
Related Party Transaction Review CommitteeDr H Cabral, PC - ChairmanS C Ganegoda
Secretaries
E-mail: [email protected] direct any queries about the administration of shareholdings to the Company Secretaries
Investor RelationsPlease contact Strategic Business Development Unit
E-mail: [email protected]
Internetwww.hayleys.com
Corporate Information
The World Of Hayleys A World of Care
Annual Report 2015-16 | Hayleys PLC 289
Notes
Report Preamble > Hayleys at a Glance > Leadership and Governance > Our Strategy > Management Discussion and Analysis > Our Value Creation Report > Financial Statements
Hayleys PLC | Annual Report 2015-16290
Notes
The World Of Hayleys A World of Care
Annual Report 2015-16 | Hayleys PLC 291

Report Preamble > Hayleys at a Glance > Leadership and Governance > Our Strategy > Management Discussion and Analysis > Our Value Creation Report > Financial Statements
Hayleys PLC | Annual Report 2015-16292
HAYLEYS PLCCompany Number PQ 22
NOTICE IS HEREBY GIVEN that the Sixty Fifth Annual General Meeting of Hayleys PLC will be held at Balmoral Ballroom, The Kingsbury Hotel , No.48,
Janadhipathi Mawatha, Colombo 01 on Wednesday, 29th June 2016 at 10.00 a.m. and the business to be brought before the Meeting will be:
1. To consider and adopt the Annual Report of the Board of Directors and the Statements of Accounts for the year ended 31st March 2016, with the
Report of the Auditors thereon.
2. To declare a dividend as recommended by the Directors.
3. To re-elect Mr.M.R.Zaheed, who retires by rotation at the Annual General Meeting, a Director.
4. To re-elect Mr.H.S.R.Kariyawasan, who retires by rotation at the Annual General Meeting, a Director.
5. To re-elect Dr.H.Cabral, PC, who retires by rotation at the Annual General Meeting, a Director.
6. To authorise the Directors to determine contributions to charities for the financial year 2016/17.
7. To authorize the Directors to determine the remuneration of the Auditors, Messrs Ernst & Young, Chartered Accountants who are deemed to have
been reappointed as Auditors, for the financial year 2016/17.
8. To consider any other business of which due notice has been given.
NOTE :
(i). A Shareholder is entitled to appoint a proxy to attend and vote instead of himself and a proxy need not be a Shareholder of the Company. A Form of
Proxy is enclosed for this purpose. The instrument appointing a proxy must be deposited at the Registered Office, No.400, Deans Road, Colombo
10 by 10.00 a.m. on 27th June 2016.
(ii). It is proposed to post ordinary dividend warrants on 11th July 2016 and in accordance with the rules of the Colombo Stock Exchange the shares of
the Company will be quoted ex-dividend with effect from 30th June 2016.
By Order of the Board
HAYLEYS PLC
HAYLEYS GROUP SERVICES (PRIVATE) LIMITED
Secretaries
Colombo
3rd June 2016
Notice of Meeting

The World Of Hayleys A World of Care
Annual Report 2015-16 | Hayleys PLC 293
HAYLEYS PLCCompany Number PQ 22
I/We……………………………………………………………………………………………………………………….........................................………………….
of……………………………………………………………………………………………….……………………..……........................................…………………
being Shareholder/Shareholders* of HAYLEYS PLC hereby appoint:
1. …………………………………………………………………………………….…………………..……………………………of ………………………………
…………………………………………………………………………………………………………. or failing him/them
2. ABEYAKUMAR MOHAN PANDITHAGE (Chairman of the Company) of Colombo, or failing him, one of the Directors of the Company as my/our * proxy to
attend, speak and vote as indicated hereunder for me/us* and on my/our* behalf at the Sixty Fifth Annual General Meeting of the Company to be held on
Wednesday, 29th June 2016 and at every poll which may be taken in consequence of the aforesaid meeting and at any adjournment thereof
For Against
1. To adopt the Annual Report of the Board of Directors and the Statements of Accounts for the year ended
31st March 2016 with the Report of the Auditors thereon.
2. To declare a dividend as recommended by the Directors.
3. To re-elect Mr.M.R.Zaheed, who retires by rotation at the Annual General Meeting, a Director.
4. To re-elect Mr.H.S.R.Kariyawasan, who retires by rotation at the Annual General Meeting, a Director.
5. To re-elect Dr.H.Cabral, PC, who retires by rotation at the Annual General Meeting, a Director.
6. To authorise the Directors to determine contributions to charities for the financial year 2016/17.
7. To authorize the Directors to determine the remuneration of the Auditors, Messrs Ernst & Young,
Chartered Accountants who are deemed to have been reappointed as Auditors, for the financial year 2016/17.
(**) The proxy may vote as he thinks fit on any other resolution brought before the Meeting.
As witness my/our* hands this ……………………. day of …………………………….2016.
Witness: …………………………..............…… …………………………..............……
…………………………..............…… Signature of Shareholder
…………………………..............……
Note : * Please delete the inappropriate words.
1. A proxy need not be a Shareholder of the Company.
2. Instructions as to completion appear on the reverse.
Form of Proxy

Report Preamble > Hayleys at a Glance > Leadership and Governance > Our Strategy > Management Discussion and Analysis > Our Value Creation Report > Financial Statements
Hayleys PLC | Annual Report 2015-16294
Form of Proxy
INSTRUCTIONS AS TO COMPLETION :
1. To be valid, this Form of Proxy must be deposited at the Registered Office, No. 400, Deans Road,
Colombo 10, by 10.00 a.m. on 27th June 2016
2. In perfecting the Form of Proxy, please ensure that all details are legible.
3. If you wish to appoint a person other than the Chairman of the Company (or failing him, one of the
Directors of the Company) as your proxy, please insert the relevant details at (1) overleaf and initial against
this entry.
4. Please indicate with an X in the space provided how your proxy is to vote on each resolution. If no indication is
given, the proxy in his discretion will vote as he thinks fit. Please also delete (**) if you do not wish your proxy to
vote as he thinks fit on any other resolution brought before the Meeting.
5. In the case of a Company/Corporation, the proxy must be under its Common Seal which should be affixed and
attested in the manner prescribed by its Articles of Association.
6. Where the Form of Proxy is signed under a Power of Attorney (POA) which has not been registered with the
Company, the original (POA) together with a photocopy of same or a copy certified by a Notary Public must be
lodged with the Company along with the Form of Proxy.

The World Of Hayleys A World of Care
Annual Report 2015-16 | Hayleys PLC 295
To request information or submit a comment / query to the Company, please complete the following and return this page to-
Strategic Business Development Unit
E-mail : [email protected]
Name : ................................................................................................................................................
Permanent Mailing Address : ................................................................................................................................................
County Code Area Code Number
County Code Area Code Number
E-mail : ...............................................................................................................................................
Queries / Comments :
Investor Feedback Form

