a world-class presence
TRANSCRIPT

ANNUAL REPORT
2010-2011
A WORLD-CLASS PRESENCE

H É R O U X - D E V T E K
ABOUT HÉROUX-DEVTEK INC.Héroux-Devtek Inc. (TSX: HRX), a Canadian company, serves two main market segments:
Aerospace and Industrial products, specializing in the design, development, manufacture and repair
and overhaul of related systems and components. Héroux-Devtek Inc. supplies both the commercial
and military sectors of the Aerospace segment with landing gear systems (including spare parts,
repair and overhaul services), airframe structural components and assemblies. The Corporation
also supplies the Industrial segment with large components for power generation equipment and
precision components for other industrial applications. Approximately 70% of the Corporation’s
sales are outside Canada, mainly in the United States. The Corporation’s head office is located
in Longueuil, Québec with facilities in the Greater Montreal area (Longueuil, Dorval, Laval and
St-Hubert); Kitchener and Toronto, Ontario; Arlington, Texas; as well as Springfield, Cleveland and
Cincinnati, Ohio.
INTERNALLY, THE CORPORATION AIMS TO:
GROWTH STRATEGY
F-35

A N N U A L R E P O R T 2 0 1 0 - 2 0 1 1
1
0
100
200
300
400
0
10
20
30
40
50
60
0
5
10
15
20
25
SALES EBITDA NET INCOME
FINANCIAL HIGHLIGHTSFISCAL YEARS ENDED MARCH 31
2011 2010 2009 2008 2007
OPERATING RESULTS
357.657.316.0 %54.8 15.3 %18.5 5.2 %
48.8
FINANCIAL POSITION
32.9 142.1 443.9 99.5
232.7
PER SHARE DATA
0.620.611.627.71
30,11230,22030,174
FINANCIAL RATIOS
2.630.290.41
(1) Earnings before interest, taxes, depreciation and amortization, excluding restructuring charges(2) Including the current portion(3) Defined as the total long-term debt, including the current portion, less cash and cash equivalents over shareholders’ equity
11 11 11

2
MAY 2010U.S. AIR FORCE AND U.S. NAVY—$16M
JULY 2010TRIUMPH AEROSTRUCTURES—$35M
OCTOBER 2010U.S. AIR FORCE—$16.4M
NOVEMBER 2010DASSAULT AVIATION
FEBRUARY 2011BOMBARDIER AEROSPACE—$175M
MARCH 2011BOEING, U.S. AIR FORCE AND U.S. NAVY—$35M
Learjet 85 Boeing 777
MAJORCONTRACTANNOUNCEMENTS2010-2011

A N N U A L R E P O R T 2 0 1 0 - 2 0 1 1
3
CHAIRMAN’S MESSAGE
T
John Cybulski
“With Héroux-Devtek solidly
entrenched in Canada and
the United States and with
a new plant scheduled
to open in Mexico at the
beginning of 2012, we are
solidly positioned to better
serve global markets.”

4
H

5
Gilles Labbé, FCA
MESSAGE TO SHAREHOLDERS
“To establish itself as
a world-class player in a
highly competitive market,
Héroux-Devtek must broaden
its product and service
offering and continuously
improve its production
capacity to reduce costs
and optimize productivity.”

6
H É R O U X - D E V T E K
6
*
GROWTH OPPORTUNITIES INTERNATIONAL EXPANSION
GLOBAL CUSTOMER BASE
EXPANDING FACTORY NETWORK
UNITED STATESBELL HELICOPTER BOEING CATERPILLAR GENERAL ELECTRIC GOODRICH LOCKHEED MARTIN NORTHROP GRUMMAN SIKORSKY US AIR FORCE US NAVY
CANADABOMBARDIER CANADIAN FORCES
BRAZILEMBRAER
FRANCEDASSAULT MESSIER-BUGATTI-DOWTY
HOLLANDFOKKER
FACILITY CUSTOMER
*

A N N U A L R E P O R T 2 0 1 0 - 2 0 1 1
7
R&DENGINEERING
TEST LABINNOVATION DRIVES
GROWTH

8
OUR OPERATIONS FISCAL 2011 (fiscal 2010)
C-130J
71%
29%
10
20
30
40
50
60
70
MILITARY COMMERCIAL
INDUSTRIALAEROSPACE
59%
34%
7%
* Excluding the Eagle acquisition made in April 2010.
100
200
300
400
500
600
430485
423*
502
FUNDED (FIRM) BACKLOG
2011
47%12%
16%6%6%4%2%
3%4%

A N N U A L R E P O R T 2 0 1 0 - 2 0 1 1
9
F
KEY MILESTONES ON NEW PROGRAMS
ENHANCED INTERNATIONAL EXPOSURE
OUTLOOK
LANDINGGEARBY DESIGN,
RECORD SALES

1 0
H É R O U X - D E V T E K
O
OPERATIONAL EXCELLENCE AS A STRATEGIC ADVANTAGE
STABLE CONTRACTS
EXPANDED BUSINESS OFFERINGS
OUTLOOK
FOCUSED ON THE FUTURE—
NEW FACILITY BRINGS OPPORTUNITIES
AEROSTRUCTURE

A N N U A L R E P O R T 2 0 1 0 - 2 0 1 1
1 1
RECOVERY AND
EXPANSION
I
DUAL IMPETUS
PORTFOLIO EXPANSION
WIND AFTERMARKET
OUTLOOK
INDUSTRIAL

1 2
H É R O U X - D E V T E K
BOARD OF DIRECTORS
John M. Cybulski†
Chairman of the Board
Principal
Gilles LabbéPresident and Chief Executive Officer
Claude Boivin†
Consultant and Member of various Boards of Directors
Paule Doré†
Corporate Director
Christian Dubé*Vice-President, Business Development
Jean-Louis Fontaine*Vice-Chairman of the Board and Director
Louis Morin*President,
Brian A. Robbins*President and Chief Executive Officer
Réal Raymond†
Consultant
Honorary director and honorary member of the Human Resources and Corporate Governance Committee Helmut Hofmann
CORPORATE MANAGEMENT
Gilles LabbéPresident and Chief Executive Officer
Réal BélangerExecutive Vice-President and Chief Financial Officer
Gabriel DuvalVice-President, Corporate Affairs
Patrice GauvinVice-President, Business Development
Gilbert GuérinCorporate Director, Human Resources
Michel RobillardVice-President, Internal Audit and Conformity
Stéphane ArsenaultVice-President, Control and Information Technology
Martin BrassardVice-President, General Manager, Landing Gear
Richard RosenjackVice-President, General Manager, Aerostructure
Michael L. MeshayVice-President, General Manager, Industrial
LANDING GEAR
Longueuil
Springfield
Cleveland
Engineering
Longueuil
Saint-Hubert
Laval
Kitchener
AEROSTRUCTURE
Dorval
Arlington
Toronto
Querétaro
INDUSTRIAL
Cincinnati
CORPORATEINFORMATION
† Member of Human Resources and Corporate Governance Committee* Member of Audit Committee

MANAGEMENT DISCUSSION AND ANALYSIS OF
FINANCIAL POSITION AND OPERATING RESULTS
AND CONSOLIDATED FINANCIAL STATEMENTS
For the year ended March 31, 2011

2 H É R O U X - D E V T E K
TABLE OF CONTENTS
Forward-Looking Statements ................................................................................................................ 4Overview ................................................................................................................................................. 4Business Management .......................................................................................................................... 5Business Strategy ................................................................................................................................. 5 Key Performance Indicators .................................................................................................................. 6Risk Management ................................................................................................................................. 7 Market Trends ......................................................................................................................................... 7Major Achievements of Fiscal 2011 ....................................................................................................... 8 Acquisition of the assets of Eagle Tool Machine Co and of its subsidiary ........................................... 8Foreign Exchange .................................................................................................................................. 9Non-GAAP measures ............................................................................................................................ 9Selected Annual Financial Information .................................................................................................. 10Consolidated Sales ............................................................................................................................... 10Aerospace Segment .............................................................................................................................. 11 Industrial Segment ................................................................................................................................ 11 Sales by Destination .............................................................................................................................. 12Gross Profit ............................................................................................................................................ 12Selling and Administrative Expenses .................................................................................................... 12Operating Income .................................................................................................................................. 12Aerospace Segment .............................................................................................................................. 12 Industrial Segment ................................................................................................................................. 13Restructuring Charges ........................................................................................................................... 13Income Tax Expense .............................................................................................................................. 13Net Income ............................................................................................................................................. 14Liquidity and Capital Resources ............................................................................................................ 14Credit Facility and Cash and Cash Equivalents .................................................................................... 14Operating Activities ................................................................................................................................ 14Investing Activities .................................................................................................................................. 15Financing Activities ................................................................................................................................ 16Pension Plans ......................................................................................................................................... 16Normal Course Issuer Bid ...................................................................................................................... 16Capital Stock, Stock Option Plan and Stock Purchase and Ownership Incentive Plan (Stock Purchase Plan) ........................................................................... 17Stock Appreciation Right and Deferred Share Unit Plans ..................................................................... 17Consolidated Balance Sheets ............................................................................................................... 18Government assistance ......................................................................................................................... 20Derivatives, Off-Balance-Sheet Items and Commitments .................................................................... 20Impact of Financial and Economic Situation ......................................................................................... 21Critical Accounting Estimates ................................................................................................................ 21Inventories, capitalized development costs and cost of sales ............................................................. 21Goodwill and intangible assets .............................................................................................................. 22Pension plans and other employee post-retirement benefits ............................................................... 22Income tax .............................................................................................................................................. 22Future Changes in Accounting Policies. ................................................................................................ 22Internal Controls and Procedures .......................................................................................................... 26Risks and Uncertainties ......................................................................................................................... 26Reliance on Large Customers ............................................................................................................... 27Availability and Cost of Raw Materials ................................................................................................... 27Operational Risks ................................................................................................................................... 27

A N N U A L R E P O R T 2 0 1 0 - 2 0 1 1 3
TABLE OF CONTENTS (cont’d)
Impact of Terrorist Activity and Political Instability ................................................................................ 27General Economic Conditions ............................................................................................................... 27Military Spending ................................................................................................................................... 27Foreign Currency Fluctuations ............................................................................................................... 27Liquidity and Access to Capital Resources........................................................................................... 28Restrictive Debt Covenants.................................................................................................................... 28Changing Interest Rates......................................................................................................................... 28External Business Environment ............................................................................................................. 28Warranty Casualty Claim Losses ........................................................................................................... 29Environmental Matters ........................................................................................................................... 29Collective Bargaining Agreements ........................................................................................................ 29Skilled Labour ........................................................................................................................................ 29Selected Quarterly Financial Information .............................................................................................. 29Fourth Quarter 2011 Results .................................................................................................................. 30Outlook ................................................................................................................................................... 30Additional Information and Continuous Disclosure ............................................................................... 31Management‘s report ............................................................................................................................. 32Independent Auditors’ Report ............................................................................................................... 33CONSOLIDATED BALANCE SHEETS ................................................................................................... 34CONSOLIDATED STATEMENTS OF INCOME ...................................................................................... 35CONSOLIDATED STATEMENTS OF CHANGES IN SHAREHOLDERS’ EQUITY ................................. 36CONSOLIDATED STATEMENTS OF CASH FLOWS ............................................................................. 37NOTES TO CONSOLIDATED FINANCIAL STATEMENTS ..................................................................... 38Note 1. Nature of activities ............................................................................................................ 38Note 2. Summary of significant accounting policies .................................................................... 38Note 3. Business acquisition ........................................................................................................ 44Note 4. Financial risk management .............................................................................................. 45Note 5. Capital risk management ................................................................................................. 48Note 6. Financial instruments ....................................................................................................... 49Note 7. Selling and administrative expenses ............................................................................... 51Note 8. Restructuring charges ...................................................................................................... 51Note 9. Other receivables ............................................................................................................. 51Note 10. Inventories ........................................................................................................................ 51Note 11. Derivative financial instruments ....................................................................................... 52Note 12. Property, plant and equipment ........................................................................................ 52Note 13. Finite-life intangible assets ............................................................................................... 53Note 14. Other assets ..................................................................................................................... 54Note 15. Goodwill ............................................................................................................................ 54Note 16. Accounts payable – other ................................................................................................ 54Note 17. Long-term debt ................................................................................................................. 55Note 18. Other liabilities .................................................................................................................. 57Note 19. Capital stock ..................................................................................................................... 57Note 20. Income taxes .................................................................................................................... 60Note 21. Net change in non-cash working capital items related to operations ............................ 61Note 22. Pension and other retirement benefit plans ..................................................................... 61Note 23. Commitments ................................................................................................................... 64Note 24. Contingencies................................................................................................................... 65Note 25. Accumulated other comprehensive income (loss) .......................................................... 65Note 26. Segmented information .................................................................................................... 65Note 27. Reclassification................................................................................................................. 66

4 H É R O U X - D E V T E K
MANAGEMENT DISCUSSION AND ANALYSISOF FINANCIAL POSITION AND OPERATING RESULTSThe purpose of this management discussion and analysis (‘’MD&A’’) is to provide the reader with an overview of how the financial position of Héroux-Devtek Inc. (‘’Héroux-Devtek’’ or the ‘’Corporation’’) changed between March 31, 2010 and March 31, 2011. It also compares the operating results and cash flows for the year ended March 31, 2011 to those for the previous year.
This analysis should be read in conjunction with the audited consolidated financial statements dated March 31, 2011. Héroux-Devtek’s consolidated financial statements have been prepared in accordance with Canadian generally accepted accounting principles (‘’GAAP’’). The Corporation reports its results in Canadian dollars. All amounts in this MD&A are in Canadian dollars unless otherwise indicated.
FORWARD-LOOKING STATEMENTS
In the interest of providing shareholders and potential investors with information regarding Héroux-Devtek, including management’s assessment of future plans and operations, certain statements in this MD&A are forward-looking statements subject to risks, uncertainties and other important factors that could cause the Corporation’s actual performance to differ materially from those expressed in or implied by such statements.
Such factors include, but are not limited to: the impact of worldwide general economic conditions and, in particular, economic conditions in Canada and the United States; industry conditions including changes in laws and regulations; increased competition; the lack of availability of qualified personnel or management; availability of commodities and fluctuations in commodity prices; foreign exchange or interest rate fluctuations; stock market volatility; and the impact of accounting policies issued by Canadian, US and international standard setters. Some of these factors are further discussed under Risks and Uncertainties in this MD&A. Readers are cautioned that the foregoing list of factors that may affect future growth, results and performance is not exhaustive, and undue reliance should not be placed on forward-looking statements.
Although the Corporation believes that the expectations conveyed by the forward-looking statements are based on information available to it on the date such statements were made, there can be no assurance that such expectations will prove to be correct. All subsequent forward-looking statements, whether written or orally attributable to the Corporation or persons acting on its behalf, are expressly qualified in their entirety by these cautionary statements. Unless otherwise required by applicable securities laws, the Corporation expressly disclaims any intention, and assumes no obligation, to update or revise any forward-looking statements, whether as a result of new information, future events or otherwise.
OVERVIEW
Héroux-Devtek and its subsidiaries specialize in the design, development, manufacture, repair and overhaul of systems and components used principally in the aerospace and industrial segments. As such, a significant portion of the Corporation’s sales are made to a limited number of customers mainly located in the United States and Canada.
The Corporation was founded in 1942 as Héroux Machine Parts Limited, and later changed its name to Héroux Inc. The Corporation became public in 1986. In 2000, it acquired Devtek Corporation and the two entities were merged to form Héroux-Devtek Inc., one of the largest second-tier manufacturers in the Canadian aerospace industry.
On April 1, 2004, the Corporation acquired Progressive Incorporated (‘’Progressive’’), a privately-held Texas-based manufacturer of large structural components for military aircraft, thereby boosting its aerostructure capability and gaining access to the important aerostructure military sector.
On April 28, 2010, the Corporation concluded the acquisition of U.S. based Eagle Tool & Machine Co. and its subsidiary, two privately-held Ohio-based manufacturers of landing gear products mainly for the military aerospace industry.
Héroux-Devtek serves two segments: Aerospace and Industrial. The Corporation supplies both the commercial and military sectors of the Aerospace segment with landing gear products (including spare parts and repair and overhaul services) and airframe structural components (including kits). In the commercial sector, the Corporation is active in the business jet, regional aircraft, helicopter and large commercial jet markets. On the military side, the Corporation provides parts and services for all major military aircraft, mainly in the United States.
Héroux-Devtek’s main products for the Industrial segment are large components for power-generating and heavy equipment, with its largest customers being The General Electric Company (GE) and Caterpillar. It also sells precision components for other industrial applications such as the wind energy market.

A N N U A L R E P O R T 2 0 1 0 - 2 0 1 1 5
The Corporation’s sales by segment are as follows:
2011 2010
Aerospace 93% 93%Industrial 7% 7% 100% 100%
Héroux-Devtek sells mainly to original equipment manufacturers (“OEMs”) such as Lockheed-Martin, Bombardier, Goodrich and Boeing, and into the aftermarket, where its main customers are the US Air Force (USAF) and US Navy. In fiscal 2011, sales to these six customers represented approximately 60% of total consolidated sales. More specifically, the Corporation has one customer representing 19% of its consolidated sales and two customers representing between 13% and 14% of its consolidated sales, all of them in the Aerospace segment.
The Aerospace segment comprises the Landing Gear and Aerostructure product lines. The Industrial segment comprises large power generation components and other industrial products produced by the Industrial product line. The Landing Gear product line designs, manufactures, repairs and overhauls landing gears and has built a strong, well-recognized design engineering team and serves both the commercial and military sectors. The Aerostructure product line manufactures airframe components ranging in size from small to large, for the commercial and military aerospace sectors. The Aerospace segment includes the Landing Gear and Aerostructure product lines since, in particular, their products and services, production processes, type of customers and methods of distribution are similar. The Industrial product line manufactures large components for power generation, including the wind energy sector, and for heavy equipment and other industrial markets.
BUSINESS MANAGEMENT
The Corporation’s segments and product lines are managed through decentralized operations that encourage entrepreneurship and the involvement of every employee. Each product line has the management, engineering, manufacturing and marketing resources required to meet the needs of its specific markets. The growth and profitability of each product line is the responsibility of a Vice-President - General Manager who reports directly to the Corporation’s President and Chief Executive Officer, while the Vice-President, Finance of each product line reports directly to the Corporation’s Vice-President, Control and Information Technology, and Executive Vice-President and Chief Financial Officer.
The Corporation’s Corporate Office is responsible for the Corporation’s public financial and other reporting and disclosure requirements and, for all financial and major business development decisions. It also provides each product line with support in establishing budget and strategic plans, developing new products and markets, and with assistance for public relations, financial controls and reporting, legal counsel, human resources and information technology.
BUSINESS STRATEGY
Héroux-Devtek’s business strategy is to position itself as a key supplier for its customers in the three pillars of its business: Aerospace landing gear and Aerospace aerostructure product lines and Industrial power generating equipment. For the Corporation, being a key supplier means providing not only manufactured components but also other services, such as design, assembly and program management, in order to become a complete service provider and allow customers to focus on their core business. In order to achieve this, the Corporation aims to develop management and technical expertise so as to add value to products at competitive costs. It also seeks to grow to attain a critical mass in each of its markets, while maintaining a solid financial position and returns.
In practice, this translates into:

6 H É R O U X - D E V T E K
Héroux-Devtek seeks growth externally through acquisitions that can be easily integrated into its existing operations or that bring complementary technology, leading to greater added value. Internally, the Corporation aims to:
landing gear, design and manufacturing of small to medium landing gear, and complete structural assemblies for commercial and military aircraft OEMs; and
structural components and industrial products.
KEY PERFORMANCE INDICATORS
Héroux-Devtek measures its performance on a corporation-wide basis through the following elements:
To do so, the Corporation developed key performance indicators (“KPI”). Presented below is a summary of these indicators as well as elements for which they are looked at:
Elementsmeasured
Profitability Liquidity Growth andcompetitivepositioning
Customersatisfaction
Financial situationand returns
KPIs Gross profit Earnings before interest, tax, depreciation and amortization (EBITDA)
Sales On-time delivery Working capital
Operating income
Earnings before interest and taxes (EBIT)
Free cash flow Backlog (Purchase orders in hand)
Non-quality performance and costs
Long-term debt to equity ratio
Cost reduction targets
Return on operating assets (RONA)
Market share in niche product markets where the Corporation evolves
— Net-debt to equity ratio
Manufacturing capacity utilization
— Value added to products as a percentage of sales
— Return on equity and RONA
What is being measured
Measures of operating performance
Measures of liquidity generation
Measures of growth, indicators of future revenue and measures of competitive positioning
Measures of commitments towards customers and product reliability
Measures of solidity of short- and long-term financial position and return to shareholders
Most of these KPIs are discussed later in this MD&A and are also included in the Financial Highlights of the Corporation’s fiscal 2011 Annual Report. Some of these KPIs are not publicly disclosed since they are of a competitive nature.
In last year’s fiscal 2010, the market trend had an obvious impact on the Corporation’s capacity utilization and added pressure on the cost absorption for some of the Corporation’s business units, while this year’s fiscal 2011 benefited from ongoing improvements in the commercial aerospace market, particularly in the second half of the year (see gross profit section below). On-time delivery and non-quality costs are customers’ satisfaction indicators that are closely monitored by Héroux-Devtek. The Corporation has steadily improved these indicators over recent years and continues to pay close attention to quality matrix and quality reports from its major customers.

A N N U A L R E P O R T 2 0 1 0 - 2 0 1 1 7
Furthermore, the Corporation’s incentive plan is based on achievement of certain financial objectives and specific personal objectives. The financial targets are the RONA, operating income, sales, net income and earnings per share.
RISK MANAGEMENT
The Corporation’s Risk Management process includes essentially the identification and assessment of business risks and opportunities and the implementation of strategies and controls to manage, monitor and communicate these risks. To help achieve its risk management objectives, the Corporation has included risk management activities and controls in the operational responsibilities of management in each product line. The Corporation’s Board of Directors is ultimately responsible for identifying and assessing the Corporation’s principal business risks, reviewing overall business risks and ensuring the implementation of appropriate systems to manage these risks. The Human Resources and Corporate Governance Committee and the Audit Committee, composed of independent Directors, assist the Board of Directors in its general management responsibilities.
The Corporation operates in markets subject to various risks and uncertainties. Some of these risks are inherent to the nature of the Corporation’s operations. See Risks and Uncertainties below.
MARKET TRENDS
As a result of the gradual improvement in the global economy in calendar 2010 and early in calendar 2011, demand in the commercial aerospace market has firmed up.
In calendar 2010, actual passenger traffic expressed in Revenue Passenger Kilometers (“RPK”) increased 8.2% over calendar 2009, while freight traffic expressed in Freight Tonne Kilometers (“FTK”) rose 20.6%1. These favourable trends have continued in the first three months of calendar 2011 with increases of 5.9% and 4.6%, respectively2.
Large commercial aircraft manufacturers recorded another solid year in terms of deliveries in 2010, while net new orders increased significantly. Airbus delivered 510 aircraft and recorded 574 new orders3, while Boeing delivered 462 aircraft and booked orders for 5304. Both manufacturers also announced several production rate increases on leading programs scheduled for calendar 2011, 2012 and 20135.
In the market for regional aircraft, Embraer delivered 100 units in 20106, while Bombardier delivered 97 in 2010-20117, including turboprops. Both manufacturers experienced lower regional jet deliveries in their last fiscal year and both have also ended their respective fiscal years with lower backlogs than a year earlier.
Business jet deliveries further declined 12.3% in calendar 2010, reaching 763 aircraft. However, positive signs that emerged during the year are indications the market has bottomed out. For instance, the number of business aircraft movements in the U.S. increased 11.0% and the proportion of the business aircraft fleet for sale declined by 1.5%8.
The military market stabilized during calendar 2010 as governments have begun to address their deficits. As to the Joint Strike Fighter F-35 (JSF) program, the U.S. government put the short take-off and vertical landing (STOVL) variant on a two-year probation, but the ramp-up of other variants continues, albeit at a slightly more moderate pace over the short-term. In Canada, the Government’s decision to purchase 65 JSF aircraft should benefit the Canadian aerospace industry.
The North American power generation industry appears to have bottomed out, as leading equipment manufacturers continue to report rising new orders. In calendar 2010, demand for electricity in the U.S. grew 4.3%, reversing decreases experienced during the two previous years. However, demand is expected to remain relatively stable in calendar 20119.
Finally, the fluctuation of the Canadian dollar, which has risen above par at fiscal year-end versus its U.S. counterpart, continued to negatively impact the Corporation’s results.
1. Source: IATA press release February 2, 2011
2. Source: IATA press release May 3, 2011
3. Source: Airbus press release January 17, 2011
4. Source: Boeing press release January 6, 2011
5. Sources: Airbus press releases February 3, 2011; July 30, 2010; March 9, 2010. Boeing press releases Dec. 20, 2010; Sept. 16, 2010; June 15, 2010; May 17, 2010; March 19, 2010.
6. Source: Embraer press release, January 17, 2011.
7. Source: Bombardier press release, March 31, 2011.
8. Sources: GAMA press release February 22, 2011; FAA January 2011 Business Jet Report, JetNet report February 1, 2011
9. US Energy Information Administration – Short-term Energy Outlook, April 12, 2011

8 H É R O U X - D E V T E K
MAJOR ACHIEVEMENTS OF FISCAL 2011
qualify and participate in the certification of the landing gear and actuation system for a new business jet program. This life-cycle mandate also includes the provision of spare parts;
300 structural detail components that encompass Bombardier’s entire portfolio of commercial and business aircraft, including new programs such as the CSeries and the Learjet 85 business jet10. At anticipated aircraft production rates, the value of the contract is estimated at over $175 million;
of more than $35.0 million:
1. The Dorval and Texas Aerostructure business units will manufacture wing ribs and other machined components for the Gulfstream 550 business jet program,
2. The Laval Landing Gear facility will fabricate torque tubes for the Boeing 737 program;
actuators supporting new aircraft production and spare parts requirements for the Boeing 777 program;
US Air Force and US Navy and mainly for the B-1B, C-130, C-5, F-15, F-16, KC-135R and P-3 aircraft;
increased from $125 million to $150 million and, subject to lenders’ consent, it could be increased by an additional amount of $75 million;
May 6, 2013. Just after the end of fiscal 2011, the unionized employees of the Longueuil Landing Gear facility voted in favour of a three-year collective agreement which extends through May 1, 2014;
Aerospace Park in Mexico. The first phase of the project consists of the erection of a 47,200 square-foot facility equipped with state-of-the-art machinery for the production of aerostructure components. Construction began during the second quarter of calendar 2011, and the facility should be ready to produce its first components early in calendar 2012. This first phase represents an investment of up to $20 million by Héroux-Devtek over the next three years. In due time, a subsequent phase could see the plant expanded to 150,000 square-feet. Such expansion would eventually provide the Corporation with the capability to manufacture and assemble aerostructure and landing gear systems.
Acquisition of the assets of Eagle Tool & Machine Co and of its subsidiary
As previously disclosed in our last year’s audited consolidated financial statements, on April 28, 2010, the Corporation announced that it had concluded the acquisition, through a U.S. subsidiary, of substantially all the net assets of U.S. based Eagle Tool & Machine Co (“Eagle”) and of its subsidiary All Tool Inc (“E2”), two privately owned manufacturers of precision machined products mainly for the military aerospace industry, with annual sales of approximately $40 million based on their December 31, 2009 fiscal year-end and of $45 million since the acquisition this year (see note 3 to the March 31, 2011 consolidated financial statements).
10. Learjet 85 and CSeries are registered or unregistered trademarks of Bombardier Inc. or its subsidiaries.Acquisition of the assets of Eagle Tool Machine Co and of its subsidiary

A N N U A L R E P O R T 2 0 1 0 - 2 0 1 1 9
The final allocation of the total purchase price of the net assets acquired, along with the source of funds, can be broken down as follows:
NET ASSETS ACQUIRED ($’000) SOURCE OF FUNDS ($’000)
Working capital $ 16,797 Credit Facilities $ 16,711Property, plant and equipment 8,498 Cash 12,102Backlog 1,390 Promissory note, 5% repayable over 40 months 3,721Goodwill 5,849 $ 32,534 $ 32,534
The Corporation drew, from its US Credit Facility, $16.7 million (US$16.5 million) and used $12.1 million of cash in the first quarter of fiscal 2011 to finance this transaction.
Throughout this MD&A, Management has explained the consolidated results for twelve-month periods ended March 31, 2011 which include the results of Eagle and E2. For all significant elements explained, Management has singled out the acquisition impact on the current year’s results to help readers understand the year-over-year change excluding the acquisition. Please also keep in mind that results for Eagle and E2 are for the period following the acquisition which is April 28, 2010, to March 31, 2011, which is not a full twelve-month period.
FOREIGN EXCHANGE
The Corporation is subject to foreign currency fluctuations from the translation of revenues (sales), expenses, assets and liabilities of its self-sustaining foreign operations and from transactions denominated mainly in US dollars. Average rates are used to translate sales (but exclusive of forward foreign exchange contracts) and expenses for the years mentioned, while closing rates translate assets and liabilities. The year-end and average exchange rates were as follows at March 31, 2011 and 2010 and for the fiscal years then ended:
CANADA / US EXCHANGE RATES 2011 2010
Year-end exchange rates used to translate assets and liabilities 1$ Canadian/ US $ equivalent 0.9696 1.0158 1$ US/ Canadian $ equivalent 1.031 0.984Average exchange rates used to translate revenues (sales) and expenses 1$ Canadian/ US $ equivalent 1.0164 1.0904 1$ US/ Canadian $ equivalent 0.984 0.917
As shown above, the average value of the Canadian dollar when compared to its US counterpart, year-over-year, increased by more than 7% and, naturally, added pressure to the US- denominated sales and results of the Corporation, including those from its Canadian operations. The closing rate declined more than 4% since March 31, 2010, from 1.0158 to 0.9696 as at March 31, 2011, reducing the currency impact on the Corporation’s US-denominated balance sheet accounts at the end of this fiscal year, when compared to last year. Currency fluctuation impact on the Corporation’s sales, gross profit and specific balance sheet elements can be found later in this MD&A.
The Corporation makes use of derivative financial instruments, in accordance with its hedging policy, to hedge foreign currency fluctuation exposure risks (Canadian dollar over U.S. dollar) in an effort to mitigate these risks. At March 31, 2011, the Corporation had forward foreign exchange contracts totalling US$159.0 million at a weighted-average exchange rate of 1.1032 maturing over the next four fiscal years, with the majority maturing over the next two fiscal years.
At March 31, 2011, the Corporation also entered into forward foreign exchange contracts totalling US$7.7 million at a weighted-average rate of 1.2343 maturing over the next three fiscal years, to cover foreign exchange risks (Canadian dollar over U.S. dollar) related to certain embedded derivatives (see under Derivatives, Off-Balance-Sheet Items and Commitments below).
NON-GAAP MEASURES
Earnings before interest, taxes, depreciation and amortization (“EBITDA”) is a financial measure not prescribed by Canadian generally accepted accounting principles (“GAAP”) and is not likely to be comparable to similar measures presented by other issuers. Management, as well as investors, consider this to be useful information to assist them in evaluating the Corporation’s profitability, liquidity and ability to generate funds to finance its operations and capital investment needs.

1 0 H É R O U X - D E V T E K
SELECTED ANNUAL FINANCIAL INFORMATION
The following table presents selected financial information for the past three fiscal years:
YEARS ENDED MARCH 31
($’000, EXCEPT PER SHARE DATA) 2011 2010 2009
Sales 357,572 320,354 337,635 EBITDA 54,830 48,437 54,559 Net income 18,527 16,003 21,363 Earnings per share ($) – basic 0.62 0.52 0.68 Earnings per share ($) – diluted 0.61 0.52 0.67Total assets 443,875 394,847 417,174 Long-term liabilities (including the current portion of long-term debt) 129,241 107,796 115,705 Cash and cash equivalents 32,910 46,591 39,759
The Corporation’s EBITDA is calculated as follows:
YEARS ENDED MARCH 31
($’000) 2011 2010 2009
Net income 18,527 16,003 21,363Income tax expense 6,900 6,498 8,605Financial expenses 5,156 4,676 4,485Amortization 23,610 21,260 20,106EBITDA including restructuring charges 54,193 48,437 54,559Restructuring charges 637 — —EBITDA 54,830 48,437 54,559
The $6.4 million increase in EBITDA from fiscal 2010 to fiscal 2011 comes mainly from the inclusion of Eagle and E2 results following the acquisition, as it will be explained in more detail later.
Last year’s market downturn still impacted our results this year mainly in the first six months. Improved conditions in the aerospace commercial and industrial markets started having a favourable impact on results in the last six months of the current year.
CONSOLIDATED SALES
Consolidated sales for the year ended March 31, 2011 increased 11.6% to $357.6 million from $320.4 million last year. Excluding the $45.0 million sales of Eagle and E2 since the acquisition, consolidated sales were down by $7.8 million or 2.4%. The impact of the Canadian dollar, against the US currency, reduced consolidated sales by $11.7 million or 3.7% compared to last year. This impact was reduced by higher sales in the Industrial segment.
The Corporation’s sales by segment were as follows:
2011 2010 % ($’000) ($’000) Change
Total Aerospace 331,993 297,852 11.5Total Industrial 25,579 22,502 13.7Total 357,572 320,354 11.6
This year’s Aerospace sales, excluding the acquisition of Eagle and E2 whose sales are included in the Aerospace segment, declined $10.9 million or 3.7% mainly as a result of the negative US/CAD currency impact of $9.8 million or 3.3% compared to last year. This year’s Industrial sales, despite a lower exchange rate, increased by $3.1 million or 13.7%, compared to last year, due to increased heavy equipment product sales.

A N N U A L R E P O R T 2 0 1 0 - 2 0 1 1 1 1
Aerospace Segment
Sales for the Aerospace segment were as follows:
2011 2010 %PRODUCT LINES ($’000) ($’000) Change
Landing Gear 227,928 194,938 16.9Aerostructure 103,465 101,719 1.7Other aerospace products 600 1,195 (49.8)Total 331,993 297,852 11.5
Landing Gear sales increased by 16.9% to $227.9 million but were actually lower than last year by 6.2% when excluding the sales from Eagle and E2. Sales were impacted by the negative US/CAD currency impact, lower production rates on large commercial programs, mainly on the B-777 program, and reduced military manufacturing sales as a result of reduced spare requirements. These negative variances were partially offset by new business on Fokker, B-787 and A-320 programs, higher business jet product requirements and increased throughput in repair and overhaul work.
Aerostructure sales increased 1.7% to $103.5 million despite the negative impact of a stronger Canadian dollar on this product line’s US denominated sales and lower F-22 sales as this program is coming to an end. This increase in sales was driven by increased sales on F-16 after-market and F-18 programs, increased commercial business jet sales on Challenger 605 and 850 and increased commercial helicopter sales, as a result of the Bell 429 program ramping up.
Sales for the Aerospace segment, shown in the table above, can be broken down by sector as follows:
2011 2010 %
($’000) ($’000) Change
Military (1) 209,921 183,604 14.3Commercial 122,072 114,248 6.8Total Aerospace 331,993 297,852 11.5
(1): Includes military sales to civil customers and government.
Excluding the impact from the Eagle and E2 acquisition, military sales were 7.8% lower this year than last year while commercial sales were 3.0% higher than last year. As mentioned above, military sales were impacted by lower F-22 and landing gear manufacturing spare parts requirements. This was partially offset by higher sales to the F-16 and F-18 programs, and higher throughput in repair and overhaul work. Despite lower production rates in large commercial programs and the negative impact of US/CAD currency exchange rates, commercial sales were up, as a result of new business on Fokker, A-320 and B-787 programs, increased production rates in the business jet market and the ramp-up in the B-429 Helicopter program.
Industrial Segment
Sales for the Industrial segment were as follows:
2011 2010 % ($’000) ($’000) Change
Gas Turbine 10,655 12,076 (11.8)Other Industrial 14,924 10,426 43.1Total 25,579 22,502 13.7
Other Industrial sales were higher than last year, boosted by higher demand for Heavy Equipment in the mining industry while Gas Turbine sales were down due to lower customer requirements in the first six months this year, when compared to last year.

1 2 H É R O U X - D E V T E K
Sales by Destination
Sales by destination remained almost at the same level as last year, as shown below:
2011 2010 (%) (%)
Canada 26 30US 70 67International 4 3Total 100 100
The sales by destination mix mainly reflects the impact of increased sales in the US following the Eagle and E2 acquisition combined with the increased sales in the Industrial segment. It also reflects the impact of shipments to a new European customer (Stork – Fokker program).
GROSS PROFIT
Consolidated gross profit increased from 15.7% to 16.0% of sales in fiscal 2011. When excluding the impact of the Eagle and E2 acquisition, this year’s gross profit as a percentage of sales would have been 16.6%.
This is the result of the overall Corporation’s increase in sales and also improved margin due to a more favourable sales mix. In the Aerospace segment, excluding the acquisition of Eagle and E2, Landing Gear gross profit in dollars was lower than last year, as a result of lower sales, but was slightly higher than last year as a percentage of sales due to a better product mix. Despite higher under-absorption of manufacturing overhead costs coming from lower than anticipated production requirements and the negative impact of a stronger Canadian dollar, the Aerostructure product line generated a higher gross profit in dollars and as a percentage of sales. In the Industrial segment, the Industrial product line improved significantly its gross profit margin boosted by higher sales in the Other Industrial markets which resulted in increased absorption of manufacturing overhead costs and continued improvement in manufacturing efficiency experienced in this segment, when compared to last year.
This year, the continued strengthening of the Canadian dollar negatively impacted the Corporation’s gross profit in dollars by $1.6 million, but represented a favourable impact of less than 0.1%, when expressed as a percentage of sales. Besides the natural hedging from the purchase of raw material in US dollars, the Corporation mitigates the currency impact by the use of forward foreign exchange contracts.
SELLING AND ADMINISTRATIVE EXPENSES
Selling and administrative expenses were as follows:
2011 2010
Selling and administrative expenses ($’000) 26,040 23,165% of sales 7.3 7.2
Selling and administrative expenses of $26.0 million were $2.9 million higher than last year, and 0.1% higher as a percentage of sales. The increase is mainly attributable to the impact from the acquisition of Eagle and E2. The increase also reflects some fees and expenses incurred for the renewal of the Corporation’s credit facility, which could not be capitalized. The selling and administrative expenses include a loss on currency translation on net monetary assets of $0.4 million this year, compared to a loss of $1.1 million last year. In fiscal 2010, selling and administrative expenses also included a $0.4 million non-recurring gain.
OPERATING INCOME
Consolidated operating income stood at $31.2 million or 8.7% of sales this year, an increase from last year’s operating income of $27.2 million or 8.5% of sales. This is the result of higher sales and gross profit in the Aerospace segment resulting from the acquisition of Eagle and E2 combined with increased other industrial sales and gross profit in the Industrial segment.
Aerospace Segment
Aerospace operating income was $27.6 million or 8.3% of sales this year, compared to $24.7 million or 8.3% of sales last year. Excluding the acquisition of Eagle and E2, the Aerospace segment operating income was $24.6 million or 8.6% of sales.

A N N U A L R E P O R T 2 0 1 0 - 2 0 1 1 1 3
Industrial Segment
Operating income increased to $3.6 million or 14.1% of sales this year from $2.4 million or 10.8% of sales last year, as a result of higher sales and gross profit in this segment, as explained above.
FINANCIAL EXPENSES 2011 2010 ($’000) ($’000)
Interest 2,678 2,901Interest accretion on governmental authorities loans 1,330 1,146Interest rate swap agreements buy-out 406 —Amortization of deferred financing costs 350 168Standby fees 220 251Accretion expense of asset retirement obligations 240 228Gain on financial instruments classified as held-for-trading - Interest income (68) (18)Total 5,156 4,676
Financial expenses stood at $5.2 million this year, $0.5 million higher than last year. The financial expenses this year reflect the impact from the increased drawings against the Corporation’s Credit Facilities and the new Promissory note issued to finance the acquisition of Eagle and E2. It also includes the costs associated to the buy-out of two interest rate swap agreements for $0.4 million and the write-off of the unamortized deferred financing costs for $0.2 million, all related to the banks’ Credit Facility, which was renewed last March for a five-year period (see Note 17 to the consolidated financial statements). The financial expenses also reflect the lower exchange rate impact coming from the Corporation’s US debt.
RESTRUCTURING CHARGES
On May 13, 2010, the Corporation launched an initiative to optimize and consolidate production capacity in its Aerospace segment, while further enhancing productivity at its Québec-based facilities. Consequently, the Corporation’s Rivière-des-Prairies, Québec, facility was closed in September 2010 and its production was transferred to the Corporation’s other facilities in the Greater Montreal area. This year, the Corporation recorded restructuring charges of $0.6 million ($0.4 million, net of income taxes). The Corporation does not expect any significant additional restructuring charges related to the closure of this facility. As at March 31, 2011, the building related to this facility was classified in Other assets as Assets held for sale in the Corporation’s Consolidated Balance Sheets.
INCOME TAX EXPENSE
For the fiscal year ended March 31, 2011, the income tax expense stood at $6.9 million compared to $6.5 million last year.
The Corporation’s effective income tax rate was 27.1% this year, compared to its Canadian blended statutory income tax rate of 28.7%. The effective income tax rate reflects the favourable impact from permanent differences ($0.5 million), the favourable tax adjustment including the conclusion of a prior tax audit ($0.3 million), and favourable impact from future income tax adjustments due to changes in the Canadian income tax rate ($0.2 million), partially offset by the negative impact of a higher U.S. income tax rate for the Corporation’s U.S. subsidiaries ($0.5 million) (see Note 20 to the consolidated financial statements).
The Corporation’s effective income tax rate for fiscal 2010 was 28.9% compared to the Corporation’s Canadian blended statutory income tax rate of 30%. The difference is coming from the favourable impact of permanent differences ($0.5 million) partially offset by the impact from a higher income tax rate for the Corporation’s US subsidiaries.
In fiscal 2011, the reduction in the Corporation’s blended statutory income tax rate, compared to last year, mainly reflects the reduction in the Federal income tax rate in Canada.
As at March 31, 2011, there were no operating losses carried forward and no other temporary differences for which related income tax assets have not been recognized in the consolidated financial statements.
As at March 31, 2011, the Corporation has federal non-capital losses available for carry-forward of $1.6 million, the majority of which are expiring in fiscal 2029.

1 4 H É R O U X - D E V T E K
NET INCOME
For fiscal 2011, the Corporation posted net income of $18.5 million compared to net income of $16.0 million last year reflecting the increase in operating income from both segments of the Corporation, net of restructuring charges incurred this year, as explained above.
2011 2010
Net income ($ million) 18.5 16.0Earnings per share – basic ($) 0.62 0.52Earnings per share – diluted ($) 0.61 0.52
Basic earnings per share figures are based on weighted-averages of 30,112,464 common shares outstanding for fiscal 2011 and 30,661,745 for the previous year while the diluted earnings per share figures are based on weighted-averages of 30,219,597 for fiscal 2011 and 30,721,952 for last year. This year’s variance in the number of outstanding shares is essentially due to the issuance of 245,221 common shares under the stock option plan and 60,802 common shares under the Corporation’s stock purchase and ownership incentive plan less the 617,700 common shares redeemed under the Corporation’s normal course issuer bid (see Note 19 to the consolidated financial statements).
On May 26, 2011, the date of this MD&A, the Corporation had 30,180,467 common shares and 1,393,000 stock options outstanding with a weighted-average of 3.5 years to maturity.
LIQUIDITY AND CAPITAL RESOURCES
Credit Facility and Cash and Cash Equivalent
In general terms, the Corporation has a healthy financial situation and is well positioned to face its financing needs. By year-end, the Corporation renewed and increased its Senior Secured Syndicated Revolving Credit Facilities into one Senior Secured Syndicated Revolving Credit Facility (“Credit Facility”) through a syndicate of five Canadian Banks, and their US affiliates or branches and, a Canadian branch of a U.S. bank. This five-year Credit Facility allows the Corporation and its subsidiaries to borrow up to $150 million, either in Canadian or US currency equivalent and will mature in March 2016 (see Note 17 to the consolidated financial statements). It also includes an accordion feature to increase the Credit Facility up to $225 million, during the term of the Credit Agreement, subject to the approval by the lenders. To March 31, 2011, only CAD $57.7 million (US$59.5 million) had been drawn against this Credit Facility, including US$16.5 million in April 2010 to finance the acquisition of Eagle and E2 described earlier. Considering the Corporation’s cash and cash equivalent position, its available Credit facility and level of expected capital investments, Corporation management does not expect any liquidity risk in the foreseeable future. At March 31, 2011, the Corporation had cash and cash equivalents of $32.9 million, compared to $46.6 million a year earlier, of which $25.1 million ($32.4 million last year) had been invested in short-term deposits. It is worth mentioning that the Corporation used $12.1 million of its cash to finance the Eagle and E2 acquisition this year.
Operating Activities
The Corporation generated cash flows from operations and used cash and cash equivalents for its operating activities as follows:
2011 2010 ($’000) ($’000)
Cash flows from operations 48,754 45,867Net change in non-cash working capital items related to operations (19,155) (8,121)Cash flows relating to operating activities 29,599 37,746
The $2.9 million increase in cash flows from operations for fiscal 2011 is essentially explained by the $2.5 million increase in net income and $2.4 million increase in amortization expense, partially offset by a lower future income taxes expense of $2.5 million.

A N N U A L R E P O R T 2 0 1 0 - 2 0 1 1 1 5
The net change in non-cash working capital items in fiscal 2011 can be summarized as follows:
($’000)
Increase in accounts receivable due to higher fourth quarter sales than last year ($106 million this year compared to $85 million last year) (18,187)Increase in other receivables as a result of higher tax credits and other tax credits receivable and increased sales tax receivable (increased fourth quarter sales, compared to last year) (2,402)Inventory decrease resulting from increased deliveries in the fourth quarter this year and increased sales 1,014Increase in accounts payable and accrued liabilities, and accounts payable – other, related to the increased fourth quarter sales volume 639Higher income tax payable 1,484Effect of changes in the exchange rate on US-denominated non-cash balance-sheet items (2,107)All others 404 (19,155)
In fiscal 2010, the negative $8.1 million net change in non-cash working capital items can be explained by the reduced accounts payable and accrued liabilities of $20.5 million as the fiscal 2009 year-end balance included a significant purchase of raw material by fiscal year-end, the lower income tax payable of $3.1 million, and the increased investment tax credits and other tax credits receivable of $2.7 million. In addition, the effect of changes in the exchange rate on US-denominated non-cash balance-sheet items was $5.1 million. These negative impacts were partially offset by lower accounts receivable of $13.1 million resulting from improved collection and lower fourth quarter sales in fiscal 2010 and a decrease in inventory of $11.2 million mainly due to reduced commercial Aerospace segment sales and last year’s cost reduction efforts (see Consolidated Balance Sheet section below).
Investing Activities
The Corporation’s investing activities were as follows:
2011 2010 ($’000) ($’000)
Business acquisition (28,813) —Additions to property, plant and equipment (19,646) (13,740)Increase in finite-life intangible assets (7,980) (3,763)Proceeds on disposal of property, plant and equipment 139 8Cash flows relating to investing activities (56,300) (17,495)
As already discussed, the Corporation invested $28.8 million in the current fiscal year to acquire substantially all the net assets of Eagle and E2.
Additions to property, plant and equipment stood at $19.6 million in fiscal 2011, higher than the $13.7 million of last year. These fiscal 2011 additions include the costs associated to the JSF building extension at the Corporation’s Arlington, Texas plant and the associated machinery and equipment included in the construction-in-progress. It also includes investment in a new test laboratory facility in St-Hubert, Quebec related to the Landing Gear testing equipment required to support our Aerospace programs currently in development. Additions to property, plant and equipment are shown net of $4.1 million relating to machinery and equipment which were delivered in this year’s last quarter but not yet paid by the Corporation at March 31, 2011.
In fiscal 2010, additions to property, plant and equipment stood at $13.7 million. These fiscal 2010 additions, which were mostly for normal maintenance projects, are presented net of $7.6 million of capital investments that were made through capital leases.
Increase in finite-life intangible assets represents capitalized development costs for long-term Aerospace, mainly business jet contracts.
Capital expenditures for fiscal 2012 are expected to be about $26 million including $5 million investment in relation to the new Mexico facility project announced subsequent to the last fiscal year-end. This Mexico project could represent total capital investments of up to $20 million over the next three years.

1 6 H É R O U X - D E V T E K
Financing Activities
The Corporation’s financing activities were as follows:
2011 2010 ($’000) ($’000)
Increase in long-term debt 23,727 2,404Repayment of long-term debt (5,428) (5,292)Increase in deferred financing costs (2,198) —Repurchase of common shares (3,570) (3,470)Issuance of common shares 1,474 322Cash flows relating to financing activities 14,005 (6,036)
The increase in long-term debt includes the drawings of US$16.5 million from the Corporation’s Credit Facility to finance the acquisition of Eagle and E2 and reflects new governmental authorities loans received to support the Corporation’s development costs for Aerospace programs. The repayment of long-term debt included repayment of $2.7 million for capital leases, $1.7 million for governmental authorities loans, and $1.0 million for a promissory note (See Note 17 to the consolidated financial statements). In conjunction with the renewal of the Credit Facility, the Corporation incurred $2.2 million of financing costs which were capitalized at March 31, 2011 and will be amortized using the effective interest rate method over a five year period.
This year, the Corporation issued 245,221 common shares following the exercise of stock options for a cash consideration of $1,143,596 and 60,802 common shares under its stock purchase and ownership incentive plan for a cash consideration of $331,192 while it repurchased 617,700 common shares under the Normal Course Issuer Bid (NCIB) for a total cash consideration of $3,570,306. The Corporation’s last Normal Course Issuer Bid terminated on November 24, 2010 (see Normal Course Issuer Bid below and Note 19 to the consolidated financial statements).
For fiscal 2010, the increase in long-term debt reflects a new governmental authorities loan received to support the Corporation’s development costs for Aerospace programs, while the repayment of long-term debt was mostly for capital leases repayment. The Corporation issued 75,387 common shares under its stock purchase and ownership incentive plan for a cash consideration of $321,536 while it repurchased 761,600 common shares under the normal course issuer bids (in fiscal years 2010 and 2009) for a total cash consideration of $3,470,000.
At March 31, 2011, the Corporation was in compliance with all its restrictive debt covenants and expects to continue to comply with these restrictive financial covenants in fiscal 2012.
PENSION PLANS
Some of the Corporation’s employees are covered by defined benefit pension plans. At March 31, the funded status of these plans is as follows:
2011 2010 ($’000) ($’000)
Deficit 11,448 10,790Accrued benefit liability (included in other liabilities) 3,686 4,381
The pension plan deficit of $11.4 million at March 31, 2011 includes $5.1 million in pension plan obligations related to unregistered pension plans, primarily for former executives of Devtek Corporation, which was acquired by the Corporation in June 2000 and whose pension plan liability does not require funding. Funding occurs as pension benefits are paid to the retired executives. The Corporation modified the accrued benefit obligation discount rate for the Defined Registered Pension Plans (from 5.9% last year to 5.6% this year) which increased the deficit by $1.9 million (see Note 22 to the consolidated financial statements). The total minimum funding requirements for these pension plans over the next five years represented about $6 million at March 31, 2011.
NORMAL COURSE ISSUER BID
On November 25, 2009, the Corporation launched a new NCIB, with the approval of the Toronto Stock Exchange (TSX). Under the terms of the NCIB, the Corporation may acquire up to 1,500,000 of its common shares, representing approximately 5% of the issued and outstanding common shares of the Corporation as of November 19, 2009. The repurchase of common shares commenced on November 25, 2009, and terminated on November 24, 2010. During that year, the Corporation repurchased 711,100 common shares at an average net price of $5.68 per share for a total of $4.0 million (see Note 19 to the consolidated financial statements).

A N N U A L R E P O R T 2 0 1 0 - 2 0 1 1 1 7
All common shares purchased by the Corporation through the NCIB were made on the open market through the facilities of the TSX or other Canadian marketplaces in accordance with the policies of the TSX, and were surrendered by the Corporation to its transfer agent for cancellation.
CAPITAL STOCK, STOCK OPTION PLAN AND STOCK PURCHASE AND OWNERSHIP INCENTIVE PLAN (STOCK PURCHASE PLAN)
At March 31, 2011, the Corporation had 30,173,798 common shares outstanding (30,485,475 as at March 31, 2010).
During fiscal 2011, the Corporation issued 245,221 common shares following the exercise of stock options at a weighted-average price of $4.66 for a total cash consideration of $1,143,596 and 60,802 common shares under the Corporation’s stock purchase plan at a weighted-average price of $5.45 for a total cash consideration of $331,192.
During fiscal 2010, the Corporation issued 75,387 common shares at a weighted-average price of $4.26 for a total cash consideration of $321,536, all under the Corporation’s stock purchase plan.
At March 31, 2011, 1,393,000 stock options were issued and outstanding with a weighted-average of 3.5 years to maturity and a weighted-average exercise price of $6.00 (see Note 19 to the consolidated financial statements).
At March 31, 2011, the aggregate number of common shares reserved for issuance under the Stock Option Plan amounted to 2,808,257 of which 50,718 shares have not been granted yet. The aggregate number of common shares reserved for issuance under the Stock Purchase Plan amounted to 340,000 of which 29,976 have not been issued yet as of the same date.
Due to the limited number of common shares remaining under the plans mentioned above, the aggregate number of shares available for future granting or issuance under these plans will be increased, subject to the approval by the shareholders of the Corporation at the next Annual and Special Meeting to be held in August 2011.
Therefore, the total number of common shares that will be available for future granting or to be issued under these plans, subject to the approval of the Corporation’s shareholders, will be as follows:
COMMON STOCK OPTION STOCK PURCHASE TOTAL COMMON SHARES PLAN PLAN SHARES
Total shares 2,808,257 340,000 3,148,257
STOCK APPRECIATION RIGHT AND DEFERRED SHARE UNIT PLANS
The Corporation has a Stock Appreciation Right (SAR) plan under which rights are issued to its non-employee directors (see Note 19 to the consolidated financial statements). In August 2010, the Board of Directors decided not to continue the SAR plan and replaced it with a Deferred Share Unit (DSU) plan, which was effectively approved, subsequent to the last fiscal year-end, in May 2011. Consequently, in fiscal 2011, no DSUs or SARs were granted to the directors. However, at March 31, 2011, on a cumulative basis, 143,000 SARS were still outstanding at a weighted-average granted value of $6.21 (150,500 SARS at $6.14 at March 31, 2010) which expire on various dates from fiscal 2012 to 2016.
The DSU applies to the non-employee directors of the Corporation and is intended, on the one hand, to enhance the Corporation’s ability to attract and retain high quality individuals to serve as members of the Board of Directors and participate in the Corporation’s long-term success and, on the other hand, to promote a greater alignment of interests between the Corporation’s non-employee directors and its shareholders.
The DSU enables the participants to receive by way of remuneration, but only at the termination date as a member of the Board of Directors, a cash amount equal to the market price of the Corporation’s common share for each DSU on the termination date. These DSUs are expensed on an earned basis and their costs determined on the basis of the Corporation’s common shares quoted market value. Each director can also elect, each fiscal year, to have up to 50% of his director’s annual retainer fees converted into DSUs. These DSUs will be vested over a one-year period.

1 8 H É R O U X - D E V T E K
CONSOLIDATED BALANCE SHEETS
The following table itemizes and explains the significant changes in the consolidated balance sheets between March 31, 2011 and March 31, 2010:
Item Change ($ million)
Explanation
Cash and cash equivalents
(13.7) See consolidated statements of cash flows. As already mentioned, the Corporation utilized $12.1 million from its cash to finance the Eagle and E2 acquisition.
Accounts receivable 23.5 Increase coming from higher and strong fourth quarter sales, when compared to last year ($106 million vs. $85 million) and from the inclusion in the consolidated figures of the acquisition made this year ($5.4 million). This increase was partially offset by the impact of the stronger Canadian dollar, compared to last year, on US-denominated accounts receivable ($1.2 million).
Other receivables 1.1 This is mostly comprised of investment tax and other tax credits receivable which increased this year by $0.3 million over last year’s balance. Sales tax receivable also increased by $0.5 million as a result of increased last quarter sales volume, compared to last year.
Inventories 17.1 This increase includes the impact from the Eagle and E2 acquisition ($18.1 million) reduced by the impact of the stronger Canadian dollar on the Corporation’s U.S. self-sustaining subsidiaries’ inventories ($1.7 million). It also reflects an improved inventory management by the Corporation.
Derivative financial instruments (current assets)
3.4 Reflects the variation in the Corporation’s balance sheets of short-term derivative financial instruments measured at fair value.
Property, plant and equipment, net
7.4 Due to:
equipment not paid at year-end.
Net of:
of a facility ($0.6 million);
subsidiaries ($2.6 million).
Finite-life intangible assets, net (includes a $3.3 million net backlog)
6.8 Due to:
capitalized development costs for Aerospace long-term contracts;
Net of:
subsidiaries ($0.2 million).

A N N U A L R E P O R T 2 0 1 0 - 2 0 1 1 1 9
Item Change ($ million)
Explanation
Other assets (long-term assets)
(1.7) Reflects the variation in the Corporation’s balance sheets of long-term derivative financial instruments measured at fair value ($2.3 million) net of a reclassification of a building as Asset held for sale ($0.6 million).
Goodwill 4.8 Includes $5.8 million of goodwill associated to the acquisition of Eagle and E2. It also includes $1.0 million negative impact from the lower US/CAD exchange rate used to convert the goodwill included in the Corporation’s self-sustaining U.S. subsidiaries.
Accounts payable and accrued liabilities
10.8 Increase resulting from higher fourth quarter sales volume, when compared to last year and from the inclusion of accounts payable and accrued liabilities in the consolidated figures related to the acquisition made this year ($7.4 million). This increase was partially offset by the impact of the fluctuation of the Canadian dollar since March 31, 2010, on US-denominated payables which decreased accounts payable and accrued liabilities by $0.8 million.
Accounts payable – other 0.4 Reflects the increase in payables ($3.5 million) of machinery and equipment received in the last quarter of the fiscal year, offset by the decrease of $2.0 million in customers’ advances and the variation in derivative financial instruments ($1.1 million) measured at fair value.
Long-term debt (including current portion)
18.5 Due to:
Eagle and E2 acquisition ($16.7 million);
($8.7 million);
Net of:
loans measured at fair value for the related long-term debt ($1.7 million);
subsidiaries ($3.0 million).
Other liabilities (1.8) Mainly reflects the variation in the Corporation’s balance sheets of long-term derivative financial instruments measured at fair value. It also includes the reduction of the accrued pension plan benefit liability this year.
Future income taxes (long-term liabilities)
4.8 Reflects mainly the increased future income tax related to property, plant and equipment ($2.8 million) and long-term derivative financial instruments measured at fair value ($1.2 million).
Capital stock (0.5) Represents the common shares issued under the Corporation’s stock purchase and ownership plan and following the exercise of stock options ($1.5 million), net of the book value of the common shares repurchased under the Corporation’s Normal Course Issuer Bid ($2.0 million).
Accumulated other comprehensive loss
(1.3) Represents the counterpart of the impact of foreign exchange rate fluctuations on the net assets of self-sustaining US subsidiaries and the net gains (losses), net of taxes, on the fair value of the financial instruments designated as cash flow hedges.
Retained earnings 16.9 See consolidated statements of changes in shareholders’ equity.

2 0 H É R O U X - D E V T E K
At March 31, 2011 and March 31, 2010, the Corporation’s working capital ratio, cash and cash equivalents, long-term debt-to-equity ratio and net debt-to-equity ratio(1) were as follows:
MARCH 31, MARCH 31, 2011 2010
Working capital ratio 2.63:1 2.66:1Cash and cash equivalents $32.9 million $46.6 millionLong-term debt-to-equity ratio 0.41:1 0.35:1Net debt-to-equity ratio(1) 0.29:1 0.16:1
(1): Defined as total long-term debt, including the current portion, less cash and cash equivalents, over shareholders’ equity.
The summary of the Corporation’s contractual obligations, including payments due over the next five years and thereafter, is as follows:
PAYMENTS DUE BY PERIOD
CONTRACTUAL OBLIGATIONS AFTER($’000) TOTAL 1 YEAR 2-3 YEARS 4-5 YEARS 5 YEARS
Governmental authorities loans (including the effective accumulated interest expenses) 39,348 1,409 6,081 8,318 23,540Capital leases (including interest expenses) 15,301 3,386 6,724 4,980 211Promissory note (including interest expenses) 2,800 1,200 1,600 — —Operating leases – Machinery and equipment 4,816 1,629 2,335 700 152Operating leases – Buildings and facilities 4,916 909 1,259 718 2,030Subtotal, contractual obligations 67,181 8,533 17,999 14,716 25,933Credit Facility 57,691 — — 57,691 —Total contractual obligations 124,872 8,533 17,999 72,407 25,933
GOVERNMENT ASSISTANCE
For fiscal 2011, the Corporation recorded as a reduction of cost of sales an amount of $2.4 million ($5.4 million in fiscal 2010), and as a reduction of the related capital expenditures or capitalized development costs an amount of $3.9 million ($2.1 million in fiscal 2010) for government assistance.
This government assistance includes mainly the investment tax and other credits and the discounted portion of the governmental authorities loans (see Note 2 to the consolidated financial statements).
DERIVATIVES, OFF-BALANCE-SHEET ITEMS AND COMMITMENTS
The Corporation had entered into operating leases amounting to $9.7 million as at March 31, 2011, for buildings and facilities, and machinery and equipment. These amounts are repayable over the next eleven fiscal years, but mainly over the next five years. At March 31, 2011, the Corporation also had machinery and equipment purchase commitments totalling $3.9 million (see Note 23 to the consolidated financial statements).
At March 31, 2011, the Corporation had forward foreign exchange contracts with Canadian chartered banks totalling US$159.0 million at a weighted-average exchange rate (Canadian dollar over US dollar) of 1.1032. These contracts relate mainly to its export sales, and mature at various dates between April 2011 and March 2015 (see Note 4 to the consolidated financial statements). This compares to US$150.0 million in forward foreign exchange contracts held at March 31, 2010 at a weighted-average exchange rate of 1.1436.
At March 31, 2011, the Corporation also entered into forward foreign exchange contracts totalling US$7.7 million at a weighted-average rate (Canadian dollar over U.S. dollar) of 1.2343 maturing over the next three fiscal years, to cover foreign exchange risk related to certain embedded derivatives.

A N N U A L R E P O R T 2 0 1 0 - 2 0 1 1 2 1
In March 2011, following the renewal of the Corporation’s Credit Facility and in order to limit the effect of interest rate variations over a portion of its long-term debt denominated in U.S. currency in accordance with the Corporation’s risk management policy, the Corporation entered into three interest-rate swap agreements for a total amount of US$40 million and repurchased, for a cost of $0.4 million, the two interest rate swap agreements in place related to the previous credit facilities. The new agreements that fix the Libor U.S. rate at 3.90% for an amount of US$20 million and at 3.91% for another amount of US$20 million, will mature in December 2015.
On March 31, 2011, the Corporation designated certain long-term debt as hedges of its net investments in self-sustaining U.S. operations (see Note 2 to the consolidated financial statements).
IMPACT OF FINANCIAL AND ECONOMIC SITUATION
Gradual improvements in the global economy throughout fiscal 2011 have reversed certain negative trends observed in the previous two fiscal years. In the large commercial aircraft markets, manufacturers have announced production rate increases for calendar years 2011, 2012 and 2013, while most of the Corporation’s key industrial markets are gathering further momentum. Still, the Corporation continues to carefully monitor its strategy and risk management, as specific events, such as the situation in Japan and unrest in the Middle East and North Africa, can have negative short-term effects. Meanwhile, the military aerospace market has stabilized, as governments have begun to address their deficits.
While the Corporation’s backlog remains strong, deferrals or cancellations of additional purchase orders could have an adverse impact on future results. The Corporation is striving to maintain a well-balanced portfolio between commercial and military Aerospace segment sales, which should help reduce the risks associated with any potential slowdown in specific markets.
Furthermore, the value of the Canadian dollar, when compared to the US currency, will put additional pressure on upcoming results. As already mentioned, and as highlighted in the Outlook section, Management maintains its focus on operational efficiencies through the continued lean manufacturing initiatives, cost reduction initiatives and forward foreign exchange contracts strategy to mitigate the negative currency fluctuations.
From a financial standpoint, the Corporation has a healthy balance sheet and is presently in compliance with all of its financial covenants and expects to be so for the next twelve months. The Corporation does not expect to have any liquidity issues, considering that the banks’ Credit Facility is extended by a syndicate of five Canadian banks and a Canadian branch of a U.S. bank, with high-grade credit ratings, and that the major customers of the Corporation are worldwide leaders in their respective fields. This Credit Facility was renewed and increased in fiscal 2011 and will mature in March 2016.
In light of the above, the Corporation maintains its near-term outlook (see Outlook section below) and does not foresee any short-term elements that could jeopardize the going concern of its operations. That being said, and understanding that the Corporation operates, in part, in sectors subject to economic volatility, Management will remain prudent (see Risks and Uncertainties and Outlook sections below).
CRITICAL ACCOUNTING ESTIMATES
- Inventories, capitalized development costs and cost of sales
Corporation management uses estimates to value inventory and cost of sales related to design-to-manufacture contracts and major assembly manufacturing contracts. A 1% change in the estimated future costs to complete the remaining quantities under the design-to-manufacture contracts and major assembly-manufacturing contracts would have an impact of approximately $0.7 million on the Corporation’s cost of sales.
The non-recurring costs (development, pre-production and tooling costs) are included in finite-life intangible assets. Recovery of these costs is expected from related sales contracts through their amortization, based on pre-determined contract quantities.
Production accounting quantities for a particular contract are essentially established at the inception of the contract or contract date, and are based on management’s assessment of the anticipated demand for the related aircraft or product, taking into account mainly firm order and committed order backlog and options, as well as prevailing market and economic conditions.
Management reviews this major assumption on a quarterly basis, and a more detailed review is made at fiscal year-end. The effect of any revision to this assumption is accounted for by way of a cumulative catch-up adjustment in the period or year in which the revision takes place.

2 2 H É R O U X - D E V T E K
- Goodwill and intangible assets
Goodwill is tested for impairment annually or more frequently if events or circumstances indicate that the asset might be impaired. The Corporation selected its fourth quarter as its annual testing period for goodwill. A goodwill impairment charge is recorded when the discounted value of the expected future cash flows of the entire related reporting unit is less than its carrying value. Future cash flows are forecast based on management’s best estimates of revenues, production costs, manufacturing overhead and other costs. These estimates are made by reviewing existing contracts, expected future orders, current cost structure, anticipated cost variations, labour agreements and general market conditions, and are subject to review and approval by the Corporation’s senior management. Future cash flows are discounted using an estimated weighted-average cost of capital rate.
- Pension plans and other employee post-retirement benefits
Certain critical assumptions are used to determine pension plan and other employee post-retirement benefit costs and obligations. In particular, the discount rate and the expected long-term rate of return on plan assets are important assumptions used to measure these costs and obligations. Other assumptions include the rate of increase in employee compensation, as well as demographic factors such as employee retirement ages, mortality rates and turnover. These assumptions are reviewed annually.
A lower discount rate increases benefit costs and obligations. A 1% change in the discount rate would have an impact of approximately $0.4 million and $4.8 million, respectively, on the Corporation’s pension plan expense and accrued benefit obligations.
A lower expected rate of return on pension plan assets also increases benefit costs. A 1% change in the return assumption would have an impact of approximately $248,800 on the Corporation’s pension plan expense.
- Income tax
The Corporation accounts for future income tax assets mainly from loss carry-forwards and deductible temporary differences. Corporation management assesses and reviews the realization of these future income tax assets at least annually, at year-end, to determine whether a valuation allowance is required. Based on that assessment, it determines whether it is more likely than not that all or a portion of the future income tax assets will be realized. Factors taken into account include future income based on internal forecasts, losses in recent years and their expiry dates, and a history of loss carry-forwards, as well as reasonable tax planning strategies.
FUTURE CHANGES IN ACCOUNTING POLICIES
First-Time Adoption Of International Financial Reporting Standards In Canada
In February 2008, the Accounting Standard Board (“AcSB”) confirmed that Canadian GAAP for publicly accountable entities will be converged with International Financial Reporting Standards (“IFRS”), as issued by the International Accounting Standards Board, effective in calendar year 2011.
As a result, for its fiscal year 2012 interim consolidated financial statements starting April 1, 2011 and for its annual consolidated financial statements as at March 31, 2012, the Corporation will be required to report under IFRS and to provide IFRS comparative information for the 2011 fiscal year. Accordingly, the Corporation issued its last consolidated financial statements prepared in accordance with Canadian GAAP as of March 31, 2011.
IFRS uses a conceptual framework similar to Canadian GAAP, but there are significant differences on recognition, measurement and disclosures.
As part of the IFRS conversion project, the Corporation developed a phased changeover plan which comprised the following phases:
1. Identify differences between IFRS and Canadian GAAP2. Assess the impact of applicable differences on the consolidated financial statements3. Evaluate changes required to internal data-gathering and reporting processes4. Implement system changes5. Train personnel6. Roll out transition

A N N U A L R E P O R T 2 0 1 0 - 2 0 1 1 2 3
The Corporation has completed phases 1 to 5 and, accordingly, has modified its systems, processes and controls to meet the accounting and disclosure requirements of IFRS. As part of phase 6, the Corporation implemented processes to accommodate parallel recording of financial information in accordance with IFRS as at the transition date and for the interim periods which will be presented as comparative figures in its fiscal year 2012 IFRS consolidated financial statements.
Management has completed the preliminary measurement of material differences between IFRS and current Canadian GAAP for fiscal year 2011. The preliminary accounting impact of these material differences on consolidated shareholders’ equity as at April 1, 2010 and as at March 31, 2011, is presented in Table 1 below. The related preliminary impact on consolidated net income and consolidated comprehensive income for the year ended March 31, 2011, is presented in Table 2.
Table 1
Reconciliation of consolidated shareholders’ equity as at April 1, 2010 (date of transition) and as at March 31, 2011:
NOTE (‘000$)
Consolidated shareholders’ equity under Canadian GAAP as at March 31, 2010 217,092Adjustments: Cumulative translation adjustment E3 — Business acquisition E1 (1,365) Graded method to amortize the cost of stock options granted A4 — Unamortized net actuarial loss E2 (3,642) Unamortized past service cost and transitional obligation A3 (1,060) All Other A1, A2 38Total adjustments (6,029)Consolidated shareholders’ equity under IFRS as at April 1, 2010 211,063
NOTE (‘000$)
Consolidated shareholders’ equity under Canadian GAAP as at March 31, 2011 232,665Adjustments: To consolidated shareholders’ equity as at April 1, 2010 Table 1 (6,029) To consolidated net income for the year ended March 31, 2011, which have an impact on the consolidated shareholders’ equity at March 31, 2011 Table 2 602
391Adjustments to other comprehensive income for the year ended March 31, 2011 which have an impact on the consolidated shareholders’ equity at March 31, 2011IFRIC 14 Table 2 (1,238)Actuarial Loss Table 2 (1,246)Total adjustments (8,122)Consolidated shareholders’ equity under IFRS as at March 31, 2011 224,543

2 4 H É R O U X - D E V T E K
Table 2
Reconciliation of consolidated net income and consolidated comprehensive income for the year ended March 31, 2011:
NOTE CANADIAN GAAP ADJUSTMENT IFRS (‘000$) (‘000$) (‘000$)
Sales 357,572 357,572Cost of sales (1) A1, A2, A3 300,312 (955) 299,357Gross profit 57,260 58,215Selling and administrative expenses A4 26,040 (211) 25,829 31,220 32,386Financial expenses, net A1, A2 5,156 420 5,576Income before income tax expense and restructuring charges 26,064 26,810Restructuring charges 637 637Income before income tax expense 25,427 26,173Income tax expense A1, A2, A3 6,900 144 7,044Net income 18,527 602 19,129Other comprehensive income (loss), net of income taxes: (1,253) (1,253)IFRIC 14 A3 (1,238) (1,238)Actuarial loss A3 (1,246) (1,246)Total – Other comprehensive income (1,253) (2,484) (3,737)Comprehensive income 17,274 (1,882) 15,392
(1) Including amortization of $23,610 under Canadian GAAP and of $24,646 under IFRS.
Following are explanations of Canadian GAAP – IFRS adjustments in relation to Tables 1 and 2 above:
A. Exemptions applied
IFRS 1-First-time Adoption of International Financial Reporting Standards allows first-time adopters certain exemptions from the general requirement to apply IFRS, effective for the April 1, 2010 consolidated opening balance sheet. The Corporation will apply the following exemptions:
E1. IFRS 3-Business Combinations will be applied to acquisitions of subsidiaries that occurred after March 31, 2004. Accordingly, we have reviewed certain business acquisition purchase price determination and allocation. The effect is a decrease in the goodwill and consolidated shareholders’ equity, at transition date.
E2. The Corporation has elected to recognize all unamortized cumulative actuarial losses on pensions and other post-retirement benefits. The effect is an increase of the other liabilities and a decrease in consolidated shareholders’ equity, at transition date.
E3. As at April 1, 2010, the Corporation has elected to transfer the cumulative translation adjustment of $15,816 from accumulated other comprehensive income to retained earnings and therefore has no impact on consolidated shareholders’ equity at that date.
B. Adjustments resulting from the transition from Canadian GAAP to IFRS
A1. Leases
Under Canadian GAAP, capital and operating leases are based on the quantitative tests for lease classification. IFRS requires a qualitative and quantitative assessment of lease classification and, as a result, certain leases for machinery and equipment accounted for as operating leases under Canadian GAAP are now accounted for as finance leases under IFRS. The main effect of the change is an increase of property, plant & equipment of $6,834 and an increase of long-term debt of $7,377. The effect on consolidated shareholders’ equity as at March 31, 2010 is not significant.
A N N U A L R E P O R T 2 0 1 0 - 2 0 1 1 2 5
A2. Provisions
The consolidated balance sheet includes provisions representing estimated amounts that the Corporation expects to pay in the future. Under Canadian GAAP, these amounts are not discounted to account for the time period in which these obligations will be settled. As required by IAS 37–Provisions, Contingent Liabilities and Contingent Assets, certain provision amounts have been discounted. The effect on consolidated shareholders’ equity as at March 31, 2010 is not significant.
A3. Employee benefits
To conform to IAS 19-Employee Benefits, the Corporation:
Corporation used accrued benefit methods. The change of method had no significant effect on consolidated shareholders’ equity.
and a decrease of the consolidated shareholders’ equity.
Under Canadian GAAP, actuarial gains and losses are amortized through income using a corridor approach. Under IFRS, the Corporation has elected to recognize all actuarial gains and losses in Other Comprehensive Income as incurred. As a result of this election, variations arising from the effect of applying IFRIC 14 are recorded in Other Comprehensive Income in the period in which they occur. IFRIC 14–The Limit on a Defined Benefit Asset, Minimum Funding Requirements and their Interaction limits the measurement of defined benefit assets and may also give rise to a liability.
A4. Stock-based compensation
In prior years, the Corporation amortized the cost of granted stock options using the straight-line method. In order to conform to IFRS 2 – Share-based payment, the Corporation will adopt the graded method to amortize the cost of stock options granted. The change of method results in an increase of contributed surplus and a corresponding decrease of retained earnings and thus has no impact on consolidated shareholders’ equity.
C. Reclassifications resulting from the transition from Canadian GAAP to IFRS
A5. Progress billings
Under Canadian GAAP, progress billings received from customers are deducted from related costs in inventory. As required by IFRS, progress billings of $32,332 as at April 1, 2010 and $33,365 as at March 31, 2011, will be classified as short-term and long-term liabilities.
A6. Provisions
IFRS requires that provisions be presented separately in the balance sheet. Accordingly, certain provisions classified under Accounts payable and accrued liabilities and Other liabilities under Canadian GAAP, will be presented separately.
A7. Derivative financial instruments - liabilities
IFRS require that derivative financial instruments be presented separately in the consolidated balance sheet.
A8. Deferred income taxes
“Future income taxes” under Canadian GAAP are referred to as “deferred income taxes” under IFRS. Under Canadian GAAP, future income taxes were classified as current or non-current based on the classification of the liabilities and assets to which future income tax liabilities and assets were related. As required by IFRS, all deferred income tax assets and liabilities will be classified as non-current.
D. Presentation of financial statements
IAS 1 prescribes various formats and requirements with respect to statement presentation and disclosure. The Corporation expects the adoption of IAS 1 to result in several changes to the format of consolidated financial statements and in additional disclosure notes.

2 6 H É R O U X - D E V T E K
E. Functional currency
Under IFRS, the criteria used to determine the functional currencies of the Corporation’s reporting entities differ in some respect from those used under Canadian GAAP. However, Management has determined that there will be no change in the Corporation’s functional currencies as a result of the transition to IFRS. The functional currency of Héroux-Devtek Inc. and the Canadian operations is the Canadian dollar. The functional currency of the US operations is the US dollar.
The Corporation may change its intentions or modify preliminary impacts in respect of potential changes to IFRS currently in development, or in light of other external factors that could arise between now and the date on which the first IFRS consolidated financial statements will be issued.
The effects on information technology, data systems, disclosure controls and procedures and internal controls over financial reporting have also been assessed, and the Corporation has made the preliminary modifications required for the conversion from Canadian GAAP to IFRS.
While we have not fully completed our conversion plan, we are not aware, at the present time, of any matter that would prevent the Corporation from meeting its full requirements for its first IFRS interim consolidated financial report.
INTERNAL CONTROLS AND PROCEDURES
In compliance with the Canadian Securities Administrators’ Multilateral Instrument 52-109 (“MI 52-109”), the Corporation has filed certificates signed by the Chief Executive Officer (“CEO”) and Chief Financial Officer (“CFO”) that, among other things, report on disclosure controls and procedures and the design and effectiveness of internal controls over financial reporting.
Disclosure controls and procedures
The CEO and CFO have designed disclosure controls and procedures, or have caused them to be designed under their supervision, to provide reasonable assurance that material information relating to the Corporation has been made known to them and has been properly disclosed in the annual regulatory filings.
At March 31, 2011, an evaluation, under the supervision of the CEO and CFO, of the design and effectiveness of the Corporation’s disclosure controls and procedures was also carried out, as defined in MI 52-109. Based on this evaluation, the CEO and CFO concluded that the design and operation of these disclosure controls and procedures were effective. This evaluation took into account the Corporation’s disclosure policy and its disclosure committee.
Internal controls over financial reporting
The Corporation’s CEO and CFO have also designed internal controls over financial reporting, or have caused them to be designed under their supervision, to provide reasonable assurance regarding the reliability of financial reporting and the preparation of financial statements for external purposes in accordance with Canadian generally accepted accounting principles.
At March 31, 2011, an evaluation, under the supervision of the CEO and CFO, of the design and effectiveness of the Corporation’s internal controls over financial reporting was carried out, as defined in MI 52-109. Based on this evaluation, the CEO and CFO concluded that the design and effectiveness of these internal controls over financial reporting were effective to provide reasonable assurance that the Corporation’s financial reporting is reliable and that the Corporation’s consolidated financial statements were prepared in accordance with Canadian generally accepted accounting principles.
However, a control system, no matter how well conceived or operated, can provide only reasonable, not absolute, assurance that the objectives of the control system are met.
Changes in internal controls over financial reporting
No changes that were made to our internal controls over financial reporting during the year ended March 31, 2011, have materially affected, or are reasonably likely to materially affect, our internal controls over financial reporting.
RISKS AND UNCERTAINTIES
Héroux-Devtek operates in industry segments with a variety of risk factors and uncertainties that could have a material adverse effect on the Corporation’s business, financial condition and results of operations. Such risks and uncertainties include, but are not limited to, those mentioned below.

A N N U A L R E P O R T 2 0 1 0 - 2 0 1 1 2 7
Reliance on Large Customers
The Corporation has exposure due to its reliance on certain large contracts and customers. The Corporation’s six largest customers account for approximately 60% of its sales. Any loss or delay in certain orders from any of these customers could have a negative impact on the Corporation’s results.
The Corporation mitigates this risk through the increase of long-term sales contracts, when possible, with its main customers.
Availability and Cost of Raw Materials
The main raw materials purchased by the Corporation are aluminum, steel and titanium. Supply and cost of these materials is somewhat outside the Corporation’s control. Difficulty in procuring raw materials in sufficient quantities and in a timely fashion, along with cost increases for these materials, could also have a material adverse effect on the Corporation’s operations and financial condition.
In the current year, as this situation has started to escalate with the improvement of the global economy and the growth of the Chinese economy in particular, the Corporation has begun to take steps to mitigate this risk. It now includes clauses in its long-term sales contracts of importance to share the risk of raw materials availability and cost with its customers. It also negotiates long-term supply agreements with its suppliers of raw materials, and has increased its monitoring of the supply chain to ensure timely deliveries.
Operational Risks
The activities conducted by the Corporation are subject to operational risks that include competition from other businesses, performance of key suppliers, product performance warranties, regulatory risks, successful integration of new acquisitions, dependence on key personnel and reliance on information systems, all of which could affect the Corporation’s ability to meet its obligations.
However, the Corporation has implemented certain risk-mitigation strategies and controls, in light of these operational risks, which include the following:
products and assemblies, and repair and overhaul services. This includes the risk assessment of achieving the targeted revenues (firm-fixed price contracts, escalation clauses, etc.) and related product costs as well as the development of long-term agreements and competitive bidding processes with main suppliers.
Impact of Terrorist Activity and Political Instability
There continues to be uncertainty over the future impact in the commercial aerospace sector from the threat of terrorist activity and the ongoing situations in the Middle East. Such issues typically have a negative impact on commercial air traffic and a positive impact on defence spending.
General Economic Conditions
Unfavourable economic conditions may adversely affect the Corporation’s business. For example, the large civil aerospace industry has experienced considerable uncertainty in prior years, especially the market for planes with more than 100 seats. Since fiscal 2006, the regional jet market has been negatively impacted by lower demand and the business jet market is closely related to the state of the economy. Furthermore, the industrial power generation market also collapsed with the recent economic downturn. This could adversely affect the Corporation’s financial condition and results of operation. Although long-term growth is gradually resuming, these sectors will remain cyclical. In addition, curtailment of production activities due to unfavourable economic conditions could result in the Corporation incurring significant costs associated with temporary layoffs or termination of employees.
Military Spending
Although significant increases in military budgets, particularly in the United States, were announced in recent years, these expenses are approved by government on a yearly basis and are subject to the political climate and changing priorities.
Foreign Currency Fluctuations
The Corporation is exposed to risks resulting from foreign currency fluctuations arising either from carrying on business in Canada in foreign currencies or through operations in the United States. In an effort to mitigate those risks, the Corporation makes use of derivative contracts to hedge this exposure.

2 8 H É R O U X - D E V T E K
The Corporation’s foreign exchange hedging policy requires it to mitigate the foreign currency exposure, essentially to the US currency, arising from its Canadian operations.
The hedging policy requires the hedging of 50% to 75%, on average, of the identified foreign currency exposure, mainly over the next two fiscal years, of the forecasted cash inflows generated by sales in US currency made by its Canadian operations and related to long-term sales contracts, net of the forecasted cash outflows in US currency related essentially to its raw and certain other material costs. This hedging policy also applies to the net forecasted cash inflows/outflows as described above, for certain specific long-term sales contracts, on a very limited basis, for an additional period of one to three fiscal years.
Liquidity and Access to Capital Resources
The Corporation requires continued access to capital markets to support its activities. To satisfy its financing needs, the Corporation relies on long-term and short-term debt and cash flow from operations. Any impediments to the Corporation’s ability to access capital markets, including significant changes in market interest rates, general economic conditions or the perception in the capital markets of the Corporation’s financial condition or prospects, could have a material adverse effect on the Corporation’s financial condition and results of operation.
Restrictive Debt Covenants
The indentures governing certain of the Corporation’s indebtedness and, in particular, its Credit Facility, contain covenants that, among other things, restrict the Corporation’s ability to:
The Corporation is subject to various financial covenants under its Credit Facility which must be met on a quarterly basis. It includes financial covenants requiring a minimum EBITDA to debt service ratio, a maximum net funded debt to EBITDA ratio and a maximum net funded debt to capital ratio, all calculated on a consolidated basis. These terms and ratios are defined in the Credit Facility agreement and do not necessarily correspond to the Corporation’s financial metrics or the specific terms used in the MD&A.
In addition, the Corporation is subject to various financial covenants under certain capital and operating leases and governmental authorities loans. It includes financial covenants requiring minimum working capital ratio and maximum long-term debt to equity ratio based on the Corporation’s consolidated balance sheet and also minimum equity requirements for certain subsidiaries of the Corporation.
These restrictions could impair the Corporation’s ability to finance its future operations or its capital needs, or to engage in other business activities that may be in its interest.
Changing Interest Rates
The Corporation’s profitability may be directly affected by the level of and fluctuations in interest rates. When appropriate, the Corporation considers using derivatives as an integral part of its asset/liability management program to mitigate or reduce its overall financial risk.
To mitigate these fluctuations, the Corporation has established a short-term investment policy that dictates the level and type of investments it should seek. The Corporation also maintains a well-balanced portfolio of financing, choosing between fixed and variable rates.
External Business Environment
The Corporation faces a number of external risk factors, specifically including general economic conditions, government policies and changing priorities or possible spending cuts by governments.

A N N U A L R E P O R T 2 0 1 0 - 2 0 1 1 2 9
Warranty Casualty Claim Losses
The products manufactured by the Corporation are complex and sophisticated and may contain defects that are difficult to detect and correct. Errors may be found in the Corporation’s products after they are delivered to the customers. If so, the Corporation may not be able to correct such errors. The occurrence of errors and failures in the Corporation’s products could result in warranty claims or the loss of customers. Any claims, errors or failures could have an adverse effect on the Corporation’s operating results and business. In addition, due to the nature of the Corporation’s business, the Corporation may be subject to liability claims involving its products or products for which it provides services. The Corporation cannot be certain that its insurance coverage will be sufficient to cover one or more substantial claims. Furthermore, there can be no assurance that the Corporation will be able to obtain insurance coverage at acceptable levels and cost in the future. See under ‘Operational Risks’, above.
Environmental Matters
The Corporation’s activities are subject to environmental laws and regulations associated with risks to human health and the environment. Changes to these laws and regulations could have a significant adverse effect on the Corporation’s operations and financial situation. The Corporation monitors these risks through environmental management systems and policies.
Collective Bargaining Agreements
The Corporation is party to some collective bargaining agreements that expire at various times in the future. If the Corporation is unable to renew these agreements or others as they become subject to renegotiation from time to time, it could result in work stoppages and other labour disturbances, which could have a material adverse effect on the Corporation’s business.
In May 2010 and April 2011, the Corporation renewed its collective agreements, respectively, with its Aerostructure Dorval plant employees and its Landing Gear Longueuil plant employees, both for three-year periods. The Landing Gear Laval plant agreement will come up for renewal in December 2011.
Skilled Labour
Héroux-Devtek’s ability to meet its future goals and objectives depends in part on its ability to attract and retain the necessary skilled labour. The skilled labour market in the aerospace industry is expected to continue to be highly competitive in the future. The Corporation’s inability to attract and retain skilled labour, particularly engineers, machinists and programmers, could adversely affect its financial condition and results of operations.
The Corporation is addressing this risk by developing its human resource strengths internally and by working to retain the skilled employees that it currently has and attract the best talent by fostering a strong sense of corporate culture. Héroux-Devtek therefore does not anticipate a substantial increase in its manpower requirements over the next few years.
SELECTED QUARTERLY FINANCIAL INFORMATION
FIRST SECOND THIRD FOURTH
($’000 EXCEPT PER SHARE DATA) TOTAL QUARTER QUARTER QUARTER QUARTER
For the fiscal year ended March 31, 2011 Sales 357,572 82,541 83,194 85,843 105,994EBITDA 54,830 11,448 10,813 14,204 18,365Net income 18,527 3,183 2,556 5,064 7,724Earnings per share ($) – basic 0.62 0.11 0.09 0.17 0.26Earnings per share ($) – diluted 0.61 0.10 0.08 0.17 0.25
For the fiscal year ended March 31, 2010 Sales 320,354 82,160 76,570 76,659 84,965EBITDA 48,437 12,762 11,723 11,685 12,267Net income 16,003 4,542 3,518 3,538 4,405Earnings per share ($) – basic 0.52 0.15 0.11 0.12 0.14Earnings per share ($) – diluted 0.52 0.15 0.11 0.12 0.14

3 0 H É R O U X - D E V T E K
Fourth Quarter 2011 Results
The Corporation achieved record results for the quarter ended March 31, 2011 with sales of $106.0 million, up from $85.0 million for the same period last year. Excluding the $12.8 million sales of Eagle and E2, consolidated sales were up by $8.2 million or 9.7% despite the negative US/CAD currency impact of $2.3 million. In addition, sales were negatively impacted by lower landing gear military manufacturing sales as a result of lower spare part requirements, lower F-22 sales, as this program is coming to an end, and lower large commercial sales, mainly due to lower production rates on the B-777 program. Sales were boosted by increased F-16 after-market sales, new business on Fokker, B-787 and B-2 programs, higher business jet and helicopter product sales along with increased throughput in repair and overhaul work.
In the fourth quarter this year, increase on JSF (F-35) program sales also had a favourable impact on sales, while the sales for the year on this program were marginally higher, compared to last year.
Gross profit margin for the quarter was 18.6% this year compared to 15.8% last year. When excluding the impact of the Eagle and E2 acquisition, this year’s gross profit as a percentage of sales would have been 19.5%. This quarter, all product lines improved their gross profit in dollars and percentage when compared to last year. The increase in overall Aerospace and Industrial sales, the favourable sales mix, along with the continued productivity improvement in the Industrial segment explained the significant increase in gross profit margin in the last quarter this year. Net income stood at $7.7 million or $0.25 per share, fully diluted, compared to net income of $4.4 million or $0.14 per share, fully diluted, last year.
Cash flow from operations yielded $16.7 million compared to $12.3 million for the fourth quarter last year, as a result of higher net income and higher amortization expense. The net change in non-cash working capital items represented an outflow of $14.1 million compared to a positive net change of $14.3 million in the last quarter of last year. This quarter’s outflow came mainly from higher accounts receivables ($25.0 million) partially offset by lower inventories ($4.2 million) and higher accounts payable and accrued liabilities ($5.9 million), compared to the previous quarter ended December 31, 2010. These variations are the result of record sales volume made in the last quarter this year. Last year, the positive net change of $14.3 million came mainly from lower accounts receivables ($3.9 million) in line with last year’s fourth quarter lower sales volume and lower inventories ($9.8 million) (see Consolidated Balance Sheet section above).
OUTLOOK
Conditions continue to be favourable in the commercial aerospace market. Despite high fuel prices and uncertainty following unrest in the Middle East and North Africa, as well as the situation in Japan, the IATA is forecasting growth in calendar 2011 of 5.6% for passenger markets and of 6.1% in air cargo.
In the large commercial aircraft segment, manufacturers have announced several production rate increases on leading programs for calendar 2011, 2012 and 201311. Furthermore, new orders received in the first three months of calendar 2011 continue to exceed levels of the prior year and both Boeing and Airbus are forecasting higher deliveries for calendar 2011. Finally, Boeing and Airbus backlogs continue to represent approximately six years of production based on projected rates.
The business jet market is seeing further signs of recovery in early 2011. Aircraft utilization continues to increase and the proportion of used aircraft for sale is still declining. However, stronger global economic growth is only expected to yield a rebound in industry shipments in calendar 201212.
The military aerospace market is stabilizing as governments address their deficits. As to the JSF program, the U.S. government has put the short take-off and vertical landing (STOVL) variant on a two-year probation period, but the ramp-up of other variants continues, albeit at a slightly more moderate pace over the near term. This probation should result in the production of a slightly lower number of shipsets for Héroux-Devtek in fiscal 2012, compared to fiscal 2011. In Canada, the Government’s decision to purchase 65 JSF aircraft should benefit the Canadian aerospace industry.
Conditions are favourable in the Corporation’s main Industrial products markets. In the power generation industry, leading North American equipment manufacturers have reported increased new orders in the past quarters. Backlogs are also strongly rising for leading heavy equipment manufacturers13.
Capital expenditures for fiscal 2012 are expected to be approximately $26 million, including an investment of $5 million related to the new facility in Mexico.
11 Sources: Boeing press releases Dec. 20, 2010; Sept. 16, 2010; June 15, 2010; May 17, 2010; March 19, 2010. Airbus press releases February 3, 2011; July 30, 2010; March 9, 2010.
12 Sources: JETNET, FAA.
13 Sources : GE press release April 21, 2011; Caterpillar press release April 29, 2011.

A N N U A L R E P O R T 2 0 1 0 - 2 0 1 1 3 1
The integration of Eagle and E2 is mostly completed and the priority for fiscal 2012 will be to optimize operations and maximize efficiencies by further specializing facilities. This progress, combined with a solid balance sheet and the recent increase in its credit facility, places Héroux-Devtek in a position to consider another strategic acquisition that would complement its product portfolio and its technologies.
As at March 31, 2011, Héroux-Devtek’s funded (firm orders) backlog stood at $502 million, including the backlog of Eagle and E2, up from $423 million at the beginning of the year. Despite this solid backlog and strong customer relationships, the Corporation must seek further productivity gains and continue to streamline its cost base to remain globally competitive in light of the volatility of the Canadian dollar and the uncertainty surrounding its continuous fluctuation versus the US currency.
Assuming the Canadian dollar remains at parity versus the US currency and considering forward foreign exchange contracts, the Corporation anticipates an internal sales growth of approximately 5% for the fiscal year ending March 31, 2012.
ADDITIONAL INFORMATION AND CONTINUOUS DISCLOSURE
This MD&A was approved by the Audit Committee on May 25, 2011 and by the Board of Directors on May 26, 2011. Updated information on the Corporation can be found on the SEDAR website, at www.sedar.com.

3 2 H É R O U X - D E V T E K
MANAGEMENT’S REPORT
The accompanying consolidated financial statements and Management Discussion and Analysis of Financial Position and Operating Results (“MD&A”) of Héroux-Devtek Inc. (the “Corporation”) and all other information in this Annual Report are the responsibility of management and have been reviewed and approved by its Board of Directors. The accompanying consolidated financial statements have been prepared by management in accordance with Canadian generally accepted accounting principles. The MD&A has been prepared in accordance with the requirements of Canadian securities regulators. The consolidated financial statements and MD&A include items that are based on best estimates and judgments of the expected effects of current events and transactions. Management has determined such items on a reasonable basis in order to ensure that the consolidated financial statements and MD&A are presented fairly in all material respects. Financial information presented elsewhere in the Annual Report is consistent with that in the consolidated financial statements. All figures presented in these consolidated financial statements are expressed in Canadian dollars unless otherwise indicated.
Héroux-Devtek Inc.’s Chief Executive Officer (“CEO”) and Chief Financial Officer (“CFO”) have designed internal controls over financial reporting (“ICFR”) and disclosure controls and procedures (“DC&P”), or have caused them to be designed under their supervision, to provide reasonable assurance regarding the reliability of financial reporting and the preparation of consolidated financial statements for external purposes in accordance with Canadian generally accepted accounting principles and that material information related to the Corporation has been made known to them and has been properly disclosed in the accompanying consolidated financial statements and MD&A. Héroux-Devtek Inc.’s CEO and CFO have also evaluated the effectiveness of such ICFR and DC&P as of the end of fiscal year 2011. As of March 31, 2011, management concludes that the ICFR and DC&P effectively provide reasonable assurance regarding the reliability of financial reporting and the preparation of consolidated financial statements for external purposes in accordance with Canadian generally accepted accounting principles and that material information related to the Corporation has been disclosed in the consolidated financial statements and MD&A. Also, based on this assessment, the CEO and the CFO determined that there were no material weaknesses in the ICFR and DC&P. Héroux-Devtek Inc.’s CEO and CFO have provided a certification related to Héroux-Devtek Inc.’s annual disclosure documents to the Canadian Securities Administrators in accordance with Multilateral Instrument 52-109, including the consolidated financial statements and MD&A.
The Board of Directors is responsible for ensuring that management fulfills its responsibilities for financial reporting and is ultimately responsible for reviewing and approving the consolidated financial statements and MD&A. The Board of Directors carries out this responsibility principally through its Audit Committee. The Audit Committee is appointed by the Board of Directors and consists entirely of independent and financially literate directors.
The Audit Committee meets periodically with management, as well as with the external auditors, to review the consolidated financial statements, the external auditors’ report, MD&A, auditing matters and financial reporting issues, to discuss ICFR , and to satisfy itself that each party is properly discharging its responsibilities. In addition, the Audit Committee has the duty to review the appropriateness of the accounting policies and significant estimates and judgments underlying the consolidated financial statements as presented by management, and to review and make recommendations to the Board of Directors with respect to the fees of the external auditors. The Audit Committee reports its findings to the Board of Directors for its consideration when it approves the consolidated financial statements and MD&A for issuance to shareholders.
The consolidated financial statements as at March 31, 2011 and 2010 have been audited by Ernst & Young LLP, the external auditors, in accordance with Canadian generally accepted auditing standards on behalf of the Shareholders. The external auditors have full and free access to the Audit Committee to discuss their audit and related matters.
Gilles Labbé, FCA Réal Bélanger, CA
President and Chief Executive Officer Executive Vice-President and Chief Financial Officer
May 27, 2011

A N N U A L R E P O R T 2 0 1 0 - 2 0 1 1 3 3
INDEPENDENT AUDITORS’ REPORTTo the Shareholders of Héroux-Devtek Inc.
We have audited the accompanying consolidated financial statements of Héroux-Devtek Inc., which comprise the consolidated balance sheets as at March 31, 2011 and 2010 and the consolidated statements of income, changes in shareholders’ equity and cash flows for the years then ended, and a summary of significant accounting policies and other explanatory information.
Management’s responsibility for the consolidated financial statements
Management is responsible for the preparation and fair presentation of these consolidated financial statements in accordance with Canadian generally accepted accounting principles, and for such internal control as management determines is necessary to enable the preparation of consolidated financial statements that are free from material misstatement, whether due to fraud or error.
Auditors’ responsibility
Our responsibility is to express an opinion on these consolidated financial statements based on our audits. We conducted our audits in accordance with Canadian generally accepted auditing standards. Those standards require that we comply with ethical requirements and plan and perform the audit to obtain reasonable assurance about whether the consolidated financial statements are free from material misstatement.
An audit involves performing procedures to obtain audit evidence about amounts and disclosures in the consolidated financial statements. The procedures selected depend on the auditors’ judgment, including the assessment of the risks of material misstatement of the consolidated financial statements, whether due to fraud or error. In making those risk assessments, the auditors consider internal control relevant to the entity’s preparation and fair presentation of the consolidated financial statements in order to design audit procedures that are appropriate in the circumstances, but not the purpose of expressing an opinion on the effectiveness of the entity’s internal control. An audit also includes evaluating the appropriateness of accounting policies used and the reasonableness of accounting estimates made by management, as well as evaluating the overall presentation of the consolidated financial statements.
We believe that the audit evidence we have obtained in our audits is sufficient and appropriate to provide a basis for our audit opinion.
Opinion
In our opinion, the consolidated financial statements present fairly, in all material respects, the financial position of Héroux-Devtek Inc. as at March 31, 2011 and 2010 and the results of its operations and its cash flows for the years then ended, in accordance with Canadian generally accepted accounting principles.
Ernst & Young LLP Chartered Accountants
Montréal, Québec May 26, 2011
1 CA Auditor permit no. 19483

3 4 H É R O U X - D E V T E K
CONSOLIDATED BALANCE SHEETSAS AT MARCH 31, 2011 AND 2010 (IN THOUSANDS OF CANADIAN DOLLARS)
NOTES 2011 2010
Assets 3, 17Current assets Cash and cash equivalents $ 32,910 $ 46,591 Accounts receivable 62,623 39,085 Income tax receivable 716 1,349 Other receivables 9, 23 12,240 11,174 Inventories 10 101,472 84,408 Prepaid expenses 2,498 2,151 Future income taxes 20 5,819 5,124 Derivative financial instruments 11 10,923 7,568 229,201 197,450
Property, plant and equipment, net 12 145,047 137,670Finite-life intangible assets, net 13 18,486 11,698Other assets 8,14 10,743 12,408 Goodwill 15 40,398 35,621 $ 443,875 $ 394,847
Liabilities and shareholders’ equityCurrent liabilities Accounts payable and accrued liabilities 23 $ 68,893 $ 58,069 Accounts payable – other 16 4,980 4,591 Income tax payable 1,622 138 Future income taxes 20 6,474 7,161 Current portion of long-term debt 17 5,136 4,250 87,105 74,209
Long-term debt 17 94,376 76,807Other liabilities 18 9,182 10,948Future income taxes 20 20,547 15,791 211,210 177,755
Shareholders’ equity Capital stock 19 100,136 100,641 Contributed surplus 19 2,010 1,615 Accumulated other comprehensive (loss) (5,871) (4,618) Retained earnings 136,390 119,454 232,665 217,092 $ 443,875 $ 394,847
Commitments and contingencies (Notes 23 and 24)The accompanying notes are an integral part of these consolidated financial statements.
On behalf of the Board of Directors
Louis Morin Gilles LabbéDirector Director

A N N U A L R E P O R T 2 0 1 0 - 2 0 1 1 3 5
CONSOLIDATED STATEMENTS OF INCOMEFOR THE YEARS ENDED MARCH 31, 2011 AND 2010 (IN THOUSANDS OF CANADIAN DOLLARS, EXCEPT SHARE AND PER SHARE DATA)
NOTES 2011 2010
3
Sales $ 357,572 $ 320,354
Cost of sales, including amortization expense of $23,610 ($21,260 in 2010) 2,10 300,312 270,012
Gross profit 57,260 50,342
Selling and administrative expenses 7, 19 26,040 23,165
Operating income 31,220 27,177
Financial expenses, net 17 5,156 4,676
Income before income tax expense and restructuring charges 26,064 22,501
Restructuring charges 8 637 —
Income before income tax expense 25,427 22,501
Income tax expense 20 6,900 6,498
Net income $ 18,527 $ 16,003
Earnings per share – basic $ 0.62 $ 0.52
Earnings per share – diluted $ 0.61 $ 0.52
Weighted-average number of shares outstanding during the year 30,112,464 30,661,745
The accompanying notes are an integral part of these consolidated financial statements.

3 6 H É R O U X - D E V T E K
CONSOLIDATED STATEMENTS OF CHANGESIN SHAREHOLDERS’ EQUITYFOR THE YEARS ENDED MARCH 31, 2011 AND 2010 (IN THOUSANDS OF CANADIAN DOLLARS)
Accumulated other
Capital Contributed comprehensive Retained Comprehensive
Notes stock surplus income (loss) earnings income (loss)
Balance at March 31, 2010 $ 100,641 $ 1,615 $ (4,618) $ 119,454 $ —Common shares: 19 Issued under the stock option plan 1,144 — — — — Issued under the stock purchase and ownership incentive plan 330 — — — — Repurchased under the Corporation’s normal course issuer bid (1,979) — — (1,591) —Stock-based compensation expense 19 — 395 — — —Net income — — — 18,527 18,527Net gains (losses) on derivative financial instruments designated as cash flow hedges, net of taxes of $2,907 — — 8,630 — 8,630Net (gains) losses on derivative financial instruments designated as cash flow hedges in prior years transferred to net income in the current year, net of taxes of $2,383 — — (6,898) — (6,898)Net gains on hedge of net investments in self-sustaining foreign operations, net of taxes of $207 — — 590 — 590Cumulative translation adjustment — — (3,575) — (3,575)Balance at March 31, 2011 $ 100,136 $ 2,010 $ (5,871) $ 136,390 $ 17,274 Accumulated other
Capital Contributed comprehensive Retained Comprehensive
Notes stock surplus income (loss) earnings income (loss)
Balance at March 31, 2009 $ 102,822 $ 1,375 $ (12,124) $ 104,418 $ —Common shares: 19 Issued under the stock purchase and ownership incentive plan 322 — — — — Repurchased under the Corporation’s normal course issuer bids (2,503) — — (967) —Stock-based compensation expense 19 — 240 — — —Net income — — — 16,003 16,003Net gains (losses) on derivative financial instruments designated as cash flow hedges, net of taxes of $9,716 — — 23,313 — 23,313Net (gains) losses on derivative financial instruments designated as cash flow hedges in prior years transferred to net income in the current year, net of taxes of $326 — — 692 — 692Cumulative translation adjustment — — (16,499) — (16,499)Balance at March 31, 2010 $ 100,641 $ 1,615 $ (4,618) $ 119,454 $ 23,509
The accompanying notes are an integral part of these consolidated financial statements.

A N N U A L R E P O R T 2 0 1 0 - 2 0 1 1 3 7
CONSOLIDATED STATEMENTS OF CASH FLOWS FOR THE YEARS ENDED MARCH 31, 2011 AND 2010 (IN THOUSANDS OF CANADIAN DOLLARS)
NOTES 2011 2010
Cash and cash equivalents provided by (used for):Operating activities Net income $ 18,527 $ 16,003Items not requiring an outlay of cash: Amortization expense 23,610 21,260 Future income taxes 20 3,978 6,443 Loss on sale of property, plant and equipment 324 379 Amortization of deferred financing costs 17 350 168 Accretion expense on asset retirement obligations and governmental authorities loans 17 1,570 1,374 Stock-based compensation expense 19 395 240Cash flows from operations 48,754 45,867Net change in non-cash working capital items related to operations 21 (19,155) (8,121)Cash flows related to operating activities 29,599 37,746
Investing activitiesBusiness acquisition 3 (28,813) — Additions to property, plant and equipment 2,12 (19,646) (13,740)Net increase in finite-life intangible assets 2,13 (7,980) (3,763)Proceeds on disposal of property, plant and equipment 139 8Cash flows related to investing activities (56,300) (17,495)
Financing activitiesIncrease in long-term debt 3 23,727 2,404Repayment of long-term debt (5,428) (5,292)Increase in deferred financing costs 17 (2,198) —Repurchase of common shares 19 (3,570) (3,470)Issuance of common shares 19 1,474 322Cash flows related to financing activities 14,005 (6,036)
Effect of changes in exchange rates on cash and cash equivalents (985) (7,383)
Change in cash and cash equivalents during the year (13,681) 6,832Cash and cash equivalents at beginning of year 46,591 39,759Cash and cash equivalents at end of year $ 32,910 $ 46,591
Supplemental information: Interest paid $ 2,834 $ 2,783 Income taxes paid $ 1,114 $ 4,269
The accompanying notes are an integral part of these consolidated financial statements.

3 8 H É R O U X - D E V T E K
NOTES TO CONSOLIDATED FINANCIAL STATEMENTSFOR THE YEARS ENDED MARCH 31, 2011 AND 2010 (ALL DOLLAR AMOUNTS IN THOUSANDS OF CANADIAN DOLLARS, EXCEPT SHARE DATA)
NOTE 1. NATURE OF ACTIVITIES
Héroux-Devtek Inc. and its subsidiaries (the “Corporation”) specialize in the design, development, manufacture, repair and overhaul of systems and components used principally in the aerospace and industrial sectors. As a result, a significant portion of the Corporation’s sales are made to a limited number of customers mainly located in the United States and Canada.
NOTE 2. SUMMARY OF SIGNIFICANT ACCOUNTING POLICIES
Basis of presentation
The consolidated financial statements have been prepared by management in accordance with Canadian generally accepted accounting principles within the framework of the significant accounting policies summarized below.
Basis of consolidation
The principal wholly-owned subsidiaries of the Corporation included in the consolidated financial statements are the following:
Use of estimates
The preparation of consolidated financial statements in accordance with Canadian generally accepted accounting principles (“GAAP”) requires management to make estimates and assumptions that affect the reported amounts of assets and liabilities, related amounts of revenues (sales) and expenses and disclosure of contingent assets and liabilities. Significant areas requiring the use of management estimates relate to the sales contract assumptions, determination of pension and other employee benefits, reserves for environmental matters, asset retirement obligations, the useful life of assets for amortization and evaluation of net recoverable amount, the determination of fair value of assets acquired and liabilities assumed in business combinations, implied fair value of goodwill, income tax and the determination of the fair value of financial instruments. Actual results could differ from these estimates.
Translation of foreign currency
The functional currency of Héroux-Devtek Inc. and the Canadian operations is the Canadian dollar and; the functional currency of the U.S. operations is the U.S. dollar.
The assets and liabilities of foreign subsidiaries are translated at the exchange rate in effect at the balance sheet dates. Revenues and expenses are translated at the average exchange rate for the year. Translation gains and losses are deferred and shown separately in shareholders’ equity as accumulated other comprehensive income (loss).
Foreign currency transactions are translated using the temporary method. Under this method, monetary balance sheet items are translated into Canadian dollars at the exchange rate in effect at the balance sheet dates. Revenues (sales) and expenses are translated using the average exchange rates prevailing during each month of the year. Translation gains and losses are included in the consolidated statements of income.

A N N U A L R E P O R T 2 0 1 0 - 2 0 1 1 3 9
NOTES TO CONSOLIDATED FINANCIAL STATEMENTSFOR THE YEARS ENDED MARCH 31, 2011 AND 2010 (ALL DOLLAR AMOUNTS IN THOUSANDS OF CANADIAN DOLLARS, EXCEPT SHARE DATA)
NOTE 2. SUMMARY OF SIGNIFICANT ACCOUNTING POLICIES (cont’d)
Financial instruments
Financial instruments are recognized on the consolidated balance sheets when the Corporation becomes a party to the contractual provisions of the financial instrument. On initial recognition, all financial instruments including embedded derivative financial instruments that are not closely related to the host contract are measured at fair value. After initial recognition, the measurement of financial instruments depends on their classification, which could include the following: held-for-trading (“HFT“), available-for-sale (“AFS“), loans and receivables (“L&R“), held-to-maturity (“HTM“) or other than HFT liabilities.
Financial assets and financial liabilities classified as HFT are measured at fair value, with gains and losses recognized to income for the period during which they arise. Financial assets classified as L&R or HTM and financial liabilities classified as other than HFT liabilities are measured at amortized cost using the effective interest rate method.
Financial assets classified as AFS are measured at fair value. Unrealized gains and losses including changes in foreign exchange rates are recognized directly to other comprehensive income (loss) (“OCI”), except for impairment losses, which are recognized to income, until the financial assets are derecognized, at which time the cumulative gains or losses previously recognized in accumulated OCI are recognized in income for the year.
During fiscal 2011 and 2010, the Corporation made the following classifications:
Derivative financial instruments
In accordance with its risk management policy, the Corporation uses derivative financial instruments to manage its foreign currency and interest rate exposures. These derivative financial instruments are measured at fair value, including derivatives that are embedded in financial or non-financial contracts that are not closely related to the host contract. Management is responsible for establishing standards of acceptable risks and monitoring, as appropriate, the transactions covering these risks. The Corporation uses financial instruments for the sole purpose of hedging existing commitments or obligations. These derivative financial instruments are not used for trading purposes.
The Corporation has designated forward foreign exchange contracts and interest-rate swap agreements as cash flow hedges. In a cash flow hedge relationship, a change in fair value of these derivatives is recognized as a component of OCI to the extent that the hedging relationship is effective. The ineffective portion of the hedging relationship and changes in fair value of derivatives not designated as a cash flow hedge, including embedded derivatives, are recognized as gains and losses in net income. The amount recognized in OCI is transferred to net income, and recorded as an adjustment of the cost or revenue of the related hedged item when realized.
Hedge of net investments in self-sustaining foreign operations
The Corporation designates certain long-term debt as hedges of its net investments in self-sustaining foreign operations. The portion of gains or losses on the hedging item that is determined to be an effective hedge is recognized in OCI, while the ineffective portion is recorded in net income. The amounts recognized in OCI are reclassified to net income when corresponding exchange gains or losses arising from the translation of the self-sustaining foreign operations are recorded in net income.
Cash and cash equivalents
Cash and cash equivalents consist of cash and highly liquid investments held with investment grade financial institutions, with maturities of three months or less from the date of acquisition.

4 0 H É R O U X - D E V T E K
NOTES TO CONSOLIDATED FINANCIAL STATEMENTSFOR THE YEARS ENDED MARCH 31, 2011 AND 2010 (ALL DOLLAR AMOUNTS IN THOUSANDS OF CANADIAN DOLLARS, EXCEPT SHARE DATA)
NOTE 2. SUMMARY OF SIGNIFICANT ACCOUNTING POLICIES (cont’d)
Inventory valuation, capitalized development costs, cost of sales and revenue recognition
[a] Inventory valuation, capitalized development costs and cost of sales
Inventories include raw materials, direct labour and related manufacturing overhead costs and include, if applicable, the amount of amortization of the non-recurring costs of the related sales contracts. These non-recurring costs represent essentially direct design engineering costs, direct manufacturing engineering costs, other direct pre-production costs (test units, prototypes, and other related costs) and tooling costs which are recorded and amortized on the following basis:
NON-RECURRING
COSTS
RECORDED IN THE
BALANCE SHEETS AS
AMORTIZATION
METHOD
Direct design engineering costs Finite-life intangible assets – capitalized development costs
Predetermined contract quantity
Direct manufacturing engineering costs Finite-life intangible assets – capitalized development costs
Predetermined contract quantity
Other direct pre-production costs Finite-life intangible assets – capitalized development costs
Predetermined contract quantity
Tooling costs related to sales contracts Property, plant and equipment Predetermined contract quantity but not exceeding ten (10) years.
Other tooling costs Property, plant and equipment Straight-line basis over five (5) years.
Contract quantities are established based on management’s assessment at the beginning of the production stage for each contract, taking into consideration, among other factors, existing firm orders and options. The Corporation’s management conducts quarterly reviews as well as a detailed annual review, in the fourth quarter, of its capitalized development costs related to sales contracts and their recoverability, and contract quantities.
Inventories consist of raw materials, work in progress and finished goods which are valued at the lower of cost (unit cost method) and net realizable value. The unit cost method is the cost method under which the actual production costs are charged to each unit produced and recognized to income as the unit is delivered.
Progress billings received from customers are deducted from related costs in inventories. Progress billings received in excess of related costs in inventories, if any, are classified as Customers’ advances in accounts payable - other.
[b] Revenue recognition
Revenues from the sale of aerospace and industrial products are recognized as the related units are delivered and collectability is reasonably assured.
Provisions for losses on contract, if any, are made as soon as it is determined that total estimated contract costs are expected to exceed the total contract revenue, and are recorded in accounts payable and accrued liabilities.

A N N U A L R E P O R T 2 0 1 0 - 2 0 1 1 4 1
NOTES TO CONSOLIDATED FINANCIAL STATEMENTSFOR THE YEARS ENDED MARCH 31, 2011 AND 2010 (ALL DOLLAR AMOUNTS IN THOUSANDS OF CANADIAN DOLLARS, EXCEPT SHARE DATA)
NOTE 2. SUMMARY OF SIGNIFICANT ACCOUNTING POLICIES (cont’d)
Long-lived assets
Long-lived assets consist of property, plant and equipment and finite-life intangible assets which include capitalized development costs (see above). Long-lived assets held for use are reviewed for impairment when certain events or changes in circumstances indicate that the carrying amount of an asset may not be recoverable. The recoverability test is performed using undiscounted future cash flows that are directly associated with the assets’ use and eventual disposition. The amount of the impairment, if any, is measured as the difference between the carrying value and the fair value of the impaired assets and presented as an additional current-period amortization expense.
Long-lived assets are recorded at cost and amortization is provided for on a straight-line basis, except for the backlog which is amortized on a pro rata basis over the life of the related sales contracts, and the units delivered, over the estimated useful lives of the related assets, as follows:
Buildings and leasehold improvements 5 to 40 years
Machinery, equipment and tooling 3 to 15 years
Machinery and equipment held under capital lease 3 to 15 years
Automotive equipment 3 to 10 years
Computer and office equipment 3 to 5 years
Finite-life intangible assets
- Software-related costs 3 to 5 years
- Backlog Based on the life of the related sales contracts and units delivered
Amortization of construction in progress begins when they are ready for their intended use.
Government assistance
Government assistance, including investment and other tax credits and the discounted portion of the governmental authorities loans, is recorded as a reduction of the related capital expenditures, capitalized development costs, inventory or expenses when there is reasonable assurance that the assistance will be received.
In fiscal year 2011, the Corporation recorded as a reduction of cost of sales an amount of $2,384 ($5,395 in 2010) and as a reduction of the related capital expenditures or capitalized development costs an amount of $3,903 ($2,083 in 2010) for government assistance.
Asset retirement obligations
The Corporation’s asset retirement obligations represent essentially environmental rehabilitation costs related to the Corporation’s manufacturing plant. The fair value of these obligations is measured in the year during which they are incurred when a reasonable estimate of their fair value can be made. The fair value of the obligations was determined as the sum of the estimated discounted future cash flows of the legal obligations associated with the future retirement of these rehabilitation costs. The retirement costs of these assets are capitalized as part of the property, plant and equipment and amortized over the relevant assets’ useful lives, while changes to the present value of the obligations are charged to income.
As of March 31, 2011, a provision of $4,202 ($4,653 as of March 31, 2010) is included in the Corporation’s other liabilities and $1,164 ($627 in 2010) in accounts payable and accrued liabilities based on management’s estimate of the total discounted future cash flows using a rate of 4.5% (4.5% in 2010). During fiscal 2011, an accretion expense of $240 was recorded ($228 in 2010) in financial expenses (see Note 17).
Goodwill
Goodwill represents the excess of the purchase price, including acquisition costs up to March 31, 2009, over the fair value of the identifiable net assets acquired. Goodwill is tested for impairment annually, or more frequently if events or circumstances, such as significant declines in expected cash flows, indicate that it is more likely than not that the asset might be impaired. Goodwill is considered to be impaired when the carrying value of a reporting unit, including the allocated goodwill, exceeds its fair value.

4 2 H É R O U X - D E V T E K
NOTES TO CONSOLIDATED FINANCIAL STATEMENTSFOR THE YEARS ENDED MARCH 31, 2011 AND 2010 (ALL DOLLAR AMOUNTS IN THOUSANDS OF CANADIAN DOLLARS, EXCEPT SHARE DATA)
NOTE 2. SUMMARY OF SIGNIFICANT ACCOUNTING POLICIES (cont’d)
Goodwill (cond’t)
The Corporation evaluates the recoverability of goodwill using a two-step test approach at the reporting unit level. In the first step, the fair value of the reporting unit, based upon discounted future cash flows, is compared to its net carrying amount. If the fair value is greater than the carrying amount, no impairment is deemed to exist and the second step is not required to be performed. If the fair value is less than the carrying amount, a second test must be performed whereby the implied fair value of the reporting unit’s goodwill must be estimated. The implied fair value of goodwill is the excess of the fair value of the reporting unit over the fair value of the identifiable net assets of the reporting unit. The carrying value of goodwill in excess of its implied fair value is charged to income.
Deferred financing costs
Deferred financing costs, which are associated with the long-term debt, are amortized using the effective interest rate method and their unamortized portion is shown as a reduction of long-term debt.
Pension and other retirement benefit plans
the projected benefit method prorated on services for the other plans (which incorporate management’s best estimate of future salary levels, when applicable, other cost escalations, retirement ages of employees and other actuarial factors).
long-term rate of return on plan assets for that period and from changes in actuarial assumptions used to determine the accrued benefit obligation. The excess of the net accumulated actuarial gain (loss) over 10% of the greater of the benefit obligation and the fair value of plan assets is amortized over the average remaining service period of active employees. The weighted-average remaining service period of the active employees is 15 years for 2011 and 2010.
period of active employees at the date of amendment.
method. The Corporation is amortizing the transitional obligation on a straight-line basis over 17 years, which was the weighted-average remaining service period of employees expected to receive benefits under the benefit plans as of April 1, 2000.
for prior to the settlement.
Income taxes
Income taxes are provided for using the liability method. Under this method, future income tax assets and liabilities are determined based on all significant differences between the carrying amounts and tax bases of assets and liabilities using substantively enacted tax rates and laws, which will be in effect for the year during which the differences are expected to reverse.
A valuation allowance is recorded to reduce the carrying amount of future income tax assets, when it is more likely than not, that such assets will not be realized.
Earnings per share
The earnings per share amounts are determined using the weighted-average number of shares outstanding during the year. The treasury stock method is used to calculate diluted earnings per share giving effect to the exercise of all dilutive elements. This method assumes that the proceeds of the Corporation’s in-the-money stock options would be used to purchase common shares at the average market price during the year.

A N N U A L R E P O R T 2 0 1 0 - 2 0 1 1 4 3
NOTES TO CONSOLIDATED FINANCIAL STATEMENTSFOR THE YEARS ENDED MARCH 31, 2011 AND 2010 (ALL DOLLAR AMOUNTS IN THOUSANDS OF CANADIAN DOLLARS, EXCEPT SHARE DATA)
NOTE 2. SUMMARY OF SIGNIFICANT ACCOUNTING POLICIES (cont’d)
Stock-based compensation and other stock-based payments
The Corporation has a stock option plan where options to purchase common shares are issued essentially to officers and key employees. The Corporation uses the binomial valuation model to determine the fair value of stock options, and expenses all granting of stock options based on their earned period. The related compensation expense is included in selling and administrative expenses and its counterpart is accounted for in the Corporation’s contributed surplus.
The Corporation has a stock purchase and ownership incentive plan allowing key management employees to subscribe, by salary deduction, to a number of common shares issued by the Corporation. The common share issuance is accounted for in the Corporation’s capital stock. Also, the Corporation matches 50% of the employee’s contribution, which cannot exceed 10% of the employee’s annual base salary, by awarding to the employee, additional common shares acquired on the Toronto Stock Exchange (TSX) at market price. However, the Corporation’s matching award cannot exceed 4% of the employee’s annual base salary. Common shares purchased by the Corporation on behalf of the employee are accounted for as a compensation expense which is included in the Corporation’s selling and administrative expenses.
The Corporation has a stock appreciation right (SAR) plan where rights are issued to its non-employee directors. The SAR enables the participants to receive by way of bonus, on the exercise date of a SAR, a cash amount equal to the excess of the market price of a common share on the exercise date of the SAR over the granted price of the SAR. The SARs are expensed on an earned basis and their costs are determined based on the quoted market value of the Corporation’s common shares over their granted value. The related compensation expense is included in selling and administrative expenses and its counterpart is accounted for in the Corporation’s accounts payable and accrued liabilities until the SARs are exercised or cancelled.
In August 2010, the Board of Directors decided not to continue the SAR plan and replaced it with a deferred share unit (DSU) plan (see below), which was effectively approved, subsequent to the last fiscal year-end, in May 2011.
Since May 2011, the Corporation has a DSU, which replaced the stock appreciation right plan (see above), under which rights are issued to its non-employee directors. The DSU enables the participants to receive a remuneration, but only at the termination date, as a member of the Board of Directors, a cash amount equal to the market price of the Corporation’s common share for each DSU.
These DSUs are expensed on an earned basis and their costs are determined, on the basis of the Corporation’s common shares quoted market value. Each director can also elect, each fiscal year, to have up to 50% of his director’s annual retainer fees converted into DSUs. These DSUs will be vested over a one-year period. The related compensation expense is included in selling and administrative expenses and its counterpart is accounted for in the Corporation’s accounts payable and accrued liabilities.
Environmental obligations
Environmental liabilities are recorded when environmental claims or remedial efforts are probable, and the costs can be reasonably estimated. Environmental costs that relate to current operations are expensed or capitalized, as appropriate. Environmental costs of a capital nature that extend the life, increase the capacity or improve the safety of an asset or that mitigate or prevent environmental contamination that has yet to occur are included in property, plant and equipment and are generally amortized over the remaining useful life of the underlying asset. Costs that relate to an existing condition caused by past operations, and which do not contribute to future revenue generation, are expensed.

4 4 H É R O U X - D E V T E K
NOTES TO CONSOLIDATED FINANCIAL STATEMENTSFOR THE YEARS ENDED MARCH 31, 2011 AND 2010 (ALL DOLLAR AMOUNTS IN THOUSANDS OF CANADIAN DOLLARS, EXCEPT SHARE DATA)
NOTE 2. SUMMARY OF SIGNIFICANT ACCOUNTING POLICIES (cont’d)
Future changes in accounting policies
International Financial Reporting Standards (“IFRS”)
Canadian GAAP for most publicly accountable entities will be changed to IFRS effective in calendar year 2011. IFRS uses a conceptual framework similar to Canadian GAAP, but there are significant differences in recognition, measurement and disclosures. First reporting under IFRS is required for the Corporation’s interim and annual financial statements beginning on April 1, 2011. IFRS 1, “First-time Adoption of International Financial Reporting Standards”, requires a first-time adopter to retrospectively apply all IFRS effective as at the end of its first annual reporting period. For more details on the Corporation’s IFRS conversion, refer to the IFRS conversion section of the Management Discussion and Analysis for the fiscal year ended March 31, 2011.
NOTE 3. BUSINESS ACQUISITION
On April 28, 2010, the Corporation announced that it had concluded the acquisition through a U.S. subsidiary of substantially all the net assets of U.S. based Eagle Tool & Machine Co. and of its subsidiary, All Tools, Inc. (E-2 Precision Products), two privately-owned manufacturers of precision machined products mainly for the military aerospace industry, with annual sales of approximately $40,000, based on their last financial year ended December 31, 2009 and of $45,044 since the acquisition this year.
The final allocation of the total purchase price of the net assets acquired, along with the source of funds, can be broken down as follows:
NET ASSETS ACQUIRED SOURCE OF FUNDS
Working capital $ 16,797 Credit Facilities $ 16,711Property, plant and equipment 8,498 Cash 12,102Backlog 1,390 Promissory note 3,721Goodwill 5,849 $ 32,534 $ 32,534
The identifiable intangible assets related to the business acquisition, which amounted to $1,390, was attributed to the backlog. The backlog value was determined using a discounted cash flow method. The excess of the purchase price over the fair value of the net tangible assets acquired and the acquired backlog amounted to $5,849.
The promissory note is repayable to the seller over 40 months, starting on April 30, 2010, bears a fixed interest rate of 5% and is guaranteed by the Corporation. The underlying value of the backlog which relates to specific sales contracts is amortized on a pro rata basis over the life of the related sales contracts and units delivered.

A N N U A L R E P O R T 2 0 1 0 - 2 0 1 1 4 5
NOTES TO CONSOLIDATED FINANCIAL STATEMENTSFOR THE YEARS ENDED MARCH 31, 2011 AND 2010 (ALL DOLLAR AMOUNTS IN THOUSANDS OF CANADIAN DOLLARS, EXCEPT SHARE DATA)
NOTE 4. FINANCIAL RISK MANAGEMENT
The Corporation is exposed primarily to market risk, credit and credit concentration risk, and liquidity risk as a result of holding financial instruments.
Market risk Risk that the fair value or future cash flows of financial instruments will fluctuate because of changes in market prices, whether those changes are caused by factors specific to the individual financial instruments or its issuer, or factors affecting all similar financial instruments traded in the market. The Corporation is primarily exposed to the following market risks:
Credit and credit concentration risks
Credit risk – Risk that one party to a financial instrument will cause a financial loss for the other party by failing to discharge its obligation.
Credit concentration risk – Risk that the business is concentrated on a limited number of customers and financial institutions, which could cause an increased credit risk as defined above.
Liquidity risk Risk that the Corporation will encounter difficulty in meeting obligations associated with financial liabilities.
Market risk
Foreign exchange risk
The Corporation is exposed to risks resulting from foreign currency fluctuations arising either from carrying on business in Canada in foreign currencies or through operations in the United States. Based on the fiscal year ended March 31, 2011, the Corporation’s sales made and costs incurred from its Canadian and American operations and in the related currencies were as follows (calculated based on the Corporation’s total consolidated sales and costs):
CANADIAN OPERATIONS U.S. OPERATIONS TOTAL
Sales Costs Sales Costs Sales Costs
U.S. Currency 45% 22% 37% 40% 82% 62%
Canadian Currency 18% 38% — — 18% 38%
% of Consolidated Sales/Costs 63% 60% 37% 40% 100% 100%
The total financial instruments denominated in U.S. dollars(1) in the Corporation’s consolidated balance sheets, as at March 31, 2011 and 2010, are as follows:
2011 2010
Current financial assets $ 75,681 $ 63,565 Long-term financial assets 212 —
Total financial assets $ 75,893 $ 63,565 Current financial liabilities $ 29,541 $ 18,516Long-term financial liabilities 64,921 48,158
Total financial liabilities $ 94,462 $ 66,674
(1) Does not include the derivative financial instruments related to forward foreign exchange contracts.

4 6 H É R O U X - D E V T E K
NOTES TO CONSOLIDATED FINANCIAL STATEMENTSFOR THE YEARS ENDED MARCH 31, 2011 AND 2010 (ALL DOLLAR AMOUNTS IN THOUSANDS OF CANADIAN DOLLARS, EXCEPT SHARE DATA)
NOTE 4. FINANCIAL RISK MANAGEMENT (cont’d)
Market risk (cont’d)
In an effort to mitigate the foreign currency fluctuation exposure on sales, the Corporation makes use of derivative contracts to hedge this exposure, essentially to the U.S. currency and arising from its Canadian operations.
The Corporation’s foreign exchange policy requires the hedging of 50% to 75%, on average, of the identified foreign currency exposure, mainly over the next two fiscal years, of the forecasted cash inflows generated by sales in U.S. currency made by its Canadian operations and related to long-term sales contracts, net of the forecasted cash outflows in U.S. currency made by its Canadian operations and related essentially to raw material and certain other material costs. This hedging policy also applies to the net forecasted cash inflows/outflows as described above, for certain specific long-term sales contracts, on a very limited basis, for an additional period of one to three fiscal years.
As at March 31, 2011, the Corporation, in accordance with the foreign exchange policy explained above, had forward foreign exchange contracts totalling US$159.0 million at a weighted-average rate of 1.1032 (Canadian dollar over U.S. dollar, “cad/usd”) (US$150.0 million at a weighted-average rate of 1.1436 cad/usd as at March 31, 2010) maturing over the next four fiscal years, with the majority maturing over the next two fiscal years.
At March 31, 2011, the Corporation had also entered into forward foreign exchange contracts totalling US$7.7 million at a weighted-average rate of 1.2343 (US$11.3 million at a weighted-average rate of 1.2396 at March 31, 2010) maturing over the next three fiscal years, with the majority maturing in the 2014 fiscal year, to cover foreign exchange risk related to certain embedded derivatives.
The foreign exchange rate sensitivity is calculated by aggregation of the net foreign exchange rate exposure of the Corporation’s financial instruments including the above-mentioned forward foreign exchange contracts as at the consolidated balance sheets dates. As at March 31, 2011, a 1% strengthening of the Canadian dollar over the U.S. currency, while all other variables would remain fixed, would have decreased consolidated net income by $186 ($213 in 2010) and decreased comprehensive income by $555 ($447 in 2010) while a 1% reduction would have had an opposite impact of essentially the same amounts.
Interest rate risk
The Corporation is exposed to interest rate fluctuations primarily due to its variable interest rate on its long-term debt’s Bank Credit Facility (see Note 17 to the consolidated financial statements). In addition, the interest rate fluctuations could also have an impact on the Corporation’s interest income which is derived from its cash and cash equivalents.
The Corporation’s interest rate policy generally requires maintaining an appropriate mix of fixed and variable interest rates debt to mitigate the net impact of fluctuating interest rate.
In March 2011, following the renewal of the Corporation’s Credit Facility and in order to limit the effect of interest rate variations over a portion of its long-term debt denominated in U.S. currency in accordance with the Corporation’s risk management policy, the Corporation entered into three interest-rate swap agreements for a total amount of US$40 million and repurchased for a cost of $0.4 million, the two interest rate swap agreements outstanding in March 2011 and related to the previous credit facilities. The new agreements which fix the Libor U.S. rate at 3.90% for an amount of US$20 million and at 3.91% for another amount of US$20 million, will mature in December 2015.
The interest rate risk sensitivity is calculated on the floating rate liability at the end of the year. Assuming a 100-basis point increase/decrease in the interest rate as at March 31, 2011, while all other variables would remain fixed, this would have reduced/increased the Corporation’s consolidated net income for the year then ended by $138 ($126 in 2010). For the derivative financial instruments (interest-rate swap agreements), a shift of 100-basis point increase in the yield curve, as of March 31, 2011, would have increased the Corporation’s comprehensive income for the year then ended by $1,173 ($227 in 2010) while a 100-basis point decrease would have reduced it by $1,229 ($230 in 2010).
Credit and credit concentration risks
The credit and credit concentration risks represent counterparty risks where the parties with which the Corporation enters into the related agreements or contracts could be unable to fulfill their commitments.
Credit risk is primarily related to the potential inability of customers to discharge their obligations with regards to the Corporation’s accounts receivable and, of financial institutions with regards to the Corporation’s cash and cash equivalents and derivative financial instruments.
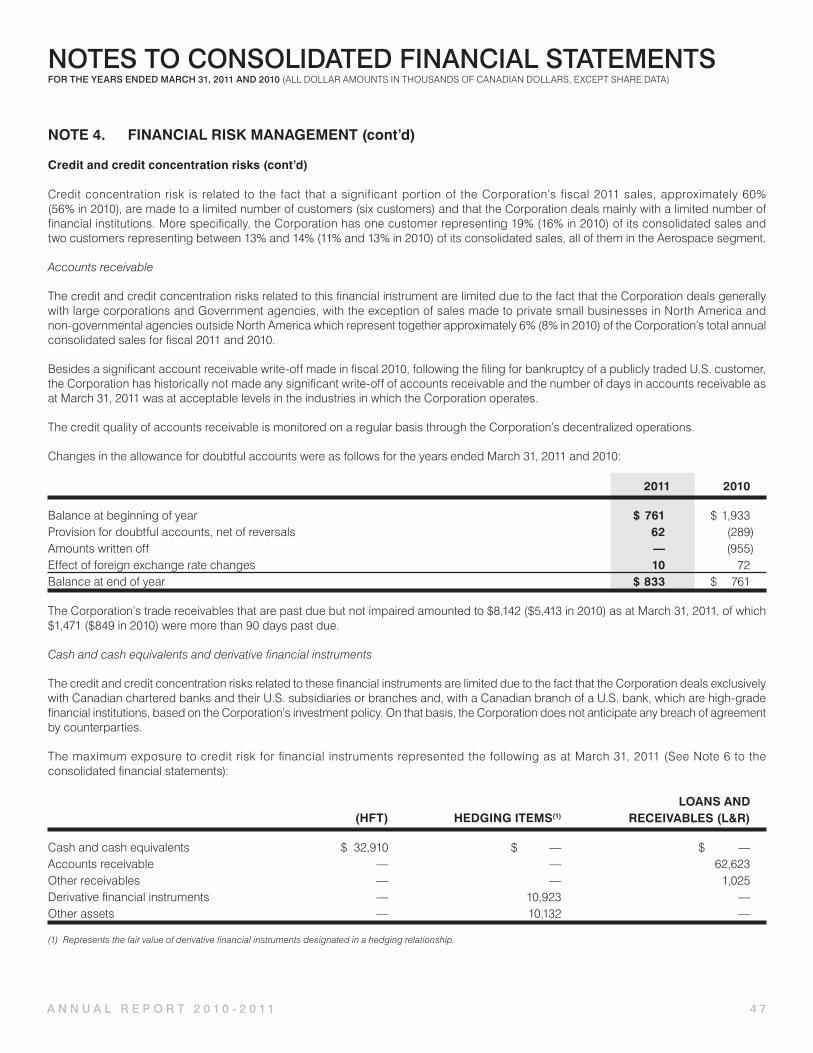
A N N U A L R E P O R T 2 0 1 0 - 2 0 1 1 4 7
NOTES TO CONSOLIDATED FINANCIAL STATEMENTSFOR THE YEARS ENDED MARCH 31, 2011 AND 2010 (ALL DOLLAR AMOUNTS IN THOUSANDS OF CANADIAN DOLLARS, EXCEPT SHARE DATA)
NOTE 4. FINANCIAL RISK MANAGEMENT (cont’d)
Credit and credit concentration risks (cont’d)
Credit concentration risk is related to the fact that a significant portion of the Corporation’s fiscal 2011 sales, approximately 60% (56% in 2010), are made to a limited number of customers (six customers) and that the Corporation deals mainly with a limited number of financial institutions. More specifically, the Corporation has one customer representing 19% (16% in 2010) of its consolidated sales and two customers representing between 13% and 14% (11% and 13% in 2010) of its consolidated sales, all of them in the Aerospace segment.
Accounts receivable
The credit and credit concentration risks related to this financial instrument are limited due to the fact that the Corporation deals generally with large corporations and Government agencies, with the exception of sales made to private small businesses in North America and non-governmental agencies outside North America which represent together approximately 6% (8% in 2010) of the Corporation’s total annual consolidated sales for fiscal 2011 and 2010.
Besides a significant account receivable write-off made in fiscal 2010, following the filing for bankruptcy of a publicly traded U.S. customer, the Corporation has historically not made any significant write-off of accounts receivable and the number of days in accounts receivable as at March 31, 2011 was at acceptable levels in the industries in which the Corporation operates.
The credit quality of accounts receivable is monitored on a regular basis through the Corporation’s decentralized operations.
Changes in the allowance for doubtful accounts were as follows for the years ended March 31, 2011 and 2010:
2011 2010
Balance at beginning of year $ 761 $ 1,933 Provision for doubtful accounts, net of reversals 62 (289)Amounts written off — (955)Effect of foreign exchange rate changes 10 72Balance at end of year $ 833 $ 761
The Corporation’s trade receivables that are past due but not impaired amounted to $8,142 ($5,413 in 2010) as at March 31, 2011, of which $1,471 ($849 in 2010) were more than 90 days past due.
Cash and cash equivalents and derivative financial instruments
The credit and credit concentration risks related to these financial instruments are limited due to the fact that the Corporation deals exclusively with Canadian chartered banks and their U.S. subsidiaries or branches and, with a Canadian branch of a U.S. bank, which are high-grade financial institutions, based on the Corporation’s investment policy. On that basis, the Corporation does not anticipate any breach of agreement by counterparties.
The maximum exposure to credit risk for financial instruments represented the following as at March 31, 2011 (See Note 6 to the consolidated financial statements):
LOANS AND (HFT) HEDGING ITEMS(1) RECEIVABLES (L&R)
Cash and cash equivalents $ 32,910 $ — $ — Accounts receivable — — 62,623Other receivables — — 1,025Derivative financial instruments — 10,923 —Other assets — 10,132 —
(1) Represents the fair value of derivative financial instruments designated in a hedging relationship.

4 8 H É R O U X - D E V T E K
NOTES TO CONSOLIDATED FINANCIAL STATEMENTSFOR THE YEARS ENDED MARCH 31, 2011 AND 2010 (ALL DOLLAR AMOUNTS IN THOUSANDS OF CANADIAN DOLLARS, EXCEPT SHARE DATA)
NOTE 4. FINANCIAL RISK MANAGEMENT (cont’d)
Liquidity risk
The Corporation is exposed to the risk of being unable to honour its financial commitments by the deadlines set and under the terms of such commitments and at a reasonable price. The Corporation manages its liquidity risk by forecasting cash flows from operations and anticipated investing and financing activities. Senior management is also actively involved in the review and approval of long-term sales contracts and planned capital expenditures.
The maturity analysis of financial liabilities represented the following as at March 31, 2011 and includes the Corporation’s Senior Credit Facility negotiated and contracted solely with Canadian chartered banks and their U.S. subsidiaries or branches and, with a Canadian branch of a U.S. bank (See Note 6):
LESS THAN 1 TO 3 4 TO 5 OVER 1 YEAR YEARS YEARS 5 YEARS TOTAL
Accounts payable and accrued liabilities $ 54,876 $ — $ — $ — $ 54,876Accounts payable – other 4,980 — — — 4,980Long-term debt (2) 5,995 14,405 70,989 (1) 23,751 115,140Other liabilities 1,158 — — — 1,158
(1) Includes the used Bank’s Credit Facility of $57,691 maturing on March 15, 2016.
(2) Includes interest accretion on governmental authorities loans.
NOTE 5. CAPITAL RISK MANAGEMENT
The general objectives of the Corporation’s management, in terms of capital management, reside essentially in the preservation of the Corporation’s capacity to continue operating, to continue providing benefits to its stakeholders and also, in providing an adequate return on investment to its shareholders by selling its products and services at a price commensurate with the level of operating risk assumed by the Corporation.
The Corporation thus determines the total amount of capital required consistent with risk levels. This capital structure is adjusted on a timely basis depending on changes in the economic environment and risk characteristics of the underlying assets.
In order to maintain or adjust its capital structure, the Corporation can:
in the near future).
In the Corporation’s current activity sectors involving long-term contracting and major capital expenditures, the total cash flows generated by the Corporation must be consistent with its net debt-to-equity ratio and comparable with widespread practices in these sectors. This net debt-to-equity ratio, represented by net debt divided by shareholders’ equity, is the overriding factor in the Corporation’s capital management and monitoring practices.

A N N U A L R E P O R T 2 0 1 0 - 2 0 1 1 4 9
NOTES TO CONSOLIDATED FINANCIAL STATEMENTSFOR THE YEARS ENDED MARCH 31, 2011 AND 2010 (ALL DOLLAR AMOUNTS IN THOUSANDS OF CANADIAN DOLLARS, EXCEPT SHARE DATA)
NOTE 5. CAPITAL RISK MANAGEMENT (cont’d)
The net debt is equal to total debt representing the current portion of long-term debt and long-term debt, less cash and cash equivalents. Shareholders’ equity includes capital stock, contributed surplus, accumulated other comprehensive income (loss) and retained earnings. In some cases, shareholders’ equity may be adjusted by amounts recorded in accumulated other comprehensive income (loss), particularly those related to cash flow hedges, depending on their nature and materiality. Moreover, in some cases and for the same reasons as those indicated above, total debt and shareholders’ equity may be adjusted by the amount of subordinated or unsecured loans and off-balance sheet items.
During fiscal 2011, the Corporation pursued the same capital management strategy as last year, which consists in generally maintaining a sufficient net debt-to-equity ratio, so as to allow access to financing at a reasonable or acceptable cost in relation to risk taken.
2011 2010
Current portion of long-term debt $ 5,136 $ 4,250Long-term debt 94,376 76,807 Less: Cash and cash equivalents (32,910) (46,591) $ 66,602 $ 34,466Shareholders’ equity 232,665 217,092Net debt-to-equity ratio 0.29:1 0.16:1
Moreover, the Corporation is not subject to any regulatory capital requirements and the Corporation’s capital management has not changed since the prior year.
NOTE 6. FINANCIAL INSTRUMENTS
The classification of financial instruments and their carrying amounts and fair values as at March 31, 2011 and 2010, were as follows:
MARCH 31, 2011 MARCH 31, 2010
Carrying value Fair Value Carrying value Fair Value
Hedging Hedging HFT L&R items Total (1) HFT L&R items Total (1)
Financial assetsCash and cash equivalents $ 32,910 $ — $ — $ 32,910 $ 32,910 $ 46,591 $ — $ — $ 46,591 $ 46,591Accounts receivable(2) — 62,623 — 62,623 62,623 — 39,085 — 39,085 39,085Other receivables(3) — 1,025 — 1,025 1,025 — 540 — 540 540Derivative financial instruments — — 10,923 10,923 10,923 — — 7,568 7,568 7,568Other assets — — 10,132 10,132 10,132 — — 12,408 12,408 12,408 $32,910 $63,648 $21,055 $117,613 $117,613 $46,591 $39,625 $19,976 $106,192 $106,192
(1) Represents only the carrying values of financial assets and liabilities included in the corresponding balance sheet caption.
(2) Comprising trade receivables.
(3) Comprising certain other receivables.

5 0 H É R O U X - D E V T E K
NOTES TO CONSOLIDATED FINANCIAL STATEMENTSFOR THE YEARS ENDED MARCH 31, 2011 AND 2010 (ALL DOLLAR AMOUNTS IN THOUSANDS OF CANADIAN DOLLARS, EXCEPT SHARE DATA)
NOTE 6. FINANCIAL INSTRUMENTS (cont’d)
MARCH 31, 2011 MARCH 31, 2010
Carrying value Fair Value Carrying value Fair Value
Other Other than Hedging than Hedging HFT HFT items Total (1) HFT HFT items Total (1)
Financial liabilities Accounts payable and accrued liabilities(5) $— $ 54,876 $ — $ 54,876 $ 54,876 $— $ 44,493 $ — $ 44,493 $ 44,493Accounts payable – other (4) — 4,128 852 4,980 4,980 — 613 2,021 2,634 2,634Long-term debt, including current portion — 101,227 — 101,227 102,865 — 81,407 — 81,407 82,988Long-term liabilities – Other liabilities(6) — — 1,158 1,158 1,158 — — 1,716 1,716 1,716 $— $160,231 $2,010 $162,241 $163,879 $— $126,513 $3,737 $130,250 $131,831
(4) Includes the fair value of short-term derivative financial instruments.
(5) Comprising trade accounts payable and accrued liabilities, including interest and certain payroll-related liabilities.
(6) Includes the fair value of long-term derivative financial instruments.
Fair value of financial instruments
The carrying amount of cash and cash equivalents (classified as HFT), accounts receivable and other receivables (classified as L&R), accounts payable and accrued liabilities and, accounts payable – other (classified as Other than HFT) approximates their fair value since these items will be realized within one year or are collectible or due on demand.
The fair value of long-term debt (classified as other than HFT) is estimated based on valuation models, using the discounted cash flows method in accordance with current financing arrangements. The discount rates used correspond to prevailing market rates for debt with similar terms and conditions.
Derivative financial instruments
The Corporation has considered the following value hierarchy that reflects the significance of the inputs used in measuring these financial instruments accounted for at fair value in the consolidated balance sheets:
directly or indirectly;
The fair value of derivative financial instruments and embedded derivative financial instruments in the consolidated balance sheets is established by the Corporation’s valuation models. These models project future cash flows and discount the future amounts to a present value using the contractual terms of the derivative instrument and factors observable in external markets data, such as interest rates, currency rates and price and rate volatilities, as applicable (Level 2 inputs). It also takes into account the credit quality of the financial instruments.
No profit or loss was accounted for fiscal years 2011 and 2010 on financial instruments designated as HFT, except for the interest income as disclosed in note 17 to the consolidated financial statements.

A N N U A L R E P O R T 2 0 1 0 - 2 0 1 1 5 1
NOTES TO CONSOLIDATED FINANCIAL STATEMENTSFOR THE YEARS ENDED MARCH 31, 2011 AND 2010 (ALL DOLLAR AMOUNTS IN THOUSANDS OF CANADIAN DOLLARS, EXCEPT SHARE DATA)
NOTE 7. SELLING AND ADMINISTRATIVE EXPENSES
Foreign exchange gains or losses resulting from the translation of net monetary items denominated in foreign currencies are included in the Corporation’s selling and administrative expenses. In fiscal 2011, the foreign exchange loss included in the Corporation’s selling and administrative expenses amounted to $420 (loss of $1,102 in 2010).
NOTE 8. RESTRUCTURING CHARGES
On May 13, 2010, the Corporation launched an initiative to optimize and consolidate production capacity in its Aerospace segment, while further enhancing productivity at its Québec-based facilities. Consequently, the Corporation’s Rivière-des-Prairies, Québec facility was closed in September 2010 and its production was transferred to the Corporation’s other facilities in the Greater Montreal area. This year, the Corporation recorded restructuring charges of $637 representing $454 net of income taxes. The Corporation does not expect any significant additional restructuring charges related to the closure of this facility. As at March 31, 2011, the building related to this facility was reclassified in other assets as asset held for sale in the consolidated balance sheets.
NOTE 9. OTHER RECEIVABLES
Other receivables consist of:
2011 2010
Investment and other tax credits receivable $ 8,427 $ 8,096 Sales tax receivable 1,713 1,195Deposits on machinery and equipment (Note 23) 223 772Others 1,877 1,111 $ 12,240 $ 11,174
NOTE 10. INVENTORIES
Inventories consist of:
2011 2010
Raw materials $ 51,615 $ 47,327 Work in progress and finished goods 83,222 69,413Less: Progress billings 33,365 32,332 $ 101,472 $ 84,408
The amount of inventories recognized as cost of sales for fiscal years 2011 and 2010 is detailed as follows:
2011 2010
Aerospace segment $ 258,834 $ 228,661Industrial segment 18,106 15,409 $ 276,940 $ 244,070

5 2 H É R O U X - D E V T E K
NOTES TO CONSOLIDATED FINANCIAL STATEMENTSFOR THE YEARS ENDED MARCH 31, 2011 AND 2010 (ALL DOLLAR AMOUNTS IN THOUSANDS OF CANADIAN DOLLARS, EXCEPT SHARE DATA)
NOTE 10. INVENTORIES (cont’d)
The change in write-downs related to inventories for fiscal years 2011 and 2010 is detailed as follows:
2011 2010
Write-downs recognized as cost of sales $ 7,325 $ 5,206 Reversal of write-downs recognized as a reduction of cost of sales $ 5,845 $ 3,883
The inventory write-down reversal is determined following the revaluation, each quarter-end and year-end, of the net realizable value of inventories based on the related sales contracts and production costs. It also includes the charges against the reserve for products delivered during the year for which a net realizable value reserve was required and recorded in prior periods.
NOTE 11. DERIVATIVE FINANCIAL INSTRUMENTS
2011 2010
Forward foreign exchange contracts and embedded derivatives $ 10,867 $ 7,568Interest-rate swap agreements 56 — $ 10,923 $ 7,568
NOTE 12. PROPERTY, PLANT AND EQUIPMENT
Property, plant and equipment consist of:
2011
Accumulated Net book Cost amortization Value
Land $ 4,370 $ — $ 4,370Buildings and leasehold improvements 62,047 19,680 42,367Machinery, equipment and tooling 220,809 126,868 93,941Construction in progress, building, machinery and equipment 1,682 — 1,682Automotive equipment 794 565 229Computer and office equipment 6,350 3,892 2,458 $ 296,052 $ 151,005 $ 145,047
2010
Accumulated Net book Cost amortization Value
Land $ 3,679 $ — $ 3,679Buildings and leasehold improvements 50,983 17,764 33,219Machinery, equipment and tooling 208,796 112,713 96,083Construction in progress, building, machinery and equipment 2,710 — 2,710Automotive equipment 723 553 170Computer and office equipment 5,250 3,441 1,809 $ 272,141 $ 134,471 $ 137,670

A N N U A L R E P O R T 2 0 1 0 - 2 0 1 1 5 3
NOTES TO CONSOLIDATED FINANCIAL STATEMENTSFOR THE YEARS ENDED MARCH 31, 2011 AND 2010 (ALL DOLLAR AMOUNTS IN THOUSANDS OF CANADIAN DOLLARS, EXCEPT SHARE DATA)
NOTE 12. PROPERTY, PLANT AND EQUIPMENT (cont’d)
The additions to property, plant and equipment of $19,646 for the year ended March 31, 2011 ($13,740 in 2010) presented in the consolidated statements of cash flows are shown net of $4,128 ($613 in 2010) of machinery and equipment which was delivered in the last two months of each fiscal year but not yet paid as at March 31. The additions to property, plant and equipment are also presented net of machinery and equipment of $nil ($7,630 in 2010) which were acquired through capital leases during the years then ended.
Amortization expense of property, plant and equipment amounted to $21,200 in fiscal 2011 ($19,469 in 2010).
At March 31, 2011, cost of machinery, equipment and tooling includes assets acquired through capital leases amounting to $27,394 ($27,947 at March 31, 2010) with accumulated amortization of $7,958 ($6,635 as at March 31, 2010).
At March 31, 2011, construction in progress includes the cost related to machinery and equipment being installed at that date. At March 31, 2010, it relates to the extension of a facility in Texas and new machinery and equipment being installed at that date (see Note 23 to the consolidated financial statements).
NOTE 13. FINITE-LIFE INTANGIBLE ASSETS
Finite-life intangible assets include software-related costs, backlogs acquired pursuant to acquisitions and the capitalized development costs related to some Aerospace long-term sales contracts. Changes in finite-life intangible assets are as follows:
2011 2010
Balance at beginning of year $ 11,698 $ 11,190Acquisition of software 1,050 562Acquisition of backlog (Note 3) 1,390 —Capitalization of development costs 6,930 3,201Amortization (2,410) (1,730)Effect of changes in exchange rate (172) (1,525) $ 18,486 $ 11,698
The finite-life intangible assets consist of:
2011
Accumulated Net book Cost amortization Value
Software $ 13,743 $ 11,778 $ 1,965Capitalized development costs 13,649 403 13,246Backlog 8,798 5,523 3,275 $ 36,190 $ 17,704 $ 18,486
2010
Accumulated Net book Cost amortization Value
Software $ 13,154 $ 11,505 $ 1,649Capitalized development costs 6,730 266 6,464Backlog 7,408 3,823 3,585 $ 27,292 $ 15,594 $ 11,698

5 4 H É R O U X - D E V T E K
NOTES TO CONSOLIDATED FINANCIAL STATEMENTSFOR THE YEARS ENDED MARCH 31, 2011 AND 2010 (ALL DOLLAR AMOUNTS IN THOUSANDS OF CANADIAN DOLLARS, EXCEPT SHARE DATA)
NOTE 14. OTHER ASSETS
2011 2010
Derivative financial instruments - Forward foreign exchange contracts and embedded derivatives $ 9,926 $ 12,408Derivative financial instruments - Interest-rate swap agreements 206 —Asset held for sale 611 — $ 10,743 $ 12,408
NOTE 15. GOODWILL
Goodwill represents the excess of the purchase price over the fair value of the net assets of acquired businesses. Changes in the goodwill balance can be detailed as follows:
2011 2010
Balance at beginning of year $ 35,621 $ 39,993Acquisition of goodwill (Note 3) 5,849 —Effect of changes in exchange rate (1,072) (4,372) $ 40,398 $ 35,621
NOTE 16. ACCOUNTS PAYABLE – OTHER
The Corporation’s accounts payable – other are summarized as follows:
2011 2010
Derivative financial instruments – forward foreign exchange contracts and embedded derivatives $ 852 $ 1,180Derivative financial instruments – interest-rate swap agreements — 841Machinery and equipment (Note 12) 4,128 613Customers’ advances — 1,957 $ 4,980 $ 4,591

A N N U A L R E P O R T 2 0 1 0 - 2 0 1 1 5 5
NOTES TO CONSOLIDATED FINANCIAL STATEMENTSFOR THE YEARS ENDED MARCH 31, 2011 AND 2010 (ALL DOLLAR AMOUNTS IN THOUSANDS OF CANADIAN DOLLARS, EXCEPT SHARE DATA)
NOTE 17. LONG-TERM DEBT
2011 2010
Senior Secured Syndicated Revolving Credit Facility (“Credit Facility“) of up to $150,000 ($125,000 as of March 31, 2010) (see below), either in Canadian or U.S. currency equivalent, maturing on March 15, 2016, which bears interest at Libor plus 1.875% at March 31, 2011 (Libor plus 1% at March 31, 2010) representing an effective interest rate of 2.2% (1.2% at March 31, 2010).
At March 31, 2011, the Corporation used US$59,500 (US$43,000 at March 31, 2010) on the Credit Facility. $ 57,691 $ 43,679
Governmental authorities loans, repayable in variable annual instalments, with various expiry dates until 2026. 27,707 21,040
Obligations under capital leases all bearing fixed interest rates between 4.2% and 9.3% maturing from November 2012 to July 2016, with amortization periods ranging from five to eight years, secured by the related property, plant and equipment, net of interest of $1,538 ($2,428 at March 31, 2010). 13,764 16,688
Promissory note, repayable in monthly instalments over 40 months up to July 2013, bearing fixed interest at 5% and is guaranteed by the Corporation (Note 3). 2,548 —
Deferred financing costs, net (2,198) (350) 99,512 81,057Less: current portion 5,136 4,250 $ 94,376 $ 76,807
Senior Secured Syndicated Revolving Credit Facility
In March 2011, the Corporation renewed and increased its Senior Secured Syndicated Revolving Credit Facilities through one Senior Secured Syndicated Revolving Credit Facility with a syndicate of five Canadian Banks and their U.S. subsidiaries or branches and, with a Canadian branch of a U.S. bank.
This five-year Credit Facility allows the Corporation and its subsidiaries to borrow up to $150 million (either in Canadian or U.S. currency equivalent) and is used for working capital, capital expenditures and other general corporate purposes and, is secured by all assets of the Corporation, and its subsidiaries and, is subject to certain covenants and corporate guarantees granted by the Corporation and its subsidiaries. The Credit Facility also includes an accordion feature to increase the Credit Facility up to $225 million, during the term of the Credit Agreement, subject to the approval of the lenders. This Credit Facility will mature in March 2016.
Interest rates vary based on prime, bankers’ acceptance, Libor or U.S. base rate plus a relevant margin depending on the level of the Corporation’s indebtedness and cash flows.
In conjunction with the renewal of the Credit Facility, the Corporation incurred $2,198 of financing costs which are capitalized at March 31, 2011 and are amortized using the effective interest rate method over a five-year period.
Governmental authorities loans
Governmental authorities loans represent essentially government assistance for the purchase of specialized equipment or tooling, for the modernization or additions to the Corporation’s facilities or for development costs capitalized or expensed for aerospace programs. They were granted as incentives under certain federal regional programs and provincial industrial programs to promote the development of the industry in Canada. These loans are either repayable according to certain specific terms, in particular depending on the Corporation’s aerospace sales and the Corporation’s sales of certain predetermined aircraft products within specific timeframes, and/or based on fixed repayment schedules. The conditional loan repayments are reviewed at least annually based on the latest estimate of the related sales.

5 6 H É R O U X - D E V T E K
NOTES TO CONSOLIDATED FINANCIAL STATEMENTSFOR THE YEARS ENDED MARCH 31, 2011 AND 2010 (ALL DOLLAR AMOUNTS IN THOUSANDS OF CANADIAN DOLLARS, EXCEPT SHARE DATA)
NOTE 17. LONG-TERM DEBT (cont’d)
Governmental authorities loans (cont’d)
Governmental authorities loans usually bear no or low interests. They are measured at a discounted value using a corresponding market rate of interest each time they are received, and the related discount is accreted to income using the effective interest rate method and included in the consolidated statements of income as financial expenses.
At March 31, 2011 and 2010, the effective interest rates for these loans were in the range of 3.9% to 7.2%.
Covenants
Long-term debt is subject to certain general and financial covenants related among others to the working capital, indebtedness, cash flows and equity of the Corporation and/or certain subsidiaries. As at March 31, 2011, the Corporation had complied with all covenants.
Minimum repayments
Minimum repayments of long-term debt during the next five years are as follows:
Years ending March 31
Repayments on Repayments governmental Repayments of Repayment of Years on capital leases authorities loans promissory note Credit Facility Total
2012 $ 3,386 $ 1,409 $ 1,200 $ — $ 5,9952013 3,372 3,324 1,200 — 7,8962014 3,352 2,757 400 — 6,5092015 3,119 2,886 — — 6,0052016 1,861 5,432 — 57,691 64,984
The minimum repayments include interest on obligations under capital leases in the amount of $1,538. The repayments of promissory note include the related interest expense of $252.
Financial expenses for the years ended March 31 comprise the following:
2011 2010
Interest $ 2,678 $ 2,901Interest accretion on governmental authorities loans 1,330 1,146Interest rate swap agreements buy-out 406 —Amortization of deferred financing costs 350 168Standby fees 220 251Accretion expense of asset retirement obligations 240 228Gain on financial instruments classified as HFT - Interest income (68) (18)Financial expenses, net $ 5,156 $ 4,676

A N N U A L R E P O R T 2 0 1 0 - 2 0 1 1 5 7
NOTES TO CONSOLIDATED FINANCIAL STATEMENTSFOR THE YEARS ENDED MARCH 31, 2011 AND 2010 (ALL DOLLAR AMOUNTS IN THOUSANDS OF CANADIAN DOLLARS, EXCEPT SHARE DATA)
NOTE 18. OTHER LIABILITIES
The Corporation’s other liabilities are summarized as follows:
2011 2010
Pension plan and other post-retirement benefits (Note 22) $ 3,686 $ 4,381Derivative financial instruments – interest-rate swap agreements — 280Derivative financial instruments – forward foreign exchange contracts and embedded derivatives 1,158 1,436Asset retirement obligations 4,202 4,653Other 136 198 $ 9,182 $ 10,948
NOTE 19. CAPITAL STOCK
Authorized capital stock
The authorized capital stock of the Corporation consists of the following:
An unlimited number of voting common shares, without par value;
An unlimited number of first preferred shares, issuable in series; and
An unlimited number of second preferred shares, issuable in series.
The rights, privileges, restrictions and conditions related to the preferred shares may be established by the Board of Directors.
The issued and outstanding capital stock of the Corporation consists of the following:
2011 2010
30,173,798 common shares at March 31, 2011 (30,485,475 at March 31, 2010) $ 100,136 $ 100,641
Issuance of common shares
During fiscal 2011, the Corporation issued 306,023 common shares at a weighted-average price of $4.82 for a total cash consideration of $1,474. This includes 245,221 common shares which were issued following the exercise of stock options for a total cash consideration of $1,144. The remainder of 60,802 common shares were issued under the Corporation’s stock purchase and ownership incentive plan for a total cash consideration of $330.
During fiscal 2010, the Corporation issued 75,387 common shares at a weighted-average price of $4.26 for a total cash consideration of $322. These shares were all issued under the Corporation’s stock purchase and ownership plan.
Normal course issuer bids
On November 25, 2009, the Corporation launched a normal course issuer bid (“NCIB”) under which the Corporation could repurchase up to 1,500,000 of its common shares, representing approximately 5% of the issued and outstanding shares. The NCIB terminated on November 24, 2010.
On November 24, 2008, the Corporation launched an NCIB under which the Corporation could repurchase up to 1,500,000 of its common shares, representing approximately 5% of the issued and outstanding common shares. The NCIB expired on November 23, 2009.
During fiscal 2011, the Corporation repurchased 617,700 common shares at an average price of $5.78 for a total cash consideration of $3,570 under the NCIB. The excess ($1,591) of the cost of the common shares over their average book value ($1,979) was accounted for as a reduction of the Corporation’s retained earnings.

5 8 H É R O U X - D E V T E K
NOTES TO CONSOLIDATED FINANCIAL STATEMENTSFOR THE YEARS ENDED MARCH 31, 2011 AND 2010 (ALL DOLLAR AMOUNTS IN THOUSANDS OF CANADIAN DOLLARS, EXCEPT SHARE DATA)
NOTE 19. CAPITAL STOCK (cont’d)
Normal course issuer bids (cont’d)
During fiscal 2010, the Corporation repurchased 761,600 common shares at an average price of $4.56, for a total cash consideration of $3,470 under these NCIBs. The excess ($967) of the cost of the common shares over their average book value ($2,503) was accounted for as a reduction of the Corporation’s retained earnings.
Stock option plan
Under the stock option plan (the “plan”), stock options (“options”) are granted to officers and key employees to purchase the Corporation’s common shares. The plan establishes that the subscription price shall not be lower than the average closing price of the related shares for the five trading days preceding the granting of the options. Options generally may be exercised after the first anniversary of the date of grant until the seventh anniversary of the date of grant. They vest after a period ranging from one to four years. For options granted after September 1, 2003, a predetermined target market price level must be reached in order for such options to become exercisable. Cancelled or forfeited options are included in the remaining number of shares reserved for issuance under the plan.
The aggregate number of common shares reserved for issuance under the plan is 2,808,257 of which 50,718 shares had not yet been granted as at March 31, 2011.
During fiscal 2011, the Corporation granted 138,000 options (246,000 in 2010) to key employees representing a total fair value of $240 ($242 in 2010) or a weighted-average fair value per option of $1.74 ($0.98 in 2010) calculated using a binomial valuation model assuming a six-year expected life, expected volatility of 48% (47% in 2010), no expected dividend distribution and a compounded risk-free interest rate of 3.5% (4.0% in 2010). Option cost is amortized over their vesting period and an expense of $395 ($240 in 2010) was accounted for in selling and administrative expenses with its counterpart in the contributed surplus in the Corporation’s shareholders’ equity.
As at March 31, 2011, 1,393,000 stock options were issued and outstanding as follows:
OUTSTANDING OPTIONS VESTED OPTIONS
Weighted- Weighted- Weighted-Range of average years average exercise average exerciseexercise price Number to maturity price Number price
$3.50 to $4.99 830,000 3.50 $ 4.58 490,000 $ 4.59$5.00 to $6.49 235,000 3.92 5.55 97,000 5.00$6.50 to $10.00 328,000 3.39 9.90 164,000 9.90 1,393,000 3.54 $ 6.00 751,000 $ 5.80
During the fiscal years ended March 31, 2011 and 2010, the variation in the number of options can be detailed as follows:
2011 2010
Weighted-average Number of Weighted-average Number of
exercise price stock options exercise price stock options
Balance at beginning of year $ 5.83 1,555,221 $ 6.27 1,384,221Granted 5.94 138,000 4.56 246,000Exercised 4.66 (245,221) — —Cancelled / forfeited 7.19 (55,000) 9.77 (75,000)Balance at end of year $ 6.00 1,393,000 $ 5.83 1,555,221
A N N U A L R E P O R T 2 0 1 0 - 2 0 1 1 5 9
NOTES TO CONSOLIDATED FINANCIAL STATEMENTSFOR THE YEARS ENDED MARCH 31, 2011 AND 2010 (ALL DOLLAR AMOUNTS IN THOUSANDS OF CANADIAN DOLLARS, EXCEPT SHARE DATA)
NOTE 19. CAPITAL STOCK (cont’d)
Stock purchase and ownership incentive plan
On September 2, 2004, the Board of Directors of the Corporation approved a stock purchase and ownership incentive plan to induce management employees to hold, on a long-term basis, common shares of the Corporation.
Under this plan, eligible employees can subscribe monthly, by salary deductions of up to 10% of their base salary, a number of common shares issued by the Corporation corresponding to their monthly contribution. The subscription price of the issued common shares represents 90% of the average closing price of the Corporation’s common share on the TSX over the five trading days preceding the common share subscription. Also, the Corporation matches 50% of the employee’s contribution by awarding the employee, on a monthly basis, additional common shares acquired on the TSX at market price. However, the Corporation’s matching award cannot exceed 4% of the employee’s annual base salary. Common shares awarded to the employee, as well as the subscribed common shares, will vest each year on July 1st and will be released over a three-year period.
A trustee is in charge of the administration of the plan, including market purchases and subscriptions to the Corporation’s common shares for and on behalf of the participating employees.
The aggregate number of common shares reserved for issuance under this plan represents 340,000 common shares, of which 29,976 shares had not yet been issued as at March 31, 2011, and has been taken out from the common shares already reserved for the Corporation’s stock option plan.
During fiscal 2011, 60,802 common shares were issued for a total cash consideration of $330 (75,387 for a total cash consideration of $322 in 2010) and 24,026 common shares were awarded (32,176 in 2010) to the participating employees. Since the beginning of the plan, 310,024 common shares were issued and 130,827 common shares were awarded to the participating employees. The cost related to the awarded common shares amounting to $147 is recorded as compensation expense ($155 in 2010) and is included in the Corporation’s selling and administrative expenses.
Stock appreciation right and Deferred share unit plans
The Corporation has a stock appreciation right (“SAR”) plan under which rights are issued to its non-employee directors. The SAR enables the participants to receive by way of bonuses, on the exercise date of a SAR, a cash amount equal to the excess of the market price of the Corporation’s common share over the granted price of the SAR. The SARs are expensed on an earned basis and their costs are determined based on the Corporation’s common shares quoted market value over their granted price. In August 2010, the Board of Directors decided not to continue the SAR plan and replace it by a deferred share unit (“DSU”) plan, which was effectively approved, subsequent to the 2011 fiscal year, in May 2011. Consequently, in fiscal 2011, no DSUs were granted to the directors.
The DSU enables the participants to receive by way of remuneration, but only at the termination date as a member of the Board of Directors, a cash amount equal to the market price of the Corporation’s common share for each DSU on the termination date. These DSUs are expensed on an earned basis and their costs are determined based on the Corporation’s common shares quoted market value. Each director can also elect, each fiscal year, to have up to 50% of his director’s annual retainer fees converted into DSUs.
In fiscal 2011, no SARS were granted (35,000 SARs at a granted value of $4.56 in 2010). In fiscal 2011, an expense of $410 was recorded for SARs ($23 was recorded for fiscal 2010).
In fiscal 2011, 7,500 SARs were exercised. No SARs were exercised and 7,500 SARs were cancelled in fiscal 2010.
As at March 31, 2011, on a cumulative basis, 143,000 SARs were still outstanding at a weighted-average granted value of $6.21 (150,500 SARs at a weighted-average granted value of $6.14 as at March 31, 2010) which expire on various dates from fiscal 2012 to 2016.

6 0 H É R O U X - D E V T E K
NOTES TO CONSOLIDATED FINANCIAL STATEMENTSFOR THE YEARS ENDED MARCH 31, 2011 AND 2010 (ALL DOLLAR AMOUNTS IN THOUSANDS OF CANADIAN DOLLARS, EXCEPT SHARE DATA)
NOTE 20. INCOME TAXES
The computation of income tax expense is as follows:
2011 2010
Income taxes at combined federal and provincial tax rates $ 7,301 $ 6,767Permanent differences (488) (528)Income tax rate difference – U.S. subsidiaries 535 291Impact of income tax rate differential on future income taxes (174) (121)Other items (274) 89 $ 6,900 $ 6,498
Temporary differences and loss carry-forwards, which give rise to future income tax assets and liabilities, are as follows:
2011 2010
Future income tax assetsCurrent Non-deductible reserves $ 2,857 $ 3,231 Inventories 4,278 2,613 Receivables 690 794 Derivative financial instruments (136) 620 Tax and other credits (1,870) (2,134) $ 5,819 $ 5,124
Future income tax liabilitiesCurrent Non-deductible reserves $ 5,269 $ 4,885 Derivative financial instruments 1,205 2,276 $ 6,474 $ 7,161
Long-term Property, plant and equipment $ 14,891 $ 12,063 Goodwill 2,371 2,028 Non-deductible reserves 384 (244) Governmental authorities loans 626 1,276 Future tax benefits from tax losses (1,082) (1,522) Derivative financial instruments 3,357 2,190 $ 20,547 $ 15,791
As at March 31, 2011, there were no operating losses carried forward and no other temporary differences for which related income tax assets have not been recognized in the consolidated financial statements.
As at March 31, 2011, the Corporation has federal non-capital losses available for carry-forward of $1,585 with the majority expiring in fiscal 2029.
Income tax expense is as follows:
2011 2010
Current $ 2,922 $ 55Future 3,978 6,443 $ 6,900 $ 6,498

A N N U A L R E P O R T 2 0 1 0 - 2 0 1 1 6 1
NOTES TO CONSOLIDATED FINANCIAL STATEMENTSFOR THE YEARS ENDED MARCH 31, 2011 AND 2010 (ALL DOLLAR AMOUNTS IN THOUSANDS OF CANADIAN DOLLARS, EXCEPT SHARE DATA)
NOTE 21. NET CHANGE IN NON-CASH WORKING CAPITAL ITEMS RELATED TO OPERATIONS
The net change in non-cash working capital items related to operations is detailed as follows:
2011 2010
Accounts receivable $ (18,187) $ 13,105Income tax receivable 633 (1,166)Other receivables (2,402) (2,715)Inventories 1,014 11,239Prepaid expenses (229) (140)Accounts payable and accrued liabilities and, other liabilities 41 (20,472)Accounts payable – other 598 232Income tax payable 1,484 (3,103)Effect of changes in exchange rate(1) (2,107) (5,101) $ (19,155) $ (8,121)
(1) Reflects the total impact of changes in exchange rate during the related fiscal year on non-cash items listed above for the Corporation’s U.S. subsidiaries.
NOTE 22. PENSION AND OTHER RETIREMENT BENEFIT PLANS
Description of benefit plans
The Corporation has funded and unfunded defined benefit pension plans as well as defined contribution pension plans that provide pension benefits to its employees. Retirement benefits provided by the defined benefit pension plans are based on either years of service and flat amount, years of service and final average salary, or set out by individual agreements.
Benefits provided by the post-retirement benefit plans are set out by individual agreements, which mostly provide for life insurance coverage and health care benefits. Since their amount is not significant, they are not included in the figures below.
Total cash payments
Total cash payments for employee future benefits for fiscal year 2011, consisting of cash contributed by the Corporation to its funded defined benefit pension plans and cash payments directly to beneficiaries for its unfunded defined benefit pension plans amounted to $2,288 ($2,596 in 2010) while the cash contributed to its defined contribution plans amounted to $2,241 ($1,837 in 2010).
Defined benefit plans
The Corporation measures the fair value of plan assets for accounting purposes as at March 31 of each year while its defined benefit obligations are valued as at December 31 of each year and projected to March 31 for all plans except one, for which the valuation is made as at March 31. The most recent actuarial valuation for funding purposes of the Unionized Pension Plan was performed as at December 31, 2010 and will be filed with regulatory authorities no later than September 30, 2011. The next required actuarial valuations for this plan will be conducted as at December 31, 2011. The most recent actuarial valuations for funding purposes of the Executive Registered Pension Plans were performed as at January 1, 2009 and January 1, 2011 and will be filed with regulatory authorities no later than September 30, 2011. The next required actuarial valuations for these plans will be conducted as at January 1, 2012.

6 2 H É R O U X - D E V T E K
NOTES TO CONSOLIDATED FINANCIAL STATEMENTSFOR THE YEARS ENDED MARCH 31, 2011 AND 2010 (ALL DOLLAR AMOUNTS IN THOUSANDS OF CANADIAN DOLLARS, EXCEPT SHARE DATA)
NOTE 22. PENSION AND OTHER RETIREMENT BENEFIT PLANS (cont’d)
Defined benefit pension plan obligations
ACCRUED BENEFIT OBLIGATIONS 2011 2010
Balance at beginning of year $ 35,044 $ 28,833Current service cost 908 643Employee contributions 653 672Interest cost 1,956 2,009Benefits paid (1,689) (1,533)Actuarial losses 1,945 4,306Special termination benefits — 114Balance at end of year $ 38,817 $ 35,044
Defined benefit pension plan assets
FAIR VALUE OF PLAN ASSETS 2011 2010
Balance at beginning of year $ 24,254 $ 19,232Actual return on plan assets 1,863 3,287Employer contributions 2,288 2,596Employee contributions 653 672Benefits paid (1,689) (1,533)Balance at end of year $ 27,369 $ 24,254
Plan assets consist of:
ASSET CATEGORY (1) 2011 2010
Equity securities 62% 56%Debt securities 35 42Other 3 2Total 100% 100%
(1) Measured as of the measurement date of March 31 of each year.
Reconciliation of the funded status of the defined benefit pension plans to the amounts recorded in the consolidated financial statements
2011 2010
Fair value of plan assets $ 27,369 $ 24,254Accrued benefit obligations 38,817 35,044Funded status – plans deficit (11,448) (10,790)Unamortized net actuarial loss 6,512 4,964Unamortized past service cost 804 925Unamortized transitional obligation 446 520Accrued benefit liability, net of valuation allowance $ (3,686) $ (4,381)

A N N U A L R E P O R T 2 0 1 0 - 2 0 1 1 6 3
NOTES TO CONSOLIDATED FINANCIAL STATEMENTSFOR THE YEARS ENDED MARCH 31, 2011 AND 2010 (ALL DOLLAR AMOUNTS IN THOUSANDS OF CANADIAN DOLLARS, EXCEPT SHARE DATA)
NOTE 22. PENSION AND OTHER RETIREMENT BENEFIT PLANS (cont’d)
The accrued benefit liability, net of valuation allowance, is included in the Corporation’s consolidated balance sheets under other long-term liabilities (Note 18 – Other liabilities).
Plans with accrued benefit obligations in excess of plan assets
The above accrued benefit obligations and fair value of plan assets at year-end also represent all amounts in respect of pension plans that are not fully funded.
Elements of defined benefit pension costs recognized in the year
2011 2010
Current service cost, net of employee contributions $ 908 $ 643Interest cost 1,956 2,009Actual return on plan assets (1,863) (3,287)Actuarial losses 1,945 4,306Special termination benefits — 114
Elements of employee future benefits costs before adjustments to recognize the long-term nature of employee future benefit costs $ 2,946 $ 3,785Adjustments to recognize the long-term nature of employee future benefit costs:
246 1,980
actual actuarial (gain) loss on accrued benefit obligations for the year (1,794) (4,272)
the year and actual plan amendments for the year 121 12174 74
Defined benefit pension costs recognized $ 1,593 $ 1,688
Significant assumptions
The significant assumptions used are as follows (weighted-average):
2011 2010
Accrued benefit obligations as at March 31: Discount rate 5.60% 5.90% Rate of compensation increase 3.50 3.50Defined benefit pension costs for years ended March 31: Discount rate 5.90% 7.50% Expected long-term rate of return on plan assets 6.50 6.50 Rate of compensation increase 3.50 3.50

6 4 H É R O U X - D E V T E K
NOTES TO CONSOLIDATED FINANCIAL STATEMENTSFOR THE YEARS ENDED MARCH 31, 2011 AND 2010 (ALL DOLLAR AMOUNTS IN THOUSANDS OF CANADIAN DOLLARS, EXCEPT SHARE DATA)
NOTE 22. PENSION AND OTHER RETIREMENT BENEFIT PLANS (cont’d)
Defined contribution pension plans
The defined contribution pension costs are as follows:
2011 2010
Defined contribution pension costs $ 2,241 $ 1,837
NOTE 23. COMMITMENTS
Building lease contracts
The Corporation has entered into leases for buildings which are used for manufacturing operations and administration. The total commitments at March 31, 2011 amounted to $4,916 excluding escalation clauses. The minimum annual lease payments over the next five years are: $909 in 2012, $742 in 2013, $517 in 2014, $373 in 2015 and $345 in 2016.
Operating lease contracts – machinery and equipment
Under operating lease contracts for machinery and equipment used mainly for its manufacturing operations, the Corporation has commitments at March 31, 2011 in the amount of $4,816 for which the minimum annual operating lease payments, over the next five years, are: $1,629 in 2012, $1,558 in 2013, $777 in 2014, $350 in 2015 and $350 in 2016.
Under these operating lease contracts, the Corporation has the option to purchase the related machinery and equipment at the end of the contract. These purchase option payments, if exercised, represent the following: $495 in 2014 and $639 in 2017.
Building, machinery and equipment acquisition commitments
The Corporation has released purchase orders relating to machinery and equipment which have not been delivered yet to the Corporation’s facilities. These outstanding purchase orders at March 31, 2011 amounted to $3,938 ($5,205 in 2010) for which an amount of $223 ($772 in 2010) in deposits on machinery and equipment were made and are included in the Corporation’s other receivables (see Note 9 to the consolidated financial statements).
Guarantees
The Corporation executes agreements that provide for indemnification and guarantees to counterparties in transactions such as business disposition and the sale of assets.
These indemnification undertakings and guarantees may require the Corporation to compensate the counterparties for costs or losses incurred as a result of various events including breaches of representations and warranties, intellectual property right infringement, loss of or damage to property environmental liabilities, changes in or in the interpretation of laws and regulations (including tax legislation), valuation differences or as a result of litigation that may be suffered by the counterparties.
In the sale of all or a part of a business or assets, in addition to possible indemnification relating to failure to perform covenants and breach of representations and warranties, the Corporation may be subjected to indemnify against claims from its past conduct of the business. The nature of these indemnification agreements prevents the Corporation from estimating the maximum potential liability that could be required under guarantees, since these events have not yet occurred. The duration of these indemnification agreements could extend up to 2024. At March 31, 2011 and 2010, an amount of $6,000 was provided for in the Corporation’s accounts payable and accrued liabilities in respect to these items.

A N N U A L R E P O R T 2 0 1 0 - 2 0 1 1 6 5
NOTES TO CONSOLIDATED FINANCIAL STATEMENTSFOR THE YEARS ENDED MARCH 31, 2011 AND 2010 (ALL DOLLAR AMOUNTS IN THOUSANDS OF CANADIAN DOLLARS, EXCEPT SHARE DATA)
NOTE 24. CONTINGENCIES
The Corporation is involved in litigations and claims in the normal course of business. Management is of the opinion that any resulting settlements would not materially affect the financial position and operating results of the Corporation.
NOTE 25. ACCUMULATED OTHER COMPREHENSIVE INCOME (LOSS)
Changes in the accumulated other comprehensive income (loss) were as follows:
CUMULATIVE TRANSLATION CASH FLOW ADJUSTMENT (1) HEDGES TOTAL
Balance as at March 31, 2009 $ 684 $ (12,808) $ (12,124)Change during the year (16,499) 24,005 7,506Balance as at March 31, 2010 (15,815) 11,197 (4,618)Change during the year (2,985) 1,732 (1,253)Balance as at March 31, 2011 $ (18,800) $ 12,929 $ (5,871)
(1) Includes the impact from the hedge of net investments in self-sustaining foreign operations.
NOTE 26. SEGMENTED INFORMATION
Based on the nature of the Corporation’s markets (clients, manufacturing techniques and regulatory requirements), two main operating segments were identified: Aerospace and Industrial. The Aerospace segment includes the design, development, manufacture, repair and overhaul and sale of systems and components for military and civil aviation, while the Industrial segment represents essentially the manufacture and sale of gas turbine components and other high precision machined products for the wind energy and heavy equipment industries.
The Corporation evaluates the performance of its operating segments primarily based on operating income before financial expenses and income tax expense.
The Corporation accounts for intersegment and related party sales and transfers, if any, at the exchange amount.
The accounting policies used to account for the operating segments are the same as those described in the summary of the Corporation’s significant accounting policies.

6 6 H É R O U X - D E V T E K
NOTES TO CONSOLIDATED FINANCIAL STATEMENTSFOR THE YEARS ENDED MARCH 31, 2011 AND 2010 (ALL DOLLAR AMOUNTS IN THOUSANDS OF CANADIAN DOLLARS, EXCEPT SHARE DATA)
NOTE 26. SEGMENTED INFORMATION (cont’d)
Segmented information consists of the following:
Activity segments
2011 2010
Aerospace Industrial Total Aerospace Industrial Total
Sales $ 331,993 $ 25,579 $ 357,572 $ 297,852 $ 22,502 $ 320,354Operating income 27,615 3,605 31,220 24,743 2,434 27,177Financial expenses, net 5,156 4,676Income before income tax expense and restructuring charges 26,064 22,501Assets 420,668 23,207 443,875 370,839 24,008 394,847Goodwill 39,530 868 40,398 34,712 909 35,621Additions to property, plant and equipment 22,423 1,351 23,774 12,939 1,414 14,353Increase in finite-life intangible assets 7,980 — 7,980 3,763 — 3,763Amortization of property, plant and equipment 18,884 2,316 21,200 16,847 2,622 19,469
Geographic segments
2011 2010
Canada U.S. Total Canada U.S. Total
Sales $ 223,748 $ 133,824 $ 357,572 $ 230,762 $ 89,592 $ 320,354Property plant and equipment, net 90,294 54,753 145,047 90,902 46,768 137,670Finite-life intangible assets, net 14,726 3,760 18,486 7,984 3,714 11,698Goodwill 17,534 22,864 40,398 17,534 18,087 35,621
Export sales (1) $ 133,738 $ 136,645
70% of the Corporation’s sales (67% in 2010) were to U.S. customers.
(1) Export sales are attributed to countries based on the location of the customers.
NOTE 27. RECLASSIFICATION
Comparative figures for the consolidated financial statements as at March 31, 2010 and for the year then ended have been reclassified to conform to the March 31, 2011 presentation.

A n n u A L r e p o r t 2 0 1 0 - 2 0 1 1
Annual General and special meetingtheannualgeneralandspecialMeetingofshareholderswillbeheldonthursday,august4,2011at11:00a.M.inthepierre-de-coubertinroomoftheHôtelOmniMont-royal1050sherbrookestreetwestMontréal,québec,canada
registrar and transfer Agent computershare trustcompanyofcanada1500universitystreet,7thFloorMontréal,québeccanadaH3a3s8tel.:514982-7555/ 1-800-564-6253
AuditorsErnst&youngllp800renélévesqueblvd.west,suite1900Montréal,québeccanadaH3b1x9tel.:514875-6060
share ListingsharesaretradedonthetorontostockExchangetickersymbol:Hrx
Investor relationstel.:450679-3330Fax:[email protected]
maisonbrison communicationstel.:[email protected]
héroux-Devtek Inc.1111saint-charlesstreetwestsuite658,Easttowercomplexesaint-charleslongueuil,québeccanadaJ4k5g4tel.:450679-3330Fax:450679-3666www.herouxdevtek.com
Designed and written by maisonbrison communicationsPour obtenir la version française de ce rapport, veuillez contacter le secrétaire corporatif.
shArehoLDers InFormAtIon

HÉROUX-DEVTEK INC.
1111, Saint-Charles Street West Suite 658, East Tower
Complexe Saint-Charles Longueuil, Québec
Canada J4K 5G4
Tel.: 450 679-3330 Fax: 450 679-3666
www.herouxdevtek.com