a wider perspective on reducing fatigue risk in aviation capability resulting from sleep loss,...
TRANSCRIPT

Copyright © 2017 Jeppesen. All rights reserved.
A Wider Perspective on Reducing Fatigue Risk in Aviation- And the importance of metrics
Tomas Klemets, Head of Scheduling Safety, Jeppesen
Managing Fatigue 2017
San Diego, March 22

Copyright © 2017 Jeppesen. All rights reserved.
” A physiological state of reduced mental or physical
performance capability resulting from sleep loss,
extended wakefulness, circadian phase, and/or
workload (mental and/or physical activity) that can
impair a person’s alertness and ability to perform
safety related operational duties.”
ICAO
What is fatigue? And fatigue risk?
Fatigue Risk ≈ the risk of a lapse, slip, mistake and/or violation by crew as a
consequence of reduced alertness, with potentially negative impact on flight safety.
2
Time of day Time awake Prior sleep debt

Copyright © 2017 Jeppesen. All rights reserved.
Let’s imagine for a moment that we are regulators
defining flight and duty time limits...
3

Copyright © 2017 Jeppesen. All rights reserved.
We need a quick decision...
In order to reduce fatigue risk, for flight duties
starting between 8pm and 5am, should we:
Increase max flight duty time with 30 minutes, OR
(10h 10h30m)
Reduce max flight duty time with 30 minutes?
(10h 9h30m)
4
Flight
Duty
Dep Arr
Max 10h duty
time
B
A

Copyright © 2017 Jeppesen. All rights reserved.
We need a quick decision...
In order to reduce fatigue risk, for flight duties
starting between 8pm and 5am, should we:
Increase max flight duty time with 30 minutes, OR
(10h 10h30m)
Reduce max flight duty time with 30 minutes?
(10h 9h30m)
5
Flight
Duty
Dep Arr
Max 10h duty
time
B
A

Copyright © 2017 Jeppesen. All rights reserved.
Metrics for more informed decisions
6
Can we quantify fatigue risk?
Perhaps not an absolute quantification,
but one allowing us to compare?
Not just one flight – but the overall risk?
We do have validated bio-mathematical
fatigue models
– Prediction of alertness/fatigue/effectiveness for
a population at any point in time

Copyright © 2017 Jeppesen. All rights reserved.
Metrics for more informed decisions
7
Starting with one flight

Copyright © 2017 Jeppesen. All rights reserved.
But what about a set of flights?
How much better is the
lower distribution?
8

Copyright © 2017 Jeppesen. All rights reserved.
Fatigue Model Accuracy
Reasons for inaccuracy– Models are not perfect (!)
– Models under-informed
Need to predict sleep
Habitual sleep length, Diurnal type, Individual
commute times etc.
– Mitigations
– Social factors
– Inter-, and intra-individual variation
9
0.60
0.35
High score ≈ 0%
probability for crew
experiencing KSS 8
or KSS 9
doi:10.7910/DVN/26541, 20 Oct 2014
SRI, Swedish CAA, SAS, Jeppesen
Low score = 95% probability
for crew experiencing KSS 8
or KSS 9!

Copyright © 2017 Jeppesen. All rights reserved.
Fatigue Risk – as a function of KSS
10
Using actual KSS
experiencedUsing predicted KSS

Copyright © 2017 Jeppesen. All rights reserved.
A Real World Example
11

Copyright © 2017 Jeppesen. All rights reserved.
The Risk of Human Error(Lapses, Slips, Mistakes, and Violations)...
Risk of human error
Alertness
Alertness
Unacceptable
Acceptable
High
Low
Risk
The operational risk for the airline is
the sum of risk contributions of all the
flights (in the tail of the distribution).
hh:mm
Risk of human error
12

Copyright © 2017 Jeppesen. All rights reserved.
Proposed metrics for overall risk
AFR, Absolute Fatigue Risk
– A weighted sum over all flights, with an accelerating
weight as the prediction approaches zero
– ✓ Detailed representation of risk, as we know it.
– ✗ Becomes a bit abstract.
NFR, Normalized Fatigue Risk.
– AFR divided over number of flights.
So; An operation keeping it’s structure but doubling in
size will have 2 times the AFR (double risk for fatigue
related incident/accident) but the same NFR (risk profile).
Good for identifying the part
of operation at highest
(overall) risk.
Good for spotting trends and picking
out base/rank/fleet/station with the
relatively highest, or shifting, risk.
Risk
Pred. alertness
13
5000
X^2
2500
Alertness, Risk
>=5000, 0
4000, 100
3000, 400
2000, 900
1000, 1600
0, 2500

Copyright © 2017 Jeppesen. All rights reserved.
Monitoring Fatigue Risk
14

Copyright © 2017 Jeppesen. All rights reserved.
Control of Fatigue Risk
“Normal” planning
rules/focus w/o any true
guidance on human
physiology
Same rules but also using a
BMM providing an incentive
during planning to avoid
poorly planned flights.
Same data. Same rules.
Almost identical crew
efficiency.
But much lower risk. 15

Copyright © 2017 Jeppesen. All rights reserved.
We need a quick decision...
In order to reduce fatigue risk, for flight duties
starting between 8pm and 5am, should we:
Increase max flight duty time with 30 minutes, OR
(10h 10h30m)
Reduce max flight duty time with 30 minutes?
(10h 9h30m)
16
Flight
Duty
Dep Arr
Max 10h duty
time
B
A
Shorter flight duties More flight duties More
commute/briefing/debriefing time More
consecutive flight duties More disrupted
physiological nights More sleep debt
Higher risk?

Copyright © 2017 Jeppesen. All rights reserved.
Summary
Traditional rules are blunt instruments. So are
cut-offs based on bio-mathematical models
Output from fatigue models can be used to
effectively monitor, prevent and reduce fatigue
risk exposure
The industry would benefit from standards for
predictive risk metrics, such as AFR and
NFR here presented.
– What you can’t measure…
Gains are significant...
– From max 60h to 70h...
17

Copyright © 2017 Jeppesen. All rights reserved.
18

Copyright © 2017 Jeppesen. All rights reserved.
Backup slides from here onwards
19

Copyright © 2017 Jeppesen. All rights reserved.
The ”Comprehensive Study” 2011 - preconditions
• OAG data for May 2011.
– Over 300 planning problems selected, all >200 flights/week
• Only two-pilot operation
• Applying only flight time regulations
• Optimal base-distribution of crew.
• Aircraft rotations built using FIFO algorithm.
– Crew may always follow A/C in turns
• Deadhead only on own carrier
• Pairing construction, striving for efficiency
– Minimizing synthetic for US and CA operators
– Maximizing productivity elsewhere
– Basic, normal, planning constraints limiting e.g. A/C changes.
• Evaluation using BAM 1.6.1
– PA5 used as main KPI for the safety of a solution
• In total over 2100 plans built consuming some 4000 CPU
hours
See
GPA_white_paper_word_v1.0.pdf
20

Copyright © 2017 Jeppesen. All rights reserved.
What if changing from EU-Ops to FAR?
21

Copyright © 2017 Jeppesen. All rights reserved.
Some absolute numbers – APAC
Copyright © 2017 Jeppesen. All rights reserved.
Conclusions of the study
• Fatigue is significantly linked to the business model
of the operator.
• FTLs in current form do not limit fatigue effectively.
• Current FTLs have a more significant effect on
efficiency than on fatigue risk.
• FAR allows for the highest efficiency, but is also the
FTL least protective from fatigue.
• DGCA is the most protective FTL for fatigue risk but
is generally most restrictive on efficiency.
• Fatigue models are needed to provide direction
within FTLs. And also for improving them…
23

Copyright © 2017 Jeppesen. All rights reserved.
The Misalignment btw Fatigue and Work load…
FTL’s: FAA, EASA, CASA,
CAAC, national CAA’s...
High workload =
High fatigue?
Low workload =
Low fatigue?
24
Copyright © 2017 Jeppesen. All rights reserved.
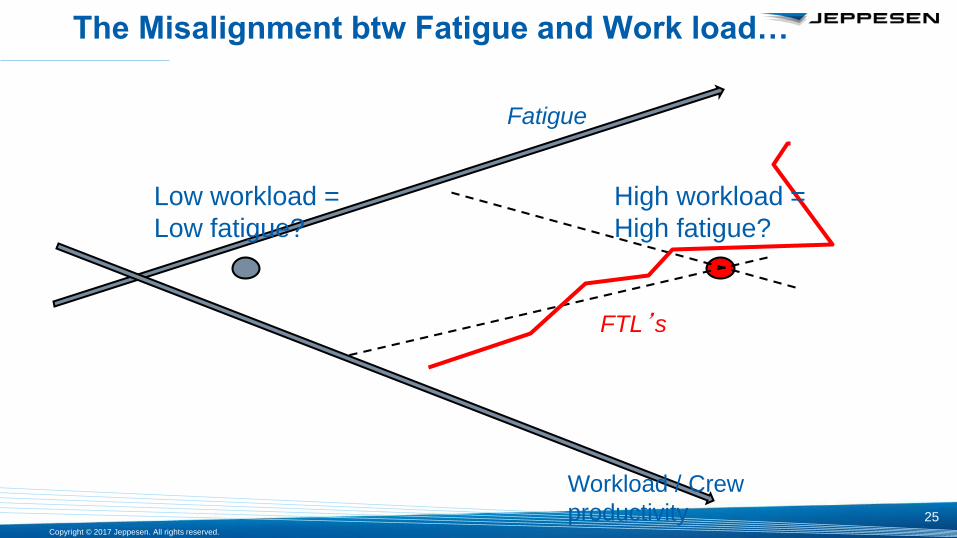
The Misalignment btw Fatigue and Work load…
Workload / Crew
productivity
Fatigue
High workload =
High fatigue?
Low workload =
Low fatigue?
FTL’s
25

Copyright © 2017 Jeppesen. All rights reserved.
Operator objective (in part) – crew productivity
FTL’s
Workload / Crew
productivity
Fatigue
26

Copyright © 2017 Jeppesen. All rights reserved.
Fatigue (Risk) Management – if done right…
Workload / Crew
productivity
Fatigue
Increased productivity
(not allowed today despite
being safe)
Increased safety (allowed
today despite being unsafe)
27

Copyright © 2017 Jeppesen. All rights reserved.
The value of an FRMS approach
• Safety (lower risk of incidents/accidents)
• Crew quality of life
• Compliance / liability / goodwill
• Crew efficiency!
Now
Exemptions
within a FRMS
The frontier of
possibilities
5-10%
10-30%
Fixed
constraints
28