a weekly update from smc wise m ney - smc trade...
TRANSCRIPT

2013: Issue 357, Week: 11th - 14th FebruaryA Weekly Update from SMC(For private circulation only)
WISE M NEY
Bra
nd
sm
c 1
81
®


(Saurabh Jain)
Contents
Equity 4-7
Derivatives 8-9
Commodity 10-13
Currency 14
IPO 15
Fixed Deposit 16
Mutual Fund 17-18
EDITORIAL STAFF
Editor Saurabh Jain
Executive Editor Jagannadham Thunuguntla
+Editorial Team
Dr. R.P. Singh Nitin Murarka
Vandana Bharti Tejas Seth
Sandeep Joon Dinesh Joshi
Vineet Sood Shitij Gandhi
Dhirender Singh Bisht Subhranil Dey
Parminder Chauhan Ajay Lakra
Mudit Goyal
Content Editor Kamla Devi
Graphic Designer Pramod Chhimwal
Research Executive Simmi Chibber
REGISTERED OFFICES:
11 / 6B, Shanti Chamber, Pusa Road, New Delhi 110005.
Tel: 91-11-30111000, Fax: 91-11-25754365
MUMBAI OFFICE:
Dheeraj Sagar, 1st Floor, Opp. Goregaon sports Club, Link Road
Malad (West), Mumbai 400064
Tel: 91-22-67341600, Fax: 91-22-28805606
KOLKATA OFFICE:
18,Rabindra Sarani, Poddar Court, Gate No-4, 4th & 5th Floor,
Kolkata-700001
Tel : 91-33-39847000/39801300, Fax No : 91-33-39847004
AHMEDABAD OFFICE :
10/A, 4th Floor, Kalapurnam Building, Near Municipal Market,
C G Road, Ahmedabad-380009, Gujarat
Tel : 91-79-26424801 - 05, 40049801 - 03
CHENNAI OFFICE:
2nd Floor, Mookambika Complex, 4, Lady Desikachari Road,
Mylapore, Chennai-600004
Tel: 91- 44 - 39109100 Fax: 91- 44 - 39109111
SECUNDERABAD OFFICE:
206, 3rd Floor, above CMR Exclusive, Bhuvana Towers, S.D.Road,
Secunderabad - 500003
Tel: 91-40-30780298/99, 39109536
DUBAI OFFICE:
312, Belshalat Building, Al Karama, Dubai, P.O. Box 117210, U.A.E.
Tel: 97143963120, Mobile : 971502612483
Fax : 9714 3963122
Email ID : [email protected]
Printed and Published on behalf of
Mr. Saurabh Jain @ Publication Address
11/6B, Shanti Chamber, Pusa Road, New Delhi-110005
Website: www.smcindiaonline.com
Investor Grievance : [email protected]
Printed at: S & S MARKETING
102, Mahavirji Complex, LSC-3, Rishabh Vihar, Delhi - 110092 (India)
Ph.: +91-11-43035012, 43035014, Email: [email protected]
lobal stock markets saw some profit taking after European Central bank
(ECB) president Mario Draghi said that the policy makers are concerned Gabout the strength in the Euro as it can hurt exporters and economic
recovery. In the Monetary policy review, ECB kept interest rates unchanged but
changed mildly its language as regard to economic recovery to “later in 2013”
from “second half of 2013”.
Japan posted current account deficit for the second consecutive month
reflecting weakness in the global economy and higher energy imports as a result
of nuclear plants shutdown. However around fourteen percent depreciation in
Yen since mid-November is offering a prospect for revival.
Back at home, after seeing a series of policy initiatives from government
beginning from opening up of retail sector to foreign investments to putting up a
cabinet committee on infrastructure to fast-track clearance for large infra
projects to allowing, etc, markets are eyeing on the budget. Lot of bills that are
pending for long are expected to get cleared in the budget, for example, Real
Estate Regulation bill that is pending since 2009, Pension Bill and Insurance Bill
may get passed in the budget. Another key area of concern is growing subsidies.
Against the budgeted petroleum subsidy of Rs 43,580 crore, Oil marketing
companies have already incurred losses of more than Rs 85,000 in the first half of
the current fiscal. As regard to Fertiliser subsidy there are chances that it would
shoot by over Rs 40,000 crore to Rs 1 lac crore from the budgeted estimates of Rs
61,000 crore. Government is trying hard to curb the ballooning subsidies and stick
to fiscal deficit target. In a significant move government allowed full adjustment
of diesel prices for all consumers in which oil marketing companies would revise
prices by 50 paisa/ litre or so every month over a period of eighteen months till
the under-recovery gets fully compensated. Also it revised the limit of subsidized
cooking gas to household to nine cylinders from six capped in September last
year. Government also indicated to cut back on plan & non-plan expenditure and
reiterated of restricting expenditure in the last quarter of the financial year to 33
per cent of the budget estimates. While restricting expenditure would certainly
help in controlling deficit but measures taken to control subsidies may give
limited impact in the current fiscal. After successful auction of NTPC,
government so far has raised around Rs 21,825 crore as against the target of Rs
30,000 crore.
On the commodities front, this week we may see limited action in commodities
market as celebration of the week-long Lunar New Year holiday in China may
result in lackluster trade worldwide. Most of China's manufacturing and
construction activities are expected to slow down. Oil may struggle to sustain
gains in NYMEX. Base metals may see mix trend on weaknesses in immediate
demand. If dollar index sustains above the mark of 80 then it may further hammer
the commodities prices or vice a versa. Consumer confidence of China, CPI of UK,
interest rate decision by Bank of Japan, advance retail sales of US, GDP of Japan,
Germany and euro zone, Michigan confidence of US are few key important events
and economic data's which should give much needed direction to the
commodities, especially when they are witnessing see saw movements on mix
cues.
From The Desk Of Editor

4
NOTES:
1) These levels should not be confused with the daily trend sheet, which is sent every morning by e-mail in the name of "Morning Mantra ".
2) S1 & S2 indicate first support & second support respectively & R1 & R2 indicate first resistance and second resistance respectively.
3) Sometimes you will find the stop loss to be too far but if we change the stop loss once, we will find more strength coming into the stock. At the moment, the stop loss will be far as we are seeing the graphs on weekly basis and taking a long-term view and not a short-term view.
TREND SHEET
STOCKS CLOSING TREND DATE RATE S1 R1 S2 R2 CL.
PRICE TREND TREND S/L
CHANGEDCHANGED
SENSEX 19580 UP 05.07.12 17539 19000 18600 18200
S&P NIFTY 5939 UP 05.07.12 5327 5830 5700 5650
CNX IT 6799 UP 17.01.13 6869 6600 6450 6350
CNX BANK 12349 UP 05.07.12
ACC 1344 DOWN 17.01.13 1359 1400 1420 1430
BHARTIAIRTEL 320 UP 22.11.12 308 335 325 315
BHEL 206 DOWN 01.11.12 227 235 241 246
CIPLA 394 UP 02.08.12 349 405 390 380
DLF 270 UP 03.01.13 239 250 240 235
HINDALCO 113 DOWN 07.02.13 113 119 123 126
ICICI BANK 1145 UP 05.07.12 921 1120 1080 1060
INFOSYS 2790 UP 17.01.13 2798 2650 2570 2500
ITC 304 UP 04.03.11 172 290 285 280
L&T 1496 DOWN 07.02.13 1496 1550 1580 1600
MARUTI 1622 UP 20.09.12 1283 1540 1500 1480
NTPC 148 DOWN 13.12.12 151 - 160 - 165 170
ONGC 320 UP 03.01.13 280 315 305 300
RELIANCE 873 UP 06.12.12 844 860 840 830
TATASTEEL 390 DOWN 07.02.13 390 410 420 425
10642 12200 11700 11400
NEWS
EX-DATE SYMBOL PURPOSE11-FEB-13 IRB INTERIM DIVIDEND RE 1 PER SHARE 11-FEB-13 CONCOR INTERIM DIVIDEND RS 8 PER SHARE11-FEB-13 CUMMINSIND INTERIM DIVIDEND RS 5 PER SHARE12-FEB-13 TRIVENI DIVIDEND RE 0.10 PER SHARE14-FEB-13 MOIL INTERIM DIVIDEND RS 2 PER SHARE 15-FEB-13 SAIL INTERIM DIVIDEND15-FEB-13 POWERGRID INTERIM DIVIDEND18-FEB-13 GAIL INTERIM DIVIDENDMEETING DATE SYMBOL PURPOSE11-FEB-13 ONGC UN-AUDITED FINANCIAL RESULTS11-FEB-13 TATAPOWER FINANCIAL RESULTS11-FEB-13 INDHOTEL RESULTS11-FEB-13 JPASSOCIAT RESULTS11-FEB-13 HEXAWARE RESULTS/DIVIDEND12-FEB-13 SAIL RESULTS/DIVIDEND12-FEB-13 POWERGRID RESULTS/DIVIDEND12-FEB-13 OIL RESULTS12-FEB-13 IFCI RESULTS13-FEB-13 UNITECH RESULTS13-FEB-13 TATASTEEL RESULTS13-FEB-13 NMDC RESULTS/DIVIDEND13-FEB-13 IOC RESULTS13-FEB-13 JSWSTEEL RESULTS13-FEB-13 COALINDIA RESULTS13-FEB-13 BPCL UN-AUDITED FINANCIAL RESULTS14-FEB-13 SBIN RESULTS14-FEB-13 TATAMOTORS RESULTS14-FEB-13 SUZLON RESULTS14-FEB-13 HDIL RESULTS14-FEB-13 DRREDDY UN-AUDITED FINANCIAL RESULTS14-FEB-13 DLF RESULTS
FORTHCOMING EVENTS
DOMESTIC NEWSEconomy·India's government predicted weaker-than-expected expansion for the
financial year ending March 2013. Gross domestic product is set to grow 5 percent in the fiscal 2013, preliminary estimates from the Central Statistical Office revealed. Growth was weaker than the 6.2 percent expansion in the financial year 2012. Earlier, the government had forecast current fiscal year growth between 5.7 percent and 5.9 percent.
Capital Goods·BHEL has bagged a contract worth `2,854 crore for supply of the Steam
Generator Package for three coal-fired thermal units of 660 MW each with supercritical parameters.
·Crompton Greaves (CG) has signed a long-term supply relationship agreement with Transpower NZ Ltd, owners and operators of the New Zealand national grid. With this agreement, CG becomes the first of three preferred vendors to supply transformers to Transpower, with the potential to scale to orders worth USD 15 million annually.
Power·NTPC Ltd has signed a term loan agreement for USD 250 million with State
Bank of India, New York Branch and Mizuho Corporate Bank, Limited., Singapore Branch as Arrangers and Lenders. The proceeds of the loan shall be utilized towards capital expenditure for procurement of goods and services for the ongoing and new projects and renovation and modernization of stations of the Company.
Oil & Gas·GAIL (India) and EDF Trading announced the signing of a memorandum of
understanding (MoU) to jointly acquire and develop upstream oil and gas assets in North America and to partner in trading and optimization of US gas and liquefied natural gas (LNG).
Forgings·Bharat Forge and Elbit Systems Land and C4I, a wholly owned subsidiary of
Elbit Systems, announced a strategic co-operation in India through the establishment of a new joint venture company (JVC), to address the Indian Ministry of Defence and other potential Indian government customers' requirements for the most advances artillery and mortars system solutions.
Gems & Jewellery·Rajesh Exports has bagged an export order worth ̀ 432 crore of designer range
of gold and diamond studded jewellery from Al Malek Jewellery, UAE. The order is to be completed by 31st March 2013.
Travel Agencies·Thomas Cook (India) has signed an investment agreement to acquire a 74%
interest in IKYA Human Capital Solutions, India's leading human resources staffing solutions company, for consideration of `256 crore (approximately US$ 47 million). The transaction remains subject to customary closing conditions and regulatory approvals as required.
INTERNATIONAL NEWS·US initial jobless claims dipped to 366,000, a decrease of 5,000 from the
previous week's revised figure of 371,000. Economists had expected jobless claims to fall to 360,000 from the 368,000 originally reported for the previous week.
·According to a report released by the Institute for Supply Management (ISM), the ISM said US non-manufacturing index edged down to 55.2 in January from a revised 55.7 in December, with a reading above 50 indicating growth in the service sector. Economists had been expecting the index to slide to 55.1 from the 56.1 originally reported for the previous month.
·US factory orders surged up by 1.8 percent in December following a revised 0.3 percent decrease in November. Economists had expected orders to jump by 2.4 percent compared to the marginal increase originally reported for the previous month. The increase in factory orders in December was largely due to an 11.7 percent increase in orders for transportation equipment, which came on the heels of a 0.7 percent decrease in November.
·US construction spending rose 0.9 percent to a seasonally adjusted annual rate of $885.0 billion in December from the revised November estimate of $876.9 billion. Economists had expected construction spending to increase by about 0.8 percent.
·China posted a merchandise trade surplus of $29.2 billion in January. That beat forecasts for a surplus of $24.20 billion following the $31.62 billion surplus in December. Exports surged 25.0 percent on year - also topping expectations for an increase of 17.3 percent after rising 14.1 percent in the previous month. Imports spiked an annual 28.8 percent, beating forecasts for a gain of 23.5 percent after adding 6.0 percent a month earlier.
·Germany's factory orders grew more than expected in December, reflecting robust orders from Eurozone economies. Orders advanced 0.8 percent in December from a month ago, data published by the Federal Ministry of Economics and technology showed.
®

5
BSE SENSEX GAINERS & LOSERS TOP (% Change) NSE NIFTY GAINERS TOP & LOSERS (% Change)
SECTORAL INDICES (% Change)
SMC Trend
SMC Trend
FMCGHealthcare
FTSE 100CAC 40
Auto BankRealty
Cap GoodsCons Durable
Oil & GasPower
NasdaqDow jonesS&P 500
NikkeiStrait times
Hang SengShanghai
INSTITUTIONAL ACTIVITY (Equity) (` Crore)
ITMetal
Down SidewaysUp
SMC Trend
Nifty BSE Midcap Nifty JuniorSensex BSE Smallcap S&P CNX 500
GLOBAL INDICES (% Change)
INDIAN INDICES (% Change)
®
-1.00 -1.02
-2.33
-2.80
-1.24 -1.31
-3.00
-2.50
-2.00
-1.50
-1.00
-0.50
0.00
Nifty Sensex BSE Midcap BSE Smallcap
Nifty Junior S&P CNX 500
1.48
-0.44 -0.47-0.25
-0.89
-2.30
-0.02
-1.87
-4.57-5.00
-4.00
-3.00
-2.00
-1.00
0.00
1.00
2.00
Nasdaq Comp.
Dow Jones S&P 500 Nikkei Strait Times Hang Seng
Shanghai Comp.
FTSE 100 CAC 40
0.49
-1.95
-3.11
-5.27
-0.96
-1.49
0.86
-2.69 -2.71
-3.93
-1.53
-6.00
-5.00
-4.00
-3.00
-2.00
-1.00
0.00
1.00
2.00
Auto Index
Bankex Cap Goods Index
Cons Durable Index
FMCG Index
Healthcare Index
IT Index Metal Index
Oil & Gas Index
Power Index
Realty Index
4.55 4.20 4.11
2.902.47
-11.81-10.93
-8.44
-5.67-5.23
-14.00
-12.00
-10.00
-8.00
-6.00
-4.00
-2.00
0.00
2.00
4.00
6.00
UltraTech Cem.
H D F C Sun Pharma.Inds.
TCS Tata Motors JP Associates Bank of Baroda
B H E L NTPC Tata Power Co.
4.16 4.02
3.05
1.30 1.07
-8.59
-6.57
-5.50 -5.494.74
-10.00
-8.00
-6.00
-4.00
-2.00
0.00
2.00
4.00
6.00
H D F C SunPharma.Inds.
TCS TataMotors
M & M B H E L SterliteInds.
TataPower
Co.
NTPC Cipla
2565.20
888.10
5018.50
1342.70
4.40
-261.00-596.70 -481.30-1000.00
0.00
1000.00
2000.00
3000.00
4000.00
5000.00
6000.00
Friday Monday Tuesday Wednesday
FII Activity MF Activity

Above calls are recommended with a time horizon of 1 year.
Beat the street - Fundamental Analysis
6®
Source: Company Website Reuters Capitaline
Face Value (`) 10.00
52 Week High/Low 375.00 / 239.00
M.Cap (`Cr.) 78920.52
EPS (`) 40.84
P/E Ratio (times) 7.96
P/B Ratio (times) 1.36
Stock Exchange BSE
` in cr
Particular Mar 2012 Mar 2013E Mar 2014E
Revenue 407231.43 467451.26 474549.18
EBITDA 19719.92 16977.99 18817.34
EBIT 14410.66 12392.33 13638.29
Pre-Tax Profit 3995.32 9009.24 10989.71
Net Profit 4225.98 6787.45 8320.87
EPS 17.41 28.06 31.73
BVPS 248.66 268.67 287.96
VALUE PARAMETERS
% OF SHARE HOLDING
INDIAN OIL CORPORATION LIMITED CMP: 325.05
Investment Rationale tonne, during the quarter ended September 2012 up by 1%. Refining throughput of the company was ·The government has announced partial decontrol 13.118 million tonne up by 1% and the throughput in diesel prices and allowed small changes in of the Corporation's countrywide pipelines prices from time to time. This would benefit the network went up by 2% to 18.44 million tonne as state-run oil marketing companies which suffer compared to the corresponding quarter of the under recoveries on domestic sale of diesel, LPG previous year.and kerosene at controlled prices. Post
announcement IOC said in a statement that the Valuation
price of diesel sold to bulk buyers will be increased Recent government decision to allow the state-run oil by `9.25 a liter. Meanwhile the company has marketing companies to raise diesel prices in small already effected 45 paise hike. The government quantities until the loss on selling the fuel at has already decontrol pricing of petrol.controlled price is neutralised and deregulation of
·The company has huge debt in its book as it was petrol would have positive impact on the company.
forced to borrow on account of delayed subsidy Meanwhile the company is also planning to expand its
release and rising working capital requirements. refining capacity which would help the company to
With the partial deregulation of diesel price and maintain sustainable revenue growth going forward.
decontrol of petrol prices, it is expected that the We expect the stock to see a price target of `429 in debt of the company would reduces gradually.one year time frame on a three year average P/B of
·The company is expecting to commission its 1.49x and FY14 (E) book value per share of ̀ 287.96.
`30,000 crore refinery at Paradip in Sep 2013, as a little over 90 percent of work at the refinery is over. It has the capacity to refine 15 million tonnes per annum.
·It has chalked out plans to expand its pipeline network by over 10,000 km in a few years. The capacity of its pipeline network will increase to 50 million tonnes per annum. IOC had recently decided to lay 1,200 km of oil pipeline from Paradip to Hyderabad passing through Visakhapatnam. The company is planning to lay two multi-purpose pipelines originating from Paradip.
·The company sold 17.845 million tonne of products, including exports of 0.766 million
P/E Chart
Face Value (`) 10.00
52 Week High/Low 66.20 / 42.90
M.Cap (`Cr.) 3316.44
EPS (`) 9.72
P/E Ratio (times) 5.79
P/B Ratio (times) 0.88
Stock Exchange BSE
VALUE PARAMETERS
% OF SHARE HOLDING
BANK OF MAHARASHTRA CMP: 56.25 Upside: 40%Target Price: 79
Investment Rationale fiscal taking the total number of branch outlet to 1665. During the quarter ended December 2012 it ·Total Business of the bank as on 31 December 2012 has opened 27 branches.stood at `1,74,355 crore, up by 44.48% on YoY
basis. Total deposits increased by 41.97% to ·The net profit of the bank grew by 43 percent `99276.49 crore while total advances grew by from ̀ 136 crore during Oct-Dec 2011 to ̀ 194 crore 47.93% to ̀ 75078.01crore. during Oct-Dec 2012, owing to lower provisioning
and a good loan growth. The bank's net interest ·Yield on advances increased to 11.49% p.a. for income increased by 23 percent from `645 crore nine months ending December 2012 as compared to ̀ 792 croreto 11.41% during the same period last year. Net
Interest Margin (NIM) for the nine months period Valuationending December 2012 stood at 2.93% and the
During the first nine month of the current fiscal the bank expect to maintain the NIM around this level
bank has delivered decent numbers with robust going forward.
growth in loan book and steady net interest margin. ·The Gross NPA ratio of the bank reduced to 1.71% The asset quality during the quarter ended December
as on 31 December 2012 from 2.06% as on 31 2012 has also improved. It is constantly expanding its December 2011 and Net NPA ratio reduced to business operation by adding new branches. 0.66% at the end of December 2012 from 0.88% as
We expect the stock to see a price target of ̀ 79 in one on 31 December 2011. The provision coverage year time frame on a three year average P/B of 0.91x ratio stood at 82.83% at the ended December and FY14 (E) book value per share of ̀ 86.45.2012.
·As on 31 December 2012 the total outstanding restructured assets stood at `5,266 crore as against the March 2012 figure of ̀ 3227 crore.
·The Capital Adequacy Ratio under Basel II norms stood at 10.70% at the end of December 2012 against the regulatory required level of 9%.
·The Union Cabinet has given its approval for capital infusion of `12,517 crore in various public sector banks (PSBs). The latest round of capital infusion will help bolster the Tier-I capital of PSBs including Bank of Maharashtra.
·The bank has opened 76 branches in the current
` in cr
Particular Mar 2012 Mar 2013E Mar 2014E
Net Total Income 3158.76 3830.00 4605.00
Pre-Tax Profit 658.97 807.00 1,135.00
Net Profit 430.83 642.00 764.00
EPS 5.85 9.70 12.00
BVPS 80.43 74.40 86.45
ROE 9.87 15.40 16.25
P/BV Chart
Upside: 32%Target Price: 429
0.94
11.561.14
78.95
7.4
Foreign
Institutions
Non Promoter Corporate Holding
Promoters
Public & Others
0.59 0.86 1.13 1.39 Close Price
0.00
20.00
40.00
60.00
80.00
100.00
120.00
8-F
eb
-10
18
-Ma
r-1
0
28
-Ap
r-1
0
3-J
un
-10
9-J
ul-
10
16
-Au
g-1
0
22
-Se
p-1
0
28
-Oct
-10
6-D
ec
-10
12
-Ja
n-1
1
18
-Fe
b-1
1
29
-Ma
r-1
1
9-M
ay-1
1
14
-Ju
n-1
1
20
-Ju
l-1
1
26
-Au
g-1
1
5-O
ct-1
1
16
-No
v-1
1
23
-De
c-1
1
30
-Ja
n-1
2
6-M
ar-
12
16
-Ap
r-1
2
22
-May
-12
28
-Ju
n-1
2
3-A
ug
-12
11
-Se
p-1
2
19
-Oct
-12
29
-No
v-1
2
7-J
an
-13
1.42 4.64 0.11
9.59
78.92
Foreign
Institutions
Govt Holding
Non Promoter Corporate Holding
Promoters
0.00
100.00
200.00
300.00
400.00
500.00
600.00
8-Fe
b-1
0
18-M
ar-1
0
28-A
pr-1
0
3-Ju
n-10
9-Ju
l-10
16-A
ug-1
0
22-S
ep-1
0
28-O
ct-1
0
6-D
ec-1
0
12-J
an-1
1
18-F
eb-1
1
29-M
ar-1
1
9-M
ay-1
1
14-J
un-1
1
20-J
ul-1
1
26-A
ug-1
1
5-O
ct-1
1
16-N
ov-1
1
23-D
ec-1
1
30-J
an-1
2
6-M
ar-1
2
16-A
pr-1
2
22-M
ay-1
2
28-J
un-1
2
3-A
ug-1
2
11-S
ep-1
2
19-O
ct-1
2
29-N
ov-1
2
7-Ja
n-13
1.01 1.39 1.77 2.15 Close Price

Charts by Spider Software India Ltd
7
EQUITY
The stock closed at `848.75 on 07th February 2013. It made a 52-week low at
`550 on 28th February 2012 and 52-week high of `902.05 on 27th December
2012. The 200 days Exponential Moving Average (EMA) of the stock on the weekly
chart is currently at ̀ 523.65.
Stock was forming the “Bull Flag” pattern on weekly charts which is bullish in
nature. It took around five months to form so the potential of rise is quite strong.
For confirmation, stock has given the breakout of pattern during last traded with
high volume so one can initiate long in range of 830-840 for the upside target of
910-930 with closing below SL of 810.
Above calls are recommended with a time horizon of 1-2 months
The stock closed at `284.95 on 07th February 2013. It made a 52-week low at
`207.90 on 04th June 2012 and 52-week high of ̀ 321.80 on 16th November 2012.
The 200 days Exponential Moving Average (EMA) of the stock on the weekly chart
is currently at ̀ 279.63
Stock is continuously trading in range of 200-300 levels from past one and half
months forming the “Inverted Head and Shoulder” pattern on weekly charts
which is considered to be bullish. As of now, stock is unable to give the pattern
breakout but its consolidation from past few weeks indicates that there will be a
strong spurt in near term. Stock has breached its 200EMA in last traded week
accompanied by higher volume. Therefore, one can initiate long in range of 280-
284 for the upside target of 310-315 with closing below SL of 270.
The stock closed at `510.95 on 07th February 2013. It made a 52-week low at
`395.10 on 23rd May 2012 and 52-week high of `542.40 on 03rd January 2013.
The 200 days Exponential Moving Average (EMA) of the stock on the weekly chart
is currently at ̀ 406.21
Short term and medium term bias remains positive for the stock. It is
continuously moving higher while trading in higher highs and higher lows sort of
“Rising Wedge” pattern on weekly chart. As technically required, it is
comfortably trading above its 200EMA which also gives the positive outlook.
Trader with short term horizon can consider buying in range of 500-508 for the
target of 560-580 with closing below SL of 480.
APOLLO HOSPITAL ENTERPRISE LIMITED
CUMMINS INDIA LIMITED
BIOCON LIMITED
®

8
DERIVATIVES
BASIS GAP IN NIFTY
HAVELLS (FEB FUTURE )
Buy: Above 674
Target: 688
Stop loss: 668
`
`
`
APOLLOTYRE (FEB FUTURE )
Buy: Above 87
Target: `91
Stop loss: `85
`
RELIANCE
Buy FEB.860 PUT 15.00
Sell FEB.840 PUT 7.85
Lot size: 250
BEP: 852.85
Max. Profit: 3212.50 (12.85*250)
Max. Loss: 1787.50 (7.15*250)
OPTIONSTRATEGY
FUTURESTRATEGY
HDFCBuy FEB. 820 CALL 10.00Buy FEB. 800 PUT 9.00
Lot size: 500Upside BEP: 839.00Downside BEP: 781.00Max. Profit: UnlimitedMax. Loss: 9500.00 (19.00*500)
M&M (FEB FUTURE)
Sell: Below 877
Target: 860
Stop loss: 885
`
`
`
Nifty underperformed its global peers in the February series. The index witnessed a breakdown from the future levels of 5950 and managed to breach
the psychological level, led by long unwinding and fresh short buildup. Closure of long positions was clearly evident. On the index options front
significant short accumulation was evident in the 6100 call-option strikes with maximum open interest of more than 75 lakh shares. The 5900 put-
option strikes also saw accumulation of long positions. Currently, option writing in OTM 6100 call-option strikes suggests that upside is capped
however current Nifty can move down to 5800 levels. The implied volatility (IV) showed a different trend as put options are trading at higher IVs than
call IV implying significant call writing. The implied volatility (IV) of call options closed at 11.22%, while the average IV of put options closed at
11.70%. The Nifty is expected to trade down trending in coming weeks and the sharp move may cause the rise in volatility. Hereafter the range of
5800-6000 will remain crucial in the near term, and the movement is expected to remain volatile.
WEEKLY VIEW OF THE MARKET
NIFTY TOTAL OPEN INTEREST (in share)
FII'S ACTIVITY IN F&O IN LAST TEN SESSIONS
(Derivative segment) `(Cr)
FII'S ACTIVITY IN F&O IN LAST WEEK
(Derivative segment)
DLFBuy FEB.280 CALL 4.40Buy FEB.260 PUT 4.90
Lot size: 1000Upside BEP: 289.30Downside BEP: 250.70Max. Profit: UnlimitedMax. Loss: 9300.00 (9.30*1000)
BEARISH STRATEGYVOLATILITY STRATEGY
DERIVATIVE STRATEGIES
®
-573.92
348.37
2269.15
1338.04
266.44
934.26
162.96
795.01
385.37519.49
-1000.00
-500.00
0.00
500.00
1000.00
1500.00
2000.00
2500.00
25-Jan 28-Jan 29-Jan 30-Jan 31-Jan 01-Feb 04-Feb 05-Feb 06-Feb 07-Feb
BUY100.0%
SELL0.0%
-5
0
5
10
15
20
25
30
35
40
45
23-Jan 25-Jan 28-Jan 29-Jan 30-Jan 31-Jan 01-Feb 04-Feb 05-Feb 06-Feb 07-Feb
395450 327550 302100508200
1582000
4686550
7440450
6127050
4379800
1835650
685200
1102100
4231500
6175250
5398350
6079500
4259900
1727600
1059150
433500317600 182700
0
1000000
2000000
3000000
4000000
5000000
6000000
7000000
8000000
5500 5600 5700 5800 5900 6000 6100 6200 6300 6400 6500
Call Put

9
BHARTIARTL 8299000 7332000 -11.65 0.62 0.36 -0.26 32.53 30.87 -1.66
DLF 12167000 15618000 28.36 0.72 0.71 -0.01 41.16 36.43 -4.73
HINDALCO 42648000 39808000 -6.66 0.35 0.40 0.05 45.06 40.43 -4.63
HINDUNILVR 6252500 6211500 -0.66 0.55 0.55 0.00 22.16 24.98 2.82
ICICIBANK 8919500 8553750 -4.10 0.28 0.34 0.06 28.43 26.07 -2.36
IDEA 9716000 9188000 -5.43 0.57 0.45 -0.12 37.19 37.34 0.15
INFY 2323000 2376375 2.30 1.44 1.32 -0.12 21.12 17.28 -3.84
ITC 18963000 17070000 -9.98 1.47 1.35 -0.12 21.42 21.66 0.24
JPASSOCIAT 66076000 84252000 27.51 0.48 0.39 -0.09 46.87 51.34 4.47
NTPC 13822000 32232000 133.19 0.38 0.34 -0.04 19.87 20.62 0.75
ONGC 9287000 8917000 -3.98 0.20 0.18 -0.02 34.51 34.06 -0.45
RANBAXY 7286000 6787000 -6.85 0.49 0.44 -0.05 32.62 29.91 -2.71
RCOM 59148000 59080000 -0.11 0.33 0.38 0.05 49.97 53.53 3.56
RELIANCE 10550000 9644750 -8.58 0.38 0.35 -0.03 23.90 21.80 -2.10
S&P CNX NIFTY 12587950 12833600 1.95 1.08 1.07 -0.01 12.92 11.22 -1.70
SAIL 19156000 18664000 -2.57 0.44 0.45 0.01 36.52 38.07 1.55
SBIN 4956750 5274250 6.41 0.54 0.61 0.07 31.00 31.49 0.49
SUZLON 111280000 143208000 28.69 0.31 0.60 0.29 65.00 51.70 -13.30
TATASTEEL 17001000 16925000 -0.45 0.50 0.49 -0.01 30.88 30.72 -0.16
UNITECH 97470000 93030000 -4.56 0.27 0.27 0.00 65.03 60.80 -4.23
IMPORTANT INDICATORS OF NIFTY AND OTHER ACTIVE FUTURE CONTRACTS
OPEN INTEREST PCR RATIO IMPLIED VOLATILITY
SCRIPTS PREV. CURRENT % PREV. CURRENT PREV. CURRENT WEEK WEEK CHANGE WEEK WEEK CHANGE WEEK WEEK CHANGE
DERIVATIVES
Put Call Ratio Analysis : The Put-Call open interest ratio of Nifty has decreased
to 1.07 from 1.08. At the end of the week, the maximum stocks had a negative of
change in put call open interest ratio.
Implied Volatility Analysis : The Implied Volatility (IV) for Nifty futures this week
has decreased to 11.22% from 12.92%.The IV of the stock futures has changed this
week ranging from -13.3% to 4.47%.
Open Interest Analysis : The open interest for the index at the end of this week
has increased by 1.95% as compared to the previous week. All future stocks saw
changes in their open interest ranging from -11.65% to 133.19%. NTPC has the
maximum increase in open interest as compared to other stocks.
Statistical Analysis·
Open 6068.95 High 6078.00
Low 5940.10 Close 5961.10
NIFTY & IV CHART NIFTY ANALYSIS
®
* **
* Jan Series ** Feb Series
12.00
13.00
14.00
15.00
5,900.00
6,000.00
6,100.00
01-Feb 04-Feb 05-Feb 06-Feb
Nifty Close IV

10
Bullions counter will continue to remain in tight range on mixed
fundamentals. On the one hand good economic data from US is reducing the
safe haven appeal, while on the other hand euro zone concerns and strong
physical demand has capped the downside. In near term movement of local
currency rupee will affect domestic prices which can trade in range of 52.5-
54.5 levels. Greenback has taken key support near 79 levels. Gold may trade
in the range of $1630-1690 in COMEX and 30200-31200 in MCX. White metal
silver can trade in range of 57000-59500. Recently Reserve Bank of India
stated that it would also consider introducing gold linked financial
instruments to divert savings of inflation wary Indians from gold bars and
coins into bonds. India, which imported about 750 tonnes of gold, last year
with 60 percent of that through banks has already increased the import duty
on gold, which now stands at 6 percent. The ultra easing policy by the
central banks will support the yellow metal prices. Federal Reserve is likely
to maintain its quantitative easing program through the end of this year and
possibly into early 2014. Meanwhile Hong Kong's net gold flow to mainland
China jumped 47 percent in 2012 to a record high of 557.478 tonnes. Hong
Kong shipped 114.372 tonnes of gold to China in December, also a record
high for monthly exports. This week China Lunar Year holidays will dampen
the demand of yellow metal.
BULLIONS
ENERGY COMPLEX
The upside momentum in crude oil counter can witness some pause as some profit booking can be seen due to rise in greenback but spurt in middle tensions and indications of global economic recovery will continue to lend support to the prices. U.S. services sector expanded again last month, extending a three year run of growth, while European business optimism hit an eight month high, suggesting the euro zone economy was starting to recover. Crude oil can trade in range of 5050-5300 in MCX and $94 to $99 in NYMEX. Meanwhile the Brent and WTI spread expanded sharply from 15.6 to 21 as Middle East tensions lend support to Brent prices. Crude inventories rose 2.62 million barrels in the week, compared with expectations for a 2.8 million barrel rise. U.S. refinery utilization fell 0.8 percentage point to 84.2 percent of total capacity. The comments from Iran's supreme leader came as the U.S. moved to tighten sanctions on the nation while opening the door to direct talks on the nuclear issue. Iran, which had been the second biggest producer in the Organization of the Petroleum Exporting Countries, has seen its crude exports drop by more than half to near one million barrels a day, due to sanctions. Natural gas prices can trade on volatile path on mixed fundamentals. It can trade in range of 170-185 in MCX. Recently bearish weekly inventory report weighed on the market, though a colder outlook for the second half of the month helped limit the downside. Natural gas prices are likely to garner support late next week as another blast of cold air moves into the Midwest and then spreads east.
CPO futures (Apr) on the international bourse will probably trade higher surpassing 2600 levels. There are expectations that reserves in Malaysia may have dropped from a record after the announcement of exports at zero duty in the month of January and extended it to February to clear the reserves. According to the Plantation Industries and Commodities Minister Bernard Dompok, the same tariff is likely to continue for a third month in March if prices remain below a threshold of 2,250 ringgit a ton. In days to come, investors would be eyeing the data to be released by the Malaysian Palm Oil Board on Feb. 13. Back at home, CPO futures (Mar) is expected to remain range bound maintaining support above 455 levels. Market participants are bit cautious ahead of the import data scheduled to be published next week by the Solvent Extractors' Association of India. Mustard futures (Apr) is expected to plunge further towards 3300 levels. This season area under cultivation at 67.17 lakh hectares has crossed the previous year's figures 65.35 lakh hectares. The current status is as follows: in Rajasthan the crop is in seed development stage; pod development stage in Madhya Pradesh, Punjab and Gujarat; in West Bengal the crop is in pod maturity to development stage. Soybean futures (Mar) will probably trade on a higher side, breaking its multi-week consolidation above 3300 levels. Sustained export enquiries of soymeal restricted selling by farmers may add strength to the counter.
OIL AND OILSEEDS
Base metals may remain sideways with upside bias. However there will be lack of demand from the key consumer China, which will be celebrating lunar year holiday from 9 -15 February. Meanwhile growing premium of some base metals due to financing deals can continue to give support to the metals. Copper may move in range of 430-455. Improved outlook for the global economy this year, reflected in positive data from China and the United States is supporting the prices although the optimism has yet to translate into strong physical demand. World No. 3 copper mine Collahuasi stated that its mineral resources grew by 19 percent to 9 billion tonnes last year compared with 2011 levels, due in part to new drilling campaigns. Aluminum prices may trade in range of 109-115 while Lead can trade in range of 126-133. Zinc may hover in range of 113-118. Stockpiles of zinc tracked by the LME are within about 3 percent of the peak in December, which was the highest since 1994. Nickel prices can trade in the range of 955-995 in MCX. LME Nickel inventory figures have been rising steadily since November 2011 and at just under 151,000 tonnes are at their highest level since April 2010. Russia's Norilsk Nickel, the world's largest nickel and palladium miner, plans to invest around $2.52 billion in 2013. Meanwhile government of Shanghai, China's financial hub aims to launch an electronic system this year to track collateral used in commodities warehouse financing, in a bid to strengthen the banking system after trade defaults.
BASE METALS
The downside momentum in chilli futures may get extended towards 6500
levels. The pace of fresh arrivals is catching up from major producing
states. Exporters are keeping away and local traders and curry powder
manufacturers are picking up only small quantities. There are reports that
India is facing stiff competition on the international platform as China's
production has crossed 1.5 lakh tonne and this number has enabled it to sell
the spice cheaply in the global market. Turmeric futures (Apr) is expected
to consolidate in the range of 6050-6450 levels. Fresh turmeric from Mysore
is arriving daily in about 50 to 75 bags & more is likely to get added up from
Erode district by the first week of March. On the other hand, exporters are
eagerly waiting for the upcountry orders. The bearish phase may continue
to over jeera futures as new crop arrivals have started coming slowly
around 300-400 bags on daily basis. This season production is estimated at
55000 tons against 43000 tons projected for the year 2012. Pepper futures
(Mar) will possibly trade with a negative bias facing resistance near 37500
levels. Market participants are expecting good yields from the top-
producing states of Kerala and Karnataka. Fresh pepper have started
arriving are being traded at 385, 395 and 405 a kg depending upon the
quality such as bulk density, moisture content and area of production.
` ` `
SPICES
OTHER COMMODITIES
Wheat futures (Mar) is likely to trade in range of 1430-1490 levels. Mixed
sentiments of over supplied inventories & prospects of allowance of
exports by mid-next week, prevailing in the counter may keep the counter
under a consolidation. India has been struggling to manage huge stocks,
built up due to bumper harvests in recent years. Wheat stocks at
government warehouses on Feb. 1 were 30.8 million tonnes, nearly four
times the official target of 8.2 million tonnes for the quarter ending March
31. Sugar futures (Mar) is likely to extend its downtrend towards 2900
levels, as the sweetener is reeling under pressure of arrivals from both old
& new stocks. The demand at the spot markets is weak due to the winter
and absence of bulk consumers. Moreover, a weaker rupee is making
imports viable, adding up to the over-supplied market. Sugar production
has touched 13.75 million tonnes in the first three months of the 2012-13
crushing season starting October. Kapas futures (Apr) will possibly remain
in negative zone with upside remaining capped near 920 levels. In the
current scenario, spot markets are witnessing higher arrivals & export
demand seems to be limited. Cotton supplies in spot markets across the
country stood at 240,000-250,000 bales of 170 kg each per day, up from
200,000 bales per day earlier this month. This is giving a word of caution to
market participants to take fresh positions.
®
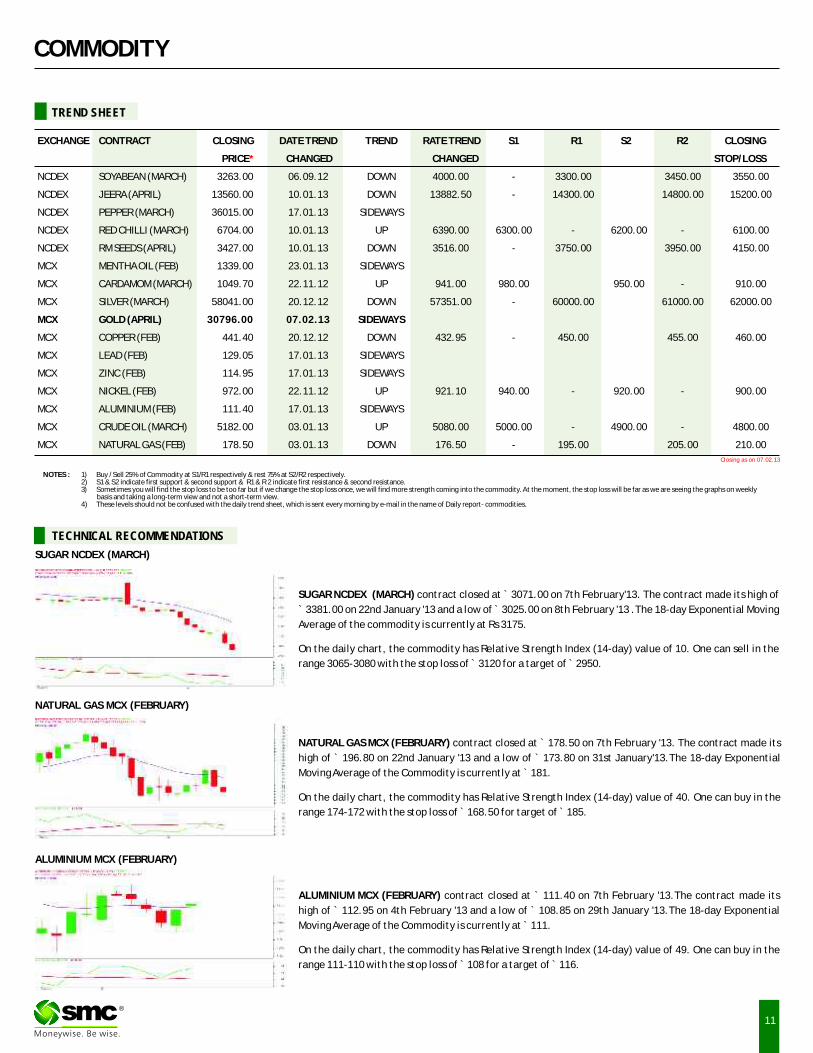
Closing as on 07.02.13
11
NOTES : 1) Buy / Sell 25% of Commodity at S1/R1 respectively & rest 75% at S2/R2 respectively.2) S1 & S2 indicate first support & second support & R1 & R 2 indicate first resistance & second resistance. 3) Sometimes you will find the stop loss to be too far but if we change the stop loss once, we will find more strength coming into the commodity. At the moment, the stop loss will be far as we are seeing the graphs on weekly
basis and taking a long-term view and not a short-term view.4) These levels should not be confused with the daily trend sheet, which is sent every morning by e-mail in the name of Daily report- commodities.
TECHNICAL RECOMMENDATIONS
EXCHANGE CONTRACT CLOSING DATE TREND
CHANGED
NCDEX SOYABEAN (MARCH) 3263.00 06.09.12 DOWN 4000.00 - 3300.00 3450.00 3550.00
NCDEX JEERA (APRIL) 13560.00 10.01.13 DOWN 13882.50 - 14300.00 14800.00 15200.00
NCDEX PEPPER (MARCH) 36015.00 17.01.13 SIDEWAYS
NCDEX RED CHILLI (MARCH) 6704.00 10.01.13 UP 6390.00 6300.00 - 6200.00 - 6100.00
NCDEX RM SEEDS (APRIL) 3427.00 10.01.13 DOWN 3516.00 - 3750.00 3950.00 4150.00
MCX MENTHA OIL (FEB) 1339.00 23.01.13 SIDEWAYS
MCX CARDAMOM (MARCH) 1049.70 22.11.12 UP 941.00 980.00 950.00 - 910.00
MCX SILVER (MARCH) 58041.00 20.12.12 DOWN 57351.00 - 60000.00 61000.00 62000.00
MCX GOLD (APRIL) 30796.00 07.02.13 SIDEWAYS
MCX COPPER (FEB) 441.40 20.12.12 DOWN 432.95 - 450.00 455.00 460.00
MCX LEAD (FEB) 129.05 17.01.13 SIDEWAYS
MCX ZINC (FEB) 114.95 17.01.13 SIDEWAYS
MCX NICKEL (FEB) 972.00 22.11.12 UP 921.10 940.00 - 920.00 - 900.00
MCX ALUMINIUM (FEB) 111.40 17.01.13 SIDEWAYS
MCX CRUDE OIL (MARCH) 5182.00 03.01.13 UP 5080.00 5000.00 - 4900.00 - 4800.00
MCX NATURAL GAS (FEB) 178.50 03.01.13 DOWN 176.50 - 195.00 205.00 210.00
TREND RATE TREND S1 R1 S2 R2 CLOSING
PRICE CHANGED STOP/LOSS*
TREND SHEET
COMMODITY
SUGAR NCDEX (MARCH) contract closed at ̀ 3071.00 on 7th February'13. The contract made its high of
` 3381.00 on 22nd January '13 and a low of ̀ 3025.00 on 8th February '13 .The 18-day Exponential Moving
Average of the commodity is currently at Rs 3175. On the daily chart, the commodity has Relative Strength Index (14-day) value of 10. One can sell in the
range 3065-3080 with the stop loss of ̀ 3120 for a target of ̀ 2950.
NATURAL GAS MCX (FEBRUARY) contract closed at ̀ 178.50 on 7th February '13. The contract made its
high of ` 196.80 on 22nd January '13 and a low of ` 173.80 on 31st January'13.The 18-day Exponential
Moving Average of the Commodity is currently at ̀ 181.
On the daily chart, the commodity has Relative Strength Index (14-day) value of 40. One can buy in the
range 174-172 with the stop loss of ̀ 168.50 for target of ̀ 185.
ALUMINIUM MCX (FEBRUARY) contract closed at ` 111.40 on 7th February '13.The contract made its
high of ` 112.95 on 4th February '13 and a low of ` 108.85 on 29th January '13.The 18-day Exponential
Moving Average of the Commodity is currently at ̀ 111.
On the daily chart, the commodity has Relative Strength Index (14-day) value of 49. One can buy in the
range 111-110 with the stop loss of ̀ 108 for a target of ̀ 116.
®
SUGAR NCDEX (MARCH)
NATURAL GAS MCX (FEBRUARY)
ALUMINIUM MCX (FEBRUARY)

12
COMMODITY
NEWS DIGEST
Mixed sentiments occurred in commodities market in the week gone by. Surge in dollar index
capped the upside of commodities. Most of the base metals traded weak on profit booing at
higher side. Zinc prices dropped on oversupply issue. Supply of zinc may exceed demand by
161,000 tonnes in the first quarter, compared with a surplus of 103,000 tonnes in the last three
months of 2012. Yellow metal rebound after a step four week long fall on lower level buying.
Gold outperformed silver last week. After a very strong rally of two months in which it saw a
rally from $85 to 98, crude prices moved down on profit booking at higher side. Total U.S. crude
stockpiles climbed 2.62 million barrels, as per EIA report. Gasoline supplies rose 1.74 million
barrels and distillates slid by 1.04 million. Natural gas prices surged on weather issue last week
but on Thursday it shed its gain to some extent on inventory isssue.
In spices weak sentiments witnessed in chilli on new crop arrivals. Exporters were away from
the market and local traders and curry powder manufacturers were picking up only small
parcels. Steady sentiments noticed in turmeric on stockiest buying. Buying was limited though
as Internal and export demand was minimal. After many weeks upside, rally looked stalled in
black pepper. Fresh pepper started trickling in though in small quantity. With weak sentiment
witnessed in domestic cumin seed market, futures market also traded in negative zone. New
crop arrivals started slowly around 300 – 400 bags on daily basis. India's production for 2013 is
estimated at 55000 tonnes against 43000 tonnes projected for the year 2012. Oil seeds and
edible oil market traded mix on limited buying activities on weakness in electronic CBOT
soybeans on chances of rains in Argentina and fall in BMD CPO. India probably imported a record
quantity last month as traders and refiners rushed to buy before a tax increase, boosting
domestic stockpiles to an all-time high. Selling pressure sent sugar prices down on both
domestic and overseas market. In India, Food ministry is seeking approval from cabinet
regarding decontrolling sugar sector. This is the first time that government is showing such bold
attitude towards reforms in sugar sector. Dull demand and higher arrivals in spot market
stimulated selling pressure in chana futures too. Wheat was steady to slightly firm on strong
domestic and international demand. Lower export demand for Indian corn as cheaper corn
being offered from Latin America weighed on the domestic maize prices.
WEEKLY COMMENTARY
WEEKLY STOCK POSITIONS IN WAREHOUSE (NCDEX)
COMMODITY UNIT 30.01.13 06.02.13 DIFFERENCE
QTY.
BARLEY MT 609.00 0.00 -609.00
CASTOR SEED MT 115952.00 107715.00 -8237.00
CHANA MT 15176.00 0.00 -15176.00
CORIANDER MT 3387.00 0.00 -3387.00
COTTONSEED OILCAKE MT 74764.00 84104.00 9340.00
MAIZE MT 43724.00 36687.00 -7037.00
RAPE MUSTARD SEED MT 26505.00 0.00 -26505.00
SOYA BEAN SEEDS MT 38467.00 1290.00 -37177.00
SUGAR S KOL MT 577.00 2725.00 2148.00
SUGAR M MT 11234.00 15731.00 4497.00
WHEAT MT 4296.00 4296.00 0.00
COMMODITY UNIT 30.01.13 07.02.13 DIFFERENCE
QTY. QTY.
CARDAMOM MT 24.20 23.00 -1.20
COTTON BALES 25600.00 33200.00 7600.00
GOLD KGS 2764.00 1257.00 -1507.00
GOLD MINI KGS 1584.30 1618.00 33.70
GOLD GUINEA KGS 258.51 259.78 1.27
MENTHA OIL KGS 1081080.25 1081080.25 0.00
MILD STEEL MT 254.92 254.92 0.00
SILVER (30 KG Bar) KGS 112230.32 114864.73 2634.41
·CME Group Inc. (CME) would cut the collateral
requirements for trading in gold, gasoline, and
metals and energy futures contracts effective
at the close of business on 12th February.
·China's gold production rose for a sixth
consecutive year and hit a record 403 tonnes in
2012.
·China's iron ore imports are expected to fall in
January after surging to a record high in
December.
·Saudi Arabia produced 9.05 million barrels a day
in January, from 9.025 million bpd in December.
·India's grains output in the current crop year to
June 30 have already exceeded 250 million
tonnes.
·India's sugar output rose 3% to 13.75 million
tonnes on year in the first four months of the
season beginning October.
·India exported 619,793 tonnes of soymeal in
January, up from 494,456 tonnes in the previous
month - Solvent Extractors' Association of India
(SEA).
WEEKLY STOCK POSITIONS IN WAREHOUSE (MCX)
®
NCDEX TOP GAINERS & LOSERS (% Change) MCX TOP GAINERS & LOSERS (% Change)
2.19
1.241.04 1.00
0.63
-6.08
-3.62-3.38
-2.58 -2.46
-7.00
-6.00
-5.00
-4.00
-3.00
-2.00
-1.00
0.00
1.00
2.00
3.00
TURMERIC WHEATNEW
STEEL LONG
SOYAMEAL GOLD NEW
RED CHILLI
BARLEY SOYA OIL
CHANA JEERA
3.97
1.19 1.11
0.64
0.06
-1.83 -1.78 -1.77
-1.31 -1.22
-3.00
-2.00
-1.00
0.00
1.00
2.00
3.00
4.00
5.00
MENTHAOIL
NATURALGAS
BR.CRUDEOIL
GOLD COTTON KAPAS KHALI
NICKEL KAPAS POTATO LEAD

Sugar…….finally on the way of freedom
13
SPOT PRICES (% change)
COMMODITY
WEEKLY STOCK POSITIONS IN LME (IN TONNES)
COMMODITY STOCK POSITION STOCK POSITION DIFFERENCE
31.01.13 07.02.13
ALUMINIUM 5156975 5138775 -18200
COPPER 371750 388900 17150
LEAD 290850 287500 -3350
NICKEL 150012 150996 984
TIN 13420 13315 -105
ZINC 1208725 1196025 -12700
INTERNATIONAL COMMODITY PRICES
COMMODITY EXCHANGE CONTRACT UNIT 01.02.13 07.02.13 CHANGE (%)
Soya CBOT MAR Cent per Bushel 1474.25 1486.75 0.85
Maize CBOT MAR Cent per Bushel 736.00 710.75 -3.43
CPO* BMD APR MYR per MT 2566.00 2551.00 -0.58
Sugar LIFFE MAR 10 cents per MT 502.50 490.40 -2.41
COMMODITY EXCHANGE CONTRACT 01.02.13 07.02.13 CHANGE%
ALUMINIUM LME 3 MONTHS 2091.50 2066.00 -1.22
COPPER LME 3 MONTHS 8189.00 8212.00 0.28
LEAD LME 3 MONTHS 2436.00 2406.50 -1.21
NICKEL LME 3 MONTHS 18445.00 18220.00 -1.22
TIN LME 3 MONTHS 24800.00 24955.00 0.63
ZINC LME 3 MONTHS 2149.00 2137.00 -0.56
GOLD COMEX APR 1670.60 1671.30 0.04
SILVER COMEX MAR 3195.80 3140.30 -1.74
LIGHT CRUDE OIL NYMEX MAR 97.77 95.83 -1.98
NATURAL GAS NYMEX MAR 3.30 3.29 -0.48
PRICES OF METALS IN LME/ COMEX/ NYMEX (in US $)
The Central government is considering on the proposal to decontrol the Rs 80,000
crore sugar industries to sell the sweetener in open market. According to food
minister K V Thomas “The decision on decontrolling levy sugar and release
mechanism system will definitely be taken before Budget."
Sugar sector is highly regulated as Sugar is a politically sensitive commodity. The
sector was brought under strict regulation 50 years ago in 1963. Through the
release mechanism, the Centre fixes the sugar quota that can be sold in the open
market. Under the levy system, it asks mills to contribute 10 per cent of output to
run ration shops costing the industry Rs 3,000 crore a year. Currently, the Centre
buys sugar from mills at about Rs 19.01 per kg and sells to ration card holders at Rs
13.50 per kg that has not been revised since 2001-02.
The sector has not got freedom from state controls after more than two decades of
economic liberalization. In October 2012, the expert panel headed by PMEAC
chairman C Rangarajan, had recommended immediate removal of two major
controls—regulated release mechanism and levy sugar obligation.
Some facts about decontrolling sugar industry
·The removal of release mechanism would help mills manage inventories and
cash-flows better.
·The abolition of levy sugar system would result in liquidity of around of Rs 3,000
crore annually to more than 500 sugar mills that it currently incurs on selling
cheaper sugar to the Centre for running PDS.
·Currently, mills have to sell 10% of total production to the government at Rs
19.01 per kg, a fraction of the wholesale market price of Rs 34 per kg, for public
distribution through ration shops.
·Now the government will have to buy sugar at market price from mills.
·The abolition of levy obligation would shift the subsidy burden, presently borne
by industry, on the government for supplying cheaper sugar to poor families.
·The government supplies around 2.7 mt to poor families and defence forces at
rates much below the market price bearing a subsidy burden of Rs 2,500-3000
crore a year.
·Poor families get 500 gm to 1.3 kg of sugar per person per month from ration
shops at Rs 13.50 a kg.
·Sugar decontrol will improve the business for the Industry and will also pave the
way for more easing in sense of cane prices in couple of years to come.
·The sugar mills would be free to make commercial decisions about when to sell,
how much to sell and the prices of sales as well.
·As a result of a competitive industry, bulk buyers like cola makers, chocolate
and sweetmeat makers who account for the 70 per cent of Indian demand, will
get better prices and quality.
·The farmers will also benefit by getting a good cane price once the industry
benefits.
·According to Crisil, the rating agency, the profitability of sugar firms may
increase by 50 percent if the sector is decontrolled.
·Decontrol will reduce their working capital requirement.
·It will help the sugar mills to settle their dues to farmers on time.
®* Previous closing as on 04.02.13
-8.08
-2.85
-2.57
-2.22
-1.89
-1.48
-1.23
-0.80
-0.71
-0.25
-0.21
-0.13
0.00
0.00
0.00
0.16
0.20
0.32
0.57
3.54
-10.00 -8.00 -6.00 -4.00 -2.00 0.00 2.00 4.00 6.00
CHANA (DELHI)
REFINED SOYA OIL (INDORE)
MASOOR (INDORE)
CORIANDER (KOTA)
TURMERIC (NIZAMABAD)
CHILLI (GUNTUR)
CARDAMOM (VANDANMEDU)
JEERA (UNJHA)
BARLEY (JAIPUR)
MUSTARD (JAIPUR)
SILVER (DELHI)
WHEAT (DELHI)
CRUDE PALM OIL (KANDLA)
GUR (MUZAFFARNGR.)
MILD STEEL INGOTS (GHAZIABAD)
GOLD KG (MUMBAI)
PEPPER MALABAR GAR (KOCHI)
RUBBER (KOCHI)
SOYABEAN (INDORE)
RAW JUTE (KOLKATA)

14
CURRENCY
Currency Table
Currency Pair Open High Low Close
USD/INR 53.21 53.40 52.88 53.22
EUR/INR 72.31 72.88 71.15 71.29
GBP/INR 84.42 84.68 82.77 83.57
JPY/INR 58.17 58.19 56.38 56.87
(Source: Thomson Reuters, Open: Friday (Prior) 9.00 AM IST, Close: Thursday 5.00 PM IST)
News Flows of last week
05th Feb: Surprise growth in UK services cuts chance of recession
05th Feb: The U.S. services sector expanded in January
06th Feb: UK House prices dipped on the month in January
07th Feb: British industrial output rose a touch more than expected in December
07th Feb: U.S Consumer borrowing rose in December
07th Feb: U.S. nonfarm productivity fell in fourth quarter by most in nearly two years
07th Feb: The number of Americans filing new claims for jobless benefits fell last week
USD/INR (FEBRUARY) contract closed at `53.42 on 07th February'13. The contract made its high of `59.25 on 22nd June'12 and a low of `51.91 on 29th February 12.The 14-day Exponential Moving Average of the USD/INR is currently at ̀ 53.78.
On the daily chart, the USD/INR has Relative Strength Index (14-day) value of 41.17. One can buy around 53.45 for a target of `54.45 with the stop loss of `52.95.
EUR/INR (FEBRUARY) contract closed at ̀ 72.46 on 07th February'13. The contract made its high of `73.75 on 14th January'13 and a low of `70.60 on 06th November'12.The 14-day Exponential Moving Average of the EUR/INR is currently at ̀ 72.38.
On the daily chart, EUR/INR has Relative Strength Index (14-day) value of 45.47. One can sell below 71.65 for a target of ̀ 70.65 with the stop loss of ̀ 72.15
GBP/INR JPY/INR
JPY/INR (FEBRUARY) contract closed at ̀ 56.98 on 07th February'13. The contract made its high of `68.49 on 31st Octoberr'12 and a low of `56.62 on 06th February'13.The 14-day Exponential Moving Average of the JPY/INR is currently at `58.76.
On the daily chart, JPY/INR has Relative Strength Index (14-day) value of 26.50. One can sell around 58.95 for a target of ̀ 57.95 with the stop loss of ̀ 59.45
GBP/INR (FEBRUARY) contract closed at `83.94 on 07th February'13. The contract made its high of `90.35 on 21st December'12 and a low of `82.56 on 04thFebruary'13. The 14-day Exponential Moving Average of the GBP/INR is currently at ̀ 84.90.
On the daily chart, GBP/INR has Relative Strength Index (14-day) value of 35.11. One can buy above 85.00 for a target of Rs 86.00 with the stop loss of ̀ 84.50
USD/INR EUR/INR
Market Stance
Currency market remained sidelined in the week gone by with India rupee
settled with minor losses against dollar after a government projection
estimated economic growth in the fiscal year will be worse than expected,
raising concerns about how it would fund its fiscal and current account
deficits. The government said the country's slowest growth in a decade
could be much worse than earlier projections. Preliminary data released on
Thursday showed the economy set to have grown 5.0 percent in the fiscal
year ending next month, underscoring the urgent need for reforms to boost
growth. However, the disinvestment process, deregulation of diesel prices
and also some budgetary stance may help lower CAD (current account
deficit) as well as fiscal deficit. Moreover, onshore dollar premiums rose to
their highest in 14 years as foreign funds hedged their spot inflows in the
forwards markets as the country gears up to raise around $2.25 billion in a
share sale in NTPC Ltd
Economic gauge for the next week
Date Currency Event PREVIOUS
12th Feb: USD USD Consumer Confidence 39.2
12th Feb: GBP GBP Consumer Price Index (YoY) 2.70%
12th Feb: GBP GBP Core Consumer Price Index (YoY) 2.40%
13th Feb: GBP GBP Bank of England Inflation Report
13th Feb: USD USD Advance Retail Sales 0.50%
13th Feb: JPY JPY Nominal Gross Domestic Product (QoQ) -0.90%
13th Feb: JPY JPY Gross Domestic Product (QoQ) -0.90%
13th Feb: JPY JPY Gross Domestic Product Annualized -3.50%
14th Feb: JPY JPY Bank of Japan Rate Decision 0.10%
14th Feb: EUR EUR German Gross Domestic Product w.d.a. (YoY) 0.90%
14th Feb: EUR EUR German Gross Domestic Product n.s.a. (YoY) 0.40%
14th Feb: EUR EUR ECB Publishes Monthly Report
14th Feb: EUR EUR Euro-Zone Gross Domestic Product s.a. (YoY) -0.60%
15th Feb: USD USD U. of Michigan Confidence 73.8
Technical Recommendation
®

IPOIPO
INDIAN IPO NEWS
Upper Tamakoshi Hydropower Project gets ready for ̀ 518-crore IPO
The Upper Tamakoshi Hydropower Project is preparing to hit the capital market with a initial public offering (IPO) worth `518 crore. The
company has authorised Citizen Investment Trust (CIT) to manage the tasks relating to the share issue.
Ortel Communications plans to raise over ̀ 100 crore from IPO, files for DRHP
Ortel Communications Ltd (OCL), Odisha's leading Multi-System Operator (MSO), has filed the Draft Herring Prospectus (DRHP) with SEBI for an
Initial Public Offering (IPO) to raise over 100 crore. In a statement, OCL said, “The issue comprises a fresh issue to the public of equity shares
aggregating upto ̀ 1,000 million and an offer for sale of up to 40,91,299 equity shares by NSR-PE Mauritius LLC.” OCL is looking to place 35 lakh
equity shares to raise up to ̀ 75 crore. IDFC Capital and Equirus Capital are the book running lead managers to the issue.
`
Bharti Infra. Telecom 39085.40 4533.60 28-Dec-12 220.00 200.00 206.95 -5.93
PC Jeweller Jewellary 2548.59 609.30 27-Dec-12 135.00 135.50 142.30 5.41
Credit Analysis Rating Agency 2366.95 540.00 26-Dec-12 750.00 949.00 828.95 10.53
Tara Jewels Jewellary 510.97 179.50 6-Dec-12 230.00 242.00 208.05 -9.54
VKS Projects Engineering 323.37 55.00 18-Jul-12 55.00 55.80 179.65 226.64
Speciality Restaruants Restaurants 817.57 181.96 30-May-12 150.00 153.00 174.10 16.07
T B Z Jewellary 1433.07 210.00 9-May-12 120.00 115.00 214.95 79.13
MT Educare Miscellaneous 427.34 99.00 12-Apr-12 80.00 86.05 108.05 35.06
NBCC Construction 1882.80 124.97 12-Apr-12 106.00 100.00 156.90 48.02
Olympic card. Media 96.39 24.75 28-Mar-12 30.00 29.95 59.10 97.00
Multi Comm. Exc. Exchange 6834.26 663.31 9-Mar-12 1032.00 1387.00 1340.05 29.85
Indo Thai Sec. Finance 11.00 29.60 2-Nov-11 74.00 75.00 11.00 -85.14
Vaswani Inds. Steel 11.70 49.00 24-Oct-11 49.00 33.45 4.50 -90.82
M and B Switch. Capital Goods 516.00 93.00 20-Oct-11 186.00 180.00 25.80 -86.13
Flexituff Intl. Packaging 503.19 104.63 19-Oct-11 155.00 155.00 231.35 49.26
Prakash Constro. Construction 296.65 60.00 4-Oct-11 138.00 145.00 23.60 -82.90
PG Electro. Cons. Durables 587.48 120.65 26-Sep-11 210.00 200.00 358.00 70.48
SRS Jewellary 578.75 203.00 16-Sep-11 58.00 55.00 41.55 -28.36
TD Power Sys. Capital Goods 860.92 227.00 8-Sep-11 256.00 251.60 259.00 1.17
Tree House Edu. Miscellaneous 918.60 112.06 26-Aug-11 135.00 132.80 255.45 89.22
L&T Fin.Holdings Finance 13354.76 1245.00 12-Aug-11 52.00 51.00 77.80 49.62
Inventure Grow. Finance 79.04 81.90 4-Aug-11 117.00 119.00 9.41 -91.96
Readymade Steel Steel 117.38 34.75 13-Jul-11 108.00 115.00 100.15 -7.27
Birla Pacific Healthcare 20.86 65.18 7-Jul-11 10.00 10.10 1.86 -81.40
Rushil Decor Miscellaneous 331.70 40.64 7-Jul-11 72.00 81.25 230.35 219.93
Timbor Home Miscellaneous 74.91 23.25 22-Jun-11 63.00 72.00 50.75 -19.44
VMS Industries Shipping 57.15 25.75 14-Jun-11 40.00 43.95 34.70 -13.25
Aanjaneya Life. Pharmaceuticals 1059.74 117.00 27-May-11 234.00 229.45 762.95 226.05
Sanghvi Forg. Forgings 42.45 36.90 23-May-11 85.00 85.00 33.45 -60.65
Innoventive Ind. Steel 823.03 217.41 13-May-11 117.00 110.00 138.00 17.95
Servalaksh.Paper Paper 16.94 60.00 12-May-11 29.00 30.00 3.93 -86.45
Future Ventures Finance 1528.95 750.00 10-May-11 10.00 9.50 9.70 -3.00
Para. Print. Packaging 6.17 45.83 9-May-11 35.00 35.00 2.31 -93.40
Muthoot Finance Finance 7971.32 901.25 6-May-11 175.00 180.00 214.45 22.54
Shilpi Cable Cables 66.04 55.88 8-Apr-11 69.00 78.35 17.60 -74.49
IPO TRACKER
Company Sector M.Cap(In Cr.) Issue Size(in Cr.) List Date Issue Price List Price Last Price %Gain/Loss(from Issue price)
*
15
®* Closing prices as on 07-02-2013

16
®

MUTUAL FUND
17
NEWS
®
UTI MF introduces FTIF Series XIV -I (366 DAYS)
UTI Mutual Fund has launched the New Fund Offer (NFO) of UTI FTIF Series XIV -I (366 DAYS), a close ended income scheme. The NFO opens for subscription on
February 8, 2013 and closes on February 11, 2013. The investment objective of the scheme is to generate returns by investing in portfolio of fixed income
securities maturing on or before the date of maturity of the scheme.
HDFC FMP 370D February 2012 (1) declares dividend
HDFC Mutual Fund has declared dividend under the normal dividend option and quarterly dividend options of HDFC FMP 370D February 2012 (1), a plan under
HDFC Fixed Maturity Plans-Series XIX, a closed ended income scheme. The record date for dividend is February 12, 2013. The amount of dividend per unit on the
face value of Rs 10 per unit will be distributable surplus, as reduced by applicable statutory levy under each option.
HDFC MF introduces FMP 1198D February 2013 (1)
HDFC Mutual Fund has launched the New Fund Offer (NFO) of HDFC FMP 1198D February 2013 (1), a close ended income scheme. The NFO opens for subscription
on February 4, 2013 and closes on February 12, 2013. No entry load or exit load will be applicable for the scheme. The investment objective of the scheme is to
generate income through investments in Debt / Money Market Instruments and Government Securities maturing on or before the maturity date of the respective
plans.
Reliance Mutual Fund declares dividend under Regular Savings Fund
Reliance Mutual Fund has declared dividend under the dividend plan of the Reliance Regular Savings Fund. The record date for dividend is February 8, 2013. The
dividend will be Rs. 1.40 per unit on the face value of ̀ 10 per unit under the schemes.
Peerless Mutual Fund launches cash investment facility
Mutual fund house Peerless Mutual Fund has started the option of cash investment to tap the un-banked customers in retail mutual fund schemes through select
Allahabad Bank branches. This initiative is in accordance with Sebi's guidelines of allowing cash investments by investors up to Rs 20,000 per investor, per mutual
fund every financial year.
ICICI Prudential MF introduces Fixed Maturity Plan-Series 66-420 Days Plan A
ICICI Prudential Mutual Fund has launched the New Fund Offer (NFO) of ICICI Prudential Fixed Maturity Plan-Series 66-420 Days Plan A, a close ended income
scheme. The NFO opens for subscription on February 5, 2013 and closes on February 6, 2013. The investment objective of the scheme is to generate income by
investing in a portfolio of fixed income securities/debt instruments maturing on or before the maturity of the scheme. However, there can be no assurance that
the investment objective of the scheme will be realized.
Deutsche MF introduces Fixed Maturity Plan - Series 23 (DFMP-23)
Deutsche Mutual Fund has launched the New Fund Offer (NFO) of DWS Fixed Maturity Plan- Series 23 (DFMP-23), a close ended income scheme. The investment
objective of the scheme is to generate income by investing in debt and money market instruments maturing on or before the date of the maturity of the Scheme.
NFOs WATCH
Fund Name NFO NFO Scheme Objective Fund Type Fund Class Fund Manager MinimumOpens on Closes on Amount
07-Feb-2013 11-Feb-2013 Close Ended Income ` 10000/-IDFC Yearly Series Interval Fund - Series II
Mr. Anupam Joshi
To seek to generate returns from investments in Debt and Money Market instruments.
06-Feb-2013 11-Feb-2013 Close-Ended Dividend `5000/-Reliance Fixed Horizon Fund - XXIII - Series 1
Mr. Amit Tripathi
The primary investment objective of the scheme is to seek to generate returns and growth of capital by investing in a diversified portfolio of the following securities which are maturing on or before the date of maturity of the scheme with the object of limiting interest rate volatility - Central and State Government securities and Other fixed income/ debt securities
07-Feb-2013 18-Feb-2013 Close Ended Income `5000/-Birla Sun Life Fixed Term Plan - Series GL (534 days)
Mr. Kaustubh Gupta
The scheme seeks to generate income by
investing in a portfolio of fixed income
securities maturing on or before the duration
of the scheme.
08-Feb-2013 12-Feb-2013 Close Ended FMP ` 5000/-DWS Fixed Maturity Plan - Series 23 - Direct Plan
Mr. Kumaresh Ramakrishnan
The objective of the Scheme is to generate income by investing in debt and money market instruments maturing on or before the date of the maturity of the Scheme.
07-Feb-2013 14-Feb-2013 Close Ended Dividend ` 5000/-Birla Sun Life Interval Income Fund - Annual Plan II
Mr. Kaustubh Gupta
The investment objective of the scheme is to seek to generate returns and growth of capital by investing in a diversified portfolio of debt & money market securities maturing on or before the term of the Scheme.

18
MUTUAL FUND Performance Charts
Returns (%) Risk Market Cap (%)
Scheme Name NAV Launch AUM 3M 6M 1Y 3Y Since Std.Dev Beta Jenson LARGE MID SMALL DEBT &
(`) Date (` Cr.) Launch CAP CAP CAP OTHER
SBI Emerg Buss Fund - Growth 58.98 17-Sep-2004 989.23 7.29 19.61 34.09 21.90 23.53 1.85 0.65 0.41 10.36 60.73 22.23 6.68
Axis Midcap Fund - Growth 13.17 18-Feb-2011 115.51 4.52 22.17 31.86 NA 14.98 1.91 0.79 0.37 9.74 74.65 8.81 6.80
Principal Emerging Bluechip Fund - G 33.46 12-Nov-2008 283.33 4.96 19.24 30.51 6.85 32.95 1.88 0.84 0.39 38.98 57.40 2.09 1.53
Birla Sun Life India GenNext Fund - G 31.27 05-Aug-2005 110.28 5.93 17.64 30.20 17.96 16.38 1.41 0.60 0.33 51.63 38.59 3.52 6.26
Franklin India Smaller Companies Fund - G 16.87 13-Jan-2006 334.97 6.45 18.42 29.70 10.89 7.67 1.76 0.69 0.41 9.40 76.84 6.93 6.83
Taurus Discovery Fund - Growth 17.00 03-Jan-1996 26.49 3.66 20.82 28.02 6.89 5.20 2.12 0.89 0.30 19.84 68.29 9.95 1.92
BNP Paribas Mid Cap Fund - Growth 12.08 02-May-2006 34.06 4.45 16.23 27.60 15.10 2.83 1.61 0.66 0.40 17.38 72.12 4.86 5.64
EQUITY (Diversified)
BALANCED
INCOME FUND
Note: Indicative corpus are including Growth & Dividend option. The above mentioned data is on the basis of 07/02/2013Beta, Sharpe and Standard Deviation are calculated on the basis of period: 1 year, frequency: Weekly Friday, RF: 7%
ULTRA SHORT TERM
SHORT TERM FUND
Due to their inherent long term nature, the following 3 categories have been sorted on the basis of 1 year returns
Due to their inherent short term nature, the following 2 categories have been sorted on the basis of 6month returns
Returns (%) Risk Market Cap (%)
Scheme Name NAV Launch AUM 3M 6M 1Y 3Y Since Std.Dev Jenson LARGE MID SMALL DEBT &
(`) Date (` Cr.) Launch CAP CAP CAP OTHER
SBI Magnum Balanced Fund - Growth 56.99 09-Oct-1995 359.27 5.60 15.60 22.68 7.55 15.97 1.13 0.26 28.05 31.68 7.98 32.29
Principal Balanced Fund - Growth 33.90 14-Jan-2000 16.33 4.18 12.40 18.64 5.87 9.79 1.26 0.19 43.51 23.76 0.86 31.87
Reliance RSF - Balanced - Growth 25.34 08-Jun-2005 556.47 2.96 11.10 18.56 9.89 12.88 1.43 0.16 50.02 14.57 5.24 30.18
ICICI Prudential Balanced - Growth 56.26 03-Nov-1999 381.15 5.22 15.03 18.39 13.12 13.90 1.19 0.18 46.20 22.79 NA 31.00
Tata Balanced Fund - Growth 96.79 08-Oct-1995 445.62 1.28 8.84 16.89 10.38 16.03 1.29 0.13 43.01 26.16 1.17 29.66
L&T India Prudence Fund - Growth 11.34 07-Feb-2011 23.88 3.40 10.71 15.25 NA 6.46 1.23 0.12 44.74 24.11 3.94 27.21
Canara Robeco Balance - Growth 70.54 01-Feb-1993 202.95 2.23 8.44 14.99 10.50 10.45 1.08 0.09 45.06 21.60 3.65 29.70
Returns (%) RiskAverage Yield till
Scheme Name NAV Launch AUM Since Std. SharpeMaturity (Days) Maturity
1W 2W 1M 6M 1Y 3Y(`) Date (`Cr.) Launch Dev.
SBI Magnum Income - Growth 28.81 25-Nov-1998 1086.68 20.69 6.74 7.70 13.40 12.69 9.08 7.69 15.96 0.33 4763.00 8.75
IDFC D B F- Plan A - Growth 23.44 25-Jun-2002 2386.71 30.90 10.67 9.16 13.63 11.90 9.04 8.35 14.35 0.28 4979.00 8.33
Sundaram Bond Saver - Reg - Growth 33.78 18-Dec-1997 85.46 18.70 5.53 6.98 12.24 11.86 7.74 8.32 11.59 0.32 4457.00 8.52
IDFC SSIF - Invt. Plan - Plan F - Growth 12.62 16-Jul-2010 516.46 32.17 5.22 7.34 13.91 11.77 NA 9.49 14.98 0.26 4909.00 8.30
Kotak Bond Deposit - Growth 31.49 25-Nov-1999 3039.74 16.76 5.62 6.68 11.82 11.75 8.96 9.07 18.27 0.30 3405.00 9.00
Kotak Bond Scheme - Plan A - Growth 33.74 25-Nov-1999 3039.74 16.71 5.45 6.49 11.72 11.69 8.94 9.64 18.28 0.30 3405.00 9.00
Templeton India IBA - Growth 39.29 23-Jun-1997 337.34 8.63 2.92 6.31 11.71 11.68 9.10 9.14 9.10 0.46 2340.00 10.19
Annualised
Returns (%) Risk Average Yield tillScheme Name NAV Launch AUM Since Std. Sharpe Maturity (Days) Maturity
1W 2W 1M 6M 1Y 3Y(`) Date (`Cr.) Launch Dev.
Escorts Short Term Debt Fund - Growth 17.48 29-Dec-2005 9.97 8.27 8.18 9.30 11.32 10.76 9.50 8.17 2.76 1.21 168.00 NA
UTI Short Term Income Fund - Ret - G 20.13 23-Jun-2003 2050.79 6.35 6.18 8.54 10.84 10.52 8.84 7.53 6.55 0.47 1411.00 NA
Sundaram Select Debt - S T A P - Reg - Appreciation 19.79 04-Sep-2002 17.25 8.89 5.44 8.86 10.44 11.06 9.29 6.76 4.44 0.79 1632.00 9.42
Taurus Short Term Income Fund - G 2002.58 23-Aug-2001 240.84 9.13 9.17 9.33 9.81 10.42 8.74 6.24 1.21 2.42 29.00 NA
Templeton India STIP - Growth 2324.56 31-Jan-2002 6035.38 6.11 3.99 7.63 9.80 10.07 8.29 7.95 4.59 0.56 898.00 10.36
SBI Short Term Debt Fund - Growth 13.32 27-Jul-2007 2249.28 5.57 3.39 6.15 9.79 10.29 8.06 5.31 5.43 0.49 1128.00 8.46
SBI SHDF - Short Term - Ret - Growth 15.07 27-Jul-2007 2249.28 5.44 3.26 6.02 9.65 10.04 7.84 7.68 5.23 0.47 1128.00 8.46
Annualised
Returns (%) Risk Average Yield tillScheme Name NAV Launch AUM Since Std. Sharpe Maturity (Days) Maturity
1W 2W 1M 6M 1Y 3Y(`) Date (`Cr.) Launch Dev.
JM Money Manager Fund - Reg - Growth 16.09 27-Sep-2006 187.29 8.53 8.68 8.83 9.17 10.06 8.79 7.76 0.76 3.44 53.00 9.47
IDFC Ultra Short Term Fund - Reg - G 16.10 17-Jan-2006 800.87 7.88 7.90 8.26 8.85 10.09 8.61 6.97 2.81 0.92 54.00 8.66
Baroda Pioneer Treasury Adv. Fund - Reg - G 1311.00 24-Jun-2009 1185.92 6.75 6.92 7.56 8.45 9.74 8.39 7.75 1.55 1.51 191.00 NA
Tata Floater Fund - Growth 1735.18 06-Sep-2005 3956.22 7.46 7.34 7.97 8.69 9.49 8.33 7.70 1.05 2.03 NA 9.51
Principal Debt Opp. Fund - Conservative - G 1839.01 14-Sep-2004 415.17 6.29 6.74 7.52 8.76 9.73 8.27 7.52 1.17 2.00 118.00 9.07
Kotak Floater - LT - Growth 18.43 13-Aug-2004 4084.42 4.59 5.67 7.14 8.75 9.41 8.26 7.46 1.32 1.60 139.00 9.25
Reliance Medium Term Fund - Growth 24.04 14-Sep-2000 4828.71 4.80 4.69 6.49 8.45 9.61 8.23 7.32 2.91 0.74 227.00 8.98
Annualised
®

