a web-based decision support system with electre iii...
TRANSCRIPT

Decision Support Systems 48 (2010) 488–497
Contents lists available at ScienceDirect
Decision Support Systems
j ourna l homepage: www.e lsev ie r.com/ locate /dss
AWeb-based decision support system with ELECTRE III for a personalised ranking ofBritish universities
Christos Giannoulis a, Alessio Ishizaka b,⁎a Faculty of Technology, Department of Electronic and Computer Engineering, University of Portsmouth, Anglesea Building, Anglesea Road, Portsmouth PO1 3DJ, United Kingdomb Portsmouth Business School, University of Portsmouth, Richmond Building, Portland Street, Portsmouth PO1 3DE, United Kingdom
⁎ Corresponding author. Tel.: +44 23 92 84 41 71.E-mail addresses: [email protected] (C. Gian
[email protected] (A. Ishizaka).
0167-9236/$ – see front matter © 2009 Elsevier B.V. Aldoi:10.1016/j.dss.2009.06.008
a b s t r a c t
a r t i c l e i n f oAvailable online 18 June 2009
Keywords:Multi-criteria decision methodELECTRE IIIUniversity rankings
Reliance upon multi-criteria decision methods, like ELECTRE III, has increased many folds in the past fewyears. However, ELECTRE III has not yet been applied in ranking universities. League tables are importantbecause they may have an impact on the number and quality of the students. The tables serve an indicationof prestige. This paper describes a three-tier Web-system, which produces a customised ranking of BritishUniversities with ELECTRE III reflecting personal preferences, where information is uncertain and vague.Using this case study, the benefits of ELECTRE III in the ranking process are illustrated.
© 2009 Elsevier B.V. All rights reserved.
1. Introduction
Professor William Cooper is particularly known through his workon DEA (Data Envelopment Analysis) [26]. His paper [17] has beenelected as one of themost influential papers published in the EuropeanJournal of Operational Research. Professor Cooper has applied DEAwidely to the performance analysis in the public and private sectors,especially in education. He was the first (founding) Dean at CarnegieMellon University's School of Urban and Public Affairs (now the H.J.Heinz III School of Public Policy andManagement, USA) and a foundingmember of the Graduate School of Industrial Administration atCarnegie Mellon. He always strives for the improvement of the qualityin education as it can be seen in his papers [3,5,10,15,18,19].
The evaluation of education with ranking lists of universities hasbecome, over the past few years, increasingly popular. Some examplesin United Kingdom are the Times Higher Education, The CompleteUniversity Guide, The Guardian University Guide and the Sunday TimesUniversity Guide all ofwhich produce leagues tables based on statisticaldata from the Higher Education Statistical Agency (HESA) and theNational Student Survey (NSS). These rankings have a sizeable impacton universities as they may have some indication of prestige and adirect influence on the number and quality of applicants. However theranking of universities does not use rigorous methodologies like onesused in Professor Cooper's work. The methodology used to rankuniversities is a simple weighted sum, which has several limitations.First, theweights arepredeterminedwith very little, if any, justificationof their value. Therefore, it is assumed that the criteria have the same
noulis),
l rights reserved.
importance (i.e. weight) for everybody. This is clearly not true as eachperson is different and has different preferences. Moreover, commer-cial league tables use a simple aggregation,which is compensatory anddoes not differentiate between universities having strengths indifferent areas.
This paper has been prepared to celebrate the 95th birthday ofProfessor Cooper and his motivation to evaluate education with newmethods.Wehave thus developed a new interactive onlineway to rankuniversities with the multi-criteria decision method ELECTRE III [42](http://www.pbs.port.ac.uk/IshizakaA/). As ELECTRE III may be com-plicated for new users, a simple and an advanced version has beendeveloped. These two versions are user-friendly, free, Web accessibleand have tailored functionalities, which is not the case for the oldcommercial off-the-shelf software supporting the ELECTRE III (http://www.lamsade.dauphine.fr/english/software.html). However, thecommercial software was used to validate the results of our Webdecision support tool.
Hereinafter, wewill reviewmethods used for rankings universities.In Section 3, the ELECTRE III algorithm is described. Section 4 describesthe design and implementation of the decision support tool, andSection 5 evaluates the implemented system. Finally, the concludingsection summarises the main points arising from this project.
2. Rankings systems
2.1. Commercial rankings
Several commercial universities ranking schemes are annuallypublished. Alongside, criticisms of these rankings have also increased[13,34,37,51,53,55]. These leagues tables are based on a weighted sumof performances, which has some methodological problems. As eachcriterion is measured in a different unit, they need to be transformed
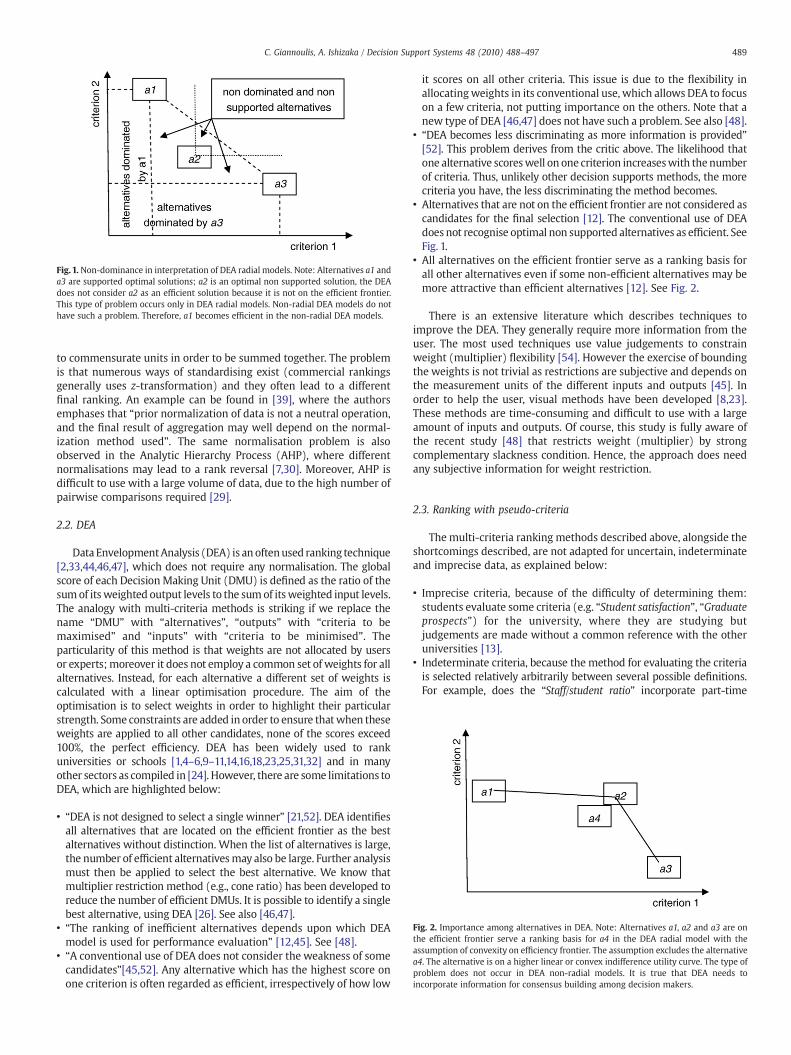
Fig. 1. Non-dominance in interpretation of DEA radial models. Note: Alternatives a1 anda3 are supported optimal solutions; a2 is an optimal non supported solution, the DEAdoes not consider a2 as an efficient solution because it is not on the efficient frontier.This type of problem occurs only in DEA radial models. Non-radial DEA models do nothave such a problem. Therefore, a1 becomes efficient in the non-radial DEA models.
Fig. 2. Importance among alternatives in DEA. Note: Alternatives a1, a2 and a3 are onthe efficient frontier serve a ranking basis for a4 in the DEA radial model with theassumption of convexity on efficiency frontier. The assumption excludes the alternativea4. The alternative is on a higher linear or convex indifference utility curve. The type ofproblem does not occur in DEA non-radial models. It is true that DEA needs toincorporate information for consensus building among decision makers.
489C. Giannoulis, A. Ishizaka / Decision Support Systems 48 (2010) 488–497
to commensurate units in order to be summed together. The problemis that numerous ways of standardising exist (commercial rankingsgenerally uses z-transformation) and they often lead to a differentfinal ranking. An example can be found in [39], where the authorsemphases that “prior normalization of data is not a neutral operation,and the final result of aggregation may well depend on the normal-ization method used”. The same normalisation problem is alsoobserved in the Analytic Hierarchy Process (AHP), where differentnormalisations may lead to a rank reversal [7,30]. Moreover, AHP isdifficult to use with a large volume of data, due to the high number ofpairwise comparisons required [29].
2.2. DEA
Data EnvelopmentAnalysis (DEA) is an oftenused ranking technique[2,33,44,46,47], which does not require any normalisation. The globalscore of each Decision Making Unit (DMU) is defined as the ratio of thesumof itsweighted output levels to the sumof itsweighted input levels.The analogy with multi-criteria methods is striking if we replace thename “DMU” with “alternatives”, “outputs” with “criteria to bemaximised” and “inputs” with “criteria to be minimised”. Theparticularity of this method is that weights are not allocated by usersor experts;moreover it does not employ a common set of weights for allalternatives. Instead, for each alternative a different set of weights iscalculated with a linear optimisation procedure. The aim of theoptimisation is to select weights in order to highlight their particularstrength. Some constraints are added in order to ensure thatwhen theseweights are applied to all other candidates, none of the scores exceed100%, the perfect efficiency. DEA has been widely used to rankuniversities or schools [1,4–6,9–11,14,16,18,23,25,31,32] and in manyother sectors as compiled in [24]. However, there are some limitations toDEA, which are highlighted below:
• “DEA is not designed to select a single winner” [21,52]. DEA identifiesall alternatives that are located on the efficient frontier as the bestalternatives without distinction. When the list of alternatives is large,the number of efficient alternativesmay also be large. Further analysismust then be applied to select the best alternative. We know thatmultiplier restriction method (e.g., cone ratio) has been developed toreduce the number of efficient DMUs. It is possible to identify a singlebest alternative, using DEA [26]. See also [46,47].
• “The ranking of inefficient alternatives depends upon which DEAmodel is used for performance evaluation” [12,45]. See [48].
• “A conventional use of DEA does not consider the weakness of somecandidates”[45,52]. Any alternative which has the highest score onone criterion is often regarded as efficient, irrespectively of how low
it scores on all other criteria. This issue is due to the flexibility inallocatingweights in its conventional use, which allows DEA to focuson a few criteria, not putting importance on the others. Note that anew type of DEA [46,47] does not have such a problem. See also [48].
• “DEA becomes less discriminating as more information is provided”[52]. This problem derives from the critic above. The likelihood thatone alternative scoreswell on one criterion increaseswith thenumberof criteria. Thus, unlikely other decision supports methods, the morecriteria you have, the less discriminating the method becomes.
• Alternatives that are not on the efficient frontier are not considered ascandidates for the final selection [12]. The conventional use of DEAdoes not recognise optimal non supported alternatives as efficient. SeeFig. 1.
• All alternatives on the efficient frontier serve as a ranking basis forall other alternatives even if some non-efficient alternatives may bemore attractive than efficient alternatives [12]. See Fig. 2.
There is an extensive literature which describes techniques toimprove the DEA. They generally require more information from theuser. The most used techniques use value judgements to constrainweight (multiplier) flexibility [54]. However the exercise of boundingthe weights is not trivial as restrictions are subjective and depends onthe measurement units of the different inputs and outputs [45]. Inorder to help the user, visual methods have been developed [8,23].These methods are time-consuming and difficult to use with a largeamount of inputs and outputs. Of course, this study is fully aware ofthe recent study [48] that restricts weight (multiplier) by strongcomplementary slackness condition. Hence, the approach does needany subjective information for weight restriction.
2.3. Ranking with pseudo-criteria
The multi-criteria ranking methods described above, alongside theshortcomings described, are not adapted for uncertain, indeterminateand imprecise data, as explained below:
• Imprecise criteria, because of the difficulty of determining them:students evaluate some criteria (e.g. “Student satisfaction”, “Graduateprospects”) for the university, where they are studying butjudgements are made without a common reference with the otheruniversities [13].
• Indeterminate criteria, because the method for evaluating the criteriais selected relatively arbitrarily between several possible definitions.For example, does the “Staff/student ratio” incorporate part-time

490 C. Giannoulis, A. Ishizaka / Decision Support Systems 48 (2010) 488–497
lecturers and part-time students? How is spending divided betweenthe criteria “Academic Service Spend” and “Facilities Spend”?
• Uncertain criteria, because the measured values refer only to a pointin time and some values vary over time. For example: the“Employability” of a university's graduates depends on the economicsituation. The “Investments in facilities” may not be uniformlydistributed over time.
The ELECTRE III allows imprecise, indeterminate and uncertaincriteria inherent to complex human decision processes by relying onthe use of pseudo-criteria and indifference and preference thresholds.See Section 3. Furthermore, very bad performance on one criterionmay not be compensated by good scores on the other criteria,depending on the veto threshold. ELECTRE III has been widely used inranking problems, for instance in ranking the stocks for investmentselection [28], for choosing a sustainable demolition waste manage-ment strategy [41], for the selection of energy systems [38], forranking urban stormwater drainage [35] or for housing evaluation [36]but it has not yet been applied for ranking universities.
3. ELECTRE III
3.1. Introduction
ELECTRE III relies upon the construction and the exploitation of theoutranking relations. The two distinct phases are depicted in Fig. 3:
a) Construction of the outranking relation: Alternatives are pairwisecompared (A,B). Each pairwise comparison is characterised by anoutranking relation. To say that “alternative A outranks alternativeB” means that “A is at least as good as B”. Therefore threeoutranking relations exists: A is “indifferent”, “weakly preferred”or “strictly preferred” to B depending on the difference betweenthe performance of the alternatives and the thresholds given bythe user. See Section 3.2.
b) Exploitation of the outranking relation: Two pre-rankings are thenconstructed with two antagonist procedures (ascending anddescending distillation). The combination of the two pre-rankinggives the final ranking. See Section 3.3.
3.2. Building the outranking relations
3.2.1. Pseudo-criteriaTrue criteria, which are the simplest and traditional form of
criterion, do not have thresholds. Only the difference between the
Fig. 3. ELECTRE III process flow.
scores on the criteria is used to determinewhich option is preferred. Inorder to take into account imprecision, uncertainty and indetermina-tion in complex decision problems, pseudo-criteria are used. Theindifference q and preference p thresholds allow the construction of apseudo-criterion. Thus, three relations between alternatives A and Bcan be considered:
a) A and B are indifferent if the difference between the performanceof the two alternatives is below the indifference threshold:
AjB X z Að Þ− z Bð Þ V q ð1Þ
where z(X): performance of the alternative Xq: indifference threshold
b) A is weakly preferred to B if the difference between the performanceof the two alternatives is in between the indifference and thepreference threshold:
AQ B X q b z Að Þ− z Bð Þ V p ð2Þ
where z(X): performance of the alternative X
q: indifference thresholdp: preference threshold of the alternative
c) A is strictly preferred toB if thedifference between the performanceof the two alternatives is higher than the preference threshold:
A P B X z Að Þ− z Bð Þ z p ð3Þ
where z(X): performance of the alternative X.p: preference threshold of the alternative.
3.2.2. Concordance indexThe concordance index (Eq. (4)) indicates the truthfulness of the
assertion “A outranks B” (A S B)1. C=1 indicates the full truthfulnessof the assertion and C=0 indicates that the assertion is false. Thegraphical representation is given in Fig. 4.
C A;Bð Þ = 1w
Xni = 1
wici A;Bð Þ ð4Þ
where W=∑i=1n wi
ci A;Bð Þ =1
pi zi Að Þð Þ + zi Að Þ− zi Bð Þpi zi Að Þð Þ− qi zi Að Þð Þ
0
if zi Bð Þ− zi Að Þ V qiif qibzi Bð Þ− zi Að Þ b piif zi Bð Þ− zi Að Þz pi
8>>><>>>:
ð5Þ
Here,
wi: weight of the criterion in: number of criteriazi(X): performance of the alternative X as regards to the criterion iqi: indifference threshold for the criterion ipi: preference threshold of the alternative on the criterion i
3.2.3. Discordance indexIf the difference of performances between the alternative A and
B, on a criterion i, is higher than the veto threshold vi, it is cautiousto refuse the assertion “A outranks B”. The discordance index for
1 S is the abbreviation of the French word « Surclasse », as defined in [42].

Table 1Performance matrix of universities (U1–U6).
Alternatives Academic servicesspend
Completion Entrystandards
Facilitiesspend
Goodhonours
U1 947 79 400 228 69.7U2 1406 64 350 204 47.6U3 677 90 300 349 61.8U4 561 65 247 188 52.3U5 1006 88 352 437 65.8U6 765 77 280 198 55.6
Fig. 4. Concordance Index between alternatives A and B. Note: Zone 1. zi(B)−zi(A)≤qi,the alternatives A and B are indifferent, which means a concordance on the assertion “Aoutranks B”. Zone 2: qibzi(B)−zi(A)bpi, the alternative B is weakly preferred to A,which means a partial concordance on the assertion “A outranks B”. Zone 3: zi(B)−zi(A)≥pi, the alternative B is strictly preferred to A, which means a null-concordanceon the assertion “A outranks B”.
491C. Giannoulis, A. Ishizaka / Decision Support Systems 48 (2010) 488–497
each criterion i is given in (Eq. (6)). Fig. 5 shows the graphicalrepresentation.
Di A;Bð Þ =0zi Bð Þ− zi Að Þ + pi½ �
vi − pi1
if zi Bð Þ− zi Að Þ V piif pi b zi Bð Þ− zi Að Þ V viif zi Bð Þ− zi Að Þz vi
8>>><>>>:
ð6Þ
Here,
zi(X): performance of the alternative X as regards to the criterion i.pi: preference threshold of the alternative on the criterion i.vi: veto threshold for the criterion i.
3.2.4. Degree of credibilityConsidering the concordance (Eq. (4)) and discordance indices
(Eq. (6)), the degree of credibility (Eq. (7)) indicates if the outrankinghypothesis is true or not. If the concordance index (Eq. (4)) is higheror equal to the discordance index of all criteria (Eq. (6)), then thedegree of credibility (Eq. (7)) is equal to the concordance index(Eq. (4)). If the concordance index (Eq. (4)) is strictly below thediscordance index (Eq. (6)), then the degree of credibility (Eq. (7)) is
Fig. 5. Discordance Index between alternatives A and B.Note: Zone 1: zi(B)−zi(A)≤pi, thealternatives B is weakly preferred to A, which means no-discordance on the assertion “Aoutranks B”. Zone 2: pibzi(B)−zi(A)bvi, the alternative B is strictly preferred to A, whichmeans a weak discordance on the assertion “A outranks B”. Zone 3: zi(B)−zi(A)≥vi, thedifference betweenA and B exceed the veto threshold, whichmeans a total discordance onthe assertion “A outranks B”.
equal to the concordance index (Eq. (4)) lowered in direct relation tothe importance of those discordances.
S A;Bð Þ =C A;Bð Þ if Di A;Bð Þ V C A;Bð Þ8i
C A;Bð Þ · ΠiaJ A;Bð Þ1− Di A;Bð Þð Þ1− C A;Bð Þð Þ otherwise
8><>:
ð7Þ
where J(A,B) is the set of criteria for which Di A;Bð ÞN C A;Bð Þ:Then, the degrees of credibility are gathered in a credibility matrix.
Example 1. In order to illustrate the ranking process of ELECTRE III, wewill use in following example with six universities and five criteria. SeeTable 1.
For each criterion of Table 1, thresholds and criteria weights aredetermined by the user. See Table 2.
After calculation of the concordance and discordance indexes, thedegrees of credibility are constructed and gathered in the credibilitymatrix. See Table 3. It can be seen that the two degrees of credibility,attached at each pair of alternatives (one in eachway) does not producea symmetric credibilitymatrix. Thenext step is to exploit thismatrix. SeeSection 3.3.
3.3. Distillation procedures
From the credibilitymatrix, a graph can be drawn. Each alternative islinked with each other alternative with two arrows, one each way,indicating the credibility index. For a large number of alternatives, thegraph is highly complex. An automated procedure, named distillation,must be used to rank the alternatives. The name distillation has beenchosen for the analogy with alchemists, who distil mixtures of liquid toextract a magic ingredient. The algorithm for ranking all alternativesyields two pre-orders.
Thefirst pre-order is obtainedwith adescendingdistillation, selectingthe best-rated alternatives initially and finishingwith theworst. The bestalternatives are extracted from the whole set by applying very stringentrules (Eq. (8)). In this sub-set, the best alternatives are selected by
Table 2Thresholds and criteria weights defined by the user.
Criterion Academic servicesspend
Completion Entrystandards
Facilitiesspend
Goodhonours
Indifference (q) 0.1 0.1 0.1 0.1 0.05Preference (p) 0.2 0.2 0.2 0.2 0.2Veto (v) 0.4 0.5 0.4 0.3 0.4Weight (w) 0.1 0.3 0.3 0.2 0.1
Table 3Credibility matrix.
U1 U2 U3 U4 U5 U6
U1 1 0 0 1 0 1U2 0 1 0 0.97 0 0.62U3 0.0053 0 1 1 0 0.97U4 0 0 0 1 0 0.22U5 0.88 0.11 1 1 1 1U6 0 0 0 1 0 1
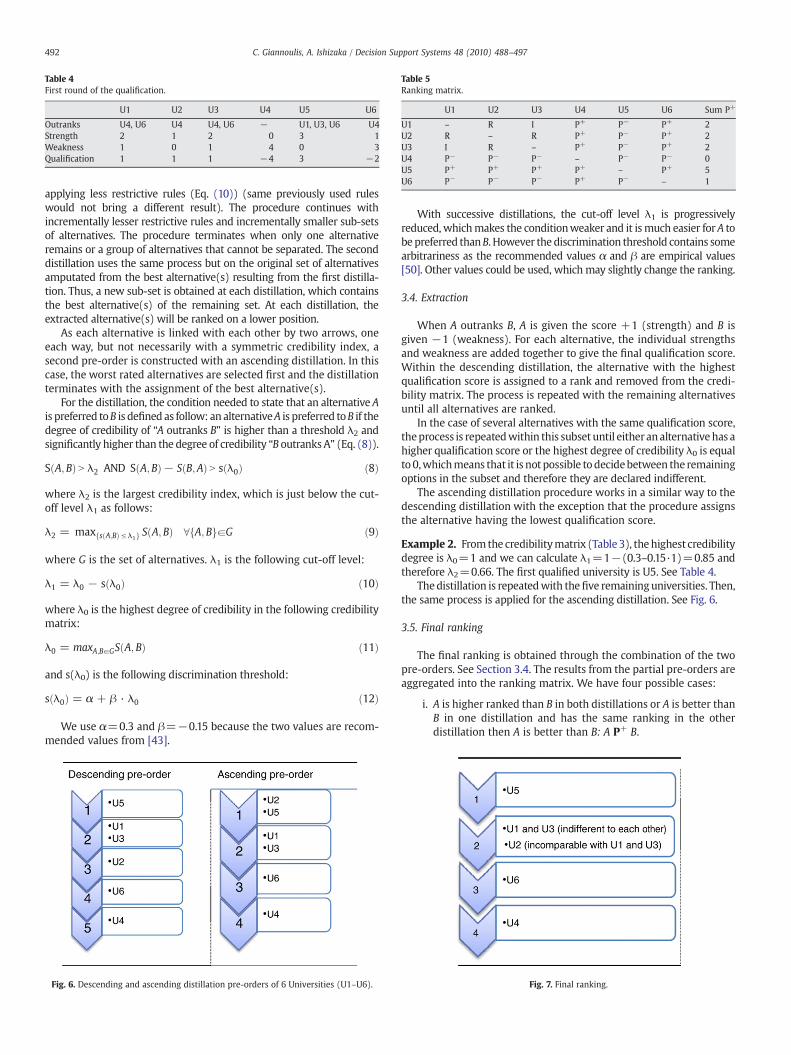
Table 4First round of the qualification.
U1 U2 U3 U4 U5 U6
Outranks U4, U6 U4 U4, U6 − U1, U3, U6 U4Strength 2 1 2 0 3 1Weakness 1 0 1 4 0 3Qualification 1 1 1 −4 3 −2
Table 5Ranking matrix.
U1 U2 U3 U4 U5 U6 Sum P+
U1 – R I P+ P− P+ 2U2 R – R P+ P− P+ 2U3 I R – P+ P− P+ 2U4 P− P− P− – P− P− 0U5 P+ P+ P+ P+ – P+ 5U6 P− P− P− P+ P− – 1
492 C. Giannoulis, A. Ishizaka / Decision Support Systems 48 (2010) 488–497
applying less restrictive rules (Eq. (10)) (same previously used ruleswould not bring a different result). The procedure continues withincrementally lesser restrictive rules and incrementally smaller sub-setsof alternatives. The procedure terminates when only one alternativeremains or a group of alternatives that cannot be separated. The seconddistillation uses the same process but on the original set of alternativesamputated from the best alternative(s) resulting from the first distilla-tion. Thus, a new sub-set is obtained at each distillation, which containsthe best alternative(s) of the remaining set. At each distillation, theextracted alternative(s) will be ranked on a lower position.
As each alternative is linked with each other by two arrows, oneeach way, but not necessarily with a symmetric credibility index, asecond pre-order is constructed with an ascending distillation. In thiscase, the worst rated alternatives are selected first and the distillationterminates with the assignment of the best alternative(s).
For the distillation, the condition needed to state that an alternative Ais preferred toB is defined as follow: an alternativeA is preferred toB if thedegree of credibility of “A outranks B” is higher than a threshold λ2 andsignificantly higher than the degree of credibility “B outranksA” (Eq. (8)).
S A;Bð Þ N λ2 AND S A;Bð Þ− S B;Að Þ N s λ0ð Þ ð8Þ
where λ2 is the largest credibility index, which is just below the cut-off level λ1 as follows:
λ2 = max s A;Bð Þ V λ1f g S A;Bð Þ 8 A;Bf gaG ð9Þ
where G is the set of alternatives. λ1 is the following cut-off level:
λ1 = λ0 − s λ0ð Þ ð10Þ
where λ0 is the highest degree of credibility in the following credibilitymatrix:
λ0 = maxA;BaGS A;Bð Þ ð11Þ
and s(λ0) is the following discrimination threshold:
s λ0ð Þ = α + β · λ0 ð12Þ
We use α=0.3 and β=−0.15 because the two values are recom-mended values from [43].
Fig. 6. Descending and ascending distillation pre-orders of 6 Universities (U1–U6).
With successive distillations, the cut-off level λ1 is progressivelyreduced, whichmakes the conditionweaker and it ismuch easier forA tobe preferred thanB. However the discrimination threshold contains somearbitrariness as the recommended values α and β are empirical values[50]. Other values could be used, which may slightly change the ranking.
3.4. Extraction
When A outranks B, A is given the score +1 (strength) and B isgiven −1 (weakness). For each alternative, the individual strengthsand weakness are added together to give the final qualification score.Within the descending distillation, the alternative with the highestqualification score is assigned to a rank and removed from the credi-bility matrix. The process is repeated with the remaining alternativesuntil all alternatives are ranked.
In the case of several alternatives with the same qualification score,theprocess is repeatedwithin this subset until eitheranalternativehas ahigher qualification score or the highest degree of credibility λ0 is equalto0,whichmeans that it is not possible todecidebetween the remainingoptions in the subset and therefore they are declared indifferent.
The ascending distillation procedure works in a similar way to thedescending distillation with the exception that the procedure assignsthe alternative having the lowest qualification score.
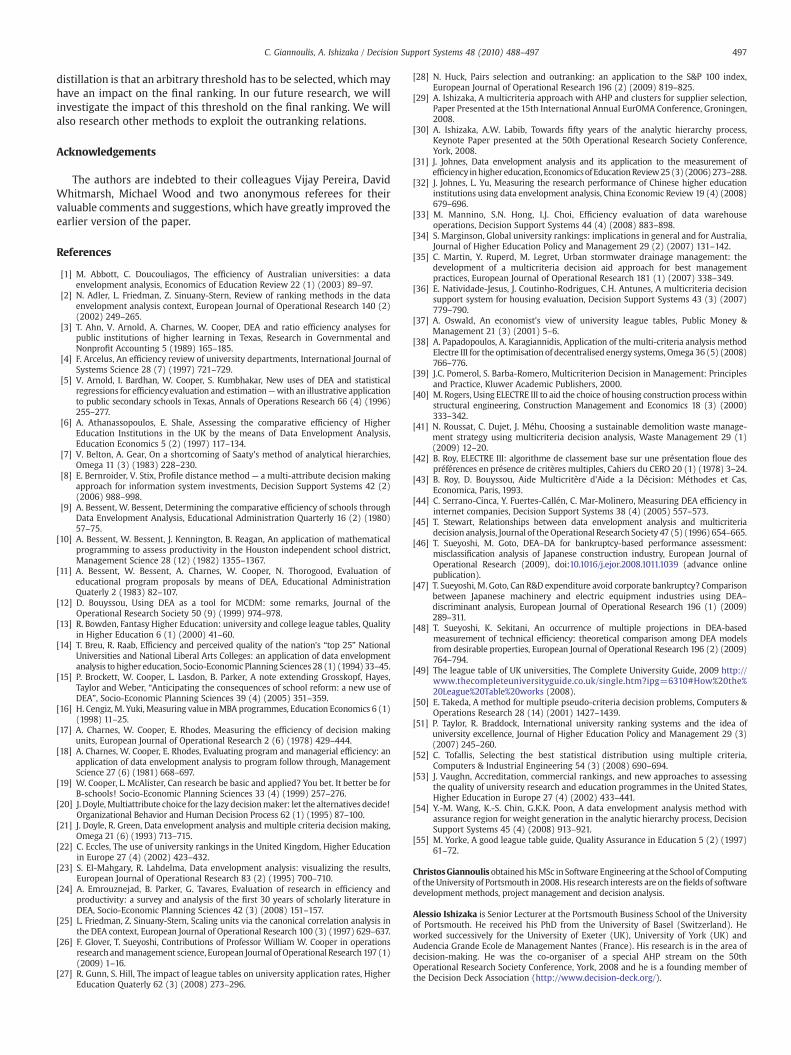
Example 2. From the credibilitymatrix (Table 3), thehighest credibilitydegree is λ0=1 and we can calculate λ1=1−(0.3–0.15·1)=0.85 andtherefore λ2=0.66. The first qualified university is U5. See Table 4.
Thedistillation is repeatedwith thefive remaininguniversities. Then,the same process is applied for the ascending distillation. See Fig. 6.
3.5. Final ranking
The final ranking is obtained through the combination of the twopre-orders. See Section 3.4. The results from the partial pre-orders areaggregated into the ranking matrix. We have four possible cases:
i. A is higher ranked than B in both distillations or A is better thanB in one distillation and has the same ranking in the otherdistillation then A is better than B: A P+ B.
Fig. 7. Final ranking.

Fig. 8. Three-tier architecture.
493C. Giannoulis, A. Ishizaka / Decision Support Systems 48 (2010) 488–497
ii. A is higher ranked than B in one distillation but B is better rankedthan A the other distillation then A is incomparable to B: A R B.
iii. A has the same ranking than B in both distillations then A isindifferent to B: A I B.
iv. A is lower ranked than B in both distillations or A is lowerranked than B in one distillation and has the same rank in theother distillation then A is worst than B: A P− B.
The final ranking is obtained by adding the number of P+. In case oftie, the comparison between the two alternatives with the same scoredecides between an indifferent or incomparable relation See Example 3.
Example 3. If we consider the two pre-orders of Fig. 6, the resultingranking matrix is given in Table 5:
The final ranking is given in Fig. 7, where it can be seen that U1, U2and U3 have the same scores but U1 and U3 are indifferent and U2 isincomparable to the two other alternatives.
4. Overview of the decision support system
4.1. Introduction
The system architecture is three-tier as shown in Fig. 8. It divides thefunctionality into independent logical layers, each one responsible fordifferent operations of the application and opaque to the other layers.
The first layer runs on standard Web browsers. In this tier, theusers enter their weighted criteria and related thresholds for theranking of universities and receive back a personalised ranking. Themiddle tier contains the Web server, where the ELECTRE III methodruns as described in Section 3. Its implementation uses an orientedobject design with C#. This layer is independent from the other andtherefore can be reusable or upgradable for other decision problems.The bottom layer stores the performance of the universities, which arethose used by The Complete University Guide. See Table 6. The TimesHigher Education uses the same criteria with the exception that itmerges the criteria “Academic Services Spend” and “Facilities Spend”
Table 6Criteria used for the ranking of universities [49].
Criterion Description
Student satisfaction Evaluation of students on the teaching quality.Research assessment Average quality of the research undertaken.Entry standards Average UCAS tariff score of new students under
the age of 21.Staff/student ratio Average staffing level.Academic services spend Expenditures per student in all academic services.Facilities spend Expenditures per student on staff and student facilities.Good honours Percentage of graduates achieving a first or upper
second class honours degree.Graduate prospects Employability of a university's graduates.Completion Completion rate of those studying at the university.
in one criterion: “Services & Facilities Spend”. The selection of thesecriteria may be considered controversial. They have been retained inour study because it allows a comparative evaluation of our systemwith the existing ones (Section 5). However, users are not obliged toselect all criteria. In the next section, we discuss the user interface.
4.2. User interface
4.2.1. IntroductionThe user interface is very important, as it is the link between a
person and the system. Because users of this support decision systemare unlikely to know ELECTRE III, we have implemented a simpleversion for them and an advanced version for more experienced users.The goal is to attract users with the simple version and then upgradethem to the advance version. Both versions are based on awizard stylewith five steps easily to follow (start page, criteria selection, weightssettings, threshold settings and ranking display). The algorithm usedis the same for the two versions (see Section 3), only the user interfaceand the required values differs.
4.2.2. Simple versionThe simple version is created for unfamiliar users of the ELECTRE III
method or for users wishing to see the universities rankings quickly.As a verbal scale is intuitively appealing, user-friendly and morecommon in our everyday lives, it has been preferred in this version forthe criteria weights and thresholds. The drawback of the user-friendliness is that some arbitrary choice must be made, in this casehow the verbal scale is converted to numbers. Table 7 shows theconversion for the weights (scale 2–10) and the indifference thresh-olds (multiplicative factor 0.2–1).
In order to minimise the number of inputs required, we have usedthe double threshold model, where only the indifference threshold isrequired. The value of the veto preference threshold is the double ofthe value of the preference threshold, which is the double of the valueof the indifference threshold. See Fig. 9. It is an arbitrary choice used inother applications [40], which allows a gain of time and an increase ofthe usability.
4.2.3. Advanced versionThe advanced version is aimed at users who are or who become
familiarwith the ELECTRE III. In contrast with the simple version,where
Table 7Conversion verbal to numerical scale.
Verbal scale Weights Indifference thresholds
Very low 2 0.2Low 4 0.4Medium 6 0.6High 8 0.8Very high 10 1

Fig. 9. Simple version with verbal inputs.
494 C. Giannoulis, A. Ishizaka / Decision Support Systems 48 (2010) 488–497
there is no fixed scale nor for weights neither for thresholds. Users canenterweights on thenumerical scale of their choice (e.g.1–10 or 1–100).The thresholds are defined with a multiplicative parameter a and anadditive parameter b. See Fig. 10. For example, suppose that the userselect b=15 and a=0.1 and the performance of alternative X is 100. Allalternatives with a performance 100±25 (25=15+100·0.1) areindifferent to the alternative X.
Fig. 10. Advanced version w
4.2.4. Final rankingThe commercial software for ELECTRE III uses a graph for
representing the results. It allows the distinction between indifferentand incomparable. However, this representation is not possible with alarge number of alternatives, as it is very difficult to read the results.Our solution uses a table to display the ranking of the 113 universities.It can seen that rankings depend highly from the criteria and weights
ith numerical inputs.

Fig. 11. Final customised ranking. Note: In this case, the universities of York, Bath, Bristol, Manchester and Dundee are all ranked 10. The first four are indifferent (in grey) and the lastone is incomparable (in yellow).
Fig. 12. Additional comparison in final customised ranking. Note: Compared with Fig. 11, other criteria and weights can lead to a very different ranking.
495C. Giannoulis, A. Ishizaka / Decision Support Systems 48 (2010) 488–497

Table 8Status of ranked universities.
Status Colour Description
Normal No colour One university per rank.Indifferent Two or more universities have the same rank
and are indifferent.Incomparable Two or more universities have the same rank
and are incomparable.
Fig. 14. Bar chart of comparison with other Websites.
496 C. Giannoulis, A. Ishizaka / Decision Support Systems 48 (2010) 488–497
selected by the user. See Figs. 11 and 12. The distinction betweenindifferent and incomparable universities is made with colours. SeeTable 8.
5. Evaluation
There were two types of evaluation that were conducted: aquestionnaire and an observation of users. We sent a questionnaire byemail to 800 students of our university, as the application has beenconceivedmainly to help students in the selection of a university. Theywere asked to visit the Web-system and answer an anonymousquestionnaire. This approach was selected in order that students cancomplete the questionnaire where, when and only if they want it. Thedisadvantage of this unpressured voluntary exercise is a lowparticipation: 20 participants (2.5% response rate). However, thecollected data gives us some significant indications.
Eighty percent of the respondents claimed that the universityranking was of interest to them but only 55% have already visited aWebsite providing this type of ranking. This observation is in line withpast researches [22,27] indicating that students do not rely oncommercial rankings in choosing their university in UK. Only oneparticipant knew ELECTRE III before. Fifty percent of the participantsused only the simple version, 20% of the participants used only theadvanced version and 30% used both versions. Users, even thoseunfamiliar with ELECTRE III, were able to understand and appreciatethe working of the system. When they were asked to assess the Web-system (Figs. 13 and 14), the results clearly indicate that the systemwas helpful and better than the other current solutions.
For the second evaluation, a group of 10 masters' students wereobserved. All students first used the simple version, which is easierand selected by default on the welcome page. At the beginning, somestudents asked the purpose of the thresholds. Then after, they foundthe system easy and straightforward to use. All students rated thesystem far superior to the current commercial rankings as the user canselect the criteria, their allocated weight and it returns moreinformation (e.g. indifferent and incomparable universities). Finally,they encouraged the developers to implement a similar system
Fig. 13. Bar chart eva
ranking universities by specialities (like business schools or engineer-ing faculties).
6. Conclusion
Professor Cooper was one of the first researchers to evaluate theperformance of education institutions, especially with DEA. Acknowl-edging his contribution in performance evaluation, we have seen thatDEA has a problem when used as a ranking method [45]. It has evenbeen called “Multiattribute for lazy decision maker” [20] as no input isrequired from the user. Today, several commercial rankings ofUniversities are periodically published. These ranking have beenseverely criticised and may not be as useful as students do not rely onthem for selecting their university. Oswald [37] concludes that “Britainneeds a wider range of rankings” in order to help students. Our web-system respond to this need as it provides a personalised ranking ofthe 113 official British Universities. It cannot be ascertained that auniversity is always better than another as the ranking depends on thecriteria and weights selected by the user. Ranking universities rely onimprecise, indeterminate and uncertain criteria; therefore ELECTRE IIIwith its pseudo-criteria was appropriate for this problem. Further-more it allows:
- to bypass the problem of the full aggregation of incommensurateperformances,
- to reveal any disastrous criterion with the veto threshold,- todistinguish between indifferent and incomparable alternatives, and- to compare a very large number of universities (the limitation isgiven by the physical storage of data and not from ELECTRE III).
However, ELECTRE III suffers from some issues in the exploitationprocess of the outranking relations. As the graph of the relations maybe complicated, especially for a large number of alternatives, anautomatic process must be used to generate the final ranking. For thispurpose, the distillation has been developed. The drawback of the
luating the tool.
497C. Giannoulis, A. Ishizaka / Decision Support Systems 48 (2010) 488–497
distillation is that an arbitrary threshold has to be selected, whichmayhave an impact on the final ranking. In our future research, we willinvestigate the impact of this threshold on the final ranking. We willalso research other methods to exploit the outranking relations.
Acknowledgements
The authors are indebted to their colleagues Vijay Pereira, DavidWhitmarsh, Michael Wood and two anonymous referees for theirvaluable comments and suggestions, which have greatly improved theearlier version of the paper.
References
[1] M. Abbott, C. Doucouliagos, The efficiency of Australian universities: a dataenvelopment analysis, Economics of Education Review 22 (1) (2003) 89–97.
[2] N. Adler, L. Friedman, Z. Sinuany-Stern, Review of ranking methods in the dataenvelopment analysis context, European Journal of Operational Research 140 (2)(2002) 249–265.
[3] T. Ahn, V. Arnold, A. Charnes, W. Cooper, DEA and ratio efficiency analyses forpublic institutions of higher learning in Texas, Research in Governmental andNonprofit Accounting 5 (1989) 165–185.
[4] F. Arcelus, An efficiency review of university departments, International Journal ofSystems Science 28 (7) (1997) 721–729.
[5] V. Arnold, I. Bardhan, W. Cooper, S. Kumbhakar, New uses of DEA and statisticalregressions for efficiencyevaluation and estimation—with an illustrative applicationto public secondary schools in Texas, Annals of Operations Research 66 (4) (1996)255–277.
[6] A. Athanassopoulos, E. Shale, Assessing the comparative efficiency of HigherEducation Institutions in the UK by the means of Data Envelopment Analysis,Education Economics 5 (2) (1997) 117–134.
[7] V. Belton, A. Gear, On a shortcoming of Saaty's method of analytical hierarchies,Omega 11 (3) (1983) 228–230.
[8] E. Bernroider, V. Stix, Profile distance method — a multi-attribute decision makingapproach for information system investments, Decision Support Systems 42 (2)(2006) 988–998.
[9] A. Bessent, W. Bessent, Determining the comparative efficiency of schools throughData Envelopment Analysis, Educational Administration Quarterly 16 (2) (1980)57–75.
[10] A. Bessent, W. Bessent, J. Kennington, B. Reagan, An application of mathematicalprogramming to assess productivity in the Houston independent school district,Management Science 28 (12) (1982) 1355–1367.
[11] A. Bessent, W. Bessent, A. Charnes, W. Cooper, N. Thorogood, Evaluation ofeducational program proposals by means of DEA, Educational AdministrationQuaterly 2 (1983) 82–107.
[12] D. Bouyssou, Using DEA as a tool for MCDM: some remarks, Journal of theOperational Research Society 50 (9) (1999) 974–978.
[13] R. Bowden, Fantasy Higher Education: university and college league tables, Qualityin Higher Education 6 (1) (2000) 41–60.
[14] T. Breu, R. Raab, Efficiency and perceived quality of the nation's “top 25” NationalUniversities and National Liberal Arts Colleges: an application of data envelopmentanalysis to higher education, Socio-Economic Planning Sciences 28 (1) (1994) 33–45.
[15] P. Brockett, W. Cooper, L. Lasdon, B. Parker, A note extending Grosskopf, Hayes,Taylor and Weber, “Anticipating the consequences of school reform: a new use ofDEA”, Socio-Economic Planning Sciences 39 (4) (2005) 351–359.
[16] H. Cengiz, M. Yuki,Measuring value inMBA programmes, Education Economics 6 (1)(1998) 11–25.
[17] A. Charnes, W. Cooper, E. Rhodes, Measuring the efficiency of decision makingunits, European Journal of Operational Research 2 (6) (1978) 429–444.
[18] A. Charnes, W. Cooper, E. Rhodes, Evaluating program and managerial efficiency: anapplication of data envelopment analysis to program follow through, ManagementScience 27 (6) (1981) 668–697.
[19] W. Cooper, L. McAlister, Can research be basic and applied? You bet. It better be forB-schools! Socio-Economic Planning Sciences 33 (4) (1999) 257–276.
[20] J. Doyle,Multiattribute choice for the lazy decisionmaker: let the alternatives decide!Organizational Behavior and Human Decision Process 62 (1) (1995) 87–100.
[21] J. Doyle, R. Green, Data envelopment analysis and multiple criteria decision making,Omega 21 (6) (1993) 713–715.
[22] C. Eccles, The use of university rankings in the United Kingdom, Higher Educationin Europe 27 (4) (2002) 423–432.
[23] S. El-Mahgary, R. Lahdelma, Data envelopment analysis: visualizing the results,European Journal of Operational Research 83 (2) (1995) 700–710.
[24] A. Emrouznejad, B. Parker, G. Tavares, Evaluation of research in efficiency andproductivity: a survey and analysis of the first 30 years of scholarly literature inDEA, Socio-Economic Planning Sciences 42 (3) (2008) 151–157.
[25] L. Friedman, Z. Sinuany-Stern, Scaling units via the canonical correlation analysis inthe DEA context, European Journal of Operational Research 100 (3) (1997) 629–637.
[26] F. Glover, T. Sueyoshi, Contributions of Professor William W. Cooper in operationsresearch andmanagement science, European Journal of Operational Research197 (1)(2009) 1–16.
[27] R. Gunn, S. Hill, The impact of league tables on university application rates, HigherEducation Quaterly 62 (3) (2008) 273–296.
[28] N. Huck, Pairs selection and outranking: an application to the S&P 100 index,European Journal of Operational Research 196 (2) (2009) 819–825.
[29] A. Ishizaka, A multicriteria approach with AHP and clusters for supplier selection,Paper Presented at the 15th International Annual EurOMA Conference, Groningen,2008.
[30] A. Ishizaka, A.W. Labib, Towards fifty years of the analytic hierarchy process,Keynote Paper presented at the 50th Operational Research Society Conference,York, 2008.
[31] J. Johnes, Data envelopment analysis and its application to the measurement ofefficiency inhighereducation,Economicsof EducationReview25(3)(2006)273–288.
[32] J. Johnes, L. Yu, Measuring the research performance of Chinese higher educationinstitutions using data envelopment analysis, China Economic Review 19 (4) (2008)679–696.
[33] M. Mannino, S.N. Hong, I.J. Choi, Efficiency evaluation of data warehouseoperations, Decision Support Systems 44 (4) (2008) 883–898.
[34] S. Marginson, Global university rankings: implications in general and for Australia,Journal of Higher Education Policy and Management 29 (2) (2007) 131–142.
[35] C. Martin, Y. Ruperd, M. Legret, Urban stormwater drainage management: thedevelopment of a multicriteria decision aid approach for best managementpractices, European Journal of Operational Research 181 (1) (2007) 338–349.
[36] E. Natividade-Jesus, J. Coutinho-Rodrigues, C.H. Antunes, A multicriteria decisionsupport system for housing evaluation, Decision Support Systems 43 (3) (2007)779–790.
[37] A. Oswald, An economist's view of university league tables, Public Money &Management 21 (3) (2001) 5–6.
[38] A. Papadopoulos, A. Karagiannidis, Application of the multi-criteria analysis methodElectre III for the optimisation of decentralised energy systems, Omega 36 (5) (2008)766–776.
[39] J.C. Pomerol, S. Barba-Romero, Multicriterion Decision in Management: Principlesand Practice, Kluwer Academic Publishers, 2000.
[40] M. Rogers, Using ELECTRE III to aid the choice of housing construction processwithinstructural engineering, Construction Management and Economics 18 (3) (2000)333–342.
[41] N. Roussat, C. Dujet, J. Méhu, Choosing a sustainable demolition waste manage-ment strategy using multicriteria decision analysis, Waste Management 29 (1)(2009) 12–20.
[42] B. Roy, ELECTRE III: algorithme de classement base sur une présentation floue despréférences en présence de critères multiples, Cahiers du CERO 20 (1) (1978) 3–24.
[43] B. Roy, D. Bouyssou, Aide Multicritère d'Aide a la Décision: Méthodes et Cas,Economica, Paris, 1993.
[44] C. Serrano-Cinca, Y. Fuertes-Callén, C. Mar-Molinero, Measuring DEA efficiency ininternet companies, Decision Support Systems 38 (4) (2005) 557–573.
[45] T. Stewart, Relationships between data envelopment analysis and multicriteriadecision analysis, Journal of theOperational Research Society 47 (5) (1996) 654–665.
[46] T. Sueyoshi, M. Goto, DEA–DA for bankruptcy-based performance assessment:misclassification analysis of Japanese construction industry, European Journal ofOperational Research (2009), doi:10.1016/j.ejor.2008.1011.1039 (advance onlinepublication).
[47] T. Sueyoshi, M. Goto, Can R&D expenditure avoid corporate bankruptcy? Comparisonbetween Japanese machinery and electric equipment industries using DEA–discriminant analysis, European Journal of Operational Research 196 (1) (2009)289–311.
[48] T. Sueyoshi, K. Sekitani, An occurrence of multiple projections in DEA-basedmeasurement of technical efficiency: theoretical comparison among DEA modelsfrom desirable properties, European Journal of Operational Research 196 (2) (2009)764–794.
[49] The league table of UK universities, The Complete University Guide, 2009 http://www.thecompleteuniversityguide.co.uk/single.htm?ipg=6310#How%20the%20League%20Table%20works (2008).
[50] E. Takeda, A method for multiple pseudo-criteria decision problems, Computers &Operations Research 28 (14) (2001) 1427–1439.
[51] P. Taylor, R. Braddock, International university ranking systems and the idea ofuniversity excellence, Journal of Higher Education Policy and Management 29 (3)(2007) 245–260.
[52] C. Tofallis, Selecting the best statistical distribution using multiple criteria,Computers & Industrial Engineering 54 (3) (2008) 690–694.
[53] J. Vaughn, Accreditation, commercial rankings, and new approaches to assessingthe quality of university research and education programmes in the United States,Higher Education in Europe 27 (4) (2002) 433–441.
[54] Y.-M. Wang, K.-S. Chin, G.K.K. Poon, A data envelopment analysis method withassurance region for weight generation in the analytic hierarchy process, DecisionSupport Systems 45 (4) (2008) 913–921.
[55] M. Yorke, A good league table guide, Quality Assurance in Education 5 (2) (1997)61–72.
ChristosGiannoulis obtainedhisMSc in Software Engineering at the School of Computingof the University of Portsmouth in 2008. His research interests are on the fields of softwaredevelopment methods, project management and decision analysis.
Alessio Ishizaka is Senior Lecturer at the Portsmouth Business School of the Universityof Portsmouth. He received his PhD from the University of Basel (Switzerland). Heworked successively for the University of Exeter (UK), University of York (UK) andAudencia Grande Ecole de Management Nantes (France). His research is in the area ofdecision-making. He was the co-organiser of a special AHP stream on the 50thOperational Research Society Conference, York, 2008 and he is a founding member ofthe Decision Deck Association (http://www.decision-deck.org/).