a water quality modelling study of roşia montană and the ...web.kvvm.hu/verespatak/2_annexes with...
TRANSCRIPT

A Water Quality Modelling Study of Roşia Montană
and the Abrud, Aries and Mures River Systems: Assessing Restoration Strategies and the Impacts of
Potential Pollution Events.
By
Professor Paul Whitehead
University of Reading School of Human and Environmental Sciences
Reading, RG6 6AB, UK
April 2007

INCA Model: Mures River, Romania and Hungary, 2007 2
TABLE OF CONTENTS
EXECUTIVE SUMMARY ....................................................................................................................3
1. INTRODUCTION.........................................................................................................................8
2. THE INCA MODEL...................................................................................................................10 2.1 Model Rationale and Background to Development .....................................................................10 2.2 Key Components of INCA............................................................................................................16 2.3 The hydrological model ...............................................................................................................17 2.4 INCA-N: The Nitrogen and Ammonium Model............................................................................21
3 APPLICATION OF INCA-N TO THE ROŞIA MONTANĂ CATCHMENTS AND THE ABRUD-ARIES-MURES RIVER SYSTEM......................................................................................24
3.1 Hydrological data analysis..........................................................................................................27 3.2 Modelling Nitrate-N and Ammonium in the Upper Catchments..................................................30 3.3 Modelling the Abrud-Aries-Mures River system..........................................................................32
4 A NEW INCA MODEL FOR CYANIDE AND METALS......................................................37 4.1 Brief Review of Modelling Metals and Processes........................................................................37 4.2 New model structure and equations.............................................................................................37 4.3 Application of INCA-Mine to the Upper Catchments and the Abrud-Aries-Mures River System............................................................................................................................................................48 4.3 Modelling Metals in the Abrud-Aries- Mures River System ........................................................53
5. SCENARIO ANALYSIS TO ASSESS RESTORATION STRATEGIES AND POTENTIAL POLLUTION EVENTS .......................................................................................................................58
5.1 Impact Assessment assuming current baseline scenarios....................................................58 5.2 Impact Assessment Assuming ARD Collection and Treatment............................................58 5.3 Impact Assessment Assuming Dam Break Scenarios ..........................................................62
6. THE HERMES MODEL AND THE BAIA MARE EVENT ..................................................69 6.1 Model Flow and Water Quality Equations ..................................................................................69 6.2 Modelling the Baia Mare Event..................................................................................................70 6.3 Modelling a Theoretical Roşia Montană Event ..........................................................................74
7. APPLICATION OF MONTE CARLO ANALYSIS TO ASSESS PEAK CYANIDE CONCENTRATIONS..........................................................................................................................76
8 CONCLUSIONS .........................................................................................................................80
9 REFERENCES............................................................................................................................83
APPENDIX 1 Estimating the Daily Evaporation, HER and SMD..........................................88

INCA Model: Mures River, Romania and Hungary, 2007 3
EXECUTIVE SUMMARY OBJECTIVES OF THE STUDY This Study was designed to determine river water quality downstream of the proposed Roşia Montană Project from two different perspectives:
1. Assessing the beneficial impacts of the clean up of past (“historical”) mining pollution resulting from the operation of the Roşia Montană Project (RMP). 2. Assessing the potential impacts resulting from worst case scenario pollution events from the Roşia Montană Project.
MODELS AND METHODOLOGY This study employs both the INCA and HERMES models, with inputs to simulate Roşia Montană conditions, and then assesses the findings for sensitivity to data variability using Monte Carlo analysis. INCA ORIGINS The result of a European research program, the INCA Model -- short for INtegrated CAtchment Model -- is a dynamic computer model that predicts water quality in rivers. INCA-Mine simulates water quality linked to mining. The model has been applied to the Roşia Montană catchments and the Abrud-Aries-Mures River System downstream. The modelling is included in the EU project EUROLIMPACS (38 institutional partners from 19 Countries) as a case study of the impacts of environmental change on metals in European Rivers ( www.eurolimpacs.ucl.ac.uk ). THE INCA MODEL INCA simulates the day to day variations in flow and water quality, including cadmium, lead, zinc, mercury, arsenic, copper, chromium, manganese, ammonia, and cyanide. The steps taken to conduct the modelling include:
1. Integrating hydrological and water quality data. 2. Simulating the key hydrological and chemical pathways and processes in the
catchments. 3. Simulating the rivers Abrud-Aries-Mures from Abrud to Nadlac at the
Hungarian Border with dilution calculations onto the Tisza. 4. Using the model to predict the improvements in water quality following the
control and clean up of existing (“historic”) pollution. 5. Predicting the likely impacts of accidental discharges on water quality
downstream.

INCA Model: Mures River, Romania and Hungary, 2007 4
The INCA model has been developed over the past ten years to simulate both terrestrial and aquatic systems and has been used to model a wide range of catchments. The basic structure of INCA has been tested on ten UK catchments and 21 catchments across Europe as part of an EU Research Project. The model is now a key component of the new Framework 6 EU research project, EUROLIMPACS (www.eurolimpacs.ucl.ac.uk) which is investigating impacts of environmental change across Europe. The model is process-based and therefore designed to cope with environmental change such as changes in land use, pollution levels and climate. The model seeks to incorporate the dominant mechanisms and processes operating so that a realistic and rapid assessment of environmental change can be evaluated. In this study, the model has been applied to the upper catchments at Roşia Montană and to the complete Abrud – Aries - Mures River System down to the Hungarian Border (and onto the Tisza river in terms of dilution). The modelling included eight metals (cadmium, lead, zinc, mercury, arsenic, copper, chromium, manganese) as well as Cyanide and Ammonia. The model has been set up to assess the impacts of discharges from future mining and collection and treatment operations at Roşia Montană. The model takes into account the dilution, mixing and processes affecting metals, ammonia and cyanide in the river system and gives estimates of concentrations at key locations along the river. The INCA model results give an evaluation of the beneficial impacts of the mine collection and treatment. The model is also used to assess the impacts of accidental discharges from Roşia Montană on cyanide concentrations in the downstream rivers. The Roşia Montană model has been incorporated into the research and training programme at the University of Cluj-Napoca (30km from the Aries) so that staff and students can investigate the processes and dynamics controlling hydrology and water quality in catchments and river systems. ADDITIONAL MODELS AND ANALYSIS In addition to using INCA, the HERMES model has been used to model dissolved oxygen and to validate the INCA settings. This is a simpler version of the INCA model and can be used in a real time forecasting mode to predict impacts of pollutants at very short notice. The model includes ammonia and dissolved oxygen, which can be affected by mine discharges. This model has been tested against the Baia Mare event and used to assess potential pollution events for Roşia Montană. The 2000 Baia Mare experience is asserted by some as a reason for concern relating to the impact of a worst case scenario at the Rosia Montana. To assess the relevance of such a comparison, the INCA model has been used to simulate a Baia Mare scale rainfall event happening at Rosia Montana. Finally, the uncertainty in the river model is considered using a Monte Carlo analysis to investigate the likely behaviour of cyanide levels at key locations along the river system. This allows for parameters such as velocity, dispersion and decay rate to be

INCA Model: Mures River, Romania and Hungary, 2007 5
specified as a distribution of values rather than specific values, reflecting their uncertainty and variability. From 5000 simulations a range of peak concentrations at key sites along the river system has been obtained. SUMMARY OF KEY RESULTS Against the two objectives described above, the Study reports these key findings: REMEDIAL IMPACT OF THE ROSIA MONTANA PROJECT The RMP will remove the majority of the Rosia Montana and Corna sources of historic Acid Rock Drainage that currently pollute the rivers systems with metals such as cadmium, lead, zinc, arsenic, copper, chromium and manganese. WORST-CASE IMPACT ASSESSMENT Under worst case scenarios for Dam Failure, the INCA model shows that, with over 595 km of river between the RMP and the Hungarian Border, there is considerable dilution and dispersion in the Aries, Mures and Tisza River Systems. Cyanide concentrations would be below the Hungarian water quality standard for Category 1 rivers (0.1mg/l CN1 WAD2) before it crosses into Hungary. For the case of the comparison with Baia Mare – the cyanide levels would by in line with the Romanian, EU and Hungarian drinking water standards (0.05mg/l CN Total) well before the Mures river crosses into Hungary. Impact of RMP on Historic Pollution There is a significant improvement in water quality after the collection and treatment of the mine discharges. Table 5.5, reproduced below, shows more clearly the improvements as it gives the percentage reductions in load down the system. The reductions are significant with reductions averaging 60%, but in some cases -- such as for zinc -- much higher. This reflects the effectiveness of the metals removal process in the Waste Water Treatment Facility which is part of the Rosia Montana Project. Metal Losses % Rosia Reach Turda Nadlac Cadmium 79.3 81.9 80.4 Lead 6.2 17.9 27.2 Zinc 92.5 93.0 93.6 Mercury 0 0 0 Arsenic 64.5 69.4 73.2 Copper 49.5 54.5 59.4 Chromium 87.4 88.5 89.9 Manganese 93.9 94.7 95.5 Table 5.5 Percentage metal load reductions assuming collection and treatment conditions
1 CN: Cyanide (one atom of Carbon and one of Nitrogen) 2 WAD: Weak Acid Dissociable

INCA Model: Mures River, Romania and Hungary, 2007 6
Impact of RMP, Worst Case Analysis for Cyanide The Table below (Table 5.11 in the Report) gives a summary of the peak concentrations of CN in the river system at key locations along the river, namely Nadlac (the border) and at the Tisza just after the Mures joins. The Table shows that the peak concentrations at the border and in the Tisza are below the standard for cyanide with the lower levels in the Tisza reflecting the extra dilution of this river. The study notes that the low level of CN is perhaps expected, as the new EU Directive on Waste Management stipulates CN must be below the 10 mg/l CN WAD before tailings are discharged into a TMF3. This is five times lower than previously accepted international standards and many times lower than that which was experienced at Baia Mare in 2000. In fact the designed concentrations of cyanide for the Rosia Montana Project are even lower than the new EU limit. As a result, any TMF failure would begin with far lower levels of CN, even before dilution, dispersion and degradation. Scenario Peak CN WAD
Concentration at Nadlac (mg/l)
Peak CN WAD Concentration in Tisza just after the Mures joins (mg/l)
1a 0.012 0.0024 1b 0.022 0.0044 1c 0.0065 0.0013 2a 0.05 0.01 2b 0.093 0.018 2c 0.025 0.005 (Table 5.11 in the Report) CN concentrations at key locations for the different scenarios and accounting for additional dilution in the Tisza For the simulation of a Baia Mare 2000 event in Rosia Montana, the results (Tables 5.7-5.9) show that Baia Mare scale rainfall events will not generate in the case of Rosia Montana anything remotely near the kinds of concentrations seen at Baia Mare – both for national and international context. Indeed, if an accident were to occur in Rosia Montana, the results show that the concentrations of total cyanides at the border would be well below the EU, Romania and Hungarian drinking water standards (0.05mg/l CN Total). This is primarily because of the significantly lower cyanide concentrations being deposited into the pond behind the dam in the case of Rosia Montana. This is enforced by the EU Mine Water Directive and enabled by the application of EU Best Available Techniques (BAT) and the capacity to first store two Probable Maximum Floods (PMF4s) prior to release -- plus the fact that the Hungarian boarder is 595km away from Rosia Montana. Impact of RMP, Worst Case Analysis for Metals The simulation results for the worst case analysis for the metals is given in Table 5.13 of the Report, reproduced below, which shows the 2b scenario (gives highest metal values) results
3 TMF: Tailing’s Management Facility 4 PMF: The Probable Maximum Flood (PMF) is the flood that may be expected from the most severe combination of critical meteorological and hydrologic conditions that are reasonably possible in a particular drainage area

INCA Model: Mures River, Romania and Hungary, 2007 7
for the key metals affected by an accidental discharge. All of the concentrations are below the classification standards for the Danube River and tributaries (ICPDR, TNMN Yearbook 2003). Metal Nadlac (Border)
Concentration mg/l
Szeged Concentration mg/l
Cadmium 0.0009 0.0002 Zinc 0.003 0.0006 Arsenic 0.0037 0.0007 Copper 0.0017 0.00032 Chromium 0.0016 0.00031 Manganese 0.0067 0.0013 (Table 5.13 in the Report) The simulated metal concentrations at key sites under the worse case scenario.
INCA Model: Mures River, Romania and Hungary, 2007 8
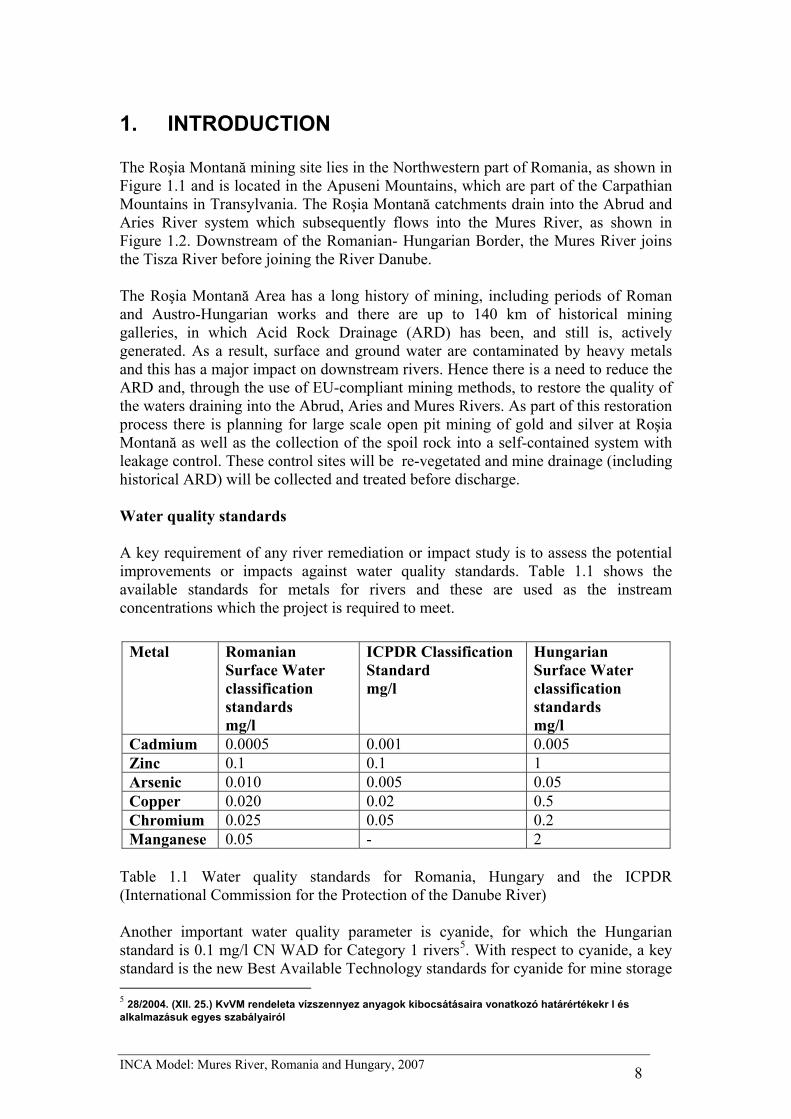
1. INTRODUCTION The Roşia Montană mining site lies in the Northwestern part of Romania, as shown in Figure 1.1 and is located in the Apuseni Mountains, which are part of the Carpathian Mountains in Transylvania. The Roşia Montană catchments drain into the Abrud and Aries River system which subsequently flows into the Mures River, as shown in Figure 1.2. Downstream of the Romanian- Hungarian Border, the Mures River joins the Tisza River before joining the River Danube. The Roşia Montană Area has a long history of mining, including periods of Roman and Austro-Hungarian works and there are up to 140 km of historical mining galleries, in which Acid Rock Drainage (ARD) has been, and still is, actively generated. As a result, surface and ground water are contaminated by heavy metals and this has a major impact on downstream rivers. Hence there is a need to reduce the ARD and, through the use of EU-compliant mining methods, to restore the quality of the waters draining into the Abrud, Aries and Mures Rivers. As part of this restoration process there is planning for large scale open pit mining of gold and silver at Roşia Montană as well as the collection of the spoil rock into a self-contained system with leakage control. These control sites will be re-vegetated and mine drainage (including historical ARD) will be collected and treated before discharge. Water quality standards A key requirement of any river remediation or impact study is to assess the potential improvements or impacts against water quality standards. Table 1.1 shows the available standards for metals for rivers and these are used as the instream concentrations which the project is required to meet.
Table 1.1 Water quality standards for Romania, Hungary and the ICPDR (International Commission for the Protection of the Danube River) Another important water quality parameter is cyanide, for which the Hungarian standard is 0.1 mg/l CN WAD for Category 1 rivers5. With respect to cyanide, a key standard is the new Best Available Technology standards for cyanide for mine storage 5 28/2004. (XII. 25.) KvVM rendeleta vízszennyez anyagok kibocsátásaira vonatkozó határértékekr l és alkalmazásuk egyes szabályairól
Metal Romanian Surface Water classification standards mg/l
ICPDR Classification Standard mg/l
Hungarian Surface Water classification standards mg/l
Cadmium 0.0005 0.001 0.005 Zinc 0.1 0.1 1 Arsenic 0.010 0.005 0.05 Copper 0.020 0.02 0.5 Chromium 0.025 0.05 0.2 Manganese 0.05 - 2

INCA Model: Mures River, Romania and Hungary, 2007 9
waters. The new EU Directive on Waste Management stipulates CN must be below the 10 mg/l level and this well below the previous EU standard of 50 mg/l. Environmental Impact Strategy A key question concerning the Roşia Montană development is the impact of the restoration strategies and potential dam failure scenarios on the downstream water quality. It this current study, this question is addressed using an elaborate process-based and dynamic model INCA (Integrated Catchment Model) of water contamination and transport for the downstream river systems. The model is tested for the upstream catchments and the applied to the full river system, down as far as the Hungarian Border at Nadlac on the Mures River. A suite of scenarios are investigated to evaluate the improvements in water quality given the planned restoration and also the potential pollution that may arise in the event of a future dam failure. In addition, a second model, HERMES, is used to evaluate operational management of the river system so that HERMES could become the basis of an early warning or real time forecasting system for the Aries and Mures River system. This could be incorporated into the River Danube forecasting system being established by the International Commission for the Protection of the Danube River Basin (ICPDR). Also, the models will form part of a new course to be offered at the University of Cluj-Napoca, and will be incorporated into the Curriculum of the University of Cluj-Napoca. The models will also be made available to the Romanian Water Authorities so that they have a tool for impact assessment and for water resource and water quality planning.
Figure 1.1: Romania and the Location of Roşia Montană

INCA Model: Mures River, Romania and Hungary, 2007 10
Figure 1.2: The Mures River Basin, key locations and sub-catchments.
2. THE INCA MODEL 2.1 Model Rationale and Background to Development The Origins of INCA The result of a European research effort, the INCA Model-- short for INtegrated CAtchment Model-- is a dynamic computer model that predicts water quality in rivers. INCA Mine simulates water quality linked to mining. The model has been applied to the Rosia Montana catchments and the Abrud-Aries-Mures River System downstream. The modelling is included in the EU project EUROLIMPACS as a case study of the impacts of environmental change on metals in European Rivers (www.eurolimpacs.ucl.ac.uk). INCA simulates the day to day variations in flow and water quality, including cadmium, lead, zinc, mercury, arsenic, copper, chromium, manganese, ammonia and cyanide. The steps taken to conduct the modelling include:
1. Integrating hydrological and water quality data. 2. Simulating the key hydrological and chemical pathways and processes in the catchments. 3. Simulating the Rivers Abrud-Aries-Mures from Abrud to Nadlac at the Hungarian Border. 4. Using the model to predict the improvements in water quality following the control and clean up of existing (“historic”) pollution. 5. Predicting the likely impacts of accidental discharges on water quality downstream.

INCA Model: Mures River, Romania and Hungary, 2007 11
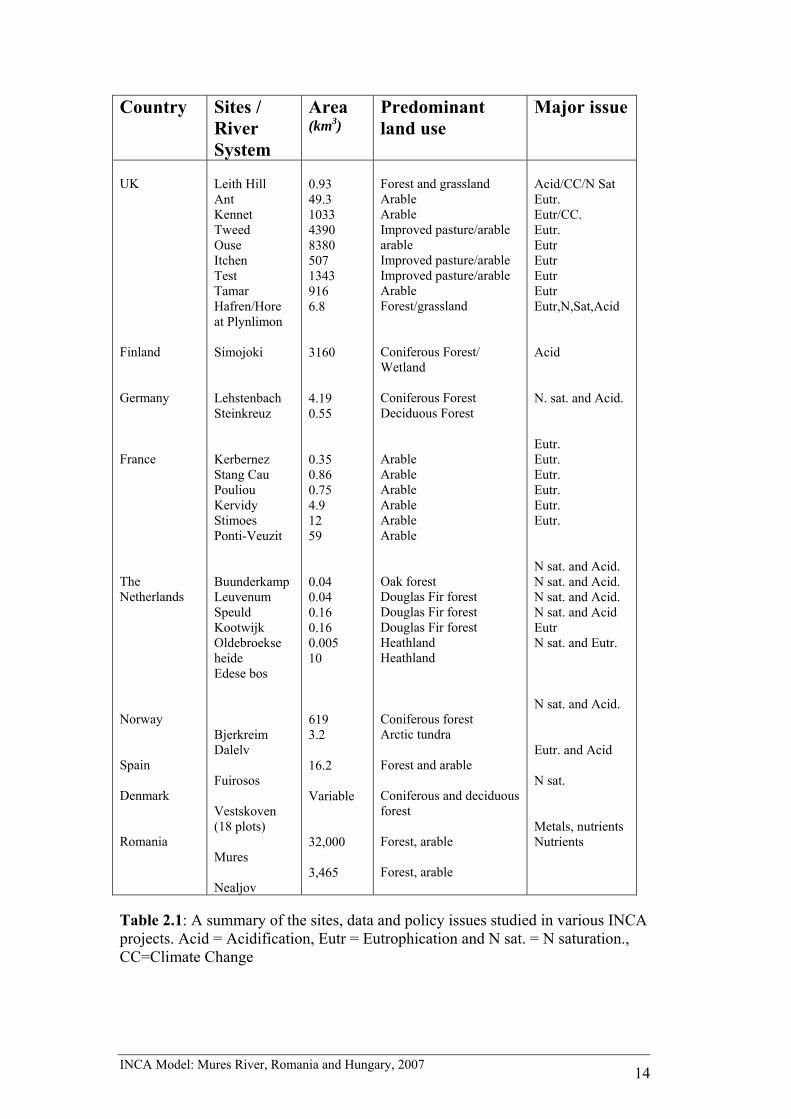
In this study, the original INCA-N model for hydrology, nitrate and ammonium has been applied to the upper catchments at Roşia Montană and to the complete Abrud- Aries- Mures River System down to the Hungarian Border. Calculations for the Tisza have also been included allowing for the higher flows, and hence extra dilution, in the Tisza. A new version of the model, INCA-MINE, has been created for Roşia Montană to simulate eight metals, namely cadmium, lead, zinc, mercury, arsenic, copper, chromium and manganese as well as Cyanide and Ammonia. The model has been applied to the upper catchments at Roşia Montană as well as the complete Abrud-Aries-Mures River system down to the Hungarian Border. The model has been set up to assess the impacts of discharges from future mining and collection and treatment operations at Roşia Montană. The model takes into account the dilution, mixing and processes affecting metals, ammonia and cyanide in the river system and gives estimates of concentrations at key locations along the river. The results indicate that low cyanide concentrations will be achieved downstream depending on the particular flow conditions in the river. The INCA model has been used to evaluate the beneficial impacts of the mine collection and treatment and it is shown that substantial improvements in water quality are achieved along the river system. The model is also used to assess the impacts of accidental discharges from Roşia Montană on cyanide concentrations in the downstream rivers. The Rosia Montana model has been incorporated into the research and training programme at the University of Cluj-Napoca so that staff and students can investigate the processes and dynamics controlling hydrology and water quality in catchments and river systems. The philosophy of the INCA model is to provide a process-based representation of the factors and processes controlling flow and water quality dynamics in both the land and in-stream components of river catchments, whilst minimising data requirements and model structural complexity (Whitehead et al., 1998a,b). As such, the INCA model produces daily estimates of discharge, and stream water quality concentrations and fluxes, at discrete points along a river’s main channel (Figure 2.1). Also, the model is semi-distributed, so that spatial variations in land use and management can be taken into account, although the hydrological connectivity of different land use patches is not modelled in the same manner as a fully-distributed approach, such as SHETRAN (Birkinshaw and Ewen, 2000). Rather, the hydrological and nutrient fluxes from different land use classes and sub-catchment boundaries are modelled simultaneously and information fed sequentially into a multi-reach river model. The INCA model has been tested on 10 catchments in the UK and 21 catchments across the EU, as shown in Table 2.1. The sites encompass a broad range of climate, geology, soil and land-use types, and ranged in spatial scale from plot and small sub-catchment studies to large river catchments of approximately 4000 km2. The INCA model became a focus of a pan European project in 1999 and the countries involved in this project are shown in Figure 2.2. The primary aim of the EU INCA project was to test whether the INCA model could be made generic and applicable in all major

INCA Model: Mures River, Romania and Hungary, 2007 12
European ecosystem types from the drier Mediterranean environments through temperate Atlantic and Continental systems to Arctic northern conditions. In addition, the INCA model has been adopted as part of the new EU funded EUROLIMPACS Project (see www.eurolimpacs.ucl.ac.uk). This is a major project involving 38 partners from every country in the EU, including Romania, with the aim of investigating the impacts of pollution, climate change and land use change on rivers, lakes and wetlands across Europe. Figure 2.3 shows the partners involved in the Eurolimpacs project. The major applications of INCA have been published to date in two special volumes of International Journals, namely, Hydrology and Earth System Sciences, 2002, 6, (3) and Science of the Total Environment, 2006, 365, (1-3). The INCA-N Model A thorough review of the underlying factors and processes controlling N transport and storage was undertaken during the EU project using both historic and new data, the latter collected as part of the EU INCA project. The basic equations of the INCA model were developed originally for the UK environment and these proved to be an adequate basis for the initial model applications. However, to cover such a wide variety of catchment types and pollution issues across the EU and to incorporate the latest processes understanding derived from the data analysis, parts of the INCA model were refined in relation to (a) the hydrology, (b) the representation of land management and (c) the factors controlling the biological processes of nitrogen transformation. Specifically, these refinements relate to the addition of soil water and ground water retention volumes, more detailed vegetation growth periods and fertiliser application mechanisms, and additional soil moisture and temperature controls (Wade et al., 2002). Work on the reformulation of the equations and numerical integration also ensured that mass-balance was maintained by the model. Subsequently the INCA framework has been utilized as the basis of a Phosphorous model and a sediment model, and to this structure has been added an ecological component which simulates macrophytes, epiphytes, and phytoplankton. In this section of the report we review the basic structure of the hydrology and nitrogen version of the model, describe the basic processes and equations and illustrate the application of the model to the upper catchments of Roşia Montană and the Abrud-Aries–Mures River System.

INCA Model: Mures River, Romania and Hungary, 2007 13
Figure 2.1: The integration of the landscape delivery and in-stream components of INCA. At level 1 the catchment is decomposed into sub-catchments. At level 2, the sub-catchments are sub-divided into 6 different land use types. At level 3, the soil chemical transformations and stores are simulated using the cell model. The diagram shows the link between the land-phase delivery and in-stream components at level 1: the diffuse inputs from the land-phase are added to the effluent point-source inputs and routed downstream.
INCA Model: Mures River, Romania and Hungary, 2007 14
Country Sites / River System
Area (km3)
Predominant land use
Major issue
UK Finland Germany France The Netherlands Norway Spain Denmark Romania
Leith Hill Ant Kennet Tweed Ouse Itchen Test Tamar Hafren/Hore at Plynlimon Simojoki Lehstenbach Steinkreuz Kerbernez Stang Cau Pouliou Kervidy Stimoes Ponti-Veuzit Buunderkamp Leuvenum Speuld Kootwijk Oldebroekse heide Edese bos Bjerkreim Dalelv Fuirosos Vestskoven (18 plots) Mures Nealjov
0.93 49.3 1033 4390 8380 507 1343 916 6.8 3160 4.19 0.55 0.35 0.86 0.75 4.9 12 59 0.04 0.04 0.16 0.16 0.005 10 619 3.2 16.2 Variable 32,000 3,465
Forest and grassland Arable Arable Improved pasture/arable arable Improved pasture/arable Improved pasture/arable Arable Forest/grassland Coniferous Forest/ Wetland Coniferous Forest Deciduous Forest Arable Arable Arable Arable Arable Arable Oak forest Douglas Fir forest Douglas Fir forest Douglas Fir forest Heathland Heathland Coniferous forest Arctic tundra Forest and arable Coniferous and deciduous forest Forest, arable Forest, arable
Acid/CC/N Sat Eutr. Eutr/CC. Eutr. Eutr Eutr Eutr Eutr Eutr,N,Sat,Acid Acid N. sat. and Acid. Eutr. Eutr. Eutr. Eutr. Eutr. Eutr. N sat. and Acid. N sat. and Acid. N sat. and Acid. N sat. and Acid Eutr N sat. and Eutr. N sat. and Acid. Eutr. and Acid N sat. Metals, nutrients Nutrients
Table 2.1: A summary of the sites, data and policy issues studied in various INCA projects. Acid = Acidification, Eutr = Eutrophication and N sat. = N saturation., CC=Climate Change

INCA Model: Mures River, Romania and Hungary, 2007 15
Figure 2.2: The Original INCA EU Project Partner Countries.
Figure 2.3: The New Eurolimpacs Project Partners KEY University College London, Environmental Change Research Centre (ECRC), London (UCL); National Environmental Research Institute, Department of Freshwater Ecology, Silkeborg (NERI); Royal Holloway Institute for Environmental Research, Wetland Ecosystems Research Group, London (RHBNC); University of Duisburg-Essen, Centre for Microscale Ecosystem, Institute of Hydrobiology, Essen (UDE);
INCA Model: Mures River, Romania and Hungary, 2007 16
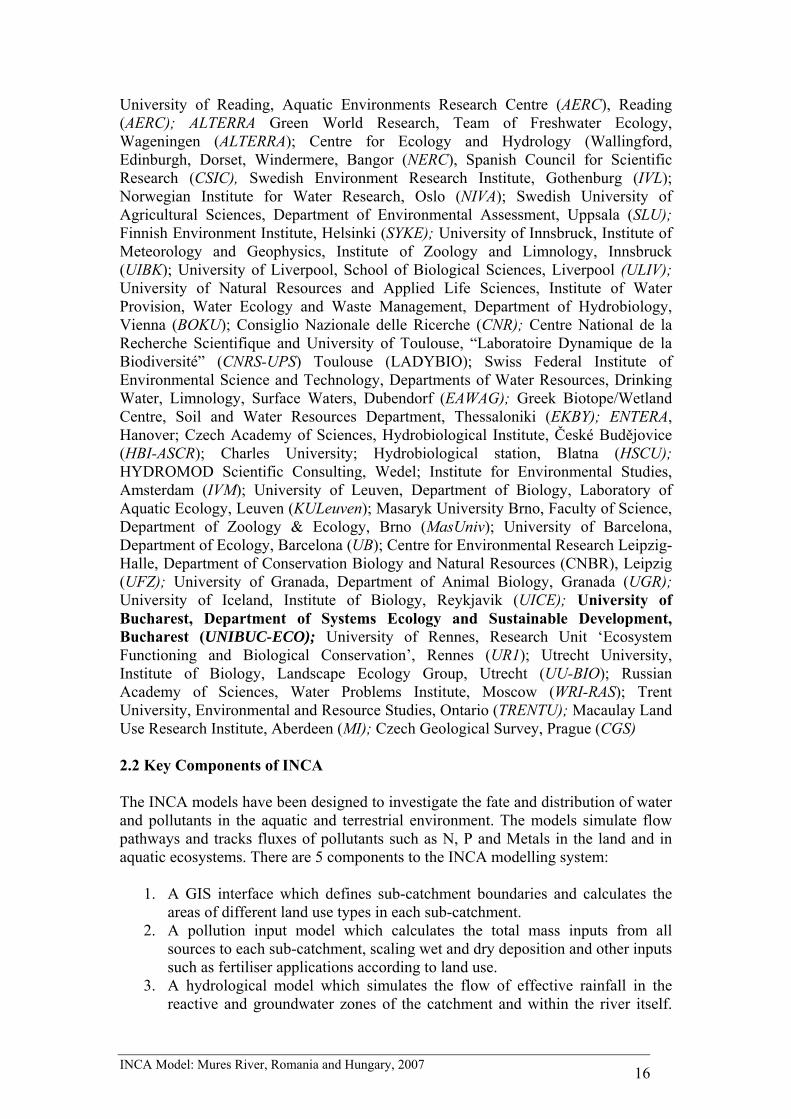
University of Reading, Aquatic Environments Research Centre (AERC), Reading (AERC); ALTERRA Green World Research, Team of Freshwater Ecology, Wageningen (ALTERRA); Centre for Ecology and Hydrology (Wallingford, Edinburgh, Dorset, Windermere, Bangor (NERC), Spanish Council for Scientific Research (CSIC), Swedish Environment Research Institute, Gothenburg (IVL); Norwegian Institute for Water Research, Oslo (NIVA); Swedish University of Agricultural Sciences, Department of Environmental Assessment, Uppsala (SLU); Finnish Environment Institute, Helsinki (SYKE); University of Innsbruck, Institute of Meteorology and Geophysics, Institute of Zoology and Limnology, Innsbruck (UIBK); University of Liverpool, School of Biological Sciences, Liverpool (ULIV); University of Natural Resources and Applied Life Sciences, Institute of Water Provision, Water Ecology and Waste Management, Department of Hydrobiology, Vienna (BOKU); Consiglio Nazionale delle Ricerche (CNR); Centre National de la Recherche Scientifique and University of Toulouse, “Laboratoire Dynamique de la Biodiversité” (CNRS-UPS) Toulouse (LADYBIO); Swiss Federal Institute of Environmental Science and Technology, Departments of Water Resources, Drinking Water, Limnology, Surface Waters, Dubendorf (EAWAG); Greek Biotope/Wetland Centre, Soil and Water Resources Department, Thessaloniki (EKBY); ENTERA, Hanover; Czech Academy of Sciences, Hydrobiological Institute, České Budějovice (HBI-ASCR); Charles University; Hydrobiological station, Blatna (HSCU); HYDROMOD Scientific Consulting, Wedel; Institute for Environmental Studies, Amsterdam (IVM); University of Leuven, Department of Biology, Laboratory of Aquatic Ecology, Leuven (KULeuven); Masaryk University Brno, Faculty of Science, Department of Zoology & Ecology, Brno (MasUniv); University of Barcelona, Department of Ecology, Barcelona (UB); Centre for Environmental Research Leipzig-Halle, Department of Conservation Biology and Natural Resources (CNBR), Leipzig (UFZ); University of Granada, Department of Animal Biology, Granada (UGR); University of Iceland, Institute of Biology, Reykjavik (UICE); University of Bucharest, Department of Systems Ecology and Sustainable Development, Bucharest (UNIBUC-ECO); University of Rennes, Research Unit ‘Ecosystem Functioning and Biological Conservation’, Rennes (UR1); Utrecht University, Institute of Biology, Landscape Ecology Group, Utrecht (UU-BIO); Russian Academy of Sciences, Water Problems Institute, Moscow (WRI-RAS); Trent University, Environmental and Resource Studies, Ontario (TRENTU); Macaulay Land Use Research Institute, Aberdeen (MI); Czech Geological Survey, Prague (CGS) 2.2 Key Components of INCA The INCA models have been designed to investigate the fate and distribution of water and pollutants in the aquatic and terrestrial environment. The models simulate flow pathways and tracks fluxes of pollutants such as N, P and Metals in the land and in aquatic ecosystems. There are 5 components to the INCA modelling system:
1. A GIS interface which defines sub-catchment boundaries and calculates the areas of different land use types in each sub-catchment.
2. A pollution input model which calculates the total mass inputs from all sources to each sub-catchment, scaling wet and dry deposition and other inputs such as fertiliser applications according to land use.
3. A hydrological model which simulates the flow of effective rainfall in the reactive and groundwater zones of the catchment and within the river itself.

INCA Model: Mures River, Romania and Hungary, 2007 17
This component of the model drives the pollutant fluxes through the catchment.
4. The catchment process models which simulate pollutant transformations in the soil and groundwater of the catchment.
5. The river pollution process model which simulates dilution and in-river transformations and losses. Outputs from each sub-catchment (component 4 above) provide the mass flux into the corresponding river reach and input to the river quality process model, as shown in Figure 2.1
The INCA stand alone software modelling package itself consists of components 3, 4 and 5 above. Components 1 and 2 represent pre-processing operations required to set up the parameter and data files for INCA. INCA has been designed to be easy to use and fast, with excellent output graphics. The menu system allows the user to specify the semi-distributed nature of a river basin or catchment, to alter reach lengths, rate coefficients, land use, velocity-flow relationships and to vary input pollutant deposition loads. INCA provides the following outputs:
• daily time series of flows, and water quality outputs, e.g. Metals, cyanide, nitrate-nitrogen and ammonium-nitrogen concentrations, at selected sites along the river;
• profiles of flow or water quality along the river at selected times; • cumulative frequency distributions of flow and water quality at selected sites; • table of statistics for all sites; • daily and annual water quality loads for all land uses and all processes. • 3D pictorial representations of flow and water quality • time series plots of the soil and groundwater responses • output times series for transfer to other analysis packages e.g. Excel • procedures for saving modified parameter sets • scenario simulation results presented graphically or as output files
2.3 The hydrological model The hydrological model provides information on the flow moving through the soil zone, the groundwater zone and the river system. Figure 2.4 shows the hydrological model as a simple two box system with hydrologically effective rainfall moving through the soil system and then either recharging the groundwater system or leaching into the river. The groundwater flows are also routed to the river reaches after a suitable delay controlled by a residence time.

INCA Model: Mures River, Romania and Hungary, 2007 18
Figure 2.4 -The structure of the cell model used to simulate the hydrological and N processes and transport mechanisms within the land component of INCA-N. The flow model for the two zones in the plant/soil system component of the INCA model is
Soil Zone dxdt T
U x1
11 1
1= −( ) (1)
Groundwater Zone )(1218
2
2 xxUTdt
dx−= (2)
where x1 and x2 are output flows (m3 s-1) for the two zones and U1 is the input driving hydrologically effective rainfall (HER). T1 and T2 are time constants associated with the zones and U8 is the baseflow index (i.e. proportion of water being transferred to the lower groundwater zone). The HER data can be obtained from data analysis using standard met data collected locally or nationally. Output from the soil and groundwater compartments are released into the stream and then routed along the river system, as shown in Figure 2.5.
Direct Runoff Flow
Groundwater Flow
Soil Flow
Surface Zone Soil Zone
G r o u Z n o d n w e a t e r
Effective Rainfall Input

INCA Model: Mures River, Romania and Hungary, 2007 19
Figure 2.5 Instream Processes and River reach structure
The river flow model is based on mass balance of low and uses a multi-reach description of the river system. Within each reach, flow variation is determined by a non-linear reservoir model. In hydrological flow routing terms the relationship between inflow, I, outflow, Q and storage, S, in each reach is represented by
dS tdt
I t Q t( ) ( ) ( )= − (3)
Where, S(t) = T(t)*Q(t), T is a travel time parameter, which can be expressed as
T t Lv T
( )( )
= (4)
L is the reach length and v, the mean flow velocity in the reach (m s-1), is related to discharge, Q through
)()( taQtv b= (5) Where, a and b are constants to be estimated from tracer experiments or theoretical considerations.

INCA Model: Mures River, Romania and Hungary, 2007 20
Whilst this model is relatively simple it is quite effective in simulating flows along rivers as shown in applications to the Bedford Ouse and a range of other river systems (Whitehead et al, 1979,1981). The equations are solved using a fourth order Runga Kutta method of solution with a Merson variable step length integration routine. This enables stable numerical integration of the equations and minimises numerical problems. The advantage of this scheme is that scientific effort can be directed to ensuring correct process formulation and interaction rather than numerical stability problems. The hydrological model uses the hydrologically effective rainfall (HER) shown in Figure 2.6 to drive the model and generate the flows from the soils and groundwater system. The residence times in the model controls the recession behaviour of the catchment and the area of the sub- catchments scale up the flows to give the full catchment flow. A typical model simulation for the River Twyi is given in Figure 2.7, and shows a very good fit. This fairly typical of the model hydrological simulation and other results are given in the following sections and in the reference list below.
Figure 2.6 1992 Input Hydrological data for River Tywi in South Wales
Figure 2.7 River Tywi Observed and Simulated flows at Ffinnant over 1992

INCA Model: Mures River, Romania and Hungary, 2007 21
2.4 INCA-N: The Nitrogen and Ammonium Model The hydrological model provides information on the flow moving through the soil zone, the groundwater zone and the river system. Simultaneously, whilst solving the flow equations, it is possible to solve the mass balance equations for both nitrate-nitrogen and ammonium-nitrogen in both the soil and groundwater zones. The key processes that require modelling in the soil zone, as shown in Figure 2.8, are plant uptake for NH4-N and NO3-N, ammonia nitrification, denitrification of NO3-N, ammonia mineralisation, ammonia immobilisation and N fixation. All of these processes will vary from land use to land use and a generalised set of equations is required for which parameter sets can be derived for different land uses. The land phase model must also account for all the inputs affecting each land use including dry and wet deposition of NH4-N and NO3-N and fertiliser addition for both NH4-N and NO3-N (e.g. as ammonium nitrate). Also, temperature and soil moisture will control certain processes so that, for example, nitrification reaction kinetics are temperature dependent and denitrification and mineralisation are both temperature and soil moisture-dependent.
Figure 2.8 The key inputs outputs and processes in the nitrogen component In the groundwater zone it is assumed that no biochemical reactions occur and that there is mass balance for NH4-N and NO3-N. The equations used in INCA are as follows:
NITRATE-N
Soil Zone 2351563733131
3 )(1 CxUCxCxUCxxUVdt
dx+−+−−= (6)

INCA Model: Mures River, Romania and Hungary, 2007 22
Groundwater )(142813
2
4 xxUxxVdt
dx−= (7)
AMMONIUM-N
Soil Zone 58675657105141
5 )(1 xCUCxCxUCxxUVdt
dx++−−−= (8)
Groundwater )(162815
2
6 xxUxxVdt
dx−= (9)
Where x3 and x4 are the daily NO3-N concentrations (mg/l) in the soil zone and groundwater zone respectively and x5 and x6 are the daily NH4-N concentrations, (mg/l), in the soil zone and groundwater zone respectively. U8 is the baseflow index and C3, C6, C1, C2, C10, C7, C8 are rate coefficients (per day) for respectively, plant uptake of nitrate, ammonia nitrification, nitrate denitrification, nitrate fixation, plant uptake of ammonia, ammonia mineralisation and ammonia immobilisation. U3 and U4 are the daily nitrate-nitrogen and ammonium-nitrogen loads entering the soil zone and constitute the additional dry and wet deposition and agricultural inputs (e.g. fertiliser addition). All rate coefficients are temperature dependent using the equation:
)20(047.1 −= snn CC θ (10)
Where θs is soil temperature estimated from a seasonal relationship dependent on air temperature as follows
⎟⎠⎞
⎜⎝⎛+=
365.
23sin16
nodayCeTemperaturAireTemperaturSoil π (11)
Where C16 is the maximum temperature, (oC), difference between summer and winter conditions. U7 is a seasonal plant growth index where:
[ ]
⎟⎠⎞
⎜⎝⎛ −
+=365
.2sin34.066.0 117
CnodayU π (12)
Where C11 is the day number associated with the start of the growing season, U5 is a soil moisture threshold below which denitrification will not occur. Denitrification generally will only be significant when soil moisture levels are high. Similarly U6 is a soil moisture control for mineralisation which permits mineralisation when soil water content is above a threshold level.

INCA Model: Mures River, Romania and Hungary, 2007 23
Nitrogen process equation: river system In the river, the key processes are denitrification of NO3-N, nitrification of NH4-N and mass balance. The reach mass balance need to include the upstream NO3-N and NH4-N together with inputs from both the soil zone and groundwater zone as well as direct effluent discharges, as shown in Figure 2.5. The equations for the NO3-N and NH4-N river reaches are then:
Nitrate 914817879103
8 )(1 xCxCxxUUVdt
dx+−−= (13)
Ammonium 9314979113
9 )(1 xUCxxUUVdt
dx−−= (14)
where U9 is the upstream flow (m3/S), U10 is the upstream NO3-N (mg/l) and U11 is the upstream NH4-N (mg/l) T3 is the reach time constant (or residence time) which varies from day to day, x7 is the estimated downstream flow rate (m3/S) and x8 and x9 are the downstream (i.e. reach output) concentrations of nitrate and ammonia, respectively and C17 and C18 are temperature-dependent rate parameters for denitrification and nitrification respectively. Temperature effects are introduced related to river water temperature σ as follows: C8 = C81.047(σ
-20) (15)
Whilst these equations are quite complex the numerical solution is extremely fast so that model runs typically take just a few seconds.

INCA Model: Mures River, Romania and Hungary, 2007 24
3 APPLICATION OF INCA-N TO THE ROŞIA MONTANĂ CATCHMENTS AND THE ABRUD-ARIES-MURES RIVER SYSTEM The upper catchments at Roşia Montană consist of four separate catchments, namely Roşia, Corna, Saliste and Abruzel, as shown in Figure 3.1. The areas of the four catchments are 14.56, 9.93, 4.53 and 13.76 km 2 respectively and the river lengths are approximately 8, 5, 4 and 7 km, respectively. The chemistry varies significantly in the catchments, as shown in Table 3.1, as they are affected to different degrees by the historical mining activities. Also, the borehole chemistry and the mine adit chemistry, shown in Table 3.2, indicate the very high levels of current pollution from ARD that occurs throughout the historic mining areas. Prior to any water quality modelling, it is necessary to establish the hydrological water balance for the catchments, making use of the rainfall and meteorological data for the area.
Figure 3.1: The Sub-catchments to Roşia Montană

INCA Model: Mures River, Romania and Hungary, 2007 25
SiteID Saliste Stream S007 Abruzel Stream S002 No of samples 15 15
Type MIN MAX AVERAGE MIN MAX AVERAGE NO3 (as N)_mg/l 0.02 36.20 8.31 0.05 1.18 0.64
AsD_µg/l 0.00 90.00 14.18 0.00 22.10 5.94CdT_µg/l 0.00 15.70 4.41 1.29 73.20 19.04CdD_µg/l 0.00 14.80 3.89 0.00 68.40 17.58CuT_µg/l 1.80 161.90 40.23 98.00 3175.70 835.19CuD_µg/l 0.00 59.40 13.68 65.30 3062.60 697.51PbT_µg/l 0.00 5.70 1.05 0.00 6.40 1.06PbD_µg/l 0.00 4.25 0.70 0.00 5.30 0.70ZnT_µg/l 58.20 3258.60 780.33 45.50 3763.50 766.29ZnD_µg/l 20.40 2830.70 616.64 42.60 3353.00 733.51ZnD_meql 0.00 0.09 0.02 0.00 0.10 0.02CrT_µg/l 5.95 691.40 70.55 3.50 278.17 44.56Mn_mg/l 1.11 985.00 80.27 0.01 1121.00 77.25Mn_meql 0.04 1.82 0.53 0.00 0.23 0.09Hg_µg/l 0.00 0.00 0.00 0.00 0.00 0.00
Site ID Rosia S010 Corna S004 No. Of Samples 15 15
Type MIN MAX Average MIN MAX Average NO3 (as N)_mg/l 0.37 10.24 2.43 0.21 2.31 0.72
AsD_µg/l 2.15 46.90 13.28 0.42 63.40 8.68CdT_µg/l 1.90 432.00 59.62 0.00 20.40 3.47CdD_µg/l 1.70 378.00 51.63 0.00 12.70 2.52CuT_µg/l 134.00 1216.00 472.55 3.90 1020.00 120.44CuD_µg/l 44.30 933.00 343.91 2.10 992.00 72.64PbT_µg/l 0.00 16.80 2.39 0.00 12.10 2.23PbD_µg/l 0.00 14.20 1,82 0.00 3.80 1.07ZnT_µg/l 138.00 14825.00 5332.71 11.20 463.00 146.53ZnD_µg/l 142.00 9243.00 3730.09 4.50 439.00 76.65
ZnD_meq/l 0.00 0.28 0.11 0.00 0.01 0.00CrT_µg/l 4.20 1438.00 155.69 0.00 46.40 12.32Mn_mg/l 12.38 90.00 40.46 0.03 8.74 2.33Mn_meql 0.45 3.28 1.47 0.00 0.32 0.08Hg_µg/l 0.00 0.16 0.05 0.00 0.00 0.00
Table 3.1: Chemistry Data for the Four Upper Catchments

INCA Model: Mures River, Romania and Hungary, 2007 26
SiteID Roşia Mine Adit R085 Roşia Borehole R087 No of samples 15 15
Type MIN MAX AVERAGE MIN MAX AVERAGE NO3( as N) mg/l 0.084 43.56 4.12 0.18 4.32 0.95
AsD_µg/l 0.000 1738.000 361.184 0.00 32.60 5.94CdT_µg/l 26.400 875.000 331.093 0.00 5.80 1.94CdD_µg/l 26.800 814.000 294.627 0.00 4.40 1.03CuT_µg/l 366.0 12370.0 3361.5 5.000 315.600 77.461CuD_µg/l 304.00 4705.00 2320.45 0.000 135.000 35.721PbT_µg/l 2.50 266.00 59.01 0.00 83.00 19.35PbD_µg/l 1.800 246.000 50.371 0.00 78.30 14.70ZnT_µg/l 1672.40 169313.00 52288.57 14.6 405.0 119.1ZnD_µg/l 1552.00 151230.00 44174.92 3.60 103.60 33.75
ZnD_meq/l 0.047 4.628 1.352 0.000 0.003 0.001CrT_µg/l 52.00 14650 2387.84 7.60 878.81 129.04Mn_mg/l 18.52 77200 5381.40 0.051 5394 361.862Mn_meql 0.67 17.31 8.73 0.002 0.624 0.095Hg_µg/l 0.000 0.310 0.106 0.000 0.100 0.012
SiteID
Corna Mine Adit C122 Corna Borehole C166
No of samples 15 15 Type MIN MAX AVERAGE MIN MAX AVERAGE
AsD_µg/l 0.00 651.80 57.91 2.00 15.10 5.16CdT_µg/l 0.00 54.30 17.61 0.00 15.40 4.87CdD_µg/l 0.00 44.50 12.21 0.00 10.40 3.15CuT_µg/l 1.60 194.10 68.74 1.20 109.00 17.29CuD_µg/l 2.80 149.00 55.72 0.00 27.00 5.85PbT_µg/l 4.40 51.10 14.87 0.00 67.20 16.45PbD_µg/l 0.00 36 8.94 0.00 49.60 8.21ZnT_µg/l 28.40 12590 4316.13 6.80 422.90 109.42ZnD_µg/l 7.00 10380 3637.39 6.00 431.00 62.09
ZnD_meq/l 0.0002 0.3176 0.1113 0.0002 0.0132 0.0019CrT_µg/l 3.50 2964.25 379.02 0.90 588.15 57.01Mn_mg/l 0.02 603000 40441.94 0.02 9600 647.08Mn_meql 0.001 26.392 10.272 0.001 1.158 0.281Hg_µg/l 0.00000 0.14000 0.02540 0.00000 0.16500 0.03707
Table 3.2: Chemistry Data of Selected Boreholes and Mine Adits

INCA Model: Mures River, Romania and Hungary, 2007 27
3.1 Hydrological data analysis The input data required by the INCA-N model are daily actual precipitation (mm day-
1), hydrologically effective rainfall (mm day-1), soil moisture deficit (mm) and air temperature (oC) data. Observed flow data are used to compare the model predictions with reality to assess model performance. The model was applied in four catchments: Abruzel (AW01), Corna (CW01), Roşia (RW01) and Saliste (SW01). The applications were based on the following data. • daily precipitation, minimum and maximum air temperature, sunshine hours and
actual evaporation data from the project meteorological station in the Roşia Valley (Table 3.3);
• daily precipitation data from the Rotunda Peak, Câmpeni and Abrud meteorological stations (Table 3.3)
• fifteen minute flow data from four gauges, one in each study catchment (Table 3.4)
• estimates of the catchment areas and length of the main channels (Table 3.5).
Start End Frequency Project Meteorological Station
Precipitation 22/03/2001 20/07/2006 event Minimum and Maximum Temperature
23/08/2001 30/06/2006 daily
Sunshine hours 20/03/2001 30/06/2006 daily Actual evaporation
01/04/2001 30/6/2006 daily
Rotunda Peak Precipitation 01/01/2000 31/12/2005 daily Câmpeni Precipitation 01/01/1999 31/12/2005 daily Abrud Precipitation 01/01/1978 31/12/1999 daily
Table 3.3: A summary of the meteorological data provided for the application of INCA-N to four sites on the Roşia Montană.
Start End Frequency Abruzel 12/06/2001 31/06/2006 15 minute Corna 13/04/2001 31/06/2006 15 minute Roşia 03/04/2001 31/06/2006 15 minute Saliste 19/03/2001 25/08/2004 15 minute
Table 3.4: A summary of the flow data provided for the application of INCA-N to four sites on the Roşia Montană.

INCA Model: Mures River, Romania and Hungary, 2007 28
Catchment Area (km2)
Reach Length (m)
Abruzel 13.76 7000 Corna 9.93 5000 Roşia 14.56 8000 Saliste 4.53 4000
Table 3.5 - A summary of the catchment characteristics provided for the application of INCA-N to four sites on the Roşia Montană. The estimates of hydrologically effective rainfall and soil moisture deficit at the Project Meteorological Station were calculated as follows: • potential evapotranspiration was estimated using the method of Thornthwaite
(1948) based on mean air temperature and day length, the latter dependent on latitude; and
• actual evaporation, HER and SMD were calculated using equations based on
those given in Bernal et al. (2004) using estimated potential and actual evapotranspiration.
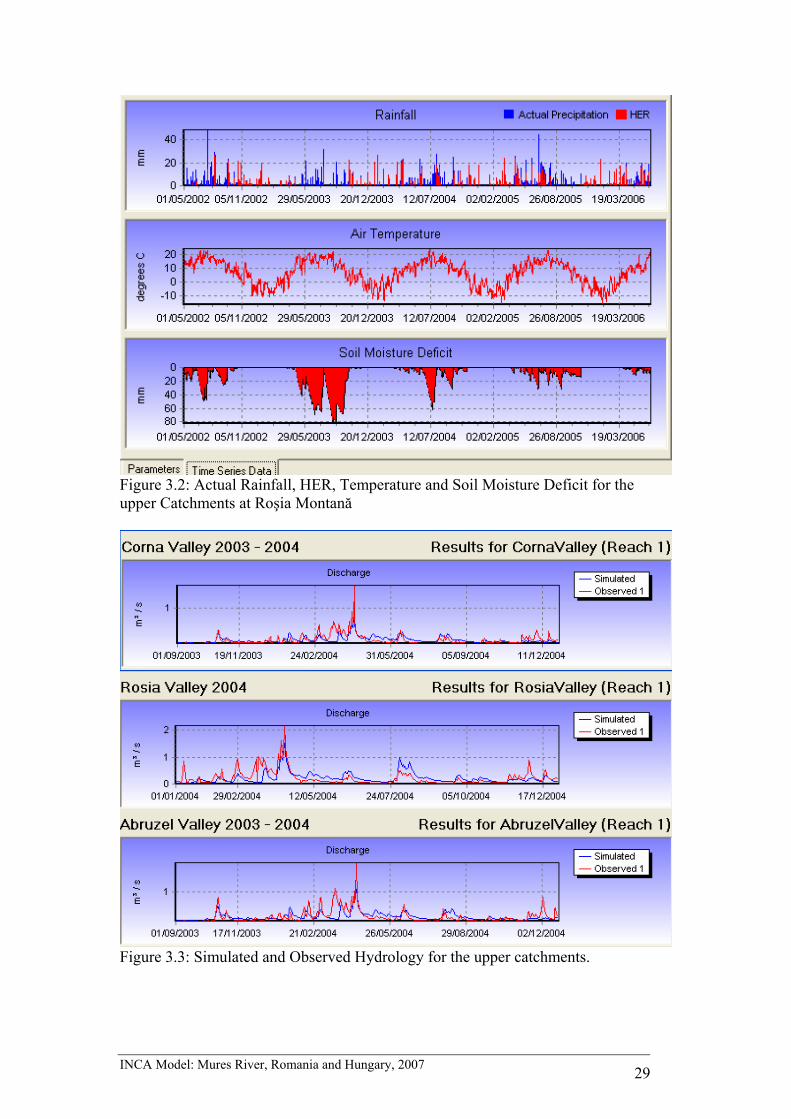
The detailed methods of Thornthwaite and Bernal are given in Appendix 1. Figure 3.2 shows the results using the above techniques to produce the input data for INCA. Here the daily actual and hydrologically effective rainfalls are plotted together with the temperature and the soil moisture deficit for a period of five years from May 2002. Figure 3.3 shows the hydrological simulation for three of the catchments that give a good fit to the observed data and a good representation of the catchment response are obtained6. Thus the simulated flows in the figure represent an estimate of the natural hydrograph.
6 The Saliste catchment, shown in Figure 3.4, is less accurate with a generally poor fit. This is because the Saliste Valley has an active tailings dam in it so water is being pumped in from outside the catchment, so the flow levels in the weir will not reflect rainfall.
INCA Model: Mures River, Romania and Hungary, 2007 29
Figure 3.2: Actual Rainfall, HER, Temperature and Soil Moisture Deficit for the upper Catchments at Roşia Montană
Figure 3.3: Simulated and Observed Hydrology for the upper catchments.

INCA Model: Mures River, Romania and Hungary, 2007 30
Figure 3.4: Simulated and observed hydrology for the Saliste Valley 3.2 Modelling Nitrate-N and Ammonium in the Upper Catchments The model has also been set up to simulate nitrate–nitrogen and ammonia in the catchments. The set up for the nitrogen and ammonium model assumes knowledge of groundwater chemistry and rate coefficients for a range of processes such as nitrification and denitrification. Whilst the chemistry data is available for boreholes and streams, as shown in Tables 3.1 and 3.2, there is little information on the process rate coefficients. However, from the INCA projects and previous modelling there is considerable knowledge on the typical process rates to use in such catchments and these rates have been selected on the basis of previous experience (Whitehead et al, 1998). A typical simulation for the Corna catchment is shown in Figure 3.5 over 2002-2006 and as shown the simulated nitrogen is generally low as might be expected for a remote mountain catchment away from centre of nitrogen pollution. Figure 3.6 shows the simulation results presented in a statistical form for the Corna catchment over the period and the mean value of the nitrate chemistry is 0.88 mg/l compared well with the actual measured value of 0.72 mg/l. Ammonia levels are low reflecting the low ammonia inputs form the atmosphere and well as the limited ammonia from agriculture and the nitrification processes that are occurring in the soils and the stream waters. Figures 3.7 and 3.8 show the Roşia catchment simulation for 2002-2006 and consistent nitrate and ammonia patterns are observed, again with generally low concentrations.
Figure 3.5: Simulations of Nitrate-N and Ammonium for Corna Catchment

INCA Model: Mures River, Romania and Hungary, 2007 31
Figure 3.6: Statistical Analysis of the Corna Catchment Over 2002-2006
Figure 3.7: Roşia Simulation Over 2002-2006

INCA Model: Mures River, Romania and Hungary, 2007 32
Figure 3.8: Statistical Output From INCA for the Roşia Catchment Simulation 3.3 Modelling the Abrud-Aries-Mures River system The next stage of the INCA-N modelling is to scale the model up to the full catchment in order to simulate the river system from Roşia Montană down the Abrud and Aries River system to Turda, and then on down the Mures River system as far as the Hungarian border at Nadlac. Figure 1.2 shows the catchment of the Mures River System and indicates the upper reach town of Câmpeni that lies just downstream of Roşia Montană. Figures 3.9 and 3.10 show the land use and elevation of the catchment. The land use is primarily forest and grassland in the upper reaches although there is arable farming in the lower reaches of the Mures River System. Table 3.6 gives a list of the key hydrometric stations on the river system and also the distances down the rivers and the catchment areas. This information has been used to set up the reach structure for the INCA model, as shown in Table 3.7. Here the reach boundary is given as well as the reach length and the associated catchment area for the reach, namely the area that drains into that particular section of the river system. Also, included in the table are the a and b parameters for the rivers. These parameters are required to calculate the travel times along the river using equation 5 above. The a and b parameters have been obtained using the Manning’s equation nRSv /67.05.0= (16) Where v is the water velocity m/sec, S is the slope, R the hydraulic Radius and n is the Manning friction factor. For wide shallow river systems the R is effectively the local flow depth according to Beven (2000) and n can be obtained from field investigations. The USGS have published values of n for a range of rivers (see http://wwwrcamnl.wr.usgs.gov/sws/fieldmethods/Indirects/nvalues/index.htm) and values for the Aries and Mures rivers are estimated as 0.043 and 0.033 respectively. The

INCA Model: Mures River, Romania and Hungary, 2007 33
slopes for the rivers are available from Table 3.6 and thus by estimating the average depth or hydraulic radius for the rivers, mean velocities can be estimated. Using this procedure the a and b values have been estimated for the rivers, as shown in Table 3.7. These are used in the INCA model to calculate the stream velocity on a daily basis. The model has been set up for all the reaches shown in Table 3.7 and a set of simulations performed using the 2002-2006 data to simulate flow, nitrate and ammonium for the river system.
Figure 3.9: Land use in the Mures River System

INCA Model: Mures River, Romania and Hungary, 2007 34
Figure 3.10 Elevations in the Mures River System
Coordinates Reach Number River Hydrometric
Station Start Date
Latit. Longit. Altitude(m) Catchment
Area (km2)
1 Mures Suseni 1949 46.39.00 25.33.00 987 160 2 Mures Toplitta 1986 46.55.00 25.22.00 935 1071 3 Mures Stanceni 1949 46.58.00 25.11.00 967 1532 4 Mures Galaoaia 1982 46.58.00 24.55.00 988 2135 5 Mures Glodeni 1956 46.38.00 24.36.00 849 3781 6 Mures Ludus 1987 46.28.00 24.07.00 670 6640 7 Mures Ocna Mures 1901 46.23.00 23.52.00 703 9961 8 Mures Alba Iulia 1870 46.04.00 23.35.00 625 18055 9 Mures Acmariu 1977 45.56.00 23.55.00 635 19737
10 Mures Gelmar 1978 45.54.00 23.13.00 640 20260 11 Mures Branisca 1870 46.56.00 22.46.00 654 24501 12 Mures Savarsin 1883 46.00.00 22.13.00 643 25707 13 Mures Radna 1853 46.05.00 21.41.00 627 26760 14 Mures Arad 1861 46.10.00 21.19.00 618 27280 15 Mures Nadlac 1960 46.08.00 20.40.00 607 27850 27 Aries Scarisoara 1951 46.27.00 22.52.00 1126 203 28 Aries Albac 1989 46.28.00 22.57.00 1092 330 29 Aries Câmpeni 1951 46.22.00 23.01.00 1020 637 30 Aries Baia de Aries 1899 46.25.00 23.17.00 965 1189 31 Aries Buru 1973 46.30.00 23.36.00 948 2000 32 Aries Turda 1899 46.35.00 23.47.00 897 2403 33 Albac Albac 1978 46.28.00 22.00.00 1110 94 36 Abrud Abrud 1962 46.17.00 23.60.00 861 108 37 Abrud Câmpeni 1978 46.21.00 23.39.00 840 222
Table 3.6 The Mures, Aries and Abrud River Reach Characteristics

INCA Model: Mures River, Romania and Hungary, 2007 35
Reach Number Reach Name
Catchment Area km2 Reach Length m a b
1 Source 91 11000 0.1 0.672 Corna 10 3000 0.1 0.673 Abrud 5 1500 0.1 0.674 Saliste 73 1500 0.1 0.675 Roşia 20 7000 0.1 0.676 Abrud joins Aries 625 4000 0.1 0.677 Lupsa 220 13500 0.1 0.678 Baia de Aries 332 13000 0.1 0.679 Salciua 200 14000 0.1 0.67
10 Buru 611 28000 0.1 0.6711 Turda 403 20000 0.1 0.6712 CampiaTurzil 200 11000 0.1 0.6713 Luncani 6640 13500 0.04 0.6714 Ocna Mures 400 22000 0.04 0.6715 Aiud 500 33000 0.04 0.6716 Teius 7194 29000 0.04 0.6717 Alba Iulia 400 30000 0.04 0.6718 Aemariu 1680 26000 0.04 0.6719 Orastie 510 25000 0.04 0.6720 Gelmar 2000 21000 0.04 0.6721 Deva 600 28000 0.04 0.6722 Branisca 640 27000 0.04 0.6723 Zam 600 40000 0.04 0.6724 Savirsin 600 32000 0.04 0.6725 Radna 1053 76000 0.04 0.6726 Arad 520 39000 0.04 0.6727 Nadlac 570 36000 0.04 0.67
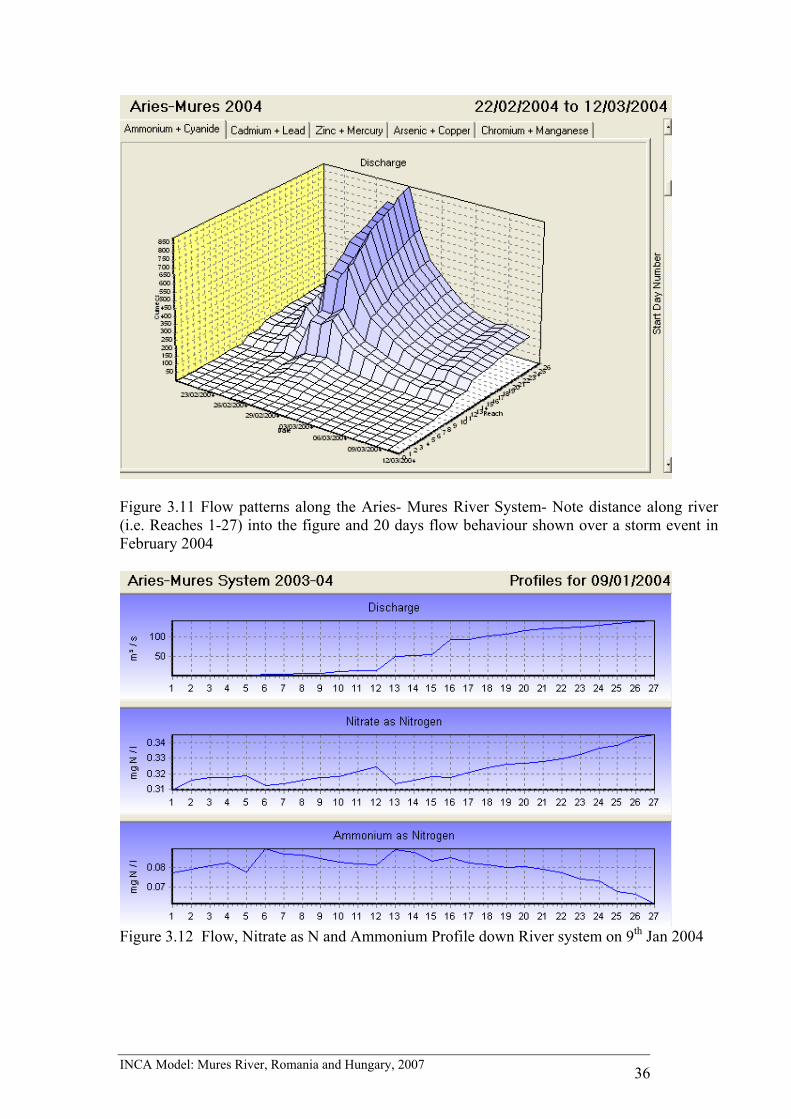
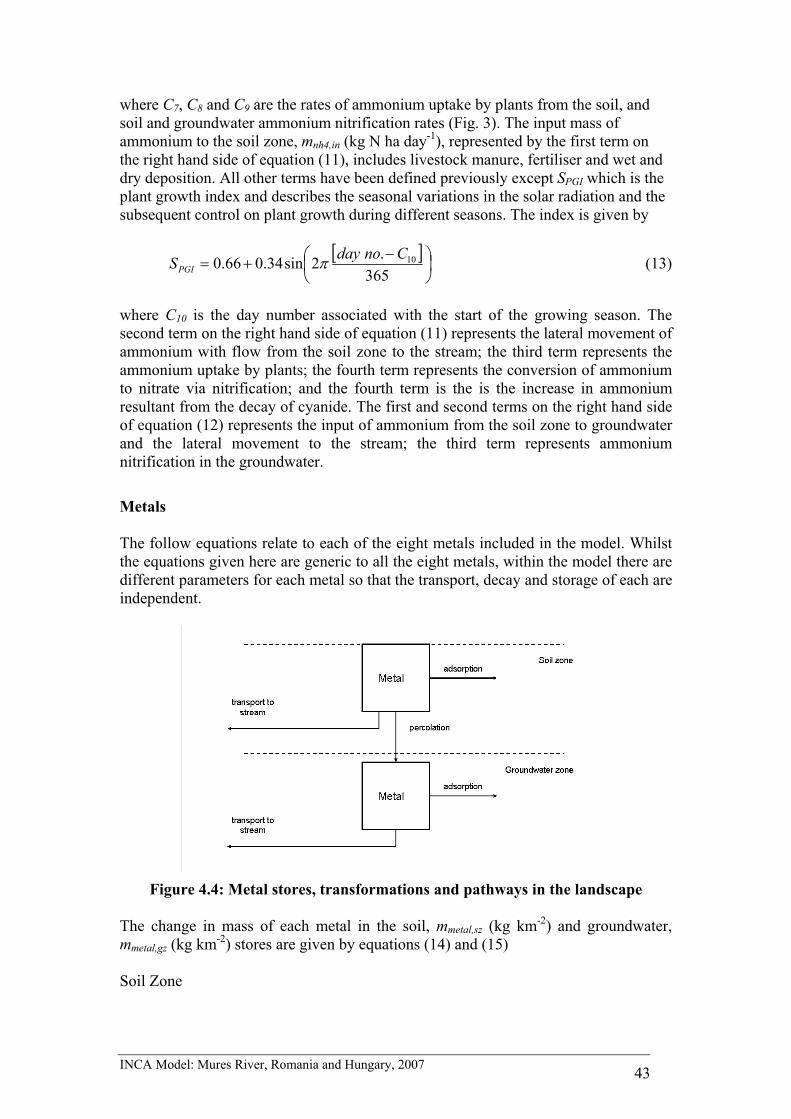
Table 3.7 The INCA Reach Structure from the Abrud Source down to Nadlac The model simulations over the period 2002 -2006 can be presented in a number of ways as illustrated for the upper catchment results. Figure 3.11 shows the flow patterns over a summer storm event and illustrate the large build up in flow down the river system. This is to be expected because of the very large increase in catchment area as the Aries River joins the Mures River and as major tributaries join the river system downstream. This large increase in flow regime is of great advantage to the Roşia Montană restoration and pollution control strategies as it means that dilution of pollutants will be significant. The rise in flows is reflected in Figure 3.12 which shows a profile down the river system on a particular day. Again flow builds up down the reaches and there is a varying pattern with Nitrate-N and ammonium, with nitrate building up as nitrate rich water joins the river and with ammonium decreasing as natural nitrification processes reduce the concentrations.
INCA Model: Mures River, Romania and Hungary, 2007 36
Figure 3.11 Flow patterns along the Aries- Mures River System- Note distance along river (i.e. Reaches 1-27) into the figure and 20 days flow behaviour shown over a storm event in February 2004
Figure 3.12 Flow, Nitrate as N and Ammonium Profile down River system on 9th Jan 2004

INCA Model: Mures River, Romania and Hungary, 2007 37
4 A NEW INCA MODEL FOR CYANIDE AND METALS 4.1 Brief Review of Modelling Metals and Processes Modelling metals in the natural environment always appears difficult because of the complexity of the chemistry involved and the lack of knowledge concerning metal behaviour. The impacts of ARD on rivers has been modelled previously by Whitehead and Jeffrey (1995) and detailed catchment based process based models of ARD processes have been developed for upland soil and rock systems (Cosby et al, 1985a and b). In addition, conceptual models have developed for predicting iron retention and cycling in river and wetland ecosystems receiving ARD (Mitsch et al, 1981, 1983, Fennessy and Mitsch 1989a and b). Flanagan et al (1994) developed a more comprehensive model predicting iron, manganese, aluminium and sulphate retention in a remediation site in Ohio, USA. This model was then evaluated once a wetland had been built to assess restoration strategies to control ARD (Mitsch and Wise, 1998). However, the conventional way of predicting metal transformations in groundwater or rock bound systems is to utilise thermodynamic equations that simulate the phase transitions of the metals (Pourbaix, 1974). However, in a major ARD study in the UK ( Science of the Total Environment, Special Issue, 2005), it was shown that metal transformation processes in freshwater systems are often controlled by kinetic and microbiological processes (Hall et al, 2005, Johnson and Hallberg, 2005). This provides an alternative method of describing metal transformations in flowing streams and rivers which are generally aerobic and not in a steady state condition such as a groundwater system. Similarly, in the case of cyanide, the chemistry is considered complex when in a pond situation, as indicated by Mudder et al, 2001 (also see www.cyantists.com). However, Simovic et al, 1984 and Botz and Mudder, 2001, have shown that the dominant volatilization and degradation processes can be represented by first order kinetics. In rivers systems, where there is significant turbulence and mixing, these two key processes also control cyanide losses and can be represented by first order kinetics dependant on temperature, concentration and river residence time. This kinetic approach to modelling metals and pollutants has been used successfully in the Wheal Jane Mine study by Whitehead et al, 2005, and this is the approach adopted for the modelling of the metals and cyanide in the current study. 4.2 New model structure and equations INCA-Mine is a mass-balance dynamic model that estimates the daily fluxes and concentrations of cyanide, ammonium and eight metals in rivers. The eight metals are cadmium, lead, zinc, mercury, arsenic, copper, chromium, manganese. These estimates are made by calculating contributions from various inputs and transformations. The key processes and stores assumed in the landscape and within the river are shown in Figs. 4.1 to 4.5.

INCA Model: Mures River, Romania and Hungary, 2007 38
Figure 4.1: Overview of the INCA-Mine model structure
The equations for INCA-Mine are based on those written for the Integrated Catchment model of Nitrogen (INCA-N; Whitehead et al., 1998; Wade et al., 2002) but have been adapted to describe the metal adsorption to sediment, cyanide decay to ammonium and cyanide volatilization. The inputs and outputs are differentiated by landscape type and varied according to the environmental conditions: soil moisture and temperature. The model accounts for stocks of ammonium, cyanide and the eight metals in the soil and groundwater zones, and in the stream reaches. The model also simulates the flow of water through the soil and groundwater zones from different soil and land use types to deliver mass to the river. This mass is then routed downstream after accounting for: direct inputs from point sources; abstractions; within river precipitation and sedimentation of metals; nitrification; and cyanide decay and volatilization. Point sources such as discharges from mine adits, waste dumps or TMFs can be routed into any of the sub catchments or reaches of the model.
The philosophy of the INCA-Mine model is to provide a process-based representation of the factors and processes controlling cyanide, ammonium and metal dynamics in both the landscape and within river components of a catchment, whilst minimising data requirements and model structural complexity. INCA-Mine produces daily estimates of discharge and river cyanide, ammonium and metal concentrations and fluxes along the main river channel. The model is semi-distributed so that spatial variations in land use and management and soil properties can be taken into account, though the hydrological connectivity of different land use and soil patches is not modelled in the same manner as a fully-distributed model. Rather the hydrological

INCA Model: Mures River, Romania and Hungary, 2007 39
and mass fluxes from different land use and soil classes and sub-catchment boundaries are modelled simultaneously and information fed sequentially into a multi-reach river model. The numerical method for solving the equations is based on a fourth order Runge-Kutta technique since this allows the simultaneous solution of the model equations and ensures that no single process takes precedence over another. The solver is fast. Typically the model runs for each of the four river systems in less than 5 seconds on a computer with 512 Mbytes of RAM and a 1 GHz processor. The equations are described in the following three sections and the input variables and constants are described in Table 4.1, and the calculated variables are given Table 4.2.
The landscape mass balances of water, cyanide, ammonium and the eight metals are based on a 1 km2 cell (Fig. 4.1). The inputs to the model can vary on a sub-catchment basis and according to soil or land-use type. In addition the model constants can also vary by soil and land use type which allows. These two factors allow the mass stored, process rates, hydrological pathways to vary spatially based on preconceived notions of variations in soil moisture, temperature, adsorption potential and land management. The water volumes and the mass of cyanide, ammonium and the eight metals are summed based on the relative amounts of each land use or soil type within a sub-catchment and the output passed to the instream routing model (Fig. 4.1).
The simulation of water flow and storage in the landscape
Figure 4.2: Hydrological stores and pathways in the landscape
There are two stores: the soil and groundwater zones (Fig. 4.2). The flow of water through the two zones is given by the following two equations:
Soil Zone
sz
szeffsz
Tqp
dtdq −
= (1)
Groundwater Zone
gz
zszgz
Tqq
dtdq −
=β (2)

INCA Model: Mures River, Romania and Hungary, 2007 40
where qsz and qgz are the outflows from the soil and groundwater zones (m3 s-1 km-2); Peff is the hydrologically effective rainfall (m3 s-1 km-2); β is the base flow index (Ø); and Tsz and Tgz are the response times associated soil and groundwater zones (days).
Within the soil zone it is assumed the water can be partitioned into two volumes: drainage and retention. The drainage volume represents the water stored in the soil that responds rapidly to water inflow and drains under gravity; it may be thought of as macropore or drain flow: the flow that most strongly influences the rising hydrograph limb. The soil zone retention volume represents the water stored retained in the soil after gravity drainage; it responds more slowly than the drainage water and represents the majority of water in the soil.
The initial value of the soil zone drainage volume (VD, m3 km-2) is calculated from a user-supplied initial soil zone flow (qsz,initial, m3 km-2) and the soil water response time:
86400..,, szinitialszinitialD TqV = (3)
where VD,initial is the initial soil water drainage volume (m3 km-2), qsz, initial is the user-supplied initial soil water flow rate (m3 s-1) and Tsz is the user-supplied soil water time constant (days).
The initial value of the soil zone retention volume (VR, m3 km-2) is calculated from the supplied soil moisture deficit time-series (SMD, mm), an estimate of the maximum soil moisture deficit (SMDmax, mm) and a parameter which describes the linear relationship between the soil moisture deficit and the soil zone retention volume, C1. The value of this parameter represents the ratio of the total water in the retention volume relative to the easily available water, namely that about the wilting point. The value of the parameter is derived through calibration and typically takes a value of 1 to 3. The value of SMDinitial is estimated from the soil moisture deficit on day one of the simulation.
( )1000max1, initialinitialR SMDSMDCV −= (4)
The groundwater initial volume (Vgw, m3 km-2) is estimated from the maximum size of the store and the proportion of pore space filled with water at the start of the model run:
62,, 10..CdV gweffinitialgw = (5)
Where Vgw, initial is the initial groundwater volume (m3 km-2), deff,gw is the user-supplied maximum groundwater effective depth (m, active depth x effective porosity) and C2 is the user-supplied proportion of filled pore-space (Ø). Given the complexity of the geology in most model applications, there is no attempt to separate the groundwater into specific yield and retention components; the former which is the water able to drain from the rock under gravity and the latter which is the water retained against the pull of gravity. The soil zone drainage and retention volumes and the groundwater zone volume are recalculated at each time step to account for the changes in input and output.

INCA Model: Mures River, Romania and Hungary, 2007 41
The simulation of the transport, storage and transformations of cyanide, ammonium and metals in the landscape
Figure 4.3: Cyanide and Ammonium stores, transformations and pathways in
the landscape The change in cyanide mass in the soil, mcn,sz (kg CN km-2) and groundwater, mcn,gz (kg CN km-2) stores are given by equations (6) and (7) Soil Zone
RD
szcnSMD
RD
szcnSMD
RD
szszcnszcn
VVmSC
VVmSC
VVqm
dtdm
+−
+−
+−
=6
,46
,3,, 101086400 (6)
Groundwater Zone
gw
gzcn
gw
gzgzcn
gw
szgzcngzcn
VmC
Vqm
Vqm
dtdm 6
,5,,, 108640086400−−=
β (7)
where C3, C4 and C5 are the rates of cyanide volatilisation, and soil and groundwater zone conversion of cyanide to ammonium (Fig.4.3). All other terms have been defined previously except SSMD which is the soil moisture factor and describes the linear dependency of the rate of the soil zone processes on the soil moisture. It is assumed that there are no diffuse inputs of cyanide to the catchment. The first term on the right hand side of equation (6) represents the lateral transport of cyanide with the soil water to the stream; the second term represents cyanide volatilisation; and the third term represents the decay of cyanide to ammonium. The first and second terms in equation (7) represent the flux of cyanide into the groundwater from the soil zone and the lateral flow of cyanide with the groundwater into the stream; the third term

INCA Model: Mures River, Romania and Hungary, 2007 42
represents the decay of cyanide to ammonium in the groundwater. The soil moisture factor is calculated at each time step as
MAX
MAXSMD SMD
SMDSMDS −= (8)
where SMD is the user supplied daily soil moisture deficit time series (mm). The factor is scaled between 0 and 1, and describes the situation that as the soil dries the rate of the soil processes declines. In addition, each process rate parameter is a function of the soil temperature
1010
10basQs t
Qnn tCC−
=θ
(9) where θs is the soil temperature (oC), Cn is the soil process parameter and tq10 (Ø) and tQ10bas (oC) are parameters determined by calibration. The parameter tq10 is the factor change in rate with a 10 degree change in temperature and the parameter tQ10bas is the base temperature for the process at which the response is 1. The soil temperature is estimated from a seasonal relationship dependent on air temperature as follows
⎟⎠⎞
⎜⎝⎛−=
365.
23sin6
nodayCAs πθθ (10)
where θs is the air temperature (oC) and C6 is the maximum temperature difference between summer and winter (oC). This relationship generates a seasonal pattern for each land use which is controlled by the parameter C6. It is corrected for snow depth during winter months using equation (4) of Rankinen et al (2002). This temperature dependency applied to all soil zone process parameters, not just those for cyanide.
Ammonium-N The change in ammonium mass in the soil, mnh4,sz (kg N km-2) and groundwater, mnh4,gz (kg N km-2) stores are given by equations (11) and (12) Soil Zone
RD
szcnSMD
RD
sznhSMD
RD
sznhPGISMD
RD
szsznhinnh
sznh
VVmSC
VVmSC
VVmSSC
VVqm
mdt
dm
++
+−
+−
+−=
6,4
6,48
6,47,4
,4,4
1010
1086400100
(11)
Groundwater Zone
gw
gznh
gw
gzgznh
gw
szgznhgznh
VmC
Vqm
Vqm
dtdm 6
,49,4,4,4 108640086400−−=
β (12)
INCA Model: Mures River, Romania and Hungary, 2007 43
where C7, C8 and C9 are the rates of ammonium uptake by plants from the soil, and soil and groundwater ammonium nitrification rates (Fig. 3). The input mass of ammonium to the soil zone, mnh4,in (kg N ha day-1), represented by the first term on the right hand side of equation (11), includes livestock manure, fertiliser and wet and dry deposition. All other terms have been defined previously except SPGI which is the plant growth index and describes the seasonal variations in the solar radiation and the subsequent control on plant growth during different seasons. The index is given by
[ ]⎟⎠⎞
⎜⎝⎛ −
+=365
.2sin34.066.0 10CnodaySPGI π (13)
where C10 is the day number associated with the start of the growing season. The second term on the right hand side of equation (11) represents the lateral movement of ammonium with flow from the soil zone to the stream; the third term represents the ammonium uptake by plants; the fourth term represents the conversion of ammonium to nitrate via nitrification; and the fourth term is the is the increase in ammonium resultant from the decay of cyanide. The first and second terms on the right hand side of equation (12) represents the input of ammonium from the soil zone to groundwater and the lateral movement to the stream; the third term represents ammonium nitrification in the groundwater.
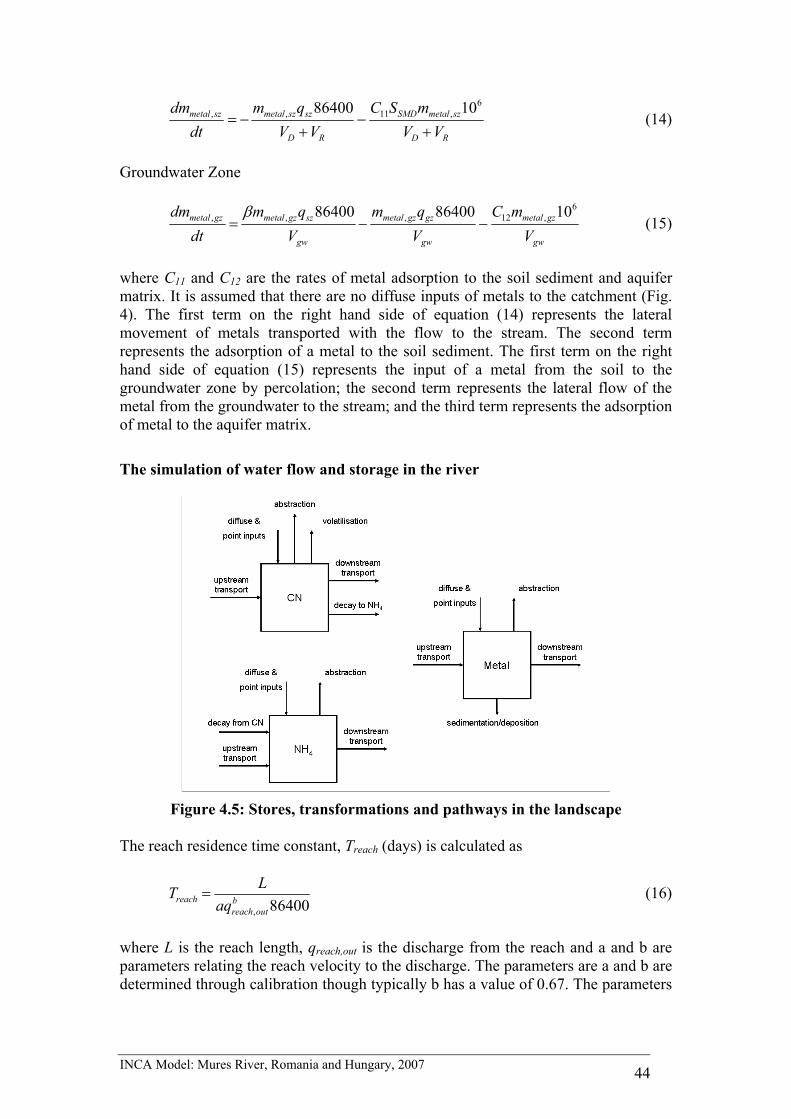
Metals The follow equations relate to each of the eight metals included in the model. Whilst the equations given here are generic to all the eight metals, within the model there are different parameters for each metal so that the transport, decay and storage of each are independent.
Figure 4.4: Metal stores, transformations and pathways in the landscape
The change in mass of each metal in the soil, mmetal,sz (kg km-2) and groundwater, mmetal,gz (kg km-2) stores are given by equations (14) and (15) Soil Zone
INCA Model: Mures River, Romania and Hungary, 2007 44
RD
szmetalSMD
RD
szszmetalszmetal
VVmSC
VVqm
dtdm
+−
+−=
6,11,, 1086400
(14)
Groundwater Zone
gw
gzmetal
gw
gzgzmetal
gw
szgzmetalgzmetal
VmC
Vqm
Vqm
dtdm 6
,12,,, 108640086400−−=
β (15)
where C11 and C12 are the rates of metal adsorption to the soil sediment and aquifer matrix. It is assumed that there are no diffuse inputs of metals to the catchment (Fig. 4). The first term on the right hand side of equation (14) represents the lateral movement of metals transported with the flow to the stream. The second term represents the adsorption of a metal to the soil sediment. The first term on the right hand side of equation (15) represents the input of a metal from the soil to the groundwater zone by percolation; the second term represents the lateral flow of the metal from the groundwater to the stream; and the third term represents the adsorption of metal to the aquifer matrix.
The simulation of water flow and storage in the river
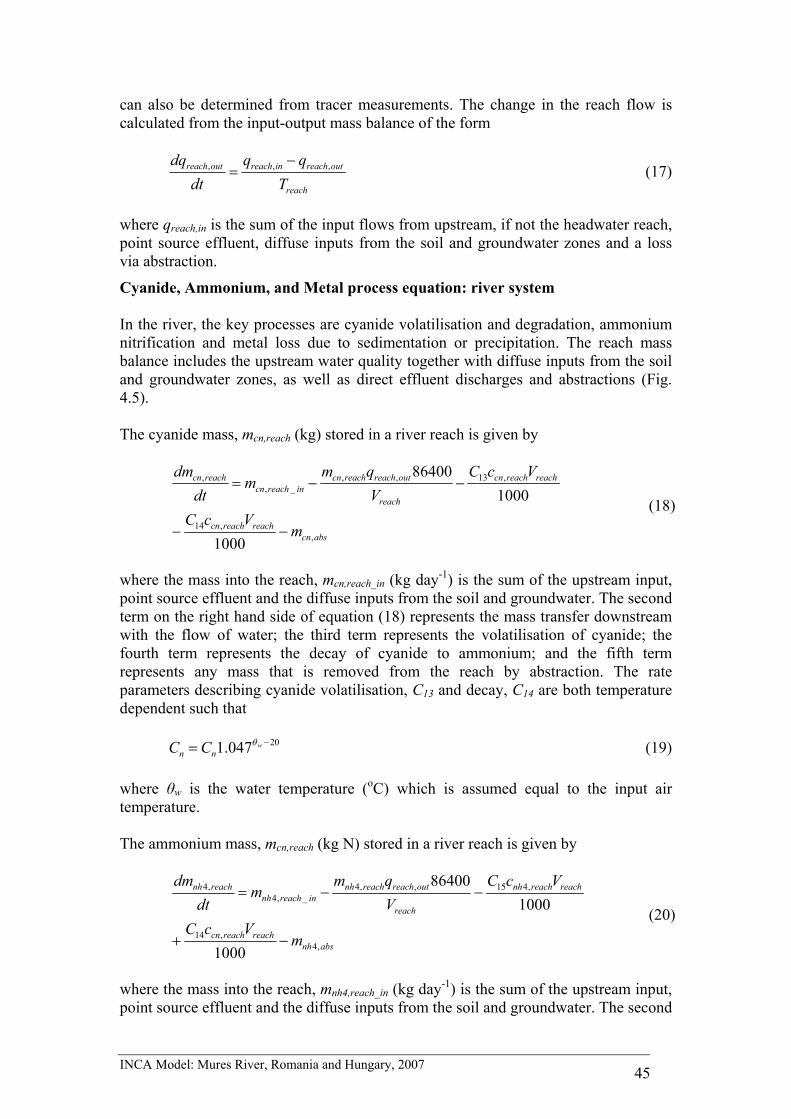
Figure 4.5: Stores, transformations and pathways in the landscape
The reach residence time constant, Treach (days) is calculated as
86400,b
outreachreach aq
LT = (16)
where L is the reach length, qreach,out is the discharge from the reach and a and b are parameters relating the reach velocity to the discharge. The parameters are a and b are determined through calibration though typically b has a value of 0.67. The parameters
INCA Model: Mures River, Romania and Hungary, 2007 45
can also be determined from tracer measurements. The change in the reach flow is calculated from the input-output mass balance of the form
reach
outreachinreachoutreach
Tqq
dtdq ,,, −
= (17)
where qreach,in is the sum of the input flows from upstream, if not the headwater reach, point source effluent, diffuse inputs from the soil and groundwater zones and a loss via abstraction.
Cyanide, Ammonium, and Metal process equation: river system In the river, the key processes are cyanide volatilisation and degradation, ammonium nitrification and metal loss due to sedimentation or precipitation. The reach mass balance includes the upstream water quality together with diffuse inputs from the soil and groundwater zones, as well as direct effluent discharges and abstractions (Fig. 4.5). The cyanide mass, mcn,reach (kg) stored in a river reach is given by
abscnreachreachcn
reachreachcn
reach
outreachreachcninreachcn
reachcn
mVcC
VcCVqm
mdt
dm
,,14
,13,,_,
,
1000
100086400
−−
−−= (18)
where the mass into the reach, mcn,reach_in (kg day-1) is the sum of the upstream input, point source effluent and the diffuse inputs from the soil and groundwater. The second term on the right hand side of equation (18) represents the mass transfer downstream with the flow of water; the third term represents the volatilisation of cyanide; the fourth term represents the decay of cyanide to ammonium; and the fifth term represents any mass that is removed from the reach by abstraction. The rate parameters describing cyanide volatilisation, C13 and decay, C14 are both temperature dependent such that
20047.1 −= wnn CC θ (19)
where θw is the water temperature (oC) which is assumed equal to the input air temperature. The ammonium mass, mcn,reach (kg N) stored in a river reach is given by
absnhreachreachcn
reachreachnh
reach
outreachreachnhinreachnh
reachnh
mVcC
VcCVqm
mdt
dm
,4,14
,415,,4_,4
,4
1000
100086400
−+
−−= (20)
where the mass into the reach, mnh4,reach_in (kg day-1) is the sum of the upstream input, point source effluent and the diffuse inputs from the soil and groundwater. The second

INCA Model: Mures River, Romania and Hungary, 2007 46
term on the right hand side of equation (20) represents the mass transfer downstream with the flow of water; the third term represents the nitrification of ammonium; the fourth term represents the increase in ammonium from the decay of cyanide; and the fifth term represents any mass that is removed from the reach by abstraction. The rate parameters describing nitrification C15 is temperature dependent. The metal mass, mmetal,reach (kg N) stored in a river reach is given by
absmetalreachreachmetal
reach
outreachreachmetalinreachmetal
reachmetal mVcC
Vqm
mdt
dm,
,16,,_,
,
100086400
−−−= (21)
where the mass into the reach, mmetal,reach_in (kg day-1) is the sum of the upstream input, point source effluent and the diffuse inputs from the soil and groundwater. The second term on the right hand side of equation (21) represents the mass transfer downstream with the flow of water; the third term represents the sedimentation of the metal.; and the fourth term represents any mass that is removed from the reach by abstraction. The rate parameters describing sedimentation C16 is temperature dependent. Symbol Definition Units
User supplied inputs as time series
peff Hydrologically effective rainfall m3 s-1 km2
SMD Soil moisture deficit Mm
θA Air temperature oC
mnh4,in Input ammonium load (includes input from livestock, fertiliser and wet and dry deposition)
kg N ha-1 day-1
User supplied inputs as constants
Β Base flow index Ø
Tsz Soil zone response time Days
Tgz Groundwater zone response time Days
qsz,initial Initial outflow from soil zone m3 s-1 km2
SMDmax The maximum soil moisture deficit in the soil Mm
deff,gw The ‘effective’ depth of the groundwater zone equal to the depth of the active groundwater multiplied by the effective porosity
M
C1 Ratio of soil retention volume to ‘easily available’ soil moisture Ø
C2 Fraction of total groundwater effective pore space occupied by water Ø
C3 Cyanide volatilisation rate in the soil zone m day-1
C4 Rate of decay of cyanide to ammonium in the soil zone m day-1
C5 Rate of decay of cyanide to ammonium in the groundwater zone m day-1
C6 Maximum temperature difference between summer and winter oC
C7 Plant ammonium uptake rate m day-1
C8 Soil zone ammonium nitrification rate m day-1
C9 Groundwater zone ammonium nitrification rate m day-1
C10 Day number associated with the start of the growing season Ø

INCA Model: Mures River, Romania and Hungary, 2007 47
C11 Rate of adsorption of metal to soil sediment m day-1
C12 Rate of adsorption of metal to aquifer matrix m day-1
tQ10 Factor change in rate with a 10 degree change in temperature Ø
tQ10bas Base temperature for the process rate at which the response is 1 oC
Variables in the landscape equations
qsz Outflow from soil zone m3 s-1 km2
qgw Outflow from groundwater zone m3 s-1 km2
VD Soil zone drainage volume m3 km2
VR Soil zone retention volume m3 km2
Vgw Groundwater zone volume m3 km2
SSMD Soil moisture factor Ø
SPGI Plant growth index Ø
mcn,sz Mass of cyanide in the soil zone kg km-2
mcn,gz Mass of cyanide in the groundwater zone kg km-2
mnh4,sz Mass of ammonium in the soil zone kg N km-2
mnh4,gz Mass of ammonium in the groundwater zone kg N km-2
mmetal,sz Mass of metal in the soil zone kg km-2
mmetal,gz Mass of metal in the groundwater zone kg km-2
Table 4.1: Constants and variables in the landscape mass-balance equations Symbol Definition Units
User supplied inputs as constants
Treach Reach residence time Days
L Reach length M
A Discharge-velocity parameter m-2
B Discharge-velocity parameter Ø
C13 Cyanide volatilisation rate m day-1
C14 Rate of decay of cyanide to ammonium in the stream m day-1
C15 Reach ammonium nitrification rate m day-1
C16 Rate of metal loss by precipitation/sedimentation in the stream m day-1
Variables in the instream equations
qreach,out Water flow from the reach m-3 s-1
qreach,in Water flow to the reach from upstream, point source effluent, diffuse inputs from soil and groundwater zones and loss via abstraction
m-3 s-1
mcn,reach Mass of cyanide in the reach Kg
mcn,reach Mass of cyanide input to the reach from upstream, point source effluent, and diffuse inputs from soil and groundwater zones
Kg
mcn,abs Mass of cyanide abstracted from the reach Kg
mnh4,reach Mass of ammonium in the reach Kg

INCA Model: Mures River, Romania and Hungary, 2007 48
mnh4,reach Mass of ammonium input to the reach from upstream, point source effluent, and diffuse inputs from soil and groundwater zones
Kg
mnh4,abs Mass of ammonium abstracted from the reach Kg
mmetal,reach Mass of metal in the reach Kg
mmetal,reach Mass of metal input to the reach from upstream, point source effluent, and diffuse inputs from soil and groundwater zones
Kg
mmetal,abs Mass of metal abstracted from the reach Kg
ccn,reach Concentration of cyanide in the reach Mg l-1
cnh4,reach Concentration of ammonium in the reach Mg l-1
Cmetal,reach Concentration of metal in the reach Mg l-1
Vreach Reach volume m3
Table 4.2: Constants and variables in the river mass-balance equations 4.3 Application of INCA-Mine to the Upper Catchments and the Abrud-Aries-Mures River System. The model has been applied to the upper catchments, namely Roşia, Saliste, Corna and Abruzel Catchments in the same manner as the nitrogen applications described above. The major problem with any such applications is that it is necessary to include the key adit or ARD flows that are affecting the water quality in the streams. As part of the Roşia Montană project these have been monitored both for chemistry and flow. Tables 4.3, 4.4 and 4.5 give the chemistry of the principal sources of mine seepage or ARD in the Abruzel, Corna and Saliste catchments. The adit chemistry for the Roşia catchment is given in Table 3.2 above.
SiteID ABRUZEL MINE SEEPAGE S021
MIN MAX AVERAGENO3_mg/l 1.93 12.24 5.54 NO3_meql 0.031 0.19 0.089 AsT_µg/l 0 265 27.58 AsD_µg/l 0 249 25.61 CdT_µg/l 2.04 107.3 30.29 CdD_µg/l 1.99 85.11 24.68 CuT_µg/l 107 8070 2878.0 CuD_µg/l 6.5 7305 2524.12 PbT_µg/l 0 66.7 10.87 PbD_µg/l 0 66.7 8.42 ZnT_µg/l 478 13090 4414 ZnD_µg/l 28.1 11810 3433.7 ZnD_meql 0.00086 0.36 0.10 CrT_µg/l 6.4 954 175.58 Mn_mg/l 1.132 14640 1228.2 Mn_meql 0.041209 0.73 0.342915 Hg_µg/l 0 0.001 0.0
Table 4.3: Mine Seepage Chemistry for the Abruzel Catchment

INCA Model: Mures River, Romania and Hungary, 2007 49
Site ID CORNA CATCHMENT
VALEA VERDE WASTE
C122 MIN MAX AVERAGEAsT_µg/l 0.00 684.20 59.46 AsD_µg/l 0.00 651.80 54.97 CdT_µg/l 0.00 54.30 17.38 CdD_µg/l 0.00 44.50 12.27 CuT_µg/l 1.60 381.00 88.26 CuD_µg/l 2.80 292.00 70.48 PbT_µg/l 4.40 67.90 18.18 PbD_µg/l 0.00 36.00 9.38 ZnT_µg/l 28.40 14590 4958.24 ZnD_µg/l 7.00 11110 4104.43 ZnD_meql 0.00 0.34 0.13 CrT_µg/l 3.50 2964.25 356.06 Mn_mg/l 0.02 603000 37940.63 Mn_meql 0.00 26.39 10.59 Hg_µg/l 0.00 0.14 0.02
Table 4.4: Seepage Chemistry for the Valea Verde Waste in the Corna Catchment
Site ID SALISTE CATCHMENT
TMF Seepage
D000 MIN MAX AVERAGEAsT_µg/l 0.9 42.8 13.57 AsD_µg/l 0.95 28.5 10.59 CdT_µg/l 1.22 73.2 16.06 CdD_µg/l 1.46 51.9 11.31 CuT_µg/l 14.6 211 81.06 CuD_µg/l 16.4 189 68.35 PbT_µg/l 0 4.8 1.91 PbD_µg/l 0 3.6 1.42 ZnT_µg/l 250.3 3129 1009.71 ZnD_µg/l 235.4 2604 863.23 ZnD_meql 0.0072 0.079 0.026 CrT_µg/l 5.36 532 207.37 Mn_mg/l 26.605 188 115.13 Mn_meql 0.968511 6.84 4.13 Hg_µg/l 0 0.17 0.028
Table 4.5: TMF Seepage Chemistry in the Saliste Catchment The flow rates for the various adits and mine seepages are 25 l/sec for Roşia, 0.76 l/sec for the mine seepage in Corna, 10 l/sec for the seepage from the TMF in Saliste and an unknown flow for mine seepage in the Abruzel catchment. These flows and the associated chemistry have been set up in the model in order to simulate the chemistry of the 4 catchments. Typical model simulations are given for the Roşia catchment for a range of metals over 2002-2006 and a comparison of simulated and
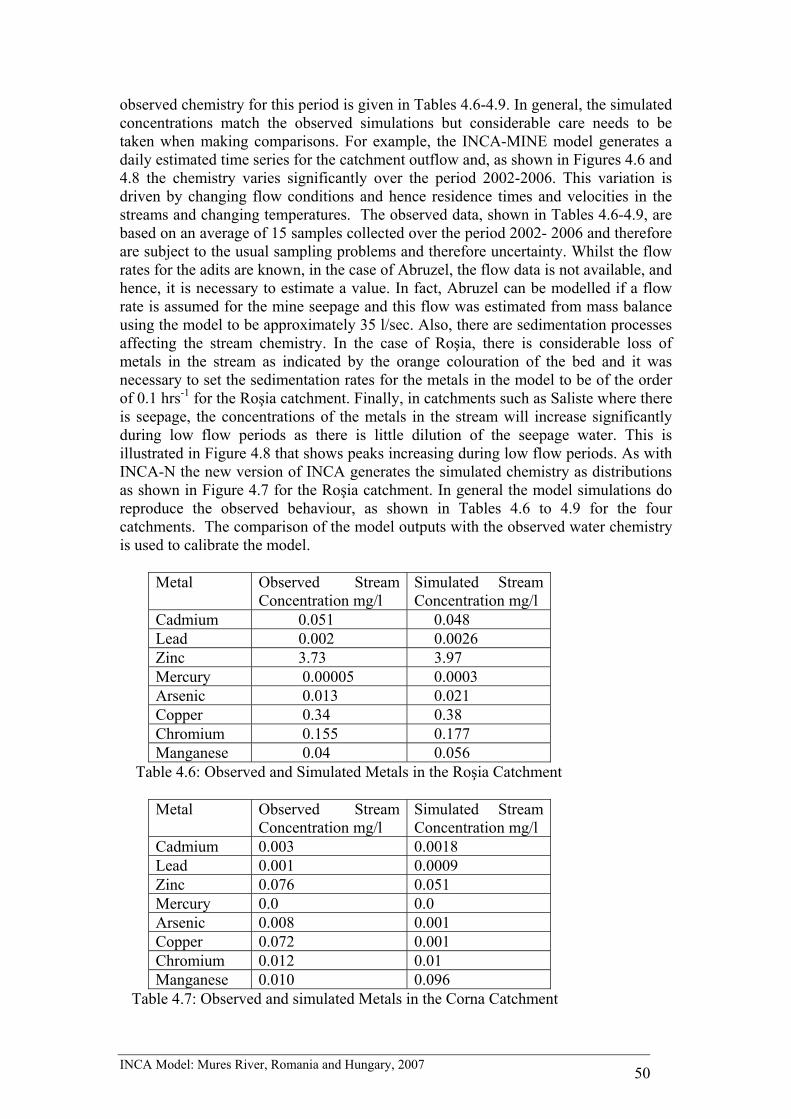
INCA Model: Mures River, Romania and Hungary, 2007 50
observed chemistry for this period is given in Tables 4.6-4.9. In general, the simulated concentrations match the observed simulations but considerable care needs to be taken when making comparisons. For example, the INCA-MINE model generates a daily estimated time series for the catchment outflow and, as shown in Figures 4.6 and 4.8 the chemistry varies significantly over the period 2002-2006. This variation is driven by changing flow conditions and hence residence times and velocities in the streams and changing temperatures. The observed data, shown in Tables 4.6-4.9, are based on an average of 15 samples collected over the period 2002- 2006 and therefore are subject to the usual sampling problems and therefore uncertainty. Whilst the flow rates for the adits are known, in the case of Abruzel, the flow data is not available, and hence, it is necessary to estimate a value. In fact, Abruzel can be modelled if a flow rate is assumed for the mine seepage and this flow was estimated from mass balance using the model to be approximately 35 l/sec. Also, there are sedimentation processes affecting the stream chemistry. In the case of Roşia, there is considerable loss of metals in the stream as indicated by the orange colouration of the bed and it was necessary to set the sedimentation rates for the metals in the model to be of the order of 0.1 hrs-1 for the Roşia catchment. Finally, in catchments such as Saliste where there is seepage, the concentrations of the metals in the stream will increase significantly during low flow periods as there is little dilution of the seepage water. This is illustrated in Figure 4.8 that shows peaks increasing during low flow periods. As with INCA-N the new version of INCA generates the simulated chemistry as distributions as shown in Figure 4.7 for the Roşia catchment. In general the model simulations do reproduce the observed behaviour, as shown in Tables 4.6 to 4.9 for the four catchments. The comparison of the model outputs with the observed water chemistry is used to calibrate the model.
Metal Observed Stream Concentration mg/l
Simulated Stream Concentration mg/l
Cadmium 0.051 0.048 Lead 0.002 0.0026 Zinc 3.73 3.97 Mercury 0.00005 0.0003 Arsenic 0.013 0.021 Copper 0.34 0.38 Chromium 0.155 0.177 Manganese 0.04 0.056
Table 4.6: Observed and Simulated Metals in the Roşia Catchment
Metal Observed Stream Concentration mg/l
Simulated Stream Concentration mg/l
Cadmium 0.003 0.0018 Lead 0.001 0.0009 Zinc 0.076 0.051 Mercury 0.0 0.0 Arsenic 0.008 0.001 Copper 0.072 0.001 Chromium 0.012 0.01 Manganese 0.010 0.096
Table 4.7: Observed and simulated Metals in the Corna Catchment

INCA Model: Mures River, Romania and Hungary, 2007 51
Metal Observed Stream
Concentration mg/l Simulated Stream Concentration mg/l
Cadmium 0.0039 0.003 Lead 0.0007 0.0004 Zinc 0.616 0.235 Mercury 0.0 0.0 Arsenic 0.014 0.0027 Copper 0.059 0.018 Chromium 0.070 0.056 Manganese 2.38 0.56
Table 4.8: Observed and Simulated Metals in the Saliste Catchment
Table 4.9: Observed and Simulated Metals Chemistry in the Abruzel Catchment
Figure 4.6: Simulated Flow, Cadmium and Lead over 2002-2006 in Roşia Catchment
Metal Observed Stream Concentration mg/l
Simulated Stream Concentration mg/l
Cadmium 0.0176 0.007 Lead 0.001 0.023 Zinc 0.733 0.96 Mercury 0.0 0.0 Arsenic 0.006 0.007 Copper 0.697 0.714 Chromium 0.044 0.049 Manganese 0.077 0.001

INCA Model: Mures River, Romania and Hungary, 2007 52
Figure 4.7: Distribution of Simulated Flow, Arsenic and Copper in Roşia Catchment
Figure 4.8: Simulated Flow, Chromium and Manganese over 2002-2006 in Saliste Catchment

INCA Model: Mures River, Romania and Hungary, 2007 53
4.3 Modelling Metals in the Abrud-Aries- Mures River System The INCA-Mine model has been applied to the whole of the Abrud-Aries-Mures River system using the same procedure as before for the INCA-N modelling. The model simulates 27 reaches from the upper Abrud down along the Aries and the Mures Rivers as far as the border with Hungary at Nadlac. This is a long stretch of river and subject to many inputs from tributaries and discharges. However, we are concerned, in this study, with the impacts of the current and future mining activities at Roşia Montană. The period of 2002-2006 is used as the key period of simulation as this is when water quality data is available for the upper catchments. The model simulates flow as well as all eight metals along the river system and also models cyanide and ammonia, so that accidental spillage and dam break scenarios can be investigated. A key feature of the model is that the water flows increase downstream as new tributaries join the main river. These flows will increase the dilution and hence reduce the concentrations of metals released from Roşia Montană upstream. This is illustrated by the observed chemistry for the river system, as shown in Table 4.10. Here the metal concentrations in the Mures River at Nadlac, 595 km downstream of the mining area, are low. In fact, the concentrations at Nadlac are very similar to the concentrations at Câmpeni, which is upstream of any mine discharges and reflect the natural clean river chemistry. The model generates a vast amount of information; too much to include in a report and hence only some example outputs are presented here. The model generates daily flow and chemistry at 27 reaches down the river system over a five year period, equivalent to 440,000 pieces of information in each model run7. The model has been set up to investigate impacts of present and future discharges from Roşia Montană; this is presented in the next section of this report. Determined in mg/l ex.pH Câmpeni (upstream of mines) Nadlac (595kms downstream)pH range 6.5-8.5 6.5-8.5 Cadmium 0.001 0.001 Lead 0.04 0.04 Zinc 0.02 0.19 Mercury 0.0001 0.0002 Arsenic 0.01 0.02 Copper 0.04 0.04 Chromium 0.05 0.05 Manganese 0.1 0.1 Table 4.10: Observed Water Quality at Câmpeni and Nadlac (average 2002-2005) Figures 4.9 to 4.14 show typical simulations for the model. The time series plots shown in Figures 4.9 and 4.10, for the river at Turda and at Arad show the varying flow and concentrations over time. An important feature is the higher flows at the lower site, Arad, and the decreased concentrations in the metals. Also, note the higher concentrations of the metals under the low flow conditions. This is due to the reduced dilution of the TMFs and the adit discharges in the upper catchments. This is further illustrated in Figure 4.11, which shows a snapshot of flow and water quality down the river on one day. Here the flows are shown to build up along the river system and the metal concentration levels fall along the river system.
7 For interested groups wishing to examine this in depth, workshops can be organised – contact [email protected].

INCA Model: Mures River, Romania and Hungary, 2007 54
This is a reflection of the increased dilution of the metals and also the effect of dispersion and sedimentation on concentration levels. Figure 4.12 shows a 3D plot of the flows in the river system and indicates the rapid build up in flow as the Aries River joins the much bigger Mures River system downstream of Turda. Finally, Figures 4.13 and 4.14 show the distributions of flow and metals for Turda on the Aries and Arad on the Mures. The distributions provide a statistical analysis of the simulated data so that we can compare the simulated behaviour with key standards for water quality in rivers.
Figure 4.9: Simulation of Chromium and Zinc at Turda 2002-2006

INCA Model: Mures River, Romania and Hungary, 2007 55
Figure 4.10: Simulation of Chromium and Zinc at Arad 2002-2006
Figure 4.11: Snapshot down the river for Arsenic and Copper

INCA Model: Mures River, Romania and Hungary, 2007 56
Figure 4.12: 3D plot of flow during a storm event in 2002
Figure 4.13: Distributions and Statistics for Chromium and Manganese at Turda

INCA Model: Mures River, Romania and Hungary, 2007 57
Figure 4.14: Distributions and Statistics for Chromium and Manganese at Arad
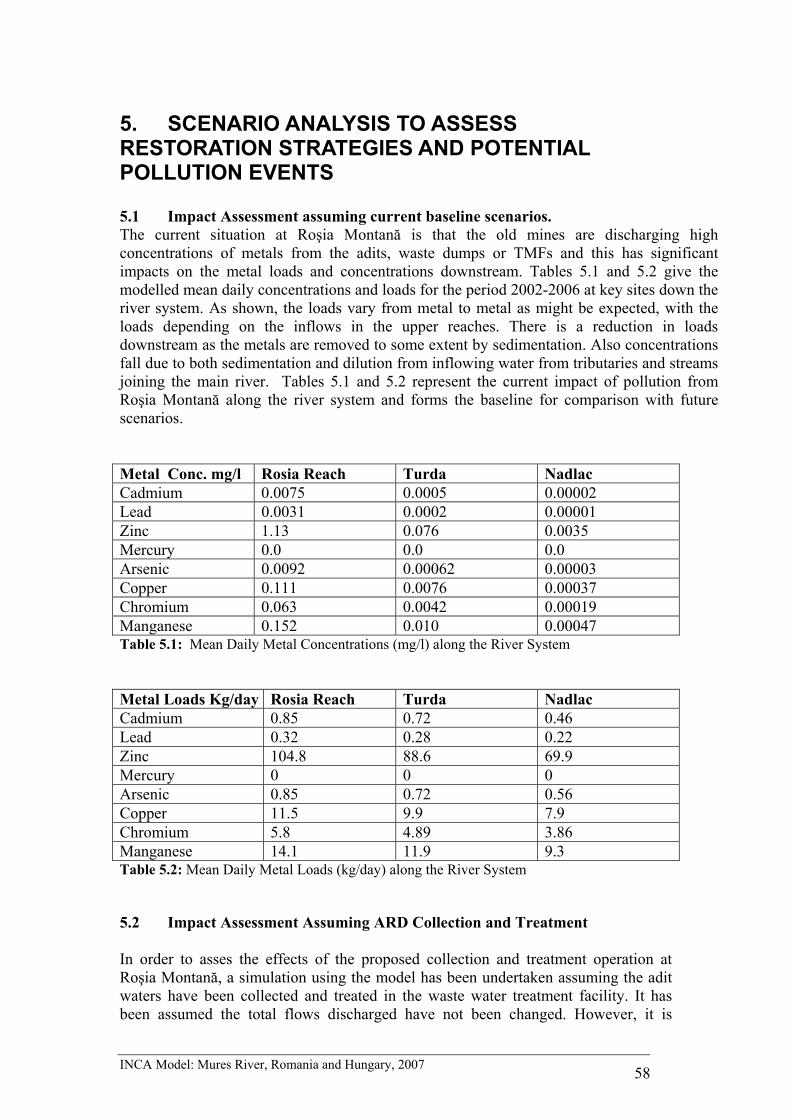
INCA Model: Mures River, Romania and Hungary, 2007 58
5. SCENARIO ANALYSIS TO ASSESS RESTORATION STRATEGIES AND POTENTIAL POLLUTION EVENTS 5.1 Impact Assessment assuming current baseline scenarios. The current situation at Roşia Montană is that the old mines are discharging high concentrations of metals from the adits, waste dumps or TMFs and this has significant impacts on the metal loads and concentrations downstream. Tables 5.1 and 5.2 give the modelled mean daily concentrations and loads for the period 2002-2006 at key sites down the river system. As shown, the loads vary from metal to metal as might be expected, with the loads depending on the inflows in the upper reaches. There is a reduction in loads downstream as the metals are removed to some extent by sedimentation. Also concentrations fall due to both sedimentation and dilution from inflowing water from tributaries and streams joining the main river. Tables 5.1 and 5.2 represent the current impact of pollution from Roşia Montană along the river system and forms the baseline for comparison with future scenarios. Metal Conc. mg/l Rosia Reach Turda Nadlac Cadmium 0.0075 0.0005 0.00002 Lead 0.0031 0.0002 0.00001 Zinc 1.13 0.076 0.0035 Mercury 0.0 0.0 0.0 Arsenic 0.0092 0.00062 0.00003 Copper 0.111 0.0076 0.00037 Chromium 0.063 0.0042 0.00019 Manganese 0.152 0.010 0.00047 Table 5.1: Mean Daily Metal Concentrations (mg/l) along the River System Metal Loads Kg/day Rosia Reach Turda Nadlac Cadmium 0.85 0.72 0.46 Lead 0.32 0.28 0.22 Zinc 104.8 88.6 69.9 Mercury 0 0 0 Arsenic 0.85 0.72 0.56 Copper 11.5 9.9 7.9 Chromium 5.8 4.89 3.86 Manganese 14.1 11.9 9.3 Table 5.2: Mean Daily Metal Loads (kg/day) along the River System 5.2 Impact Assessment Assuming ARD Collection and Treatment In order to asses the effects of the proposed collection and treatment operation at Roşia Montană, a simulation using the model has been undertaken assuming the adit waters have been collected and treated in the waste water treatment facility. It has been assumed the total flows discharged have not been changed. However, it is

INCA Model: Mures River, Romania and Hungary, 2007 59
assumed that the chemistry has been altered to meet the chemistry specified in Table 4.1-16 of the EIA Study Report section 4.1 for Water. The effects of changing the discharge chemistry is significant as illustrated in Tables 5.3, 5.4 and 5.5 and in Figures 5.1- 5.3. Tables 5.3 and 5.4 show the predicted chemistry and loads at Câmpeni, Turda and Nadlac, and these can be compared with the concentrations and loads for the current polluted system (Tables 5.1 and 5.2 above). There is a significant improvement in water quality after the collection and treatment of the mine discharges. Table 5.5 shows more clearly the improvements as it gives the percentage reductions in load down the system. The reductions are significant, with reductions averaging 60% but in some cases -- such as for zinc -- much higher. This reflects the effectiveness of the metals removal process in the Waste Water Treatment Facility. Copper does not show such a big reduction but that is because of the large source of copper in the upper reaches of the Abrud River, above Roşia Montană. Figure 5.1 and 5.2 show the simulated time series of concentrations below Rosia and at Nadlac for various metals with and without the cleanup. The cleanup operation is shown to be very effective at reducing the concentrations along the river system. The RMP will remove the majority of the Rosia Montana and Corna sources of historic Acid Rock Drainage that currently pollute the rivers systems with metals such as cadmium, lead, zinc, arsenic, copper, chromium and manganese. This is even more clearly illustrated in Figure 5.3 which shows a range of metals for every reach down the system on an average flow condition day. The before and after cleanup simulated concentrations show a significant reduction in most metals. Metal Conc. mg/l Rosia Reach Turda Nadlac Cadmium 0.0016 0.00008 0.0 Lead 0.0024 0.0001 0.0 Zinc 0.056 0.003 0.0001 Mercury 0 0.0 0.0 Arsenic 0.0028 0.0001 0.0 Copper 0.041 0.002 0.0001 Chromium 0.0061 0.0003 0.0 Manganese 0.0084 0.0004 0.0 Table 5.3 Simulated Metal Concentrations assuming Collection and Treatment Metal Loads kg/day Rosia Reach Turda Nadlac Cadmium 0.176 0.13 0.09 Lead 0.30 0.23 0.16 Zinc 7.9 6.2 4.4 Mercury 0 0.0 0.0 Arsenic 0.3 0.22 0.15 Copper 5.8 4.5 3.2 Chromium 0.73 0.56 0.39 Manganese 0.86 0.63 0.42 Table 5.4 Simulated Metal Loads assuming Collection and Treatment

INCA Model: Mures River, Romania and Hungary, 2007 60
Metal Losses % Rosia Reach Turda Nadlac Cadmium 79.3 81.9 80.4 Lead 6.2 17.9 27.2 Zinc 92.5 93.0 93.6 Mercury 0 0 0 Arsenic 64.5 69.4 73.2 Copper 49.5 54.5 59.4 Chromium 87.4 88.5 89.9 Manganese 93.9 94.7 95.5 Table 5.5 Percentage metal load reductions assuming collection and treatment conditions
Figure 5.1: Simulated Cadmium and Lead Concentrations at the end of the Rosia Reach with (green line) and without (blue line) ARD Waste Water Treatment.

INCA Model: Mures River, Romania and Hungary, 2007 61
Figure 5.2: Simulated Arsenic and Copper Concentrations at Nadlac

INCA Model: Mures River, Romania and Hungary, 2007 62
Figure 5.3: Profiles of Simulated Metals along the Abrud- Aries- Mures River System Showing Effects of Collection and Treatment on Metal Concentrations- Green line shows collection and treatment conditions. 5.3 Impact Assessment Assuming Dam Break Scenarios The impacts in the case of a dam break has also been analysed using the INCA-Mine model. The model allows for a point source discharge over a short space of time as if there were a dam failure on the main tailings management facility (TMF) or a water management failure resulting in overtopping of the dam. Several sets of scenarios have been investigated using the model. Cyanide pollution due to overtopping of the dam: as in the case of Baia Mare 2000. The first question often posed when talking about Rosia Montana and transboundary impacts is: “what would happen if the events of Baia Mare 2000 were to be repeated in Rosia Montana?” Given that the Baia Mare event resulted from unexceptional weather conditions, this is a logical question. The sequence of events leading to the Baia Mare accident, as reported in the Report of the International Task Force for Assessing the Baia Mare Accident, UNDP (2000) are as follows: “• Heavy (but not exceptional) rain and snowfall in December 1999 and January 2000, combined with rapid snowmelt from 27 January 2000 as the temperature rose suddenly from below freezing to 9.5ºC, and nearly 40mm of rainfall on 30 January 2000 caused water levels to reach critical levels. The embankment walls became saturated and unstable as the snow melted directly on their surfaces. • On 30 January, the dam overflowed and washed away a stretch of embankment wall 25 metres long and 2.5 metres deep. Approximately, 100,000m3 of tailings water containing cyanide began to flow into the nearby Lapus River.” In the case of Rosia Montana, the dam layout as required by its water management strategy incorporates a minimum storm water or snow melt storage capacity of two

INCA Model: Mures River, Romania and Hungary, 2007 63
probable maximum floods (PMF)8 . Before any overtopping could occur, two PMFs would have to enter the pond of the tailings management facility. This would therefore result is considerable dilution prior to overtopping as shown in Table 5.6, as 2 PMFs for the Corna valley is equal to 5.5 million cubic meters of fresh water. Once these two events occurred one after the other there would have to be another meteorological event. For the purpose of this exercise we examine the impacts of
1. 2 PMFs stored followed by a 1:10 year flood resulting from rainfall / snowmelt (2.3 m3/sec)
2. 2 PMFs stored followed by a 1:100 year flood resulting from rainfall / snowmelt (13 m3/sec)
3. 2 PMFs stored followed by a 1:1000 year flood resulting from rainfall / snowmelt (20 m3/sec)
Note that such events, even though being unimaginably rare (i.e., an assumption of 2 PMFs one after the other followed immediately by the flood event), would occur over a controlled spillway, to avoid the situation in Baia Mare where the overtopping resulted in a dam breach. For the purpose of this exercise, these events are examined at operating (tailings) water storage conditions present behind the dam towards the beginning of the mine operation and towards the end of mine operation
a. For operating conditions at start of mining: pond operating water is 1,000,000 cubic meters
b. For operating conditions towards end of mining: pond operating water is 3,000,000 cubic meters.
The before and after storm events cyanide concentrations in the pond behind the dam given in Table 5.6 and reflect both summer and winter conditions. (Note that these are conservative as the extra storage capacity behind the dam is often more than 2 PMFs, especially towards the end of mine life when it can become the equivalent of 3 to 4 PMFs.)
Operating water in pond behind dam (m3)
Cyanide (Total) concentration behind dam (mg/l)
Dilution water added to pond due to 2 PMFs (m3)
Dilution factor
Cyanide (Total) concentration in pond behind dam prior to overtopping (mg/l)
Summer9 Winter Summer Winter 1,000,000 2 6 5,500,000 5.50 0.36 1.09 3,000,000 2 6 5,500,000 1.83 1.09 3.27
Table 5.6 Dilution Effects of Additional Water in the Pond
8 The Probable Maximum Flood (PMF) is the flood that may be expected from the most severe combination of critical meteorological and hydrologic conditions that are reasonably possible in a particular drainage area 9 The lower summer cyanide concentrations are due to the loss rates of processes such as volatilisation and degradation being considerably higher compared to the colder winter conditions
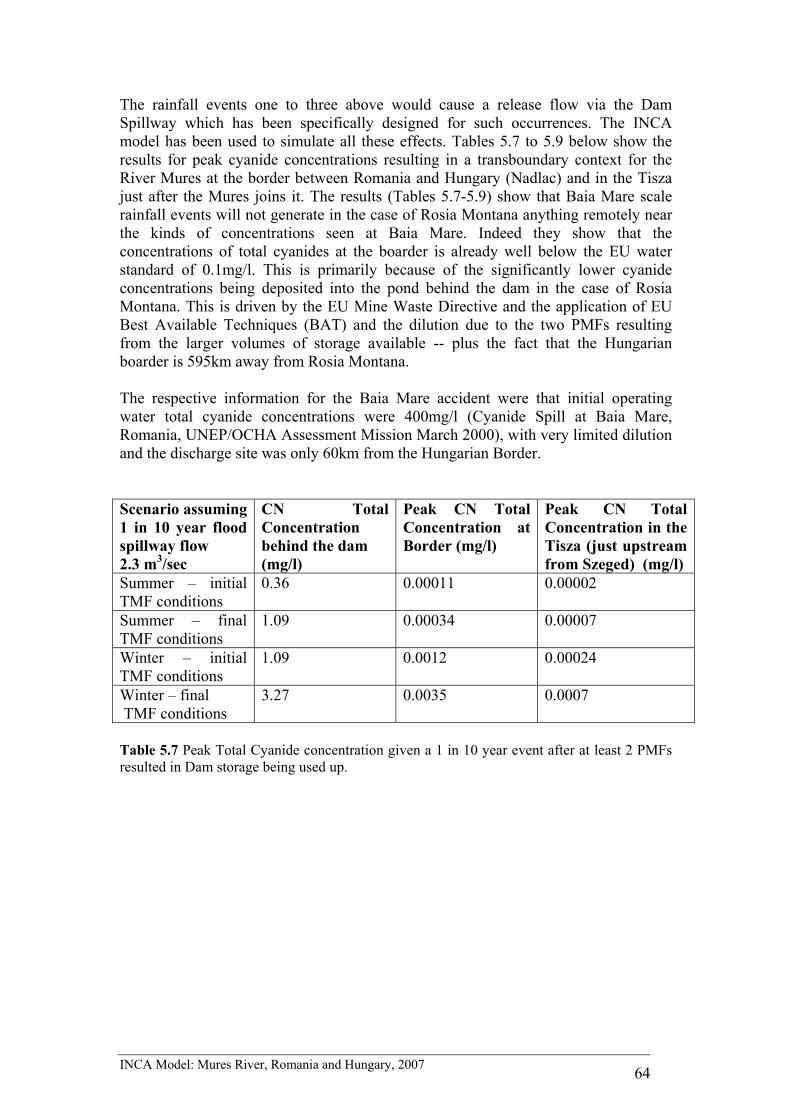
INCA Model: Mures River, Romania and Hungary, 2007 64
The rainfall events one to three above would cause a release flow via the Dam Spillway which has been specifically designed for such occurrences. The INCA model has been used to simulate all these effects. Tables 5.7 to 5.9 below show the results for peak cyanide concentrations resulting in a transboundary context for the River Mures at the border between Romania and Hungary (Nadlac) and in the Tisza just after the Mures joins it. The results (Tables 5.7-5.9) show that Baia Mare scale rainfall events will not generate in the case of Rosia Montana anything remotely near the kinds of concentrations seen at Baia Mare. Indeed they show that the concentrations of total cyanides at the boarder is already well below the EU water standard of 0.1mg/l. This is primarily because of the significantly lower cyanide concentrations being deposited into the pond behind the dam in the case of Rosia Montana. This is driven by the EU Mine Waste Directive and the application of EU Best Available Techniques (BAT) and the dilution due to the two PMFs resulting from the larger volumes of storage available -- plus the fact that the Hungarian boarder is 595km away from Rosia Montana. The respective information for the Baia Mare accident were that initial operating water total cyanide concentrations were 400mg/l (Cyanide Spill at Baia Mare, Romania, UNEP/OCHA Assessment Mission March 2000), with very limited dilution and the discharge site was only 60km from the Hungarian Border. Scenario assuming 1 in 10 year flood spillway flow 2.3 m3/sec
CN Total Concentration behind the dam (mg/l)
Peak CN Total Concentration at Border (mg/l)
Peak CN Total Concentration in the Tisza (just upstream from Szeged) (mg/l)
Summer – initial TMF conditions
0.36 0.00011 0.00002
Summer – final TMF conditions
1.09 0.00034 0.00007
Winter – initial TMF conditions
1.09 0.0012 0.00024
Winter – final TMF conditions
3.27 0.0035 0.0007
Table 5.7 Peak Total Cyanide concentration given a 1 in 10 year event after at least 2 PMFs resulted in Dam storage being used up.

INCA Model: Mures River, Romania and Hungary, 2007 65
Scenario assuming 1 in 100 year flood spillway flow 13 m3/sec
CN Total Concentration behind the dam (mg/l)
Peak CN Total Concentration at Border (mg/l)
Peak CN Total Concentration in the Tisza (just upstream from Szeged) (mg/l)
Summer – initial TMF conditions
0.36 0.00072 0.00014
Summer – final TMF conditions
1.09 0.0022 0.00045
Winter – initial TMF conditions
1.09 0.0071 0.0014
Winter – final TMF conditions
3.27 0.021 0.0042
Table 5.8 Peak Total Cyanide concentrations given a 1 in 100 year event after at least 2 PMFs resulted in Dam storage being used up. Scenario assuming 1 in 1000 year flood spillway flow 20 m3/sec
CN Total Concentration behind the dam (mg/l)
Peak CN Total Concentration at Border (mg/l)
Peak CN Total Concentration in the Tisza (just upstream from Szeged) (mg/l)
Summer – initial TMF conditions
0.36 0.0012 0.00024
Summer – final TMF conditions
1.09 0.0036 0.00051
Winter – initial TMF conditions
1.09 0.011 0.0021
Winter – final TMF conditions
3.27 0.033 0.0066
Table 5.9 Peak Total Cyanide concentration given a 1 in 1000 year event after at least 2 PMFs resulted in Dam storage being used up. This gives rise to the question: “so what would it take for the Rosia Montana Project to have a transboundary impact due to a tailings dam accident?” Scenarios to answer this question were created for the Rosia Montana Project’s Environmental Impact Assessment (EIA) study and were reported there as scenarios 1a, 1b, 1c, 2a, 2b and 2c. The next section analyses these scenarios. A study to investigate other dam failures scenarios and there transboundary effect. As part of the EIA, a study was undertaken to investigate the likelihood of a dam failure. These were considered by MWH (http://www.mwhglobal.com/), an environmental engineering consultancy, and are itemised in the EIA Report, Chapter 7, Risk Cases, Sections 6.4.3.1 and 6.4.3.2. MWH considered 2 sets of Dam Break scenarios with the first set of these representing start-up dam failure at the end of Year 1 and the second set assuming final dam failure at year 17. MWH also calculated the cyanide WAD10 concentration released in each scenario and considered average and
10 weak acid dissociable
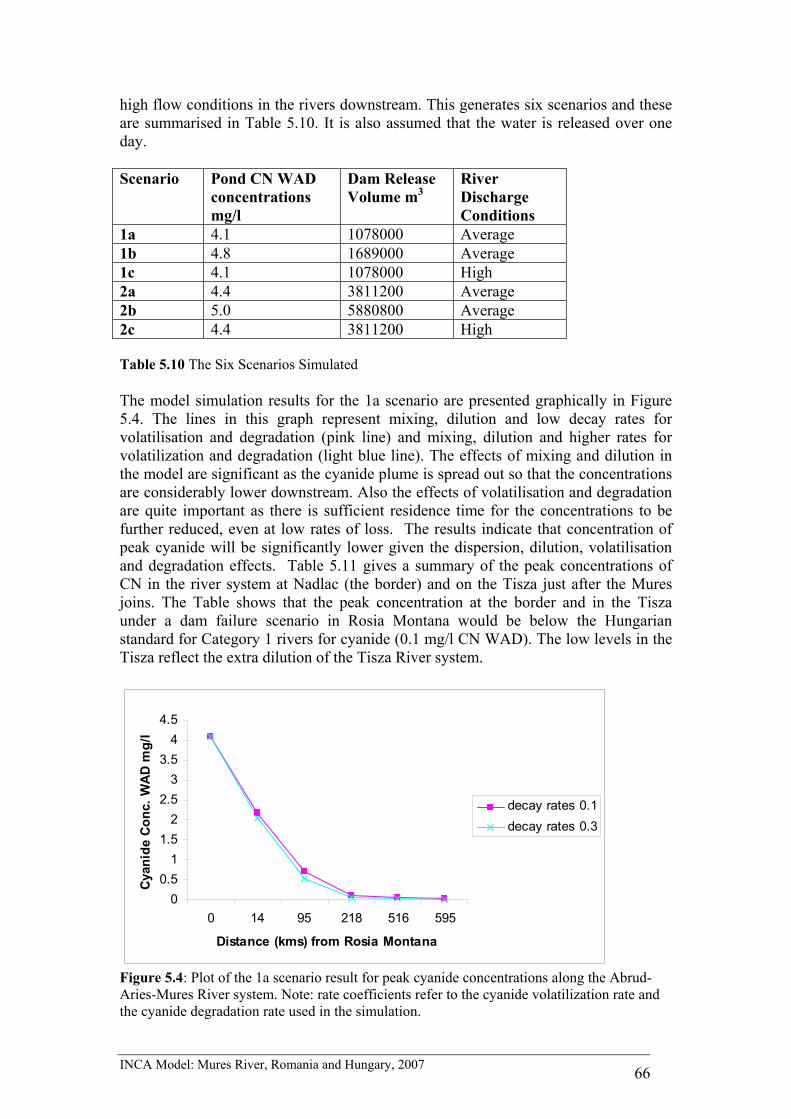
INCA Model: Mures River, Romania and Hungary, 2007 66
high flow conditions in the rivers downstream. This generates six scenarios and these are summarised in Table 5.10. It is also assumed that the water is released over one day. Scenario Pond CN WAD
concentrations mg/l
Dam Release Volume m3
River Discharge Conditions
1a 4.1 1078000 Average 1b 4.8 1689000 Average 1c 4.1 1078000 High 2a 4.4 3811200 Average 2b 5.0 5880800 Average 2c 4.4 3811200 High Table 5.10 The Six Scenarios Simulated The model simulation results for the 1a scenario are presented graphically in Figure 5.4. The lines in this graph represent mixing, dilution and low decay rates for volatilisation and degradation (pink line) and mixing, dilution and higher rates for volatilization and degradation (light blue line). The effects of mixing and dilution in the model are significant as the cyanide plume is spread out so that the concentrations are considerably lower downstream. Also the effects of volatilisation and degradation are quite important as there is sufficient residence time for the concentrations to be further reduced, even at low rates of loss. The results indicate that concentration of peak cyanide will be significantly lower given the dispersion, dilution, volatilisation and degradation effects. Table 5.11 gives a summary of the peak concentrations of CN in the river system at Nadlac (the border) and on the Tisza just after the Mures joins. The Table shows that the peak concentration at the border and in the Tisza under a dam failure scenario in Rosia Montana would be below the Hungarian standard for Category 1 rivers for cyanide (0.1 mg/l CN WAD). The low levels in the Tisza reflect the extra dilution of the Tisza River system.
00.5
11.5
22.5
33.5
44.5
0 14 95 218 516 595
Distance (kms) from Rosia Montana
Cya
nide
Con
c. W
AD
mg/
l
decay rates 0.1decay rates 0.3
Figure 5.4: Plot of the 1a scenario result for peak cyanide concentrations along the Abrud-Aries-Mures River system. Note: rate coefficients refer to the cyanide volatilization rate and the cyanide degradation rate used in the simulation.

INCA Model: Mures River, Romania and Hungary, 2007 67
Scenario Peak CN WAD Concentration at Nadlac mg/l
Peak CN WAD Concentration at Szeged (Tisza) mg/l
1a 0.012 0.0024 1b 0.022 0.0044 1c 0.0065 0.0013 2a 0.05 0.01 2b 0.093 0.018 2c 0.025 0.005 Table 5.11 Simulated Peak CN (WAD) concentrations at the border for the different scenarios and accounting for additional dilution in the Tisza Potential Metals Impacts from Dam Failure Another important issue is the impact of the metals released under the scenarios described above. A set of model simulations have been undertaken to simulate the 8 metals in INCA-Mine. The scenarios have been set up as in the case of the cyanide simulations using the case 1 and case 2 scenarios together with the estimated tailings geochemistry as reported in the EIA Report, Chapter 2 on TMF Closure and Management Plans. The average composition of the metals is estimated as shown in Table 5.12 Metal TMF Metal
Concentration mg/l
Cadmium 0.1 Lead 0.0 Zinc 0.1 Mercury 0.0 Arsenic 0.2 Copper 0.1 Chromium 0.1 Manganese 0.4 Table 5.12 TMF Metal Concentrations The simulation results for the worst case analysis is given in Table 5.13 which shows the 2b scenario results for the key metals affected by an accidental discharge. All the concentrations are below the Romanian standards, the Hungarian standards and the ICPDR classification standards for the Danube River and tributaries (ICPDR, TNMN Yearbook 2003), shown in Table 5.14. The impact of the metals in the event of an accident should be below the ICPDR classification levels by the border. This is again due to the dilution and dispersion effects as well as the natural degradation and loss of the metals as they progress downstream.
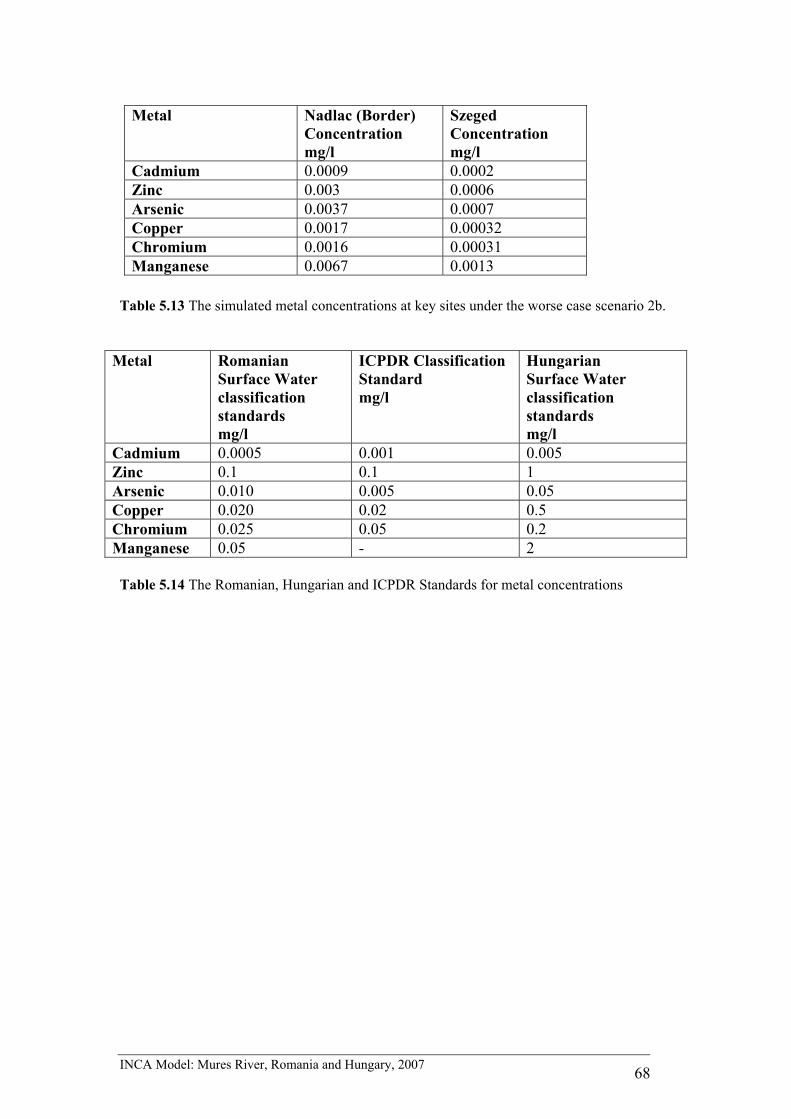
INCA Model: Mures River, Romania and Hungary, 2007 68
Table 5.13 The simulated metal concentrations at key sites under the worse case scenario 2b.
Metal Romanian Surface Water classification standards mg/l
ICPDR Classification Standard mg/l
Hungarian Surface Water classification standards mg/l
Cadmium 0.0005 0.001 0.005 Zinc 0.1 0.1 1 Arsenic 0.010 0.005 0.05 Copper 0.020 0.02 0.5 Chromium 0.025 0.05 0.2 Manganese 0.05 - 2 Table 5.14 The Romanian, Hungarian and ICPDR Standards for metal concentrations
Metal Nadlac (Border) Concentration mg/l
Szeged Concentration mg/l
Cadmium 0.0009 0.0002 Zinc 0.003 0.0006 Arsenic 0.0037 0.0007 Copper 0.0017 0.00032 Chromium 0.0016 0.00031 Manganese 0.0067 0.0013

INCA Model: Mures River, Romania and Hungary, 2007 69
6. THE HERMES MODEL AND THE BAIA MARE EVENT The HERMES model is a multi- reach channel flow and water quality model, similar to the rivers component of INCA, that can be used for rapid assessment of water quality in accident and emergency situations. For example, the model could have been used as part of the emergency response to the Baia Mare event in Romania when a major discharge of cyanide rich water affected the Somes and Tisza River System (UNEP, 2002). The details of the original version of HERMES for flow and water quality is given by Whitehead and Green (2001). In this study, the model has been modified to simulate cyanide, ammonia, copper, zinc and dissolved oxygen (DO). The Baia Mare event provides a very useful test of the model as this is one of the few events where detailed water chemistry data is available for a river system at key locations. 6.1 Model Flow and Water Quality Equations In order to model water quality it is necessary to first simulate stream flow in all reaches of the river. As in the case of INCA, the first stage of the HERMES model development is to divide the river system into a series of reaches, and these are specified by the user. Reach boundaries can be specified at any distance along the river and can be located, for example, at flow gauging stations, water quality monitoring stations, weirs, tributaries, major discharges or abstraction sites. The model for flow variation in each reach is based on a non-linear reservoir model. The model may be viewed in hydrological flow routing terms as one in which the relationship between inflow, I, outflow, Q, and storage, S, in each reach is represented by the continuity equation:
where S(t) = T(t) * Q(t), T is a travel time parameter, which can be expressed as:
where L is the reach length, m, and V, the mean flow velocity in the reach, m sec-1, is related to discharge, Q, through
where a and b are constants to be estimated from tracer experiments or from theoretical considerations, as above in the INCA study.
dS(t)dt
= I(t) - Q(t) (1)
T(t) = LV(t)
(2)
V(t) = aQ(t)b (3)

INCA Model: Mures River, Romania and Hungary, 2007 70
The water quality model The dynamic water quality model in HERMES is based on a similar mass balance approach, but includes factors to allow for the non-conservative nature of water quality variables. For example, cyanide in the river is a balance between the sources of cyanide and the losses from volatilisation and degradation. The basic mass balance equations required to simulate the behaviour of any variable can be written in differential equation form for a reach as follows:
where: X, refers to the downstream (reach output) concentration mg l-1
U, refers to the upstream (reach input) concentration mg l-1 T, is the reach residence time, which will vary as a function of flow (equations 2 and 3 above) Z, refers to additional sources or sinks affecting the reach.
The differential equations used in the model for cyanide, ammonia, DO and the metals are the same as those used for the INCA model in described in Section 4 above, but the DO is modelled as described by Whitehead and Green (2001). Thus the key processes which affect the water quality are incorporated into the model and the kinetic rate parameters can be specified by the user. The key processes incorporated are volatilisation and degradation of cyanide, ammonia nitrification, degradation (e.g., sedimentation) for the metals and reaeration for DO. The model has been set up to simulate both the Abrud- Aries- Mures River system and also the Baia Mare event. The Baia Mare event is particularly interesting because it represents a real example of a serious pollution event. Also, a substantial database was established in the days and weeks following the pollution event by the Romanian and Hungarian Authorities. In addition, a special monitoring project was undertaken by the UNEP (UNEP report, 2000) as part of their emergency procedures. 6.2 Modelling the Baia Mare Event The Baia Mare event occurred on the 30th January 2000 when a large tailings pond burst and a substantial volume of water containing high concentrations of cyanide was discharged into the Somes River. The pulse of cyanide travelled down the Lapus and Somes River, into the Tisza River and then into the Danube. Concentrations followed a fairly classical decreasing plume shape as concentrations were reduced by dilution, dispersion and decay. However, the levels were well above the Hungarian surface water Category 1 river standard of 0.1 mg/l CN WAD. The data collected provides a good record of the transport of the pollutant along the river and so can be used to test the HERMES model. Figure 6.1 shows the reach structure. The model is set up to run from the discharge point at Baia Mare in Northern Romania down to the border with Hungary at Csenger and then along the Tisza as far as the Hungarian Border with Bulgaria at Sziget. In Figure 6.1, the a and b parameters are given that control the
dX(t)dt
= U(t)T(t)
- X(t)T(t)
Z(t)± (4)

INCA Model: Mures River, Romania and Hungary, 2007 71
water velocity and then the travel distance in each reach given in metres. The velocity matches the observed velocity estimated at 0.66m/sec (UNEP, 2000). The input event is modelled as a sudden discharge that occurred over an eight hour period and high cyanide water is discharged into the river (UNEP Report, 2000). The background flows in the Somes River at this time were approximately 106 m3/sec. Figure 6.2 shows the model response and indicates peak concentrations of about 20 mg/l at the Hungarian border and the levels falling to 1 mg/l at the Bulgarian border. These concentrations match the levels observed in the UNEP Report (2000) as shown in Figure 6.3. Also the velocity and hence travel times for the modelled plume are approximately correct.
Figure 6.1: The Reach Structure for the HERMES Metals Model set up for the Baia Mare Event, giving reach boundary location, a and b parameters, and the distance in metres of each reach.

INCA Model: Mures River, Romania and Hungary, 2007 72
Figure 6.2: Simulation of the Baia Mare Pollution Event in 2000
02468
101214161820
1 6 11 16 21 26 31 36 41 46
Time after release- 8 hr time steps
Cya
nide
con
c. m
g/l Csenger
TunyogmatoicsBalsasTiszalokSzoinokCsongradSziget
Figure 6.3: Observed Cyanide Concentrations at Various Locations along the Somes and Tisza River System An interesting feature of cyanide is that during the degradation process ammonia is released as a natural degradation product. This effect is simulated in INCA-Mine and

INCA Model: Mures River, Romania and Hungary, 2007 73
in Hermes, and Figure 6.4 shows the ammonia concentrations building up along the river. Ammonia also undergoes a chemical reaction and nitrifies to nitrate whilst removing oxygen from the river and producing a DO sag. All of these effects are built into HERMES. The impacts of the Baia Mare event have been simulated taking the ammonia generation, its decay and the impacts on DO into account. Figures 6.4 and 6.5 show the ammonia and DO simulations, and whilst ammonia does increase, it has relatively minor effects on DO. However, this is mainly due to the low temperatures operating during the winter months when the accident happened and lower cyanide degradation rate and ammonia decay rate.
Figure 6.4: Simulated Ammonia Generation Following the Baia Mare Event
Figure 6.5: The Dissolved Oxygen Sag Generated by Nitrifying Ammonia

INCA Model: Mures River, Romania and Hungary, 2007 74
6.3 Modelling a Theoretical Roşia Montană Event Finally, the HERMES model has been set up for the Abrud-Aries-Mures River System to validate the INCA model and to examine the impacts of cyanide decay on dissolved oxygen (DO). Figure 6.6 shows a simulation using the same reach structure as used for INCA-mine but with an extra reach corresponding to the Mures River joining the Tisza River at Szeged. The pulse of pollution travels along the river system and produces similar results to the INCA model with low levels of cyanide at Nadlac at the Hungarian border and in the Tisza. The corresponding ammonia and DO simulations are shown in Figures 6.7 and 6.8, respectively. Note the low concentrations of ammonia in the river due primarily to the high dilution and low decay rates and the corresponding minimal impact on the DO levels. Note that the Baia Mare event is quite different in character from the theoretical Roşia Montană event. Firstly, the input concentrations at Roşia Montană are significantly less and this is very important. At Baia Mare the concentration of the cyanide being deposited into the TMF is very high, at 400 mg/l (UNEP report, 2000). At Rosia Montana the concentrations are approximately 6mg/l CN Total due to cyanide-laden water recycling before discharge, the improved recovery processes, and the legal limits on cyanide concentrations for discharge to TMFs as specified in the EIA Report and EU legislation (10 mg/l CN WAD). Also, the Aries and Mures rivers offer very considerable dilution compared to the Baia Mare situation, with over 595 km of river in which dilution, dispersion and degradation will occur. This will considerably reduce the concentrations in the river as demonstrated by the modelling studies.
Figure 6.6: Cyanide Simulation for a Theoretical Roşia Montană Event
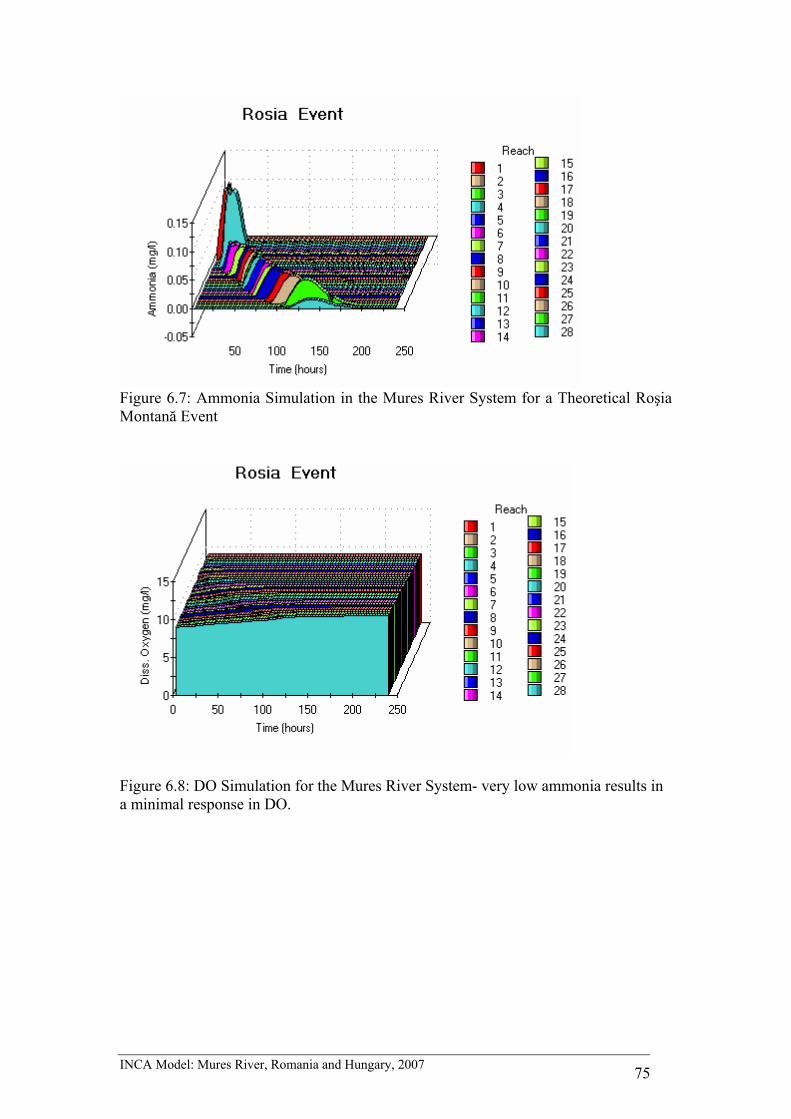
INCA Model: Mures River, Romania and Hungary, 2007 75
Figure 6.7: Ammonia Simulation in the Mures River System for a Theoretical Roşia Montană Event
Figure 6.8: DO Simulation for the Mures River System- very low ammonia results in a minimal response in DO.

INCA Model: Mures River, Romania and Hungary, 2007 76
7. APPLICATION OF MONTE CARLO ANALYSIS TO ASSESS PEAK CYANIDE CONCENTRATIONS. A technique that is often used in water quality studies to assess model uncertainty, or the variability of a determinant of interest, is that of Monte Carlo analysis (Whitehead and Young, 1979, Hornberger and Spear, 1982). A recent analysis package (Crystal Ball, Descioneering, 2006) has been developed that makes use of Monte Carlo analysis to simulate the behaviours of any set of equations that can be represented as a spreadsheet model. This approach has been used by Skeffington and Whitehead (2006) to assess the impacts of pollutants on aquatic systems making use of Critical Load equations linked to Monte Carlo analysis. Also, the approach has been used to assess the most important parameters controlling pollutant behaviour (Skeffington and Whitehead, 2006). Crystal Ball has been used in this study to assess the peak concentrations of cyanide subject to natural variability and uncertainty in rivers. These uncertainties arise from varying velocities, varying mixing and dispersion processes and uncertainty associated with the cyanide degradation rates. Chapra (1997) utilises the second order dispersion equation to model pollutant transport and an analytical solution of this for the concentration of a point source pollutant is:
ktEtUtx
p eEt
mtxc
−−
−=
2
4)(
2),(
π (1)
Where c is the pollutant concentration at distance, x, down the river and at time, t. E is the longitudinal dispersion coefficient m2/sec, U is the velocity m/sec, k is the decay rate, days-1, and mp is the pollutant mass discharged expressed as a plane source gm/ m2 (Chapra, 1997). The equation can also be solved to give the peak concentrations of the pollutant as follows:
Ukxp eUEx
mtxc /
/2),( −=
π (2)
Equation 2 can be set up to for a river system and used to predict the peak concentrations at key locations along the river system. With this model set up as a spreadsheet, Crystal Ball can then be used to assess variability subject to uncertainty in the velocity, U, the dispersion, E, and the degradation, k.

INCA Model: Mures River, Romania and Hungary, 2007 77
The equation 2 has been set up to simulate the Abrud- Aries- Mures River system and to model the peak cyanide concentrations at key sites along the river given the theoretical 1a discharge event described in Section 5 above. The concentration calculations also need to be modified to take into account the dilution along the river system, and this is obtained using the ratio of the catchment areas to determine the dilution effects. The difficulty with using any dispersion model is estimating the dispersion coefficient E. There are no measured values for the Abrud, Aries or Mures Rivers, and hence, it is necessary to estimate dispersion E using empirical equations such as those obtained by Kashefipour and Falconer (2002). This analysis has been undertaken for the river system and estimated values of E range from 60 to 160 m2/sec. The Monte Carlo analysis depends on setting up the inputs as distributions and using a random number generator to create values drawn from the distributions. These values are fed into the model (equation 2) and the output peak concentrations calculated for each simulation and saved. This is repeated for 5000 simulations each time using a different set of values. The final set of 5000 simulations are analysed statistically to calculate mean values, ranges and distributions of behaviour. Figures 7.1 and 7.2 give the distributions for the velocity and the dispersion coefficient and Figures 7.3 and 7.4 give the Monte Carlo output distributions for the peak concentrations at Nadlac and Szeged, where the Mures joins the Tisza River, based on 5000 simulations. The results show that peak cyanide concentrations for the 1a scenario (see section 5) at Nadlac and Szeged are low, with a spread of concentrations from about 0.005 to 0.01mg/l of cyanide. As applied to the Rosia Montana Project, the Study confirms the sensitivity of the INCA model and that because of dilution, dispersion and degradation, the cyanide and metal concentrations would be below the standards required by the Hungarian environmental protection legislation at the border and in the River Tisza downstream. Thus the analysis supports the earlier results of the INCA modelling, which shows low values of cyanide at the Hungarian border even if there were a worse-case dame failure scenario at Rosia Montana. Importantly the Monte Carlo simulation shows the spread of behaviours given the inherent complexity of rivers, flow, dispersion and chemical processes, all of which interact to make the modelling of river systems a complex and difficult procedure.
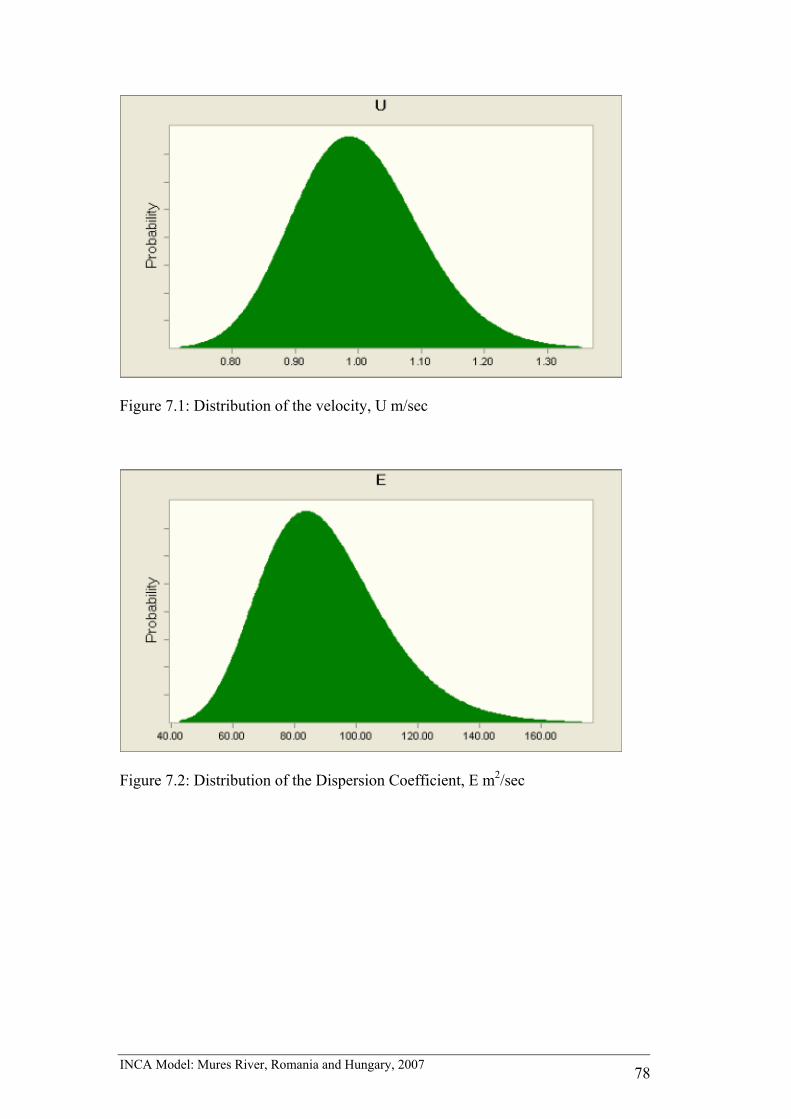
INCA Model: Mures River, Romania and Hungary, 2007 78
Figure 7.1: Distribution of the velocity, U m/sec
Figure 7.2: Distribution of the Dispersion Coefficient, E m2/sec

INCA Model: Mures River, Romania and Hungary, 2007 79
Figure 7.3: Simulated Peak Cyanide Concentrations at Nadlac, Hungarian Border, mg/l
Figure 7.4: Simulated Peak Cyanide Concentrations at Szeged in the River Tisza, mg/l

INCA Model: Mures River, Romania and Hungary, 2007 80
8 CONCLUSIONS This report provides an analysis of the water quality of the upper catchments of Roşia Montană and an analysis of the impacts of future mining and collection and treatment operations. It was designed to determine river water quality downstream of the proposed Rosia Montana Project from two different perspectives:
1. Assessing the beneficial impacts of the clean up of past (“historical”) mining pollution resulting from the operation of the Rosia Montana Project (RMP). 2. Assessing the potential impacts resulting from worst case scenario pollution events from the RMP.
INCA-Mine has been applied to the four upper catchments at Roşia Montană, as well as the complete river system down to the Hungarian border, and from there onwards to the Tisza accounting for dilution effects only. The model has been used to assess the impacts of the collecting and treating the existing pollution sources as part of the project and shows that significant improvements in water quality in the downstream rivers will be achieved. The result of a European research effort, the INCA Model-- short for INtegrated CAtchment Model-- is a dynamic computer model that predicts water quality in rivers. INCA-Mine simulates water quality linked to mining. The model has been applied to the Rosia Montana catchments and the Abrud-Aries-Mures-Tisza River System downstream. The modelling is included in the EU project EUROLIMPACS as a case study of the impacts of environmental change on metals in European Rivers (www.eurolimpacs.ucl.ac.uk ). INCA simulates the day to day variations in flow and water quality, including cadmium, lead, zinc, mercury, arsenic, copper, chromium, manganese, ammonia and cyanide. The steps taken to conduct the modelling include:
1. Integrating hydrological and water quality data. 2. Simulating the key hydrological and chemical pathways and processes in the
catchments. 3. Simulating the rivers Abrud-Aries-Mures from Abrud to Nadlac at the
Hungarian Border with dilution calculations onto the Tisza. 4. Using the model to predict the improvements in water quality following the
control and clean up of existing (“historic”) pollution. 5. Predicting the likely impacts of accidental discharges on water quality
downstream.
This study employs both the INCA and HERMES models, with inputs to simulate Rosia Montana conditions, and then assesses those findings using Monte Carlo analysis.

INCA Model: Mures River, Romania and Hungary, 2007 81
KEY RESULTS Against the two objectives described above, the Study reports these key findings: REMEDIAL IMPACT OF THE ROSIA MONTANA PROJECT The RMP will remove the majority of the Rosia Montana and Corna sources of historic Acid Rock Drainage that currently pollute the rivers systems with metals such as cadmium, lead, zinc, arsenic, copper, chromium and manganese. WORST-CASE IMPACT ASSESSMENT Under worst case scenarios for Dam Failure, the INCA model shows that, with over 595 km of river between the RMP and the Hungarian Border, there is considerable dilution and dispersion in the Aries, Mures and Tisza River Systems. Cyanide concentrations would be below the Hungarian water quality standard for cyanide for Category 1 rivers (0.1mg/l CN WAD) before it crosses into Hungary. For the case of the comparison with Baia Mare – the cyanide levels would by in line with the Romanian, EU and Hungarian drinking water standards well before the Mures river crosses into Hungary (0.05mg/l CN Total). Impact of RMP on Historic Pollution There is a significant improvement in water quality after the collection and treatment of the mine discharges. Table 5.5 shows more clearly the improvements as it gives the percentage reductions in load down the system. The reductions are significant, with reductions averaging 60%, but in some cases -- such as for zinc -- much higher. This reflects the effectiveness of the metals removal process in the Waste Water Treatment Facility. Figure 5.3 shows a range of metals for every reach down the system on an average flow condition day. The before and after cleanup simulated concentrations show a significant reduction in most metals. Impact of RMP, Worst Case Analysis A key question is the impact of cyanide and metal pollution in the event of an accidental discharge from the tailings dam. This effect has been simulated and it is shown that because of dilution, dispersion and degradation that cyanide and metal concentrations will be below the standards for water quality. The study notes that the low level of CN is perhaps expected, as the new EU Directive on Mine Waste Management stipulates CN WAD must be below 10 mg/l before the tailings may be deposited into a TMF. As a result, any TMF failure would begin with far lower levels of CN, even before dilution, dispersion and degradation has its effect on the 595 km of river downstream before the river crosses the Hungarian border. Finally, the 2000 Baia Mare experience is asserted by some as a reason for concern relating to the impact of a worst case scenario at the Rosia Montana.
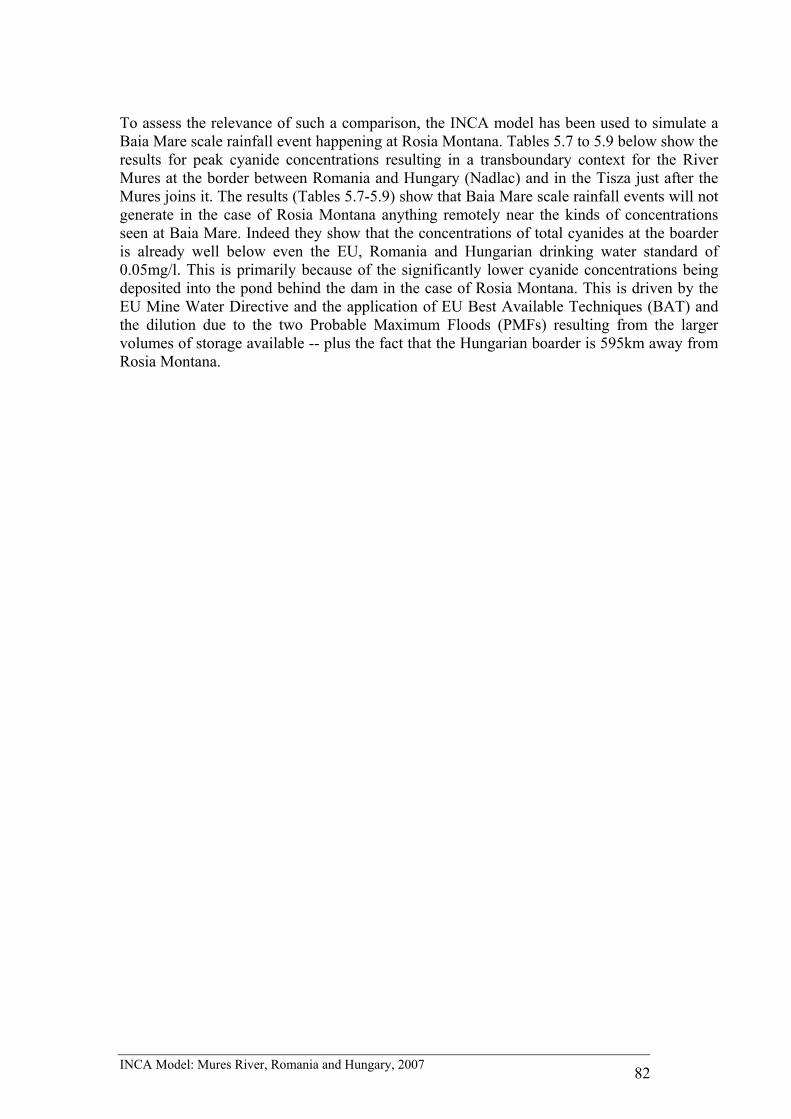
INCA Model: Mures River, Romania and Hungary, 2007 82
To assess the relevance of such a comparison, the INCA model has been used to simulate a Baia Mare scale rainfall event happening at Rosia Montana. Tables 5.7 to 5.9 below show the results for peak cyanide concentrations resulting in a transboundary context for the River Mures at the border between Romania and Hungary (Nadlac) and in the Tisza just after the Mures joins it. The results (Tables 5.7-5.9) show that Baia Mare scale rainfall events will not generate in the case of Rosia Montana anything remotely near the kinds of concentrations seen at Baia Mare. Indeed they show that the concentrations of total cyanides at the boarder is already well below even the EU, Romania and Hungarian drinking water standard of 0.05mg/l. This is primarily because of the significantly lower cyanide concentrations being deposited into the pond behind the dam in the case of Rosia Montana. This is driven by the EU Mine Water Directive and the application of EU Best Available Techniques (BAT) and the dilution due to the two Probable Maximum Floods (PMFs) resulting from the larger volumes of storage available -- plus the fact that the Hungarian boarder is 595km away from Rosia Montana.

INCA Model: Mures River, Romania and Hungary, 2007 83
9 REFERENCES Beven, K.J.2001, Rainfall-Runoff Modelling: The Primer, Willey, Chichester Bernal, S., Butturini, A., Riera, J.L., Va´zquez, E., Sabater, F., 2004.Calibration of the INCA model in a Mediterranean forested catchment: the effect of hydrological inter-annual variability in an intermittent stream. Hydrol. Earth Syst. Sci. 8 (4),729-741 Birkenshaw, S. J. and Ewen, J., 2000. Nitrogen transformation component for SHETRAN catchment nitrate transport modelling. J. Hydro., 230 (1-2), 1-17. Botz, M. and Mudder, T. (2001) Modelling of Natural Cyanide Attenuation in Tailings Impoundments, Chapter 3 The Cyanide Compendium Mining Journal Books Ltd., London, UK Chapra, S. 2000 Surface Water Quality Modelling, McGraw-Hill, pp342 Cosby, B.J., Wright, R.F., Hornberger, G.M. and Galloway, J.N. 1985a Modelling the effects of acid deposition: assessment of lumped parameter model of soil and water and stream chemistry, Water Resour. Res., 2 (1) 54-63. 1985a. Cosby, J.B., Wright, R.F., Hornberger, G.M. and Galloway, J.N. 1985b Modelling the effects of acid deposition: estimation of long term water quality responses in a small forested catchment Water Resour. Res., 21 (11) 1591-1601. 1985b. EU 2000 Report on the Investigation of the Baia Mare Accident, Available from http://www.reliefweb.int/library/documents/eubaiamare.pdf Flynn, N. J., Paddison, T. and Whitehead, P. G., 2002. INCA Modelling of the Lee System: strategies for the reduction of nitrogen loads. Hydrol. Earth Syst. Sci., 6 (3), 467-483. Fennessy, M.S. and Mitsch, W.J. 1989a Design and use of wetlands for renovation of drainage from coal mines. In Ecological Engineering: An introduction to Ecotechnology. W.J. Mitsch and S.E. Jørgensen (eds). John Wiley and Sons, New York.
Fennessy, M.S. and Mitsch, W.J. 1985b Treating coal mine drainage with and artificial wetland. Res. J. Water Pollut. Contr. Fed. 61, 1691-1701. Flanangan, N.E., Mitsch, W.J. and Beach, K. 1994 Predicting metal retention in a constructed mine drainage wetland. Ecological Engineering, 135-159
Hall, G., Swash, P. and Kitilainen, S. 2005 The importance of biological oxidation of iron in the aerobic cells of the Wheal Jane Pilot Passive Treatment System. Sci. Tot. Environ., Sci. Totl. Env., Vol. 338 pp 53-67
Hall, G.H. and Puhlmann, T. 2005 Spatial distribution of iron oxidation in the aerobic cells of the Wheal Jane pilot passive treatment plant. Sci. Tot. Environ., Sci. Totl. Env., Vol. 338 pp 76-73

INCA Model: Mures River, Romania and Hungary, 2007 84
Hornberger, GM and Spear, RC 1980 Eutrophication in Peel Inlet-I. The Problem-Defining Behaviour and a Mathematical Model for the Phosphorus Scenario Water Research 14 (1), p 29-42 International Commission for the Protection of the Danube River 2003 TNMN Yearbook Classification Standards for the Danube River and Tributaries
Jaffe, P.R., Sookyun, W., Kallin, P.L. and Smith, S.L.(2002) The dynamics of arsenic in saturated porous media: fate and transport modelling for deep aquatic sediments, wetland sediments and groundwater environments, The geochemical society Special publication No.,7, 379-397.
Johnson, D.B. and Hallberg, J.2005 Biogeochemistry of the Compost Bioreactor Components of a Composite Acid Mine Drainage Passive Remediation System. Sci. Tot. Environ., Sci. Totl. Env., Vol. 338 pp 73-81 Jarvie, H. P., Wade, A. J., Butterfield, D., Whitehead, P. G., Tindall, C. I., Virtue, W. A., Dryburgh, W. and McGraw, A., 2002. Modelling nitrogen dynamics and distributions in the River Tweed, Scotland: an application of the INCA model. Hydrol. Earth Syst. Sci., 6 (3), 433-453. Kashefipour S. M. and Falconer R.A. 2002 Longitudinal Dispersion in Natural Channels, Water Res., 36(6), 1596-1608 Limbrick, K.J., Whitehead, P.G., Butterfield, D. and Reynard, N., 2000. Assessing the Potential impact of climate change scenarios on the hydrological regime of the River Kennet at Theale, Berkshire, South-Central England, UK: An application and evaluation of the new semi-distributed model, INCA, Science of the Total Environment, Vol. 251/252 pp 539-556
Mudder, T., M. Botz and A. Smith (2001) Chemistry and Treatment of Cyanidation Wastes, 2nd Edition, Mining Journal Books Ltd., London, UK
Mudder, T. and M. Botz, (2001) The Cyanide Compendium Mining Journal Books Ltd., London, UK
Meteorological Office(1981) The MORECS System, Hydrological Memorandum, No 45, pp 91
Meeus J. 1991. Astronomical algorithms. Richmond, Va.: Willmann-Bell. ISBN 0943396352 MWH Inc., Mining Group. 2006. Hydrogeology Baseline Report. Prepared for S.C. Roşia Montană Gold Corporation, pp. 31 Mitsch, W.J., Bosserman, R.W., Hill Jr, P.L. and Smith, F.1981 Models of wetlands amid surface coal mining regions of Western Kentucky. In: Energy and Ecological Modelling. W.J. Mitsch, R.W. Bosserman and J. Klopatek (eds). Elsevier, Amst. 103-113.

INCA Model: Mures River, Romania and Hungary, 2007 85
Mitsch, W.J., Taylor, J.R. and Benson, K.B. 1983 Classification, modelling and management of wetlands – a case study in Western Kentucky. In: Analysis of ecological systems, State of the art in ecological modelling. W.K. Lauebroth, G.V. Skogerboe and M. Flug (eds). Elsevier, Amst. Mitsch, W.J. and Wise, K.M. 1998 Water quality, fate of metals and predictive model validation of a constructed wetland treating acid mine drainage. Wat. Res. 32 (6), 1888-1900. Pourbaix, M. 1974 Atlas of electrochemical equilibira in aqueous solutions. NACE, Cebelcor. Pergamon Press Ltd, UK. Simovic, L, W.J. Snodgrass, K.L. Murphy and J.W. Schmidt, December, 1984, Development of a Model to Describe the Natural Degradation of Cyanide in Gold Mill Effluents, Conference on Cyanide and the Environment, Tucson, Arizona, pp. 413-432. Skeffington, R.A., Whitehead, P.G. and Abbott, J.2006 Uncertainty in mass balance critical loads: Application to a sensitive site, Biogeochemisty. 169, 25-46 Thornthwaite CW. 1948. An Approach toward a Rational Classification of Climate. Geographical Review 38:55-94. UNEP 2000, Cyanide Spill at Baia Mare Romania, Report of the UNEP/OCHA Assessment Mission, Geneva, pp175 Wade, A.J., Durand, P., Beaujouan, V., Wessels, W., Raat, K., Whitehead, P.G., Butterfield, D., Rankinen, K. & Lepistö, A. 2002. A nitrogen model for European catchments: INCA, new model structure and equations. Hydrology and Earth System Sciences 6(3): 559-582.
Wade, A. J., Whitehead, P. G. and Butterfield, D. (2002) The Integrated Catchments model of Phosphorus dynamics (INCA-P), a new approach for multiple source assessment in heterogeneous river systems: model structure and equations, Hydrology and Earth Systems Sciences, 6, 583-606.
Wade, A. J., Hornberger, G. M., Whitehead, P. G., Jarvie, H. P. and Flynn, F., 2002. On modelling the mechanisms that control in-stream phosphorus, macrophyte and epiphyte dynamics: an assessment of a new model using General Sensitivity Analysis. Water Resources. Res., 37, 2777-2792.
Whitehead, P.G. 1979, Water quality in river systems: Monte Carlo Analysis, Water Resources Research, vol.15, no.2, pp. 451-459.
Whitehead, P.G., Hornberger, G., Black, R. 1979, Effects of parameter uncertainty in a flow routing model, hydrological sciences bulletin, vol.24, pp. 441-460. Whitehead, P.G., Young, P.C., Hornberger, G.E.1979, A systems model of flow and water quality in the Bedford Ouse River System: Part 1, Streamflow Modelling, Water Research, vol.13, pp. 15.

INCA Model: Mures River, Romania and Hungary, 2007 86
Whitehead, P.G., Beck, M.B., O’Connell, P.E. 1981, A system model of flow and water
quality in the Bedford Ouse River System: Part 2, Water Quality Modelling, Water Research, vol.15, pp. 1157-1171.
Whitehead P.G. Green C. 2001 The Hermes Model for Water Quality Modelling,
University of Reading Report, Dept of Geography, pp 45
Whitehead P. G., Williams R. J., Hornberger G. M. 1986 On the Identification of Pollutant or Tracer Sources Using Dispersion Theory, Journal of Hydrology, 84, 1986, pp 273 - 286.
Whitehead, P. G. and Hornberger, G. M., 1984. Modelling algal behaviour in the River Thames. Water Res., 18, 945-953. Whitehead, P. G., Wilson, E. J. and Butterfield, D., 1998a. A semi-distributed Nitrogen Model for Multiple Source Assessments in Catchments (INCA): Part 1 - Model Structure and Process Equations. Sci. Total Env., 210/211, 547-558. Whitehead, P. G., Wilson, E. J., Butterfield, D. and Seed, K., 1998b. A semi-Distributed Integrated Flow and Nitrogen Model for Multiple Source Assessment in Catchments (INCA): Part II Application to large River Basins in South Wales and Eastern England. Sci. Total Env., 210/211, 559-583. Whitehead, P.G., Lapworth, D.J., Skeffington, R.A. and Wade, A.J., 2002. Excess nitrogen leaching and c/n decline in the Tillingbourne Catchment, Southern England: inca process modelling for current and historic time series. Hydrol. Earth Syst. Sci., 6, 455-466. Whitehead, P.G., Johnes, P.J. and Butterfield, D. 2002 Steady State and Dynamic modelling of nitrogen in the River Kennet: Impacts of land use change since the 1930s. Sci. Tot. Env., vol. 282-283 pp. 417-435.
Whitehead, P.G. and Jeffrey, H. 1995 Heavy Metals from Acid Mine Drainage - impacts and modelling strategies, IAHS Pub. No. 230, 55-68. 1995.
Whitehead P. G., Caddy D. E., Templeman R. F. 1984 An On-Line Monitoring, Data Management and Forecasting System for the Bedford Ouse River Basin, Water Science Research, Vol. 16, pp 295 - 314. Whitehead, P.G., Cosby, B.J. and Prior, H. 2005 The Wheal Jane Wetlands Model for Bioremediation of Acid Mine Drainage, Sci. Totl. Env., Vol. 338 pp 115-125

INCA Model: Mures River, Romania and Hungary, 2007 87
STATEMENT OF LIABILITY Note that the University of Reading has used all reasonable endeavours to ensure the accuracy of the work performed and any information given. The University makes no warranty, expressed or implied, as to the accuracy of the information used in the study. The University will not be held responsible for any consequence arising out of any inaccuracies or omissions.
The parties agree that the obligations of the University and its agents shall cease upon delivery of the report and that no liability whatsoever either direct or indirect shall rest upon them for the effects of any product, process or action that may be produced, adopted and/or undertaken by any other party.
Neither shall the university or its agents be liable for any death or injury sustained as a result of the research results presented in this report.
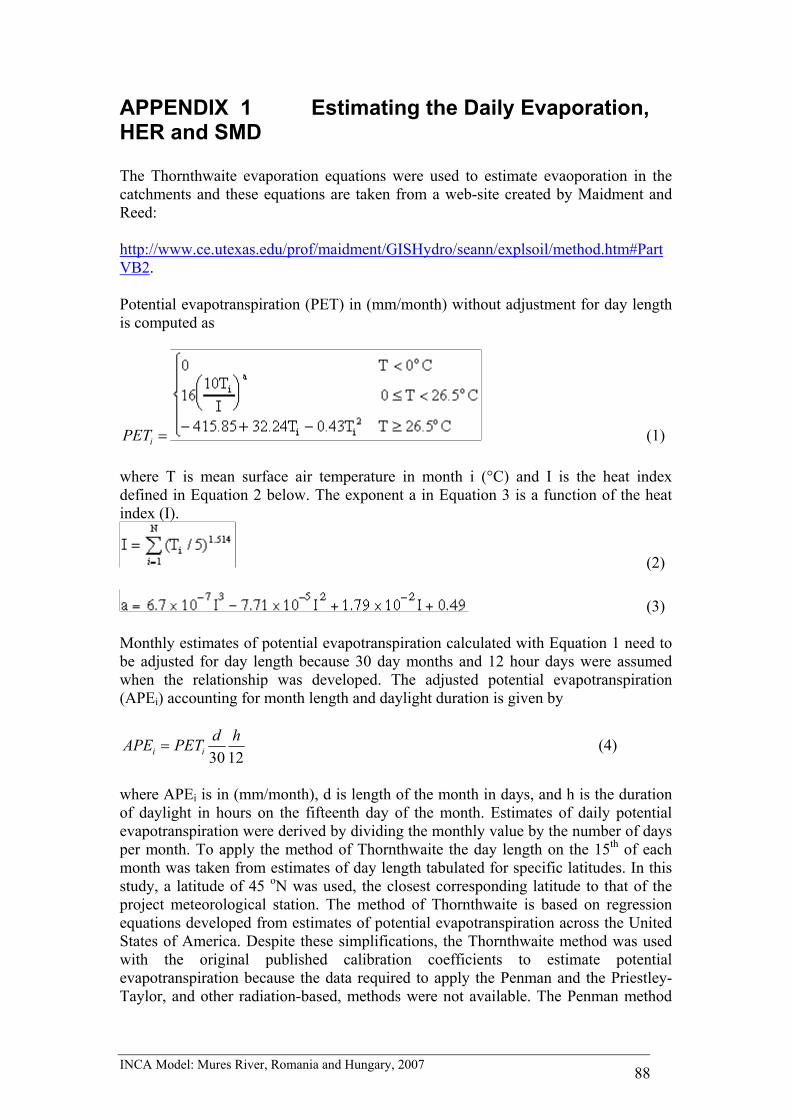
INCA Model: Mures River, Romania and Hungary, 2007 88
APPENDIX 1 Estimating the Daily Evaporation, HER and SMD The Thornthwaite evaporation equations were used to estimate evaoporation in the catchments and these equations are taken from a web-site created by Maidment and Reed: http://www.ce.utexas.edu/prof/maidment/GISHydro/seann/explsoil/method.htm#PartVB2. Potential evapotranspiration (PET) in (mm/month) without adjustment for day length is computed as
=iPET (1) where T is mean surface air temperature in month i (°C) and I is the heat index defined in Equation 2 below. The exponent a in Equation 3 is a function of the heat index (I).
(2)
(3) Monthly estimates of potential evapotranspiration calculated with Equation 1 need to be adjusted for day length because 30 day months and 12 hour days were assumed when the relationship was developed. The adjusted potential evapotranspiration (APEi) accounting for month length and daylight duration is given by
1230hdPETAPE ii = (4)
where APEi is in (mm/month), d is length of the month in days, and h is the duration of daylight in hours on the fifteenth day of the month. Estimates of daily potential evapotranspiration were derived by dividing the monthly value by the number of days per month. To apply the method of Thornthwaite the day length on the 15th of each month was taken from estimates of day length tabulated for specific latitudes. In this study, a latitude of 45 oN was used, the closest corresponding latitude to that of the project meteorological station. The method of Thornthwaite is based on regression equations developed from estimates of potential evapotranspiration across the United States of America. Despite these simplifications, the Thornthwaite method was used with the original published calibration coefficients to estimate potential evapotranspiration because the data required to apply the Penman and the Priestley-Taylor, and other radiation-based, methods were not available. The Penman method

INCA Model: Mures River, Romania and Hungary, 2007 89
requires air temperature, relative humidity, wind speed and solar radiation, and the Priestley-Taylor method requires radiation and ground dryness. For the period 01/09/2003 to 31/12/2004, flow data are available continuously bar 3 days in the Corna valley. The estimated evapotranspiration using the Thornthwaite method for this period is 410 mm. This compares to a difference between annual precipitation and runoff of 655 mm for the same period in Corna. Thus, the calculated potential evapotranspiration may be an under estimate. The difference of 245 mm between the estimated potential evapotranspiration and the difference between precipitation and runoff may be due to percolation to the underlying rocks. The solid geology of the four catchments outside the mine area is dominated by Black shale which is comprised of interbedded shales and sandstone; the upper shales are moderately water bearing. The alluvium may also store water. The under-estimation of potential evapotranspiration has two implications, Firstly, the mean daily flows might be larger than expected and thus the modelled results would imply a bigger flood wave derived from catchment. Secondly, more water would be available to dilute a point source injection of contaminant than might be expected in reality. The actual evapotranspiration, AET (mm) for the xth day was estimated as follows based on the approach of Bernal et al. (2004): AETx = SMDMAX-SMDx-1+Px if PETx > SMDMAX-SMDx-1+Px AETx = PETx if PETx ≤ SMDMAX-SMDx-1+Px (5) where PET is the potential evapotranspiration (mm), SMDMAX is the estimated maximum soil moisture deficit (mm) and P is the observed daily precipitation (mm). In this application, a SMDMAX of 10 cm was assumed based on the observation of Thornthwaite (1948) that ‘except in areas of shallow soil the water storage capacity available to mature plants with fully developed root systems varies around a mean that is equivalent of about 10 centimetres or 4 inches of rainfall’. The daily soil moisture deficit (SMD, mm) was estimated for the xth day as: SMDx = 0 if Px ≥ PETx-SMDx-1 SMDx = Min(SMDx-1-PETx-Px, SMDMAX) if Px < PETx-SMDx-1 (6) The Hydrologically Effective Rainfall (HER) for the xth day is calculated as follows: HERx = Px-SMDx-1-AETx if Px > SMDx-1 + AETx HERx = 0 if Px ≤ SMDx-1 + AETx (7) Soil moisture deficit and hydrologically effective rainfall time-series data were created for the four upper catchments.