a visual computer interface concept for making error ... visual computer interface concept for...
TRANSCRIPT

A Visual Computer Interface Concept for Making Error Reporting Useful at the Point of Care Ranjit Singh, MA, MB, BChir (Cantab.), MBA; Wilson Pace, MD; Ashok Singh, MA, MB, BChir (Cantab); Chester Fox, MD; Gurdev Singh, MScEng, PhD (Birm)
Abstract Reports on errors can be a rich source for understanding their causes, cascades, and consequences, leading to interventions for improvement. There are national and international calls for the development of appropriate error reporting and taxonomy systems that are useful at the point of care. The current momentum and urgency for these developments present an opportunity to harness the benefits of computer visualization that helps structure and illustrate the “story” of an error. This visualization process could help overcome the shortcomings of current reporting methods and could aid in creating an unambiguous international error taxonomy. We present a concept for a visual error reporting interface. The ambulatory care domain is used for illustration. The system has the potential to provide a user friendly, efficient means of reporting errors. Errors reported in this way would populate a “visual database,” providing the ability to disseminate patient safety information in a straightforward, structured format that will be useful to a variety of stakeholders.
Introduction A huge chasm exists between the potential and actual quality of care delivered by the health care industry. In the United States, this chasm appears to be consistently wide across the Nation and the spectrum of care delivery venues.1
Creation of a culture of safety is a critical first step for health care organizations that wish to improve quality and safety.2 One of the steps in developing a culture of safety is the recognition by staff and clinicians of errors that occur on a regular basis.3 One of the primary drivers to achieve this recognition is error reporting. Reporting systems need to be safe (i.e., free from blame), easy, and worthwhile.4, 5 Error reports can be a rich source for uncovering errors, and through further study, can lead to an understanding of causes, cascades, and consequences of errors, in turn leading to the design of interventions for improvement.
Error reports represent the “tip of the iceberg,” as only a small fraction of errors are typically reported, and the information contained in the reports is limited to what reporters perceive and are willing to share. Other methods of analysis, which may be based on error reports, include failure modes and effects analysis, root cause analysis, chart review, and direct observation. These are needed to provide a more complete assessment of risks within an organization. Error
1

reporting is nevertheless an important modality and should be seen as complementary to the other approaches.
In the United States, the Patient Safety and Quality Improvement Act of 20056 was intended to encourage and facilitate error reporting. The Act calls for the formation of Patient Safety Organizations (PSOs) that can safely collect and analyze data on medical errors without the legal risk of discovery. In conjunction with the president’s 2004 call for national implementation of electronic medical records (EMRs) and the creation of the office of the National Coordinator for Health Information Technology, PSOs will be asked to pool their deidentified data, which should support the creation of searchable electronic databases of errors that are secure, involve low medico-legal risk, and can be analyzed and used to develop systemic solutions to health care safety problems.7
The collation of error reports into central databases can be useful at two levels. First, and currently the focus of most efforts, is the regional, national, or international level, which we shall refer to as the “macro-system level.” These pooled databases have the potential to receive large numbers of reports and, therefore, might be able to detect infrequent errors and track trends in reporting frequencies over time. In addition, since a large number of providers will, it is hoped, submit data, the publication of summary statistics will not compromise the confidentiality of individual providers. In the United States, legislation will help protect these data from medico-legal discovery.6
One difficulty with error analysis at the macro-system level is that the generalizations made about national data might not apply (or, be perceived by individual physicians not to apply) to individual practices or hospital floors. The Director of the Agency for Healthcare Research and Quality (AHRQ) has emphasized that quality and safety information needs to be made useful at the point of care to patients and health care providers.8 Similarly, the United Kingdom’s House of Commons Committee of Public Accounts, in its report “A safer place for patients: Learning to improve patient safety,” calls for a unified and convenient form for reporting and a taxonomy that encourages feedback on solutions to specific patient safety incidents.9 Therefore, in addition to macro-system level data, individual practices/health care sites and organizations need local “micro-system level” information that is directly relevant to them and can be used internally to drive safety improvement. Such information, reported internally for quality and safety improvement purposes, potentially has more legitimacy in the eyes of local staff and clinicians in any health care setting.
The overall purpose of our work is to develop and test a concept for a visual medical error taxonomy, built on visual reporting, that can provide for both macro-system and micro-system level needs. Figure 1 depicts the overall concept in which error reporting at the micro-system level is used internally for safety improvement, as well as being fed seamlessly to a regional, national, or international database that is used to study the epidemiology of errors and to generate alerts. The purpose of this paper is to present the concept of visual reporting. Before presenting this concept, it will be helpful to describe the framework of the error taxonomies that have to be populated by the proposed visual reports.
2

E
Figure 1. Overview of the concept for visual taxonomy and reporting. Adapted from Singh R, Pace W, Singh S, et al. A concept for a visual computer interface to make error taxonomies useful at the point of primary care. Infomat Prim Care 2007; 15:221-229.
Error Taxonomies Error Taxonomies A number of error taxonomies have been and are being developed to organize and classify error reports. The Institute of Medicine’s (IOM) report “Patient Safety: Achieving a New Standard for Care”10 calls for the development of an event taxonomy. The Joint Commission has proposed a taxonomy11 and is working with the World Health Organization (WHO) to establish a common international system for classification.12 The International Primary Care Patient Safety Taxonomy Steering Committee has given itself the important and necessary task of developing “a primary care taxonomy for patient safety, embedded in the International Classification of Primary Care (ICPC-2) and in an episode of care structure, that can operate across settings and vendors, and that maps to other standards and data structures.”13
A number of error taxonomies have been and are being developed to organize and classify error reports. The Institute of Medicine’s (IOM) report “Patient Safety: Achieving a New Standard for Care”10 calls for the development of an event taxonomy. The Joint Commission has proposed a taxonomy11 and is working with the World Health Organization (WHO) to establish a common international system for classification.12 The International Primary Care Patient Safety Taxonomy Steering Committee has given itself the important and necessary task of developing “a primary care taxonomy for patient safety, embedded in the International Classification of Primary Care (ICPC-2) and in an episode of care structure, that can operate across settings and vendors, and that maps to other standards and data structures.”13
Current taxonomies are essentially alphanumeric codes that are used to classify and summarize error data (whether at local, regional, national, or international levels) for various purposes including:
Current taxonomies are essentially alphanumeric codes that are used to classify and summarize error data (whether at local, regional, national, or international levels) for various purposes including:
• Communication of information about errors and their characteristics, including causative factors, consequences, and severity (keeping in mind that error reporting alone might be insufficient for fully addressing these issues).
• Communication of information about errors and their characteristics, including causative factors, consequences, and severity (keeping in mind that error reporting alone might be insufficient for fully addressing these issues).
3

• Estimation of frequencies and trends of various error types. • Identification of needs for safety improvement.
While such taxonomies have been used successfully in primary care and other settings, they have some limitations:
• The coding systems are complex and prone to ambiguity. • They do not readily meet the point-of-care needs of patients and health care providers to
understand, within their own unique micro-systems, the causes, cascades, and consequences of the reported errors.
• They do not fully capture the “story.” By reducing an incident to a series of codes, the flavor of the event is lost. It is the “story” that has the greatest potential to contribute to safety improvements.4, 14
• They often differ in the way they define, count, and track events, and they use different terms, data, coding methods, and analysis. This makes it difficult to compare data that have been collected or coded using different taxonomies.
According to the IOM,10 a comprehensive National Health Information Infrastructure must provide information flow across three dimensions: (1) personal health, to support individuals in their own wellness and health decisionmaking; (2) health care providers, to ensure access to clinical decision support systems; and (3) public health, to address and track public health concerns and health education campaigns. Items 1 and 2 correspond to the micro-system level, while item 3 is at the macro-system level. Use of a consistent error taxonomy across these levels is imperative.
The need for a consistent error taxonomy at both micro- and macro-system levels presents an opportunity to harness the benefits of computer visualization. Our experience with visualization suggests that this will help create crosswalks between disparate taxonomies. A very important feature of visualization is that it can help structure and illustrate the “story” of an error or event. The proposed visual taxonomy is coded at four main levels, corresponding to the structure of the visual models:15
• Health care domain. • Process. • Sub-process. • Entity/interaction.
A reported event can consist of one or more errors, together with causes and consequences. Each of these is coded at the above four levels.
Visualization We take the view that visualization is a universal tool that furnishes a natural common “language.” For instance, it is used effectively for international road signs. It respects and aids inductive (as opposed to linear) perception and decisionmaking that is the natural way that the human brain works.16 It can provide:
4

• A fast path to fully engaging the minds of individuals and their teams, including patients. • Insight into causes, cascades, and consequences of errors. • A common vision for teamwork, with the potential for improved outcomes. • An aid for coping with the complexities, fragmentation, and decentralization of the health
care system.2 • An aid for mapping across different taxonomies and data structures.16
Applying a systems engineering/management approach, we have developed visual models at the macro-system and micro-system levels.17
Macro-System Model The macro-system model is a high level view (Figure 2) of the health care system. The processes of care are represented by the radials. These processes are recognized to occur in a cyclical fashion, as shown by the clockwise progression around the circle from Assessment to Plan to Implementation, Feedback, Review & Learn and back to Assessment again.17
These processes in the cycle of care take place in various domains that are depicted by concentric circles. The increasing sizes of the circles depict the enlarging involvement of the system, starting from the patient level at the center to the international health authority level on the outside. The innermost circle represents the patient in his/her own domain (i.e., home/community) and recognizes that this is where most health care actually occurs. International health authorities (e.g., World Health Organization), depicted by the outermost circles, play an important role in devising public health policies that can affect management of patients at all points within the system. Office-based primary care is represented by circle 1. Depending on the system under study, circle 2 might represent the emergency room, and circle 3 might represent the hospital inpatient setting, etc.
The main purpose of this macro-system model is to understand a patient’s care in the context of the overall health care system, especially with respect to errors and opportunities for errors, including errors that may occur in transitions between different parts of the system. This is best illustrated through the use of an example. Suppose a 59-year-old male patient with a long history of hypertension arrives at his primary physician’s office with intermittent atypical chest pain of 2 days’ duration. He is currently having retrosternal burning chest pain.
The scenario therefore begins at point 1A in Figure 2, with the patient in the office setting being assessed by the physician. Based on the history and physical exam, the physician decides to order sublingual nitroglycerine and an EKG; this is the Plan (point 1P). The order is conveyed to the nurse, who gives the patient nitroglycerine, completes the EKG (Implements the Plan, point 1I). The nurse presents the printed EKG to the physician and informs him/her that the patient’s pain did not improve despite three doses of nitroglycerine (this is the Feedback, point 1F). The physician reviews the EKG (point 1R) and notices some T-wave inversion in the inferior leads. The physician goes back into the room to reassess the patient (back to point 1A) and finds that the patient’s chest pain is getting worse (it has been ongoing for 30 minutes), and the patient is diaphoretic. Now the physician decides (point 1P) to transfer the patient to the emergency room for evaluation to rule out acute coronary syndrome (ACS).
5

Figure 2. Macro-system model of health care. Adapted from Singh R, Singh A, Fox C, et al, Computer visualization of patient safety in primary care: A systems approach adapted from management science and engineering. Informat Prim Care. 2005; 13: 135-144.
The patient makes a transition from the office to the emergency room, shown in Figure 2 by the dotted line from point 1P to point 2I. In the emergency room (circle no. 2), similar cycle(s) of care occur, starting with Assessment (point 2A). The patient is treated in the emergency room according to their “rule out ACS” protocol and discharged home after “ruling out.”
The next day, the primary physician receives a copy of the emergency room record (transition back to point 1F) and reviews it (point 1R). He/she is pleased to learn that the patient did well and has been diagnosed with “probable GERD” after responding well to a “GI cocktail” in the emergency room. As the physician reflects on what happened to the patient (also part of the Review & Learn process, point 1R), he/she realizes that he/she missed the opportunity to give the patient aspirin in the office (which he/she should have done, since the patient was not on aspirin, and he/she was entertaining the diagnosis of ACS). Further, the physician considers whether he/she and his/her colleagues should improve their systems for dealing with chest pain patients, perhaps by using a written protocol for managing chest pain in the office. The following week, the patient returns for followup with the primary physician (point 1A) and the cycle continues.
Thus, cycles of care can occur multiple times in one setting and/or involve transitions between settings. The macro-level view aims to provide the “big picture,” so as to facilitate understanding of the processes of care in different interrelated parts of the system and transitions between these parts, helping the user understand interdependencies and the need for information flow.
6

Micro-System Models The micro-system models are close-up views of the system; each may represent one or more points within the macro-system model. For example, one might devise a micro-system model for a specific domain within the macro-system or for a specific process within a domain. These models show how the various entities/agents in the micro-system interact. The level of detail represented in a micro-model depends on the purpose for which it is used.
Figure 3 depicts a micro-system model for medication management in ambulatory settings. It shows activities in the office, pharmacy, home, laboratory, imaging/radiology facility, and third
party payer and the interactions within and between these. Each interaction is shown as an arrow. Errors or safety problems can originate at any one point or at multiple points in the system.
The macro-system and micro-system diagrams are computerized and contain “hyperlinks” that facilitate hierarchical linkage between models and can be used for dynamic data links within databases. For example, any point on the micro-system model can be linked electronically to a table containing relevant data about errors that are known to occur at that point in the system,
Figure 3. Micro-system model of medication management.
7

with details of frequency and consequences of these errors and corrective action recommended or used. These macro- and micro-system models can also provide various other functions that we have described elsewhere.17
A Visual Error Reporting Tool Figure 4 is an example of how a visual reporting tool could be used, based on the same micro-system model shown in Figure 3. To report an error, the user would first describe the patient’s demographic details and enter other information deemed appropriate, such as their job designation, circumstances in which they discovered the error, etc. Then they would commence entering details of the error using the visual interface.
In this case, the error is that the primary doctor (who is reporting this error) refilled the wrong dose of a blood pressure medication by phone. The patient is a 76-year-old female with type 2 diabetes mellitus, hypertension, and coronary artery disease (CAD). She sees her primary doctor every 3 months and is on various appropriate medications, including quinapril 10 mg daily for hypertension. She also sees a cardiologist annually for CAD followup and management. At today’s visit to the primary doctor’s office, the doctor notices that her blood pressure is above goal at 147/90, while it had been well controlled at previous visits (including the most recent visit 3 months ago). Therefore, he/she inquires as to the patient’s compliance with the medication, to which the patient replies “my pressure’s probably up because you cut down my medication dose last time.” The doctor reviews the chart and finds no documented change in any blood pressure medication. He/she inquires further and discovers that at the patient’s previous visit to the cardiologist (8 months earlier), the cardiologist had noted elevated blood pressure and increased the dose of quinapril from 10 mg to 20 mg daily and also prescribed a 6-month supply. Then, 2 months ago, when the patient was running out of quinapril, she called her primary doctor’s office for a refill. The doctor reviewed the chart and instructed the nurse to phone in a prescription for quinapril 10 mg daily, since this was the dose documented in the patient’s chart. There was no consult letter in the chart from her cardiologist. The patient had seen the primary doctor twice since the cardiology visit but apparently had not mentioned the dose change.
Panel 1 of Figure 4 shows how the doctor would indicate the location of the error, which in this case is in the communication (via telephone) between the doctor’s office and the pharmacy. Next, in Panel 2, when presented with a list of possible errors in this step, the reporter picks the relevant item from the list, which in this case was “Wrong dose.” Next, the user chooses to describe the contributing factors. As mentioned earlier, one of these was that the chart did not contain any information from the cardiologist regarding the dose change. The user therefore clicks on the chart and chooses the appropriate item from the list, as shown in Panels 3 and 4. Another contributor was that the patient did not inform the primary doctor about the dosage adjustment; this can be entered in the same fashion.
8

From the list, select the Error that occurred
CascadeConsequences
ErrorsContributors
Patient/Caregiver
Script
Office
Patient/Caregiver Medication
Home
Pharmacist
Patient/Caregiver
Pharmacy
Nurse
Doc
Recept.
Lab
Phone/Fax
Chart
Select Error:Wrong patientWrong medicationWrong doseWrong frequencyWrong routeWrong # of dosesWrong #of refills
StorySeverity
Click onthiserror
Click where the error occurred
CascadeConsequences
ErrorsContributors
Patient/Caregiver
Script
Office
Patient/Caregiver Medication
Home
Pharmacist
Patient/Caregiver
Pharmacy
Nurse
Doc
Recept.
Lab
Phone/Fax
Chart
StorySeverity
Click Here (this iswhere theerroroccurred)
1 2
Contributing factors for Error: Wrong doseClick on the place where a Contributor occurred
CascadeConsequences
ErrorsContributors
Patient/Caregiver
Script
Office
Patient/Caregiver Medication
Home
Pharmacist
Patient/Caregiver
Pharmacy
Nurse
Doc
Recept.
Lab
Phone/Fax
Chart
StorySeverity
Click herefirst
Contributing factors for Error: Wrong doseSelect the Contributor from the list
CascadeConsequences
ErrorsContributors
Patient/Caregiver
Script
Office
Patient/Caregiver Medication
Home
Pharmacist
Patient/Caregiver
Pharmacy
Nurse
Doc
Recept.
Lab
Phone/Fax
Chart
Select Contributor:Missing/inaccurate information:
WeightAllergiesPrescription medsOTC medsPast medical history / Problem listLab valuesConsult reportsPhone messages
Poor chart design:Problem listMedication listAllergy list…. StorySeverity
Click onthiscontributor
3 4
G and R Singh 2001Cascade
ConsequencesErrors
Contributors
Patient/Caregiver
Script
Office
Patient/Caregiver Medication
Home
Pharmacist
Patient/Caregiver
Pharmacy
Nurse
Doc
Recept.
Lab
Phone/Fax
Chart
Consequences of Error: Wrong doseClick on the place where a Consequence occurred
StorySeverity
Click here(where thconsequeoccurred)
ence
StorySeverity
G and R Singh 2001Cascade
ConsequencesErrors
Contributors
Patient/Caregiver
Script
Office
Patient/Caregiver Medication
Home
Pharmacist
Patient/Caregiver
Pharmacy
Nurse
Doc
Recept.
Lab
Phone/Fax
Chart
Select Consequence:Missed medicationUnder-medicationOver-medicationMedication side effects….
Consequences of Error: Wrong doseSelect the Consequence from the list
Click onthisconsequence
G and R Singh 2001Cascade
ConsequencesErrors
Contributors Story
Patient/Caregiver
Script
Office
Patient/Caregiver Medication
Home
Pharmacist
Patient/Caregiver
Pharmacy
Nurse
Doc
Recept.
Lab
Phone/Fax
5 6
G and R Singh 2001Cascade
ConsequencesErrors
Contributors Story
Patient/Caregiver
Script
Office
Patient/Caregiver Medication
Home
Pharmacist
Patient/Caregiver
Pharmacy
Nurse
Doc
Recept.
Lab
Phone/Fax
Chart
Consequences of Error: Wrong dosePlease give a brief story
Severity
The story can be typed into a box like this one
…………
….
Consequences of Error: Wrong doseClick on the Severity level
Severity Level1. ................2. ................ Severity is selected3. ................ from a scale like this4. ................
Chart
Click hereto enter t‘Story’
he
Severity
7 8
Figure 4. Example of interactive error reporting.
9
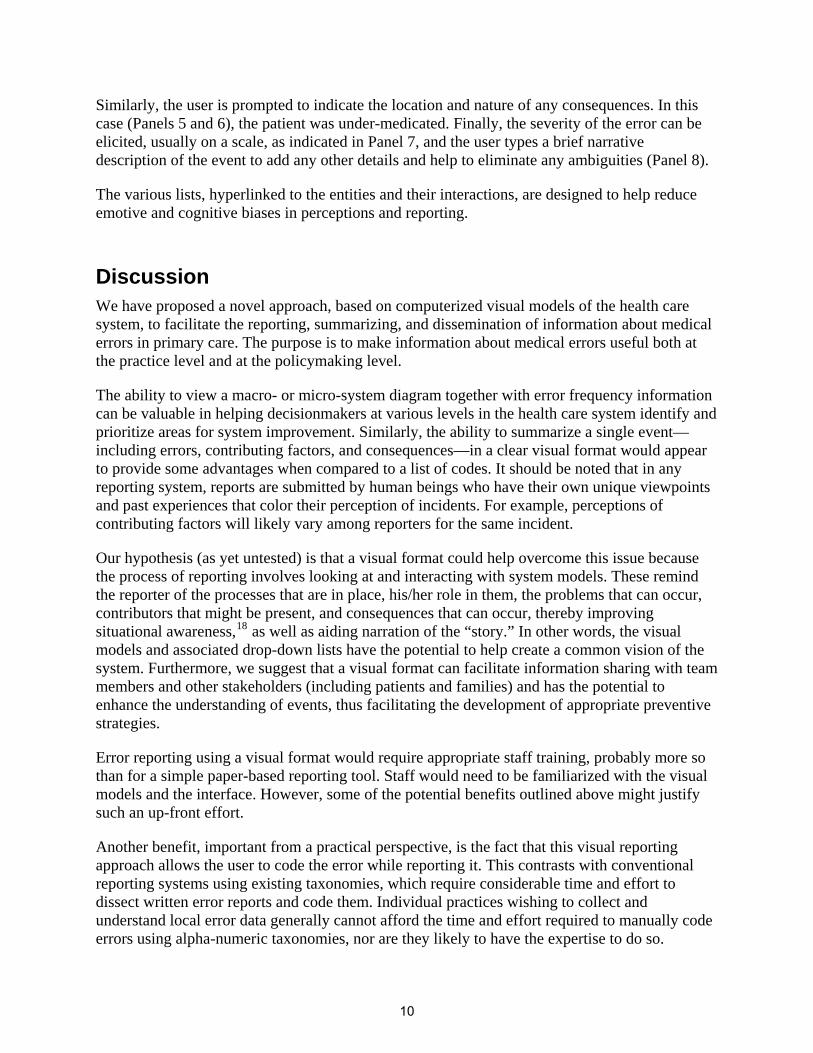
Similarly, the user is prompted to indicate the location and nature of any consequences. In this case (Panels 5 and 6), the patient was under-medicated. Finally, the severity of the error can be elicited, usually on a scale, as indicated in Panel 7, and the user types a brief narrative description of the event to add any other details and help to eliminate any ambiguities (Panel 8).
The various lists, hyperlinked to the entities and their interactions, are designed to help reduce emotive and cognitive biases in perceptions and reporting.
Discussion We have proposed a novel approach, based on computerized visual models of the health care system, to facilitate the reporting, summarizing, and dissemination of information about medical errors in primary care. The purpose is to make information about medical errors useful both at the practice level and at the policymaking level.
The ability to view a macro- or micro-system diagram together with error frequency information can be valuable in helping decisionmakers at various levels in the health care system identify and prioritize areas for system improvement. Similarly, the ability to summarize a single event—including errors, contributing factors, and consequences—in a clear visual format would appear to provide some advantages when compared to a list of codes. It should be noted that in any reporting system, reports are submitted by human beings who have their own unique viewpoints and past experiences that color their perception of incidents. For example, perceptions of contributing factors will likely vary among reporters for the same incident.
Our hypothesis (as yet untested) is that a visual format could help overcome this issue because the process of reporting involves looking at and interacting with system models. These remind the reporter of the processes that are in place, his/her role in them, the problems that can occur, contributors that might be present, and consequences that can occur, thereby improving situational awareness,18 as well as aiding narration of the “story.” In other words, the visual models and associated drop-down lists have the potential to help create a common vision of the system. Furthermore, we suggest that a visual format can facilitate information sharing with team members and other stakeholders (including patients and families) and has the potential to enhance the understanding of events, thus facilitating the development of appropriate preventive strategies.
Error reporting using a visual format would require appropriate staff training, probably more so than for a simple paper-based reporting tool. Staff would need to be familiarized with the visual models and the interface. However, some of the potential benefits outlined above might justify such an up-front effort.
Another benefit, important from a practical perspective, is the fact that this visual reporting approach allows the user to code the error while reporting it. This contrasts with conventional reporting systems using existing taxonomies, which require considerable time and effort to dissect written error reports and code them. Individual practices wishing to collect and understand local error data generally cannot afford the time and effort required to manually code errors using alpha-numeric taxonomies, nor are they likely to have the expertise to do so.
10

Further work is needed to fully operationalize the concepts described here and to evaluate the usability of the visual interface and its potential benefits. In order for the process to be used across health care settings and internationally, it would be necessary to create visual diagrams of other systems. We are beginning to create standardized icons for the whole range of entities in the various settings of the health care system. These would enable interactive creation of micro-system models (potentially by end-users) for any setting.
Figure 5 shows two examples of micro-system models developed for falls and postoperative pain management in a hospital setting. In addition, to facilitate use in a wide variety of settings, this kind of reporting tool should be accessible directly from within electronic medical record systems and should be able to import patient data directly from these records. A recent study19 in the domain of operating theaters demonstrated that integration of an incident reporting system into an electronic patient record significantly increased the number of incidents reported.
While tracking rates of errors over time or comparing rates among different institutions or regions are commonly perceived aims of error reporting systems, caution is needed in interpreting such data because of the problem of underreporting. According to IOM estimates, only about 5 percent of known errors are reported.2 Therefore, differences in rates of errors reported over time or among institutions do not necessarily reflect true differences in rates of errors but may merely represent differences in reporting behavior.
Similarly, and perhaps even more importantly, those errors that are reported most frequently are not necessarily the errors that occur most frequently. They are merely the ones that reporters feel more comfortable reporting.20 It is hoped that creating more user-friendly and intuitive reporting tools, such as the one described here, will help increase reporting rates and so, provide more opportunities to learn. However, this needs to be done in concert with changes in organizational culture21 that encourage reporting and learning from errors and discourage blame and punishment for errors that are due to systemic problems. In other words, a shift from the prevailing culture of blame to a culture of safety is called for.
11

Resident
Attending
Consultantpsychologist
Knowledge and Info
The Post-Operative TEAMRN
Support
Tech.
Chart
Results of Diagnostic StudiesLAB, X-Ray, MRI, CAT
Vital signs-including pain
PoliciesProtocolsGuidelines
PhysioTherapist
Nutrition/administration
pharm
Macro-Link
Figure 5. Examples of micro-system models for inpatient falls (top) and for postoperative pain management (bottom). Adapted from Singh R, Naughton B, Anderson D, et al. Building self-empowered teams for improving safety in postoperative pain management. In press.
12

Author Affiliations State University of New York at Buffalo (Dr. R. Singh, Dr. Fox, Dr. G. Singh); American Academy of Family Physicians National Research Network and University of Colorado (Dr. Pace); Niagara Family Medicine Associates (Dr. A. Singh).
Address correspondence to: Ranjit Singh, MA, MB, BChir (Cantab), MBA, Associate Director, Patient Safety Research Center, Primary Care Research Institute, State University of New York at Buffalo, UB Clinical Center - Rm CC155, 62 Grider Street. Buffalo NY 14215; telephone: 716-898-5544; fax: 716-898-3536; e-mail: [email protected]
References
1. McGlynn EA, Asch SM, Adams J, et al. The quality of health care delivered to adults in the United States. N Eng J Med 2003; 348: 2635-2645.
2. Kohn LT, Corrigan J, Donaldson MS, eds. To err is human: Building a safer health system. Washington, DC: National Academies Press; 2000.
3. Joseph GM, Stee L, Marian TM, et al. Journal reporting of medical errors: The wisdom of Solomon, the bravery of Achilles, and the foolishness of Pan. Chest 2007; 131: 890-896.
4. Billings CE. Incident reporting systems in medicine and experience with the Aviation Safety Reporting System. A tale of two stories: Contrasting views of patient safety. Chicago: National Patient Safety Foundation at the AMA; 1998.
5. Leape LL, Arbookire S. WHO draft guidelines for adverse event reporting and learning systems. Geneva, Switzerland: World Alliance for Patient Safety; 2005.
6. Patient Safety and Quality Act, United States Public Law 109-41, 2005. Available at: http://www.mihealthandsafety.org/pdfs/pub-3-scheffler.pdf. Accessed April 4, 2008.
7. Thompson TG, Brailer DJ. The decade of health information technology: Delivering consumer-centric and information-rich health care: Framework for strategic action. Washington, DC: Department of Health and Human Services; 2004.
8. Clancy CM. Evaluating the potential of new technology. Building a better delivery system: A new engineering/health care partnership. Washington, DC: National Academies Press; 2005.
9. House of Commons Committee of Public Accounts, A safer place for patients: Learning to improve patient safety, HC 831. London: The Stationery Office Limited; 2006.
10. Aspden P, Corrigan JM, Wolcott J, et al, eds. Patient safety: Achieving a new standard for care. Washington, DC: Institute of Medicine, Committee on Data Standards for Patient Safety; 2004
11. Chang A, Schyve PM, Croteau RJ, et al. The JCAHO patient safety event taxonomy: A standardized terminology and classification schema for near misses and adverse events. Int J Qual Health Care 2005; 17: 95-105.
12. International classification for patient safety. Geneva, Switzerland: World Health Organization. Available at: www.who.int/patientsafety/taxonomy. Accessed April 4, 2008.
13. Chen F, Philips R. NAPCRG leads efforts to distribute ICPC information. North American primary care research group newsletter. 2005 February; 33.
14. Weingart SL. Beyond Babel: Prospects for a universal patient safety taxonomy. Int J Qual Health Care 2005; 17: 93-94.
15. Singh R, Pace W, Singh S, et al. A concept for a visual computer interface to make error taxonomies useful at the point of primary care. Informat Prim Care 2007; 15: 221-229.
16. Buzan T. The mind map book. New York: Penguin; 1991.
17. Singh R, Singh A, Fox C, et al. Computer visualization of patient safety in primary care: A systems approach adapted from management science and engineering. Informat Prim Care. 2005; 13: 135-144.
13

18. Craig PA. Controlling pilot error: Situational awareness. New York: McGraw-Hill; 2001.
19. Haller G, Myles PS, Stoelwinder J, et al. Integrating incident reporting into an electronic patient record system. J Am Med Inform Assoc 2007; 14: 175-181.
20. Nuckols TK, Bell DS, Liu H, et al. Rates and types of events reported to establish incident reporting systems in two U.S. hospitals. Qual Saf Health Care 2007; 16: 164-168.
21. Singh R, Singh A, Taylor JS, et al. Building learning practices with self-empowered teams for improving patient safety. J Healthc Manag 2006; 8: 91-118.
14