a visual articulatory model and its application to … visual articulatory model and its application...
TRANSCRIPT

B.J. Kröger, J. Gotto, S. Albert & C. Neuschaefer-Rube
ZAS Papers in Linguistics 40, 2005: 79-94 79
A visual articulatory model and its application to therapy of speech disorders: a pilot study Bernd J. Kröger Department of Phoniatrics, Pedaudiology and Communication Disorders, University Hospital of RWTH Aachen, Germany Julia Gotto Department of Neurology, Neurolinguistics, University Hospital of RWTH Aachen, Germany Susanne Albert Christiane Neuschaefer-Rube Department of Phoniatrics, Pedaudiology and Communication Disorders, University Hospital of RWTH Aachen, Germany
A visual articulatory model based on static MRI-data of isolated sounds and its application in therapy of speech disorders is described. The model is capable of generating video sequences of articulatory movements or still images of articulatory target positions within the midsagittal plane. On the basis of this model (1) a visual stimulation technique for the therapy of patients suffering from speech disorders and (2) a rating test for visual recognition of speech movements was developed. Results indicate that patients produce recognition rates above level of chance already without any training and that patients are capable of increasing their recognition rate over the time course of therapy significantly.
1. Introduction Applications for phonetic models of speech production are rare. Basically these models are used as research tools in phonetics and phonology. However more practical applications like high quality speech synthesis (see for example Birkholz et al. 2003 and this volume) may be aimed for. The visual articulatory model described here serves as a generator for visual stimuli used in therapy of speech disorders as suggested by Heike et al. (1986).

80
2. Visual articulatory model The visual articulatory model developed in Cologne and Aachen (Kröger 1998 and 2003) is a geometrical model based on a set of static MRI-data. It generates still images for single sounds and articulatory movement sequences (i.e. ani-mations, video sequences) for syllables, words and sentences. The basic concept of this model is the separation of vocalic and consonantal articulation which allows a straightforward modelling of coarticulation.
2.1. Static MRI-data: the basis of the model A corpus of midsagittal articulatory MRI-data of one speaker (JD) was collected for isolated German long vowels, nasals, fricatives, and the lateral (Kröger et al. 2000). Edge contours were extracted manually for all articulators (i.e. lips, tongue, jaw, palate, velum, pharyngeal wall, larynx) and all sounds from these MRI data using a predefined number of contour points per articulator (e.g. 23 contour points for tongue body, see fig. 1).
Figure 1: MRI-data for edge contours of vowels [i:], [a:], and [u:]. Edge contour points are indicated by white dots for different articulators. Contour points of tongue body are indicated by grey points.
2.2. Modelling vocalic and consonantal articulation
Functional control parameters (table 1) are predefined with respect to vocalic and consonantal articulation. Articulator positions (figure 2) can be described by sets of control parameter values and thus articulatory movements by time variation of control parameter values (figure 3). Model contours corresponding to definite sets of control parameter values are calculated by interpolation from edge contours.
B.J. Kröger, J. Gotto, S. Albert & C. Neuschaefer-Rube
ZAS Papers in Linguistics 40, 2005: 79-94 81
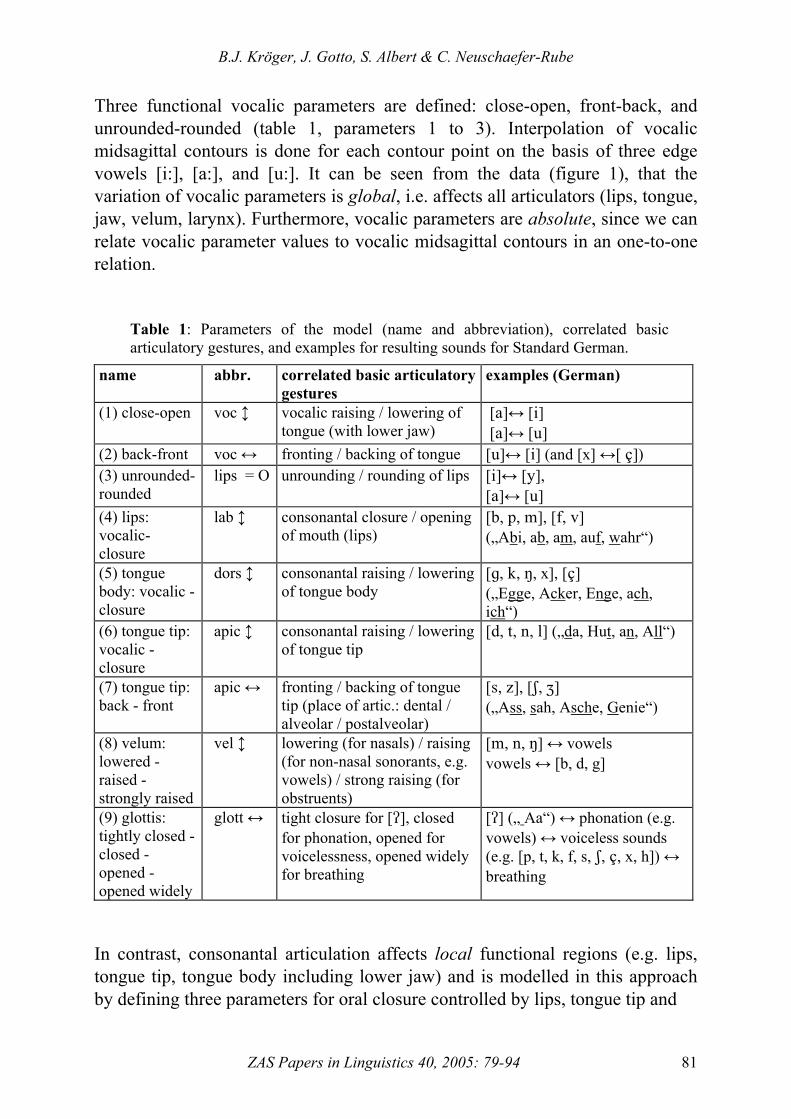
Three functional vocalic parameters are defined: close-open, front-back, and unrounded-rounded (table 1, parameters 1 to 3). Interpolation of vocalic midsagittal contours is done for each contour point on the basis of three edge vowels [i:], [a:], and [u:]. It can be seen from the data (figure 1), that the variation of vocalic parameters is global, i.e. affects all articulators (lips, tongue, jaw, velum, larynx). Furthermore, vocalic parameters are absolute, since we can relate vocalic parameter values to vocalic midsagittal contours in an one-to-one relation.
Table 1: Parameters of the model (name and abbreviation), correlated basic articulatory gestures, and examples for resulting sounds for Standard German.
name abbr. correlated basic articulatory gestures
examples (German)
(1) close-open voc ↕ vocalic raising / lowering of tongue (with lower jaw)
[`]↔ [h] [`]↔ [t]
(2) back-front voc ↔ fronting / backing of tongue [t]↔ [h] (and [x] ↔[ B]) (3) unrounded-rounded
lips = O unrounding / rounding of lips [h]↔ [x], [`]↔ [t]
(4) lips: vocalic- closure
lab ↕ consonantal closure / opening of mouth (lips)
[a, o, l], [e, u]
(„Abi, ab, am, auf, wahr“)
(5) tongue body: vocalic - closure
dors ↕ consonantal raising / lowering of tongue body
[f, j, M, x], [B]
(„Egge, Acker, Enge, ach, ich“)
(6) tongue tip: vocalic - closure
apic ↕ consonantal raising / lowering of tongue tip
[c, s, m, k] („da, Hut, an, All“)
(7) tongue tip: back - front
apic ↔ fronting / backing of tongue tip (place of artic.: dental / alveolar / postalveolar)
[r, y], [R, Y] („Ass, sah, Asche, Genie“)
(8) velum: lowered - raised - strongly raised
vel ↕ lowering (for nasals) / raising (for non-nasal sonorants, e.g. vowels) / strong raising (for obstruents)
[l, m, M] ↔ vowels vowels ↔ [b, d, g]
(9) glottis: tightly closed - closed - opened - opened widely
glott ↔ tight closure for [>], closed for phonation, opened for voicelessness, opened widely for breathing
[>] („ Aa“) ↔ phonation (e.g. vowels) ↔ voiceless sounds (e.g. [p, t, k, f, s, R, B, x, h]) ↔ breathing
In contrast, consonantal articulation affects local functional regions (e.g. lips, tongue tip, tongue body including lower jaw) and is modelled in this approach by defining three parameters for oral closure controlled by lips, tongue tip and

82
Figure 2: Midsagi-ttal views of edge vowels [i:], [a:], and [u:] and conso-nants (plosives, na-sals and fricatives). The plosives are gi-ven in the context of [a:] and [i:]. Other consonants are given in context [a:].

B.J. Kröger, J. Gotto, S. Albert & C. Neuschaefer-Rube
ZAS Papers in Linguistics 40, 2005: 79-94 83
tongue body respectively (table 1, parameters 4 to 6). Interpolation of consonantal midsagittal contours is done for each contour point of the active consonantal articulator on the basis of the actual vocalic contour on the one hand and a consonantal edge contour for lips (bilabial closure), tongue tip (alveolar closure), or tongue body (velar closure) on the other hand. This is sufficient for modelling plosives. In the case of fricatives a labio-dental obstruction contour is used instead of the bilabial stop contour (figure 2). In all other cases the consonantal constriction is approximated by the consonantal closure contours. This approximation should be replaced by using dynamic MRI-data for fricatives collected recently (Kröger et al. 2004). The control of place of articulation in the case of dorsal fricatives is done by the back-front-parameter (table 1, parameter 2). In the case of apical and laminal fricatives a further control parameter is introduced (table 1, parameter 7). The control of velum and glottis is accomplished by separate parameters (table 1, parameter 8 and 9). For the velum in addition to edge values a mid-range value (i.e. “raised”) is defined. The corresponding velum contour is interpolated with respect to the vocalic edge contours (see figure 1 and 2). The appertaining velum position represents the non-obstruent raising, which leads to different positions of the velum, e.g. for high vs. low vowels. For glottis articulation the mid-range value (i.e. “closed”) represents a light glottal closure as needed for normal phonation. Consonantal parameters are local as described above and relative since the interpolation of contour points for consonant articulation depends not exclusively on consonantal edge contours but also on an actual underlying interpolated vocalic contour. Thus consonantal closure results in smaller closing gestures for example in [i]- vs. [a]-context (figure 2, row 2 vs. row 3). According to this separation of vocalic and consonantal articulation, modelling of a time course of a word (or sentence) is relatively simple. At first a score of independent vocalic and consonantal articulatory features is defined in terms of the model parameters (figure 3, upper panel). Subsequently these features are used for specification of spatio-temporal targets for each control parameter and each sound (figure 3, lower panel, see rectangles). Then the vocalic targets are simply connected by monotonic trajectories, thus producing slowly varying tongue body (and lip rounding) movements (figure 3, lower panel). Consonantal parameters reset to zero if a target position needs no longer to be hold by an articulator.

84
Figure 3: Score of articulatory features (upper panel) and articulatory plan including phonetic transcription (lower panel) for the German word “Kompass”. For definition of parameters see table 1.
2.3. Modelling coarticulation A huge amount of coarticulatory movements results from articulatory underspecification in our approach and is referred to as consonant-vowel-coarticulation. Since vocalic and consonantal features are defined by different parameters (i.e. vocalic or consonantal parameters), free slots occur in the table

B.J. Kröger, J. Gotto, S. Albert & C. Neuschaefer-Rube
ZAS Papers in Linguistics 40, 2005: 79-94 85
of feature specification for each word (figure 3 upper panel, empty slots). In addition consonantal features are solely specified for the actual constriction forming oral articulator i.e. lips, tongue body, or tongue tip (see free slots marked by [/] in figure 3, upper panel). Thus (i) the basic vocalic movements are relatively uninfluenced by consonants and (ii) all articulators not primarily involved in producing oral closure or constriction are free for coarticulatory variation according to the underlying vocalic movements. This can be exemplified by comparing the German words “Kompass” vs. “Kampus” (figure 4). For these words only the vocalic parameter trajectories are different (figure 4 top) leading to different coarticulatory forms of tongue body and lip rounding during the consonantal closure of [m] and [p] in both words (figure 4 bottom). Furthermore the articulatory plans displayed here clarify the parallelism of the terms “coarticulation” and “temporal gestural overlap” (e.g. Browman and Goldstein 1992). Figure 4 indicates that vocalic gestures are activated during the preceding consonantal closure or constriction periods: Vocalic movements mainly occur during consonantal production periods and many consonantal movements occur during the target period of vowels.
Figure 4: Articulatory plan (top) and midsagittal views of the model articulator positions in the temporal centre of the sounds for the German words “Kompass” (left) and “Kampus” (right). The underlying vocalic articulatory movements during the bilabial closure of [m] and [p] are marked by rectangles within the articulatory plans.

86
Further coarticulatory movements result from synergistic movement effects (e.g. Lindblom 1983) also modelled in this approach. Focussing again on the example of a lip closing gesture in [a]-context, the complete movement needed for lip closure can be divided into cooperative partial movements of upper lips, lower lips and lower jaw. Thus the lower jaw participates in the lower lip raising movement as can be seen in figure 2 for [a:] vs. [ba]. This lower jaw raising caused by the lip closing gesture leads also to a passive raising of the front part of the tongue body and thus to tongue body coarticulation in the case of consonantal lip closure.
2.4. User-friendly interface “SpeechTrainer” The main idea for application of this model is its use in therapy of speech disorders as a visual stimulation technique. Thus it is very important to integrate the visual articulatory model in a user-friendly interface in order to allow the model to be controlled without effort by therapists and patients. The model can be controlled by prompting broad phonetic transcriptions for the generation of syllables, words or sentences, by prompting orthographic text (converted via a text-to-allophone-module), or by clicking sound symbols in a phonetic symbol chart. Furthermore word lists can be created by users in order to apply specific word lists to various disorders or to various patients with different kinds and different degrees of dysfunctions. The articulatory movement patterns generated by the model can be displayed in different speech rates (fast, normal, and various degrees of slow motion). Furthermore the animations generated by the model can be synchronised with natural acoustic signals recorded by users. This programm (“SpeechTrainer”) can be used as freeware by therapists and researchers (see: http:\\www.phoniatrie.ukaachen.de > research > speechtrainer).
3. Application in therapy of speech disorders The main idea for application of this model is its use in therapy of speech disorders as a visual stimulation technique. At the moment the visual articulatory model is applied in therapy of developmental speech disorders (i.e. articulation disorders, Albert 2005) and in therapy of neurogenic speech disorders (i.e. apraxia of speech, Gotto 2004 and dysarthria, O’Neill 2004). Patients with articulation disorders show deficits in producing definite single sounds (e.g. velar plosives). Patients with apraxia of speech exhibit deficits in syllable or word production while the production of isolated sounds is nearly unproblematic. The latter patients have deficits at the level of motor planning of articulatory movements, e.g. coproduction of articulatory gestures (McNeil et al.

B.J. Kröger, J. Gotto, S. Albert & C. Neuschaefer-Rube
ZAS Papers in Linguistics 40, 2005: 79-94 87
1997). In therapy of both types of disorders, the visual information (i.e. the mediosagittal still images for single sounds or video clips of speech movements for syllables and words) are used in addition to the auditive and visual information naturally produced by the therapist (i.e. acoustic speech output and synchronous view of the face). But this visual stimulation technique using the articulatory model is not meant as an independent therapy method; rather this technique should be integrated as one part in comprehensive therapy concepts. In the case of velar consonants, patients profit from mediosagittal visual information of consonantal target positions, since the acoustic cues for place of articulation are very complex and eventually not prominent enough. Furthermore the natural facial visual information does not contain prominent cues for the rear places of articulation. Thus the mediosagittal visual information of the model is a non-redundant perceptual information. In the case of apraxia of speech patients profit from the visual perception of the dynamics of articulatory movements instead of viewing still images (i.e. consonantal target positions). In the case of the visual articulatory model described here, patients get an impression of coarticulatory overlap of vocalic and consonantal speech movements. Thus the movement sequences (i.e. animations, video sequences) generated by the visual articulatory model help to rebuild patients articulatory plans for syllables as well as for words or sentences. At the moment it is still unclear how the visual stimulation technique works. It can be argued that these visual signals are too complex for the patient. Speech movements are mainly acquired by auditory perception using auditive sensorimotor circuits and thus our perception system is not trained in processing these complex visual stimuli in the case of the speech production and speech perception mode. However, due to the existence of multimodal perception-production links (Liberman and Mattingly 1985) a profitable use of visual perception of speech gestures seems to be of particular importance for the treatment of various pathological speech disorders. Two case studies (Gotto 2004 and Albert 2005) were carried out in order to evaluate the benefit of this stimulation technique. Unfortunately according to the huge variety of factors influencing therapy effects we were not able to prove within these pilot studies that patient - using this visual stimulation technique as a part of their therapy - profit significantly more by this therapy than patients using conventional therapy techniques. As a first step we created a rating method for visual recognition of speech movements measuring the increase in recognition rate over the time period of therapy. An increase in patients recognition rate indicates interaction between patient and model and makes feasible that patients benefit from the visual stimulation technique.
88
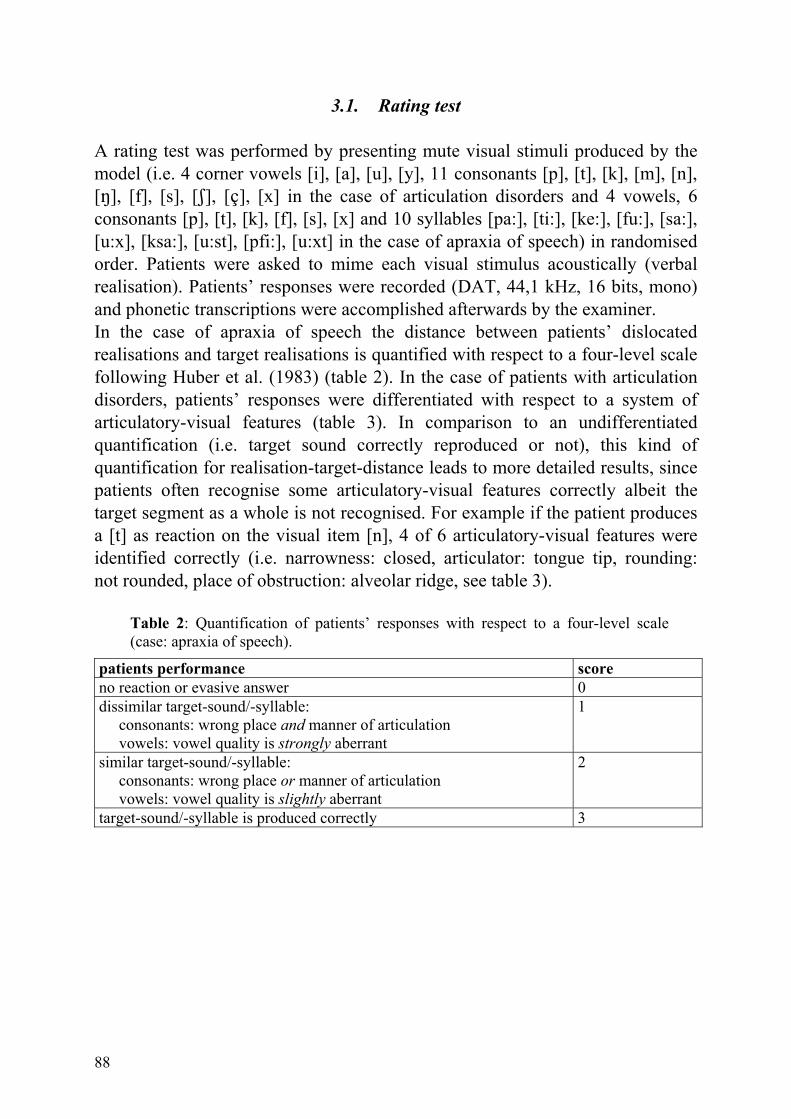
3.1. Rating test A rating test was performed by presenting mute visual stimuli produced by the model (i.e. 4 corner vowels [i], [a], [u], [y], 11 consonants [p], [t], [k], [m], [n], [M], [f], [s], [R], [B], [x] in the case of articulation disorders and 4 vowels, 6 consonants [p], [t], [k], [f], [s], [x] and 10 syllables [pa:], [ti:], [ke:], [fu:], [sa:], [u:x], [ksa:], [u:st], [pfi:], [u:xt] in the case of apraxia of speech) in randomised order. Patients were asked to mime each visual stimulus acoustically (verbal realisation). Patients’ responses were recorded (DAT, 44,1 kHz, 16 bits, mono) and phonetic transcriptions were accomplished afterwards by the examiner. In the case of apraxia of speech the distance between patients’ dislocated realisations and target realisations is quantified with respect to a four-level scale following Huber et al. (1983) (table 2). In the case of patients with articulation disorders, patients’ responses were differentiated with respect to a system of articulatory-visual features (table 3). In comparison to an undifferentiated quantification (i.e. target sound correctly reproduced or not), this kind of quantification for realisation-target-distance leads to more detailed results, since patients often recognise some articulatory-visual features correctly albeit the target segment as a whole is not recognised. For example if the patient produces a [t] as reaction on the visual item [n], 4 of 6 articulatory-visual features were identified correctly (i.e. narrowness: closed, articulator: tongue tip, rounding: not rounded, place of obstruction: alveolar ridge, see table 3).
Table 2: Quantification of patients’ responses with respect to a four-level scale (case: apraxia of speech).
patients performance score no reaction or evasive answer 0 dissimilar target-sound/-syllable: consonants: wrong place and manner of articulation vowels: vowel quality is strongly aberrant
1
similar target-sound/-syllable: consonants: wrong place or manner of articulation vowels: vowel quality is slightly aberrant
2
target-sound/-syllable is produced correctly 3

B.J. Kröger, J. Gotto, S. Albert & C. Neuschaefer-Rube
ZAS Papers in Linguistics 40, 2005: 79-94 89
Table 3: System of articulatory-visual features for quantification of patients’ responses (case: articulation disorders). From left: Area of appearance of the articulatory-visual feature, name of feature, possible specification values for each feature.
area feature specification (1) (2) (3) oral region narrowness of
obstruction open narrow closed
oral region articulator lips tongue body tongue tip lips rounding rounded not rounded - tongue place of
obstruction hard palate or alveolar ridge
soft palate pharyngeal wall
velum nasality nasal non-nasal - larynx voice voiced voiceless -
3.2. Results For both types of speech disorders the rating test was carried out at begin, middle, and end of the therapy period, and at a follow-up test a few months after therapy was completed. All patients had no experience with midsagittal views at the beginning of the therapy. Therefore in the case of the initial rating test, patients were introduced to midsagittal views by explaining the articulators (i.e. lips, tongue, velum, pharyngeal wall, larynx) and by explaining the basic articulatory movements (i.e. closure or constriction produced by lips, tongue tip, tongue body; fronting, backing, lowering, and raising the tongue; spreading and rounding of lips; raising and lowering of velum; opening and closing of glottis) produced by our model. Two patients with articulation disorders (child 1: female 4;6 years old, child 2: male 4;7 years old) used the visual articulatory model during therapy (Albert 2005). The therapy period lasted three months with two one-hour therapy sessions per week. The visual stimulation technique was applied in the first half of the therapy period for child 1 and in the second half of the therapy period for child 2. The rating test was performed at begin, middle, and end of the therapy period and a follow-up testing was performed 6 weeks after end of therapy. The results are displayed in figure 5.

90
Figure 5: Recognition score in % at begin, middle, end of therapy and at a follow-up testing (from left to right) for two children. Differences reaching significance are indicated by horizontal lines (Willcoxon-sign-rank-test two-tailed).
In addition 9 other children (3 male, 6 female, age from 4;7 to 8;3) were tested at begin of the therapy period exclusively (Albert 2005). Thus, in total 11 children were tested: 7 children suffered from articulation disorders without further deficits, while 4 children exhibited articulation disorders as a part of a specific language impairment. Results of this initial rating test is given in table 4. Recognition scores are round about 40% to 70% in the case of differentiated quantification (mean value) and about 10% to 30% in the case of undif-ferentiated quantification. Mean values of recognition rate of the 11 children separated for each visual-articulatory feature are given in figure 6. It can be seen, that the feature “lip rounding” is recognised best. This may be related to the fact, that this lip feature is well known from normal (i.e. facial) visual speech perception. The articulatory-visual feature “place of obstruction” refers to vocalic and consonantal tongue articulation (i.e. palatal or /i/-like, velar or /u/-like, pharyngeal or /a/-like articulation). This feature is identified second best. This may be related to the fact that the change of tongue contour is visually prominent in the midsagittal view (see figure 1, row 1).

B.J. Kröger, J. Gotto, S. Albert & C. Neuschaefer-Rube
ZAS Papers in Linguistics 40, 2005: 79-94 91
Table 4: Recognition rate in % for visual articulatory features (see table 3), for mean value of differentiated rating, and for non-differentiated rating in the case of 11 children suffering from articulations disorders. The rating test was done before starting the therapy. Children with specific language impairment are indicated by asterisk. Child 1 and 2 are also described in figure 5. child age narrow
ness articu-lator
roun-ding
place nasa-lity
voice differen-tiated (mean)
undiffe-rentiated
1 4;6 40 33 64 42 44 47 45 11 2 4;7 40 53 60 44 47 40 47 13 3 4;7 (*) 51 64 78 71 78 44 64 20 4 4;11 (*) 38 31 58 40 38 31 39 11 5 5;5 47 69 76 80 62 44 63 24 6 5;9 (*) 60 73 87 78 71 49 70 22 7 5;9 49 62 76 64 44 49 57 29 8 6;5 (*) 49 62 73 64 49 51 58 22 9 6;6 44 62 68 64 51 36 54 13 10 7;9 58 77 73 82 67 44 67 27 11 8;3 56 64 73 64 69 58 64 27 The features identified next best are “articulator” and “nasality” followed by the features “narrowness of obstruction” and “voice”. Especially the specification of the last two features corresponds to very small changes only within the medio-sagittal view of the visual articulatory model and thus may be not noticed by patients.
Figure 6: Mean values of recognition rate for visual articulatory features for all 11 children described in table 4. The rating test was executed before starting the therapy. Differences reaching significance were indicated by horizontal lines (Wilcoxon-sign-rank-test two-tailed).
48%
59%
72%63%
56%
45%
0%
10%
20%
30%
40%
50%
60%
70%
80%
STENG ART RUND ORT NAS STIMnarrow- articulator rounding place nasality voice ness
p.005* p.002* p.02* p.045* p.015*
p.375
p.137
92
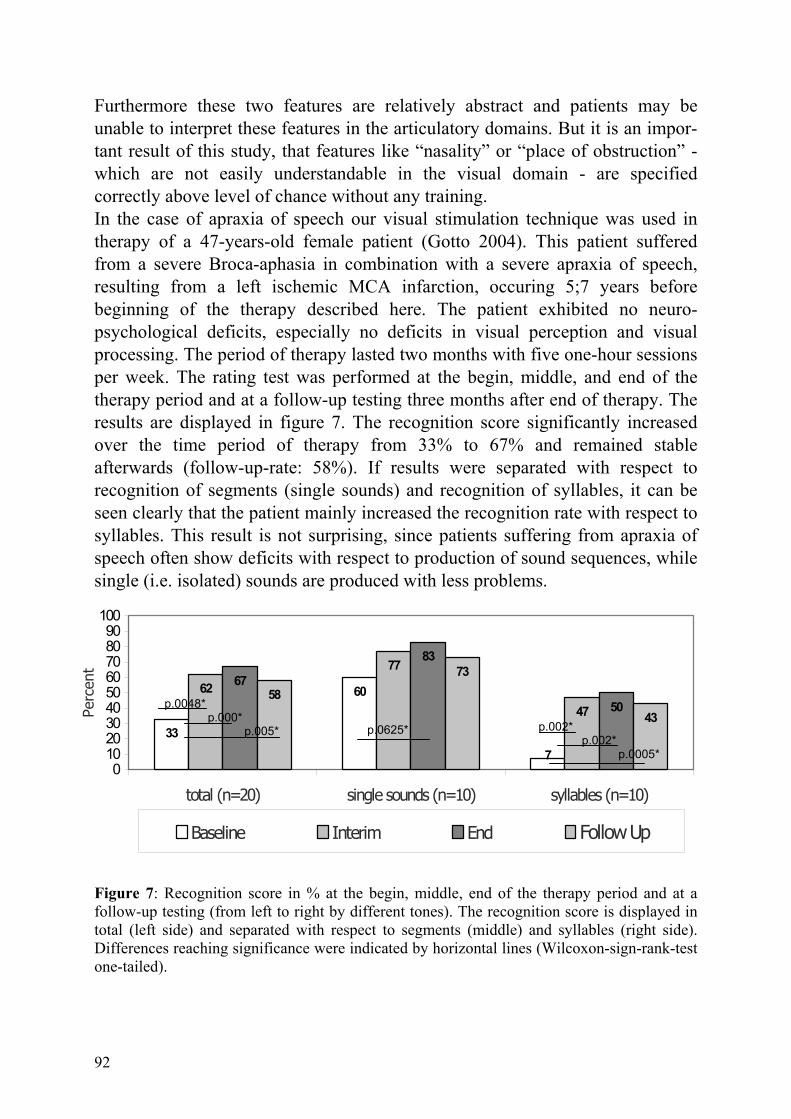
Furthermore these two features are relatively abstract and patients may be unable to interpret these features in the articulatory domains. But it is an impor-tant result of this study, that features like “nasality” or “place of obstruction” - which are not easily understandable in the visual domain - are specified correctly above level of chance without any training. In the case of apraxia of speech our visual stimulation technique was used in therapy of a 47-years-old female patient (Gotto 2004). This patient suffered from a severe Broca-aphasia in combination with a severe apraxia of speech, resulting from a left ischemic MCA infarction, occuring 5;7 years before beginning of the therapy described here. The patient exhibited no neuro-psychological deficits, especially no deficits in visual perception and visual processing. The period of therapy lasted two months with five one-hour sessions per week. The rating test was performed at the begin, middle, and end of the therapy period and at a follow-up testing three months after end of therapy. The results are displayed in figure 7. The recognition score significantly increased over the time period of therapy from 33% to 67% and remained stable afterwards (follow-up-rate: 58%). If results were separated with respect to recognition of segments (single sounds) and recognition of syllables, it can be seen clearly that the patient mainly increased the recognition rate with respect to syllables. This result is not surprising, since patients suffering from apraxia of speech often show deficits with respect to production of sound sequences, while single (i.e. isolated) sounds are produced with less problems.
Figure 7: Recognition score in % at the begin, middle, end of the therapy period and at a follow-up testing (from left to right by different tones). The recognition score is displayed in total (left side) and separated with respect to segments (middle) and syllables (right side). Differences reaching significance were indicated by horizontal lines (Wilcoxon-sign-rank-test one-tailed).
33
60
7
77
47
67
83
50
73
43
62 58
0102030405060708090
100
total (n=20) single sounds (n=10) syllables (n=10)
Perc
ent
Baseline Interim End Follow Up
p.0048* p.000* p.005* p.0625* p.002*
p.002* p.0005*

B.J. Kröger, J. Gotto, S. Albert & C. Neuschaefer-Rube
ZAS Papers in Linguistics 40, 2005: 79-94 93
4. Discussion and perspective A visual articulatory model comprising basic coarticulatory mechanisms has been introduced. Articulator positions are calculated by interpolating edge contours extracted from MRI-data. The model displays segmental articulatory targets as still images and articulatory movement sequences as video sequences. The model is used as a visual stimulation technique in therapy of articulation disorders and apraxia of speech. A rating test was developed in order to evaluate the increase in visual recognition of sounds and syllables over the time course of therapy. In both kinds of speech disorders a significant increase in recognition rate is found. Even in the case of young children we were able to demonstrate that recognition of articulatory-visual sound features is unproblematic at their first exposure to the visual articulatory model (i.e. without training). A major disadvantage of the rating test described here, is that the visual recognition scores are also influenced by the production abilities of the patients. In order to get a better separation of production and perception abilities, it is planned to design acoustic-visual matching experiments. Since the results of this study have promise, we are going to use this visual stimulation technique in therapy with a larger amount of patients. The goal is to evaluate the effectiveness of this therapeutic aid as well as an estimation of therapy duration effects with and without using this visual stimulation technique in the therapy of speech disorders.
References Albert, S. (2005). Einsatz des SpeechTrainers in der Artikulationstherpie bei Kindern.
Diplomarbeit, Studiengang Lehr- und Forschungslogopädie, RWTH Aachen.
Browman, C. P., & Goldstein, L. (1992). Articulatory phonology: An overview. Phonetica, 49: 155-180.
Birkholz, P., & Jackèl, D. (2003). A three-dimensional model of the vocal tract for speech synthesis. Proceedings of the 15th International Congress of Phonetic Sciences, Barcelona, Spain. 2597-2600.
Gotto, J. (2004). Therapie der Sprechapraxie: Eine Einzelfallstudie zum PC-Programm SpeechTrainer. Diplomarbeit, Studiengang Lehr- und Forschungslogopädie, RWTH Aachen.
Heike, G., Philip, J. & Hilger, S. (1986). Computergrafikdarstellung von Artikulationsbewe-gungen zur Unterstützung des Artikulationstrainings. Sprache - Stimme - Gehör 10: 4-6.
Huber, W., Poeck, K., Weniger, D. & Willmes, K. (1983) Aachener Aphasie Test (AAT). Göttingen: Hogrefe.
Kröger, B.J. (1998). Ein phonetisches Modell der Sprachproduktion. Tübingen: Niemeyer.

94
Kröger, B.J. (2003). Ein visuelles Modell der Artikulation. Laryngo-Rhino-Otologie, 82: 402-407.
Kröger B.J., Winkler, R., Mooshammer, C. & Pompino-Marschall, B. (2000). Estimation of vocal tract area function from magnetic resonance imaging: Preliminary results. Pro-ceedings of 5th Seminar on Speech Production: Models and Data. Kloster Seeon, Bavaria. 333-336.
Kröger, B.J., Hoole, P., Sader, R., Geng, C., Pompino-Marschall, B., & Neuschaefer-Rube, C. (2004). MRT-Sequenzen als Datenbasis eines visuellen Artikulationsmodells. HNO, 52: 837-843.
Liberman, A. M. & Mattingly, I.G. (1985). The motor theory of speech perception revised. Cognition, 21: 1-36.
Lindblom, B. (1983). Economy of speech gestures. In: MacNeilage P.F. (Eds.) The production of speech. New York: Springer. 217-246.
McNeil, M. R., Donald, A. R. & Schmidt, R.A. (1997). Apraxia of speech: Definition, differentiation, and treatment. In M.R. McNeil (ed.) Clinical management of sensorimotor speech disorders. New York: Thieme. 311-344.
O’Neill, G. (2004) The use of a new computer programme in the treatment of dysarthria: A single case studie. Bachelor Thesis, Trinity College Dublin.