a vision 2030 flagship project - reliefweb.int
TRANSCRIPT
Page 1 of 17
National Drought Management Authority KILIFI COUNTY
DROUGHT EARLY WARNING BULLETIN FOR JULY 2016
A Vision 2030 Flagship Project
Short rains harvests Short dry spell Reduced milk yields Increased HH Food Stocks Land preparation
Planting/Weeding Long rains High Calving Rate Milk Yields Increase
Long rains harvests A long dry spell Land preparation Increased HH Food Stocks Kidding (Sept)
Short rains Planting/weeding
Jan Feb Mar Apr May Jun Jul Aug Sept Oct Nov Dec
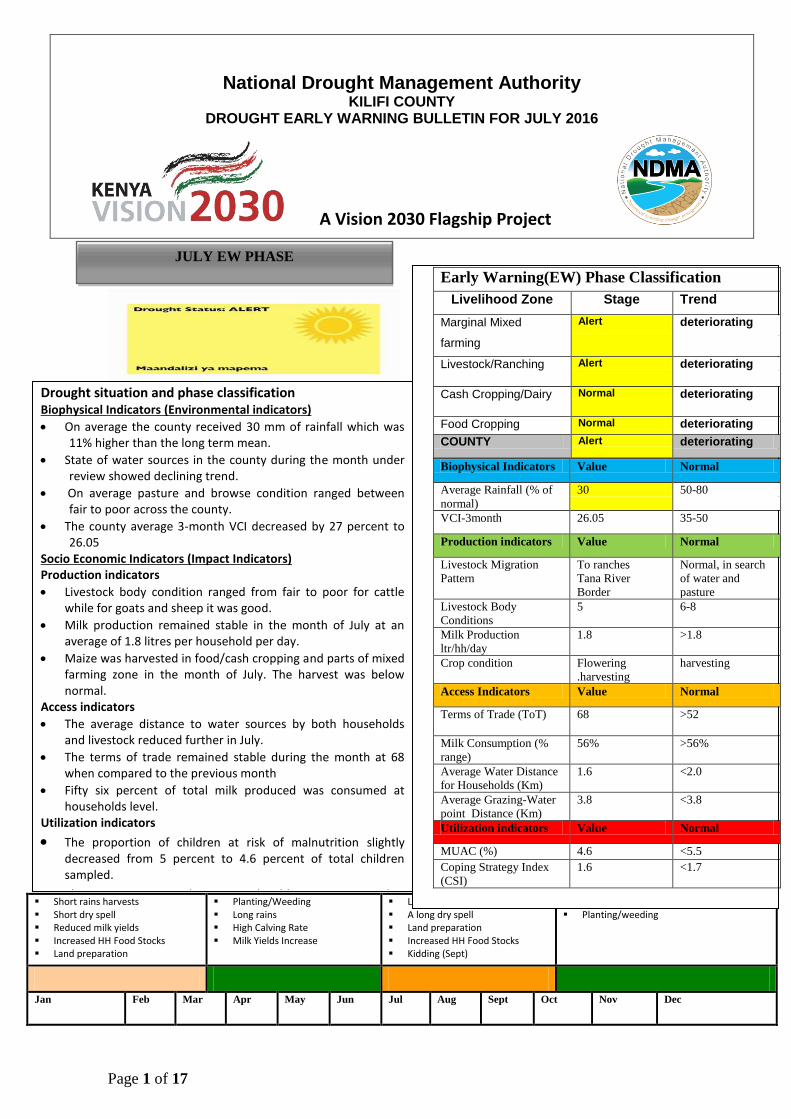
JULY EW PHASE
Early Warning(EW) Phase Classification
Livelihood Zone Stage Trend
Marginal Mixed
farming
Alert deteriorating
Livestock/Ranching Alert deteriorating
Cash Cropping/Dairy Normal deteriorating
Food Cropping Normal deteriorating COUNTY Alert deteriorating
Biophysical Indicators Value Normal
Average Rainfall (% of
normal)
30 50-80
VCI-3month 26.05 35-50
Production indicators Value Normal
Livestock Migration
Pattern
To ranches
Tana River
Border
Normal, in search
of water and
pasture
Livestock Body
Conditions
5 6-8
Milk Production
ltr/hh/day
1.8 >1.8
Crop condition Flowering
.harvesting
harvesting
Access Indicators Value Normal
Terms of Trade (ToT) 68 >52
Milk Consumption (%
range)
56% >56%
Average Water Distance
for Households (Km)
1.6 <2.0
Average Grazing-Water
point Distance (Km)
3.8 <3.8
Utilization indicators Value Normal
MUAC (%) 4.6 <5.5
Coping Strategy Index
(CSI)
1.6 <1.7
Drought situation and phase classification Biophysical Indicators (Environmental indicators)
On average the county received 30 mm of rainfall which was 11% higher than the long term mean.
State of water sources in the county during the month under review showed declining trend.
On average pasture and browse condition ranged between fair to poor across the county.
The county average 3-month VCI decreased by 27 percent to 26.05
Socio Economic Indicators (Impact Indicators) Production indicators
Livestock body condition ranged from fair to poor for cattle while for goats and sheep it was good.
Milk production remained stable in the month of July at an average of 1.8 litres per household per day.
Maize was harvested in food/cash cropping and parts of mixed farming zone in the month of July. The harvest was below normal.
Access indicators
The average distance to water sources by both households and livestock reduced further in July.
The terms of trade remained stable during the month at 68 when compared to the previous month
Fifty six percent of total milk produced was consumed at households level.
Utilization indicators
The proportion of children at risk of malnutrition slightly decreased from 5 percent to 4.6 percent of total children sampled.
The coping strategy index remained stable at 1.6 compared to previous month.
Page 2 of 17
1.0 CLIMATIC CONDITIONS 1.1 Rainfall Performance 1.2 Amount and Spatial Distribution
JAN FEB MAR APR MAY JUN JUL AUG SEP OCT NOV DEC
LTM (2010-2015) 36.9 6.7 18.5 48.1 96.9 74.9 27.8 28.2 23.2 54.4 70.7 84.2
YEAR 2016 36.5 1.1 7.2 30.0 73.0 32.0 30.5
0.0
15.0
30.0
45.0
60.0
75.0
90.0
105.0
AM
OU
NT
IN
MIL
LIM
ET
RE
S
AVERAGE AMOUNT OF RAINFALL RECORDED IN KILIFI COUNTY
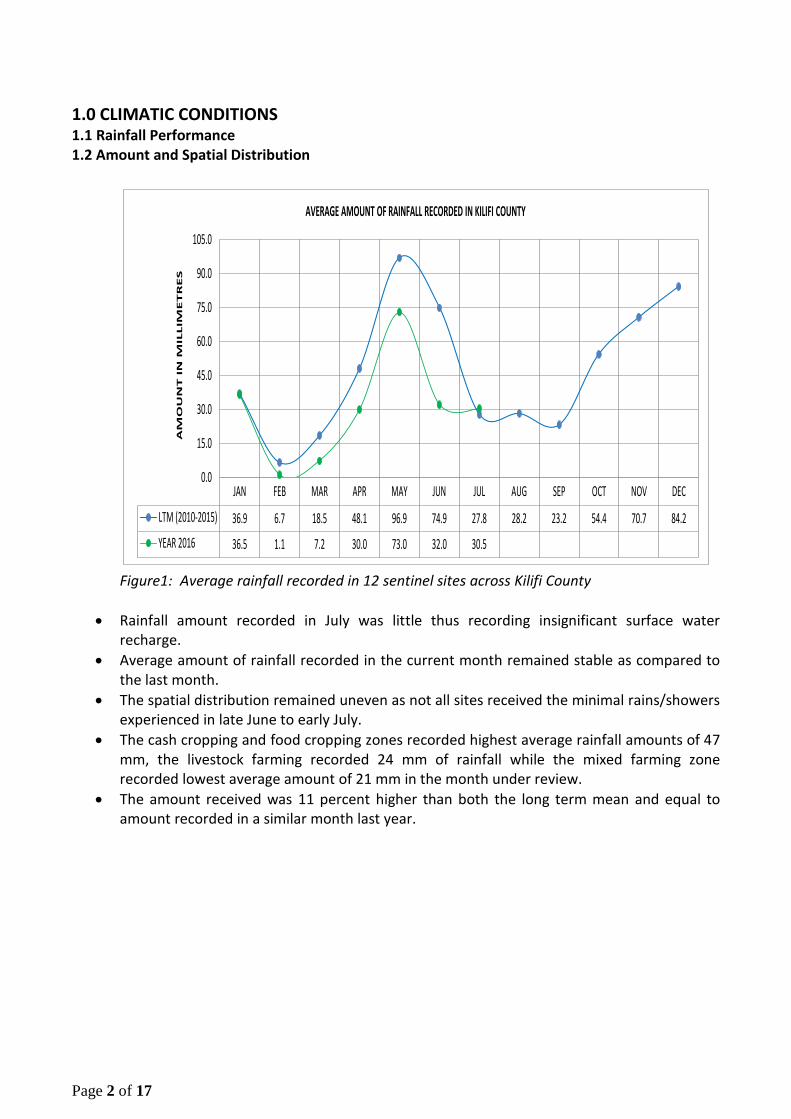
Figure1: Average rainfall recorded in 12 sentinel sites across Kilifi County
Rainfall amount recorded in July was little thus recording insignificant surface water recharge.
Average amount of rainfall recorded in the current month remained stable as compared to the last month.
The spatial distribution remained uneven as not all sites received the minimal rains/showers experienced in late June to early July.
The cash cropping and food cropping zones recorded highest average rainfall amounts of 47 mm, the livestock farming recorded 24 mm of rainfall while the mixed farming zone recorded lowest average amount of 21 mm in the month under review.
The amount received was 11 percent higher than both the long term mean and equal to amount recorded in a similar month last year.
Page 3 of 17
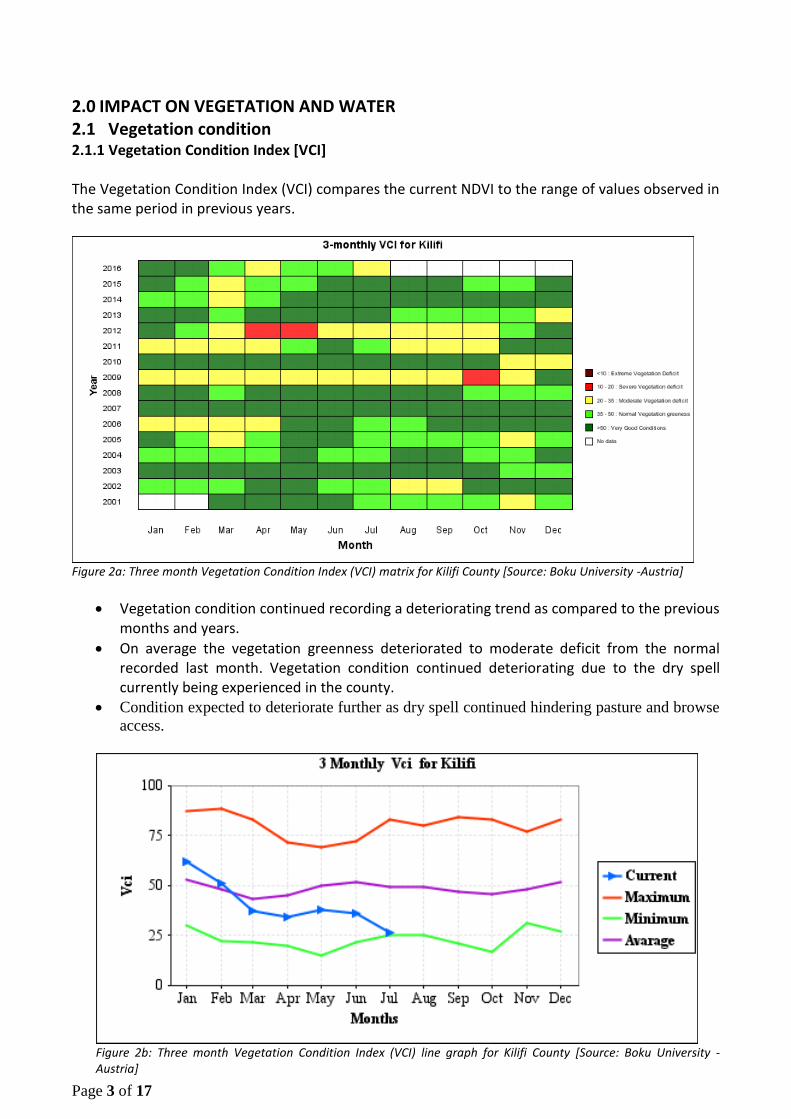
2.0 IMPACT ON VEGETATION AND WATER 2.1 Vegetation condition 2.1.1 Vegetation Condition Index [VCI] The Vegetation Condition Index (VCI) compares the current NDVI to the range of values observed in the same period in previous years.
Figure 2a: Three month Vegetation Condition Index (VCI) matrix for Kilifi County [Source: Boku University -Austria]
Vegetation condition continued recording a deteriorating trend as compared to the previous months and years.
On average the vegetation greenness deteriorated to moderate deficit from the normal recorded last month. Vegetation condition continued deteriorating due to the dry spell currently being experienced in the county.
Condition expected to deteriorate further as dry spell continued hindering pasture and browse
access.
Figure 2b: Three month Vegetation Condition Index (VCI) line graph for Kilifi County [Source: Boku University -Austria]
Page 4 of 17
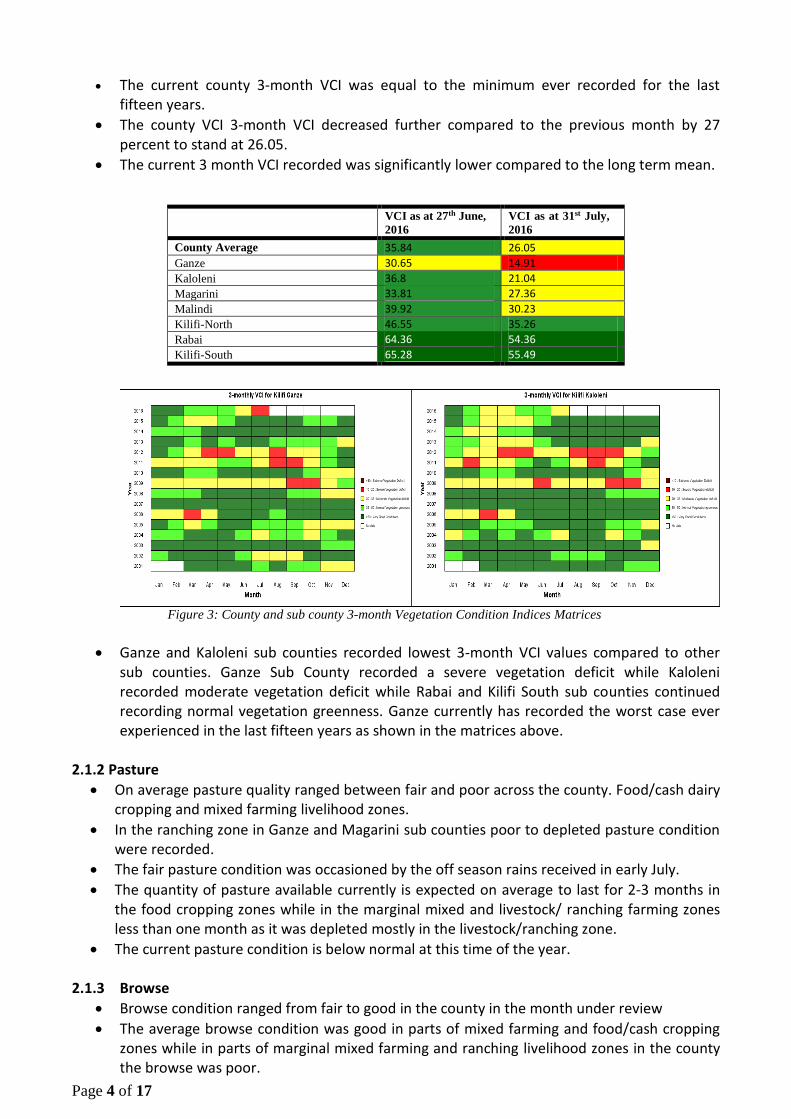
The current county 3-month VCI was equal to the minimum ever recorded for the last fifteen years.
The county VCI 3-month VCI decreased further compared to the previous month by 27 percent to stand at 26.05.
The current 3 month VCI recorded was significantly lower compared to the long term mean.
Figure 3: County and sub county 3-month Vegetation Condition Indices Matrices
Ganze and Kaloleni sub counties recorded lowest 3-month VCI values compared to other sub counties. Ganze Sub County recorded a severe vegetation deficit while Kaloleni recorded moderate vegetation deficit while Rabai and Kilifi South sub counties continued recording normal vegetation greenness. Ganze currently has recorded the worst case ever experienced in the last fifteen years as shown in the matrices above.
2.1.2 Pasture
On average pasture quality ranged between fair and poor across the county. Food/cash dairy cropping and mixed farming livelihood zones.
In the ranching zone in Ganze and Magarini sub counties poor to depleted pasture condition were recorded.
The fair pasture condition was occasioned by the off season rains received in early July.
The quantity of pasture available currently is expected on average to last for 2-3 months in the food cropping zones while in the marginal mixed and livestock/ ranching farming zones less than one month as it was depleted mostly in the livestock/ranching zone.
The current pasture condition is below normal at this time of the year. 2.1.3 Browse
Browse condition ranged from fair to good in the county in the month under review
The average browse condition was good in parts of mixed farming and food/cash cropping zones while in parts of marginal mixed farming and ranching livelihood zones in the county the browse was poor.
VCI as at 27th June,
2016
VCI as at 31st July,
2016
County Average 35.84 26.05
Ganze 30.65 14.91
Kaloleni 36.8 21.04
Magarini 33.81 27.36
Malindi 39.92 30.23
Kilifi-North 46.55 35.26
Rabai 64.36 54.36
Kilifi-South 65.28 55.49

Page 5 of 17
The browse quality condition is below normal at this time of year in the marginal mixed farming and ranching zones while in the cropping zones it remains normal.
The current browse condition is below normal at this time of the year.
2.2 Water Resource 2.2.1 Sources
33%
13%
10%
44%
Water sources for Households in Kilifi County
Pans & Dams
Boreholes/Shallow wells
Natural Rivers/Ponds/River wells
Pipeline
Figure 4: Water sources for households in Kilifi County
The proportion of households who relied on pipeline increased by 10% in the current month as those who relied on natural ponds and wells/natural ponds decreased by a similar margin.
The main water sources for domestic and livestock use across all livelihood zones in the month of July were pipeline (44%), pans/dams (33%), natural rivers, ponds and river wells (10%) and boreholes/shallow wells (13%).
Majority of households relied on pipeline due to drying of some pans especially in the marginal mixed farming and ranching zones coupled with poor quality of water in some pans caused by direct use by livestock. Those households closer to river Sabaki depended on river wells and the river for livestock and household use.
The sources used during the current month were normal at this time of the year.
The EW phase classification index for water sources in the county during the month under review was 4 , indicating normalcy in water availability but with deteriorating trend
Page 6 of 17
2.2.2 Household access and Utilization
0.0 0.5 1.0 1.5 2.0 2.5 3.0 3.5 4.0
JAN
FEB
MAR
APR
MAY
JUN
JUL
AUG
SEP
OCT
NOV
DEC
JAN FEB MAR APR MAY JUN JUL AUG SEP OCT NOV DEC
YEAR 2016 1.6 2.6 3.5 2.6 2.5 2.1 1.6
LTM (2011-2015) 2.2 2.6 3.2 2.9 1.8 1.7 2.0 2.3 3.0 2.6 2.1 1.6
AVERAGE HOUSEHOLD RETURN DISTANCE TO WATER SOURCES IN KILIFI COUNTY
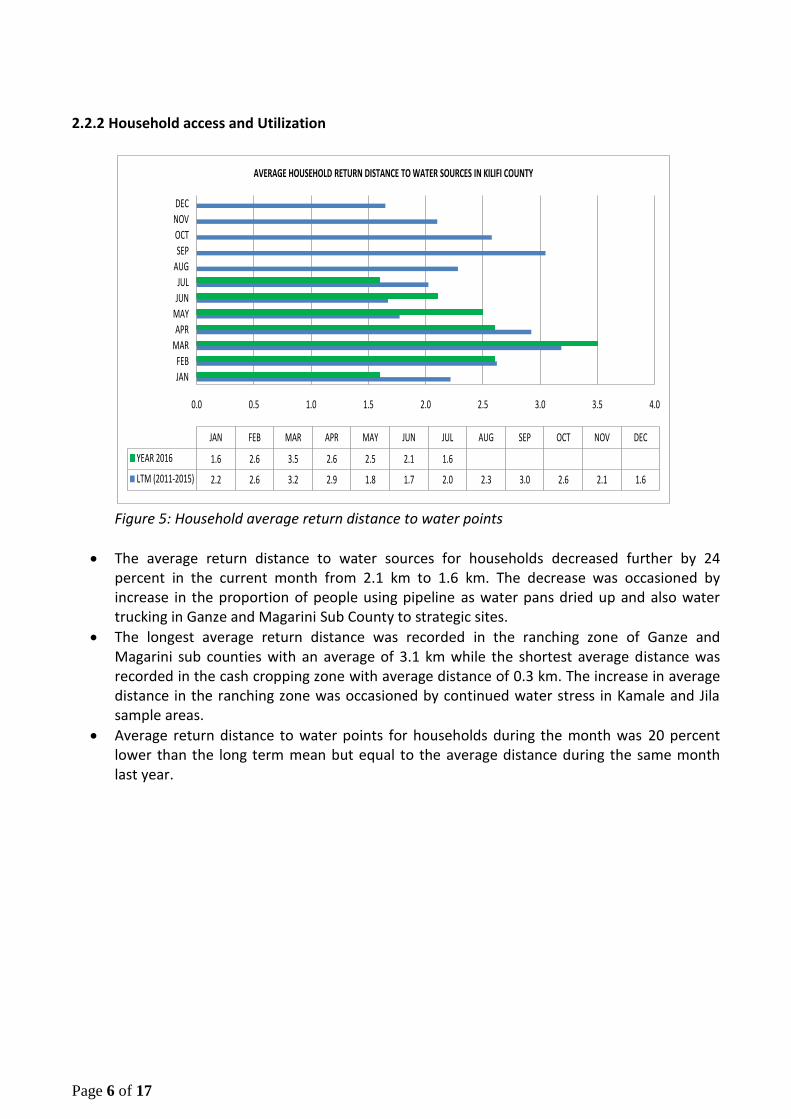
Figure 5: Household average return distance to water points
The average return distance to water sources for households decreased further by 24 percent in the current month from 2.1 km to 1.6 km. The decrease was occasioned by increase in the proportion of people using pipeline as water pans dried up and also water trucking in Ganze and Magarini Sub County to strategic sites.
The longest average return distance was recorded in the ranching zone of Ganze and Magarini sub counties with an average of 3.1 km while the shortest average distance was recorded in the cash cropping zone with average distance of 0.3 km. The increase in average distance in the ranching zone was occasioned by continued water stress in Kamale and Jila sample areas.
Average return distance to water points for households during the month was 20 percent lower than the long term mean but equal to the average distance during the same month last year.
Page 7 of 17
2.2.3 Livestock access to water
0.0 1.0 2.0 3.0 4.0 5.0 6.0
JAN
FEB
MAR
APR
MAY
JUN
JUL
AUG
SEP
OCT
NOV
DEC
JAN FEB MAR APR MAY JUN JUL AUG SEP OCT NOV DEC
YEAR 2016 3.6 4.4 5.7 4.6 4.5 4.2 3.8
LTM (2011-2015) 3.8 5.2 5.6 5.0 3.1 3.4 3.8 4.7 5.6 5.0 3.6 3.0
AVERAGE LIVESTOCK RETURN DISTANCE TO WATER POINTS FROM GRAZING AREA IN KILIFI COUNTY
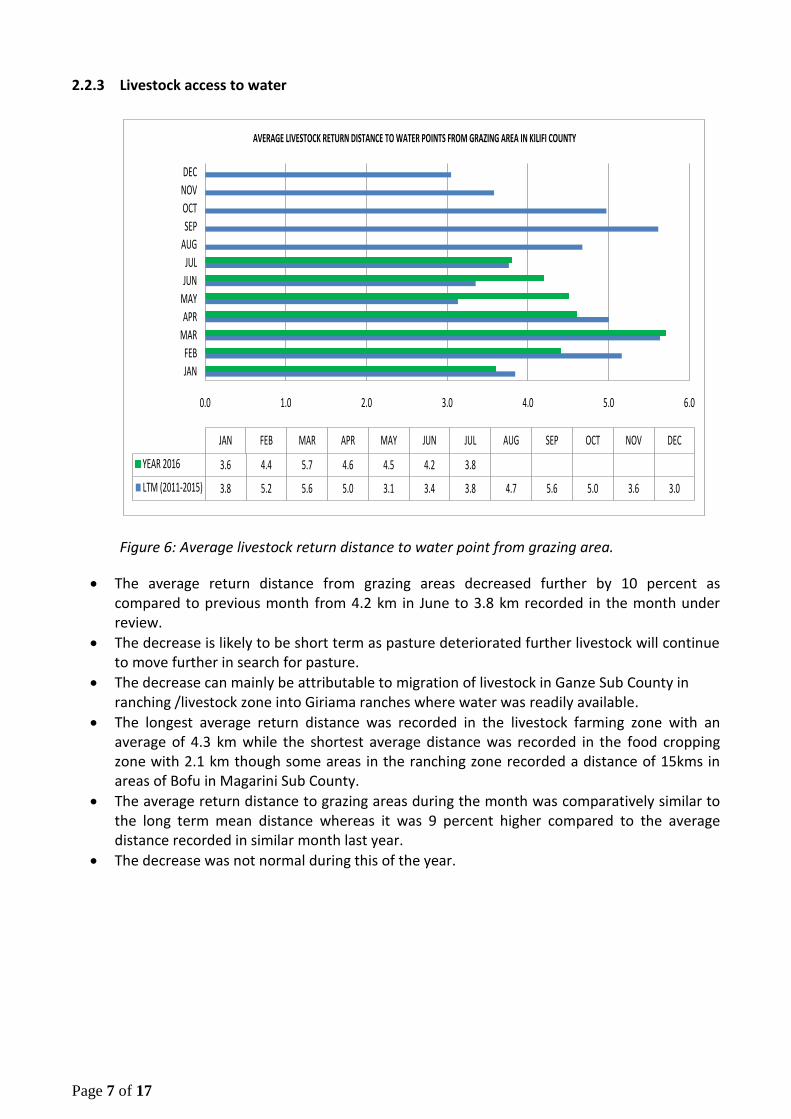
Figure 6: Average livestock return distance to water point from grazing area.
The average return distance from grazing areas decreased further by 10 percent as compared to previous month from 4.2 km in June to 3.8 km recorded in the month under review.
The decrease is likely to be short term as pasture deteriorated further livestock will continue to move further in search for pasture.
The decrease can mainly be attributable to migration of livestock in Ganze Sub County in ranching /livestock zone into Giriama ranches where water was readily available.
The longest average return distance was recorded in the livestock farming zone with an average of 4.3 km while the shortest average distance was recorded in the food cropping zone with 2.1 km though some areas in the ranching zone recorded a distance of 15kms in areas of Bofu in Magarini Sub County.
The average return distance to grazing areas during the month was comparatively similar to the long term mean distance whereas it was 9 percent higher compared to the average distance recorded in similar month last year.
The decrease was not normal during this of the year.
Page 8 of 17
3.0 PRODUCTION INDICATORS 3.1 Livestock production 3.1.1 Livestock body condition
The body condition for cattle was fair in the food cropping and cash cropping livelihood zones during the month under review occasioned by fair quality of pasture and browse while in the marginal mixed and ranching zones it was fair to poor. The deterioration of body condition of livestock in some pocket in the marginal mixed and ranching zone was due to stress in accessing pasture and water. Goats and sheep body condition was good across all livelihood zones.
On average, livestock body condition across the county remained normal at this time of the year with an EW phase classification score of 5 (moderate neither fat nor thin).
3.1.2 Livestock diseases
New castle disease was observed in poultry across all livelihood zones while CBPP, CCPP and Lumpy Skin Disease were reported in the ranching and marginal mixed farming zones.
3.1.3 Milk production
Milk production remained stable in the month of July as compared to production in the previous month at 1.8 litres per household per day
The production was lower in the ranching zone at between 0.5 and 1.0 litre per household per day while the highest production was recorded in the cash cropping/dairy livelihood zone with between 2.0 to 2.5 litres per household per day.
The distinction between livelihood zones was due to average trekking distance to water sources and access and availability of pasture.
3.2 Rain fed crop production 3.2.1. Stage and condition of food crops
The late planted maize crop in mixed farming and cash/food cropping livelihood zones was at knee height stage while March/April planted maize was ready for harvest.
In the marginal mixed and ranching zones minimal to no harvest is expected as most areas recorded total crop failure while some never even planted due to poor rains.
3.2.2. Crop harvest
Minimal maize crop harvest were recorded or is expected in the mixed, marginal mixed and food/cash cropping farming zones.
Minimal harvest of African Birds Eye Chilies and Cassava harvesting continued in mixed and marginal mixed all livelihood zones.
Farmers continued to harvest vegetables in irrigated farms along river Sabaki (livestock farming zone
Coconut harvesting was ongoing in cash cropping, food cropping zones and along the coastal strip.

Page 9 of 17
4.0 MARKET PERFORMANCE 4.1 Livestock marketing 4.1.1 Cattle Prices
Figure7: Average cattle price (4 year bull) in major livestock markets in Kilifi County.
A decrease of 10.4 % in average cattle prices was recorded in July when compared to the previous month to Kshs14300.
The decrease was occasioned by poor body condition due to poor quality and quantity of pasture and long trekking distances to water points especially in the ranching and marginal mixed farming zones.
The current recorded price was 2 percent higher than the long term mean and 5 percent lower than the price recorded in a similar month last year.
Page 10 of 17
4.1.2 Goat Prices
JAN FEB MAR APR MAY JUN JUL AUG SEP OCT NOV DEC
LTM (2013-2015) 2492 2527 2265 2299 1872 2093 2074 2350 2340 2292 2511 2577
YEAR 2016 2500 3000 2400 2700 2600 3000 2700
0
1000
2000
3000
4000
GO
AT
PR
ICE
IN
KS
HS
AVERAGE GOAT PRICE IN THE COUNTY IN COMPARISON TO THE LONG TERM MEAN PRICE
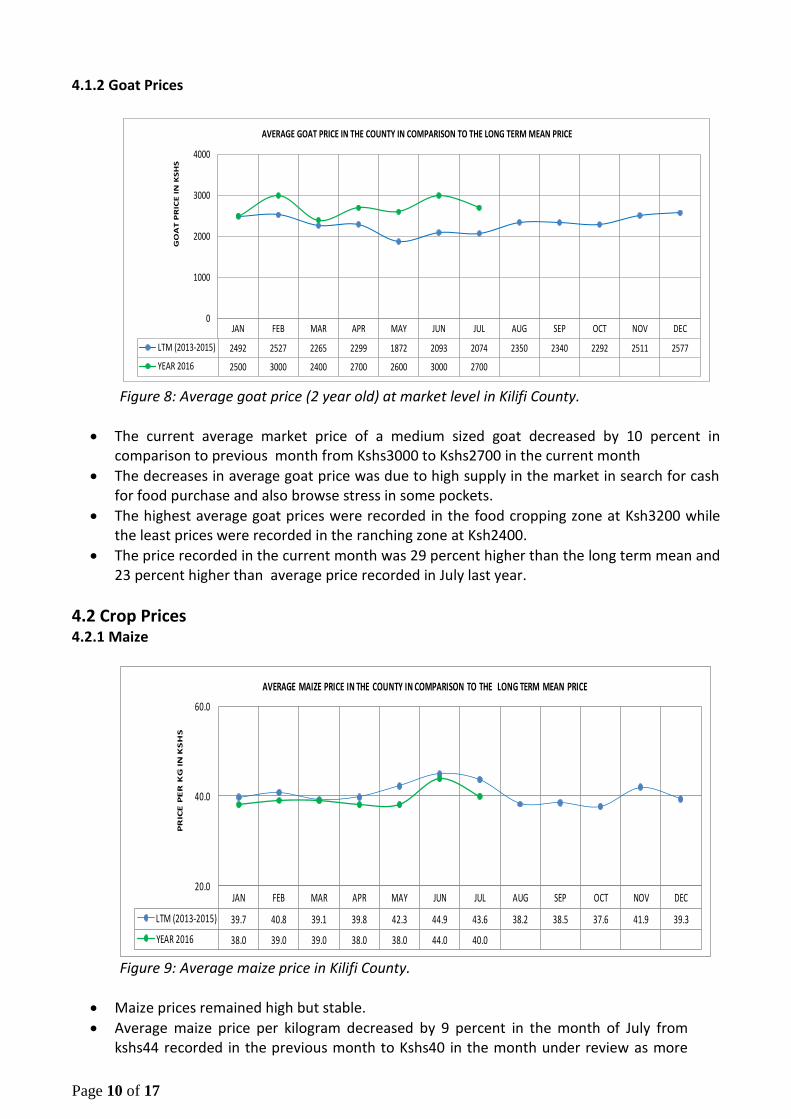
Figure 8: Average goat price (2 year old) at market level in Kilifi County.
The current average market price of a medium sized goat decreased by 10 percent in comparison to previous month from Kshs3000 to Kshs2700 in the current month
The decreases in average goat price was due to high supply in the market in search for cash for food purchase and also browse stress in some pockets.
The highest average goat prices were recorded in the food cropping zone at Ksh3200 while the least prices were recorded in the ranching zone at Ksh2400.
The price recorded in the current month was 29 percent higher than the long term mean and 23 percent higher than average price recorded in July last year.
4.2 Crop Prices 4.2.1 Maize
JAN FEB MAR APR MAY JUN JUL AUG SEP OCT NOV DEC
LTM (2013-2015) 39.7 40.8 39.1 39.8 42.3 44.9 43.6 38.2 38.5 37.6 41.9 39.3
YEAR 2016 38.0 39.0 39.0 38.0 38.0 44.0 40.0
20.0
40.0
60.0
PR
ICE
PE
R K
G IN
KS
HS
AVERAGE MAIZE PRICE IN THE COUNTY IN COMPARISON TO THE LONG TERM MEAN PRICE
Figure 9: Average maize price in Kilifi County.
Maize prices remained high but stable.
Average maize price per kilogram decreased by 9 percent in the month of July from kshs44 recorded in the previous month to Kshs40 in the month under review as more
Page 11 of 17
household preferred purchase sifted maize meal and some recorded some minimal maize crop harvest.
The ranching zone recorded the highest average price of Ksh50 per kilogram while the food cropping zone posted the lowest average price of Ksh30 per kilogram.
The observed average price was 9 percent lower compared to the long term mean price whereas it was 18 percent higher than the average price recorded in the same month last year.
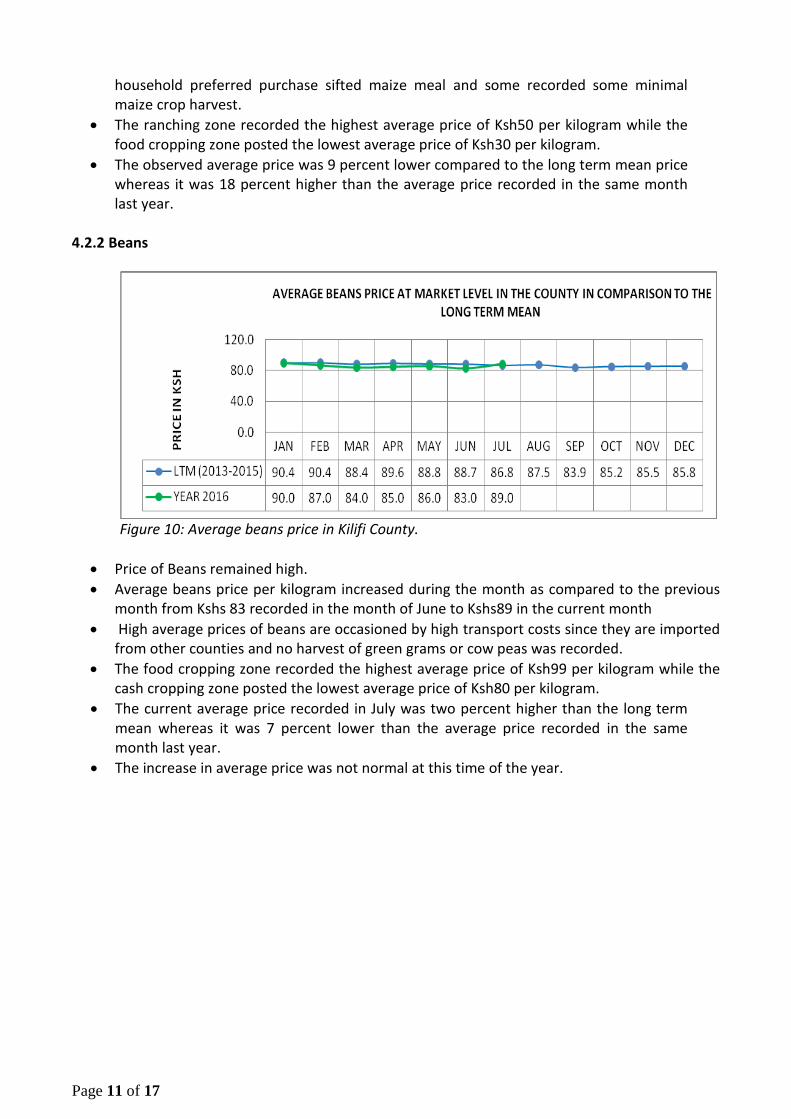
4.2.2 Beans
Figure 10: Average beans price in Kilifi County.
Price of Beans remained high.
Average beans price per kilogram increased during the month as compared to the previous month from Kshs 83 recorded in the month of June to Kshs89 in the current month
High average prices of beans are occasioned by high transport costs since they are imported from other counties and no harvest of green grams or cow peas was recorded.
The food cropping zone recorded the highest average price of Ksh99 per kilogram while the cash cropping zone posted the lowest average price of Ksh80 per kilogram.
The current average price recorded in July was two percent higher than the long term mean whereas it was 7 percent lower than the average price recorded in the same month last year.
The increase in average price was not normal at this time of the year.
Page 12 of 17
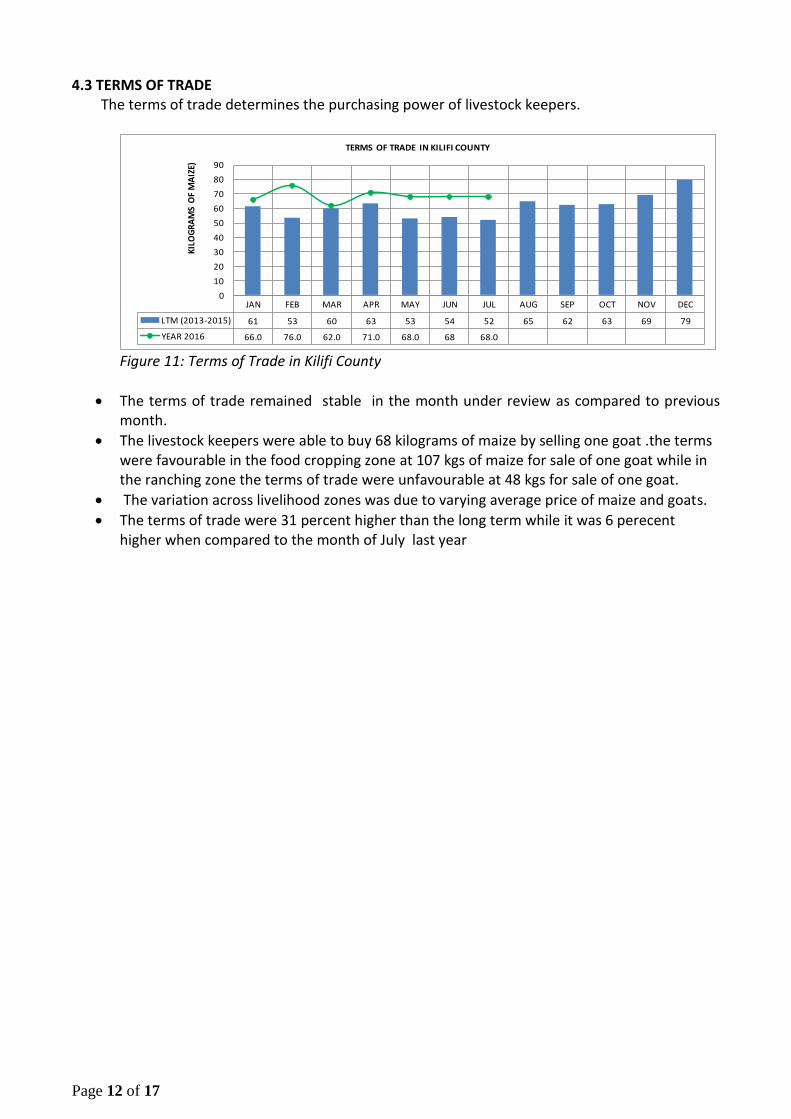
4.3 TERMS OF TRADE The terms of trade determines the purchasing power of livestock keepers.
JAN FEB MAR APR MAY JUN JUL AUG SEP OCT NOV DEC
LTM (2013-2015) 61 53 60 63 53 54 52 65 62 63 69 79
YEAR 2016 66.0 76.0 62.0 71.0 68.0 68 68.0
0
10
20
30
40
50
60
70
80
90
KIL
OG
RA
MS
OF
MA
IZE)
TERMS OF TRADE IN KILIFI COUNTY
Figure 11: Terms of Trade in Kilifi County
The terms of trade remained stable in the month under review as compared to previous month.
The livestock keepers were able to buy 68 kilograms of maize by selling one goat .the terms were favourable in the food cropping zone at 107 kgs of maize for sale of one goat while in the ranching zone the terms of trade were unfavourable at 48 kgs for sale of one goat.
The variation across livelihood zones was due to varying average price of maize and goats.
The terms of trade were 31 percent higher than the long term while it was 6 perecent higher when compared to the month of July last year

Page 13 of 17
5.0 NUTRITIONAL STATUS 5.1 Milk Consumption
There was two percent increase in the average milk consumed at households in the month of July as compared to the previous month
On average, 56 percent of the total milk produced in July was consumed at household level while the rest was sold to supplement households’ income.
Average household milk price remained high at Ksh41 per litre. In some parts (Adu ward) of Magarini milk production had declined significantly.
Farmers who delivered their milk to the dairy centers reported lower average price of Kshs30 per litre.
5.2 Health and Nutritional Status 5.2.1 Mid Upper Arm Circumference [MUAC]
Figure 12: Proportion of children under five at risk of malnutrition (MUAC<=135mm)
[n=1614]
Average percentage of children under five years at risk of malnutrition slightly decreased from 5% to 4.6% of the total children sampled in the in the current month.
This decrease can be attributed to increase in milk consumption, minimal harvest recorded in some parts of the food/cash cropping and mixed farming zones and a boost in household food stocks following the distribution of relief food by the National, County governments, also food donated by Kenya Military officials.
Kakuyuni sample area in the mixed farming zone recorded the high proportion of children at risk of malnutrition with 11.7%. Jila and Sosodemi in Ganze sub county also recorded high numbers of children at risk of malnutrition.
The proportion of children under five years at risk of malnutrition was 16 percent lower than the long term mean but 39 percent higher than the proportion recorded in July last year.

Page 14 of 17
5.3 Coping Strategies 5.3.1 Coping Strategy Index
JAN FEB MAR APR MAY JUN JUL AUG SEP OCT NOV DEC
LTM (2011-2015) 1.8 1.6 1.6 1.6 1.8 1.7 1.7 1.5 1.5 1.5 1.6 1.6
YEAR 2016 1.8 1.9 2.0 2.0 1.5 1.7 1.6
0.0
1.0
2.0
3.0
IND
EX
COPING STRATEGY INDEX FOR HOUSEHOLDS IN KILIFI COUNTY
Figure 13: Coping Strategy Index for Kilifi County
Coping Strategy Index (CSI) remained stable in the month under review compared to previous month at 1.6
This indicates that there was stability in food access at households compared to the previous month and this may be attributed to minimal harvest, food distribution by the National and County governments and also donated by Kenya Military officials.
The cash cropping zone recorded the least CSI of 1.0 while the highest CSI was recorded in the livestock farming zone( Ganze and Magarini sub counties) with a score of 3.5
The more prevalent coping mechanisms employed by households that faced food shortage in July were; Reduction in number and meal rations. Opting for less preferred or cheaper meals. Reduced quantity of food consumed by adults to ensure children get enough to eat Borrowing food from friends and relatives. Purchase of food on credit terms Charcoal burning
Page 15 of 17
6.0 CURRENT ONGOING INTERVENTION MEASURES
6.1 Food- aid Water trucking to Ganze and Magarini sub counties for affected schools and villages by
water department.
Food distribution by the national and county governments 4414 (90kg) bags of maize, 1000 bags of beans by the county government, 1050 (50 kg) bags of maize, 1050 (50 kg) bags of beans, 350 cartons of cooking oil. Some food (maize and beans) also donated by Kenya Military official
Supplementary/ Therapeutic feeding program in health facilities by County Department of Health/UNICEF and Kenya Red Cross.
Home Grown School Meals Programme in 29% of the public schools in Kilifi County by the Ministry of Education.
6.2 Non-food aid Excavation of Shomella water pan in Magarini sub county by NDMA and Kilifi County
Government.
Community sensitization on conservational Agriculture by County Department of Agriculture and FAO.
Cash for Asset by GoK/ WFP, World Vision, Kenya Red Cross Society and NDMA in Ganze, Kaloleni, Malindi, Rabai and Magarini Sub Counties.
Promotion on local poultry projects by ASDSP, KALRO.
Promotion on African Bird Eye Chill (ABEC) projects by ASDSP and Equator Kenya Limited.
Cassava Revitalization and Commercialization by CAST/ASDSP/NDMA in Kilifi County.
Promotion of irrigation farming in Magarini sub county (Gandini) by Kenya Red Cross.
Construction of milk collection and cooling centre in Rabai sub county by county department of Livestock production.
Extension of water pipeline across the sub counties by county department of water.
Growth monitoring of children under five at village level by Community Health Workers.
Community capacity building on appropriate infant and young child feeding practices
(mother-to-mother support groups) by county department of Health, Plan International and
World Vision.
Promotion of maternal and child health in the county by Share progamme in collaboration with the county department of health.
7.0 EMERGING ISSUES 7.1 Food Security Prognosis
Following the poor performance to failure of the long rains crop, households expected to depend
largely on the market for food supplies.
Food prices expected to remain high and record an increase due to demand.
Pasture condition expected to continue recording a deteriorating trend till the next rain season in
mid-October thus a deteriorating livestock body condition which will lead to a decrease in livestock
prices.
Average livestock trekking distance to water sources expected to record an increase as pasture and
water condition continued deteriorating.
Page 16 of 17
Livestock diseases (CBPP, CCPP and NCD) expected to be the rise as the dry spell hit and livestock
immigration necessitating decline in livestock prices hence creating unfavorable terms of trade for
the livestock dependent households.
Pipeline dependency as the main source expected to increase thus an increase in water prices mostly for diesel operated boreholes and too water trucking expected to rise as more water pans dried up.
Charcoal burning expected to record an increase as main source of income as income source
opportunities remained low.
Households expected to more severe coping strategies as household food stress expected to
increase due to poor to total failure of the long rains season.
7.2 THINGS WHICH NEED CLOSE MONITORING
Livestock migration into the county, conflicts between crop farmers and livestock keepers in
Magarini sub counties.
Livestock diseases
Under-five nutritional status
Household food security in Ganze and Magarini sub counties.
Food prices in the market
8.0 RECOMMENDATIONS Increase water trucking to Ganze and Magarini sub counties as water pans continued drying
and water stress increased.
Need for boreholes’ fuel subsidy as pipeline dependency increased and increasing the probability of a rise in water prices.
Need for boreholes (Kadzandani, Adu Majengo, Baricho and Marafa) repair and fuel subsides as more households depended on pipeline.
Livestock disease surveillance as livestock migration was recorded in Ganze and Magarinin sub counties in search for water.
Livestock vaccination against CBPP, CCPP and NCD which were the diseases recorded across the county.
Close monitoring of pasture condition in the ranching zone as the situation deteriorated fast.
Community Sensitization and capacity building on peace and security and monitoring of potential conflict areas along River Sabaki and Marereni location both in Magarini sub county as livestock immigration were recorded.
Close monitoring of nutritional status of the under-fives and pregnant and lactating mothers in Ganze and Magarini sub counties.
Upscale food distribution for affected households in Ganze and Magarini sub counties as the situation is forecast to deteriorate due ti poor performance of the 2016 long rains coupled with low performance of 2015 short rains.
Desilting major water pans (Jila, bofu, Kwa Hare, Kaoyeni, Kabaka, Kavunyararo, Adu, Zyadime…..) which are still holding some water from the 2015 long rains despite recording less than 5% recharge during the 2016 long rians.
Page 17 of 17
Promotion of irrigation farming as rain-fed agriculture continued recording poor yield.
Upscale and out-scale indigenous chicken rearing as households continued to own few birds though environment was conducive for chicken rearing.
Promotion of small-scale irrigation on high value crops in order contribute to household incomes and diversified household diet.
Close monitoring of under-fives’ nutritional status in Kakuyuni in the mixed farming zone and in the ranching zone of Ganze and Magarini areas which has continuously recorded higher percentage of children at risk of malnutrition.
Up scaling cash for asset programme as a way of creating resilience in the community through creation of community assets
Pipeline extension to Adu ward to cover areas under water stress such as Kamale and Marereni
Reintroduction of Supplementary feeds for moderately malnourished persons.