a view of the u.s. news & world report rankings of undergraduate
TRANSCRIPT

A View of the U.S. News & World Report Rankings of Undergraduate Institutions from the College Admission Counseling Perspective
Survey report from the National Association for College Admission Counseling Ad Hoc Committee on U.S. News & World Report Rankings
May 2011
NACAC Ad Hoc Committee on U.S. News & World Report Rankings
Peter Caruso, Chair, Boston College, MA
Bruce Chamberlin, Georgetown University, DC
Rafael S. Figueroa, Albuquerque Academy, NM
Pam Horne, Purdue University, IN
Irene Logan, Virginia State University
Lee Melvin, University of Connecticut
Joseph Prieto, Hinsdale Central High School, IL
Kris Getting Roach, University of St. Thomas, MN
Michael Sexton, Santa Clara University, CA

NACAC U.S. News & World Report Rankings Survey Report • May 2011 Page 2 of 18
In 2010, the National Association for College Admission
Counseling (NACAC) convened a group of members to
form an Ad Hoc Committee on U.S. News & World Report
Rankings. The Committee was convened to conduct
discussions with U.S. News staff for the purpose of offering
an organizational conduit through which to exchange ideas,
convey concerns, and respond to questions about each
organization’s respective constituency.
To help inform the Ad Hoc Committee, NACAC conducted
a survey of association members in May 2010 to gauge
attitudes of college admission counseling professionals
toward the U.S. News & World Report undergraduate
rankings publication. Major findings from the survey
research include:
A majority of college admission counseling professionals
hold negative opinions of the U.S. News & World Report
undergraduate rankings. On a scale of 1 (strenuously object
to rankings) to 100 (strongly support the rankings), high
school counselors rated the U.S. News rankings a twenty
nine and college admission officers rated the rankings a
thirty nine. A majority of respondents believe that the rank-
ings have increased in prominence over the past five years.
Public schools and institutions tended to view the
rankings slightly more favorably than private schools and
institutions. In many cases, public high school counselors
were more charitable toward the rankings than private
school counselors. In a few cases, public college admission
officers were more charitable toward the rankings than
private college admission officers.
College admission counseling professionals believe the title
“America’s Best Colleges” (or “Best Colleges” as of August
2010) is not an accurate representation of the information
in the publication. Only 2.9 percent of respondents believe
that “America’s Best Colleges” accurately represents the
information contained in the rankings publication. Many
respondents posed the question, “Best for whom?” to
emphasize the lack of objective measures of the fit between
student and college. A large majority of respondents believe
that the rankings offer misleading conclusions about
institutional quality.
College admission counseling professionals find useful
resources in the publications aside from the rankings.
Articles on preparing for and narrowing the college search, as
well as articles about paying for college, are well-received by
respondents. Rankings of colleges are perceived as the least
helpful feature in the publication.
Colleges use rankings to market themselves. A majority
of colleges that are ranked in the U.S. News publication
promote their ranking as part of their marketing strategy.
College admission officers believe rankings encourage counter-
productive behavior among colleges, though they are less likely
to believe that such behavior takes place on their campus.
More than 90 percent of colleges believe the rankings put
pressure on institutions to invest in strategies to maintain their
rankings, though only 46 percent believe that their institution
makes programmatic changes because of their rankings.
College admission counseling professionals find the rankings
methodology problematic. A majority of respondents believe
that several core elements of the U.S. News rankings
methodology are either “poor” or “not at all” predictors of
college quality, including the peer assessments, student
selectivity, and alumni giving. A majority of respondents also
believe that graduation/retention rates, faculty resources,
financial resources, and graduation rate performance are
“fair” or “good” indicators of college quality.
Next Steps
The Ad Hoc Committee will propose recommendations for
action to the NACAC Board of Directors and issue a final
report, based on these survey results, the committee’s
continued discussions, and the committee’s recommendations
at the NACAC National Conference in September 2011.
Executive Summary
To help inform the Ad Hoc Committee, NACAC conducted a survey of association members
in May 2010 to gauge attitudes of college admission counseling professionals…
NACAC U.S. News & World Report Rankings Survey Report • May 2011 Page 3 of 18
In 2010, the National Association for College Admission
Counseling (NACAC) convened a group of members to
form an Ad Hoc Committee on U.S. News & World Report
Rankings. The Committee was convened to conduct
discussions with U.S. News staff for the purpose of offering
an organizational conduit through which to exchange ideas,
convey concerns, and respond to questions about each
organization’s respective constituency.
To help inform the Ad Hoc Committee, NACAC conducted
a survey of association members in May 2010 to gauge
attitudes of college admission counseling professionals
toward the U.S. News & World Report rankings publication,
“America’s Best Colleges.” This report on the survey findings
will be followed by a series of conversations with college
admission counseling professionals via NACAC’s member
communication channels and at Affiliate conferences in
Spring 2011. The Committee anticipates issuing a final
report, to include further research and recommendations to
the association, at the NACAC National Conference in
Fall 2011.
For purposes of this report, the term “Committee” refers only
to the NACAC members who serve on the Ad Hoc Committee.
Representatives of U.S. News & World Report meet with
the Ad Hoc Committee to ensure an open dialogue with the
association, but their views are not represented in this report.
For the official public summaries of meetings between both
NACAC and U.S. News & World Report representatives, visit
the Ad Hoc Committee’s Web page.
The first section of this report examines general NACAC
member attitudes toward the “America’s Best Colleges”
ranking publication. Those who are familiar with the college
admission counseling profession will not be surprised that
NACAC members expressed a significant degree of skepticism
and dislike of the U.S. News & World Report rankings.
However, the Committee believes it is important—for
practitioners, students and families—to carefully examine
member attitudes toward the rankings if we are to make
responsible recommendations about the role and influence of
rankings in college admission.
The second section examines how NACAC members use
the “America’s Best Colleges”1 ranking publication. Despite
holding strong negative attitudes toward the U.S. News &
World Report rankings, as revealed by the first section, the
majority of NACAC members still use the rankings in their
admission and advising work. It is therefore vital to consider
the influence of rankings on the college search process.
The third section examines how NACAC members feel about
specific elements and features of the U.S. News & World
Report rankings publication. Members hold particularly
negative opinions of the peer assessment, student selectivity
and alumni giving elements of the rankings methodology
and believe the annual rankings of colleges to be the
least helpful feature in the publication. In responding to
the survey, some members proposed a variety changes
that could be made to improve the rankings and related
materials, while others stood entirely opposed to the
practice of ranking colleges and universities.
Introduction
Despite holding strong negative attitudes toward the U.S. News & World Report rankings, as revealed by the first section, the majority of NACAC members still use the rankings in their admission and advising work.
1 Now called “Best Colleges” as of August 17, 2010.

NACAC U.S. News & World Report Rankings Survey Report • May 2011 Page 4 of 18
Confirming What We Know: College Admission Counseling Professionals Hold Generally Negative Assessments of the Rankings
NACAC members were asked to indicate, on a scale from one
to 100, their general attitude toward the U.S. News & World
Report rankings. A score of one represents a strenuous objection
to U.S. News rankings, while 50 represents a completely neutral
attitude and 100 indicates strong support. The mean scores,
which are presented in Figure 1, reveal generally negative
opinions of the rankings among respondents.
0 20 40 60 80 100
Figure 1. Average Perceptions of US News Rankings on "Feeling Thermometer"
College
High School
Total
High school counselors (mean score of 28.67) expressed
lower regard for the rankings than college admissions officers
(mean score of 38.54), but both groups held negative
views (under fifty) toward the rankings.2 Public high school
counselors viewed the rankings slightly more charitably (mean
score of 35.11) than private high school counselors (mean
score of 23.92).
How Influential Are the Rankings?
If college admission counseling professionals are, on the
whole, negatively inclined toward them, is the influence of
rankings such that we should be more concerned, or less
concerned, about their effects on college admission and
counseling? NACAC members were asked about their opinions
on the change in prominence of the U.S. News & World
Report rankings over the last five years. As Figure 2 suggests,
a majority of NACAC members believe that the prominence
of the U.S. News & World Report rankings has increased over
the past five years.
0.0%5.0%
10.0%15.0%20.0%25.0%30.0%35.0%40.0%
Muchmore
Somewhatmore
Same Somewhatless
Much less
Figure 2. Change in Prominence of USNWR Rankings Over Past Five Years
College
High School
Total
“Best for Whom?”
NACAC members expressed something approaching a
consensus on the question of whether the title of U.S.
News & World Report’s annual publication, “America’s
Best Colleges,” accurately represents the information
presented therein.
0.0%10.0%20.0%30.0%40.0%50.0%60.0%70.0%
Accurately Somewhataccurately
Not at allaccurately
Figure 3. How accurately does the title "America's Best Colleges" describe content in
publication?
College
High School
Total
Only 2.9 percent of all respondents (2.4 percent of high
school counselors and 3.3 percent of college admission
professionals) believed that the title of the publication
accurately represents the content delivered by the
publication. The majority of college admission officers (51.3
percent) and high school counselors (61.9 percent) reported
that the title is not at all accurate (Figure 3).
Section One Only 2.9 percent of all respondents believed that
the title of the publication accurately represents
the content delivered by the publication.
2 To ensure that the mean was not masking highly polarized opinions, we examined the median scores as well. High school counselors’ median feeling thermometer score was twenty five, while college admission officers’ median score was thirty five.

NACAC U.S. News & World Report Rankings Survey Report • May 2011 Page 5 of 18
As Figure 4 indicates, public high school counselors were
slightly more likely to believe that the title at least “somewhat
accurately” describes the content in the publication.
0.0%10.0%20.0%30.0%40.0%50.0%60.0%70.0%80.0%
Accurately Somewhataccurately
Not at all accurately
Figure 4. How Accurately does the title "America's Best Colleges" describe content in publication?
HS Results Only
Public
Private
More than 600 NACAC members offered comments on this
question in addition to their multiple choice responses. The
most common themes in the open ended responses add
substance to the general notion that the title of “America’s
Best Colleges” does not accurately convey the information
contained in the publication to consumers.
Common themes included:
• “TheBestforWhom?”—Many members stated
that the best college for an individual student
will be determined by the goodness of fit between
institution and student.
• “What’sinaRank?”—Members argued that the
difference in numeric rank between colleges is at
least somewhat arbitrary by virtue of the weighting
system used in the methodology, that making
subsequent rank order distinctions between colleges
does not prove that one college is “better” than
another, and that the weights of the factors, when
changed, have produced and will produce different
rankings.
• Inputsvs.Outputs—Members find it difficult to
explain what the term “best” describes—many
believe that the rankings’ use of “input” variables
(including selectivity and test scores) and other
variables not related to directly measurable outputs
(such as the peer assessments) lead consumers to
make decisions based on information unrelated to
the quality of education provided at the institutions
Beyond the Title—Member Attitudes About the Utility of the Rankings Publication
When asked about the utility of the U.S. News & World
Report rankings publication, NACAC members felt that the
publication itself contained potentially helpful resources and
focused their concern on the rank ordering of colleges.
Helpful Resource for Students and Families?
Overall, NACAC members differed as to whether the rankings
are a helpful resource for students and families interested in
college information.
0.0%
10.0%
20.0%
30.0%
40.0%
50.0%
Agree Somewhatagree
Somewhatdisagree
Disagree
Figure 5. Rankings Are a Helpful Resource for Students and Families Interested in College
Information
College
High School
Total
College respondents were more likely than high school
respondents to at least “somewhat agree” (55.4 percent vs.
39.3 percent) that the rankings are a helpful resource (Figure
5). The split between college and high school opinions on
this question reveals a potentially important and well-known
difference between the two professional segments. Namely,
colleges may be more inclined to view the rankings as
containing information that is useful to students and families,
though potentially flawed in presentation and interpretation.
Conversely, high school counselors appear more apt to view
the rankings as doing more harm than good on balance.
Americans love rankings—of all things—and unfortunately higher education, whether we like it or not, is part of the rankings system. We need to help families understand that small differences
are meaningless and to also understand why the items that are ranked actually matter.
NACAC U.S. News & World Report Rankings Survey Report • May 2011 Page 6 of 18
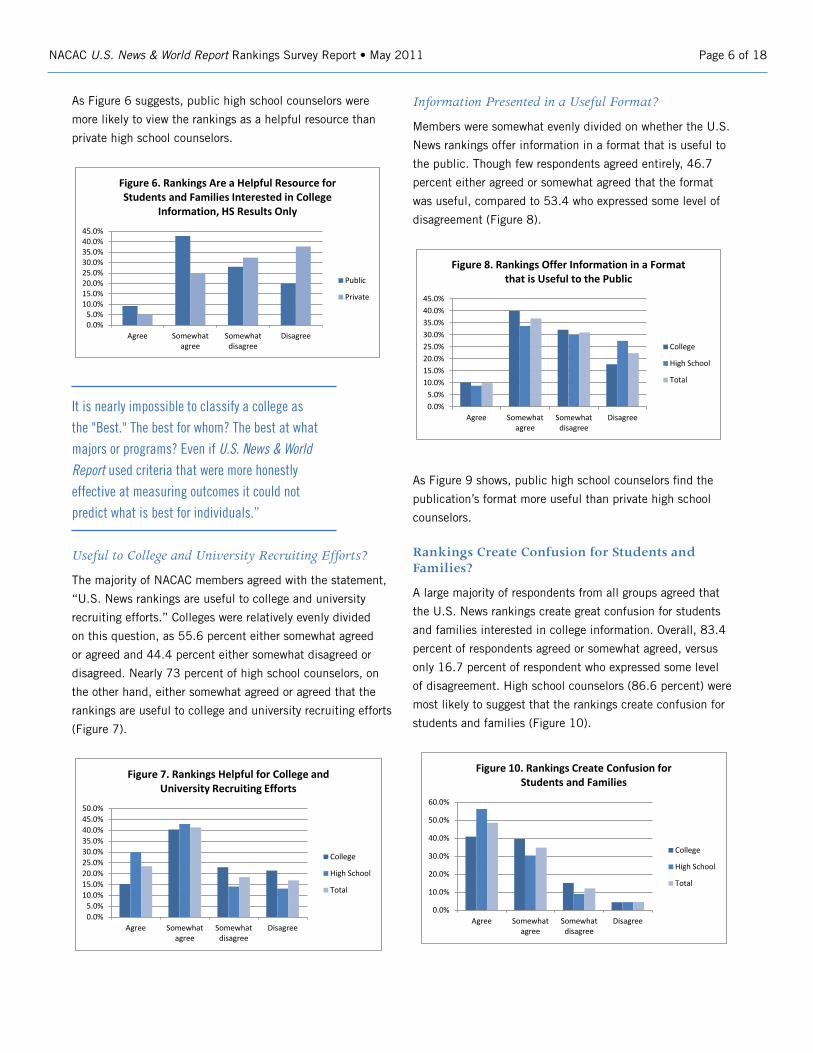
As Figure 6 suggests, public high school counselors were
more likely to view the rankings as a helpful resource than
private high school counselors.
0.0%5.0%
10.0%15.0%20.0%25.0%30.0%35.0%40.0%45.0%
Agree Somewhatagree
Somewhatdisagree
Disagree
Figure 6. Rankings Are a Helpful Resource for Students and Families Interested in College
Information, HS Results Only
Public
Private
Useful to College and University Recruiting Efforts?
The majority of NACAC members agreed with the statement,
“U.S. News rankings are useful to college and university
recruiting efforts.” Colleges were relatively evenly divided
on this question, as 55.6 percent either somewhat agreed
or agreed and 44.4 percent either somewhat disagreed or
disagreed. Nearly 73 percent of high school counselors, on
the other hand, either somewhat agreed or agreed that the
rankings are useful to college and university recruiting efforts
(Figure 7).
0.0%5.0%
10.0%15.0%20.0%25.0%30.0%35.0%40.0%45.0%50.0%
Agree Somewhatagree
Somewhatdisagree
Disagree
Figure 7. Rankings Helpful for College and University Recruiting Efforts
College
High School
Total
Information Presented in a Useful Format?
Members were somewhat evenly divided on whether the U.S.
News rankings offer information in a format that is useful to
the public. Though few respondents agreed entirely, 46.7
percent either agreed or somewhat agreed that the format
was useful, compared to 53.4 who expressed some level of
disagreement (Figure 8).
0.0%5.0%
10.0%15.0%20.0%25.0%30.0%35.0%40.0%45.0%
Agree Somewhatagree
Somewhatdisagree
Disagree
Figure 8. Rankings Offer Information in a Format that is Useful to the Public
College
High School
Total
As Figure 9 shows, public high school counselors find the
publication’s format more useful than private high school
counselors.
Rankings Create Confusion for Students and Families?
A large majority of respondents from all groups agreed that
the U.S. News rankings create great confusion for students
and families interested in college information. Overall, 83.4
percent of respondents agreed or somewhat agreed, versus
only 16.7 percent of respondent who expressed some level
of disagreement. High school counselors (86.6 percent) were
most likely to suggest that the rankings create confusion for
students and families (Figure 10).
0.0%
10.0%
20.0%
30.0%
40.0%
50.0%
60.0%
Agree Somewhatagree
Somewhatdisagree
Disagree
Figure 10. Rankings Create Confusion for Students and Families
College
High School
Total
It is nearly impossible to classify a college as the "Best." The best for whom? The best at what majors or programs? Even if U.S. News & World Report used criteria that were more honestly effective at measuring outcomes it could not predict what is best for individuals.”
NACAC U.S. News & World Report Rankings Survey Report • May 2011 Page 7 of 18
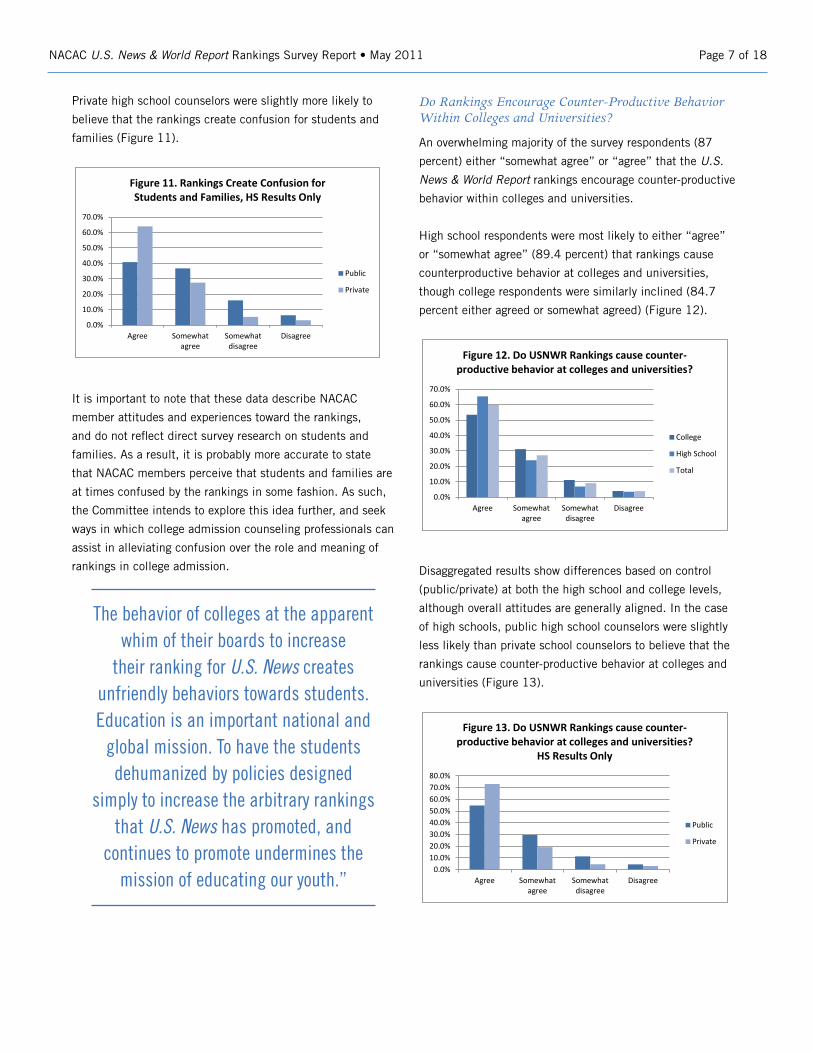
Private high school counselors were slightly more likely to
believe that the rankings create confusion for students and
families (Figure 11).
0.0%
10.0%
20.0%
30.0%
40.0%
50.0%
60.0%
70.0%
Agree Somewhatagree
Somewhatdisagree
Disagree
Figure 11. Rankings Create Confusion for Students and Families, HS Results Only
Public
Private
It is important to note that these data describe NACAC
member attitudes and experiences toward the rankings,
and do not reflect direct survey research on students and
families. As a result, it is probably more accurate to state
that NACAC members perceive that students and families are
at times confused by the rankings in some fashion. As such,
the Committee intends to explore this idea further, and seek
ways in which college admission counseling professionals can
assist in alleviating confusion over the role and meaning of
rankings in college admission.
Do Rankings Encourage Counter-Productive Behavior Within Colleges and Universities?
An overwhelming majority of the survey respondents (87
percent) either “somewhat agree” or “agree” that the U.S.
News & World Report rankings encourage counter-productive
behavior within colleges and universities.
High school respondents were most likely to either “agree”
or “somewhat agree” (89.4 percent) that rankings cause
counterproductive behavior at colleges and universities,
though college respondents were similarly inclined (84.7
percent either agreed or somewhat agreed) (Figure 12).
0.0%
10.0%
20.0%
30.0%
40.0%
50.0%
60.0%
70.0%
Agree Somewhatagree
Somewhatdisagree
Disagree
Figure 12. Do USNWR Rankings cause counter-productive behavior at colleges and universities?
College
High School
Total
Disaggregated results show differences based on control
(public/private) at both the high school and college levels,
although overall attitudes are generally aligned. In the case
of high schools, public high school counselors were slightly
less likely than private school counselors to believe that the
rankings cause counter-productive behavior at colleges and
universities (Figure 13).
0.0%10.0%20.0%30.0%40.0%50.0%60.0%70.0%80.0%
Agree Somewhatagree
Somewhatdisagree
Disagree
Figure 13. Do USNWR Rankings cause counter-productive behavior at colleges and universities?
HS Results Only
Public
Private
The behavior of colleges at the apparent whim of their boards to increase
their ranking for U.S. News creates unfriendly behaviors towards students. Education is an important national and
global mission. To have the students dehumanized by policies designed
simply to increase the arbitrary rankings that U.S. News has promoted, and
continues to promote undermines the mission of educating our youth.”

NACAC U.S. News & World Report Rankings Survey Report • May 2011 Page 8 of 18
Among colleges, admission officers from public institutions
were slightly less likely to believe that the rankings caused
counter-productive behavior than admission officers at private
institutions (Figure 14).
0.0%
10.0%
20.0%
30.0%
40.0%
50.0%
60.0%
Agree Somewhatagree
Somewhatdisagree
Disagree
Figure 14. Do USNWR Rankings cause counter-productive behavior at colleges and universities?
College Results Only
Public
Private
Committee discussions to this point have noted the widely-
held perception that colleges are heavily incentivized to
“game” the rankings by manipulating data they submit in
any numbers of ways. As the Committee proceeds with its
discussions of the survey results, it will seek feedback from
members about ways in which the association might address
the environment created by the rankings, the incentives the
environment creates, and avenues for members to ensure the
integrity of information conveyed to students and families.
Misleading Conclusions About Institutional Quality?
An overwhelming 89.1 percent of all respondents agreed or
somewhat agreed that the U.S. News & World Report rankings
offer misleading conclusions about institutional quality. As
Figure 15 shows, opinions did not vary substantially between
college and high school members.
0.0%10.0%20.0%30.0%40.0%50.0%60.0%70.0%80.0%
Agree Somewhatagree
Somewhatdisagree
Disagree
Figure 15. USNWR Rankings Offer Misleading Conclusions about Institutional Quality
College
High School
Total
Disaggregated results among high schools again reveal a
slight difference between public and private high school
opinions about the conclusions drawn by the rankings about
institutional quality, though the differences in this case are
slight (Figure 16).
0.0%10.0%20.0%30.0%40.0%50.0%60.0%70.0%80.0%90.0%
Agree Somewhatagree
Somewhatdisagree
Disagree
Figure 16. USNWR Rankings Offer Misleading Conclusions about Institutional Quality, HS
Results Only
Public
Private
These results, combined with the responses to the question
about the accuracy of the title, “America’s Best Colleges,”
offer the clearest indication of where NACAC member
concerns are grounded.3
Ever since they first arrived I've argued that this controversy
really reflects higher education's inability to articulate and
provide convincing evidence of its quality. It says VOLUMES about the state of assessment on our campuses. We should focus on that issue and less
trying to get U.S. News to change something that's a
big seller because of our own industry's inadequacies in providing better evidence!
3 There was a strong and statistically significant correlation (-.521, p<.01) between responses to the feeling thermometer question and the question about the accuracy of the title “America’s Best Colleges.”

NACAC U.S. News & World Report Rankings Survey Report • May 2011 Page 9 of 18
Section Two
Rankings and Recruiting
Section One revealed that a majority of NACAC members
believe the rankings are, generally speaking, useful to college
and university recruiting efforts. A specific example of the
rankings’ utility for colleges—the promotion of an institution’s
rank in its marketing materials—is shown in Figure 17.
Because a majority of NACAC members representing high
schools are not presented at all in the U.S. News & World
Report rankings, only responses from members representing
colleges are discussed for this question.
0.0%
10.0%
20.0%
30.0%
40.0%
50.0%
60.0%
Yes, promotewidely
Yes, promotein a limited
fashion
No, do notpromote
Not presentedfavorably
Not presentedat all
Figure 17. Promote Rankings in Marketing Strategy, College Results Only
Of the 88.6 percent of college members who are included
in the rankings, only 2.8 percent report being presented
unfavorably. Among the remaining 79.8 percent of college
members who are presented favorably in the U.S. News
& World Report rankings, over two-thirds (71.3 percent)
promote their rank, though most do so in a limited fashion.
Among colleges, public institutions were slightly more likely
to promote their ranking than private institutions (Figure 18).
0.0%
10.0%
20.0%
30.0%
40.0%
50.0%
60.0%
Yes,promotewidely
Yes,promote in
a limitedfashion
No, do notpromote
Notpresentedfavorably
Notpresented
at all
Figure 18. Promote Rankings in Marketing Strategy, College Results Only
Public
Private
Rankings in Counseling and Admission Offices
NACAC members were asked whether they spend “a great
deal of time,” “some time,” or “no time” discussing or
answering questions about the U.S. News & World Report
rankings. As Figure 19 shows, a majority of members spend
at least some time discussing U.S. News rankings with
students and families.
0.0%
10.0%
20.0%
30.0%
40.0%
50.0%
60.0%
70.0%
Great deal of time Some time No time
Figure 19. Time Spent Discussing Rankings with Students and Families
College
High School
Total
Members representing colleges and universities were split
almost 50/50 between spending no time and some time
on the rankings. NACAC high school members, however,
were more likely to spend some time on the rankings (65.2
percent) than no time (30.1 percent). Due to the fact that
high school respondents held more negative opinions about
the rankings than college respondents (as seen in the first
section), it is possible that this discrepancy is a result of
a strong demand among families and students for ranking
information in counseling offices, rather than a stronger
desire or willingness to discuss the rankings among high
school counselors.
Smart institutional leaders will find
alignments between institutional mission/
vision and advancement in rankings, if
that is a priority. While rankings are often
sighted, in general institutional leaders
pick and choose the areas to address,
and the idea that these drive institutional
decisions is wildly over-stated.
NACAC U.S. News & World Report Rankings Survey Report • May 2011 Page 10 of 18
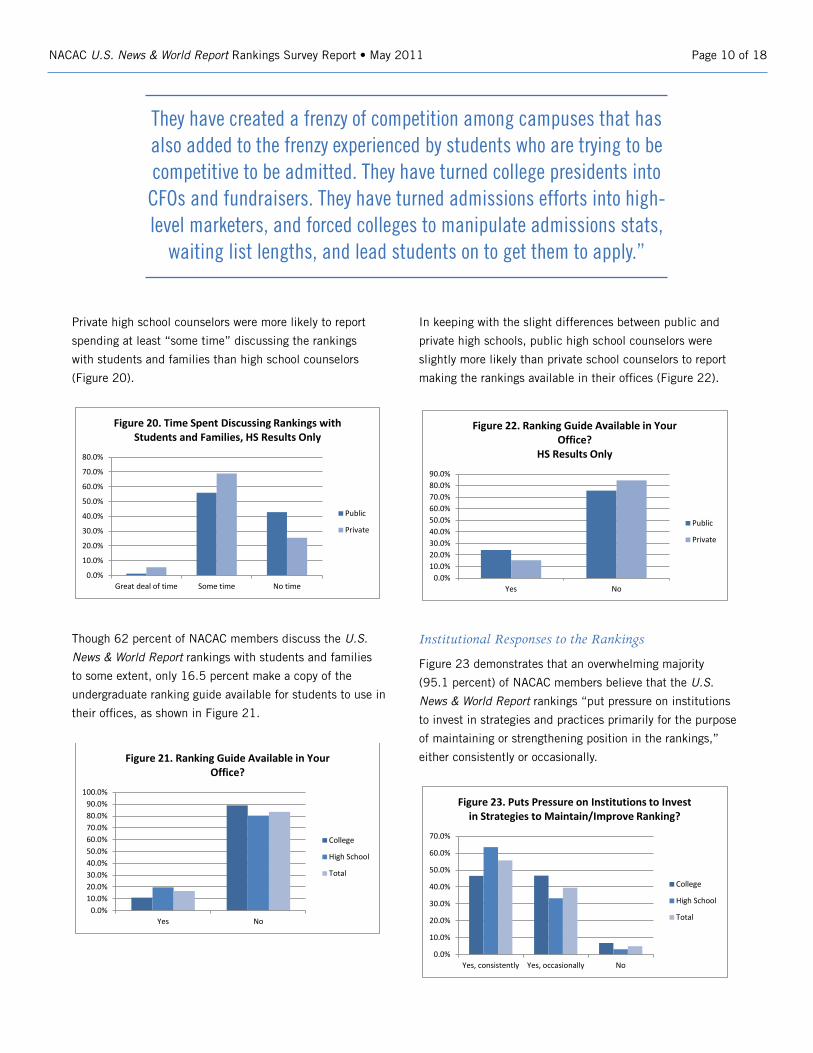
Private high school counselors were more likely to report
spending at least “some time” discussing the rankings
with students and families than high school counselors
(Figure 20).
0.0%
10.0%
20.0%
30.0%
40.0%
50.0%
60.0%
70.0%
80.0%
Great deal of time Some time No time
Figure 20. Time Spent Discussing Rankings with Students and Families, HS Results Only
Public
Private
Though 62 percent of NACAC members discuss the U.S.
News & World Report rankings with students and families
to some extent, only 16.5 percent make a copy of the
undergraduate ranking guide available for students to use in
their offices, as shown in Figure 21.
0.0%10.0%20.0%30.0%40.0%50.0%60.0%70.0%80.0%90.0%
100.0%
Yes No
Figure 21. Ranking Guide Available in Your Office?
College
High School
Total
In keeping with the slight differences between public and
private high schools, public high school counselors were
slightly more likely than private school counselors to report
making the rankings available in their offices (Figure 22).
0.0%10.0%20.0%30.0%40.0%50.0%60.0%70.0%80.0%90.0%
Yes No
Figure 22. Ranking Guide Available in Your Office?
HS Results Only
Public
Private
Institutional Responses to the Rankings
Figure 23 demonstrates that an overwhelming majority
(95.1 percent) of NACAC members believe that the U.S.
News & World Report rankings “put pressure on institutions
to invest in strategies and practices primarily for the purpose
of maintaining or strengthening position in the rankings,”
either consistently or occasionally.
0.0%
10.0%
20.0%
30.0%
40.0%
50.0%
60.0%
70.0%
Yes, consistently Yes, occasionally No
Figure 23. Puts Pressure on Institutions to Invest in Strategies to Maintain/Improve Ranking?
College
High School
Total
They have created a frenzy of competition among campuses that has also added to the frenzy experienced by students who are trying to be competitive to be admitted. They have turned college presidents into CFOs and fundraisers. They have turned admissions efforts into high-level marketers, and forced colleges to manipulate admissions stats,
waiting list lengths, and lead students on to get them to apply.”

NACAC U.S. News & World Report Rankings Survey Report • May 2011 Page 11 of 18
High school members are more suspicious of institutional
responses to the rankings. Nearly two-thirds (63.6 percent)
of high school respondents believe that the rankings
“consistently” put pressure on institutions, compared to only
46.5 percent of college respondents.
More than 300 NACAC members offered comments on this
question in addition to their multiple choice responses.
The most common themes in the open ended responses
add substance to the general belief institutions and schools
are pressured to make programmatic changes in efforts to
improve their rankings. Common themes included:
• Manipulating numbers—Many members believe
that schools manipulate the data that is used to
calculate the U.S. News & World Report rankings,
especially admit and yield4 rates, with wait lists,
fast-track applications, and early decision programs.
• Outside pressure—Members commonly reported
being pressured by their institution’s presidents,
trustees, and faculty to adopt strategies that would
increase their rank.
• Benefits—Some members argued that the pressure
to improve rankings can benefit schools, colleges,
and students by encouraging policies that improve
certain student-centered features, including
retention rate and class size.
In contrast to the data shown in Figure 23, 54.1 percent of
NACAC members representing colleges reported that their
particular institutions do not make any programmatic changes
based on the rankings, as seen in Figure 24. Because the
U.S. News & World Report high school rankings are less
prominent and influential than the college rankings, only
responses from NACAC members representing colleges are
discussed for this question.5
0.0%
10.0%
20.0%
30.0%
40.0%
50.0%
60.0%
Yes, consistently Yes, occasionally No
Figure 24. School or Institution Makes Programmatic Changes Because of Rankings,
College Results Only
Very few NACAC college members (7.6 percent) report that
their institutions consistently “make programmatic changes
at least in part because of their influence on the rankings.”
Over one-third of college respondents (38.4 percent)
report that their particular institutions do so occasionally.
Comparing Figures 23 and 24 yields an interesting
contrast. College respondents’ beliefs that institutions are
“gaming” the rankings generally seems to apply to other
colleges, whereas they are less likely to perceive their own
institution as manipulating the process. The Committee
will explore this finding further as they meet and share
information with members over the coming months.
Any attempt—ANY—to distill the concept of academic quality down to a single metric is based solely in marketing and is antithetical to all best practices in conducting a proper college search. As has been said on this matter countless times, what is best for one student is not necessarily best for another, let alone best for all. The
guiding principles for finding the right college for any student must be rooting in fit and match, and there is no ranking system that can accomplish this. This applies to
USNWR, Forbes, Newsweek, and every single publication that tries to make the college search process easier for families by selling millions of issues of their publication.
4 Yield rates are no longer used in the U.S. News rankings formula.5 The high school member responses for the question regarding the promotion of rankings were as follows: 6.7 percent consistently make changes based on the rankings, 20.4 percent occasionally make changes based on the rankings, and 72.9 percent do not make any changes based on the rankings.
NACAC U.S. News & World Report Rankings Survey Report • May 2011 Page 12 of 18
Section Three
Elements of the Rankings Methodology
NACAC members were asked to classify seven elements of
the U.S. News & World Report college rankings methodology
as either good indicators of college quality, fair though
imperfect indicators of college quality, poor indicators of
college quality that provide useful information, or not at all
indicators of college quality. Members are more critical of
the peer assessment, student selectivity and alumni giving
elements of the methodology and more positive regarding the
measures of financial resources, faculty resources, graduation
rate performance and graduation and retention rate.
Peer Assessments
A very small portion of NACAC members (5.8 percent) think
that the peer assessments issued by U.S. News & World
Report are good indicators of college quality. The remaining
94.2 percent of respondents are split nearly evenly between
the remaining categories, with college admission officers
more likely to report that the assessments do not provide
any indication of quality (39.7 percent) than high school
counselors (32.5 percent) (Figure 25).
0.0%
5.0%
10.0%
15.0%
20.0%
25.0%
30.0%
35.0%
40.0%
45.0%
Goodindicator
Fair indicator Poorindicator
Not anindicator
Figure 25. Peer Assessments
College
High School
Total
Disaggregated results by control (public/private) reveal
differences as to respondents’ viewpoints about the peer
assessment portion of the rankings methodology. Among high
schools, a majority (54 percent) of public school counselors
believe that the peer assessments are at least a “fair”
indicator of institutional quality. Meanwhile, more than two-
thirds (68 percent) of private high school counselors believe
that the peer assessments were either “poor” or “not at all”
indicators of institutional quality (Figure 26).
0.0%
5.0%
10.0%
15.0%
20.0%
25.0%
30.0%
35.0%
40.0%
45.0%
Good indicator Fair indicator Poor indicator Not anindicator
Figure 26. Peer Assessments, HS Results Only
Public
Private
Among colleges, admission officers from public institutions
were slightly more likely (38 percent) to believe that the peer
assessments were at least a “fair” indicator of institutional
quality than admission officers from private institutions (27
percent) (Figure 27).
0.0%5.0%
10.0%15.0%20.0%25.0%30.0%35.0%40.0%45.0%50.0%
Good indicator Fair indicator Poor indicator Not anindicator
Figure 27. Peer Assessments, College Results Only
Public
Private
A very small portion of NACAC members think that the peer assessments issued
by U.S. News & World Report are good indicators of college quality.

NACAC U.S. News & World Report Rankings Survey Report • May 2011 Page 13 of 18
Graduation and Retention Rates
An overwhelming majority of respondents (88.1 percent)
view graduation and retention rates as either “good” or “fair”
indicators of college quality, though, of those, more would
describe them as fair and imperfect (forty eight percent) than
good (40.1 percent) (Figure 28). Only 2.3 percent believe
that the rates are not indicators of college quality and do not
provide any useful information. Among all of the elements of
the U.S. News & World Report methodology, graduation and
retention rates are viewed most favorably.
0.0%
10.0%
20.0%
30.0%
40.0%
50.0%
60.0%
Goodindicator
Fair indicator Poorindicator
Not anindicator
Figure 28. Graduation and Retention Rates
College
High School
Total
Faculty Resources
Survey respondents are also positive about the measures
of faculty resources used in the U.S. News & World Report
rankings methodology. A majority of NACAC members (52.8
percent) think that faculty resources provide a fair but
imperfect measure of college quality, while only five percent
say that they provide no indication of quality. College and
high school respondents expressed very similar views in
response to this question (Figure 29).
0.0%
10.0%
20.0%
30.0%
40.0%
50.0%
60.0%
Goodindicator
Fair indicator Poorindicator
Not anindicator
Figure 29. Faculty Resources
College
High School
Total
Student Selectivity
Forty percent of NACAC members, including 44.2 percent
of high school respondents and 35.9 percent of college
respondents, think that student selectivity measures
provide a “poor” indication of college quality but offer
useful information for students and families (Figure 30).
Responses to subsequent open ended questions reveal that
some members find the measures of selectivity useful for
anticipating a student’s chance of acceptance.
Public school counselors (forty five percent) were slightly
more likely to believe that student selectivity was a “fair” or
“good” indicator of institutional quality than private school
counselors (thirty four percent) (Figure 31).
0.0%5.0%
10.0%15.0%20.0%25.0%30.0%35.0%40.0%45.0%50.0%
Good indicator Fair indicator Poor indicator Not anindicator
Figure 31. Student Selectivity, HS Results Only
Public
Private
is not going away. I think it's
important as an organization to keep
discussions in the public eye, as it
brings awareness to families to "look
beyond the rankings" The guide does
contain a lot of good information
about schools that can be used for
comparing—graduation rates, costs,
student demographics—I use it as a
resource a lot for those purposes.
NACAC U.S. News & World Report Rankings Survey Report • May 2011 Page 14 of 18
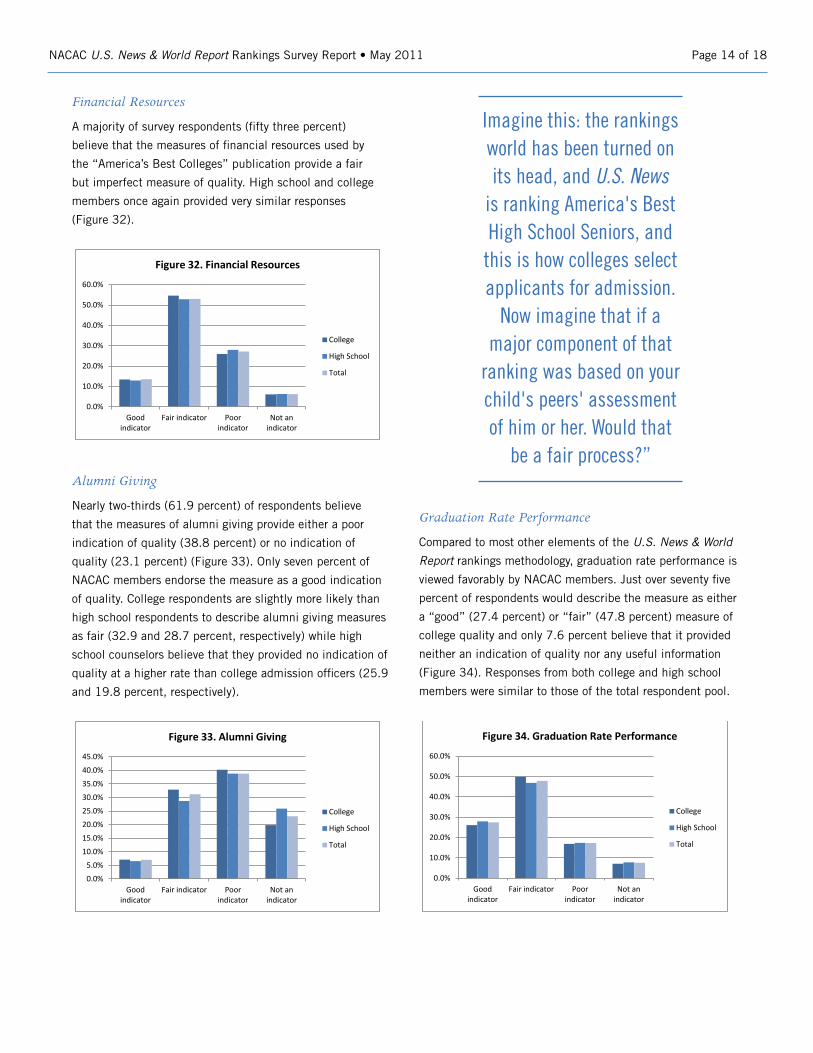
Financial Resources
A majority of survey respondents (fifty three percent)
believe that the measures of financial resources used by
the “America’s Best Colleges” publication provide a fair
but imperfect measure of quality. High school and college
members once again provided very similar responses
(Figure 32).
0.0%
10.0%
20.0%
30.0%
40.0%
50.0%
60.0%
Goodindicator
Fair indicator Poorindicator
Not anindicator
Figure 32. Financial Resources
College
High School
Total
Alumni Giving
Nearly two-thirds (61.9 percent) of respondents believe
that the measures of alumni giving provide either a poor
indication of quality (38.8 percent) or no indication of
quality (23.1 percent) (Figure 33). Only seven percent of
NACAC members endorse the measure as a good indication
of quality. College respondents are slightly more likely than
high school respondents to describe alumni giving measures
as fair (32.9 and 28.7 percent, respectively) while high
school counselors believe that they provided no indication of
quality at a higher rate than college admission officers (25.9
and 19.8 percent, respectively).
0.0%
5.0%
10.0%
15.0%
20.0%
25.0%
30.0%
35.0%
40.0%
45.0%
Goodindicator
Fair indicator Poorindicator
Not anindicator
Figure 33. Alumni Giving
College
High School
Total
Graduation Rate Performance
Compared to most other elements of the U.S. News & World
Report rankings methodology, graduation rate performance is
viewed favorably by NACAC members. Just over seventy five
percent of respondents would describe the measure as either
a “good” (27.4 percent) or “fair” (47.8 percent) measure of
college quality and only 7.6 percent believe that it provided
neither an indication of quality nor any useful information
(Figure 34). Responses from both college and high school
members were similar to those of the total respondent pool.
0.0%
10.0%
20.0%
30.0%
40.0%
50.0%
60.0%
Goodindicator
Fair indicator Poorindicator
Not anindicator
Figure 34. Graduation Rate Performance
College
High School
Total
Imagine this: the rankings world has been turned on its head, and U.S. News
is ranking America's Best High School Seniors, and
this is how colleges select applicants for admission.
Now imagine that if a major component of that
ranking was based on your child's peers' assessment of him or her. Would that
be a fair process?”

NACAC U.S. News & World Report Rankings Survey Report • May 2011 Page 15 of 18
Other Concepts or Data Points for Quality Assessments
In an open ended response question, members were asked
what other concepts or data points they believe would be
important for inclusion in any attempt to assess the quality
of postsecondary institutions. Nine hundred members offered
suggestions that may have implications for future efforts to
improve the U.S. News & World Report rankings methodology.
Common themes that emerged included:
• Studentexperience—Many NACAC members support
the inclusion of a measure of students’ experiences
while in college using surveys of student satisfaction
and/or engagement (such as the National Survey
of Student Engagement), surveys of alumni and/or
parent satisfaction, and measures of the amount and
type of student work (for example, the percentage of
freshmen required to write papers of a certain length
or whether or not students are required to write a
senior thesis).
• Studentservices—Members also suggest looking
into what support, advising, and career services
are available to students, as well as measuring
the availability and placement rate of students in
internships, work study positions and study abroad
programs. Some respondents also emphasize the
importance of considering freshman orientation
programs, transition programs, and retention
programs when measuring institutional quality.
• Studentoutcomes—Many members emphasize
the importance of including outcome measures as
opposed to or in addition to measures that seek to
quantify the quality of institutions’ incoming freshman
classes. Proposed measures for alumni outcomes
include: average student debt and income, possibly
combined with the cost of tuition in order to form a
measure of return-on-investment; employment rates;
acceptance rates into graduate and professional
schools; Ph.D. completion rates; GRE, MCAT, LSAT
and other standardized test and placement exam
scores; the percentage of alumni receiving academic
fellowships and honors such as Fulbright, Watson and
Rhodes scholarships; the rate of acceptance into Phi
Beta Kappa; and rates of enrollment in competitive
community service programs such as Teach for America
and the Peace Corps.
• Facultyquality—Some respondents suggest
using different measures to calculate the
faculty resources element of the U.S. News
& World Report rankings methodology. These
measures include the percentage of faculty with
terminal degrees teaching in the classroom;
the percentage of freshmen classes taught by
professors; the ratio of professors to adjunct
professors, teaching assistants, and graduate
assistants; the percentage of courses taught
by tenure or tenure-track faculty; the number
of faculty with distinguished honors, including
Nobel prizes, Pulitzer prizes, Fulbright
scholarships, national awards for teaching
excellence, and university awards for teaching
excellence; and the number of hours that
professors are available to students.
• Otherfactors—Other elements of institutional
quality supported by members include the extent
to which students are involved in the community;
post-graduation academic assessments such as
the Collegiate Learning Assessment; the diversity
of the student body; the percentage of Pell Grant
recipients; the percentage of first generation
students; the graduation and retention rates
for underrepresented minorities; the amount
of financial aid distributed; the safety of the
campus and/or the crime rate; the variety of
programs or number of majors offered; and the
fulfillment of the institutional mission statement
• Notapplicable—Some members suggest that
colleges and universities shouldn’t be ranked
at all and that quality assessments should be
based on non-quantifiable measures gleaned
from personal research and campus visits.
One member wrote, “Someone once compared
US News to ranking every sports team in the
country against one another. Can one compare a
volleyball team to a basketball team? Rankings
don’t work.” Others believe that only academic
programs, and not whole institutions, should be
ranked, or that institutions should be placed into
groups, rather than ordinal order. Some members
also believe that the rankings are irrelevant as
long as questions remain about the accuracy of
reported data.

NACAC U.S. News & World Report Rankings Survey Report • May 2011 Page 16 of 18
Guidance on the Use of the Rankings
When members were asked, “Which statement best
describes your awareness of U.S. News’ guidance to
students and families about how to use the rankings as
a tool in the college search process,” 57.8 percent said
that they are aware of the guidance but believe it is not
sufficiently visible and clear to communicate with students
and families effectively. College members are more likely
(47.1 percent) to be unaware of the guidance than high
school members (30.9 percent) (Figure 35).
0.0%
10.0%
20.0%
30.0%
40.0%
50.0%
60.0%
70.0%
Not aware Aware, notsufficiently visible
Aware, sufficientlyvisible
Figure 35. Awareness of U.S. News' Guidance about Using the Rankings
College
High School
Total
Important Considerations for Students and Families Using the Rankings
In another open ended response question, members
were asked to describe the information that they believe
is important for students and families to consider when
using the U.S. News rankings. More than 950 members
volunteered their expertise in response to the question.
Common themes that emerged included:
• Focusonfit—Many respondents emphasize that
college choice should ultimately be about personal
fit and that college rankings, regardless of their
methodology, can’t tell student anything about how
well they will fit at an institution. One member
wrote, “Our students are not all the same, and so
they shouldn’t be using rankings as if the same
criteria ought to apply to each student’s college
search process.”
• Buyerbeware—Some NACAC members are entirely
opposed to the use of the U.S. News & World Report
rankings and urge students and families to avoid
them altogether. Other members believe “America’s
Best Colleges” is only one of many resources that
can be used in a college search and urge families to
keep the rankings in perspective by supplementing
them with college visits and other research.
• Useful,butnotbecauseoftherankings—Some
members think that students and families can use
the rankings to find schools that they otherwise
wouldn’t have considered, while others find certain
data collected by U.S. News & World Report to be
useful when considered individually and without
regard to the rankings. Members identified the
following figures as helpful: retention and graduation
rate, selectivity, institution size, class size, student-
to-teacher ratio, and cost.
• Methodologyissues—Many members are concerned
with students’ and families’ knowledge of the U.S.
News & World Report rankings methodology. They
recommend finding out what factors are (and are
not) taken into account and deciding as a family
what factors are relevant in measuring quality. Some
members said that, because the methodology is
different each year, the rankings are unstable and
cannot be compared over time. They also said that
the rankings are based on the incoming class as
opposed to students’ experiences while at college,
that some colleges, particularly prestigious private
colleges, are unfairly favored by the formula, and
that the rankings are based too heavily on measures
of alumni giving and peer assessments, which are
subjective and biased. Some respondents further
emphasize that there is little statistical difference
between schools and that, by placing colleges in
ordinal rank, U.S. News creates the illusion of
differences where there are none.

NACAC U.S. News & World Report Rankings Survey Report • May 2011 Page 17 of 18
• Datacollectionissues—Some respondents want
students and families to know that that the rankings
can be gamed, that there are issues with accurate
data collection, and that the rankings can encourage
bad behavior. More specifically, a few members
believe that by the time the rankings are published
the data are outdated, that selectivity measures are
easily skewed, and that the listed average class sizes
can take non-teaching faculty into account.
• Otherissues—Some members ask families and
students to keep in mind that there are good
colleges in the lower tiers and that good colleges
are sometimes not included in the rankings at all,
often by choice. Others ask students to remember
that the rankings are used to sell magazines and
as a marketing tool for a magazine. One member
deemphasized the importance of the rankings,
saying, “I have come to a realization that success
is much more dependent on what they [students],
themselves, do and take advantage of at a university
than the university’s ranking.”
Features of the Rankings Publication
NACAC members were asked to rank the features of the
“America’s Best College” publication from one to seven, one
being the most helpful and seven being the least helpful.
Perhaps reflecting their disapproval of the process of placing
things in ordinal rank, about a third of members rated, rather
than ranked, the features (i.e. used the same number for
two or more features). For the purposes of this report, their
responses were excluded (Figure 36).
1
2
3
4
5
6
7
Articles onPreparingfor College
Search
Articles onNarrowing
CollegeSearch
Articles onHow toPay forCollege
Directoryof Colleges
Articles onAdjustingto College
Articles on"How toGet In"
AnnualRankings
of Colleges
Mos
t Hel
pful
Le
ast H
elpf
ul
Figure 36. Member Rank of Features in Rankings Publicaton
College
High School
Total
Articles on preparing for and narrowing the college search, as
well as those on how to pay for college, received the highest
mean scores, with average means scores of 2.51, 3.1, and
3.19, respectively. Unsurprisingly, the annual rankings of
colleges are believed to be the least helpful feature of the
publication with an overall mean score of 5.56.
Creating Individual Weights
If given the option to select individual weights for various
elements of the U.S. News & World Report rankings, most
members (58.6 percent) would be neither more or less
inclined to recommend the rankings to their students. Over
a quarter (26.6 percent) of members would be more likely
to recommend the rankings, given the option to choose their
own weights (Figure 37).
0.0%
10.0%
20.0%
30.0%
40.0%
50.0%
60.0%
70.0%
More likely torecommend
Neutral Less likely torecommend
Figure 37. If Students Could Create Own Weights...
College
High School
Total
That the information in U.S. News is only one of many sources of
important information and that the information does not by itself measure
institutional quality. Students and families should be encouraged to do their own investigation by visiting campuses, speaking with current
students, speaking with faculty and alumni, etc.”
NACAC U.S. News & World Report Rankings Survey Report • May 2011 Page 18 of 18
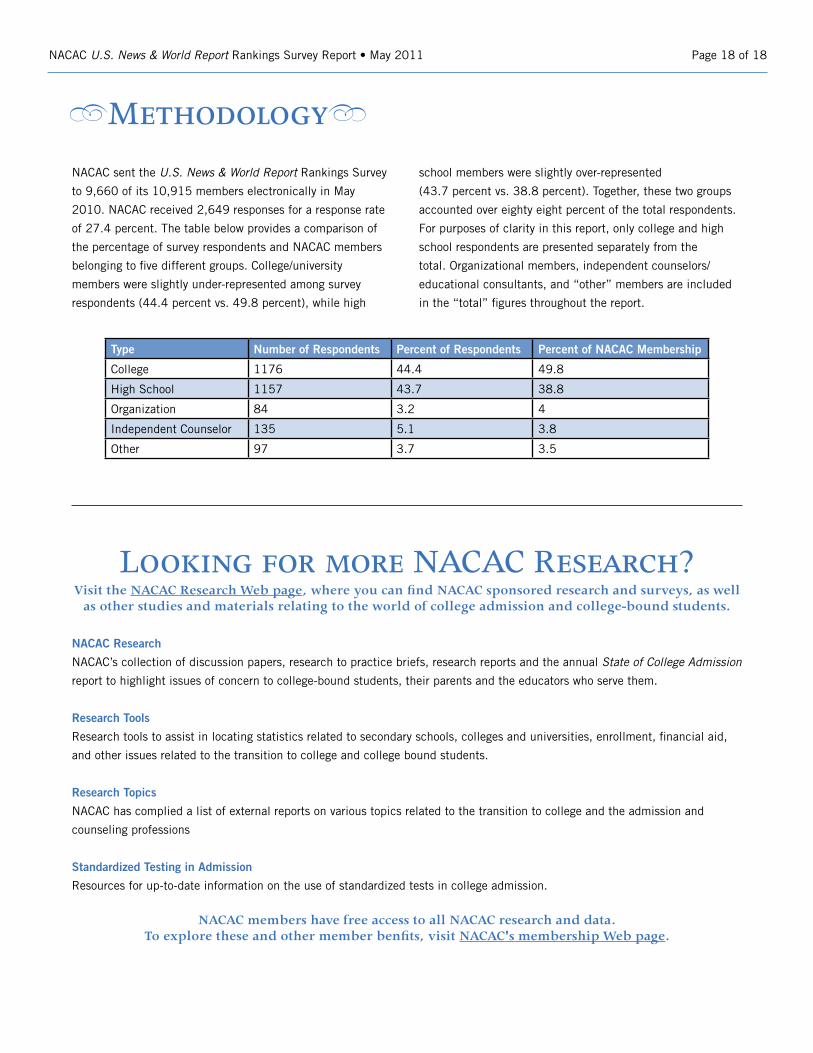
MethodologyNACAC sent the U.S. News & World Report Rankings Survey
to 9,660 of its 10,915 members electronically in May
2010. NACAC received 2,649 responses for a response rate
of 27.4 percent. The table below provides a comparison of
the percentage of survey respondents and NACAC members
belonging to five different groups. College/university
members were slightly under-represented among survey
respondents (44.4 percent vs. 49.8 percent), while high
Type Number of Respondents Percent of Respondents Percent of NACAC Membership
College 1176 44.4 49.8
High School 1157 43.7 38.8
Organization 84 3.2 4
Independent Counselor 135 5.1 3.8
Other 97 3.7 3.5
school members were slightly over-represented
(43.7 percent vs. 38.8 percent). Together, these two groups
accounted over eighty eight percent of the total respondents.
For purposes of clarity in this report, only college and high
school respondents are presented separately from the
total. Organizational members, independent counselors/
educational consultants, and “other” members are included
in the “total” figures throughout the report.
Looking for more NACAC Research? Visit the NACAC Research Web page, where you can find NACAC sponsored research and surveys, as well
as other studies and materials relating to the world of college admission and college-bound students.
NACAC Research
NACAC’s collection of discussion papers, research to practice briefs, research reports and the annual State of College Admission
report to highlight issues of concern to college-bound students, their parents and the educators who serve them.
ResearchTools
Research tools to assist in locating statistics related to secondary schools, colleges and universities, enrollment, financial aid,
and other issues related to the transition to college and college bound students.
ResearchTopics
NACAC has complied a list of external reports on various topics related to the transition to college and the admission and
counseling professions
StandardizedTestinginAdmission
Resources for up-to-date information on the use of standardized tests in college admission.
NACAC members have free access to all NACAC research and data. To explore these and other member benfits, visit NACAC's membership Web page.