a very public secret
TRANSCRIPT

1
http://library.sc.edu/blogs/academy
A Very Public Secret
Historical Background Contrary to what many students believe and to what many teachers teach, Black life in South
Carolina before the Civil War consisted of much more than just slavery. Referred to in society as
Free Blacks, Free Negroes, or Free Colored, a surprising number of African Americans held a
substantial life outside of the institution of slavery. Free Blacks did not attract much attention
which helped them to thrive in some ways.
Population statistics for Free Blacks, existed every year of the Census since its inception in 1790.
Free Blacks were also recorded statistically to have lived in every state of the nation since the initial
Census. Free Blacks existed within the population before the initial census. This is recorded in a
number of church records. Many participated in the missionary arena (Wikramanyake 1966, 2).
While most Free Blacks worked as paid laborers, some enjoyed other professions including
architects, carpenters, druggists, gunsmiths, hatters, masons, teachers, mechanics and ship
carpenters to name a few. In 1790, Free Blacks were 1.6% of the total Black Population and .72%
of the overall population in South Carolina. By 1860 that percentage had increased to 2.4% of the
total Black Population and 1.4% of the overall population (Wallace 1934, Appendix V). Though it
seems an insignificant amount in number, the idea of being a Free Black among a society of
enslaved Blacks is awe-inspiring and worthy of great attention.
South Carolina Standards
3-4.1 Compare the conditions of daily life for various classes of people in South Carolina,
including the elite, the middle class, the lower class, the independent farmers, and the free
and the enslaved African Americans.
8-1.4 Explain the significance of African Americans in the developing culture and economy of the
South and South Carolina, including the growth of the slave trade and resulting population
imbalance between African and European Americans; African contributions to agricultural
development; and resistance to slavery, including the Stono Rebellion and subsequent laws to
control slaves.
USHC-4.1 Compare the social and cultural characteristics of the North, the South, and the
West during the antebellum period, including the lives of African Americans and
social reform movements such as abolition and women’s rights.
Objectives Students will analyze population statistics to gather information regarding the existence of
free Blacks living in South Carolina during the antebellum era.
Students will analyze the life of Bonds Conway one of many free Blacks that lived in
Camden South Carolina during the antebellum era.
Time Required Recommended Grade Level 4-5 class periods Middle/High

2
http://library.sc.edu/blogs/academy
A Very Public Secret
Lesson Materials Primary and secondary documents included in this lesson packet
Analyzing Primary Sources sheets (attached).
LCD projector for projecting images and for Excel Tutorial
Computer Lab or Computer access for students
Microsoft Excel Software
Images and documents from the Bonds Conway collection via the University of South
Carolina’s Digital Collections library
Lesson Preparation 1. Download or bookmark the following images for student analysis
o Letter, 18th May, 1857
o The State of South-Carolina, Deed to Daughter
o The State of South-Carolina. Deed 1820
o The State of South-Carolina, Deed 1812
o Letter, 15 December 1859
2. Arrange students into groups of three or four.
3. Place the following questions on the board. “Describe what life was like for African
Americans in South Carolina before the Civil War. What did African Americans do from
day to day?”
4. Create a list on the board as students describe what they know. Keep this list visible in the
classroom throughout this lesson.
5. If you’ve never introduced the use of primary documents in the classroom, you will need to
model how to analyze a document with the class prior to engaging in this lesson.
Lesson Procedure 1. Place the following questions on the board. “Describe what life was like for African
Americans in South Carolina before the Civil War. What did African Americans do from
day to day?”
2. Create a list on the board as students describe what they know. Keep this list visible in the
classroom throughout this lesson.
Statistical Analysis
In this portion of the lesson, students will analyze and interpret statistical trends of the Free Black
population in South Carolina and the United States, using Microsoft Excel as a means to graphically
display information. This process may take an average of two class periods to complete. The most
efficient way to cover this assignment is to break the class up into groups of three or four. There are
a total of five charts of statistical data to integrate into Microsoft Excel. A rubric is provided to
briefly assess the accuracy of each chart that students create. Instructions for creating a Microsoft
Excel graph are also included.

3
http://library.sc.edu/blogs/academy
A Very Public Secret
1. Provide students with the instructions for creating a Microsoft Excel graph. Then walk them
through a step by step tutorial using your LCD projector and computer. (There are online
tutorials that you may be able to provide for your students to skip this step. With the online
tutorial, each group may be able to work at their own pace. Ex:
http://www.youtube.com/watch?v=HQwE0Xv1lAA )
2. Distribute Census Record Sheets handouts. Explain to students that they are to use the
information provided to develop charts and/or answer the questions. Stress to students, that
the accuracy of their charts will determine if their answers are correct.
3. Allow students enough time to compile and complete their graphs and address each question
4. Have each group present their chart and information to the class in brief 3 minute
presentations.
5. Supply students with correct answers if needed. Reinforce the information about Free
Blacks in South Carolina when students have finished.
Document Analysis
In this section of the lesson, students will analyze the original documents of one Free Black family
that lived in antebellum South Carolina, the family of Bonds Conway, native of Camden, SC. This
process will also take an average of two class periods to complete. The most efficient way to cover
this task is to break the class up into groups of three or four. An Analysis Guide is provided to help
students keep track of their ideas.
1. Distribute the Analysis Guide suggested in this packet to each group of students. Then
model how students are to complete the guide with a neutral document or one example from
the resources provided.
2. Provide each group with a different document from the family papers.
3. Allow students enough time to analyze the documents and complete the Analysis Guide.
4. Have groups briefly report their findings and conclusions.
5. Supply students with additional facts that they may have missed in their analysis. Reinforce
the information about each family when students have finished.
Assessment 1. To assess the Statistical Analysis, use the rubric provided to determine the accuracy of
their graphs and the accuracy of their answers to the questions on each table.
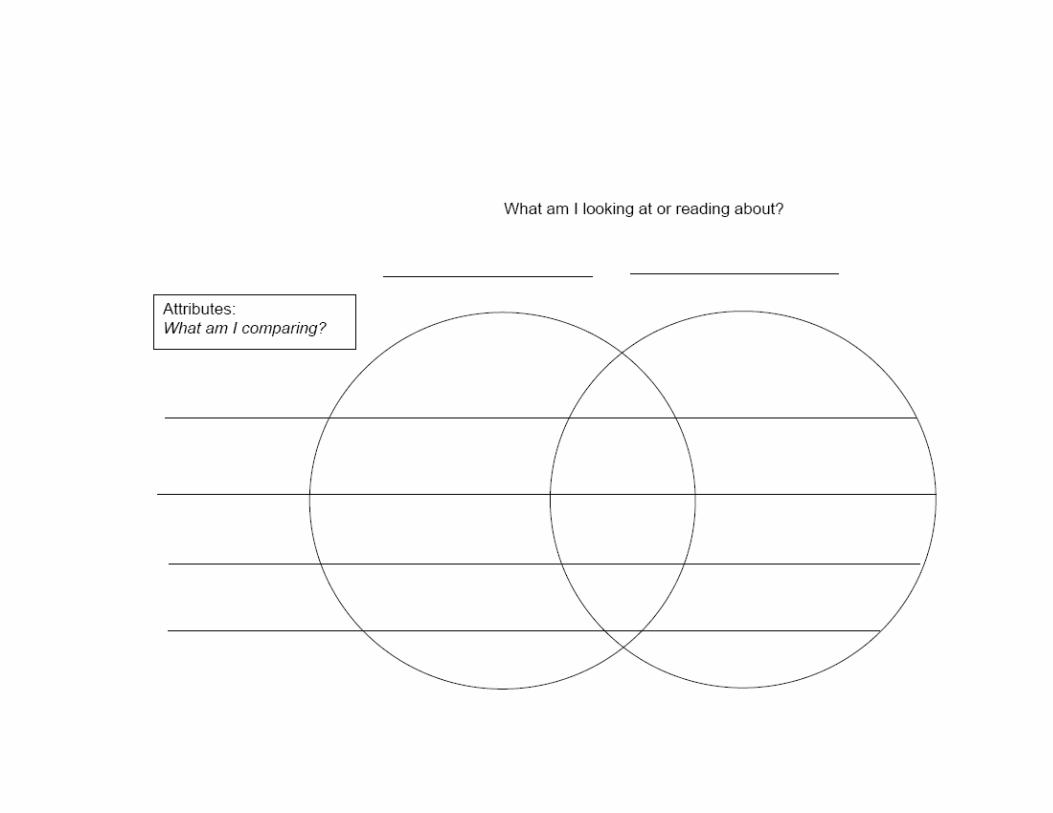
2. To assess the Document Analysis, have students create a list of characteristics that might
help describe how Free Blacks lived in Antebellum South Carolina. Then have them use
the list to create a Venn diagram that compares and contrasts the lives of slaves with that
of Free Blacks.
3. To assess the entire lesson, have students formulate an opinion then use it to create a
blog or short article that addresses one of the following questions:
a. Why do you think the Free Black Population is not a popular history topic?
b. How does learning about Free Blacks alter your perception of history?
c. How might you use this knowledge to your own advantage?

4
http://library.sc.edu/blogs/academy
A Very Public Secret
Lesson Extension Options
Have students research the history of other Free Black families in South Carolina before the
Civil War. More information on Free Black families can be found at the South Caroliniana
Library.
Digital Collections Information This lesson plan is based on images and/or documents derived from the Bonds Conway collection
available from the University of South Carolina’s Digital Collections Library. To see more from
this collection please visit the link above.
To see other collections that may be helpful to your search, visit the Digital Collections homepage
or visit SCDL’s collections.

A Very Public Secret: Free Blacks in Antebellum
South Carolina
Student Handouts and Materials Includes:
5 census tables with questions
Grading rubric for evaluating finished graph products
Step-By-Step Instructions for creating a Microsoft Excel Graph
Teacher’s guide for analyzing manuscripts with student questions (Available from the Library of
Congress)
Primary source analysis sheet for students (Available from the Library of Congress)
Venn diagram for final analysis
A Very Public Secret:
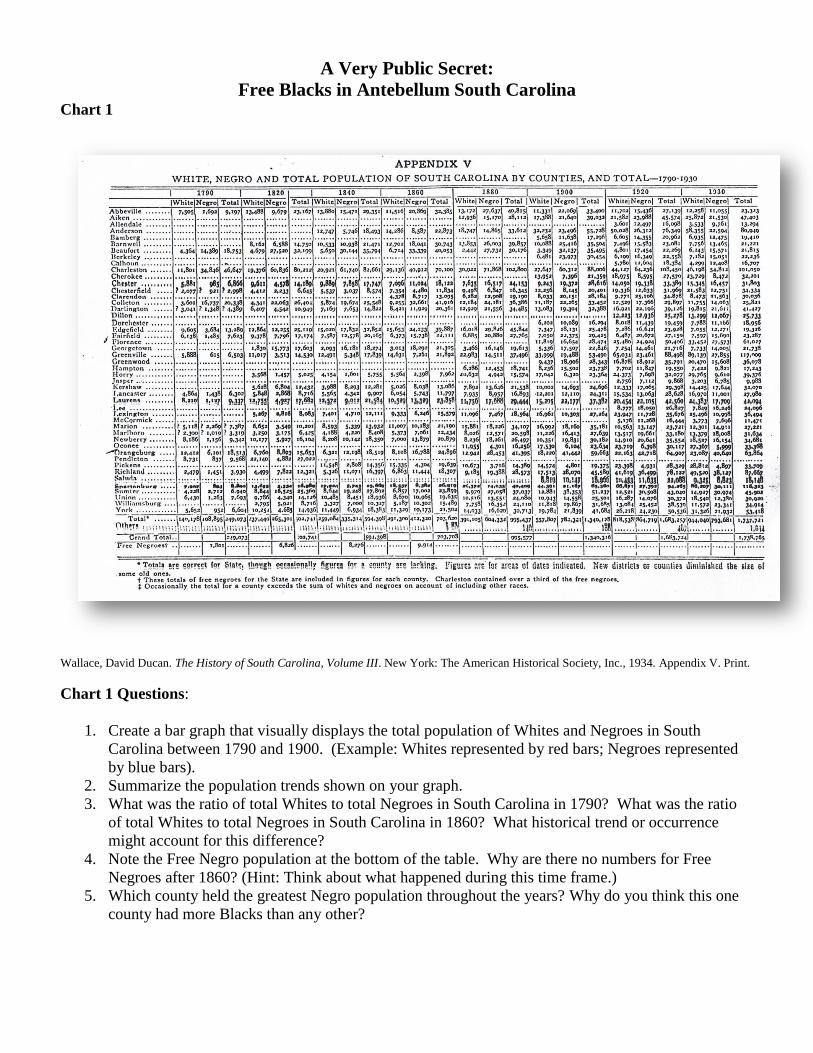
Free Blacks in Antebellum South Carolina Chart 1
Wallace, David Ducan. The History of South Carolina, Volume III. New York: The American Historical Society, Inc., 1934. Appendix V. Print.
Chart 1 Questions:
1. Create a bar graph that visually displays the total population of Whites and Negroes in South
Carolina between 1790 and 1900. (Example: Whites represented by red bars; Negroes represented
by blue bars).
2. Summarize the population trends shown on your graph.
3. What was the ratio of total Whites to total Negroes in South Carolina in 1790? What was the ratio
of total Whites to total Negroes in South Carolina in 1860? What historical trend or occurrence
might account for this difference?
4. Note the Free Negro population at the bottom of the table. Why are there no numbers for Free
Negroes after 1860? (Hint: Think about what happened during this time frame.)
5. Which county held the greatest Negro population throughout the years? Why do you think this one
county had more Blacks than any other?

A Very Public Secret:
Free Blacks in Antebellum South Carolina Chart 2
Debow, J. D. B. "Chapter IV, Chapter V." Statistical View of the United States. Washington: Senate Printer, 1854. 62+. Print
Chart 2Questions:
1. Create a bar graph to visibly display the population trends in Free Colored Populations in South
Carolina between 1790 and 1850.
2. Summarize the population trends shown on your graph.
3. How many slaves were newly classified as Free Colored in South Carolina between 1810 and 1820?
4. How many slaves were newly classified as Free Colored in South Carolina between 1820 and 1830?
5. How many slaves were newly classified as Free Colored in South Carolina between 1830 and 1840?
6. Describe the trend in population between 1810 and 1840? Why do you think this happened?

A Very Public Secret:
Free Blacks in Antebellum South Carolina Chart 3
Debow, J. D. B. "Chapter IV, Chapter V." Statistical View of the United States. Washington: Senate Printer, 1854. 62+. Print
Chart 3 Questions:
1. Create a bar graph that displays the four categories represented in the table. Only display South
Carolina’s statistics.
2. Analyze your bar graph and the chart above when complete.
3. What does this information suggest about the opportunity to earn freedom?

A Very Public Secret:
Free Blacks in Antebellum South Carolina Chart 4
Debow, J. D. B. "Chapter IV, Chapter V." Statistical View of the United States. Washington: Senate Printer, 1854. 62+. Print
Chart 4 continued on next page with questions

Debow, J. D. B. "Chapter IV, Chapter V." Statistical View of the United States. Washington: Senate Printer, 1854. 62+. Print
Chart 4 Questions:
1. Analyze the table on pages 80 and 81
2. Create a chart that graphically displays the top four occupations among Free Colored males in 1850.
3. Which occupations were you surprised to see on the list? Explain why you were surprised?
4. Which occupation held the greatest number of Free Colored males?
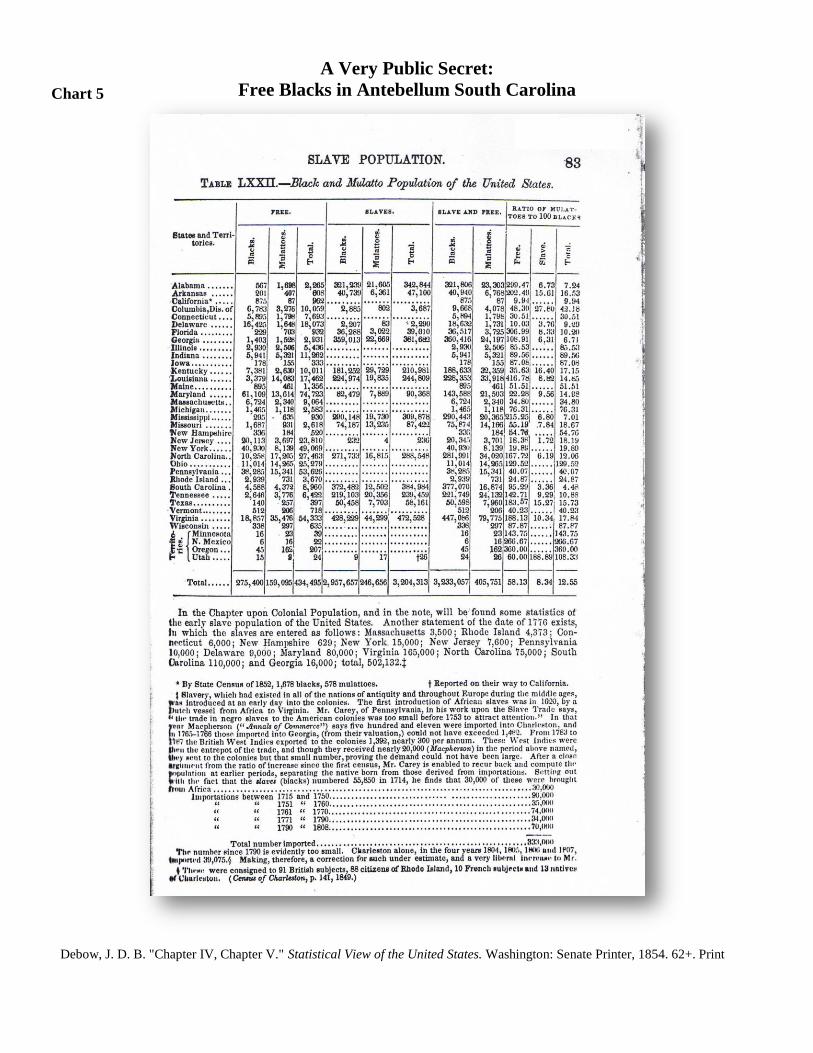
A Very Public Secret:
Free Blacks in Antebellum South Carolina
Debow, J. D. B. "Chapter IV, Chapter V." Statistical View of the United States. Washington: Senate Printer, 1854. 62+. Print
Chart 5

Chart 5 Questions:
1. Analyze the table above. What is the title of the table?
2. What is the difference between a Black and Mulatto?
3. According to the table, were all Blacks slaves?
4. Could a Mulatto be a slave?
5. Create a bar graph that graphically displays the difference between Free Blacks and Mulattoes and
Slave Blacks and Mulattoes in South Caroina.
6. Were there more Free Blacks or Free Mulattoes in South Carolina?
7. Were there more Slave Blacks or Slave Mulattoes in South Carolina?
8. Why do you think there is a difference between Blacks and Mulattoes?

Grading Rubric Name: Did the student have an appropriate title? 10pts
Was the information accurate? 20 pts
Was the information clear and understandable? 20pts
Is the product neat and attractive? 20pts
Was the product turned in on time? 20pts
Was the class presentation clear and focused? 10pts Total 100 pts
Notes:

Instructions for Creating an Excel Graph
Step 1 - Launch Excel
1. Go to the Standard toolbar. Click on the New Workbook button.
2. Go to the File menu. Select New.
3. Use a keyboard combination: on a Macintosh use Command + N and on a Windows computer use Ctrl
+ N
Step 2 - Enter the data to be graphed. For the purpose of this lesson you will use data from a Favorite
Fruit Survey. Enter it as you see below:
Step 3 - Highlight data to be graphed. Do not include the row with heading titles, only the names of fruit
and the numbers. If your worksheet looks like the one above; put your cursor in call A2, click hold the
mouse button down and drag to cell B7. Highlighted data should look like the image below:
Note: Cell A2 is selected, the select color extends around the cell
Step 4 - Select the Chart Wizard. That is done by going to the Insert menu and selecting Chart. You can
also click on the Chart Wizard button on the Standard toolbar.
Step 5 - From the Chart Wizard box that opens select Chart type. For this activity, I selected pie.

After you have selected the Chart type, click and hold your mouse pointer down on the Press and Hold...
button to see what your data looks like in the chart type you selected. If you do not like the look, select
another chart type. After you have selected the chart type you will have two options:
Select Next and let Chart Wizard show you a series of options to make changes to your chart.
Select Finish and Chart Wizard puts your completed chart on the spreadsheet. You can see
the finished product below.
The second step taken by Chart Wizard is to verify the range of data being used for this chart. The Data
range displayed below is read "all cells from A2 to B7."
Notice where the cursor is located in the dialog box above. It is pointing to the small box at the end of the
line where the Data range is displayed. If the data range should be changed, click on the box the cursor is
pointing to.

The dialog box shrinks allowing you to see your entire spreadsheet. You can edit the data range in this small
window. When you are finished, click the same box at the end to restore the window.
Select Next to go to the dialog box below. This box allows you to add a title to the chart, make changes on
the legend, or make changes on the data labels.
Select Next to move to the final dialog box which allows you to see the chart as a new sheet or place it on
one of the sheets in your workbook.
If you let the Chart Wizard finish your chart after the first dialog box, or work through each of the four
steps, your chart will look something like the one below.

Teacher’s Guide Analyzing Manuscripts
B S E RO
V E
Guide students with the sample questions as they respond to the
N
O
R E
I primary source. Encourage them to go back and forth between the
T
F
S
L columns; there is no correct order. E
E
UC
Q T
O B S E RV E
Have students identify and note details.
Sample Questions:
Describe what you see. · What do you notice first?
· How much of the text can you read? What does
it say? · What do you see that looks strange or
unfamiliar? · How are the words arranged? · What
do you notice about the page the writing appears
on? • What size is the page? · What do you see on
the page besides writing? · What other details can
you see?
R E F L E C T
Encourage students to generate and test hypotheses about the manuscript.
Why do you think this manuscript was made? · Who
do you think created it? · Who do you think was
intended to read it, if anyone? · What do you think
was happening when it was created? · What tools
and materials were used to create it? · What can
you learn from examining this? · If someone created
something like this today, what would be different? ·
What would be the same?
Q U E S T I O N
Have students ask questions to lead to more observations and reflections.
What do you wonder about...
who? · what? · when? · where? · why? · how?
F U RT h E R I N V E S T I g AT I O N
Help students to identify questions appropriate for further investigation, and to develop a research strategy for finding answers. Sample Question: What more do you want to know, and how can you find out?
LOC.gov/teachers
A few follow-up Beginning Advanced For more tips on using primary activity ideas: Have students choose a section of the manuscript and put it in their Examine a section of the manuscript. Think about what you already sources, go to
own words. know about this period in history. How does the manuscript support http://www.loc.gov/teachers or contradict your current understanding of this period? Can you
Intermediate see any clues to the point of view of the person who created this Select a section of a manuscript. Speculate about the purpose of the manuscript? manuscript, and what the person, or people, who created it expected it to accomplish. Do you think it achieved their goals? Explain why you think so.