a variable absorption feature in the x-ray spectrum …a variable absorption feature in the x-ray...
TRANSCRIPT
A variable absorption feature in the X-ray spectrum of amagnetarAndrea Tiengo1,2,3, Paolo Esposito2, Sandro Mereghetti2, Roberto Turolla4,5, Luciano Nobili4,Fabio Gastaldello2, Diego Gotz6, Gian Luca Israel7, Nanda Rea8, Luigi Stella7, Silvia Zane5 &Giovanni F. Bignami1,2
1Istituto Universitario di Studi Superiori, piazza della Vittoria 15, I-27100 Pavia, Italy.2Istituto di Astrofisica Spaziale e Fisica Cosmica Milano, INAF, via Bassini 15, I-20133 Milano,Italy.3Istituto Nazionale di Fisica Nucleare, Sezione di Pavia, via Bassi 6, I-27100 Pavia, Italy.4Dipartimento di Fisica e Astronomia, Universita di Padova, via Marzolo 8, I-35131 Padova, Italy.5Mullard Space Science Laboratory, University College London, Holmbury St. Mary, Dorking,Surrey RH5 6NT, UK.6AIM CEA/Irfu/Service d’Astrophysique, Orme des Merisiers, F-91191 Gif-sur-Yvette, France.7Osservatorio Astronomico di Roma, INAF, via Frascati 33, I-00040 Monteporzio Catone, Italy.8Institut de Ciencies de l’Espai (IEEC–CSIC), Campus UAB, Torre C5, 2a planta, E-08193Barcelona, Spain.
Soft-γ-ray repeaters (SGRs) and anomalous X-ray pulsars (AXPs) are slowly rotating, iso-lated neutron stars that sporadically undergo episodes of long-term flux enhancement (out-bursts) generally accompanied by the emission of short bursts of hard X-rays1, 2. This be-haviour can be understood in the magnetar model3–5, according to which these sources aremainly powered by their own magnetic energy. This is supported by the fact that the mag-netic fields inferred from several observed properties6–8 of AXPs and SGRs are greater than– or at the high end of the range of – those of radio pulsars. In the peculiar case of SGR0418+5729, a weak dipole magnetic moment is derived from its timing parameters9, whereasa strong field has been proposed to reside in the stellar interior10, 11 and in multipole com-ponents on the surface12. Here we show that the X-ray spectrum of SGR 0418+5729 hasan absorption line, the properties of which depend strongly on the star’s rotational phase.This line is interpreted as a proton cyclotron feature and its energy implies a magnetic fieldranging from 2×10¹⁴ gauss to more than 1015 gauss.
On 2009 June 5 two short bursts of hard X-rays, detected by Fermi and other satellites,revealed the previously unknown source SGR 0418+572913. Subsequent observations with theRossi X-ray Timing Explorer (RXTE), Swift, Chandra and X-ray Multi-mirror Mission (XMM)Newton satellites found the new SGR to be an X-ray pulsar with a period of∼9.1 s and a luminosityof ∼1.6× 1034 erg s−1 (in the 0.5–10 keV band and for a distance of 2 kpc)13, 14. During the threeyears after the onset of the outburst, the spectrum softened and the luminosity declined by threeorders of magnitude, but remained still too high to be powered by rotational energy9, 10, 14. Themeasured spin-down rate of 4× 10⁻¹⁵ s s−1 translates (under the assumption of rotating magneticdipole in vacuo) into a magnetic field B = 6× 10¹² G at the magnetic equator9, a value well in the
1
arX
iv:1
308.
4987
v1 [
astr
o-ph
.HE
] 2
2 A
ug 2
013
range of normal radio pulsars. However, the presence of high-order multipolar field componentsof 1014 G close to the surface has been invoked to interpret the spectrum of the source in theframework of atmosphere models12. In any case, a strong crustal magnetic field (> 1014 G) seemsto be required to explain the overall properties of SGR 0418+5729 within the magnetar model9, 11.
Hints of the presence of an absorption feature at 2 keV in the spectrum of SGR 0418+5729were found in the phase-resolved analysis of data (with relatively low-count statistics) from theSwift X-ray Telescope (XRT) taken during 2009 July 12–1614. Thanks to the large collecting areaand good spectral resolution of the European Photon Imaging Camera (EPIC), we were able toperform a more detailed investigation using data collected by XMM-Newton during a 67-ks longobservation performed on 2009 August 12, when the source flux was still high (5×10⁻¹² erg cm−2
s−1 in the 2–10 keV band).
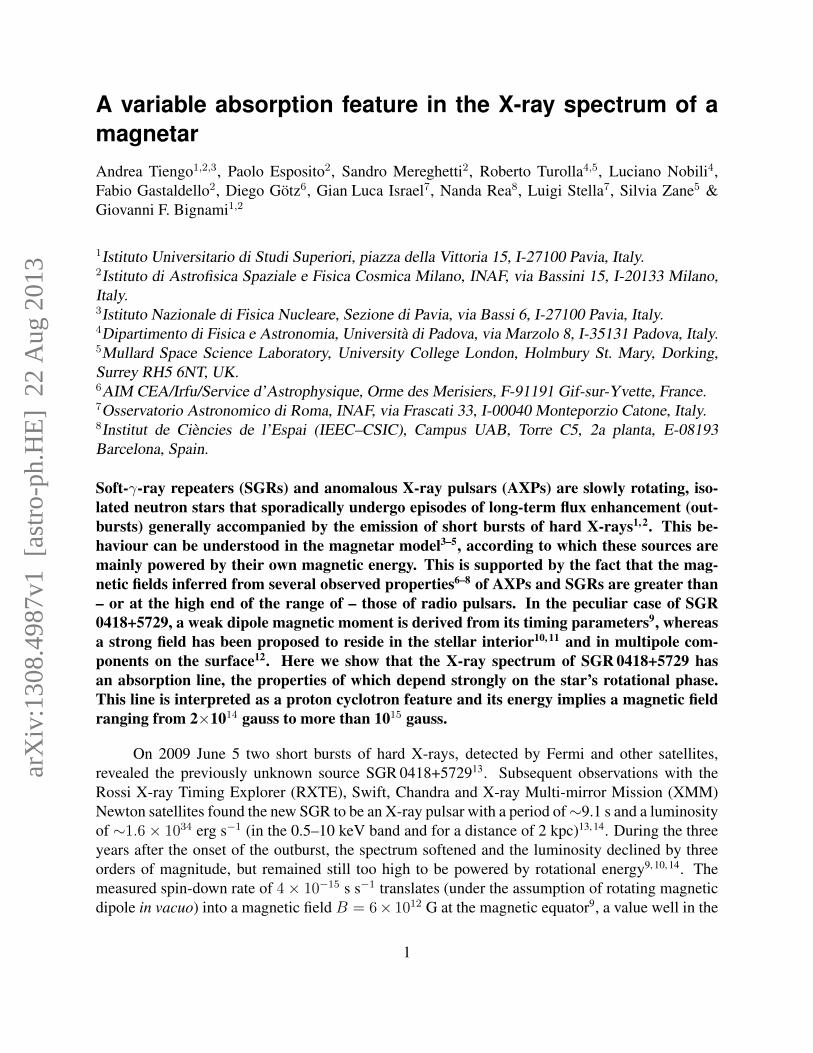
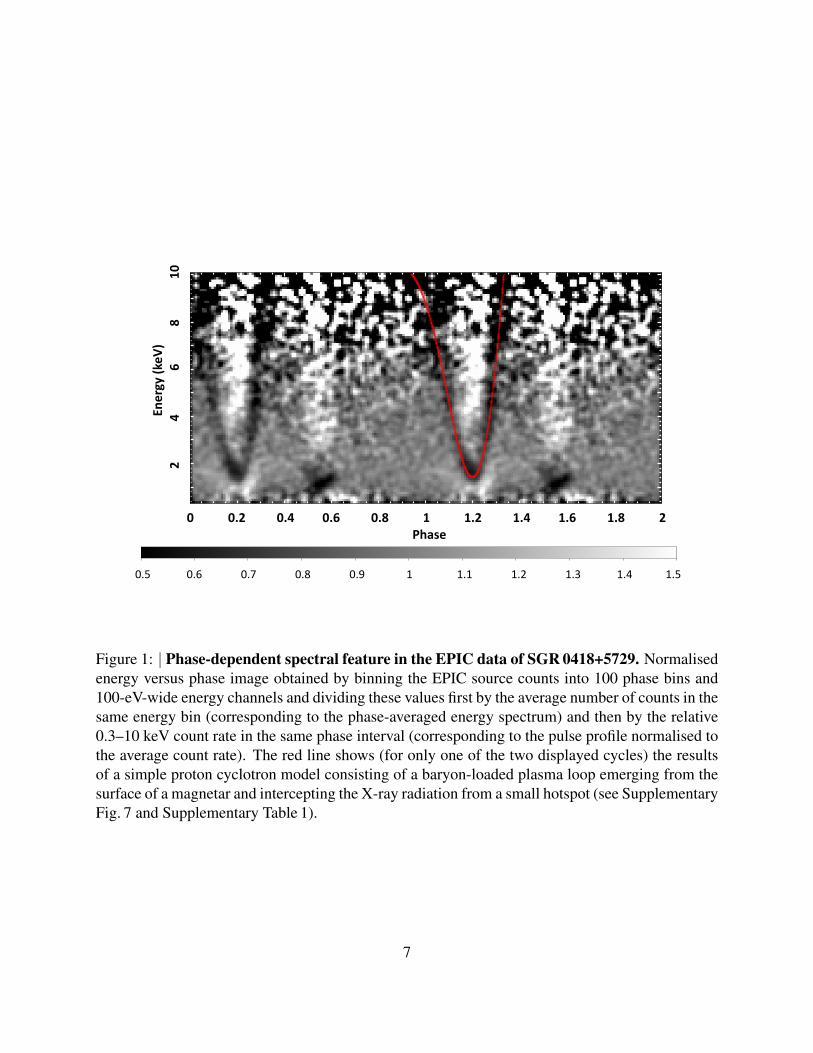
To examine the spectral variations as a function of the star’s rotational phase without mak-ing assumptions about the X-ray spectral energy distribution of SGR 0418+5729, we produced aphase–energy image by binning the EPIC source counts into energy and rotational phase channelsand then normalising to the phase-averaged energy spectrum and pulse profile. The normalisedphase–energy image (Fig.1) shows a prominent V-shaped feature in the phase interval ∼0.1–0.3.This is produced by a lack of counts in a narrow energy range with respect to nearby energy chan-nels, that is, an absorption feature at a phase-dependent energy. The regular shape of the feature inthe phase–energy plane as well as its presence in the three independent EPIC detectors (see Sup-plementary Fig. 5) exclude the possibility that it results from statistical fluctuations in the numberof counts or from an instrumental effect. Another absorption feature is visible at low energies atphase ∼0.5–0.6.
We extracted from the EPIC data the phase-averaged spectrum of SGR 0418+5729, as well asthe spectra from 50 phase intervals of width 0.02 rotational cycles, as described in the Supplemen-tary Information. The phase-averaged spectrum can be adequately fit by either a two-blackbodymodel (χ2
ν = 1.198 for 196 degrees of freedom, d.f.) or a blackbody plus power-law model(χ2
ν = 1.105 for 196 d.f.), corrected for interstellar absorption (see refs 11 and 12 for other modelsthat can fit the spectrum).
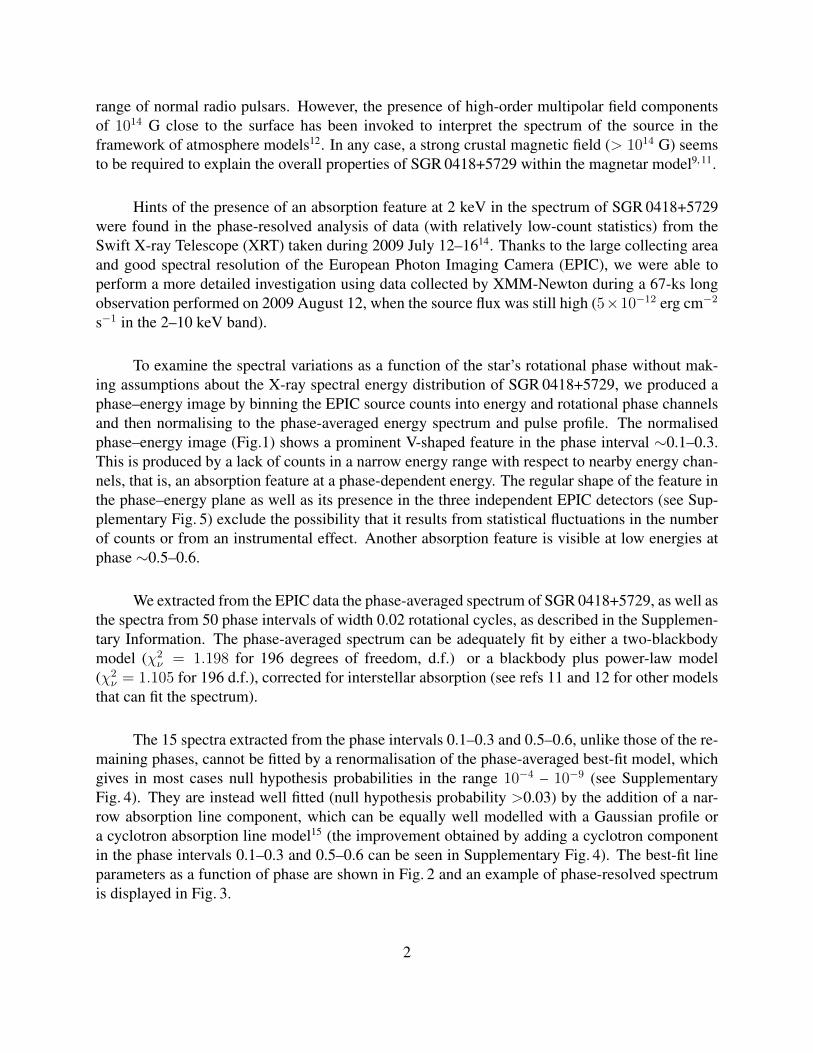
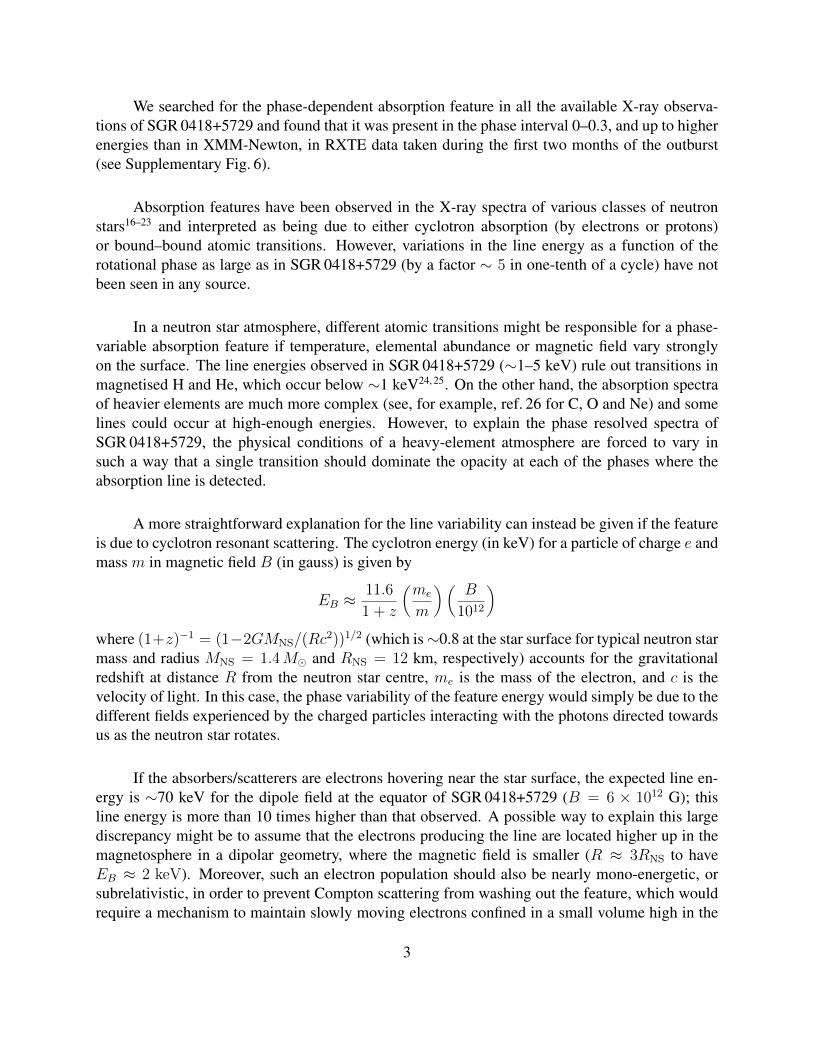
The 15 spectra extracted from the phase intervals 0.1–0.3 and 0.5–0.6, unlike those of the re-maining phases, cannot be fitted by a renormalisation of the phase-averaged best-fit model, whichgives in most cases null hypothesis probabilities in the range 10−4 – 10−9 (see SupplementaryFig. 4). They are instead well fitted (null hypothesis probability >0.03) by the addition of a nar-row absorption line component, which can be equally well modelled with a Gaussian profile ora cyclotron absorption line model15 (the improvement obtained by adding a cyclotron componentin the phase intervals 0.1–0.3 and 0.5–0.6 can be seen in Supplementary Fig. 4). The best-fit lineparameters as a function of phase are shown in Fig. 2 and an example of phase-resolved spectrumis displayed in Fig. 3.
2
We searched for the phase-dependent absorption feature in all the available X-ray observa-tions of SGR 0418+5729 and found that it was present in the phase interval 0–0.3, and up to higherenergies than in XMM-Newton, in RXTE data taken during the first two months of the outburst(see Supplementary Fig. 6).
Absorption features have been observed in the X-ray spectra of various classes of neutronstars16–23 and interpreted as being due to either cyclotron absorption (by electrons or protons)or bound–bound atomic transitions. However, variations in the line energy as a function of therotational phase as large as in SGR 0418+5729 (by a factor ∼ 5 in one-tenth of a cycle) have notbeen seen in any source.
In a neutron star atmosphere, different atomic transitions might be responsible for a phase-variable absorption feature if temperature, elemental abundance or magnetic field vary stronglyon the surface. The line energies observed in SGR 0418+5729 (∼1–5 keV) rule out transitions inmagnetised H and He, which occur below ∼1 keV24, 25. On the other hand, the absorption spectraof heavier elements are much more complex (see, for example, ref. 26 for C, O and Ne) and somelines could occur at high-enough energies. However, to explain the phase resolved spectra ofSGR 0418+5729, the physical conditions of a heavy-element atmosphere are forced to vary insuch a way that a single transition should dominate the opacity at each of the phases where theabsorption line is detected.
A more straightforward explanation for the line variability can instead be given if the featureis due to cyclotron resonant scattering. The cyclotron energy (in keV) for a particle of charge e andmass m in magnetic field B (in gauss) is given by
EB ≈11.6
1 + z
(me
m
)(B
1012
)where (1+z)−1 = (1−2GMNS/(Rc
2))1/2 (which is∼0.8 at the star surface for typical neutron starmass and radius MNS = 1.4M� and RNS = 12 km, respectively) accounts for the gravitationalredshift at distance R from the neutron star centre, me is the mass of the electron, and c is thevelocity of light. In this case, the phase variability of the feature energy would simply be due to thedifferent fields experienced by the charged particles interacting with the photons directed towardsus as the neutron star rotates.
If the absorbers/scatterers are electrons hovering near the star surface, the expected line en-ergy is ∼70 keV for the dipole field at the equator of SGR 0418+5729 (B = 6 × 10¹² G); thisline energy is more than 10 times higher than that observed. A possible way to explain this largediscrepancy might be to assume that the electrons producing the line are located higher up in themagnetosphere in a dipolar geometry, where the magnetic field is smaller (R ≈ 3RNS to haveEB ≈ 2 keV). Moreover, such an electron population should also be nearly mono-energetic, orsubrelativistic, in order to prevent Compton scattering from washing out the feature, which wouldrequire a mechanism to maintain slowly moving electrons confined in a small volume high in the
3

magnetosphere.
If the particles responsible for the cyclotron scattering are protons, the energy range of theSGR 0418+5729 spectral feature requires a magnetic field > 2 × 10¹⁴ G (it would be even largerfor heavier ions). In the framework of the magnetar model, the unprecedented phase-variabilityof the line energy can be explained by the complex topology of the magnetar magnetospheres,in which global and/or localised twists play an important part5. This is particularly true forSGR 0418+5729, which has a weak dipolar component, as testified by the small spin-down value,whereas a much stronger internal magnetic field has been advocated to explain its X-ray luminos-ity and burst activity10, 11. Furthermore, the presence of small-scale, strong, multipolar componentsof the surface field has been inferred by fitting its phase-averaged X-ray spectrum with models ofmagnetized neutron star atmospheres12.
In this context, the observed line variability might be due to the presence of either strongmagnetic field gradients along the surface or vertical structures (with a spatially dependent field)emerging from the surface. To work out how the dynamic magnetosphere of a magnetar shouldlook, an analogy with the solar corona in the proximity of sunspots has been proposed (see, forexample, ref. 27). In particular, localised, baryon-rich, magnetic structures, in the form of risingflux tubes, or ‘prominences’, produced by magnetic reconnection or the emergence of the internalfield near a crustal fault, have been proposed to explain some of the observed properties of thegiant flare emitted in 2004 by SGR 1806–2028, 29. If a similar scenario, albeit on a reduced scale,occurred during the outburst of SGR 0418+5729, a spectral feature might arise as thermal photonsfrom the hot spot (a small hot region on the neutron star surface, responsible for most of the X-rayemission, which could be itself related to the prominence) cross the plasma threading the mag-netic loop. A proton density ≈1017 cm−3 is needed to produce a resonant scattering depth of orderunity5. Protons, being heavy, do not rise much above the surface and move subrelativistically5,so resonant scattering in the prominence is likely to produce a narrow feature instead of an ex-tended tail. As the star rotates, photons emitted in different directions pass through portions of theprominence with different magnetic field, density and size, giving rise to the observed variationsof the line centroid and width. A simple quantitative model based on this picture is presented inSupplementary Information. Results, obtained with a geometry consistent with the constraints de-rived from the X-ray pulsed fraction of SGR 0418+5729, are in good agreement with the observedvariations of the feature with phase (Fig. 1).
Acknowledgements We thank G. Goggi and C. Paizis for useful discussion. This research is based ondata and software provided by the the ESA XMM-Newton Science Archive (XSA) and the NASA/GSFCHigh Energy Astrophysics Science Archive Research Center (HEASARC). The Authors acknowledge par-tial funding from INAF through a PRIN 2010 grant and ASI through contract I/032/10/0.
Author Information The authors declare that they have no competing financial interests. Correspondenceand requests for materials should be addressed to A.T. (email: [email protected]).
4
1. Mereghetti, S. The strongest cosmic magnets: soft gamma-ray repeaters and anomalous X-raypulsars. Astron. Astrophys. Rev. 15, 225–287 (2008).
2. Rea, N. & Esposito, P. Magnetar outbursts: an observational review. In Torres, D. F. & Rea, N.(eds.) High-Energy Emission from Pulsars and their Systems, Astrophysics and Space ScienceProceedings, 247–273 (Springer, Heidelberg, 2011).
3. Thompson, C. & Duncan, R. C. The soft gamma repeaters as very strongly magnetized neutronstars - I. Radiative mechanism for outbursts. Mon. Not. R. Astron. Soc. 275, 255–300 (1995).
4. Thompson, C. & Duncan, R. C. The Soft Gamma Repeaters as Very Strongly MagnetizedNeutron Stars. II. Quiescent Neutrino, X-Ray, and Alfven Wave Emission. Astrophys. J. 473,322–342 (1996).
5. Thompson, C., Lyutikov, M. & Kulkarni, S. R. Electrodynamics of Magnetars: Implicationsfor the Persistent X-Ray Emission and Spin-down of the Soft Gamma Repeaters and Anoma-lous X-Ray Pulsars. Astrophys. J. 574, 332–355 (2002).
6. Kouveliotou, C. et al. An X-ray pulsar with a superstrong magnetic field in the soft gamma-rayrepeater SGR 1806-20. Nature 393, 235–237 (1998).
7. Thompson, C. & Duncan, R. C. The Giant Flare of 1998 August 27 from SGR 1900+14. II.Radiative Mechanism and Physical Constraints on the Source. Astrophys. J. 561, 980–1005(2001).
8. Vietri, M., Stella, L. & Israel, G. L. SGR 1806-20: Evidence for a Superstrong Magnetic Fieldfrom Quasi-Periodic Oscillations. Astrophys. J. 661, 1089–1093 (2007).
9. Rea, N. et al. The Outburst Decay of the Low Magnetic Field Magnetar SGR 0418+5729.Astrophys. J. 770, 65 (2013).
10. Rea, N. et al. A Low-Magnetic-Field Soft Gamma Repeater. Science 330, 944 (2010).
11. Turolla, R., Zane, S., Pons, J. A., Esposito, P. & Rea, N. Is SGR 0418+5729 Indeed a WaningMagnetar? Astrophys. J. 740, 105 (2011).
12. Guver, T., Gogus, E. & Ozel, F. A magnetar strength surface magnetic field for the slowlyspinning down SGR 0418+5729. Mon. Not. R. Astron. Soc. 418, 2773–2778 (2011).
13. van der Horst, A. J. et al. Discovery of a New Soft Gamma Repeater: SGR J0418+5729.Astrophys. J. 711, L1–L6 (2010).
14. Esposito, P. et al. Early X-ray and optical observations of the soft gamma-ray repeaterSGR0418+5729. Mon. Not. R. Astron. Soc. 405, 1787–1795 (2010).
15. Makishima, K. et al. Observations of the peculiar hard X-ray transient X 0331+53(V 0332+53). Publ. Astron. Soc. Japan 42, 295–315 (1990).
5
16. Truemper, J. et al. Evidence for strong cyclotron line emission in the hard X-ray spectrum ofHercules X-1. Astrophys. J. 219, L105–L110 (1978).
17. Heindl, W. A. et al. Timing and Spectroscopy of Accreting X-ray Pulsars: the State of Cy-clotron Line Studies. In Kaaret, P., Lamb, F. K. & Swank, J. H. (eds.) X-ray Timing 2003:Rossi and Beyond, vol. 714 of American Institute of Physics Conference Series, 323–330 (AIPMelville, 2004).
18. Turolla, R. Isolated neutron stars: The challenge of simplicity. In Becker, W. (ed.) Neutronstars and pulsars, vol. 357 of Astrophysics and Space Science Proceedings, 141–163 (SpringerHeidelberg, 2009).
19. Haberl, F. et al. Evidence for precession of the isolated neutron star RX J0720.4-3125. As-tron. Astrophys. 451, L17–L21 (2006).
20. van Kerkwijk, M. H. & Kaplan, D. L. Isolated neutron stars: magnetic fields, distances,andspectra. Astrophys. Space Sci. 308, 191–201 (2007).
21. Bignami, G. F., Caraveo, P. A., De Luca, A. & Mereghetti, S. The magnetic field of an isolatedneutron star from X-ray cyclotron absorption lines. Nature 423, 725–727 (2003).
22. Gotthelf, E. V., Halpern, J. P. & Alford, J. The Spin-down of PSR J0821-4300 and PSRJ1210-5226: Confirmation of Central Compact Objects as Anti-magnetars. Astrophys. J. 765,58 (2013).
23. Kargaltsev, O., Durant, M., Misanovic, Z. & Pavlov, G. G. Absorption Features in the X-raySpectrum of an Ordinary Radio Pulsar. Science 337, 946–949 (2012).
24. Potekhin, A. Y. Hydrogen atom moving across a strong magnetic field: analytical approxima-tions. Journal of Physics B: Atomic, Molecular and Optical Physics 31, 49–63 (1998).
25. Medin, Z., Lai, D. & Potekhin, A. Y. Radiative transitions of the helium atom in highlymagnetized neutron star atmospheres. Mon. Not. R. Astron. Soc. 383, 161–172 (2008).
26. Mori, K. & Ho, W. C. G. Modelling mid-Z element atmospheres for strongly magnetizedneutron stars. Mon. Not. R. Astron. Soc. 377, 905–919 (2007).
27. Beloborodov, A. M. & Thompson, C. Corona of Magnetars. Astrophys. J. 657, 967–993(2007).
28. Gelfand, J. D. et al. A Rebrightening of the Radio Nebula Associated with the 2004 December27 Giant Flare from SGR 1806-20. Astrophys. J. 634, L89–L92 (2005).
29. Masada, Y., Nagataki, S., Shibata, K. & Terasawa, T. Solar-Type Magnetic ReconnectionModel for Magnetar Giant Flares. Publ. Astron. Soc. Japan 62, 1093–1102 (2010).
6
0.5 0.6 0.7 0.8 0.9 1 1.1 1.2 1.3 1.4 1.5
0 0.2 0.4 0.6 0.8 1 1.2 1.4 1.6 1.8 2
1000
080
0060
0040
0020
00
Phase
Ener
gy (e
V)En
ergy (keV
) 2 4 6 8 10
0 0.2 0.4 0.6 0.8 1 1.2 1.4 1.6 1.8 2 Phase
0.5 0.6 0.7 0.8 0.9 1 1.1 1.2 1.3 1.4 1.5
Figure 1: | Phase-dependent spectral feature in the EPIC data of SGR 0418+5729. Normalisedenergy versus phase image obtained by binning the EPIC source counts into 100 phase bins and100-eV-wide energy channels and dividing these values first by the average number of counts in thesame energy bin (corresponding to the phase-averaged energy spectrum) and then by the relative0.3–10 keV count rate in the same phase interval (corresponding to the pulse profile normalised tothe average count rate). The red line shows (for only one of the two displayed cycles) the resultsof a simple proton cyclotron model consisting of a baryon-loaded plasma loop emerging from thesurface of a magnetar and intercepting the X-ray radiation from a small hotspot (see SupplementaryFig. 7 and Supplementary Table 1).
7

500
1,00
0
pn c
ount
s
a
02
4
Ener
gy (k
eV)
b
01
2
Wid
th (k
eV)
c
0 0.5 1 1.5 2
00.
51
Dep
th
Phase
d
Figure 2: | Results of the phase-resolved spectroscopy of SGR 0418+5729. a, Pulse profileobtained by folding the 0.3–10 keV EPIC pn light curve at the neutron star spin period P =9.07838827 s. The data points are the number of counts in each phase-dependent spectrum. b-d,Line energy (Ec; b), width (W ; c) and depth (D; d) of the cyclotron feature as a function of thespin phase. The model consists of a blackbody plus a power law and an absorption line, modifiedfor the interstellar absorption (see Supplementary Information). For the line we used the cyclotronabsorption model from ref. 15: F (E) = exp
(− D (WE/Ec)2
(E−Ec)2+W 2
). The interstellar absorption,
temperature, photon index and relative normalisations of the two components were fixed to thebest-fit values of the phase-integrated spectrum: NH = (9.6 ± 0.5) × 1021 cm−2, kT = 913 ± 8eV, Γ = 2.8 ± 0.2, (RBB/d)2 = 0.81 ± 0.03 km2 kpc−2 and KPL = (1.5 ± 0.2) × 10−3 photonscm−2 s−1 keV−1 at 1 keV. Vertical error bars, 1 s.d.
8

0.1
0.05
0.2
0.5
Cou
nts
s−1 k
eV−1
a
−4−2
02
4
!
b
−4−2
02
4
!
c
1 2 5
−4−2
02
4
!
Energy (keV)
d
Figure 3: | Example of a phase-resolved EPIC pn spectrum and its residuals with respect todifferent models. a, Spectrum from the phase interval 0.15–0.17 (black dots) and best-fit modelof the phase-averaged spectrum, rescaled with a free normalisation factor (red line). b, Residualswith respect to this model (χ2
ν = 2.75 for 25 d.f.); c, residuals after the addition of an absorptionline (cyclabs model in XSPEC, with parameters as in Fig. 2; χ2
ν = 0.94 for 22 d.f.); d, residualswith respect to an absorbed blackbody plus power law model with free temperature, photon indexand normalisations (kT = 1.11 ± 0.06 keV and Γ = 3.8 ± 0.4; χ2
ν = 1.75 for 22 d.f.). Thisis one of the models (with the same number of free parameters) that we also explored to fit thephased-resolved spectra. In this case, we obtained fits of comparable quality to those with the linemodel at most phases, but worse fits in the phase interval 0.11–0.21. A joint fit to these five spectragave an unacceptable χ2
ν of 1.56 for 116 d.f., to be compared with χ2ν of 1.08 for the absorption
line model (same number of d.f.). Horizontal error bars indicate the energy channel width; verticalerror bars, 1 s.d.; residuals σ are in units of standard deviations.
9

1 XMM-Newton data analysis
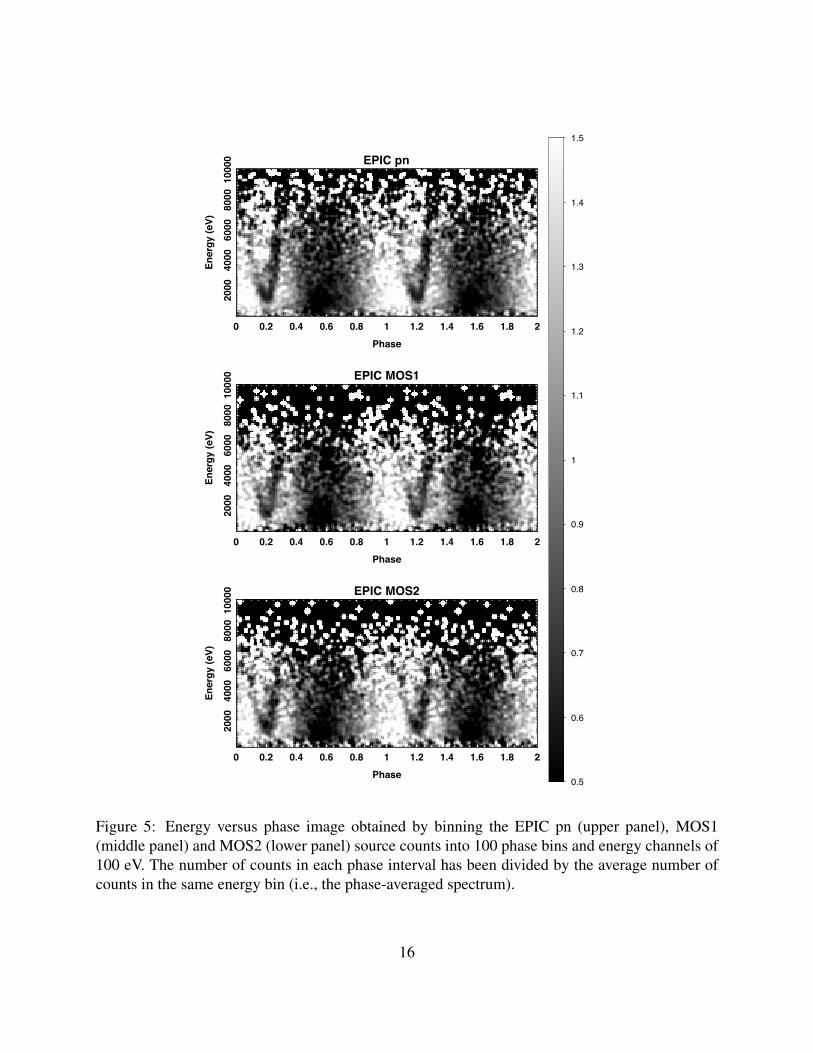
The data have been processed with version 12 of the Scientific Analysis Software (SAS) and weused the most recent (2012 October) calibration files available for the EPIC instrument. EPIC con-sists of two MOS30 and one pn31 CCD cameras sensitive to photons with energy between 0.2 and10 keV. During the 2009 observation (see also Refs. 32, 33), the two MOS and the pn cameras wereset in Small Window mode (time resolution of 0.3 s and 5.7 ms, respectively); all detectors wereoperated with the thin optical blocking filter. Periods in which the particle background was unusu-ally high because of soft proton flares were excluded using an intensity filter. This reduced the netexposure time to 30.7 ks, 50.0 ks and 50.7 ks for pn, MOS1 and MOS2, respectively. Again accord-ing to standard procedure, photon event grades higher than 12 for the MOS cameras and 4 for thepn were filtered out. Photon arrival times were converted to the Solar System barycentre referenceframe, by using the coordinates34 R.A. = 04h18m33.87s, Decl. = +57◦32′22.91′′ (J2000) and thespin phases were computed with the timing parameters of Ref. 32 (P = 9.07838827, Epoch 54993MJD, valid over the range MJD 54993–55463). The phase–energy images extracted for each ofthe three EPIC cameras are shown in Fig. 5. The V-shaped feature indicating the presence of aphase-dependent absorption line is present in the three independent datasets.
We also analysed in the same way the three XMM-Newton observations ofSGR 0418+5729 performed from September 2010 to August 2012 (the observation settings andthe source flux are reported in Ref. 35). However, due to the lower flux, they were not sensitiveenough to detect the absorption feature, even if it were still present.
For the source spectra we used the pn counts extracted from a circular region with radiusof 35′′; the background spectra were extracted from source-free regions on the same chip as thetarget. The ancillary response files and the spectral redistribution matrices were generated with theSAS tasks arfgen and rmfgen, respectively. For the spectral analysis, performed in the 0.3–10 keVenergy range, we used the XSPEC fitting package version 12.436. The abundances adopted werethose of Ref. 37 and for the photoelectric absorption we used the cross-sections from Ref. 38.
2 RXTE and Swift data analysis
The RXTE and Swift observations used in this research have been already presented in Ref. 39, towhich we refer for more information. All data were reprocessed and analysed with version 6.12 ofthe HEAsoft package and the CALDB calibration data base available in 2013 February. Apart fromthis, the Swift data were reduced exactly as described in Ref. 39.
10
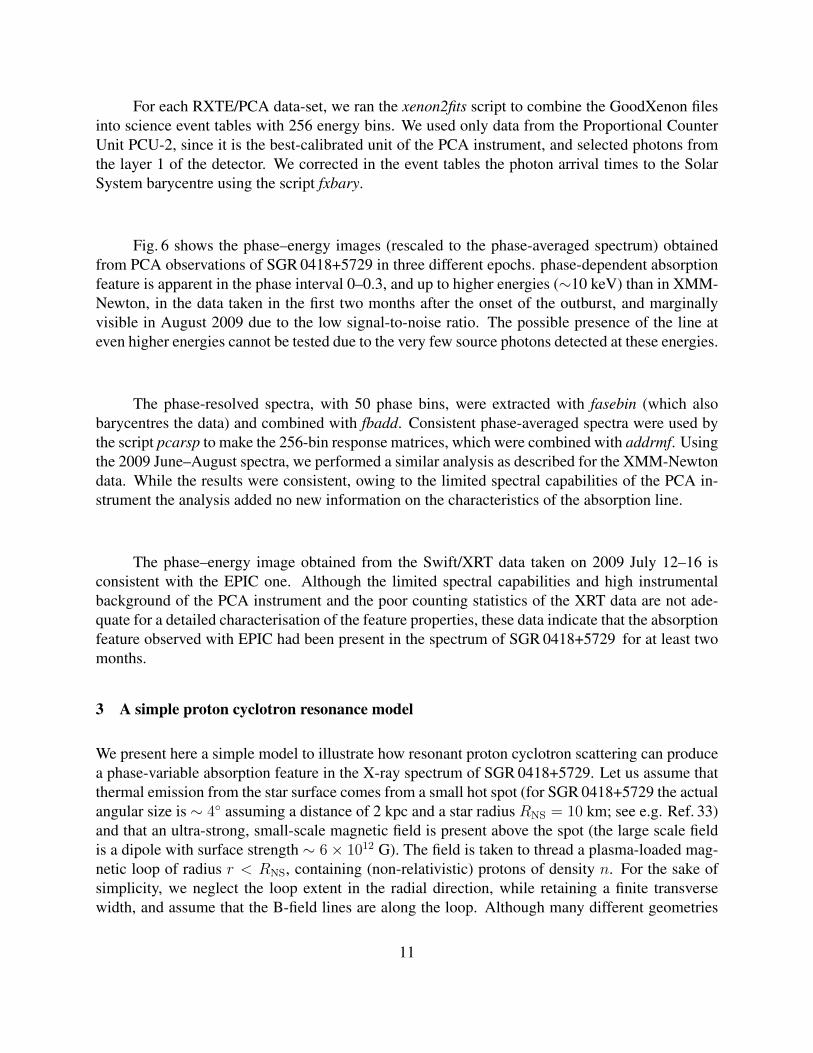
For each RXTE/PCA data-set, we ran the xenon2fits script to combine the GoodXenon filesinto science event tables with 256 energy bins. We used only data from the Proportional CounterUnit PCU-2, since it is the best-calibrated unit of the PCA instrument, and selected photons fromthe layer 1 of the detector. We corrected in the event tables the photon arrival times to the SolarSystem barycentre using the script fxbary.
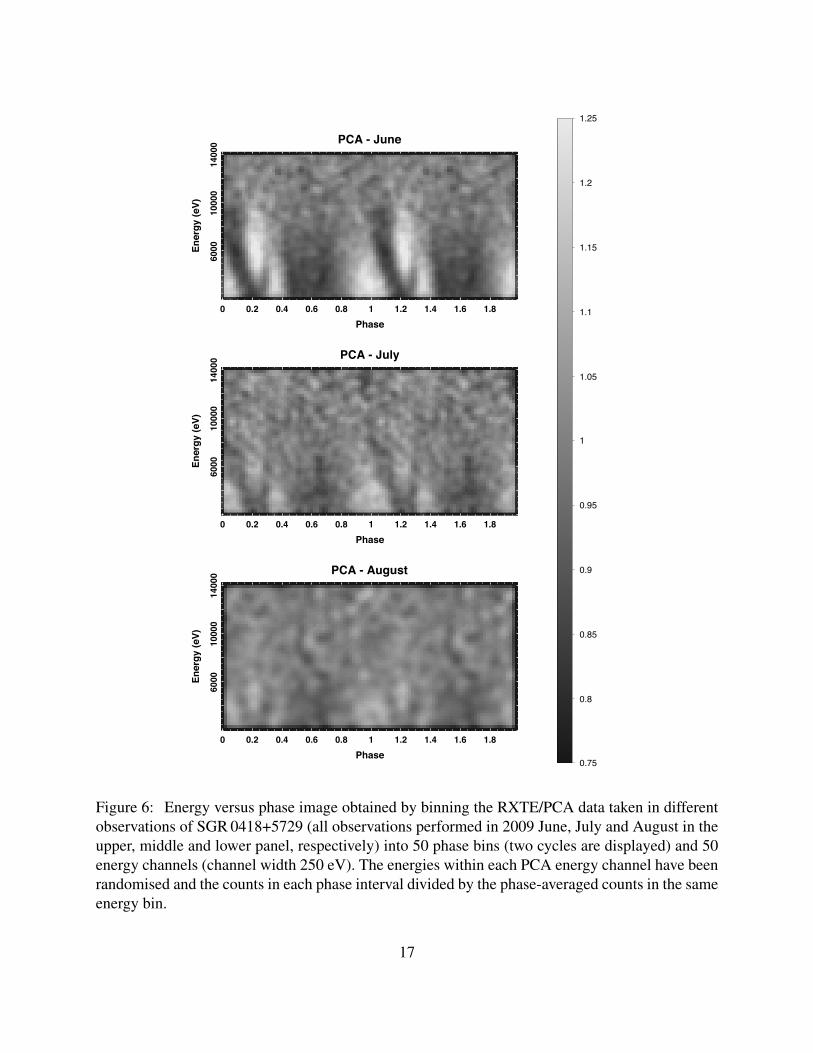
Fig. 6 shows the phase–energy images (rescaled to the phase-averaged spectrum) obtainedfrom PCA observations of SGR 0418+5729 in three different epochs. phase-dependent absorptionfeature is apparent in the phase interval 0–0.3, and up to higher energies (∼10 keV) than in XMM-Newton, in the data taken in the first two months after the onset of the outburst, and marginallyvisible in August 2009 due to the low signal-to-noise ratio. The possible presence of the line ateven higher energies cannot be tested due to the very few source photons detected at these energies.
The phase-resolved spectra, with 50 phase bins, were extracted with fasebin (which alsobarycentres the data) and combined with fbadd. Consistent phase-averaged spectra were used bythe script pcarsp to make the 256-bin response matrices, which were combined with addrmf. Usingthe 2009 June–August spectra, we performed a similar analysis as described for the XMM-Newtondata. While the results were consistent, owing to the limited spectral capabilities of the PCA in-strument the analysis added no new information on the characteristics of the absorption line.
The phase–energy image obtained from the Swift/XRT data taken on 2009 July 12–16 isconsistent with the EPIC one. Although the limited spectral capabilities and high instrumentalbackground of the PCA instrument and the poor counting statistics of the XRT data are not ade-quate for a detailed characterisation of the feature properties, these data indicate that the absorptionfeature observed with EPIC had been present in the spectrum of SGR 0418+5729 for at least twomonths.
3 A simple proton cyclotron resonance model
We present here a simple model to illustrate how resonant proton cyclotron scattering can producea phase-variable absorption feature in the X-ray spectrum of SGR 0418+5729. Let us assume thatthermal emission from the star surface comes from a small hot spot (for SGR 0418+5729 the actualangular size is ∼ 4◦ assuming a distance of 2 kpc and a star radius RNS = 10 km; see e.g. Ref. 33)and that an ultra-strong, small-scale magnetic field is present above the spot (the large scale fieldis a dipole with surface strength ∼ 6× 10¹² G). The field is taken to thread a plasma-loaded mag-netic loop of radius r < RNS, containing (non-relativistic) protons of density n. For the sake ofsimplicity, we neglect the loop extent in the radial direction, while retaining a finite transversewidth, and assume that the B-field lines are along the loop. Although many different geometries
11
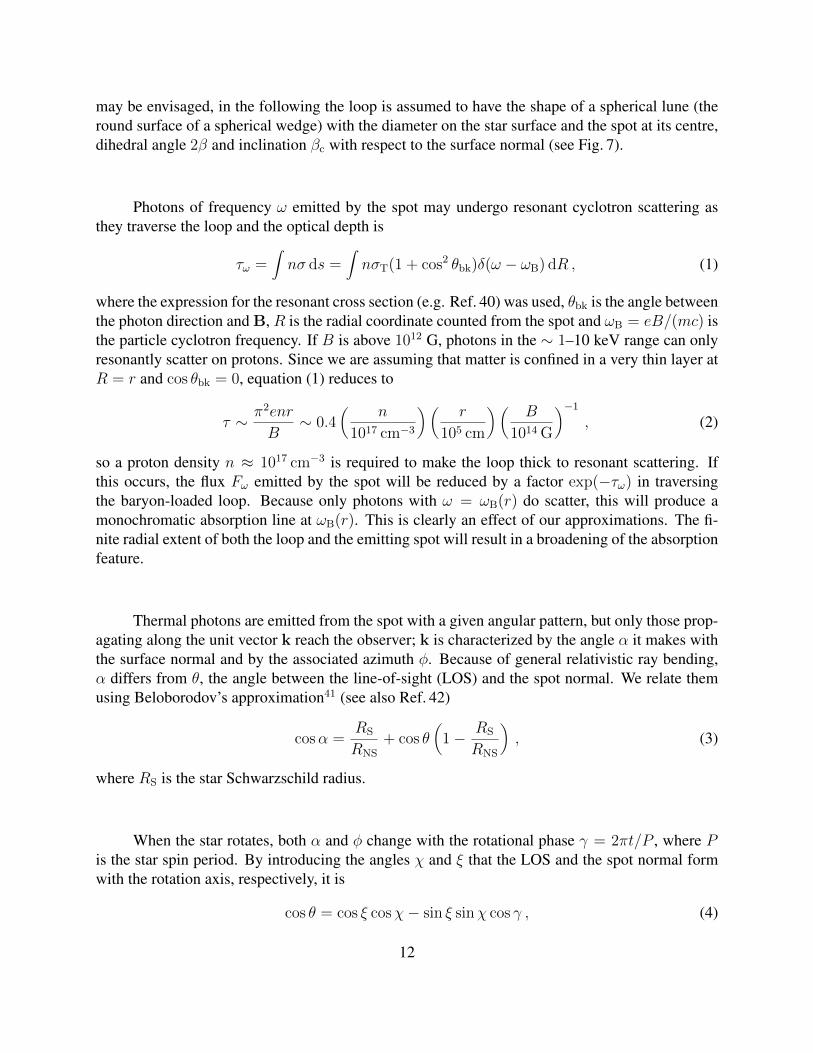
may be envisaged, in the following the loop is assumed to have the shape of a spherical lune (theround surface of a spherical wedge) with the diameter on the star surface and the spot at its centre,dihedral angle 2β and inclination βc with respect to the surface normal (see Fig. 7).
Photons of frequency ω emitted by the spot may undergo resonant cyclotron scattering asthey traverse the loop and the optical depth is
τω =∫nσ ds =
∫nσT(1 + cos2 θbk)δ(ω − ωB) dR , (1)
where the expression for the resonant cross section (e.g. Ref. 40) was used, θbk is the angle betweenthe photon direction and B, R is the radial coordinate counted from the spot and ωB = eB/(mc) isthe particle cyclotron frequency. If B is above 1012 G, photons in the ∼ 1–10 keV range can onlyresonantly scatter on protons. Since we are assuming that matter is confined in a very thin layer atR = r and cos θbk = 0, equation (1) reduces to
τ ∼ π2enr
B∼ 0.4
(n
1017 cm−3
)(r
105 cm
)(B
1014 G
)−1, (2)
so a proton density n ≈ 1017 cm−3 is required to make the loop thick to resonant scattering. Ifthis occurs, the flux Fω emitted by the spot will be reduced by a factor exp(−τω) in traversingthe baryon-loaded loop. Because only photons with ω = ωB(r) do scatter, this will produce amonochromatic absorption line at ωB(r). This is clearly an effect of our approximations. The fi-nite radial extent of both the loop and the emitting spot will result in a broadening of the absorptionfeature.
Thermal photons are emitted from the spot with a given angular pattern, but only those prop-agating along the unit vector k reach the observer; k is characterized by the angle α it makes withthe surface normal and by the associated azimuth φ. Because of general relativistic ray bending,α differs from θ, the angle between the line-of-sight (LOS) and the spot normal. We relate themusing Beloborodov’s approximation41 (see also Ref. 42)
cosα =RS
RNS
+ cos θ(
1− RS
RNS
), (3)
where RS is the star Schwarzschild radius.
When the star rotates, both α and φ change with the rotational phase γ = 2πt/P , where Pis the star spin period. By introducing the angles χ and ξ that the LOS and the spot normal formwith the rotation axis, respectively, it is
cos θ = cos ξ cosχ− sin ξ sinχ cos γ , (4)
12
andcosφ = u · (n× k)/|n× k| = sin γ sinχ√
1− cos2 θ; (5)
the latter follows from geometrical considerations (see again Fig. 7; note that the azimuths associ-ated to α and θ coincide) and the last equality holds for u oriented along the meridian which passesthrough the spot and pointing north. The angle φ is counted from u and changes by 2π in a cycle ifit is ξ < χ while it oscillates between a minimum and a maximum value (which depend on ξ andχ) in the opposite case.
Because α and θ change during a cycle, the ray direction k may or may not intersect the loop,so an absorption feature may be present at certain phases only. What actually happens depends onthe loop geometry (here its transverse angular width 2β and inclination βc) and on the angles χand ξ. Actually, χ and ξ are not known for SGR 0418+5729, the only constraint coming from themeasured pulsed fraction (∼ 50%), which implies that their sum is about 90◦.
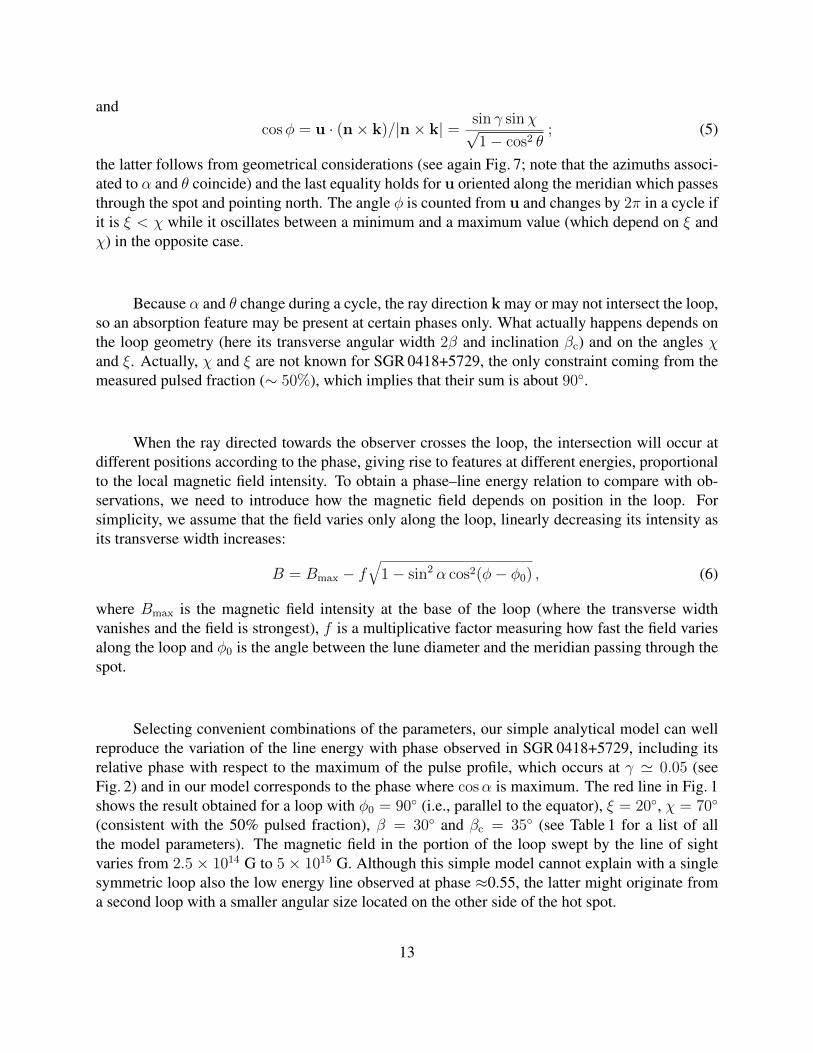
When the ray directed towards the observer crosses the loop, the intersection will occur atdifferent positions according to the phase, giving rise to features at different energies, proportionalto the local magnetic field intensity. To obtain a phase–line energy relation to compare with ob-servations, we need to introduce how the magnetic field depends on position in the loop. Forsimplicity, we assume that the field varies only along the loop, linearly decreasing its intensity asits transverse width increases:
B = Bmax − f√
1− sin2 α cos2(φ− φ0) , (6)
where Bmax is the magnetic field intensity at the base of the loop (where the transverse widthvanishes and the field is strongest), f is a multiplicative factor measuring how fast the field variesalong the loop and φ0 is the angle between the lune diameter and the meridian passing through thespot.
Selecting convenient combinations of the parameters, our simple analytical model can wellreproduce the variation of the line energy with phase observed in SGR 0418+5729, including itsrelative phase with respect to the maximum of the pulse profile, which occurs at γ ' 0.05 (seeFig. 2) and in our model corresponds to the phase where cosα is maximum. The red line in Fig. 1shows the result obtained for a loop with φ0 = 90◦ (i.e., parallel to the equator), ξ = 20◦, χ = 70◦
(consistent with the 50% pulsed fraction), β = 30◦ and βc = 35◦ (see Table 1 for a list of allthe model parameters). The magnetic field in the portion of the loop swept by the line of sightvaries from 2.5 × 10¹⁴ G to 5 × 10¹⁵ G. Although this simple model cannot explain with a singlesymmetric loop also the low energy line observed at phase ≈0.55, the latter might originate froma second loop with a smaller angular size located on the other side of the hot spot.
13
30. Turner, M. J. L. et al. The European Photon Imaging Camera on XMM-Newton: The MOScameras. Astron. Astrophys. 365, L27–L35 (2001).
31. Struder, L. et al. The European Photon Imaging Camera on XMM-Newton: The pn-CCDcamera. Astron. Astrophys. 365, L18–L26 (2001).
32. Rea, N. et al. A Low-Magnetic-Field Soft Gamma Repeater. Science 330, 944 (2010).
33. Turolla, R., Zane, S., Pons, J. A., Esposito, P. & Rea, N. Is SGR 0418+5729 Indeed a WaningMagnetar? Astrophys. J. 740, 105 (2011).
34. van der Horst, A. J. et al. Discovery of a New Soft Gamma Repeater: SGR J0418+5729.Astrophys. J. 711, L1–L6 (2010).
35. Rea, N. et al. The Outburst Decay of the Low Magnetic Field Magnetar SGR 0418+5729.Astrophys. J. 770, 65 (2013).
36. Arnaud, K. A. XSPEC: The First Ten Years. In Jacoby, G. H. & Barnes, J. (eds.) Astronom-ical Data Analysis Software and Systems V, vol. 101 of Astronomical Society of the PacificConference Series, 17–20 (ASP, San Francisco, 1996).
37. Wilms, J., Allen, A. & McCray, R. On the Absorption of X-Rays in the Interstellar Medium.Astrophys. J. 542, 914–924 (2000).
38. Balucinska-Church, M. & McCammon, D. Photoelectric absorption cross sections with vari-able abundances. Astrophys. J. 400, 699 (1992).
39. Esposito, P. et al. Early X-ray and optical observations of the soft gamma-ray repeaterSGR0418+5729. Mon. Not. R. Astron. Soc. 405, 1787–1795 (2010).
40. Thompson, C., Lyutikov, M. & Kulkarni, S. R. Electrodynamics of Magnetars: Implicationsfor the Persistent X-Ray Emission and Spin-down of the Soft Gamma Repeaters and Anoma-lous X-Ray Pulsars. Astrophys. J. 574, 332–355 (2002).
41. Beloborodov, A. M. Gravitational Bending of Light Near Compact Objects. Astrophys. J. 566,L85–L88 (2002).
42. Turolla, R. & Nobili, L. Pulse Profiles from Thermally Emitting Neutron Stars. Astrophys. J.768, 147 (2013).
43. Makishima, K. et al. Observations of the peculiar hard X-ray transient X 0331+53(V 0332+53). Publ. Astron. Soc. Japan 42, 295–315 (1990).
14
0 0.2 0.4 0.6 0.8 1
10−9
10−8
10−7
10−6
10−5
10−4
10−3
0.01
0.1
1
Nul
l hyp
othe
sis
prob
abilit
y
Phase
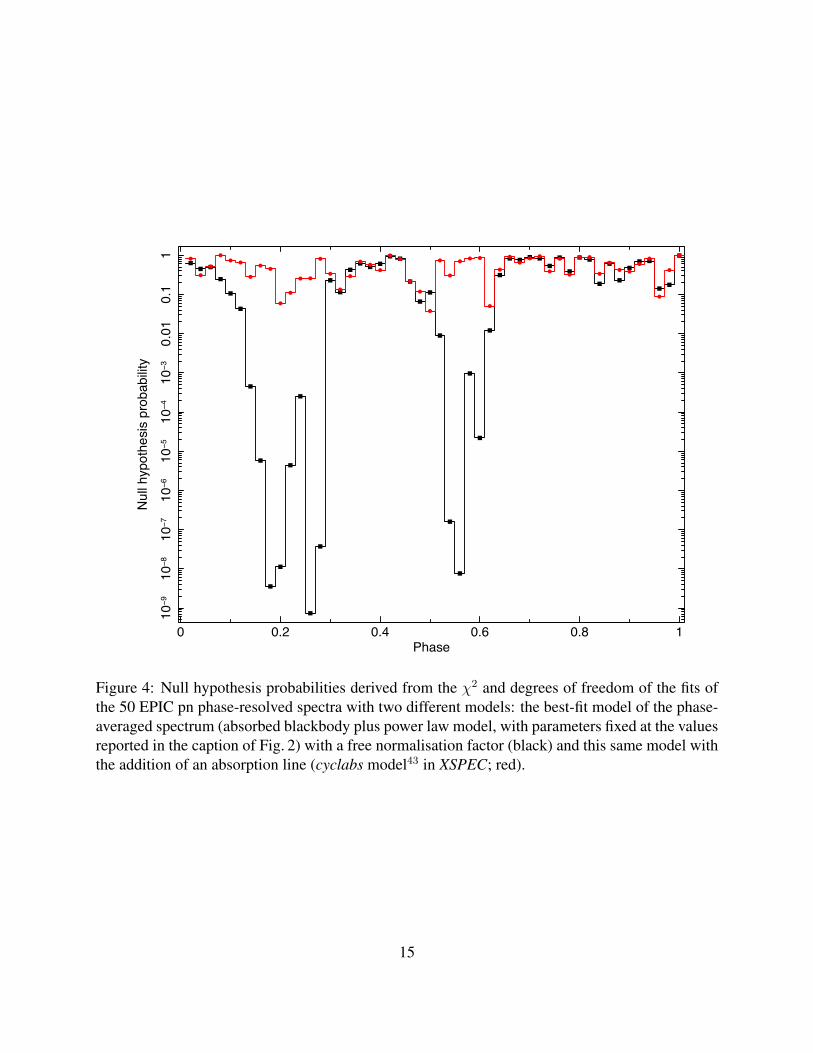
Figure 4: Null hypothesis probabilities derived from the χ2 and degrees of freedom of the fits ofthe 50 EPIC pn phase-resolved spectra with two different models: the best-fit model of the phase-averaged spectrum (absorbed blackbody plus power law model, with parameters fixed at the valuesreported in the caption of Fig. 2) with a free normalisation factor (black) and this same model withthe addition of an absorption line (cyclabs model43 in XSPEC; red).
15
0.5
0.6
0.7
0.8
0.9
1
1.1
1.2
1.3
1.4
1.5
0 0.2 0.4 0.6 0.8 1 1.2 1.4 1.6 1.8 2
1000
080
0060
0040
0020
00
Phase
Ener
gy (e
V)
EPIC MOS2
0 0.2 0.4 0.6 0.8 1 1.2 1.4 1.6 1.8 2
1000
080
0060
0040
0020
00
Phase
Ener
gy (e
V)
EPIC MOS1
0 0.2 0.4 0.6 0.8 1 1.2 1.4 1.6 1.8 2
1000
080
0060
0040
0020
00
Phase
Ener
gy (e
V)
EPIC pn
Figure 5: Energy versus phase image obtained by binning the EPIC pn (upper panel), MOS1(middle panel) and MOS2 (lower panel) source counts into 100 phase bins and energy channels of100 eV. The number of counts in each phase interval has been divided by the average number ofcounts in the same energy bin (i.e., the phase-averaged spectrum).
16
0.75
0.8
0.85
0.9
0.95
1
1.05
1.1
1.15
1.2
1.25
0 0.2 0.4 0.6 0.8 1 1.2 1.4 1.6 1.8
1400
010
000
6000
Phase
Ener
gy (e
V)
PCA - July
0 0.2 0.4 0.6 0.8 1 1.2 1.4 1.6 1.8
1400
010
000
6000
Phase
Ener
gy (e
V)
PCA - August
0 0.2 0.4 0.6 0.8 1 1.2 1.4 1.6 1.8
1400
010
000
6000
Phase
Ener
gy (e
V)
PCA - June
Figure 6: Energy versus phase image obtained by binning the RXTE/PCA data taken in differentobservations of SGR 0418+5729 (all observations performed in 2009 June, July and August in theupper, middle and lower panel, respectively) into 50 phase bins (two cycles are displayed) and 50energy channels (channel width 250 eV). The energies within each PCA energy channel have beenrandomised and the counts in each phase interval divided by the phase-averaged counts in the sameenergy bin.
17

Figure 7: Schematic view of the model discussed in the text. The line-of-sight (LOS) forms anangle θ with the normal to the surface at the spot position, n, and crosses a magnetic loop orientedat some arbitrary direction with respect to u. General relativistic ray bending is neglected here, soα = θ. The actual direction of the photon, k′, differs from k (see text and equation 3). However,since k′, k and n lie in the same plane, both directions share the same azimuthal angle φ.
Table 1: Parameters of the proton cyclotron model producing the line energy variability displayedin Fig. 1 (see Fig. 7 for a schematic view of the model geometry).
Parameter Description Valueξ Angle between the spot normal and the rotation axis 20◦
χ Angle between the LOS and the rotation axis 70◦
φ0 Angle between the lune diameter and the spot meridian 90◦
β Semi-amplitude of the lune transverse angle 30◦
βc Lune inclination angle 35◦
z Gravitational redshift at the neutron star surface 0.25Bmax Magnetic field intensity at the base of the loop 7.41× 10¹⁵ Gf Linear term in Eq. 6 7.16× 10¹⁵ G
18