a value-momentum trading strategy using selective …
TRANSCRIPT

A VALUE-MOMENTUM TRADING STRATEGY USING SELECTIVE EQUITY SCREENING
CRITERIA
by
Anderson Chu
BBA, Menlo College, Atherton, CA, U.S. 2006
and
Anh Tran
BBA, Simon Fraser University, Burnaby, 2009
PROJECT SUBMITTED IN PARTIAL FULFILLMENT OF
THE REQUIREMENTS FOR THE DEGREE OF
MASTER OF FINANCIAL RISK
MANAGEMENT
In the Faculty of Business Administration
© Anderson Chu, Anh Tran, 2010
SIMON FRASER UNIVERSITY
Summer 2010
All rights reserved. However, in accordance with the Copyright Act of Canada, this work
may be reproduced, without authorization, under the conditions for Fair Dealing.
Therefore, limited reproduction of this work for the purposes of private study, research,
criticism, review and news reporting is likely to be in accordance with the law, particularly if cited appropriately.

i
Approval
Name: Anderson Chu and Anh Tran Degree: Master of Financial Risk Management
Title of Project: A Value-Momentum Trading Strategy Using Selective
Equity Screening Criteria Supervisory Committee:
Dr. Robert. R. Grauer Senior Supervisor Endowed Professor, Finance
Dr. Alexander Vedrashko Second Reader Assistant Professor, Finance
Date Approved:
ii
Abstract
Investors and money managers are constantly looking for a trading strategy that can help them
outperform the market. These strategies usually are constructed from fundamental analysis that
help money managers select the best value stocks for their portfolios. Hence, the task of finding
common features of winning stocks is highly important. These common features are usually
represented in terms of fundamental data. The purpose of this paper is to reexamine Yu
(2009)’s four-factor trading strategy, which is based on Reinganum (1988)’s original four-factor
strategy, on the S&P 500 stocks, and to develop a new profitable trading strategy based on
updated value and momentum factors.
Keywords: Equity Screening, Portfolio Abnormal Return, Portfolio Management

iii
Dedication
We wish to dedicate this report to our family members for their endless support throughout our
lives.

iv
Acknowledgements
We would like to sincerely thank our senior supervisor, Dr. Robert R. Grauer and our second
reader, Dr. Alexander Vedrashko for their support, comment, patience and encouragement
throughout the semester. Without them, we will never be able to achieve this accomplishment.
We also would like to express special thanks to our friends and fellow classmates for providing
us with assistance, opinion, and encouragement throughout the process of this paper.

Contents
Approval ..................................................................................................................................... i
Abstract ..................................................................................................................................... ii
Dedication ................................................................................................................................. iii
Acknowledgements ................................................................................................................... iv
1. Introduction .........................................................................................................................1
2. Literature Review.................................................................................................................2
3. Equity Screening Methodology ............................................................................................3
a. Return Related Filters ...................................................................................................3
b. Risk Related Filters .......................................................................................................4
c. Size Related Filters .......................................................................................................4
4. Data .....................................................................................................................................5
5. Performance Measure Methodology .....................................................................................5
6. Results .................................................................................................................................6
Table 1 .................................................................................................................................7
Performance Measurement of Portfolios’ Monthly Returns ..................................................7
Table 2 .................................................................................................................................8
Performance Measurement of Portfolios’ Quarterly Returns .................................................8
Table 3 .................................................................................................................................9
Results of Alphas for Both Portfolios’ Monthly Return ........................................................9
Table 4 .................................................................................................................................9
Results of Alphas for Both Portfolios’ Quarterly Return .......................................................9
Table 5 .................................................................................................................................9
Results of Matched-Pair t-test on Differences in Both Portfolios’ Average Returns ..............9
6.1 The 1990 - 2009 Period .................................................................................................... 10
6.2 The 1990 - 1999 Period .................................................................................................... 10
6.3 The 2000 - 2009 Period .................................................................................................... 11
7. Conclusion ......................................................................................................................... 11
References ................................................................................................................................ 13

1
1. Introduction
Money managers are striving to find a successful trading strategy that will help them
outperform their rivals. They are constantly trying different strategies to obtain significant
abnormal returns in their portfolios. This competition has made the mission of finding alpha
difficult. This paper will first reexamine Yu’s (2009) four-factor trading strategy developed from
Reinganum’s (1988) original four-factor strategy. Then we will develop our trading strategy
created from a different set of factors with the hope that these portfolios will outperform the
market. We evaluate the effectiveness of our strategy by back testing it using data from 1990 to
the end of 2009 from the 500 stocks in the S&P 500 Index. We construct an equally weighted
portfolio using five screening filters every quarter. Then, we evaluate the monthly and quarterly
performance of these portfolios in the context of the Jensen’s (1972) Capital Asset Pricing alpha,
Fama and French’s (1996) three-factor alpha and Carhart’s (1997) four-factor alpha. In addition,
we compare the returns of our portfolios to the return of Yu’s (2009) equally weighted portfolios
to determine which strategy is more profitable.
Significant alphas are found in both strategies in almost all models used to evaluate
monthly and quarterly returns of constructed portfolios over the entire period and two sub-
periods. These findings lead us to believe that both Reinganum’s revised strategy and our value
investing mix momentum strategy are profitable.
The remainder of the paper is composed of six sections. Section 2 contains the literature
review on the framework used in our study. The data and methodology of our trading strategy
together with the analysis of our screening factors and those of Yu are mentioned in section 3, 4
and 5. Section 6 will summarize all results and findings. Section 7 is the conclusion of the paper.

2
2. Literature Review
As many studies, such as Chan and Lakinishok (2004), have suggested that value
investing will, on average, outperform momentum investing in the long run. But, we are
interested to know whether adding momentum factors to value investing strategy will create any
value. Interesting findings of recent studies by Jegadeesh and Titman (1993) and Chan (1996)
lead us to believe the implementation will add value to investors. These studies claim that
investors can take advantage of the slowness in response to new information by investing with
price and earnings momentum in the short term. Undoubtedly, transactions and other related
costs should be considered in momentum strategies as they require more frequent turnover of
portfolio’s assets. A more recent study by Korajczyk and Sadka (2004) examines the effects of
trading and the liquidity premium on momentum strategies and conclude that a liquidity-
weighted strategy can still create profit opportunities for investors.
Now, the question is whether we can identify the common features of winning stocks.
Reinganum (1988) studies 222 winning stocks traded on NYSE and AMEX that have at least
doubled in price in any single year between 1970 and 1983. He then examines the performance
of portfolios created using two strategies: a nine-variable model and a four-variable model. His
four variables are: market-to-book ratio less than one; most recent quarterly earnings changes
faster than of the previous one; most recent quarter’s relative strength greater than the previous
quarter; and less than 20 million outstanding shares. He finds that both strategies can generate
significant cumulative excess returns.
Yu (2009) replicates Reinganum’s four-variable strategy over extended periods from
1970 to 2006 and compares her new strategies with other common features of winning stocks to
Reinganum’s strategy. She finds that Reinganum’s strategy applied in the post 1984 period

3
yields even higher returns than the pre 1984 period and her new strategy with variations of rules
and filters can result in higher abnormal returns and alphas than portfolios constructed by
Reinganum’s strategy.
Another concern is the effect of market anomalies, such as the size effect. The idea that
small stocks earn higher return than large stocks varies over different periods of time. Arnott
(2005) finds that the size effect has far less effect than commonly perceived and that value
factors are more powerful and consistent than thought.
3. Equity Screening Methodology
The filters can be grouped into three main categories: return, risk and size.
a. Return Related Filters
Year-over-Year Net Income Changes
Yu considers year-over-year net income changes to represent the return performance in
her model and can tell whether a firm is able to outperform its growth from last year’s same
quarter. The following formula demonstrates how the year-over-year net income changes are
calculated:
Return on Equity (ROE) and 6-month Return
The past 6-month Return is included in both strategies; while, the ROE is only included
in our strategy. Both filters best represent the return factor and the well-being condition of a
company in both long term and relatively short term. Specifically, the ROE ratio represents the
return effectiveness of a firm to the investor as its formula represents the magnitude of net
income (return) received for every unit of equity. The 6-month total return including all

4
dividends payout helps indicate if a firm is able to sustain their returns within relatively short
term.
b. Risk Related Filters
Market Cap to Book Ratio
Yu uses market cap to book ratio as the size and value measure in her model. This ratio is
defined as book value to market value. This ratio compares the market value of the firm relative
to its historical book value. The value of the ratio helps Yu determine whether the firm is
overvalued or undervalued relative to book value.
Asset to Equity and P/E
The next two ratios enable us to categorize companies in term of their riskiness level. The
Asset to Equity ratio indicates how much leverage a company is taking on. Being value
investors, we want companies with acceptable level of leverage but not too high comparing to its
peers average. As a result, this ratio will screen out companies that are not fit in our investing
strategy. For the price to earnings ratio, we decide to include this in our model as we prefer lower
P/E companies that are cheaper on average for every unit of earnings. High P/E companies tend
to have higher growth in the future, so they are more likely to have high debt and leverage
compared to lower P/E companies. Thus, low to medium P/E companies are preferred in our
investing strategy.
c. Size Related Filters
Market Cap
The last factor that both strategies consider is the size of the firm. Unlike most value
investors who would prefer firms with large market cap, Yu and we prefer firms with small to
medium market cap relative to the index average market cap. As mentioned in the literature

5
review, small cap companies tend to outperform large cap companies in the long term. As a
result, this filter is used in both strategies.
We exclude stocks with missing values from the screening process. Next, we define our
cutting point for each filter. These cutting points are set in a way that will best represent our
mixed investing style. This means we will pick the top 50th
percentile for filters, such as ROE, 6-
month Return, YOY Quarterly Net Income Changes and bottom 50th percentile for filters such as
Market Cap, Asset to Equity, P/E and Market Cap to Book Ratio.
4. Data
The data are obtained from CompuStat and CRSP data through Wharton Research Data
Services (WRDS) website. The data period is quarterly from 1990 to the end of 2009. The
monthly and quarterly market return between 1990 and 2009 together with the SMB (Small
Minus Big) and HML (High Minus Low) factors are attained from Kenneth R. French’s website;
whereas, the 3-month treasury bills are downloaded from the Federal Reserve Bank of St. Louis’
website.
5. Performance Measure Methodology
After the screening process, portfolios for every quarter are formed. We compute the
monthly and quarterly total returns assuming that portfolios are equally weighted. Monthly
returns of constructed portfolios are attained from CRSP data and quarterly returns are computed
from the monthly data. Since both strategies are based on past quarterly data and these data may
not be available immediately to the public, we will issue a buy signal two months after each
quarter end. Thus, the portfolios’ monthly and quarterly returns will be calculated accordingly.
After determining monthly and quarterly returns over the entire period 1990 to end of 2009, we
take the average value of the constructed portfolios’ returns over the desired periods.

6
Jensen’s alpha, Fama-French’s three-factor alpha and Carhart’s four-factor alpha are used to
evaluate the performance of portfolios constructed by Yu’s strategy and our strategy.
( )
( )
( )
where:
= return of a portfolio created by a strategy
= return of a value-weighted portfolio of NASDAQ/NYSE/AMEX market proxy
= return of Treasury bill rate (monthly and 3-month)
= excess return of the market proxy over the Treasury bill rate
= average return on three small portfolios minus average return on three big
portfolios
= average return on the two value portfolios minus the average return on the two
growth portfolios
= average return on the two high prior return portfolios minus the average return
on the two low prior return portfolios
In addition, we regress the differences in both portfolios’ monthly and quarterly return in the
above frameworks. This additional test will show whether the differences between two
portfolios’ alphas are statistically significant at 5% level.
6. Results
The results are displayed in the following tables
7
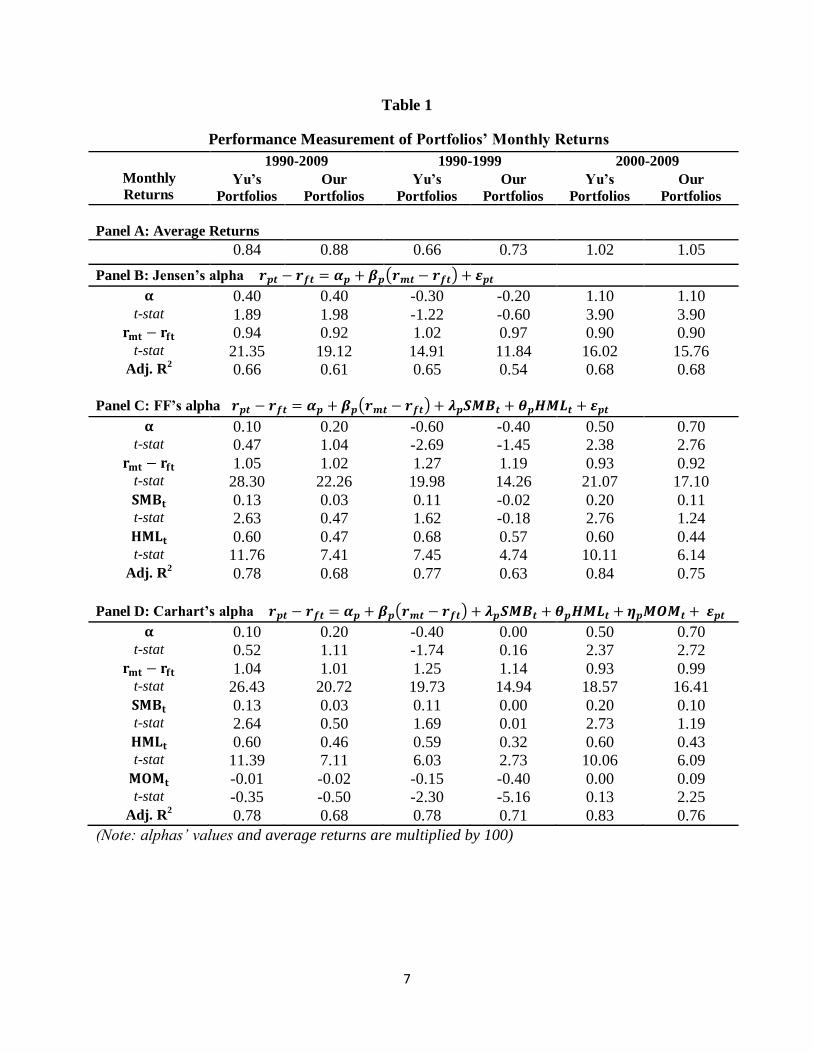
Table 1
Performance Measurement of Portfolios’ Monthly Returns
Monthly
Returns
1990-2009 1990-1999 2000-2009
Yu’s
Portfolios
Our
Portfolios
Yu’s
Portfolios
Our
Portfolios
Yu’s
Portfolios
Our
Portfolios
Panel A: Average Returns
0.84 0.88 0.66 0.73 1.02 1.05
Panel B: Jensen’s alpha ( )
0.40 0.40 -0.30 -0.20 1.10 1.10 t-stat 1.89 1.98 -1.22 -0.60 3.90 3.90
0.94 0.92 1.02 0.97 0.90 0.90 t-stat 21.35 19.12 14.91 11.84 16.02 15.76
Adj. R2 0.66 0.61 0.65 0.54 0.68 0.68
Panel C: FF’s alpha ( )
0.10 0.20 -0.60 -0.40 0.50 0.70 t-stat 0.47 1.04 -2.69 -1.45 2.38 2.76
1.05 1.02 1.27 1.19 0.93 0.92 t-stat 28.30 22.26 19.98 14.26 21.07 17.10 0.13 0.03 0.11 -0.02 0.20 0.11 t-stat 2.63 0.47 1.62 -0.18 2.76 1.24 0.60 0.47 0.68 0.57 0.60 0.44 t-stat 11.76 7.41 7.45 4.74 10.11 6.14
Adj. R2 0.78 0.68 0.77 0.63 0.84 0.75
Panel D: Carhart’s alpha ( )
0.10 0.20 -0.40 0.00 0.50 0.70 t-stat 0.52 1.11 -1.74 0.16 2.37 2.72
1.04 1.01 1.25 1.14 0.93 0.99 t-stat 26.43 20.72 19.73 14.94 18.57 16.41 0.13 0.03 0.11 0.00 0.20 0.10 t-stat 2.64 0.50 1.69 0.01 2.73 1.19 0.60 0.46 0.59 0.32 0.60 0.43 t-stat 11.39 7.11 6.03 2.73 10.06 6.09 -0.01 -0.02 -0.15 -0.40 0.00 0.09 t-stat -0.35 -0.50 -2.30 -5.16 0.13 2.25
Adj. R2 0.78 0.68 0.78 0.71 0.83 0.76
(Note: alphas’ values and average returns are multiplied by 100)
8
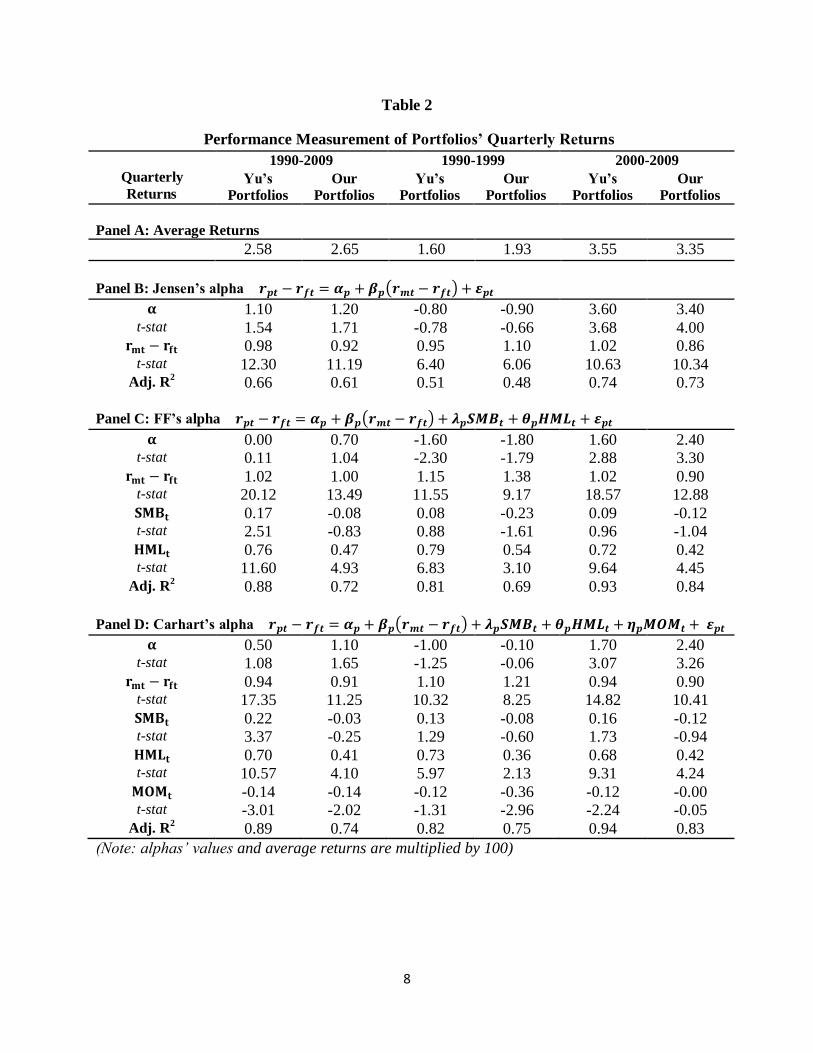
Table 2
Performance Measurement of Portfolios’ Quarterly Returns
Quarterly
Returns
1990-2009 1990-1999 2000-2009
Yu’s
Portfolios
Our
Portfolios Yu’s
Portfolios Our
Portfolios Yu’s
Portfolios Our
Portfolios
Panel A: Average Returns
2.58 2.65 1.60 1.93 3.55 3.35
Panel B: Jensen’s alpha ( )
1.10 1.20 -0.80 -0.90 3.60 3.40 t-stat 1.54 1.71 -0.78 -0.66 3.68 4.00
0.98 0.92 0.95 1.10 1.02 0.86 t-stat 12.30 11.19 6.40 6.06 10.63 10.34
Adj. R2 0.66 0.61 0.51 0.48 0.74 0.73
Panel C: FF’s alpha ( )
0.00 0.70 -1.60 -1.80 1.60 2.40 t-stat 0.11 1.04 -2.30 -1.79 2.88 3.30
1.02 1.00 1.15 1.38 1.02 0.90 t-stat 20.12 13.49 11.55 9.17 18.57 12.88 0.17 -0.08 0.08 -0.23 0.09 -0.12 t-stat 2.51 -0.83 0.88 -1.61 0.96 -1.04 0.76 0.47 0.79 0.54 0.72 0.42 t-stat 11.60 4.93 6.83 3.10 9.64 4.45
Adj. R2 0.88 0.72 0.81 0.69 0.93 0.84
Panel D: Carhart’s alpha ( )
0.50 1.10 -1.00 -0.10 1.70 2.40 t-stat 1.08 1.65 -1.25 -0.06 3.07 3.26
0.94 0.91 1.10 1.21 0.94 0.90 t-stat 17.35 11.25 10.32 8.25 14.82 10.41 0.22 -0.03 0.13 -0.08 0.16 -0.12 t-stat 3.37 -0.25 1.29 -0.60 1.73 -0.94 0.70 0.41 0.73 0.36 0.68 0.42 t-stat 10.57 4.10 5.97 2.13 9.31 4.24 -0.14 -0.14 -0.12 -0.36 -0.12 -0.00 t-stat -3.01 -2.02 -1.31 -2.96 -2.24 -0.05
Adj. R2 0.89 0.74 0.82 0.75 0.94 0.83
(Note: alphas’ values and average returns are multiplied by 100)

9
Table 3
Results of Alphas for Both Portfolios’ Monthly Return
1990-2009 1990-1999 2000-2009
Panel A: Jensen’s alpha ( )
0.05 0.11 0.03 t-stat 0.31 0.43 0.11
Panel B: FF’s alpha ( )
0.13 0.13 0.19 t-stat 0.73 0.51 0.71
Panel C: Carhart’s alpha ( )
0.14 0.46 0.19 t-stat 0.76 1.76 0.71
(Note: alphas’ values are multiplied by 100)
Table 4
Results of Alphas for Both Portfolios’ Quarterly Return
1990-2009 1990-1999 2000-2009
Panel A: Jensen’s alpha ( )
0.15 -0.03 -0.25 t-stat 0.28 -0.03 -0.36
Panel B: FF’s alpha ( )
0.61 -0.26 0.62 t-stat 1.20 -0.32 0.93
Panel C: Carhart’s alpha ( )
0.61 0.93 0.57 t-stat 1.13 1.01 0.89
(Note: alphas’ values are multiplied by 100)
Table 5
Results of Matched-Pair t-test on Differences in Both Portfolios’ Average Returns
1990-2009 1990-1999 2000-2009
Monthly
Return’s t-stat
0.25 0.26 0.10
Quarterly
Return’s t-stat
0.12 0.41 -0.27

10
6.1 The 1990 - 2009 Period
Over the entire period, the average monthly and quarterly return of portfolios constructed
using our strategy are 0.88% and 2.65% respectively, which are higher than the average returns
of 0.84% and 2.58% from portfolios constructed using Yu’s strategy as shown in Table 1 and
Table 2. However, the differences in both portfolios’ average returns are not statistically
significant as shown in Table 5. Our portfolios’ cumulative return for the entire period is $12.08
for every dollar invested at the beginning of the period comparing to $10.99 from Yu’s
portfolios. Neither strategy can create monthly and quarterly portfolios with significant abnormal
return in Fama-French’s three-factor alpha and Carhart’s four-factor alpha. In Jensen’s alpha,
only monthly portfolios constructed using our strategy have positive and significant abnormal
return.
6.2 The 1990 - 1999 Period
The average return of monthly and quarterly portfolios constructed using our strategy are
0.73% and 1.93% respectively, which are higher than the average return of 0.66% and 1.6% from
portfolios constructed using Yu’s strategy (Table 1 and 2). But, the differences in both
portfolios’ average returns are not statistically significant (Table 5). Also, one should earn $3.22
at the end of 1999 for every dollar invested at the beginning of 1990 in our portfolios; while,
Yu’s portfolios will earn $3.03. Neither Yu’s nor our portfolios can create any positive and
significant abnormal return in this period. The only portfolios with significant and negative
abnormal return are Yu’s monthly and quarterly portfolios measured in Fama-French’s three-
factor alpha.

11
6.3 The 2000 - 2009 Period
In this sub-period, the monthly portfolios constructed using Yu's strategy have lower average
return than those constructed using our strategy (1.02% compared to 1.05%). However, the
average quarterly return of Yu’s portfolios (3.55%) is greater than our strategy’s average return
of 3.35%. The differences in both portfolios’ average returns do not have any statistical
significance as displayed in Table 5. Our portfolios can produce $3.75 at the end of 2009 for
every dollar invested at the start of 2000 comparing to $3.63 produced by Yu’s portfolios in the
same period. All portfolios perform very well in second half period. In fact, they all have highly
significant and positive abnormal return as shown in both tables 1 and 2. Also, the alphas for
Yu’s and our portfolios are not statistically different at 5% level (Table 3 &4). Both monthly
and quarterly portfolios constructed using Yu's strategy have higher abnormal return than those
constructed using our strategy in Jensen’s alpha. When measured in Fama-French’s three-factor
alpha and Carhart’s four-factor alpha, our monthly and quarterly portfolios yield greater
abnormal return relative to Yu’s monthly and quarterly portfolios.
7. Conclusion
Our strategy is better than Yu’s over the entire period. The average monthly and quarterly
returns of portfolios constructed using our strategy are greater than those of Yu’s although the
differences are not statistically significant. In addition, only our portfolio has a positive
statistically significant Jensen’s alpha of 0.4% with monthly returns.
Over the first sub-period, our strategy is arguably better than Yu’s for the following
reasons. The average monthly and quarterly returns of our portfolios are higher than those of
Yu’s portfolios although the differences are not statistically significant. At the 5% significance
level, Yu’s portfolios generate negative and significant alpha on both monthly and quarterly

12
return basis according to Fama-French. Our portfolios also experience negative alphas on both
monthly and quarterly basis in all models, but the losses are smaller than those of Yu’s and our
alphas are not statistically significant.
Over the second sub-period, our strategy shows improvement over Yu’s. Our portfolio’s
average monthly return is greater than those of Yu’s, but the average quarterly return of Yu is
slightly higher than our portfolio’s. But, the differences in both portfolios’ average returns are
not statistically significant. Both strategies are profitable over the second sub-period as both
portfolios are capable of creating consistently high positive Jensen, Fama-French and Carhart
alphas. In fact, the alphas of our portfolios on monthly and quarterly return basis in Fama-French
and Carhart are much greater than those of Yu’s. Both Yu’s and our portfolios produce similar
significant and positive Jensen’s alpha.
In addition, the adjusted R2
for Yu’s portfolios are higher than ours in all regressions.
This leads us to believe that our value-momentum strategy contains other unknown factors
responsible for abnormal returns in our portfolios.
Overall, we find that only our strategy can construct monthly portfolios with significant
alpha over the entire period and both strategies are capable of creating high and very significant
alpha over the second sub-period.
Hence, equity screening models are important and useful tools for money managers in
their quest for alpha.
13
References
Arnott, R.D. (2005), “Disentangling size and value”, Financial Analyst Journal, Vol. 61 No. 5
pp. 12-15.
Bodie Z., Kane A., Marcus A., Perrakis S., Ryan P. (2005). Investments, Toronto: McGraw-Hill
Ryerson.
Carhart, M.M., (1997). “On persistence in mutual fund performance”, Journal of Finance, Vol.
52, pp. 57-92.
Chan, L.K.C and Lakonishok, J. (2004),”Value and growth investing: review and update”,
Financial Analyst Journal, Vol.60 No.1, pp. 71-86.
Chan, L.K.C, Jegadeesh, N. and Lakonishok, J. (1996), “Momentum strategies”, Journal of
Finance, Vol.51 No.5, pp.1681-731.
Fama, E.F., French, K.R. (1996), “Multifactor explanations of asset pricing anomalies”, Journal
of Finance, Vol. 51, pp. 55-84.
Jegadeesh, N. and Titman, S. (1993). “Returns to buying winners and selling losers: implications
for stock market efficiency”, Journal of Finance, Vol.48 No.1, pp.65-91.
Jensen, M.C., 1972, “Capital Market: Theory and evidence”, Bell Journal of Economics and
Management Science, Vol.3, pp. 357-398.
Korajczyk, R.A and Sadka, R. (2004), “Are momentum profits robust to trading costs?”, Journal
of Finance, Vol.59 No.3, pp.1039-82.
Reinganum, M.R. (1988), “The anatomy of a stock market strategies”, Journal of Finance,
Vol.44 No.1, pp. 16-28.
Yu, S. (2009), “Reinganum’s trading strategies revisited”, Managerial Finance, Vol. 35 No. 4,
pp.357-384.