a ut ono m o u s ocea n m ea sureme n t s in the c …diego, la jolla, ca, usa. hey-jin kim is...
TRANSCRIPT

Oceanography | Vol. 26, No. 318
S P E C I A L I S S U E O N C O A S TA L L O N G T E R M E C O L O G I C A L R E S E A R C H
AUTONOMOUS OCEAN MEASUREMENTS IN THE
CALIFORNIA CURRENT ECOSYSTEM
B Y M A R K D . O H M A N , D A N I E L L . R U D N I C K ,
A L E X A N D E R C H E K A LY U K , R U S S E . D AV I S ,
R I C H A R D A . F E E LY , M AT I K A H R U ,
H E Y ! J I N K I M , M I C H A E L R . L A N D R Y,
T O D D R . M A R T Z ,
C H R I S T O P H E R L . S A B I N E ,
A N D U W E S E N D
Oceanography | Vol. 26, No. 318
Oceanography | September 2013 19
ABSTR AC T. Event-scale phenomena, of limited temporal duration or restricted spatial extent, o!en play a disproportionately large role in ecological processes occurring in the ocean water column. Nutrient and gas "uxes, upwelling and downwelling, transport of biogeochemically important elements, predator-prey interactions, and other processes may be markedly in"uenced by such events, which are inadequately resolved from infrequent ship surveys. #e advent of autonomous instrumentation, including underwater gliders, pro$ling "oats, surface dri!ers, enhanced moorings, coastal high-frequency radars, and satellite remote sensing, now provides the capability to resolve such phenomena and assess their role in structuring pelagic ecosystems. #ese methods are especially valuable when integrated together, and with shipboard calibration measurements and experimental programs.
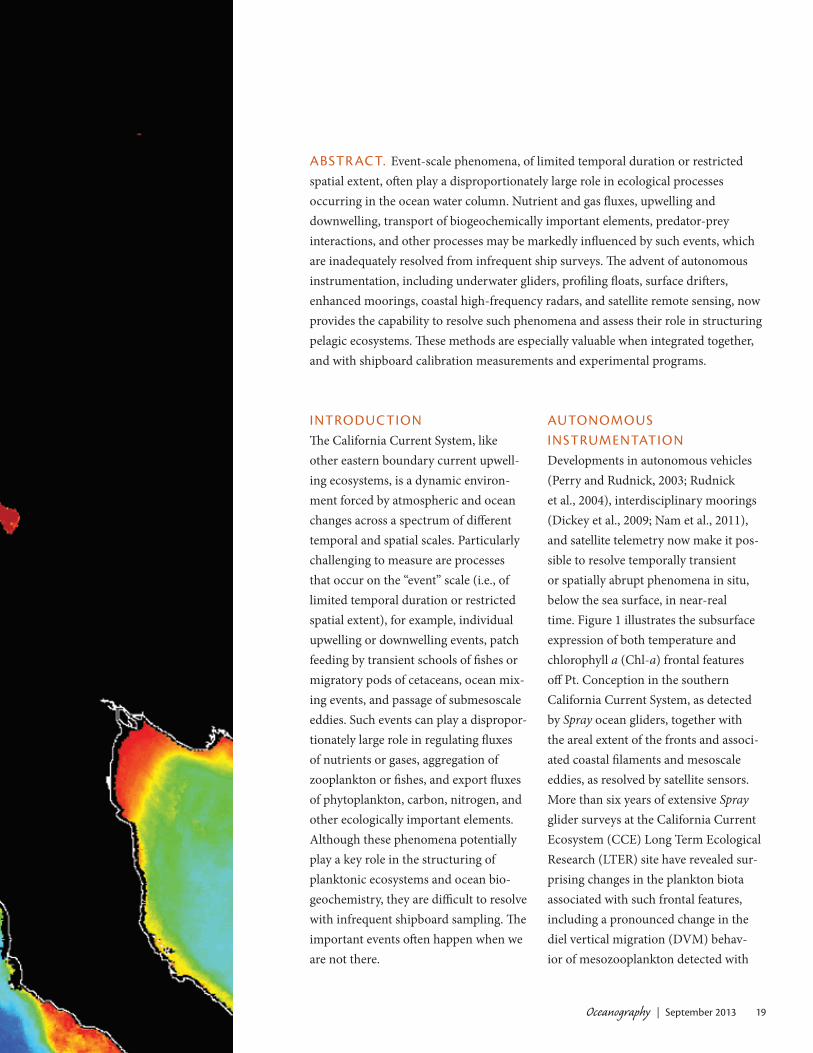
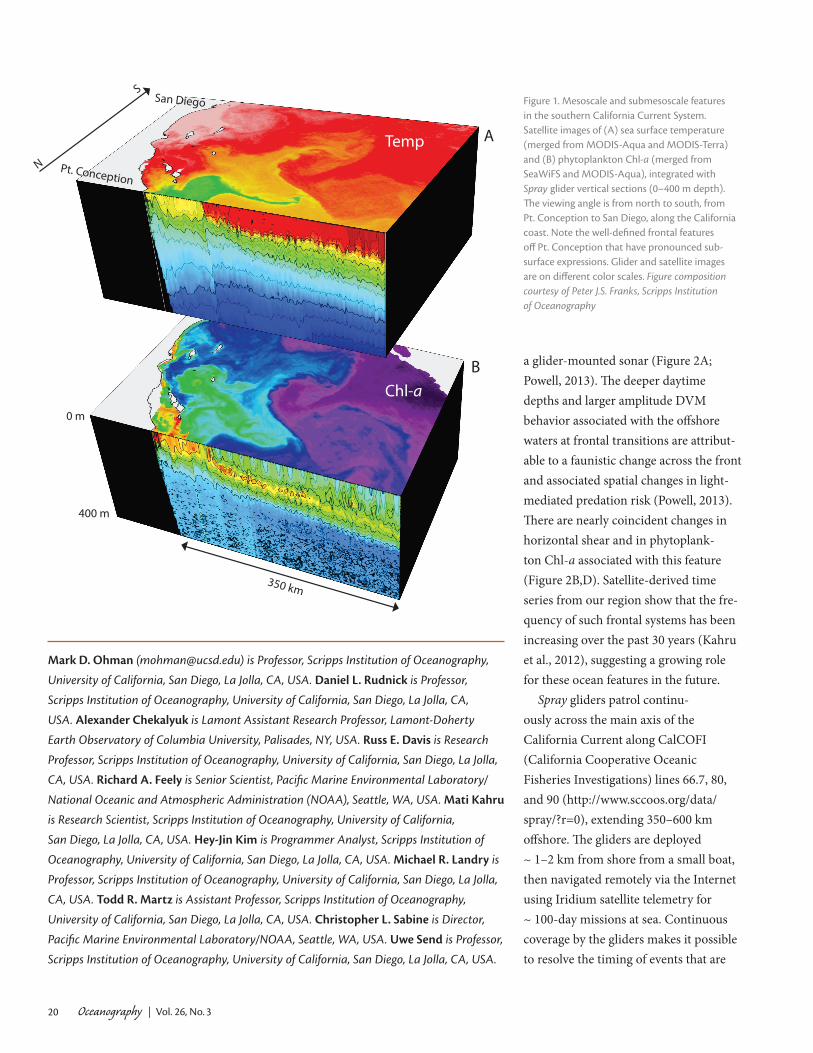
AUTONOMOUS INSTRUMENTATIONDevelopments in autonomous vehicles (Perry and Rudnick, 2003; Rudnick et%al., 2004), interdisciplinary moorings (Dickey et%al., 2009; Nam et%al., 2011), and satellite telemetry now make it pos-sible to resolve temporally transient or spatially abrupt phenomena in%situ, below the sea surface, in near-real time. Figure%1 illustrates the subsurface expression of both temperature and chlorophyll%a (Chl-a) frontal features o& Pt. Conception in the southern California Current System, as detected by Spray ocean gliders, together with the areal extent of the fronts and associ-ated coastal $laments and mesoscale eddies, as resolved by satellite sensors. More than six years of extensive Spray glider surveys at the California Current Ecosystem (CCE) Long Term Ecological Research (LTER) site have revealed sur-prising changes in the plankton biota associated with such frontal features, including a pronounced change in the diel vertical migration (DVM) behav-ior of mesozooplankton detected with
INTRODUC TION#e California Current System, like other eastern boundary current upwell-ing ecosystems, is a dynamic environ-ment forced by atmospheric and ocean changes across a spectrum of di&erent temporal and spatial scales. Particularly challenging to measure are processes that occur on the “event” scale (i.e., of limited temporal duration or restricted spatial extent), for example, individual upwelling or downwelling events, patch feeding by transient schools of $shes or migratory pods of cetaceans, ocean mix-ing events, and passage of submesoscale eddies. Such events can play a dispropor-tionately large role in regulating "uxes of nutrients or gases, aggregation of zooplankton or $shes, and export "uxes of phytoplankton, carbon, nitrogen, and other ecologically important elements. Although these phenomena potentially play a key role in the structuring of planktonic ecosystems and ocean bio-geochemistry, they are di'cult to resolve with infrequent shipboard sampling. #e important events o!en happen when we are not there.
Oceanography | Vol. 26, No. 320
a glider-mounted sonar (Figure%2A; Powell, 2013). #e deeper daytime depths and larger amplitude DVM behavior associated with the o&shore waters at frontal transitions are attribut-able to a faunistic change across the front and associated spatial changes in light-mediated predation risk (Powell, 2013). #ere are nearly coincident changes in horizontal shear and in phytoplank-ton Chl-a associated with this feature (Figure%2B,D). Satellite-derived time series from our region show that the fre-quency of such frontal systems has been increasing over the past 30 years (Kahru et%al., 2012), suggesting a growing role for these ocean features in the future.
Spray gliders patrol continu-ously across the main axis of the California Current along CalCOFI (California Cooperative Oceanic Fisheries Investigations) lines 66.7, 80, and 90 (http://www.sccoos.org/data/spray/?r=0), extending 350–600 km o&shore. #e gliders are deployed ~ 1–2 km from shore from a small boat, then navigated remotely via the Internet using Iridium satellite telemetry for ~%100-day missions at sea. Continuous coverage by the gliders makes it possible to resolve the timing of events that are
Figure"1. Mesoscale and submesoscale features in the southern California Current System. Satellite images of (A) sea surface temperature (merged from MODIS-Aqua and MODIS-Terra) and (B)"phytoplankton Chl-a (merged from SeaWiFS and MODIS-Aqua), integrated with Spray glider vertical sections (0–400"m depth). #e viewing angle is from north to south, from Pt. Conception to San Diego, along the California coast. Note the well-defined frontal features o$ Pt. Conception that have pronounced sub-surface expressions. Glider and satellite images are on di$erent color scales. Figure composition courtesy of Peter J.S. Franks, Scripps Institution of Oceanography
Mark D. Ohman ([email protected]) is Professor, Scripps Institution of Oceanography, University of California, San Diego, La Jolla, CA, USA. Daniel L. Rudnick is Professor, Scripps Institution of Oceanography, University of California, San Diego, La Jolla, CA, USA. Alexander Chekalyuk is Lamont Assistant Research Professor, Lamont-Doherty Earth Observatory of Columbia University, Palisades, NY, USA. Russ E. Davis is Research Professor, Scripps Institution of Oceanography, University of California, San Diego, La!Jolla, CA, USA. Richard A. Feely is Senior Scientist, Pacific Marine Environmental Laboratory/National Oceanic and Atmospheric Administration (NOAA), Seattle, WA, USA. Mati Kahru is Research Scientist, Scripps Institution of Oceanography, University of California, San!Diego, La Jolla, CA, USA. Hey-Jin Kim is Programmer Analyst, Scripps Institution of Oceanography, University of California, San Diego, La Jolla, CA, USA. Michael R. Landry is Professor, Scripps Institution of Oceanography, University of California, San Diego, La!Jolla, CA, USA. Todd R. Martz is Assistant Professor, Scripps Institution of Oceanography, University of California, San Diego, La Jolla, CA, USA. Christopher L. Sabine is Director, Pacific Marine Environmental Laboratory/NOAA, Seattle, WA, USA. Uwe Send is Professor, Scripps Institution of Oceanography, University of!California, San Diego, La Jolla, CA, USA.
Temp
Chl-a
Pt. Conception
San Diego
N
S
0 m
400 m
350 km
A
B

Oceanography | September 2013 21
impractical to measure from research vessels. For example, continuous glider coverage showed that the onset of the October 2009 El%Niño event in southern California was nearly synchronous with the appearance of El%Niño along the equator, suggesting that this event propa-gated to mid-latitudes initially via atmo-spheric teleconnections, not by oceanic advection (Todd et%al., 2011a).
Gliders permit continuous interroga-tion of relatively large ocean areas, but they move rather slowly (~ 25 cm s–1) and thus revisit the same location rela-tive to the sea"oor infrequently (unless directed to remain in a speci$c location). Fixed-location moorings, on the other hand, sample at high temporal frequency and for extended time periods. Moorings can also draw on substantial battery (or solar) power, considerably increasing the instrument payload. Inductive telem-etry can be used to telemeter subsurface data in real time, and vertically pro$ling moorings are now being deployed (Send et%al., 2012). Integration of mooring with glider data provides the advantages of both spatial and temporal resolution.
Figure%3A illustrates a glider-derived horizontal section of aragonite satura-tion state ((arag), based on a robust proxy relationship for (arag from dis-solved oxygen and temperature (Alin et%al., 2012). (arag is a useful geochemical index of potential dissolution of arago-nitic calcium carbonate shells of marine organisms due to ocean acidi$cation (Bednar!ek et%al., 2012). #e section shows the shoaling of the saturation horizon where (arag = 1.0 from a depth of 180–200 m in the o&shore region to 35–50 m inshore, near the upwelling zone o& Pt. Conception. #ese data, col-lected during 182 glider dives, provide
a larger-scale spatial picture of the hori-zontal and depth distribution of waters potentially corrosive to aragonite-secret-ing organisms. Mooring-based measure-ments also permit (arag to be estimated from the proxy relationship. For example, our o&shore mooring location (CCE-1, ~ 220 km o&shore) reveals relatively stable (arag that is always oversaturated, while the inshore mooring (CCE-2,
~ 35 km o& Pt. Conception) shows sev-eral episodes of undersaturation at 76%m that are associated with the upwelling of dense, high pCO2, low pH, low O2, and high nitrate waters (Figure%3B). #e moorings permit real-time measure-ment of the magnitude, frequency, and duration of undersaturation events, key variables that in"uence the responses of calcifying organisms to the stress of
0
200
400
–80
–85
–90
–95
0.2
0.0
–0.2
34.0
33.5
33.0
1.2
0.8
0.4
0
200
400
Dep
th (m
)
Distance O!shore (km)
SFU
Salin
itym
s–1dB
300 250 200 150 100 50
0
100
200
0
50
100
Figure"2. Cross-frontal changes in amplitude of zooplankton diel vertical migration, cross-track currents, and Chl-a, largely coincident with two salinity fronts. Spray glider sections from o$shore (left) to onshore (right), along CalCOFI (California Cooperative Oceanic Fisheries Investigations) line 80 o$ Pt. Conception. (A) Acoustic backscatter (dB) from a 750 kHz acoustic Doppler profiler (ADP); black line indicates median depth of samples with mean volume backscatter values above the 85th percentile for a given dive. (B) Cross-track current velocity (m s–1) from the ADP. (C) Salinity. (D) Phytoplankton Chl-a (Standardized Fluorescence Units, SFU). Depth scale varies by panel. Alternating white-gray-black-gray bars in uppermost panel indicate day-dusk-night-twilight, respectively. Figure courtesy of Jesse R. Powell, Scripps Institution of Oceanography

Oceanography | Vol. 26, No. 322
ocean acidi$cation, while gliders provide a broader spatial context. Autonomous gliders with di&erent instrumenta-tion are also being utilized in the Santa Barbara Coastal LTER site (David Siegel,
University of California, Santa Barbara, 2013, pers. comm.), the Palmer Station LTER site (Oliver et%al., 2012), and in research programs located elsewhere.
Other autonomous measurements in
the CCE LTER region include diverse satellite-based sensors (Kahru et%al., 2012). In addition, an array of shore-based high-frequency radars maps surface currents to a distance of up to 150 km from shore o& the California coast (Kim et%al., 2011). A growing fam-ily of autonomous dri!ing instruments has been deployed in recent years. #e original Argo Lagrangian "oat program included only conductivity-temperature-depth sensors (Roemmich et%al., 2009), but there are now autonomous "oats with instrumentation more relevant to ocean ecology, including a Laser Optical Particle Counter (Checkley et%al., 2008), nitrate and dissolved oxygen sensors (Johnson et%al., 2010), and optically based particulate carbon and particle "ux sen-sors (Bishop, 2009), with others in devel-opment. A major distinction between gliders and "oats is the user’s ability to control the horizontal position of gliders.
Autonomously deployed sensors require careful calibration before and a!er deployment and, preferably, inde-pendent veri$cation during a deploy-ment. Sensor dri!, degradation, and biofouling can alter instrumental responses. In the CCE LTER program, we bene$t from shipboard measure-ments made quarterly by the CalCOFI program (http://www.calco$.org). #e high-quality CalCOFI data, co-located with our mooring and glider sampling, make it possible to verify instrumental responses independently with in situ samples multiple times per year.
Integration of diverse types of sam-pling in the CCE LTER region has many bene$ts, including the complementar-ity of di&erent temporal and spatial scales resolved by di&erent devices, redundancy of measurements when
Dep
th (m
)
050100150Distance O!shore (km)
200250300350
0
50
100
150
200
250
300 0.6
0.8
1.0
1.2
1.4
1.6
1.8
2.0
2.2
A CCE-1 CCE-2
300500700
2468
0 5
101520
Apr May Jun Jul
1,025
1,026
Den
sity
(kg
m–3
)O
xyge
n(m
l L–1
)
NO
3
(µm
ol–1
)pC
O2
(µAt
m)
2012
1
2
7.8
8.0
8.2
pH
B!
arag
!ar
ag
Figure"3. Spatial and temporal variations in aragonite saturation state (%arag) along CalCOFI line 80, o$ Pt. Conception. (A) Cross-shore variations in %arag from Spray glider section (April 17–May 9, 2012). California Current Ecosystem (CCE)-1 and CCE-2 indicate the locations of two interdisciplinary moorings. White contour: %arag = 1.0. (B) Temporal variations in water column properties measured at the CCE-2 mooring (March 23–July 1, 2012). Top to bottom: pCO2 (blue = in water, red = in air), dissolved O2 (black = 16 m, orange = 76 m), pH (16 m), %arag (black = 16 m, orange = 76 m), NO3 (16 m), density (16 m). For both (A) and (B), %arag was derived from the proxy relationship in Alin et al. (2012).

Oceanography | September 2013 23
cloud cover or technical issues restrict availability of one type of sensor, and the ability to calibrate and verify sensor performance through intercomparisons. Figure%4 re"ects the present integration of our gliders, moorings, satellite remote sensing, and shipboard measurements. Satellite coverage provides larger-scale synoptic views of near-surface phenom-ena. In our application, Spray gliders provide continuous coverage to a depth of 500 m, extending 350 to 600%km o&shore. Moorings record higher tem-poral frequency phenomena, with more diverse instrumentation. In addition to our surface-expressed moorings, a parallel mooring e&ort by the Scripps Whale Acoustic Lab (http://cetus.ucsd.edu) deploys passive acoustic hydro-phones, typically at a depth of 20 m o& the bottom, to record vocalizations by whales, dolphins, and porpoises at some of the same locations as our moorings. Regular shipboard sampling by CalCOFI at speci$c stations is important, both for calibration measurements and for the more diverse array of sampling, multi-frequency acoustic surveys, and experi-mentation that is possible aboard ship. In addition, our integrated water column measurements can be related directly to processes at the deep-sea benthic study site at Station M (located due north of the CCE-1 mooring), where autonomous sediment traps and a deep-sea benthic rover record "uxes and corresponding changes in benthic communities and sediment community oxygen demand (see http://www.mbari.org/pelagic-benthic/deepsea.htm).
Glider, satellite, mooring, and CalCOFI shipboard observations help identify features of interest for experi-mental process studies. We customarily
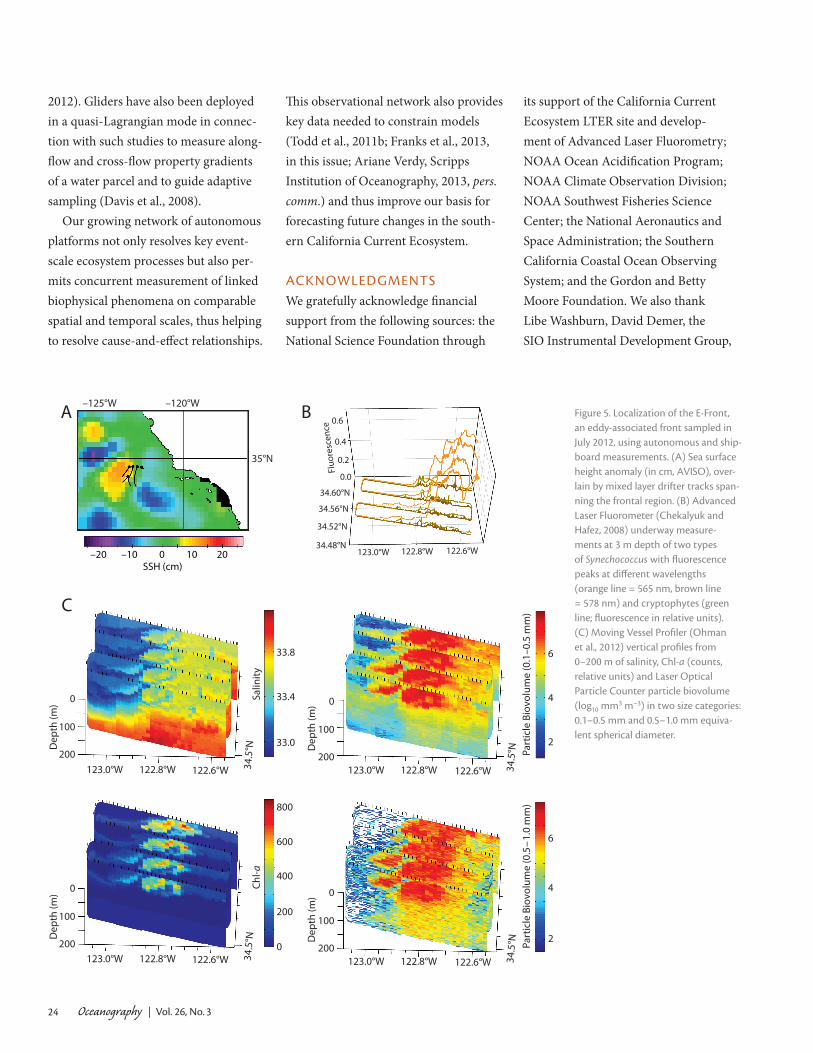
use such measurements for initial broad-scale surveys that are followed by additional $ne-scale shipboard surveys to localize speci$c features for inten-sive experimentation. For example, Figure%5A illustrates an eddy dipole that was detectable in AVISO (Archiving, Validation and Interpretation of Satellite Oceanographic Data) sea-surface height anomaly imagery, with an associated frontal region between the anticyclonic and cyclonic features. #is frontal region was then more precisely mapped using two shipboard instruments (Figure%5B,C): a free-fall Moving Vessel Pro$ler (MVP; Herman et%al., 1998; Ohman et%al., 2012) and a continuous underway Advanced Laser Fluorometer (ALF; Chekalyuk and Hafez, 2008;
Chekalyuk et%al., 2012), an imaging device that permits resolution of di&er-ent phycobiliproteins, Chl-a, other pig-ments, CDOM (chromophoric dissolved organic matter), and assessment of phytoplankton physiology (Fv /Fm). Once deployed, the MVP pro$les repeatedly from the surface to 200 m depth, mak-ing it well suited to resolving subsurface frontal gradients, while ALF continu-ously measures near-surface features from the ship’s continuous "ow intake. Having identi$ed a feature such as shown in Figure%5, it then becomes pos-sible to conduct targeted experimental studies of plankton growth, grazing, and particle export (e.g., the A-Front special issue of the Journal of Plankton Research, September 2012; Landry, Ohman et%al.,
Pt. Conception
CalCOFI line 80
PassiveAcousticRecorders
CalCOFI/CCE-LTER
CCE-1 CCE-2
Spraygliders
Salinity33.0 34.5
Chl-a
Figure"4. Schematic illustration of the integrated autonomous and shipboard measurement systems in place in the California Current Ecosystem (CCE) Long Term Ecological Research region, including satel-lite remote sensing, Spray ocean gliders, CCE-1 and CCE-2 moorings, HARP (High-frequency Acoustic Recording Package) passive acoustic moorings, and CalCOFI shipboard sampling and multifrequency sonar surveys. Due north of the CCE-1 mooring is Ken Smith’s (Monterey Bay Aquarium Research Institute) Station M deep-sea benthic study site (not shown). Surface color contours are Chl-a from SeaWifs; vertical section contours are salinity, indicating the low-salinity core of the California Current (blue).
Oceanography | Vol. 26, No. 324
2012). Gliders have also been deployed in a quasi-Lagrangian mode in connec-tion with such studies to measure along-"ow and cross-"ow property gradients of a water parcel and to guide adaptive sampling (Davis et%al., 2008).
Our growing network of autonomous platforms not only resolves key event-scale ecosystem processes but also per-mits concurrent measurement of linked biophysical phenomena on comparable spatial and temporal scales, thus helping to resolve cause-and-e&ect relationships.
#is observational network also provides key data needed to constrain models (Todd et%al., 2011b; Franks et%al., 2013, in this issue; Ariane Verdy, Scripps Institution of Oceanography, 2013, pers. comm.) and thus improve our basis for forecasting future changes in the south-ern California Current Ecosystem.
ACKNOWLEDGMENTSWe gratefully acknowledge $nancial support from the following sources: the National Science Foundation through
its support of the California Current Ecosystem LTER site and develop-ment of Advanced Laser Fluorometry; NOAA Ocean Acidi$cation Program; NOAA Climate Observation Division; NOAA Southwest Fisheries Science Center; the National Aeronautics and Space Administration; the Southern California Coastal Ocean Observing System; and the Gordon and Betty Moore Foundation. We also thank Libe Washburn, David Demer, the SIO%Instrumental Development Group,
Figure"5. Localization of the E-Front, an eddy-associated front sampled in July 2012, using autonomous and ship-board measurements. (A) Sea surface height anomaly (in cm, AVISO), over-lain by mixed layer drifter tracks span-ning the frontal region. (B) Advanced Laser Fluorometer (Chekalyuk and Hafez, 2008) underway measure-ments at 3 m depth of two types of Synechococcus with fluorescence peaks at di$erent wavelengths (orange line = 565 nm, brown line = 578 nm) and cryptophytes (green line; fluorescence in relative units). (C) Moving Vessel Profiler (Ohman et al., 2012) vertical profiles from 0–200 m of salinity, Chl-a (counts, relative units) and Laser Optical Particle Counter particle biovolume (log10 mm3 m–3) in two size categories: 0.1–0.5 mm and 0.5–1.0"mm equiva-lent spherical diameter.
0
100
200
Dep
th (m
)
0
100
200
Dep
th (m
)
Salin
ityCh
l-a
Part
icle
Bio
volu
me
(0.1
–0.5
mm
)
2
4
6
Part
icle
Bio
volu
me
(0.5
– 1.0
mm
)
2
4
6
0
200
400
600
800
33.0
33.4
33.8
C
BA
0.0
0.2
0.4
0.6
122.6°W122.8°W123.0°W34.48°N
34.52°N
34.56°N
34.60°N
Fluo
resc
ence
SSH (cm) –20 –10 0 10 20
35°N
–125°W –120°W
122.6°W 34.5
°N
122.8°W123.0°W
122.6°W 34.5
°N
122.8°W123.0°W
0
100
200
Dep
th (m
)
122.6°W 34.5
°N
122.8°W123.0°W
0
100
200
Dep
th (m
)
122.6°W 34.5
°N
122.8°W123.0°W

Oceanography | September 2013 25
SIO Timeseries Group, and CCE LTER team for their sustained e&orts. #is is PMEL contribution number 4029.
REFERENCESAlin, S.R., R.A. Feely, A. Dickson, J.M. Hernandez-
Ayon, L.W. Juranek, M.D. Ohman, and R.%Goericke. 2012. Robust empirical relation-ships for estimating the carbonate system in the southern California Current System and application to CalCOFI hydrographic cruise data (2005–2011). Journal of Geophysical Research 117, C05033, http://dx.doi.org/ 10.1029/2011JC007511.
Bednar)ek, N., G.A. Tarling, D.C.E. Bakker, S.%Fielding, E.M. Jones, H.J. Venables, P.%Ward, A. Kuzirian, B. Leze, R.A. Feely, and E.J.%Murphy. 2012. Extensive dissolution of live pteropods in the Southern Ocean. Nature Geoscience 5:881–885, http://dx.doi.org/ 10.1038/ngeo1635.
Bishop, J.K.B. 2009. Autonomous observa-tions of the ocean biological carbon pump. Oceanography 22(2):182–193, http://dx.doi.org/10.5670/oceanog.2009.48.
Checkley, D.M., Jr., R.E. Davis, A.W. Herman, G.A. Jackson, B. Beanlands, and L.A. Regier. 2008. Assessing plankton and other par-ticles in situ with the SOLOPC. Limnology and Oceanography 53:2,123–2,136, http://dx.doi.org/10.4319/lo.2008.53.5_part_2.2123.
Chekalyuk, A., and M. Hafez. 2008. Advanced laser "uorometry of natural aquatic envi-ronments. Limnology and Oceanography: Methods 6:591–609, http://dx.doi.org/10.4319/lom.2008.6.591.
Chekalyuk, A., M.R. Landry, R. Goericke, A.G.%Taylor, and M.A. Hafez. 2012. Laser "uorescence analysis of phytoplankton across a frontal zone in the California Current ecosys-tem. Journal of Plankton Research 34:761–777, http://dx.doi.org/10.1093/plankt/*s034.
Davis, R.E., M.D. Ohman, D.L. Rudnick, J.T.%Sherman, and B. Hodges. 2008. Glider surveillance of physics and biology in the southern California Current System. Limnology and Oceanography 53:2,151–2,168, http://dx.doi.org/10.4319/lo.2008.53.5_part_2.2151.
Dickey, T., N. Bates, R.H. Byrne, G. Chang, F.P.%Chavez, R.A. Feely, A.K. Hanson, D.M.%Karl, D. Manov, C. Moore, and others. 2009. #e NOPP O-SCOPE and MOSEAN projects: Advanced sensing for ocean observing systems. Oceanography 22(2):168–181, http://dx.doi.org/ 10.5670/oceanog.2009.47.
Franks, P.J.S., E. Di%Lorenzo, N.L. Goebel, F. Chenillat, P. Rivière, C.A. Edwards, and A.J. Miller. 2013. Modeling physical-biological responses to climate change
in the California Current System. Oceanography 26(3):26–33, http://dx.doi.org/ 10.5670/oceanog.2013.42.
Herman, A.W., B. Beanlands, M. Chin-Yee, A.%Furlong, J. Snow, S. Young, and T. Phillips. 1998. #e Moving Vessel Pro$ler (MVP): In-situ sampling of plankton and physical parameters at 12 kts and the integration of a new Laser Optical Plankton (LOPC) Counter. http://www.alexherman.com/pub002.php.
Johnson, K.S., S.C. Riser, and D.M. Karl. 2010. Nitrate supply from deep to near-surface waters of the North Paci$c subtropical gyre. Nature 465:1,062–1,065, http://dx.doi.org/ 10.1038/nature09170.
Kahru, M., R.M. Kudela, M. Manzano-Sarabia, and B.G. Mitchell. 2012. Trends in the surface chlo-rophyll of the California Current: Merging data from multiple ocean color satellites. Deep Sea Research Part II 77–80:89–98, http://dx.doi.org/ 10.1016/j.dsr2.2012.04.007.
Kim, S.Y., E.J. Terrill, B.D. Cornuelle, B. Jones, L. Washburn, M.A. Moline, J.D. Paduan, N.%Gar$eld, J.L. Largier, G. Crawford, and P.M. Kosro. 2011. Mapping the US West Coast surface circulation: A multiyear analysis of high-frequency radar observations. Journal of Geophysical Research: Oceans 116, C03011, http://dx.doi.org/10.1029/2010jc006669.
Landry, M.R., M.D. Ohman, R. Goericke, M.R.%Stukel, K. Barbeau, R. Bundy, and M.%Kahru. 2012. Pelagic community responses to a deep-water front in the California Current Ecosystem: Overview of the A-Front study. Journal of Plankton Research 34:739–748, http://dx.doi.org/10.1093/plankt/*s025.
Nam, S., H.J. Kim, and U. Send. 2011. Ampli$cation of hypoxic and acidic events by La Niña conditions on the continental shelf o& California. Geophysical Research Letters 38, L22602, http://dx.doi.org/ 10.1029/2011gl049549.
Ohman, M.D., J.R. Powell, M. Picheral, and D.W.%Jensen. 2012. Mesozooplankton and particulate matter responses to a deep-water frontal system in the southern California Current System. Journal of Plankton Research 34:815–827, http://dx.doi.org/ 10.1093/plankt/*s028.
Oliver, M.J., M.A. Moline, I. Robbins, W. Fraser, D. Patterson, and O. Scho$eld. 2012. Letting penguins lead: Dynamic modeling of penguin locations guides autonomous robotic sampling. Oceanography 25(3):120–121, http://dx.doi.org/ 10.5670/oceanog.2012.84.
Perry, M.J., and D.L. Rudnick. 2003. Observing the ocean with autonomous and Lagrangian platforms and sensors (ALPS): #e role of ALPS in sustained ocean observing systems. Oceanography 16(4):31–36, http://dx.doi.org/ 10.5670/oceanog.2003.06.
Powell, J.R. 2013. Ocean fronts in the southern California Current System and their role in structuring zooplankton distributions, diel vertical migration, and size composi-tion. PhD%thesis, University of California, San Diego, 190 pp.
Roemmich, D., and the Argo Steering Team. 2009. Argo: #e challenge of continuing 10 years of progress. Oceanography 22(3):46–55, http://dx.doi.org/10.5670/oceanog.2009.65.
Rudnick, D.L., R.E. Davis, C.C. Eriksen, D.M.%Fratantoni, and M.J. Perry. 2004. Underwater gliders for ocean research. Marine Technology Society Journal 38:73–84.
Send, U., G. Fowler, G. Siddall, B. Beanlands, M.%Pittman, C. Waldmann, J. Karstensen, and R. Lampitt. 2012. Seacycler: A moored open-ocean pro$ling system for the upper ocean in extended self-contained deployments. Journal of Atmospheric and Oceanic Technology, http://dx.doi.org/10.1175/JTECH-D-11-00168.1.
Todd, R.E., D.L. Rudnick, R.E. Davis, and M.D.%Ohman. 2011a. Underwater gliders reveal rapid arrival of El%Niño e&ects o& California’s coast. Geophysical Research Letters 38, L03609, http://dx.doi.org/10.1029/2010GL046376.
Todd, R.E., D.L. Rudnick, M.R. Mazlo&, R.E. Davis, and B.D. Cornuelle. 2011b. Poleward "ows in the southern California Current System: Glider observations and numerical simulation. Journal of Geophysical Research: Oceans 116, C02026, http://dx.doi.org/10.1029/2010JC006536.