a user-flocksourced bus intelligence system for dhaka
DESCRIPTION
By Albert Ching, MIT 2012 Master of City Planning ThesisTRANSCRIPT

A USER-FLOCKSOURCED BUS INTELLIGENCE SYSTEM FOR DHAKA
byAlbert M. L. Ching
B.A. in EconomicsHarvard University, 2003
Submitted to the Department of Urban Studies and Planningon September 2012 in Partial Fulfillment of the Requirements
for the Degree of Master in City Planning
© 2012 Massachusetts Institute of Technology.
All rights reserved.
The author here by grants to MIT the permission to reproduce and to distribute publiclypaper and electronic copies of the thesis document in whole or in part.
! ! ! ! ! !! ! ! ! ! !
! ! ! ! ! !! ! ! ! ! Author
Department of Urban Studies and Planning, MIT
August 9, 2012
Certified by
Associate Professor Christopher Zegras Department of Urban Studies and Planning, MIT
Thesis Advisor
Accepted by
Professor Alan BergerDepartment of Urban Studies and Planning, MIT
MCP Committee Chair
1

A User-Flocksourced Bus Intelligence System in Dhaka!
the first
the world ----------
---
by Albert M. L. Ching
Abstract
Flocksourcing, or guided crowdsourcing, is an experimental data collection technique where users
become the sensors to generate a large amount of information that improves a public service like
public transport. In an ideal world, users would self-organize to collect data that would improve
their own experience—but in a place like Dhaka, the megacapital of Bangladesh, the technology that enables users to become sensors is not (yet) widely available.
In this thesis, we attempt to test the viability of flocksourcing by co-developing and seeding those
technologies with a local resident-led flock who targeted a segment of the largely owner-operated
bus system in Dhaka. The results from a flock of eight’s weeklong data collection efforts
demonstrated that flocksourcing can be a viable data collection technique for generating big
amounts of data even in some of the most challenging urban environments. While the
demonstration helps lay the groundwork showing that the technique can be used, questions still
remain on whether and how it will be used in a truly sustainable way.
Thesis Advisor Christopher Zegras Associate Professor of Transportation Planning Department of Urban Studies & Planning, MIT
Thesis Reader Eran Ben-Joseph Professor of Landscape Architecture Department of Urban Studies & Planning, MIT
2

Table of Contents
Foreword! ! ! ! ! ! ! 4 Acknowledgements 5
CONTEXT
Motorization and the Mobile Opportunity ! 6Motorization and the Iron LawThe mobile-driven mobility intelligence opportunityLandscape of mobiles + mobility mash-ups in developing Asia
PROBLEM
Dhaka Has No Bus Map 23Buses in DhakaCurrent bus data collection methodsThe bus crowdsourcing dilemma
EXPERIMENT
The Flocksourcing Experiment 39Introducing FleetsourcingIntroducing FlocksourcingResearch questionResearch method
RESULTS
A Thousand Riders Surveyed in One Week 50Flocksourcing workflowTechnical feasibilityAppropriate designA thousand riders surveyed
CONCLUSION
Dhaka Will (Soon) Have a Bus Map 71Menu of possibilities
Appendix 74Works Cited 76
! !
3
1
2
3
4
Foreword
The future of cities is no longer held in one big plan but in a thousand little, measured strokes.
The following thesis was written with the intention of advancing the idea
of low-cost smart cities for everyone. New technological breakthroughs
that have enabled relatively cheap and precise measurement may be
actuating a more performance-based, more responsive, and more
iterative approach for managing cities. This possibility could not have
come at a better time with increased pressure on our shared urban
resources—roadspace, energy, water, and happiness—especially in places
that have trouble keeping the city lights on.
Most research on smart cities focuses on innovations that further
improve the capacity of already fairly smart cities like Singapore and
Stockholm. Often times, those innovations do not transfer well to places
like Dhaka and Jakarta, where institutional capacities and the ability to
invest in new infostructures make them difficult to implement.
We do believe that while many of these recent technologies were
developed for more advanced contexts, they can be appropriately adapted for low-cost cities with the collaboration and shared intention of
local stakeholders. In some ways, data and information powered by the
mobile device, which can be retrofit on top of even the worst physical
infrastructures, may offer hope for a rapidly improving future for these
cities, and for our collective future on this shared planet.
The first step is to bring science and visibility to the idea that these
adaptations—like flocksourcing big bus data in Dhaka—can be
technologically viable and socially sustainable. The next step is to inspire
a generation of city mayors, innovators, planners, technologists,
designers, and citizens to push forward these possibilities.
Albert Ching, Stephen Kennedy & Muntasir Mamun
Co-founders of the Urban Launchpad
4

Acknowledgments
First and foremost, I would like to thank my partners in this flocksourcing experiment. Stephen, thanks for taking a leap of faith and agreeing to check reason at the door and collaborate with me on this project. I’m not sure I would have made it without the rickshaw rides, the weekly spinning, and the trips to Flour and Coast Cafe. Muntasir, I know you only have 10 more years to live so partnering with us was a huge sacrifice on your part. I hope that you learned as much from us as we have from you and that we can continue this partnership for at least the next 10 years. Kewkradong team, thanks for introducing us to BFC, the best chai stands in Dhaka, and for the many repeated times you saved our lives crossing the road—you are like my brothers. To the first class of pilot flocksourcers, I can’t imagine what your week in the field was like on buses for up to 33 hours but the results were astounding in large part due to your effort and dedication.
Understanding how this flocksourcing experiment fits into the other efforts taking place to promote sustainable transport around the world was more complicated than I ever imagined and I’m grateful to my mentors who guided me through this process. Thanks Chris for your patient guidance, deep expertise, and gentle permission to let me run with perhaps some of the more experimental ideas that a grad student has ever proposed to his advisor. This work would not be possible without you. Paul and Zia, thanks for your expertise on sustainable transport in Asia as well as your words of encouragement. Eran, thanks for your constant source of advice on planning and on life. A special thanks to Hal for empowering me through his mobile app development platform, MIT App Inventor.
Navdeep, Ravee, Anthony, Hooi Ling, Sundar, Nadiem, Murali and others, thanks for taking me into your confidence and sharing your inspirational examples of entrepreneurship in this new mobility space. It has inspired me to want to do the same. To Mom and Dad, thanks for giving birth to me and raising me in Hawaii, perhaps your two best decisions ever. Hope I am making you proud. Marlene and Michael, thanks for your future support as I attempt to continue to pursue these less than lucrative endeavors. Jeremy, Kaylie, and my future nieces, nephews and children, this work is dedicated to allowing you to see polar bears in your lifetime. To Stephanie, thanks for making my life funnier and fuller than I could ever imagine.
More than anything I’ve learned over the past two years is to brazenly commit myself to doing what I love. Most of that credit goes to the most amazing and supportive community that I may ever be a part of—yes, that’s you, DUSP. A special thanks to Panamania, Puerto Rico and the Bronx Practicum class for not letting me take myself too seriously, showing me what sharing means and what a team can truly accomplish.
This research could not have been made possible without the generous support of the Singapore-MIT Alliance for Research and Technology (SMART) and the Future of Urban Mobility project.
5

CONTEXT
1
Motorization and the Mobile Opportunity Motorization and the Iron Law
The mobile-driven mobility intelligence opportunityLandscape of mobiles + mobility mash-ups in developing Asia
6

Dhaka
15-18 million people 100,000 cars
<1% vehicles per 100 ppl
Figure 1.1 | Evening traffic in Dhaka featuring dedicated rickshaw lane on the right (Source: Unknown)
What do we predict will happen to Dhaka if nothing is done?
Jakarta
9 million people 9 million motorbikes
3 million cars >100% vehicles per 100 ppl
Figure 1.2 | 4 pm traffic in Jakarta with Transjakarta dedicated BRT bus lane on the left (Source: Author’s fieldwork, August 2011)
7
Motorization and the Iron Law
Today, there are 800 million cars on the road. By 2050, there is expected to be 2-4
billion additional cars, most of them in Asia, particularly India and China (Ford 2011). In
Delhi, projections indicate a 500% increase in vehicles by 2030 compared to 1990 levels
(Hickman and Bannister 2011). Motorization in Beijing has been growing rapidly,
increasing from 3 million to 4 million cars in 31 months between 2008 and 2010,
compared to the 12 years it took Tokyo to do the same (CPPCC 2010).
The laundry list of problems associated with motorization, aside from the highly visible
congestion, are well-known, from health to equity to climate change. On a local level, air
pollution (ADB 2003) and road fatalities have increased to dangerous levels over the last
few decades in Asian cities. These consequences disproportionately impact the urban
poor, who also experience declining levels of service in alternative modes like buses as
more consumers shift to private modes. Globally, the issue may be more alarming as the
transport sector already accounts for approximately 20% of global greenhouse gas
emissions and by most forecasts, will be the most rapidly growing anthropogenic, or human-made, source of emissions in the future (e.g., Timilsina and Shrestha, 2009).
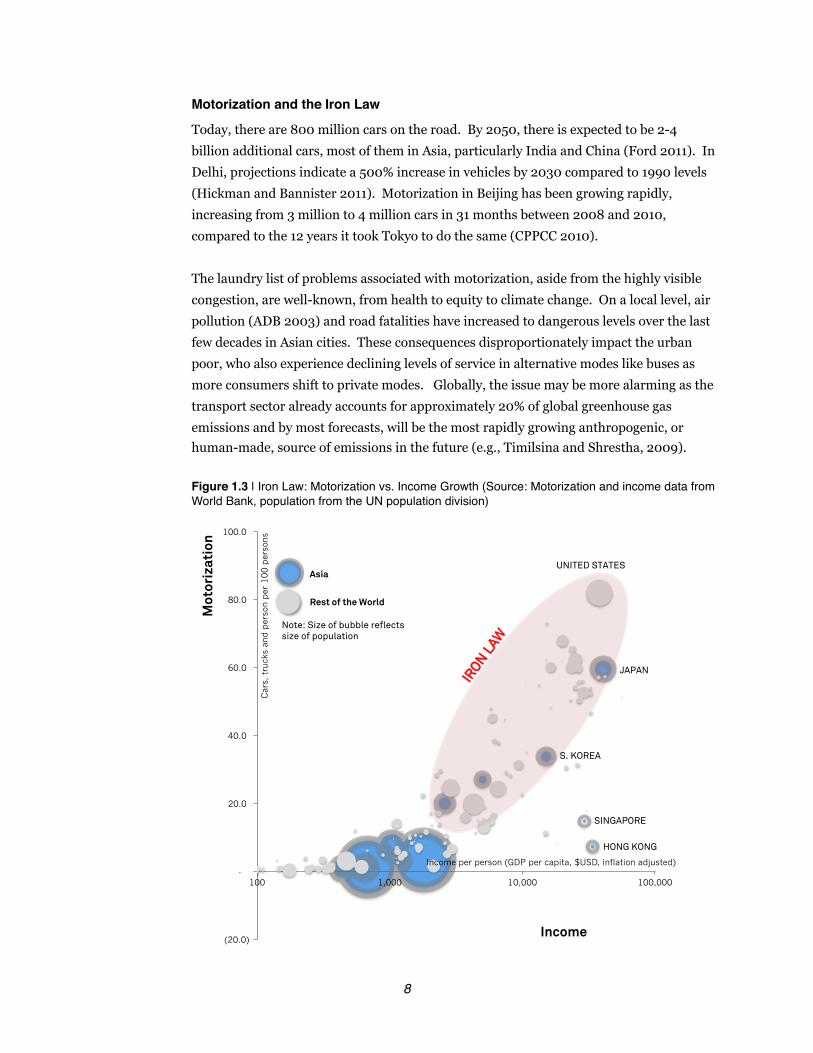
Figure 1.3 | Iron Law: Motorization vs. Income Growth (Source: Motorization and income data from World Bank, population from the UN population division)
(20.0)
-
20.0
40.0
60.0
80.0
100.0
100 1,000 10,000 100,000
Car
s, t
ruck
s an
d p
erso
n p
er 1
00 p
erso
ns
Income per person (GDP per capita, $USD, inflation adjusted)
Income
Mot
oriz
atio
n
Asia
Rest of the World
Note: Size of bubble reflects size of population
JAPAN
S. KOREA
SINGAPORE
HONG KONG
IRON L
AW
UNITED STATES
8

As Figure 1.3 illustrates, the reason motorization in Asia seems inevitable is based upon a
historically strong correlation between motorization and income growth (Galkenheimer
1999; Dargay 2001), referred to as an “Iron Law” by Zhao (2012). As income grows so
does the number of cars and two-wheelers per capita.
Figure 1.4 | Iron Law, Motorization, and “Lock-In” (Source: Motorization and income data from World Bank, population from the UN population division; Sandra and Archaya (2007); Barter (2004))
(20.0)
-
20.0
40.0
60.0
80.0
100.0
100 1,000 10,000 100,000
Car
s, t
ruck
s an
d p
erso
n p
er 1
00 p
erso
ns
Income per person (GDP per capita, $USD, inflation adjusted)
Income
Mot
oriz
atio
n
Asia
Rest of the World
Note: Size of bubble reflects size of population
JAPAN
S. KOREA
SINGAPORE
HONG KONG
IRON L
AW
UNITED STATES
Barter (2004) “lock-in” line of 10-20 cars per 100 people!
Sand
ra a
nd A
rcha
ya (2
007)
mot
oriz
atio
n in
flect
ion
of $
5,00
0 pe
r cap
ita G
DP!
Of note in this relationship are a couple of important inflection points, one where car
ownership takes off, and another where a city becomes “locked-into” cars, a state that has
proven difficult to unwind in the West. Archaya & Morichi (2007) suggest that car
ownership takes off at an income level of $5,000 per capita and Paul Barter (2004)
estimates that “lock-in” may occur around 10-20 cars per 100 people.
9

Figure 1.5 | Iron Law, Motorization, “Lock-In”, and Developing Asia (Source: Motorization and income data from World Bank, population from the UN population division; Sandra and Archaya (2007); Barter (2004))
INDIA ($700,
1.2 per 100, 1.3 billion) (20.0)
-
20.0
40.0
60.0
80.0
100.0
100 1,000 10,000 100,000
Car
s, t
ruck
s an
d p
erso
n p
er 1
00 p
erso
ns
Income per person (GDP per capita, $USD, inflation adjusted)
Income
Mot
oriz
atio
n Asia
Note: Size of bubble reflects size of population
INDONESIA ($1,000,
7.6 per 100, 245 million)
JAPAN
S. KOREA
SINGAPORE
HONG KONG
UNITED STATES
Barter (2004) “lock-in” line of 10-20 cars per 100 people
San
dra
and
Arc
haya
(200
7) m
otor
izat
ion
infl
ecti
on o
f $5,
000
per
capi
ta G
DP
BANGLADESH ($440,
0.9 per 100, 160 million)
CHINA ($1800,
3.2 per 100, 1.4 billion)
Based on the latest statistics available, most developing countries in Asia—China, India,
Indonesia, Bangladesh—seem to reside below those points as Figure 1.5 illustrates.
However, visit any of the major urban areas in those same countries—Beijing, Bangalore,
and Jakarta—and it is difficult to find one that is not “traffic saturated” (Barter 2004), if
not on the path to be “locked-in” to cars. Due to high densities, traffic saturated cities
may encourage the proliferation of motorcycles and two-wheelers (not shown on the
preceding charts) which play a significant role for users trying to avoid congestion in
cities like Jakarta and Hanoi, where the percentage of trips taken by motorcycle
(including bicycles) is as high as 93% (JICA 1997).
Bangladesh and Dhaka, the context for this thesis, are early enough on their development
path where the motorization inflection point and auto lock-in have not been hit.
10

Part of the reason why the impending motorization seems inevitable is rational, given the
health effects of taking alternative modes where air pollution and traffic accidents are
constant concerns. Private cars are a much better user experience—more convenient,
relatively faster, and more reliable—than the often hot, sweaty and crowded alternatives.
The other reason, which is perhaps more important, is aspirational.
Figure 1.6 | Car Ownership Aspiration Index (Source: Nielson 2005)
As Figure 1.6 depicts, car ownership aspirations are high in key countries in developing
Asia ahead of their ability to afford owning a car. Cars have symbolic value in many of
these countries associated with the transition to a “modern middle class” (Vasconcellos
1997). Wu et al (1999) explains that car ownership has both a utilitarian and symbolic
utility, with the latter being particularly important in the early stages of motorization,
where most of these countries in developing Asia find themselves. That symbolic utility
has been, in part, cultivated by auto manufacturers, who spent $23 billion in 2011 to fuel
the ownership aspiration (Borrell Associates 2011).
11

Figure 1.7 | Strategies for Managing Motorization (Source: Compiled by author from primary and ! ! secondary research and GIZ guides on sustainable transport)
Manage private motorization!
Improve mobility of the ‘car and 2-wheeler-less’!
Invest in new public/shared transport
assets & infrastructure!
2!
(+) BRT!(+) Metro!(+) Pedestrian, bicycle, and cycle rickshaw lanes!!!
Make private vehicles! more costly to own
and drive!
Make private vehicles less attractive to own
and drive!
(+) Vehicle taxes!(+) Congestion pricing (+) Fuel taxes!(+) Parking fees!!(-) Domestic car industry (-) Income growth!
(+) Compact land use (+) Car pool lanes!(+) Congestion*!(+) Difficult driving conditions * (+) Vehicle theft*! (-) Road construction!(-) Car commercials and billboards!
1!
Improve Auto-Substitutes
Restrict Car Use
Cities in developing Asia, already plagued with increasing congestion, have tried an
assorted menu of strategies for managing this motorization. Those strategies fall into two
categories: efforts to curtail motorization itself (restraints on private motor vehicle
ownership) and those to curtail private motorized traffic (restraints on private motor
vehicle use). Naturally, the latter might act indirectly on the former, reducing the
utilitarian convenience of private motor vehicle use but maintain the symbolic value of
ownership, which has more to do with peer and culturally driven consumer and social
desires.
Singapore, well-known for its long-time use of road pricing measures and vehicle taxation
and ownership quota schemes (e.g., Willoughby 2000), likely represents the extreme on
the end of restricting car use. Barter (2004) suggests that Singapore, many Japanese
cities, Hong Kong, and even Seoul until the 1980s, intervened at early stage motorization
to slow their motorization trajectories via a range of taxation and other policy schemes
(not necessarily for the same public policy purposes), which have enabled those places to
maintain a strong public transport role with a legacy of transit-oriented urban structures
and well-functioning public transport services.
Arguably on the other end of the extreme rests much of the rest of rapidly urbanizing
Asia, epitomized according to Barter (2004) by places like Bangkok, Kuala Lumpur and
12

Taipei, where un-curtailed motorization reached relatively high levels before efforts to
implement “modern” public transport were realized. While a few rapidly developing
cities, most notably Shanghai and more recently Beijing, have adopted policies – vehicle
ownership auctions and quotas, respectively – to reduce the rate of growth of the private
car fleet, such approaches have been more the exception in almost all of developing Asia.
A common policy reaction to motorization is to increase the supply of roadways, which may decrease congestion in the short term. At the same time, however, these moves tend
to encourage longer-term motorization patterns through several inter-related
mechanisms. Most basically, expanding roadway capacity improves driving conditions
thereby inducing traffic in the short-term (trips from other modes, times of day, routes,
etc.) and shifting demand in the longer run, as the city and its transportation system
become more automobile oriented. Simultaneously, improving private motor vehicle
flow via expanded capacity tends to create short and long-term effects that make other
modes less desirable. In the short term, for example, because they may take up space
previously used for non-motorized modes while increasing non-motorized modes’
exposure to safety and pollution hazards; in the longer-term, the automobile-oriented
built environment (wide roads, long blocks, longer distances, etc.) further disadvantages
alternatives to the private motorized modes. Borrowing Barter’s (2004) terminology, the
automobile-oriented response to traffic saturation (road investments and auto-oriented
suburbanization) leads to automobile-dependent cities; restraining vehicle ownership
and use and investing heavily in transit-oriented alternatives can create an alternative.
Most large and rapidly developing Asian cities have yet to become “locked in” to
automobile dependence, yet are quickly approaching the point where their response to
traffic saturation may put them firmly on the auto-dependent path. As Barter (2004)
suggests, avoiding auto-dependent entrenchment now is likely easier than attempting to
reverse it later.
Nonetheless, restricting car ownership and use nearly anywhere remains a difficult
proposition on a political and institutional capacity level. Few Asian cities have been
willing or able to replicate Singapore’s approach, for example. Despite an apparent basic
political logic favoring non-automotive solutions (since automobile ownership and use
remain a privilege of the minority in most places), policies and investments tend to
heavily favor automobile infrastructure (for a good description of reasons for this in the
developing city context, see Vasconcellos, 2001) – influenced, not trivially, by images of
“modernization,” large industrial and financial players (national and international), trade
and economic policies, etc. The automobile represents a development paradox – on the
one hand it symbolizes “freedom” and, in theory, offers individual comfort, convenient,
privacy, speed, etc. On the other hand, and in aggregate, it poses a challenge with respect
to a host of well-documented urban ills – contributing to traffic safety problems, local air
13

pollution problems, and equity concerns (e.g. Pucher etal 2006; Bose and Sperling, 2003;
Vasconcellos, 2001).
At the global scale, motorization also presents a development dilemma. Increased
income growth and the subsequent rise in private vehicle ownership in the developing
world is certainly an important force leading to the transportation sector being the
highest forecast source of greenhouse gas emissions (e.g., Timilsina and Shrestha, 2009); however, the developing world lags well behind the industrial world in “responsibility” for
the higher concentrations in greenhouse gases in the atmosphere since dawn of the
industrial age. Expecting aspiring Asian urbanites to sacrifice the car in the name of
climate change risk – even if Asian cities such as Dhaka may be among the most adversely
affected by global climate change – will no doubt inspire skepticism. To restrict car use is
to restrict freedom, something that may be the antithesis of development and difficult to
sell to the auto-aspiring class of voters. More important, however, may be a government’s
capacity to implement complex measures such as congestion pricing, deterrent parking
fees, and controlled land use—especially when even basic maintenance of existing
transport services is difficult.
The more politically attractive option to restricting car ownership and use, then, is to
attempt to improve automobile substitutes. Again, “hardware”-focused solutions tend to
predominate here as well – from the large urban rail investments in places like Kuala
Lumpur and Bangkok, to the more recent bus rapid transit (BRT) “revolution,” with large
systems developed early this century in places like Jakarta and Kunming. While
improved public transportation is helpful, likely fundamental, to rapidly developing Asian
cities, hardware alone will simply not suffice. As Hickman et al (2011) suggest, “urban
transport in Asia is in crisis.” No single silver bullet will resolve this crisis. Solutions must
effectively aim at managing mobility, improving conditions for the still vastly non-
motorized residents of developing Asia by embracing an integrated approach, focusing on
both the hardware of new infrastructures, but also the “software” of system management. Towards this end, many rapidly growing Asian cities are arriving at the critical historical
juncture where they can choose, or not, a path of automobile dependency, with a new tool
at hand: the mobile phone.
14

The mobile-driven mobility intelligence opportunity
Can owning a cell phone replace the desire to own a car?
Figure 1.8 | Mobile-empowered rickshaw wallah in India with Airtel, a leading mobile phone service provider’s billboard in the background (Source: Reuters 2009)
Figure 1.9 | Mobile penetration and motorization rates across Asia (Source: Motorization data from World Bank, mobile penetration data from various sources compiled by Wikipedia)
59.5 !
33.8 ! 27.0 ! 20.0 ! 14.9 ! 7.6 ! 7.2 ! 3.2 ! 3.2 ! 1.2 ! 1.1 ! 0.9 !
95.1 ! 108.1 ! 106.0 ! 105.0 !
143.5 !
105.3 !
187.9 !
75.3 ! 91.5 !
75.4 ! 66.5 !
58.5 !
Japan!
South Korea!
Malays
ia!
Thailan
d!
Singapore!
Indonesia!
Hong Kong!
China!
Philippines
!India!
Pakist
an!
Banglad
esh!
66x!
Ratio!
60x!63x!
Mob
iles
per 1
00!
Cars
per
100!
15

The last two decades have witnessed a boom in what today is known as Intelligent
Transportation Systems (ITS). ITS has tended to focus on applying new information
technologies to “traditional” transportation functions, such as traffic light
synchronization, toll road and public transportation operations, and commercial fleet
tracking. The increasing sophistication and ubiquity of a range of different consumer-
oriented mobile devices, however, may fundamentally change ITS as they introduce new
information sources and communication paradigms into transportation planning and operations, including distributed mobile sensor networks, direct citizen engagement, and
means for broadly and quickly distributing close-to-real-time information (e.g. on city
events).
The mobile phone epitomizes these developments. What was originally “only” a
untethered telephone today is a computer, sensor, camera, GPS device, personal planner
and more. At one end are the most basic phones which are still equipped with voice and
text capabilities that can potentially tap into a network of knowledge from market prices
for fish to emergency alerts for natural disasters. On the other end are what are
commonly referred to as smartphones which add not just data and Internet connectivity
but also a host of applications and sensors from GPS to high resolution cameras. Perhaps
as powerful as low-end computers if not more useful, smartphones and their larger
screened cousins, the tablet, may replace laptops and PCs for large portions of the
developing world population, especially in countries where penetration of personal
computers is not high.
In more affluent, highly-connected places like Hong Kong and Singapore, mobile phones
outnumber people (see Figure 1.9) and in Singapore, 62% of the population already owns
a smartphone (Our Mobile Planet 2011). In less motorized countries like Bangladesh,
Pakistan and India, mobile phones have grown to become an astounding 60x more ubiquitous than motorized vehicles in just a few years.
In the context of sustainable transport, mobile phones may play a significant functional
role. Mobile phones are conduits for both receiving and creating valuable urban
information. With some adaptation and innovation, that layer of information can be
retrofitted on top of any infrastructure, hard or soft, in good condition or bad, from roads
to social networks. Recent observations suggest that that intelligence layer, sometimes
referred to as an infostructure, can potentially help make the other urban infrastructures
more efficient (Operators more effectively managing fleets of shared vehicles) and more
responsive (Regulators more quickly adjusting policy based on changing conditions),
while also making users happier (Users with more access to transport infrastructures
around them). Instead of owning a car, a mobile phone can enable a user to better access
shared transport from booking a taxi to finding bus routes.
16

Like the automobile, the mobile phone has both utilitarian and symbolic utility. The
symbolic utility of mobile phones in developing countries does not yet seem to be
rigorously researched but indications are that the symbolic value of the mobile phone
may be as significant as its functional role, especially in places bound by rigid social and
knowledge hierarchies.
Saachin Pilot, the youthful minister of information and technology in India, observed at
the 2011 mBillionth South Asian mobile empowerment awards held in Delhi:
India is an ancient society. For many years, only few people had knowledge. It was blood by chance. The mobile phone is a godsend . . . [and] information can break the stranglehold of the
ovarian lottery sealed in India’s old hierarchies and shackles.
Figure 1.10 | Mobile phones and its uses for sustainable transport
Marketing!1! (Real-Time)
Operator Services!
3!
Users!
Information can improve
accessibility to, comfort and safety of shared vehicles!
Information can help monitor and evaluate city
performance in a more precise and timely manner
than ever before!
Regulators!Operators!
Information can improve efficiency, management
and profitability of shared fleets!
Cars = aspiration!---!
(Real-Time)User Services!
2!Responsive
City Planning!
4!
The mobile phone’s dual functional and symbolic value may enable it to play four key
roles in support of sustainable transport:
(1) Marketing sustainable transport as a more convenient, environmentally-
friendly, modern, and simply better alternative to cars and two-wheelers,
(2) Providing users with real-time, or almost real-time information that can
improve accessibility to and potentially comfort and safety of shared vehicles,
(3) Providing operators with real-time, or almost real-time information that can
improve efficiency and potentially profitability of shared fleets
(4) Enable city governments to better monitor and evaluate ongoing and future
initiatives in a more precise and timely manner than before
17

Landscape of mobiles + mobility mash-ups in developing Asia
While the hardware is available, are mobile + mobility mash-ups (combinations) happening on their own within developing Asia? On what modes? Are current experiments sustainable and scalable?
Guided by these questions, I spent three months traveling to 11 cities in South and
Southeast Asia in the summer of 2011. Those cities included the more developed, transit-
oriented cities such as Singapore, Hong Kong, and Mumbai, what Barter (2004) calls the traffic-saturated but perhaps not yet automobile “locked-in” cities of Bangkok, Kuala
Lumpur, Jakarta, and Bengalaru, and unmotorized cities, such as Dhaka, the cycle
rickshaw capital of the world, and Fazilka, a car-free town in northern Punjab, India.
Most of the visits were arranged to meet entrepreneurs that had combined the mobile
phone with mobility in a creative way (Fazilka, Jakarta, Bengalaru) which I found online
and through the Sustrans mailing list, an email forum for sustainable transport
enthusiasts in Asia. For other locations (Dhaka, Bangkok), I did not have a mash-up
identified before my visit.
The innovations I found were creative, resourceful and often humorous especially for the
Western observer. Some of the more notables ones are depicted in Figures 1.11-1.14
Marketing
Figure 1.11 | QR-coded rickshaws in Patiala (Author’s fieldwork, July 2011)
Marketing!1!
Ravee Aahluwalia, the coordinator for Patiala’s implementation of the Dial-a-Rickshaw service in Punjab, India, placed QR-codes, or three-dimensional barcodes that can be
read by most smartphones, on rickshaws to help identify their owner, and transform an
18

old transit mode into one that was modern. The mayor could not stop scanning the
codes.
(Real-time) user services
Figure 1.12 | Dial-a-rickshaw in Fazilka (Author’s fieldwork, July 2011)
(Real-Time)User Services"
2!
Navdeep Asija launched Fazilka Eco-cabs, the world’s first dial-a-rickshaw service, to
provide a safe and reliable way for his mother to get to the market. Instead of hailing a
cycle rickshaw on the street, users can call a call center usually manned by the chai wallah
who sends the next available rickshaw to the user’s location. In addition to the dial-up-
service, the Fazilka start-up has pioneered other innovations from fixed fares and lighter
rickshaws to health insurance for the rickshaw drivers.
Figure 1.13 | On-demand ojeks, or motorcycle taxis in Jakarta (Author’s fieldwork, August 2011)
(Real-Time) User Services"
2!
19

Nadiem Makarim started Go-Jek, an on-demand motorcycle taxi service that can
help users more quickly and reliably navigate the traffic-clogged streets of Jakarta than
by taking a regular taxi. An ojek, or motorcycle taxi, can be booked by calling or sending
an SMS. In return, an SMS confirmation is sent with a detailed description of fare,
expected wait time and driver name. In addition, the service has produced economics of
scope. A popular and unexpected use of the service is for commercial deliveries especially
wedding invitations, which are traditionally hand-delivered rather than mailed.
(Real-time) operator services
Figure 1.14 | Fleet management systems from (left) analog taxi paper logs in Kuala Lumpur to (right) digital vehicle tracking in Dhaka (Author’s fieldwork, July/August 2011)
(Real-Time) Operator Services!
3!
Anthony Tan and Hooi Ling Tan created MyTeksi, an on-demand platform for taxi
operators in Kuala Lumpur to reduce the unsafe conditions for women in taxis. To do so,
they built a smartphone-based platform for tracking a taxi fleet, replacing the largely
paper-based system that is in use today. These fleet management technologies have been
also pioneered in Dhaka by Arup Chakti and his team at NITS, who designed custom
hardware to track delivery trucks which were often stolen for their prized cargo.
20

Figure 1.15 | Mobile-driven innovations by transport modes in select cities in developing Asia! ! (Compiled from author’s fieldwork, July/August 2011)
More Sustainable!Less Sustainable!
Navigation!Congestion
Tracking!Vehicle-Security!
!
On-DemandSafety Alerts!
On-Demand!Fare-Tracking!
On-Demand! Real Time!Arrival Info!
Real Time!Arrival Info!Bus Delays!
On-Demand! Bicycle Sharing!
Singapore!
Jakarta!
Delhi Bangalore!
Fazilka!
Kuala Lumpur!
Bangkok!
Dhaka!
Legend! Current innovation! No innovation observed! No transport mode! Proposed experiment!
Together, the efforts of these entrepreneurs and others in the region formed a
constellation of recent innovations (almost all less than two years old) taking place
without government subsidies or support. The regional scan of examples revealed several
apparent patterns. First, most centered around more profitable but less environmentally
friendly modes of cars and auto-taxis. Rarer were efforts focused on improving public
transit, and buses in particular. In addition, since the cost of learning how to set up and
integrate these technologies is non-trivial, there appeared to be more related endeavors in
cities with larger agglomerations of technical expertise, like Bengalaru, a global hub for
technology development. Fewer innovations appeared in less affluent cities, like Dhaka, a city known more as a hub of global clothing manufacturing than software development.
Deploying the related technologies across contexts (even different cities in the same
country) was not common due to the very localized, customized purpose of the original
technology. Cross-context collaborations of the innovations, even when similar, was not
witnessed. Finally, irrespective of place, the financial sustainability of the various
endeavors remains unclear. Most of these initiatives were somewhat new, and typically
powered by the determination of the founders more than by the motive of profit.
21

Rather than focus on the how or why of these innovation ecosystems, I aimed to
understand how implementation of mobile and mobility mashups could be accelerated
and, in particular, focused on the public transport side, especially “traditional” public
transport like buses. Was the most effective strategy to support existing and aspiring
entrepreneurs through financing, through technology, or through marketing their
successes globally? Could an outside research team with some access to technical
expertise seed technology with a local partner in a place that would otherwise take at least a few years to germinate on its own?
It was based on this preliminary field research that we decided to focus on smartphone-
based technology that could improve Dhaka’s heavily used but highly chaotic bus system,
in hopes that it could both spark innovation on other sustainable modes in Dhaka and on
buses throughout the region.
22

PROBLEM
2
Dhaka has No Bus Map Buses in Dhaka
Current bus data collection methodsThe bus crowdsourcing dilemma
23

Figure 2.1 | Extreme crowding on buses in Dhaka during annual Itjema pilgrimage, the second largest gathering of Muslims next to the Hajj (Source: Author’s fieldwork, January 2012)
Figure 2.2 | Typical evening rush hour traffic on Mirpur Road in Dhaka (Source: Author’s fieldwork, January 2012)
24

Figure 2.3 | Inside a mini-bus on the outskirts of Dhaka (Source: Author’s fieldwork, January 2012)
Figure 2.4 | Less crowding = more women on Falgun bus to Uttara (Source: Author’s fieldwork, January 2012)
25

Buses in Dhaka
Dhaka has one of the largest captive bus riderships in the world but few promises of improving what is at best a convenient but crowded and disorienting user experience. Can information help?
Dhaka is the fastest growing city in the world, with a population that has increased four-
fold in the past 25 years from 4 million in 1980 to an estimated 15-18 million today
(United Nations 2003). More pressingly, the population is expected to grow to 22-25
million by 2020 (World Bank 2005, City Mayor Statistics 2012), which would rank Dhaka
as the fourth largest urban area in the world. This somewhat aggressive population
forecast is plausible, due to Dhaka’s role as the economic and political capital of
Bangladesh and consequently, one of the best protected areas to flooding in one of the
most densely-populated, lowest lying countries in the world. One hundred and sixty
million people live in a floodplain the size of Wisconsin, consistently named as one of, if not the most vulnerable places in the world to climate change.
The combination of high density and limited space for new transport infrastructure has
translated into significant road congestion despite one of the lowest motorization rates in
the world (ADB 2011). Without a mass transit system, Dhaka has one of the more unique
transport mode share splits in the world, with a high reliance on non-motorized means.
Based on the latest available official transport survey in 2004, one in three transport
users‘ primary mode of travel is by cycle rickshaw (STP 2005). Despite only 89,000
official licenses, an estimated 500,000 cycle rickshaws – the most in the world – plow
Dhaka’s limited roadways, making them an easy target of the city’s reform efforts at
reducing congestion. 22% of users walk to their destinations (STP 2005), a sharp decline
from 60% just five years prior (DUTP 1998), due in large part to increased pressure on
the pedestrian infrastructure. In a limited study of a proposed Bus Rapid Transit (BRT)
corridor study between the airport and a major bus terminal in Gazipur, only 37% of the
observed roads had footpaths on both sides and more than half had no footpaths at all
(Efroymson 2011). Consequently, Dhaka also has one of the highest pedestrian shares of
traffic fatality rates in the world at 54% (Leather etal 2011). Only 2% of households own
bicycles (Rahman 2008).
With the ban of cycle rickshaws from the main arterial roads starting in 2004 (World Carfree Network n.d.) and continuing to as recently as April of 2011 (Work for a Better
Bangladesh 2012), buses have increasingly become the lifeline for almost half of residents
in the city, with 44% using buses or mini-buses as their primary mode (STP 2005),
especially for longer trips. The average bus trip length is 8 km vs. 2 km for rickshaws,
and buses are the cheapest available mode of public transport (Rahman 2008).
26

Despite a high demand for services, Dhaka has only 6,500 buses (Hasnine 2011) for its
15-18 million person population. By comparison, Colombo, the capital of neighboring Sri
Lanka, has more buses (7,600) for a population less than half of that size (4.6 million)
(Hoque & Hussain 2004). With only 2% of buses operated by the government itself,
oversight is imperative with as many as 750 individual, private owners (Rahman 2008)
operating on 59 licensed routes (Olsson & Thynell 2004). Recent consolidation has
brought the lion share (75%) of buses within the control of 45 bus companies (ADB Greater Dhaka Sustainable Urban Transport Project 2011).
Due to the importance of buses to the daily operation of the city and the fragmentation of
the industry, there are no less than six government agencies with a major stake in
regulating bus operations in Dhaka. The Dhaka Transport Coordination Board (DTCB) is
the lead agency, tasked to plan and coordinate a long-term sustainable transport strategy
for the city. The Bangladesh Road Transport Corporation (BRTC) operates 2% of the
buses in the city, the Bangladesh Road Transport Authority (BRTA) regulates public
transport vehicles, the Road Transport Committee (RTC) awards route permits, the
Dhaka Metropolitan Police (DMP) is responsible for enforcing regulations, and the Dhaka
City Corporation (DCC), which split into two bodies in late 2011, is responsible for overall
municipal governance and administration. In spite of or largely due to the extensive
regulatory framework, a “range of rent-seeking practices affecting all aspects of bus
operations and regulation” has become pervasive and makes any “new investment [by bus
owners] unprofitable” (World Bank 2009).
A detailed cost analysis of four different types of Dhaka buses found that expected costs
for operations, maintenance and depreciation per kilometer are up to 42% higher than
the fixed government fare, even without including illegal bribes and payments made
(Bhuiyan 2007). Bus owners are suspected to make up for this shortfall by overloading passengers during peak hours, minimal maintenance, using buses long after their
recommended lifespan, and adding on unauthorized charges based on what commuters
are willing to pay.
In the context of increasing motorization, the result for the millions of captive bus riders
in Dhaka is alarming. Mannan and Karim (1999) estimated that buses were involved in
25% of road accidents in Dhaka. According to Katz and Rahman (2010):
Travelers are forced to hang out the door frames in the most extreme conditions, filling all available space in the aisles . . . This not only is a comfort issue for many passengers but also affects the safety level at which the buses operate. For many passengers, the link between crowding and safety is strong; some feel not only less comfortable but also less safe among their co-passengers during crowded conditions.
27

Crowdedness not only impacts safety but also equity, as the most vulnerable populations
are often effectively denied rides. Rahman (2008), for example, suggests that older
adults, women and children often cannot board buses during rush hour, since these
groups avoid having to fight during peak-period boarding and alighting. Using data from
the 2004 travel survey, Enam and Chowdhury (2011) find that women are less likely to
consider public transport in their travel choices.
Since private operators have little incentive to invest in a better user experience, the
government, with the assistance of outside agencies like the Swedish International
Development Cooperation Agency (SIDA) and the Japan International Cooperation
Agency (JICA) has tried to incentivize the private operators through competition,
launching its own aforementioned bus service in 2001. While it has had a number of
stumbles procuring and maintaining buses in the past, the BRTC has recently launched
several hundred modern, high capacity buses from China and Korea that, though my
interviews of local bus patrons and data that we collected in this study, are rated among
the best in Dhaka. 300 buses featuring electronic ticketing are expected to hit the roads
in June 2012, with another 300 planned in the next year (BRTC 2012).
The efforts of the government, while still perhaps too early to evaluate, seem to be one
step toward improving the conditions for captive riders and preventing the future rapid
erosion of the significant passenger base. Can better information on Dhaka’s buses
complement those efforts?
Current bus data collection methods
Despite the pronouncements that we are now living in a world of limitless data,
information is expensive to collect, especially when attempting to measure thousands of
uncoordinated, moving shared vehicles that serve millions of riders everyday. It explains
why, despite its apparent need, Dhaka does not have an updated map of its bus system.
Before we examine how bus data are being collected today, it is helpful to first outline the
dimensions of measurement and how new tools like the smartphone are redefining the
landscape of not only what can be measured but also how precisely, and how quickly
those measurements can be disseminated.
28

Figure 2.5 | Categories of bus data
!
Automated! Requires user input!
met
ric ty
pe!
CATEGORIES OF BUS DATA!A
Time e.g. travel time, wait time, road
speed
Space e.g. mapping,
directions
Conditions e.g. crowding,
service disruptions, safety alerts
Perception e.g. happiness, by age, gender,
income
1
Figure 2.6 | Dimensions of measurement
3 DIMENSIONS OF MEASUREMENT!
Categories of Data Being Measured!
Accuracy + Precision of Objective Measures!
Speed of Measurement and Dissemination!
1
2
3
Most discussions of measurement usually center around the range of metrics that are
measured, from the more objective metrics like speed to the more subjective measures
like happiness. As Figure 2.5 depicts, there are four main categories of metrics that relate
to buses (and which are common to shared vehicles): those that characterize the objective
position and nature of the bus itself, (1) space, (2) time, and (3) physical conditions, and
(4) perception, which references the individual experiences of bus riders. However, as
Figure 2.6 illustrates, there are two additional dimensions of measurement that have become increasingly important with the proliferation of networked digital tools: (1) the
accuracy and precision of those objective measurements and the (2) speed at which those
measurements can be both made and disseminated. The former speaks to the capabilities
of digital sensors to capture at least objective measures to a level of accuracy and
29

precision that human senses cannot i.e. digital clocks measuring time to the thousandths
of a second. The latter speaks to the ‘real-time‘ nature of data and intelligence today, that
something can be measured and shared almost simultaneously. Whereas earlier digital
technologies like video and voice recorders expanded the scope of what could be
measured, more recent digital networked technologies like smartphones have been the
catalyst for redefining what is actually measured in practice.
Figure 2.7 | Types of bus data collection devices
Digital Networked"
Analog"
TYPES OF BUS DATA COLLECTION DEVICES"
Pen & Paper
Smartphones
Automated Vehicle Locators (AVLs)
Voice Recorders
Counters
Video Recorders / Cameras
Desktops
Spac
e Ti
me
1 2 3
Con
diti
ons
Perc
epti
on
Acc
urac
y +
Prec
isio
n
Spee
d
Digital "
Bus data collection in Dhaka
While buses in Dhaka are highly visible on the roads, they have been historically costly to,
and consequently rarely, measured in data. Data collection for buses in Dhaka (and likely
in much of the rest of the developing world) has been analog and ad hoc. By analog, I
mean collected using human observation and, essentially, pen and paper. Since any
analog method that attempts to capture data on moving objects in a relatively chaotic
atmosphere at a mega-city scale will require significant amounts of time and resources, it
will likely be ad hoc, or done much less frequently than necessary to remain up-to-date.
30

Figure 2.8 | Current bus data collection snapshot for Dhaka by type of data collected ! (Source: Compiled by author from various sources)
Time e.g. travel time, wait time, road speed
metric type!
DATA COLLECTION IN DHAKA!
Space e.g. mapping, directions
Conditions e.g. crowding, service disruptions, safety alerts
Perception e.g. happiness by age, gender, income
collection tool! data collector!public
accessibility!volume of publicly
accessible data!
Analog+ (Hasnine 2011)
Academic Ad hoc Less data
Digital using custom hardware
Private companies e.g. NITS
Unavailable No data
Analog+ (Katz and Rahman 2010)
Academic Ad hoc
Less data
Analog Academic / Regulators
Ad hoc Less data
1
2
3
4
CATE
GO
RIES
OF
BUS
DATA!
1
Some efforts to merge analog and digital approaches have taken place in Dhaka. For
example, researchers like Hasnine (2011) and Katz and Rahman (2010) have attempted to
characterize the bus system in Dhaka by supplementing analog tools with digital voice
and video recorders to more precisely measure crowding and bus wait times. While those
studies have provided valuable glimpses into the system itself, they have been rare. The
challenges arise not just from the technologies or the tools themselves, but also from
weak institutional capacity typified by RAJUK, the main planning agency for Dhaka who
reportedly has a total of 10 planners for the 15-18 million inhabitants of the city (Shafi
2010)1. Across all categories of bus data from temporal and spatial to comfort,
demographics, satisfaction and behavior, there is a palpable absence of data. One might
wonder that if the mobile phone can empower hundreds of millions who previously did
not have knowledge, could better information powered by digital tools begin to empower
well-intentioned institutions as well?
31
1 San Francisco, a progressive but largely developed city of 800,000 has a planning department staff of 152 (SF Planning Dept n.d.).

Bus data collection in the industrialized world
In contrast, bus data collection methods in the more industrialized world are increasingly
digital but in some cases, still closed to the public.
Digital tools can augment human senses and capture data more scalably and at a higher
precision than analog tools. Digital time can be captured in fractions of a second. Digital
location, which is today sensed, triangulated and optimized by a combination of cell towers, GPS and Wi-Fi networks, can be as accurate as 3-5 meters (Google n.d.). This
new level of precision and accuracy of collected data increases the precision and accuracy
of the information that can be relayed to users. Combined with real-time data
transmission and distribution through mobile or Wi-Fi networks, digital tools also
provide the opportunity to make the information more relevant, since it can be tied to a
user’s specific time and place.
While bus data are increasingly easier to collect, resulting in much more data actually
collected, this does not necessarily translate into more information available for the bus
user. Automatic-vehicle-location (AVL) devices that track real-time locations of bus fleets
have become increasingly common in the industrialized world. Today’s AVLs not only
include core location capabilities but also other features like automated onboard stop
announcements, automatic passenger counting and vehicle maintenance status messages
(TCRP 2008).
Institutionally, AVLs are required by the government but implemented by the agency or
operator for the purposes of internal planning and management. Quite often, the AVL
data can, in theory, be useful to the user especially in relatively low-frequency service
settings. The agencies or operators own the information and users are dependent on
goodwill to access that data. In some places like Boston, that goodwill translates to improved real-time services; in others like Singapore, the data are made available but
only through centralized approaches.
In the United States, the trend has been “open” with data feeds from AVL services
provided to the developer community starting with Portland, who pioneered a common
data standard for this type of data with Google, a leading mapping and local service
provider, called GTFS, or General Transit Feed Specification. Other transit agencies like
Boston have followed suit, which have provided users with improved real-time services
like live bus wait times (Rojas 2012). On the other extreme, places like Singapore where
the private operators and the regulatory and planning agency (e.g. Land Transport
Authority) serve as strong gate-keepers to the data, only centralized dissemination of the
information is allowed. In part, that reluctance to release data may be a result of the high
cost to collect data. AVLs retail in the US for $15,000-$35,000 per bus inclusive of both
32

capital and operating costs (TCRP 2008). The higher the cost of collecting data, the less
likely the data collector will share the data collected (and the less likely a third party can
generate data on its own).
Figure 2.8 | Current bus data collection methods for the industrialized world by type of data ! ! collected (Source: Compiled by author from various sources)
Time e.g. travel time, wait time, road speed
metric type!
DATA COLLECTION IN THE INDUSTRIALIZED WORLD!(Ex. Boston, Singapore)!
Space e.g. mapping, directions
Conditions e.g. crowding, service disruptions, safety alerts
Perception e.g. happiness by age, gender, income
collection tool! data collector!public
accessibility!volume of publicly
accessible data!
Digital using AVLs
Operators Closed / Open Full or no
data
Digital Private companies e.g. Google
Open Full data
Analog moving to digital (Steinfeld 2011)
Academic Open but Ad hoc Less data
Analog moving to digital (Stephen and Graves 2006)
Academic / Regulators
Semi-Open but Slow Slow data
1
2
3
4
CATE
GO
RIES
OF
BUS
DATA!
1
Into the realm of transportation data collection and dissemination comes the power of the
smartphone, which may provide an opportunity for many contexts, including developing
cities, to leapfrog traditional approaches, just as has happened with mobile telephony
more generally (James 2009).
For one, smartphones, equipped with the same or even better time and location sensors
as traditional AVL technology, can potentially be utilized as portable AVL sensors at a
fraction of the cost ($150 vs. $15,000). In industrialized contexts, lower-cost,
smartphone-based sensors may enable operators of lower-frequency lines or in smaller
revenue markets to initiate coverage of their lines for the first time. Importantly, and
distinctly from traditional “passive” AVL sensing technologies, smartphones can also be
relatively easily converted into counting and surveying devices, enabling the simultaneous collection of data on dimensions like crowding and user characteristics like
demographics and satisfaction. Such surveys carry the added benefit of having precise
time and place “stamps.”
33

It may in fact be this combination of automated and user-generated information enabled
by smartphones that lay the foundation for truly intelligent cities. As Thomas Erickson
(2010) from IBM Watson Research Center writes:
Besides offering the possibility of increasing the range of problems and quality of solutions, tapping human intelligence to augment the intelligence of cities and regions offers the prospect that “smart systems” will be more likely to be accepted and viewed as legitimate. Rather than people as passive subjects of increasingly ‘smart’ technical systems, the vision is that smarter cities can offer a variety of ways for humans to act as first class participants, contributing their abilities to sense, analyze and act.
In many developing contexts, AVL systems tend to only exist for BRTs or otherwise in
well-organized, centrally controlled fleets. For systems characterized by a large number of individual owner-operators, who do not have the requisite fleet scale, or where operators
and/or government authorities are otherwise technically or financially incapable of
deploying the necessary technologies, few incentives for, or possibilities of, AVL
implementation exist.
The expected increased penetration of smartphones in most developing urban contexts
provides an interesting opportunity to bypass the institutional barriers to AVL
implementation, and effectively reinvent the AVL paradigm. Can users, equipped with
smartphones, become the sensors who collect data that improves their own user
experience and thus obviate the need for operators or the government to step in? Might
crowdsourcing offer the right approach?
The bus crowdsourcing dilemma
Despite its seeming ubiquity, crowdsourcing has only recently become a cost-effective
and creative technique for gathering large amounts of information from a distributed,
largely online crowd. The term itself, was coined only in 2006 by Jeff Howe in Wired
magazine (Howe 2006) and is used to refer to a “participative online activity” where a
“heterogeneous” group of people “voluntarily” undertake a task of “mutual
benefit” (Estellés and González 2012).
Crowdsourcing is an appropriate data collection method when the scale of the data
collection effort can match the scale of data required to be useful. The scale of a
crowdsourced data collection effort is dependent on (1) the size of the potential pool of
participants, (2) the ease for participants to make a contribution, and (3) the compelling
nature of the mission. Perhaps the most successful example of crowdsourcing to date is
Wikipedia, which leverages a boundary-less set of volunteers to build a free encyclopedia
on the web at their convenience.
34

Figure 2.9 | Evolution of crowd-based data collection tools and techniques
Data Input Device!
Categories of Bus Data! Space Time Conditions Perception
??? CROWDSOURCING Data Collection
Technique!
1
It may be important to note that crowdsourcing emerged from a time when desktop computers were the primary data input (and output) devices and the demand for precise
time- and space-information was still nascent. Geocentric crowdsourcing, or
crowdsourcing that centers around a specific location was still in its infancy but did
generate its fair share of successes from generating a map of bicycle lanes (e.g. Cyclopath)
to real-time potholes (e.g. FixMyStreet). With the proliferation of smartphones and other
location-sensing devices, not only was geocentric crowdsourcing potentially much easier
but it could also be done more precisely and in ‘real-time.‘ A bus route map could not just
be drawn on a desktop from one’s memory but the routes could be geo-traced while
actually riding a bus in person. Travel times could not just be estimated but
communicated to other riders as that data was collected.
While precise, ‘real-time’ geocentric crowdsourcing became possible with smartphones,
was it also something that was likely, especially in providing useful data on buses?
Generating the most useful information on a bus system stretches the limits of the
crowdsourcing model. First, crowdsourcing bus data with smartphones in the field likely
requires more effort from the participant than contributing via the comfort of one’s home
and one’s time. Second, the number of potential volunteers who can collect data is
limited by space and time (imagine a low-frequency bus line), thus increasing the need
for “altruism” among potential members. Thirdly, getting transit riders to be “altruistic” may be a significant hurdle.
In perhaps the only documented experiment thus far on crowdsourcing bus data,
researchers at Carnegie Mellon (Steinfeld etal 2011) developed and deployed smartphone
35

apps on the Pittsburgh (Pennsylvania, USA) bus system to capture real-time bus
locations, fullness (crowding) and service disruptions. While the technology worked, they
found it particularly difficult to motivate transit riders to gather data, especially in the
quantities needed to be relevant to users. They note:
We suspect this difference is based on two factors. First, riders view transit as a “means” rather than the “end.” In a sense, riders engage with transit service not for the specific experience of the ride, but in order to efficiently achieve a different goal that requires them to move within a city. Second, riders of public transit services interact with the service much more like a consumer than other public services . . . This constant financial transaction may frame riders thinking of the service as a consumable service as opposed to a public good enabled by taxpaying citizens.
Moreover, with the advent of smartphones and other location-sensing technologies, the
potential applications of precise time- and space-information for users, operators and
regulators has expanded markedly (which is a great development). The challenge from a
crowdsourcing perspective, however is that much of that information requires a lot more
data, especially for users, who benefit tremendously from information that is specific to
their particular place and time.
As Figure 2.11 (top left) illustrates, one can collect data on (1) all the buses, all of the time,
(2) all the buses, some of the time, (3) some buses, all of the time, and (4) some buses,
some of the time. The crowdsourcing “sweet spot” is in that fourth, bottom-right
quadrant when some participants measure the buses that they happen to be riding on a
given day. Tracking all the buses some of the time or even some of the buses all of the time would require a level of mobilization rarely observed in a typical, volunteer-led
crowdsourcing effort.
For bus riders, who aspire to save time and avoid discomfort today, perhaps the most
valuable information on buses is gathered in those first two quadrants, where all or most
buses are measured. Service alerts, wait and travel times and crowding levels all depend
on a user’s specific place and time. Nextbus, a popular bus arrival prediction service in
the U.S., targets an error rate of “less than one minute for predictions of five-minutes or
less” (Next Bus n.d.). Whereas a private car is always “on-demand” in one’s garage, this
set of information can collectively make buses and other shared vehicles seem more
accessible (the buses themselves may not actually arrive more frequently). Endowed with
‘real-time’ information on crowding and other physical conditions within the buses, bus
riders may also avoid the peak times that often make shared rides uncomfortable, if not
intolerable.
36

Figure 2.11 | Bus data collection matrix and information requirements by stakeholder
Some Buses!All Buses!
All the Time!
Some of the Time!
BUS DATA COLLECTION MATRIX" Bus Riders!
Some Buses!All Buses!
All the Time!
Some of the Time!
Travel Times
Bus Routes
Bus Stops
Wait Times
Service Alerts
Some Buses!All Buses!
All the Time!
Some of the Time!
Bus Operators!
Emergencies Bus Positions
Ridership Traffic
Some Buses!All Buses!
All the Time!
Some of the Time! Routes deployed
Stops fulfilled
Bus Regulators!
Demographics served
For bus operators, who aspire to optimize their fleet utilization today, information on all
their buses (and preferably on all the buses on the road), at all times is a basic
requirement. Road emergencies, which are too frequent in a place like Dhaka, can be
reported and adapted to in almost ‘real-time.‘ Bus timings, which are not fixed on a set
schedule in Dhaka, can be coordinated to avoid bunching and maximize total ridership
(and not just overcrowd buses during slow, peak-period traffic times).
37

For well-intentioned bus regulators, whose goal is to maximize social welfare in a longer
time period, any information on performance (e.g. demographics served, routes deployed,
stops fulfilled) over time is helpful. Traditionally, this information has been sampled
from the overall system (some buses some of the time), which suggests that
crowdsourcing could be an appropriate data collection technique, at least in terms of
providing the requisite volume of data. However, as in all applications requiring a sampled set of data, having a thoughtfully controlled sample (as opposed to one based on
a particular techno-centric crowd’s reach) is critical to avoid bias in the data--and
consequently in the policies. Moreover, the power of these new tools suggest that the
next frontiers in regulation may be in adjusting policies in ‘real-time,‘ thus increasing the
requirements for data.
The bus crowdsourcing dilemma, therefore, is not just that motivating sufficient
participants to collect data on buses is difficult; it is also that the most valuable
information on buses requires either a lot more data or a very targeted set of data, both
likely beyond the reach of traditional crowdsourcing efforts.
In a developing country context like Dhaka, there are several additional complications.
First, the initial requirements for data precision may not be as high since the
unpredictability in travel experiences is high. Compared to Singapore where one can, and
often does, schedule a meeting to within a 5 minute interval, in Dhaka, arriving within an
hour window can be an achievement. Second, while there may be large pools of potential
volunteers due to higher bus riderships, the current lack of smartphone penetration
makes even piloting a crowdsourced model difficult. Smartphone penetration is expected
to increase quickly as prices of handsets continue to decline and have already reached 23
and 17 percent for urban areas in India and Indonesia respectively (Our Mobile Planet 2011). However, the bigger challenge may not be the general availability of smartphones
but the rate of smartphone penetration among the transit users, and the ability to develop
useful applications for them. Finally, for a largely analog ridership, what is the right
format for communicating complex, multidimensional layers of information?
Interestingly, in Jeff Howe’s original article in Wired, crowdsourcing arose as a reaction
to outsourcing, which assigns tasks to a specific group of people rather than relying on the
altruism of a distributed set. In the developing world where labor is relatively
inexpensive and smartphone technology is not yet widely available, is there another
model of data collection that combines both the power of a highly motivated and
coordinated group (outsourcing) and a distributed means of contributing information
(crowdsourcing)?
38

EXPERIMENT
3
The Flocksourcing Experiment Introducing Fleetsourcing Introducing Flocksourcing
Research questionResearch method
39

The alternatives to crowdsourcing with smartphones
As outlined in the previous chapter, bus data may be difficult to crowdsource due to (1)
the high rider demand for accurate and precise time-space data, (2) the limited number of
potential participants and (3) the inherent challenge of motivating transit users. In
developing contexts, (4) the lack of available smartphone hardware and (5) know-how
makes even piloting crowdsourcing as a viable data collection technique difficult. While
crowdsourcing with smartphones is possible, it is unlikely to generate sufficient or
targeted enough information to be useful to riders, operators or regulators. With the goal of substantially increasing the amount of publicly available information on buses in
Dhaka, what are the alternative data collection methods designed around the smartphone
that can generate the requisite data and leverage the resources available in a developing
context like Dhaka?
Figure 3.1 | Bus data collection options with smartphones
FLOCKSOURCING
FLEETSOURCING WITH
SMARTPHONE AVLs
CROWDSOURCING WITH
SMARTPHONES
Sampling + Machine Learning
Space
Time
Conditions
Perception
On one side of crowdsourcing, where just a few of the buses are tracked some of the time
is an approach we are calling fleetsourcing, where all of the buses of interest are tracked
all of the time. In between is a data collection method called flocksourcing, the focus of
this study’s experiment, which attempts to collect just enough data to be useful for its
particular purpose.
40

Introducing Fleetsourcing
FLEETSOURCING
Spatial
Temporal
As mentioned previously, smartphones, equipped with precise time- and space-sensors
can be retrofit into low-cost automated-vehicle-location devices, or AVLs. Fleetsourcing
is a data collection approach that simply pairs any fleet of shared vehicles with these
smartphone AVLs. Since the device is not built into the buses themselves, a viable system
will likely require the assistance of the onboard ticket agent, an employee common on buses in many developing world cities. Whereas traditional AVLs are programmed to
passively collect only objective metrics like time and space, the smartphone AVLs can also
be input devices for the human sensor who has the option of collecting additional
information like ridership and even publicly report crowding, traffic conditions, roadside
or other emergencies.
Figure 3.2 | Working definition of “Fleetsourcing”
FLEETSOURCE - v. to arm human sensors aboard a fleet of
vehicles with smartphone sensors to collect
data at all times, thus retrofitting the fleet
with intelligence
While smartphone AVLs are expected to be significantly cheaper than traditional AVLs,
for bus operators, who as previously discussed, have little incentive to make any investment in their operations, implementation across Dhaka’s fleet of 6,500 mostly
owned and operated buses will be a challenge. Not only is there a significant capital cost
of procuring and maintaining 6,500 smartphones but also convincing 45+ different bus
companies to buy into the idea and training their 6,500 ticket agents, who likely have not
used a smartphone before, will be a huge undertaking. Nevertheless, there are situations
when having data on all the buses at all times is really useful information for both
operators, who want to effectively manage their fleets and riders, who want to have better
information on their specific bus at their given departure time. While it may always seem
better to have all the data at all times, privacy (private fleet owners unlikely to want to
publicly share data of bad performance) and cost concerns (collecting, storing, mining
huge volumes of data) may favor another more cost-effective and less data-intensive
approach, at least in the interim.
41

Introducing Flocksourcing
FLOCKSOURCING
Spatial
Temporal
Targeted
Sampling +
Machine
Learning
Conditions
Perception
Flocksourcing is an evolution of crowdsourcing and outsourcing that attempts to organize
and motivate a specific group of participants to collect data in a distributed way for a
specific purpose.
Figure 3.3 | Working definition of “Flocksourcing”
FLOCKSOURCE - v. to arm a FLOCK, or guided crowd, with
smartphone sensors to collect a lot of data
for a specific purpose, thus bringing
visibility to something that was previously
less visible
Flocksourcing attempts to address the bus crowdsourcing dilemma in developing city
contexts by (1) relying more on face-to-face contact and less on online altruism to
motivate and organize participants and (2) endowing both the technology and the “know-
how” to the flock members. Whereas traditional crowdsource relies on a pool of largely
anonymous online volunteers, as experienced in our Dhaka experiment, flocksourcing
incorporates social organization to set targets and hold a (usually smaller) group of
individuals accountable. Despite the increasing popularity of online collaboration,
humans are in fact much better at collective action in person due to the power of our
subtle social cues, which have been difficult to mimic online (Erikson and Kellogg 2000).
While endowing the technology is not a requirement for flocksourcing, it is an important
element especially because the places that seemingly need data the most are the places
where the most advanced data collection devices are not readily available.
If completed as advertised, a successful bus flocksourcing should result in a large,
concentrated sample of data. For some purposes like providing a bus route map for
users, that sample itself may be sufficient. For others, where more data is needed like
time-specific average travel times, another technology called machine learning could help
42

to magnify a sample or samples of data into information that can describe the entire
system. In Dhaka, travel times vary considerably (how much is unclear due to a lack of
data), not only due to peak morning and evening travel periods but also because different
sections of the city shutdown depending on the day, in order to minimize congestion. The
concept behind machine learning is simple: enter a sample of data with a variety of
characteristics and the machine will attempt to learn patterns in the sample and
extrapolate them to predict a larger set of behavior. As the sample of data increases so should the accuracy of the predictions. In that way, a flocksourced sample of data can
potentially be used to provide information where much more data would have been
required e.g. time-specific travel times.
Figure 3.4 | Flocksourcing and Flocksourcing with Machine Learning
Some Buses!All Buses!
All the Time!
Some of the Time!
Some Buses!All Buses!
All the Time!
Some of the Time!
FLOCKSOURCING FLOCKSOURCING with
Machine learning
The intended product of flocksourcing is not just a large, concentrated sample of data but
perhaps as importantly, a trained and trusted data collection flock.
In a city that is threatened not only by large-scale motorization but also catastrophic
flooding, flocks that are trained to collect data on buses may also be deployed to rapidly
collect data during disasters (provided the mobile networks are operational). One can
perhaps imagine a day when a trusted information flock works in concert during these
moments of crisis with a police force like the elite Rapid Action Battalion (RAB) in Dhaka.
With a significant shortfall in formal institutional capacity, building local capacity
through data collection is not without strong precedents. In Kibera, the world’s largest
informal settlement located in Nairobi, Kenya, 13 young residents trained in digital data
collection in three weeks produced one of the densest maps ever made of the area,
highlighting points of interest once large invisible like restrooms, schools and religious
institutions. Today, armed with data and digitally visible to the world, the organization
43

seeks to provide a voice for residents in the informal settlement through a program called
the Voice of Kibera.
While flocksourcing buses to bring visibility to a critical yet complicated system is a
worthy beginning, a natural evolution are flocks that are empowered to collect data on
anything of interest to the public e.g. crowding on buses before, during and after cricket
matches. With this power, of course, comes questions of which groups are endowed with this technology and which issues are made more visible in data. For the scope of this
study though, we will focus our attention on if the smartphone tools can actually be
applied today in a more challenging urban environment like aboard buses in Dhaka and if
a flocksourced data collection technique may actually lead to meaningful information for
bus riders, operators and regulators.
44

Research question
Is flocksourcing a viable technique for collecting data on the Dhaka bus system?
This broader question can be broken down into 3 subquestions:
Technical feasibility(1) Are smartphones technically feasible as data collection devices in
Dhaka today?How accurate is the location-sensing technology, how fast is the mobile data network, and
are there limitations of locally available hardware?
Appropriate design
(2) Can a flocksourcing workflow be designed appropriately for collecting
data while riding buses in Dhaka?How to design a workflow that is affordable, easy to understand and deploy on the buses?
Scalable
(3) How much quality data can be collected by an organized flock on buses in Dhaka?How much data can a small flock collecting data for one week collect? Can that sample of
data reveal potentially meaningful insights on the largely unmeasured Dhaka bus system?
45

Research method
The flocksourcing experiment was the culmination of 9 months of collaborative research,
highlighted by an initial visit to Dhaka in July, a month of iteration with our local
partners in Dhaka in January, and a week of technology deployment in late March.
2011 2012 JUL NOV/DEC
1! 2 4! 5
JAN MAR
Timeline
In Dhaka!
3
Understand the current situation Previous to my first visit to Dhaka in July 2011, I had no direct connection with anyone in
Dhaka and little understanding of the complex mobility context aside from a brief
literature review. That first trip in the middle of a car-free hartal, or political protest,
confirmed that Dhaka was a city that could still operate without cars due to the high
proportion of users who relied on alternative means like buses, cycle rickshaws and
walking.
Interviews with local academic experts, social entrepreneurs, non-governmental
organizations, private sector companies, a government regulator, and cultural experts
helped to confirm (1) the severity of the traffic congestion despite a relative lack of private
cars, (2) the poor quality of alternative transport means especially for the poor, (3) the
ineffectiveness of previous measures to address these transport challenges and most
worrisome, (4) the absence of an implementable city transport plan for the future.
Find a (great) local partner
Since I was clearly an outsider with limited local language (Bangla) skills, it was
important to find a local partner not only to implement the approach but also to give
constant, honest and open feedback. I was very fortunate to meet Muntasir Mamun, a
social entrepreneur and founder of Kewkradong Bangladesh (www.kewkradong.com), an
adventure-based non-profit that organizes an annual 1,000 person International Coastal
Cleanup of beaches in neighboring Chittagong. The close-knit group of 15-20 volunteers
describes themselves informally as “not an NGO or a club where you can join by paying
membership dues” but as “out-of-box” thinkers who frequently push the boundaries of
46
1!
2

what is possible in their city and beyond. Our partnership was sealed when the group
took this author on a tandem bicycle ride through the bike-unfriendly city.
Endow a small set of smartphones; Install pre-developed apps for technical and cultural field testing
Since smartphones are still relatively new to the Dhaka market and our local partners did
not have easy access to them, we decided to locally procure a limited set of 25 for our
pilot. A range of mobility-related apps from vehicle counters to trip trackers to paperless
surveys were developed by the author from abroad at MIT. With the help of the team
from Kewkradong, we then deployed these data collection tools in 18 busy intersections
across 6 neighborhoods in Dhaka to understand both the technical possibilities and the
cultural context. We counted pedestrians, cycle rickshaws, cars and buses at each of these
intersections, surveyed street conditions and surveyed citizens on their perception of
different urban transport modes.
Co-develop a mobility data collection app with partner
After a week and a half of field testing, we conducted a charette with local university students and with our local partner to devise potential mobile and non-mobile related
solutions for the mobility challenge in Dhaka. The team agreed that buses were the
appropriate transport mode to focus on based on their city-wide reach, crowding and
slowness. The app itself (along with the data collection, analysis and visualization back-
end) was then revised about 5 or so times in the field and then another 6-7 times when
the author returned to the US.
Make technology available to local partner, who then organizes and deploys a flock on targeted bus lines in Dhaka; Help partner monitor and analyze data collection results
After 15 iterations, the final version of the bus data collection app called Share My Bus
Dhaka was sent via QR code to our partners in Dhaka with some training material on how
to use it. Kewkradong then organized a small flock of 8 to ride buses for a week in March
2012, focusing on two critical bus lines in the city (see Figure 3.7). The routes were
chosen because they were among the most frequently used in the city according to our
local partners and third-party sources (Olsson and Thynell 2004). We devised a cloud-
based back end technology to monitor the data that were collected in real-time.
47
4!
5
3

Since this pilot was not commissioned by any particular stakeholder, we created a plan to
test the range of possible metrics (see Figure 3.5) that smartphones could collect on buses
in Dhaka today. We developed a single mobile application (see Figure 3.6) that could
collect (1) bus positions (spatial and temporal), (2) bus crowding (conditions), and (3)
user demographics and satisfaction of the bus riding experience (perception). By
collecting all four categories of bus data, we could explore not just the viability of
flocksourcing but also the technical feasibility of fleetsourcing as well.
Figure 3.5 | Metrics collected in Flocksourcing data collection plan
Bus Details!Bus Number!Bus Destination Bus Company!No. of Seats!!Speed!Location!Time!!Crowding!Passenger Count!Female Passenger Count!
Survey*!Gender!Age!Home Location Work Location!One-Way Commute!Income Phone Ownership!Rider Satisfaction!Biggest Complaint!Riding Frequency!!!*Survey data linked to bus data
Figure 3.6 | “Share My Bus Dhaka” mobile data collection application
*Scan me if you have an Android
48

Figure 3.7 | Target bus lines in Dhaka
!AZIMPUR!
New Market!
Dhanmondi Lake!
Agargaon High School!
Shewrapara Bus Stand!
Army Stadium!
Parliament!
Prime Minister Office!
Mohakhali Flyover!
Airport!
PALLABI!
UTTARA!
13 km!
20 km!27
36
49
RESULTS
4
A Thousand Riders Surveyed in One Week Flocksourcing workflow
Technical feasibilityAppropriate design
A thousand riders surveyed
50

! ! Flocksourcing workflow
Figure 4.1 | Flocksourcing data collection workflow
Human sensors"
Hardware sensors"
Platform"
Connectivity"
Data storage"
Data monitoring"
IncentivizedVolunteers"
Unsmartphones"
None"
Bluetooth
Organized Flock"
OrganizedVehicles"
Involuntary Tracking"
Smartphones" Tablets" PC"
Cell network Mobile data" Wi-Fi"
Excel"
Android" iPhone" Web"
Local Cloud"
Statistical"Packages"
Data visualization & dissemination"
Flocksourcing Workflow"
Software / App" MIT App Inventor"
Machine learning"
Visualization APIs"
1
2
3
4
5
6
7
8With an increasing number of digital tools at one’s disposal today, there are an increasing
combinations that are possible to complete the same task. The specific sequence of steps
that are taken to complete a task is often referred to as a workflow, a term that originates
from the domain of computer science. Optimizing a workflow is an important practice
when trying to increase efficiency, usability or simply to keep costs low. A key to
flocksourcing’s viability was a data collection workflow that was technically feasible in the
local context, appropriately designed for local users and scalable to data collection
efforts larger than the initial pilot. In the case of Dhaka, that meant a workflow that was
also designed to be both affordable and simple to understand and deploy, non-trivial
goals when none of our partners in Dhaka had ever used a smartphone and where English
is not the primary language. A very complementary workflow on transforming data into
knowledge has been compiled by my partner in this experiment, Stephen Kennedy, in his
2012 MIT master’s thesis, The Big Data-Information-Knowledge Continuum:
Experimental Techniques in the Visualization of Flocksourced Bus Data (Kennedy 2012).
51

Technical feasibility
Since the data collection workflow was initially conceived and developed at MIT in a similar environment in which the technologies were initially developed, it was unclear
whether key technical elements in the workflow (steps 2-6 in Figure 4.1) would meet the
minimum requirements in Dhaka. Specifically, we needed to determine (1) the accuracy
of the location sensing, (2) the speed of the mobile data network, and (3) any
performance limitations of locally-available hardware, specifically the screen size and
resolution since the touch screen is the input mechanism for some metrics. Some of these
requirements were more critical to some metrics more than others, suggesting that
certain metrics could still be measured even if one of the requirements was not met.
Figure 4.2 | Minimum technical requirements by metric collected
Metric Location accuracy Upload speed Local hardware
Geo-coded bus routes HIGH FAST Not important
Bus speed / travel times HIGH FAST Not important
Crowding HIGH FAST USABLE TOUCH SCREEN
Survey (satisfaction, demographics)
Not important MEDIUM USABLE TOUCH SCREEN
While our technical tests were not extensive, location sensing seemed to be generally
accurate within 25 meters, mobile data upload speeds were acceptable averaging around
3 seconds and the smaller and lower-resolution touch screen of locally available hardware
did not prove to hinder the data input process.
Location accuracy
A large majority of smartphones and certainly newer models are equipped with a variety of location sensing options including Wi-Fi, GPS, and cell tower triangulation. Wi-Fi is
typically the most precise but usually works best indoors when there are Wi-Fi networks
available. GPS, which triangulates position using satellites circling the earth, is accurate
to within 10 meters and can be accurate to within 1 meter but only under open skies i.e.
those not obstructed by buildings (Enge etal 2001). Cell tower networks are typically the
least accurate but are utilized when Wi-Fi or GPS is unavailable. A smartphone’s location
sensor can be programmed to optimize between the three options, which was fortunately
the default setting on our phones.
52
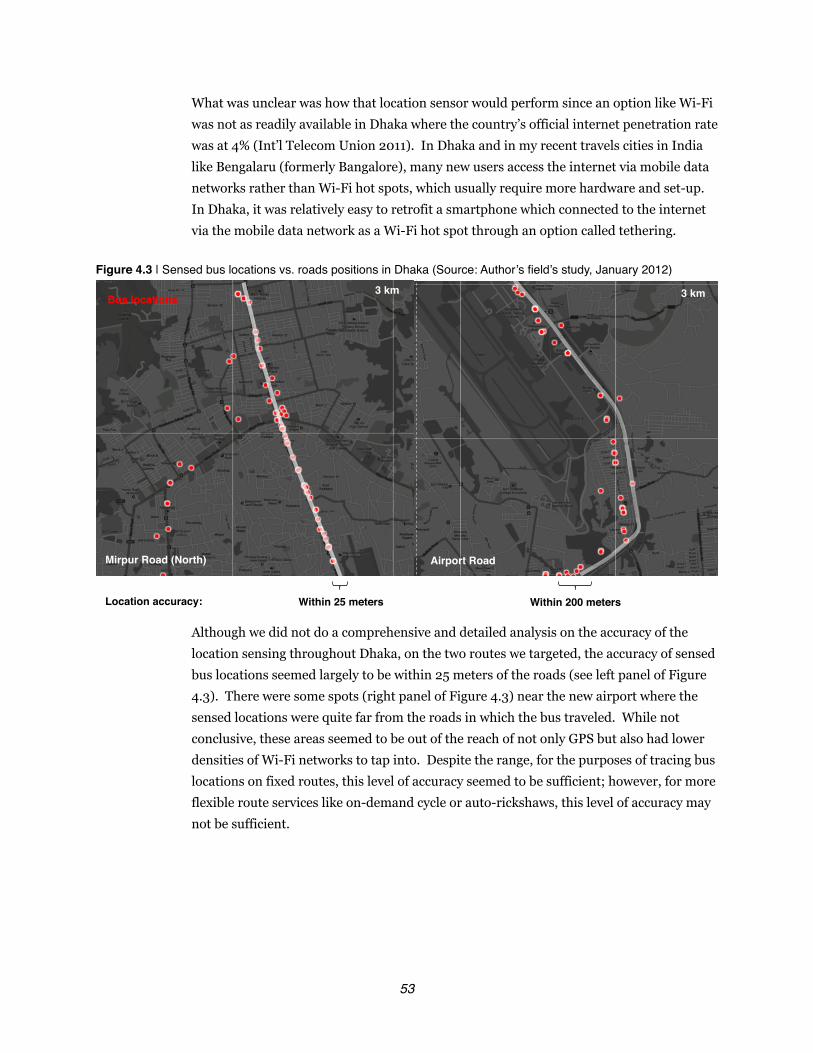
What was unclear was how that location sensor would perform since an option like Wi-Fi
was not as readily available in Dhaka where the country’s official internet penetration rate
was at 4% (Int’l Telecom Union 2011). In Dhaka and in my recent travels cities in India
like Bengalaru (formerly Bangalore), many new users access the internet via mobile data
networks rather than Wi-Fi hot spots, which usually require more hardware and set-up.
In Dhaka, it was relatively easy to retrofit a smartphone which connected to the internet
via the mobile data network as a Wi-Fi hot spot through an option called tethering.
Figure 4.3 | Sensed bus locations vs. roads positions in Dhaka (Source: Author’s field’s study, January 2012)
Mirpur Road (North)!
3 km!
Airport Road!
3 km!
Location accuracy:! Within 25 meters! Within 200 meters!
Bus locations!
Although we did not do a comprehensive and detailed analysis on the accuracy of the
location sensing throughout Dhaka, on the two routes we targeted, the accuracy of sensed
bus locations seemed largely to be within 25 meters of the roads (see left panel of Figure
4.3). There were some spots (right panel of Figure 4.3) near the new airport where the
sensed locations were quite far from the roads in which the bus traveled. While not
conclusive, these areas seemed to be out of the reach of not only GPS but also had lower
densities of Wi-Fi networks to tap into. Despite the range, for the purposes of tracing bus
locations on fixed routes, this level of accuracy seemed to be sufficient; however, for more
flexible route services like on-demand cycle or auto-rickshaws, this level of accuracy may
not be sufficient.
53

Mobile data upload speeds
Figure 4.4 | Mobile data payment process in Dhaka (Author’s field study, July 2011).
Mobile payment vendor! Payment log! Text message confirmation!
Since opening up in the mid-1990’s, Bangladesh’s mobile phone industry, which includes
six providers, is one of the most competitive in the world and features a tariff lower than
neighboring India, which has the fastest-growing mobile subscriber base in the world
(Yusuf et al 2010). As in many developing world markets, there are no contracts required
for activating phone service, only SIM cards, or portable memory chips for GSM-enabled
mobile phones, that can be topped up with even the smallest of amounts. GSM, or the
Global System for Mobile Communications, is a mobile phone standard used in almost every country in the world. To enroll in a mobile data plan in Dhaka requires simply
going to any local shop owner, available on almost every street corner in Dhaka, and
topping up about 300 Taka ($4 USD), needing only to provide a mobile number and
service provider. The local shop owner will log your payment manually in his or her book
and within a few minutes, you will receive a text message you of the payment.
Despite the relatively competitive mobile market in Dhaka, the current mobile data
networks operate on 2 to 2.5 Gs, which is a generation or two of mobile network
standards behind what the most advanced contexts (e.g. Singapore, United States), are
beginning to operate (4G). There has been some delay in upgrading Dhaka’s network to
3G, although reports indicate that 3G spectrum licenses will be available later this year
(Davies 2011). 2.5 G networks can support data upload rates of up to 150 kilobits per
second versus 4G networks which can handle from 30 to more than a 1000 times more
data per second (Wikipedia 2012).
Mobile data upload speeds are a function of the speed of the network and the amount of
data being sent. While 2-2.5G might indicate prohibitively slow data speeds, the data
packets sent in the bus flocksourcing pilot were quite small—just a few lines of text.
While we had no precise way of measuring the average upload speed, based on hundreds
of field observations by the author, each upload seemed to average around 3 seconds with
54

speeds varying by location and network provider. The upload speed mattered because
users could not input other data, e.g. counting passengers on the bus, while data was
being sent. While we could not adjust the upload speed, we could adjust how often the
bus location was updated, testing frequencies from every 15 seconds to every 2 minutes.
For our initial pilot, sending location data every 60 seconds, similar to the upload
frequency of the researchers at Carnegie Mellon (Steinfeld et al 2011), seemed to strike
the optimal balance between giving our flocksourcers time to input data and sending enough bus position data to infer metrics like bus speed.
Locally available hardware
Due to a variety of reasons, from cost to usability to sustainability in terms of enabling
our local partner to scale up the pilot in the future, it was important to develop our
applications on phones that could be purchased locally instead of phones imported from
abroad. At the time of our pilot in January 2011, the best available Android-powered
phone was the Samsung Galaxy Y, a phone designed specifically for the South Asian
market with lower price points (13,000 Taka or $175 USD inclusive of taxes) and a
slightly less advanced feature set. These phones were launched in Dhaka a few weeks
before our arrival in January and available at the main technology market in Agargaon.
240 x 320 px Samsung Y!
1280 x 720 pxSamsung Galaxy Nexus!
"
320 x 480 px HTC Nexus One!
4.65”"3.7”"
3”"
Figure 4.5 | Screen size and resolution of popular Android smartphones ! ! (Author’s fieldwork, July 2011)
The main challenge with the phone itself was the smaller screen, about 25% smaller than
the Nexus One, which was used to develop the original pilot apps. This meant that the
touch interface was 25% smaller, something important to consider given the high-
55

intensity environments that users may be surrounded by when entering information.
With a few rounds of launching and iteration, the smaller screen size could be designed
for, especially since the rest of the specs, from location sensing to data upload speed,
worked comparably across phones.
Of note, Internet-enabled, multimedia phones made by a Chinese company called
Symphony were popular in Dhaka at a price point much lower than the cost of smartphones (as low as $30) (Mobile Phone Bangladesh website n.d.). The phones do
not operate on the standard Android or iPhone platforms but do have links to YouTube,
Google Maps and other web applications. While not fully functional for our purposes,
they do indicate how fast prices for these smartphone-like phones are plummeting,
putting increasing pressure on the rest of the market and increasing adoption rates for
data-enabled phones which may enable users to receive information on Dhaka’s buses.
Appropriate design
For any design to be viable in Dhaka and other non-English speaking, less-advanced
technology cultural contexts requires designing a workflow that is:
(1) affordable (2) easy to understand, and
(3) easy to deploy for local users
Based on three weeks of rapid iteration in Dhaka with our local partner Kewkradong, we
were able to co-design a workflow that: (1) minimized costs by leveraging free and open
global tools, (2) simplified the user interaction by using icons rather than text, and (3)
streamlined the workflow by minimizing the number of steps required for a user to start
collecting data.
! ! Affordability
In the developing world, which is by definition poorer in terms of income levels than the
developed world, the costs of technology can be a barrier to deployment. Minimizing
costs in the flocksourcing workflow required both leveraging resources that are relatively
cheap in Dhaka—mobile data networks and labor—and open and free tools that are
developed for global audiences. The upshot is a cost structure that requires some upfront
investment for hardware but minimum ongoing investment. For example, in this
workflow, the only real ongoing costs were the cost of mobile data, which currently costs
about $4 for every GB of data sent and the cost of each flockmember, which can be as low
as $10-$15 per day per person in Dhaka. By comparison, the average GDP per capita in
Bangladesh hovers around $2 per day.
56

Figure 4.6 | Pilot cost structure (Author’s field study, January 2012)
???per person per
day"
$175 and rapidly declining"
Free" $4 per 1 GB" Free"
Human sensors"
Hardware"sensors" Connectivity" Data storage"Platform +
Software / App" Data monitoring"
Free"
1 2 3/4" 5 6 7
Increasingly, open and free tools are being made available by companies like Google and
research institutions like MIT to develop mobile apps, store data in the clouds and
analyze data in real-time. For this workflow, a combination of tools developed by Google2
was integrated.
MIT App Inventor, which was developed at MIT, sold to Google and then endowed back
to MIT late in 2011, is perhaps the biggest-related breakthrough; it requires no coding so
technical development and maintenance are minimal. In fact, this author learned mobile
phone programming in a few months on the MIT App Inventor service and helped teach
the team from Kewkradong how to develop a basic location-aware application in a few
hours.
Figure 4.7 | MIT App Inventor, user interface design (left) and functionality design (right) ! !
57
2 Disclaimer: Other open tools like Open Street Map could have been included but this author worked for Google, including to help launch the initial version of Google Maps, so was more familiar with their products, which were designed to be compatible with each other

Easy to understand
One of the biggest challenges for those in the developing world to fully access content on
the Internet is low literacy rates, especially in English, since most content on the web and
applications are developed first in English (Farrell etal 2010). While Bangladesh was for
a time a British colony, only 2 percent of the population speaks English (Crystal 2003)
and Bangla is the primary language. An alternative to text for our purposes is icon-based
design; thanks to open online resources like the Noun Project (thenounproject.com),
designing an interface using icons rather than text has become much simpler. Combined
with John Maeda’s (2006) laws of simplicity (e.g. “Simplicity is about subtracting the
obvious and adding the meaningful”), the result was a user-interface design that, through
many rounds of iteration, required, in our final deployment, minimal training (3 hours)
of local users.
Bus Me
Count Me
1 2
Survey Me 3
Figure 4.8 | Mobile user interface of Share My Bus Dhaka: bus position input (left), counting ! ! passengers including females (middle), 9-question rider survey (right)
58

Easy to deploy
Perhaps the most difficult part of the workflow was designing the mobile applications to
be usable in the context of riding a bus in Dhaka, which can be quite a chaotic experience.
This includes running to catch the bus, shoving one’s way to the back to find a seat,
paying while aboard, shouting for stops, and then alighting safely from a still-moving
vehicle. The only practical way to know the viability of the app in such a context was to
pilot them and rapidly iterate while in the field.
Figure 4.9 | (Left) Testing application in the Kewkradong office; (Right) Testing application on bus in Dhaka Author’s field study, January 2012)
In such a high stress context for data collectors, what became apparent was that every
small step that could be eliminated, especially in setting up the flocksourcers to collect
data, meant fewer errors during the data collection process and more data that could be
collected. To do so, we employed techniques like (1) persistent data i.e. storing previously
used information like user login name and bus number and (2) strictly limiting the
onboard survey to nine questions that could be flipped through on one screen.
59

A Thousand Riders Surveyed
Figure 4.10 | Locations of where 1,014 riders were surveyed onboard buses in Dhaka
When we first launched this experiment, we had no idea how it would turn out. The results surpassed even our highest expectations.
Even after my initial visit to Dhaka in July, it was unclear whether the most basic
technical capabilities e.g. location-sensing could function with a similar level of accuracy
and precision as that of more technically advanced contexts like Boston, especially given
the poor state of the physical infrastructure. Once it became clear that the mobile data
infrastructure in Dhaka was quite robust and that smartphones could be appropriately
adapted for use by locals even on the most crowded buses, the potential of a viable data
collection technique for buses in Dhaka using smartphones was revealed.
60

! ! Figure 4.11 | 4 of 8 members of pilot flock recruited and organized by Kewkradong, March 2012
Our original goal was modest: identify the deployment scale required to develop an
accurate portrait of the two routes' primary operating characteristics, including speeds,
crowding, adherence to routes and their variation across times and days. In addition, we
wanted to test the viability of using the technology for carrying out on-board surveys. The plan was to cover the routes for a week, aiming to achieve a minimum of 120 one-way
vehicle rides, in total.
Figure 4.12 | Team data collection results of Kewkradong flocksourcing pilot, March 2012
120! 100!onboardsurveys"
8!flock members"
team target"
270 -----
one-way rides"
resources"
1!week"
----- +10,000
passenger counts, bus
location points
1,014
The members of the flock ultimately carried out 270 rides, recording over 10,000
passenger counts and bus location points. In addition, they used the devices to survey,
on-board, over 1,000 users. Three flocksourcers rode the bus for over 2,000 minutes in
that period, equivalent to over 33 hours.
As mentioned earlier in this chapter, the sheer volume of data that was collected by this
small pioneering flock surpassed our highest expectations. That our flock collected any
data was in part a small miracle in itself. The flocksourcing pilot was delayed by a week
due to a violent hartal, or political protest, that banned all motorized vehicles, including
for the first time, buses, from the road. The political uncertainty underscored some of the
inherent risks that bus commuters in Dhaka take as well as those of potential
flocksourcers. What will be important to determine for future applications of
flocksourcing is if this pioneering flock was more productive than what can be expected
on average, even with more experience.
61

Monitoring data collection in real-time
One of the biggest advantages of mobile-driven, real-time data collection techniques is
that they can be monitored almost instantaneously, from anywhere with an Internet
connection. In our particular application, with the help of a few online dashboards, we
could monitor and analyze the data collection efforts that were happening in Dhaka from
12,500 kilometers away in Boston. Thanks to proactive communication by the team from
Kewkradong, we were able to provide feedback (e.g. “try to ride more during peak rush
hour times”) in the midst of the weeklong data collection effort.
Figure 4.13 | Real-time bus data collection dashboard (Source: Kewkradong’s flocksourcing pilot, ! ! March 2012)
62

Data auditing through location tracing
Another benefit of our approach is its accountability. Location data are difficult to falsify
and, with the proper tools, easy to audit. We could easily deduce how the volunteers
were being organized, which bus routes they were riding, and which individual flock
members were performing better than others. The location data, linked to surveys and
passenger counts, add another layer of information that can help verify and validate data
collection and identify anomalies. In our particular week-long application, the data that
came in exhibited few outliers.
Figure 4.14 | A day’s worth of individual location traces (Source: Kewkradong’s flocksourcing pilot, March 2012)
Kb16
Kb10 Kb20 Kb7 Kb14
Kb13
Kb2
Kb8
63

A sample of what a week’s worth of flocksourced bus data may tell us
While the volume of data collected was impressive, could that data from a small flock collecting data for one week reveal potentially meaningful insights on the largely unmeasured Dhaka bus system?
The following figures 4.15-4.20 provide a first look at some of the early promising
possibilities:
(1) mapping unmapped bus routes for users and regulators (Figure 4.15),
(2) monitoring the average speed of the roads and identifying bottlenecks (Figure 4.16),
(3) understanding travel time patterns by times of the day and days of the week (Figure
4.17),
(4) breaking down bus riders by basic demographics (Figure 4.18), (5) layering one-way commutes of riders of a particular bus line to the bus route itself
(Figure 4.19), and
(6) identifying the relationship between crowding and user happiness and female
ridership (Figure 4.20)
Note that these figures should not be extrapolated to represent the entire bus system of
Dhaka, or of even the two principal bus lines that were targeted since they were just a
sample of some buses from a week’s worth of time. However, they may give a sense of the
level of precision that this approach may offer and how the data could be used by various
stakeholders in the future.
64

Geo-coded bus routes
Figure 4.15 | Bus traces by day and by line (Source: Kewkradong flocksourcing pilot, March 2012)
3-18-2012!Sunday!
3-19-2012!Monday!
3-20-2012!Tuesday!
3-21-2012!Wednesday!
3-23-2012!Friday!
3-24-2012!Saturday!
3-25-2012!Sunday!
Detour due to cricket matches
!
Cricket Stadium!
27
36
As far as this author could tell, there is no reliable existing map for Dhaka’s extensive bus
system (Mydigonto.com, at the time of this thesis, has a crude bus route planner for
Dhaka that is not map-based and seemed to be incorrect for the routes that we traced).
Bus riders in Dhaka normally rely instead on a powerful offline social network (e.g. people on the street and other riders) for bus information. While this pilot focused on
two main lines (Figure 4.15), No. 36 from Azimpur to Pallabi and No. 27 from Azimpur to
Uttara, one can imagine a more broad effort to flocksource all the lines in Dhaka
including the less well-known routes on the outskirts of the city and the more flexible
routes of mini-buses and even cycle rickshaws. The upshot could be the first digital bus
map of Dhaka that, layered with predicted travel times, themselves flocksourced, could
help users decide the optimum route based on time.
65

Bus (and potentially road) speeds Figure 4.16 | Bus speed map (Data source: Kewkradong flocksourcing pilot, March 2012)
AZIMPUR
PALLABI
UTTARA
While congestion may already be at gridlock levels during peak times in Dhaka despite a
low private motorization rate, it has been difficult to monitor precisely how the road
speeds change over the course of a day, and perhaps more importantly, how they are
changing from week to week as the population rapidly rises. Other techniques like traffic
counting can give some general indications but placing smartphone AVLs onto buses may
be one way to provide that level of precision in ‘real-time.’ If adopted widely, fleetsourced
buses could provide traffic data for the major roads in the city, since buses are ubiquitous
on those roads. Understanding bus (and potentially road) speeds on a daily basis may
help independent operators better time and even coordinate their deployments
appropriately. Monitoring road speeds on a longer timescale may help regulators target
experiments to improve speeds at key bottlenecks during peak travel times.
66

Bus travel times
Figure 4.17 | Estimated one-way travel times for the 12 km route of Bus No. 27 from Azimpur to ! ! Azimpur (Data source: Kewkradong flocksourcing pilot, March 2012)
Uttara!
20 km!
1:25! Average!
1:47!
1:04!
*Data based on 42 Rides in March 2012!
Bad day!2:07!
0:43! Good day!
8 am! 10 am! 6 pm!
1:50!
Weekend!Weekday!
Azimpur!
27
For bus riders in Dhaka, it is difficult to understand why some trips take significantly
longer than others. As you can see from Figure 4.17, a 20 km commute from Azimpur to Uttara ranged in travel time (does not include waiting time) from a low of 43 minutes to a
high of 2 hours and 7 minutes. In Dhaka, travel times are influenced by the time of day,
day of week and route through the city since different parts of the city are closed on
different days of the week to alleviate traffic3. Knowing even the maximum and minimum
travel times may help improve user satisfaction; knowing the expected travel time at a
given moment (time of day, day of week, season of year) may even delight customers.
67
3 New Market, one of the main textile and goods markets located near Azimpur, is closed on Tuesdays and have half days on Wednesdays. The markets in Gulshan and Banani, the main commercial districts, are closed on Sundays and have half days on Monday. The weekend in Dhaka incidentally falls on Friday and Saturday.

Bus rider demographics
Figure 4.18 | Bus rider demographics based on onboard user survey (Data source: Kewkradong flocksourcing pilot, March 2012)
Young, Male, Captive, Mobile, Hates Crowding!
85% surveyed
btwn 24-34 years
16% female (of those counted)
57% ride at least 5
times a week
100% with a mobile phone (18% with
smartphone, 50% with internet-
enabled multimedia phone)
Most common complaint about buses (23%)
Long waits (21%) and Too
few buses (20%) were also common
Since buses aim to serve the general public and are often the only mobility option for
commuters in Dhaka to travel longer distances, it is important to understand who they
are currently serving, and by subtraction, who they are not. Based on our limited survey
of 1,014 riders, the routes we targeted seemed to serve a younger, male and mobile-phone
enabled population. Older and female members of the population were either
underrepresented in the survey, a key challenge for flocksourcing survey data, or if they
were simply underserved by the bus system. Since our flocksourcers also counted female
riders, it seems more likely that the buses were underserving females since 1 in 6 riders
both counted and surveyed were female. Bangladesh is a predominantly Muslim country
where the mobility of women is often restricted. Understanding the demographics of
existing bus riders may help operators and regulators market and develop better services
to existing and future bus riders, especially those that are most likely to become car
owners.
68

Bus routes and riders’ commutes Figure 4.19 | Commutes served by the No. 27 Azimpur to Uttara bus line based on riders home ! ! and work locations (Data source: Kewkradong flocksourcing pilot, March 2012)
Azimpur!
Uttara!
4%! 3%!
7% Full Azimpur to
Uttara Commute!
Azimpur!
Uttara!
Banani!
Dhanmondi!
3%!
7% !
6% !
25% Banani Work
Commute!
2%!Khilkhet!
<1% 2.5 Hour Gazipur
to Azimpur Comute!
Azimpur!
Gazipur!
<1%!
27 Bus route!
Since we both geo-coded bus routes and asked riders for their home and work locations, it
was possible to deduce how many riders were dependent on a particular bus line for a
portion of, or the entirety of their commutes. Riders themselves may have chosen home
and work locations based upon the bus routes themselves. The No. 27 line featured in
Figure 4.19 originates in Azimpur and ends in Uttara with stops at two major hubs in
Dhanmondi, the education center of the city and Banani, the commercial heart of the city.
38% of all riders surveyed on the No. 27 line traveled between 2 of those 4 locations, with
25% working in Banani. Of the riders surveyed, 44% lived on the ends of the lines (26% from Uttara and 18% from Azimpur) with 7% traveling the entire 20 km journey. The
longest commute measured on this bus line was a 40 km, 2.5 hour one-way journey
between Gazipur, a bus stand north of Dhaka, and Azimpur. This data could potentially
be helpful for regulators to estimate the impact of any changes to the 59 or so bus routes
that are currently in operation and perhaps for entrepreneurs to estimate the commercial
opportunity of providing last-mile services (e.g. mini-buses, taxis, CNGs, cycle rickshaws,
tandem cycles) for riders of this route.
69

Bus size, happiness, crowding, and female ridership Figure 4.20 | Bus size, rider happiness, crowding and female ridership on 2 main bus companies ! ! serving the No. 27 route, BRTC and VIP (Data source: Kewkradong flocksourcing pilot, March ! ! 2012)
2.3!
52 seats per bus
39 seats per bus!
3.6!
VIP!
BRTC!
bus size rider happiness
bus crowding
female passengers
With motorization a pressing concern, understanding how to keep current bus riders
happy may be the most valuable use of flocksourced data. One of the strongest
correlations seen in this sample of data was between user happiness and crowding, a
dynamic studied by Katz and Rahman (2010). While user happiness seemed to decline
when crowding was at its highest, a deeper dive into the data revealed that specific
companies like the government-owned BRTC that had launched a fleet of bigger, more
modern buses which had fewer people standing demonstrated significantly higher
happiness levels than their peers e.g. VIP. Moreover, less crowding on the BRTC buses
seemed to be correlated with more female riders, a potentially important development
given the relatively low ridership of females on Dhaka’s buses. With the current focus in
Dhaka on a Bus Rapid Transit (BRT) system, perhaps flocksourced data can begin to
unveil a bigger demand for a Bigger Bus Transit (BBT) system instead. Despite the
slowness of the roads, travel times and happiness did not seem to be as closely correlated to crowding and happiness.
70

CONCLUSION
Dhaka Will (Soon) Have a Bus Map Flocksourcing as a technique to rapidly collect bus data in a challenging urban
environment like Dhaka can work today. In contrast to existing analog tools that are
usually employed in Dhaka, digital smartphones paired with human sensors can quickly
and scalably collect multidimensional layers of data in precise detail. The volume and
range of data that was collected in this pilot is promising, especially in an environment
where data is largely unavailable.
Despite this potential, it is at the moment unclear who in Dhaka or elsewhere will support
the data collection in the future, especially with low smartphone penetration rates that
would make pure citizen-led efforts expensive. Based on this initial demonstration,
though, there are a few possibilities of how flocksourcing (and its sister technique
fleetsourcing) can be utilized by various stakeholders in Dhaka in the near future.
For users, a modest flocksourcing effort can create the first comprehensive bus map of the
city, outlining the 60 major routes that are operated by the more than 45 different bus
companies. Despite the informality of the system, the map can potentially outline the
major stops and transfer points. With additional rides and the help of machine learning,
the map can also include estimated travel times by time of day and day of week as well as
crowding levels. The key questions are the accuracy of the location sensing and more
importantly, the format of the map for a largely analog rider base e.g. interactive and web-based or traditional paper-based. Assuming similar levels of productivity as
demonstrated in this study, the estimate to collect data for a baseline bus map of the city
is $1,000 with 5 flockmembers over the course of a week. An enhanced bus map with
travel time and crowding level profiles will require additional resources, up to $15,000,
30 flockmembers and take 4 weeks to complete.
71

For operators, smartphones can be retrofit into onboard automatic vehicle locators
(AVLs) to help operators track their fleets through the often unpredictable road
environment. If there is sufficient adoption and real-time locations are shared between
operators, an operator could time the deployment of their vehicles to avoid bunching,
congestion and adapt quickly to the much too common road emergencies that buses in
Dhaka are often involved in. If there is sufficient adoption and the data is made available to the public (via a standard application programming interface, also known as an API),
real-time wait and travel could be estimated with some additional effort (e.g. machine
learning). The smartphone AVLs could potentially also be utilized as a Wi-Fi hot spot
(through an option called tethering), an amenity that may be valued by students and
professional with commutes over an hour. As previously mentioned, the cost of
retrofitting a smartphone as an AVL (as low as $150 per bus) is significantly less than the
cost of the built-in AVL employed in developed contexts like New York ($15,000 per bus).
Nonetheless, the cost of retrofitting a significant portion of the 6,500 bus fleet is non-
trivial especially for operators who have little incentive to invest in capital improvements.
The most likely implementation is a retrofit of the government-owned and operated
BRTC fleet which may grow to as many as 1,000 in the next few years. A preliminary
baseline estimate of such a retrofit is $150,000 annually and may be sponsored by
outside organizations like JICA, which is reported to have invested in electronic ticketing
and smartcards for the new BRTC fleet. Adoption by the top 45 bus companies which
own 75% of the bus fleet would cost something closer to $750,000 and require training
for the extensive group of fleetsourcers and a solution to power or recharge the
smartphones on a daily basis.
For regulators, a modest and periodic flocksourcing effort could monitor bus rider
satisfaction and accessibility, leading indicators of how likely the bus ridership base will switch to private car ownership and how equitably the public transit system serves the
mobility needs of everyone in Dhaka. If deployed on a regular basis, this measurement
effort can be the first effort towards a more iterative Dhaka, providing benchmarks for
bus-related experiments to compare against, especially as they relate to rider happiness
and usage patterns. With both a bus rapid transit and an elevated mass transit system in
the works, this data could help inform the planning of those future routes and also begin
to measure their impact on riders’ perceptions. A key challenge towards a successful
implementation is ensuring against flock bias, or the over- and under-representation of
some groups e.g. women and the elderly in the ridership samples. An onboard survey of a
thousand riders would require 5 flockmembers for a week and is estimated to cost $1,300
for the first survey and $600 for each subsequent survey. A survey of 10,000 riders
would require 30 flockmembers for 4 weeks and cost $9,000 for the first survey and
$6,000 for each subsequent survey.
72

With some sustainable technical expertise from abroad (see Appendix A), a committed
flocking partner on the ground, and a little bit of luck, all of these options are possible
with a modest amount of investment. Together, they present a possibility that Dhaka
could be retrofit with one of the more advanced bus information systems in the world and
perhaps inspire a new vision of Dhaka’s urban transport future, a vision that does not
include accelerating motorization.
Figure 5.1 | Summary of potential bus intelligence products in Dhaka
!
bus info-product Option A
Bus Route MapOption B
Smartphone AVL
Option C
Bus Rider Surveys
stakeholder
Riders Operators Regulators
data collection technique Flocksourcing Fleetsourcing Flocksourcingdata collection technique
(Flock size from 5-30 members)
(Fleet size from 1,000-5,000)
(Flock size from 5-30 members)
data collection frequency (suggested)
Every 6 months Everyday Every 3 months
metrics collected Geo-coded Routes, Stops (if any); (Travel times, Crowding)
Live Bus Locations Satisfaction, Home and Work Locations, Demographics
cost (detailed breakdowns in appendix)
$1000 for base map; $15,000 to include travel times and crowding
$150,000 annually for 1,000 BRTC buses; $750,000+ annually for 4,900 buses owned by Top 45 companies
$1300 for 1,000 survey sample ($600 for subsequent surveys); $9000 for 10,000 survey sample ($6,000 for subsequent surveys)
time to collect 1 - 4 weeks N/A 1 - 4 weeks
add’l benefits Consumer marketing for buses
Live wait times, traffic (if open); Wi-Fi hot spot
Baseline measurements for experimentation
outstanding questions Location Accuracy; Analog or Digital Output
Power + Battery Life; Training
Flock Bias
73

Appendix | The business plan for the Urban Launchpad, a start-up co-founded by this author to scale up urban data collection efforts in places like Dhaka
GENERATING BIG DATA INSIGHTS FOR CITIES WITH LESS DATA
The escalator pitch! Big data is destiny for cities today. With it, a city can manage its limited resources from water to roadspace to energy. Cities that can afford it like Singapore are spending $100B (Source: Pike Research 2011) over the next 10 years to build robust infostructures to optimize their cities with data, potentially saving them hundreds of millions of dollars each year.
We, at the Urban Launchpad, are building those same capabilities on resources that exist in almost every urban area on the planet –smartphones, mobile data networks and organized groups of people and fleets - to provide those same insights at a fraction of the price - and perhaps more importantly, a fraction of the hassle.
OUR FIRST PRODUCT
HOW IT WORKS
Smartphone sensors
Clouds
CUSTOMERS
Machine Learning Visualizations
DCBAGO TO: WWW.URBANLAUNCHPAD.ME
the cheapest and easiest
the world --- -------- A BUS INTELLIGENCE SERVICE IN DHAKA
TECHNOLOGY +
YOUR FLEET
1!
Ongoing data collection!
TECHNOLOGY +
OUR FLOCKS
2
One-time data collection!Private bus and mini-bus operators, !Paratransit (taxis, auto-rickshaws
cycle rickshaws)!
City government, non-profits, academic institutions, new mobility
startups, citizen groups!
74

PRICING
$50* per seat per month"
$50* per flock member per day"
*50% discount if data is made open to public for mash-up"
REVENUE POTENTIAL (FLEET ONLY)
$50per seat per month"
6,000"buses in Dhaka"
5%10%"25%"50%"75%"100%"
$180K"$360K"$900K"$1.8M$2.7M$3.6M"
Bus tracking hardware retails in US for $8-$20K per bus"
Retails to less than $3 per survey using pilot results"
penetration rate"
x
annual revenue"
PUBLIC INFOSTRUCTURE
BEST BUS MAP IN THE WORLD
public!
public!
public!public!
public!
30 buses (position, speed)!
50 buses (position, speed)!
flock of 25, 10 days(satisfaction)!
flock of 15, 5 days (crowding)!
flock of 30, 15 days (counts)!
our teamfounders !! Albert Ching is a former Googler who helped Google Maps become #1, Stephen ! ! Kennedy is an award-winning designer, and Muntasir Mamun (Dhaka-based) is an ! ! experienced social entrepreneur who has organized 1,000 persons in an annual coastal ! ! clean-up in Bangladesh. field partner! We launched our first Urban LaunchLab in Dhaka in January with Kewkradong, a team ! ! of 20 out-of-box cycling evangelists, who will help co-develop and field test our tools. advisor ! ! Chris Zegras is a professor of city planning and sustainable transport at MIT
75

Works Cited
Archaya, S and Morichi, S (2007). “Motorization and Role of Mass Rapid Transit in East Asian Megacities” IATSS Research, 31(2), 6-16.
Asian Development Bank (2003). Reducing Vehicle Emissions in Asia: Policy Guidelines for Reducing Vehicle Emissions in Asia: A Set of Six Policy Guidelines. Asian Development Bank, Manilla.
Asian Development Bank (2011). Key Indicators for Asia and the Pacific 2011. Published by the Asian Development Bank.
Asian Development Bank (2011). Greater Dhaka Sustainable Urban Transport Project. Barter, P (1999). An International Comparative Perspective on Urban Transport and Urban Form in Pacific Asia: the Challenge of Rapid Motorisation in Dense Cities. PhD thesis, Murdoch University.
Barter, P (2004). “Transport, Urban Structure and ‘Lock-in’ in the Kuala Lumpur Metropolitan Area” IDPR, 26 (1), 2004.
Borrell Associates (2011). 2011 Local Automotive Advertising Outlook.
Bose, R and Sperling, D (2003). “Transport in Delhi, India: Environmental Problems and Opportunities” Transportation Research Record, 1815.
Bhuiyan, A (2007). Study on Bus Operation in Dhaka City. Air Quality Management Project, Department of Environment, Dhaka, Bangladesh.
BRTC (Bangladesh Road Transport Corporation) (2012). BRTC website.
CPPCC (Chinese People’s Political Consultative Conference) (2010). The Standing Committee of the Beijing Committee of the Chinese People’s Political Consultative Conference. China Daily, Beijing, June 2010.
City Mayors Statistics (2012). The World’s Largest Cities and Urban Areas in 2020.
Crystal, D (2003) [1995]. The Cambridge Encyclopedia of the English Language (Second ed.). Cambridge, UK: Cambridge University Press, 109.
Dargay J (2001). “The Effect of Income on Car Ownership: Evidence of Asymmetry” Transportation Research Part A, 35, 807-821.
Davies, S (2011). Bangladesh May Offer 3G Licenses in 2012. Retrieved May 16, 2012 from the Cellular News website: http://www.cellular-news.com/story/50398.php.
DUTP (Dhaka Urban Transport Project) (1998). Phase II, Draft Final Report.
Efroymson, D (2011). Dhaka’s BRT Walkability Strategy: Ensuring that Dhaka’s Transportation Infrastructure is Pedestrian-Friendly. Regional and Sustainable Development Department, Sustainable Infrastructure Division, Asian Development Bank.
Enam, A and Chowdhury, C (2011). “Methodological Issues in Developing Mode Choice Models for Dhaka City” Journal of Transportation Research Board, 84-92.
Enge, P et al (2001). Improving GPS Coverage and Continuity: Indoors and Downtown. Retrieved Jul 22, 2012 from http://waas.stanford.edu/~wwu/papers/gps/PDF/engion01.pdf
Erickson, T (2010). Geocentric Crowdsourcing and Smarter Cities: Enabling Urban Intelligence in Cities and Regions. 1st Ubiquitous Crowdsourcing Workshop at UbiComp, 2010.
Erickson, T and Kellogg, W (2000). “Social Translucence: An Approach to Designing Systems that Mesh with Social Processes” In Transactions on Computer-Human Interaction, 7 (1), 59-83.
Estellés, A and González, L (2012). “Towards an Integrated Crowdsourcing Definition” Journal of Information Science (in press).
Farrell, R, Danis, C, Erickson, T, Ellis, J, Christensen, J, Bailey, M, Kellogg, W (2012). A Picture and a Thousand Worlds: Visual Scaffolding for the Developing World. International Journal of Handheld Computing Research.
Ford, B (2011). A Future Beyond Traffic Gridlock. Ted Talk, filmed March 2011.
76

Gakenheimer, R (1999). “Urban Mobility in the Developing World” Transportation Research Part A, 33, 671-689.
Google (n.d.). Google Maps for Other Mobile Devices: Location Source and Accuracy.
Hasnine, M (2011). Evaluation and Development of Bus Based Public Transport in Dhaka city. 4th Annual Paper Meet and 1st Civil Engineering Congress, December 22-24, 2011, Dhaka, Bangladesh.
Hickman, R, Fremer, P, Breithaupt, M, Saxena, S (2011). Changing Course in Urban Transport: An Illustrated Guide. Published by the ADB and GIZ.
Hickman, R and Bannister, D (2011). “Transitions to Low Carbon Transport Futures. Strategic Conversations from London and Delhi” Journal of Transport Geography, Forthcoming.
Hoque, M, and Hossain, T (2004). Augmentation of Mass Transit Mode in Dhaka, Bangladesh. CODATU XI Conference Paper. Bangladesh University of Engineering and Technology.
Howe, J (2006). “The Rise of Crowdsourcing” Wired, 14(6), June 2006.
International Telecommunications Union (2011). World Telecommunication/ICT Indicators Database. Retrieved Jun 3, 2012 from ITU website http://www.itu.int/ITU-D/ict/statistics/.
James, J (2009). “Leapfrogging in Mobile Telephony: A Measure for Comparing Country Performance” Technological Forecasting & Social Change, 76, 991–998.
JICA (Japan International Cooperation Agency) (1997). The Master Plan of Urban Transport for Hanoi City in Viet Nam, Tokyo.
Katz, D and Rahman, M (2010). “Levels of Overcrowding in Bus System of Dhaka, Bangladesh” Transport Research Record, 2143, 85-91.
Kennedy, S (2012). The Big Data-Information-Knowledge Continuum: Experimental Techniques in the Visualization of Flocksourced Bus Data. MIT, Master of City Planning Thesis.
Leather, J, Fabian, H, Gota, S, Mejia, A (2011). Walkability and Pedestrian Facilities in Asian Cities: State and Issues. ADB Sustainable Development Working Paper Series, 17, Feb 2011.
Mannan, M and Karim, M (1999). “Road Accidents in Metropolitan Dhaka, Bangladesh” IATSS Research, 23 (2), 90-98.
mBillionth South Asia Awards (2011). Mobile for Masses: South Asia’s Best Mobile Innovations 2011. Published by the Digital Empowerment Foundation.
Mobile Phone Bangladesh. Website. Retrieved May 16, 2012 from http://www.mobilephonebd.com/symphony-mobile/symphony-mobile-price-list-bangladesh.html
Next Bus (n.d.) About Next Bus Predictions. Retrieved May 11, 2012 from http://www.nextbus.com/help/aboutNextBusHelp.shtml.
Nielson, AC (2005). Was available online at http://kr.en.nielsen.com/pubs/2005_q1_ap_car. Retrieved on 28 November 2008.
Olsson, L and Thynell, M (2004). Bangladesh Road Transport Corporation (BRTC) Bus Project in Dhaka. Sida Evaluation 06/38, Department for Infrastructure and Economic Cooperation.
Our Mobile Planet (2011). Retrieved on May 11, 2012 from http://www.ourmobileplanet.com/.
Pucher, J, Peng, Z, Mittal, N, Zhu, Y, Korattyswaroopam, N (2006). “Urban Transport Trends and Policies in China and India: Impacts of Rapid Economic Growth” Transport Reviews, 27 (4), 379–410, July 2007.
Rahman, M (2008). “Future Mass Rapid Transit in Dhaka City: Options, Issues and Realities” Jahangirnagar Planning Review, 6, 69-81, June 2008.
Rojas, F (2012). Transit Transparency: Effective Disclosure through Open Data. Transparency Policy Project, Harvard Kennedy School, June 2012.
San Francisco Planning Department (n.d.). Department website.
Shafi, S (2010). Implementation of Dhaka City Master Plan. Daily Star, Feb 23, 2010. Retrieved from Daily Star website at http://www.thedailystar.net/suppliments/2010/02/ds19/segment1/plan.htm.
77

Steinfeld, A, Zimmerman, J, Tomasic, A, Yoo, D, Dar Aziz, R (2011). Mobile Transit Rider Information Via Universal Design and Crowdsourcing. Presentation at TRB 2011.
STP (Strategic Transport Plan for Dhaka) (2005). Final Report, Louis Berger Group and Bangladesh Consultants Ltd., Dhaka.
TCRP (Transit Cooperative Research Program) (2008). AVL Systems for Bus Transit: Update TCRP Synthesis 73, Sponsored by the Federal Transit Administration.
Timilsina, G and Shrestha, A (2009). “Transport Sector CO2 Emissions Growth in Asia: Underlying Factors and Policy Options” Energy Policy, 37 (2009), 4523-4539.
United Nations (2003). World Urbanization Prospects: The 2003 Revision. Published by the United Nations Department of Economic and Social Affairs.
Vasconcellos, E (1997). “The Making of the Middle Class City: Transportation Policy in São Paulo” Environment and Planning A, 29, 293-310.
Vasconcellos, E (2001). Urban Transport Environment and Equity: The Case for Developing Countries. London: Routledge.
Wikipedia (2012). 2G and 4G. Retrieved from http://en.wikipedia.org/wiki/2G and http://en.wikipedia.org/wiki/4G
Willoughby, C (2000). “Singapore's Motorization Policies 1960–2000” Transport Policy, 8 (2), 125–139.
Work for a Better Bangladesh (2012). Wrong-Minded Modernization: Rickshaw Bans. Work for a Better Bangladesh website. Retrieved May 22, 2012 from http://dhaka-rickshaw.blogspot.com/2011/04/wrong-minded-modernization-rickshaw.html.
World Bank (2005). Dhaka Urban Transport Project.
World Bank (2009). South Asia Political Economy and Governance Issues Note No. 1: Urban Bus Operations in Dhaka.
World Carfree Network (n.d.) Dhaka’s Rickshaws Still Threatened. World Carfree Network website. Retrieved May 22, 2012 from http://www.worldcarfree.net/dhaka/index.php.
Wu G, Yamamoto T, Kitamura R, (1999). “Vehicle Ownership Model That Incorporates the Causal Structure Underlying Attitudes Toward Vehicle Ownership” Transportation Research Record, 1676, 61-67.
Yusuf, M, Alam, Q, Coghill, K (2010). “The Mobile Phone Market in Bangladesh: Competition Matters” Journal of African and Asian Studies, 2010 (45), 610.
Zhao, J (2012). Transport—Maker or Breaker of the Cities. Lecture in APSC 364 Applied Sustainability at the University of British Columbia, March 6, 2012.
78