a two-step method for the optimization of antenna azimuth tilt and frequency planning in ofdma...
TRANSCRIPT
8/2/2019 A Two-Step Method for the Optimization of Antenna Azimuth Tilt and Frequency Planning in OFDMA Multihop Netwo…
http://slidepdf.com/reader/full/a-two-step-method-for-the-optimization-of-antenna-azimuth-tilt-and-frequency 1/6
A Two-Step Method for the Optimization of AntennaAzimuth/Tilt and Frequency Planning in OFDMA Multihop
Networks
Fernando Gordejuela-SánchezCWIND (Centre for WirelessNetwork Design, http://cwind.org)
University of Bedfordshire, Luton, UK+44 (0)1582 743288
David López-PérezCWIND (Centre for WirelessNetwork Design, http://cwind.org)
University of Bedfordshire, Luton, UK+44 (0)1582 743288
Jie ZhangCWIND (Centre for WirelessNetwork Design, http://cwind.org)
University of Bedfordshire, Luton, UK+44 (0)1582 743288
ABSTRACT
During the network planning process, it is very important toidentify the key network design factors and define how to takethem into account to achieve optimally performing networks. Theintroduction of Relay Stations (RSs) in OFDMA-based networkswill bring numerous advantages such as coverage extension and
capacity enhancement due to the deployment of new cells and thereduction of distance between transmitter and receiver. However,the use of RSs will also bring new challenges to the network designers, for example, interference management in multihopcommunications. This work establishes the fundamentals of a newapproach that will adapt the tilt, azimuth, and frequencyassignment in OFDMA networks - in the form of subchannelplanning - according to the changing conditions of the traffic andthe radio channel in a novel two-step process for network design.An example of deployment is presented in this paper.
Categories and Subject Descriptors
C.4 [Performance of Systems]: Design studies, modeling
techniques, reliability, availability, and serviceability.
General Terms
Algorithms, Performance, Design.
Keywords
Network planning, optimization, interference avoidance, antennatilt, azimuth, OFDMA, Multihop.
1. INTRODUCTIONOFDMA is a physical layer technology that supports several keyfeatures necessary for delivering broadband services at highmobility, for example, scalable channel bandwidth, high spectralefficiency, simple implementation and multi-path robustness due
to subcarrier orthogonality [1]. LTE (downlink) and MobileWiMAX are broadband Wireless Metropolitan Area Network
(WMAN) based1on OFDMA capable of providing wide coveragearea, flexibility, high data rates, Quality of Service (QoS) andseamless mobility between different networks.
The relay topology is a kind of multihop communication thatintroduces RSs into the network, which forward the informationfrom some Mobile Stations (MSs) to the legacy Base Stations
(BSs) that are connected to the core network. The BSs willprovide resources to both the RSs and the MSs to which isdirectly connected. The RS will help to extend the coverage andenhance the capacity of the system [1]. This results in morereliable communications with larger throughput, capacityimprovement and terminal power saving. However, there are alsosome important challenges that the network designers must facebefore deploying a relay network. A major concern is themanagement of interference [2], which can considerablydowngrade the performance of the system. Therefore, the power,frequency and antenna configuration of the RSs must be carefullyselected to mitigate this problem.
In order to successfully compete to other existing and future wire-
line and wireless services, the network designers need to fullyconsider the technical constraints that influence the whole designprocess of this kind of networks: IEEE 802.16j. The number of combinations of network elements and parameters that can beconfigured by the operator (e.g. antenna tilt/azimuth, subchannelassignment) constitutes the solution space of the design process.The size of such space determines the degree of complexity of finding appropriate configurations. Since, in WMAN scenarios,the number of options is large, it is very unlikely that the optimalsolution can be found using a manual method [3]. The problem iseven more complex with the relay-based configuration [2].Therefore, automated procedures for network design are desirable.
Some approaches on technologies such as GSM suggest the use of Radio Frequency Planning (RFP) in order to mitigate interference
and enhance the system performance [4] [5]. Similarly, OFDMAsupports reconfiguration of the subchannel usage with differentfrequency reuse schemes and subchannel allocation techniques inorder to mitigate intercell interference. Some of these strategiesare proposed in the existing literature on multihopcommunications. However, they only consider fixed reusepatterns or fixed assignment of subchannels in regular scenarios
This work is supported by the EU FP6 “RANPLAN-HEC”project. Grant number MEST-CT-2005-020958.
Permission to make digital or hard copies of all or part of this work forpersonal or classroom use is granted without fee provided that copies arenot made or distributed for profit or commercial advantage and thatcopies bear this notice and the full citation on the first page. To copyotherwise, or republish, to post on servers or to redistribute to lists,requires prior specific permission and/or a fee. IWCMC’09, June 21–24,2009, Leipzig, Germany. Copyright © 2009 ACM 978-1-60558-569-7/09/06...$5.00

8/2/2019 A Two-Step Method for the Optimization of Antenna Azimuth Tilt and Frequency Planning in OFDMA Multihop Netwo…
http://slidepdf.com/reader/full/a-two-step-method-for-the-optimization-of-antenna-azimuth-tilt-and-frequency 2/6
[6][7][8]. On the other hand, antenna azimuth and tiltoptimization has been widely investigated as main part of advanced network planning and optimization tools [9][10][11],especially in the case of UMTS or other CDMA based networkswhere a frequency reuse factor of 1 is used. Nevertheless,frequency planning and tilt/azimuth configuration involvedifferent reconfiguration costs, and although some approaches for
a joint formulation can be found in the existing literature e.g. [12][5], they focus on special cases or other technologies, and do notconsider a precise formulation and computationally efficientmethodology. This work goes beyond the study of fixed framestructures, and establishes the fundamentals of a novel approachthat exploit the flexibility of the OFDMA physical layer byadapting the antenna azimuth/tilt and subchannel assignment,according to the changing conditions of the traffic and the radiochannel. We propose a two-step method with the use of staticMonte Carlo simulation that will allow intense System Level
Simulations (SLSs) in a multihop environment.
The paper is organized as follows. Section 2, introduces theOFDMA technology. In Section 3, the optimization model used inthis work is introduced. In Section 4, an example of deployment
analysis is given. Finally, the conclusions are drawn in section 5.
2. OFDMA TECHNOLOGYIn OFDMA the available bandwidth is formed by orthogonalsubcarriers, which are grouped into subchannels [1]. In the timedomain, the frame is divided in several symbols. The slot is theminimum frequency-time resource that can be allocated by thebase station. A single user is allocated a contiguous set of slotswith the same Modulation and Coding Scheme (MCS) calledburst. This particular matrix-like frame structure should be takeninto account in the interference model when designing a network.
In order to accommodate the relay links (or backhaul link) and theaccess links (or users link), the OFDMA frame can be fragmentedinto several pieces and some of them are allocated to the relaylinks and the others to the access links in different combinationsto avoid interference between communications. It is accepted thatin most of the cases more than three hops in the communication(two RSs) is not practical due to the low radio resource efficiencyand possible impairments in the communication such as delay [7].
In order to enhance the network performance, traditionalfrequency planning in the form of dynamic subchannel planning has recently been proposed for OFDMA networks [2], where acertain subset of subchannels is assigned to different sectors. Thisplanning aims to balance the network load and decrease theinterference levels, resulting this in a better system respond. Withthe addition of RSs, the network designers will also need to dealwith the interference between the new links created in the
multihop operation.
3. OPTIMIZATION FRAMEWORKIn general, the network design process consists of two parts,
planning and optimization. The concept of planning involvesfinding the quality of the network performance for a givenconfiguration, whereas optimization involves finding theconfiguration for which the network quality is optimal. Thenetwork planning and optimization problem is NP-hard as it isdifficult to find a theoretical optimum in polynomial time [3].
There are several methods and algorithms in the existing literatureto perform the latter task, among them, meta-heuristic algorithmsseem a common approach, since they can provide optimal or atleast a good solutions in reasonable time [5][9]. They do notguarantee the optimality of the solution, but they often performwell in practice when the number of variables becomes large.
This work proposes a two-step process for wireless network design in which a first step performs a frequency planningprocedure, which is integrated within the simulation stage in aninner optimization loop. Other parameters that need a full network performance estimate are optimized in an outer optimization loop.Figure 1 shows the optimization framework introduced.
Figure 1. Optimization framework.
The first stage of the network life is the actual definition of the
network . In this phase different criteria are defined, includingdescription of the expected traffic, services, network topology,and deployment scenarios, as well as coverage, and capacity andquality requirements of the system. After this, a first manualnetwork adjustment based on data collection from a digital mapand propagation model tuning can be done.
Automaticadjust
Azimuth
Tilt
Network performance estimate – Static simulator
Best Server
Read Parameters
Interference Prediction
ueue Schedulin
Resource Allocation
CNIR Calculation
Throu h ut
Optimization Algorithm
End?
Automatic AdjustSubchannel usage
Conver ence?
QualityIndicator
All Sna shots?
Ca acity Demands
Y
Y
YN
N
N
Statistics
Optimization algorithm
Termination?
Y
N
Network Solution
Meets the need?
Prediction
YN
Manual adjust
Data Collection
Network Definition

8/2/2019 A Two-Step Method for the Optimization of Antenna Azimuth Tilt and Frequency Planning in OFDMA Multihop Netwo…
http://slidepdf.com/reader/full/a-two-step-method-for-the-optimization-of-antenna-azimuth-tilt-and-frequency 3/6
The following network planning and optimization phase normallymakes use of a tool for coverage and capacity predictions. Thistool should support traffic, propagation, Radio Resource
Management (RRM) models among other parameters. Theobjective of this tool is to estimate the network performance bycalculating Key Performance Indicators (KPI) that can representthe network quality of a certain configuration. Static network
simulation is often used in cellular network planning andoptimization due to the high computational load of dynamicsimulation [3].
In the described framework, we propose a static Monte Carlosimulation, which is an snapshot-based simulation approach. Asnapshot represents an instant of the network performance withfixed position of MSs. The simulator takes multiple snapshots tostatistically observe the network performance. Within each MonteCarlo snapshot, the throughput is calculated iteratively until theperformance of the system converges. Since the resources used byone user in one sector may interfere with other users, the systemconverges when it is stable in the selection of MCSs andassignment of resources. In order to fulfill the servicerequirements of the user, a Quality indicator (QI) helps to set the
adequate MCS for communication according to the performanceobtained in the previous iteration.
Link level simulation results are imported in the form of Look Up
Tables (LUT) for throughput calculation, which should includethe effects of different wireless channels and effects like fading.
3.1 Inner Optimization Loop: Frequency
PlanningAt each iteration of this process, the first automatic adjustment of the framework is done. After the system is initialized, the bestserver of each user is identified and a number of MSs areassociated to a sector ( M i). This is done by checking the pilotpower strength of all stations, including RSs. The MS service
requirements and the MCS estimated from the QI are taken intoaccount in the optimization process. This is done in two stages,interference prediction, and capacity demands, which aredescribed below. Note that the system intercell interference ischaracterized by a Restriction Matrix W [2] [9].
First of all, let us model an OFDMA network as a set of N sectorsS = {S0 , Si , S j ... S N−1 }, the users associated to a sector (MSi ={0, m
... M i − 1}) and K available subchannels {0, k ... K − 1}, whereeach sector Si requires a certain number of subchannels Di. Theinterference prediction stage characterizes the intercellinterference of the network, represented by the matrix W of size
N×N , in which wi,j represents the intercell interference betweensectors Si , S j.
Let us introduce the concept of Interference Event (Ie)
. Weconsider a set of RS as a subset of a sector Si ( RSi ={0, r ... Ri −
1}, RSi⊂ S). Two sectors, Si (server) and S j (neighbour), interfere
with each other ( Ieij ++) every time the power level of the carriersignal (from Si to a served user UE x) is smaller than the powerlevel of a neighbouring interfering signal (from S j to the sameuser) plus a given threshold (here 12 dB), and S j is not a RSattached to Si, (due to frame fragmentation) as the followingpseudocode indicates. The threshold Thres is a protection marginagainst interference and it is set by the operator according to itsplanning targets.
if ( Thres I C ji +< && S j ∉ RSi) then
Ieij ++
Note that the power level of the server and neighboring cells isreported using Measurement Reports (MRij). The system intercellinterference is modeled by W , as (1) indicates, in terms of percentage of time that cells interfere each other considering that
the same subchannel is used.
ij
ij
ij Mr
Iew = (1)
After the traffic class prioritization (queue scheduling), theoptimal number of required subchannels Di per sector Si, isapproximated in the capacity demand stage. The number of requested slots Rlm for each user m of sector Si is calculated, fromthe requested service capacity Rcm (kbps) and slot efficiency Sem
(kbps):
m
m
mSe
Rc Rl = (2)
As (3) indicates, Sem depends on the number of subcarriers persubchannel η sub, and the bearer efficiency η B(QI m) in terms of
bits/symbol. The bearer efficiency depends on the MCS assignedto the user, and it is selected according to the QI feedback fromprevious iterations. T frame is the frame duration.
frame
QI Bsub
mT
Se m )(η η ⋅= (3)
The requested subchannels Di per sector are calculated bydividing sum of all Rlm within the sector Si and the number of symbols per subchannel η sym (see (4)).
∑−
=
⋅=1
0
1 i M
m
m
sym
i Rl Dη
(4)
Once that the inputs has been obtained, the optimization routinecan be defined as a Mixed Integer Programming problem, wherethe objective is to find the optimal solution that minimizes thegiven cost function representing the overall network interference:
minwij
Di ⋅ D j
⋅ y i, j,k
k = 0
K −1
∑ j= 0
N −1
∑i= 0
N −1
∑ (5)
subject to:
x i,k
k =0
K −1
∑ = Di k ∀ (6)
x i,k + x j,k −1≤ y i, j,k k ji ,,∀ (7)
0,, ≥k ji y k ji ,,∀ (8)
} ,{ xi,k 10∈ k i,∀ (9)
where xi,k is a binary variable that indicates whether sector Si usessubchannel k or not. Constraint (6) imposes that sector Si must use
Di subchannels. Inequality (7) and (8) force that in an optimalsolution, yi,j,k = 1 if and only if both sectors Si and S j use

8/2/2019 A Two-Step Method for the Optimization of Antenna Azimuth Tilt and Frequency Planning in OFDMA Multihop Netwo…
http://slidepdf.com/reader/full/a-two-step-method-for-the-optimization-of-antenna-azimuth-tilt-and-frequency 4/6
subchannel k , and yi,j,k = 0 otherwise. Finally, the cost function isthe sum of the interference between all pair of sectors Si and S j taking into account all the frequencies k . Since the capacity of thesectors is not considered when the restriction matrix W is built,the interference restrictions wi,j must be divided by the number of used subchannels Di, D j in both interfered sectors Si, S j, and thus,the bigger the number of subchannels per sector, the smaller the
chance of interference.
3.2 Outer Optimization Loop: Antenna
configurationIn the outer loop, the optimization algorithm test differentconfigurations for different parameters that have higherreconfiguration costs in a real network evaluation - tilt or azimuth- and that need a full simulation of RRM procedures. Suchparameters need to be discrete, and the resolution chosen willdetermine the size of the solution space. The algorithm stopswhen a series of penalty functions based on some criteria (G =
{G0 , Gh ,... G H−1 }) that evaluate the network performance in a costfunction meet the needs of the service provider:
}min{1
0∑−
=
H
h
penhF (10)
The different criteria is evaluated over all the users, which may be
penalized differently. A binary variablem
hd in {0, 1} indicates if
user m is evaluated by the cost function related to criterion Gh (see(11)). For example, the MSs will be either in transmission UL orreception DL state and the designer may want to penalizedifferently these two states.
∑ ∑−
=
−
=
⋅=
1
0
1
0
N
i
M
m
m
h
m
pen pen
i
hhd f F (11)
For the penalization of the network performance in the cost
function, a threshold-based function avoids the excessiveinfluence of very good or very bad users. Maximal penalty is
applied when the value of the criterionm
ht from user m is smaller
than a lower bound T min and no penalty exists when it is higherthan a threshold T max. In between these two values the function islinearly decreasing as (12) indicates.
== )( m
h
m
pen
m
pen t f f hh
≤
≤<
−
−⋅
<
);(
);(
);(0
minmax
maxmin
maxmin
max
max
max
mm
h
m
mm
h
m
mm
mm
hm
m
h
m
hh
hh
hh
h
h
h
T t if f
T t T if T T
T t f
t T if
(12)
Furthermore, different criteria can be grouped according to themain KPIs. We consider CINR (C), throughput (T) and RSresilience (R) in a three objective minimization problem as shownin (13). Different subsets of criteria (G’,G’’,G’’’⊂G) related tothe particular KPI nature will determine different constraints tothe problem, e.g. services used or channel profile, which areshown in (14-17) and described below.
}
min{
1
0
1
0
1'''
0'''
''')(
1
0
1
0
1''
0''
'')(
1
0
1
0
1'
0'
')(
∑ ∑ ∑
∑ ∑ ∑∑ ∑ ∑−
=
−
=
−
=
−
=
−
=
−
=
−
=
−
=
−
=
⋅+
+⋅+⋅
N
i
R
r
H
h
r
h
r
R pen
N
i
M
m
H
h
m
h
m
T pen
N
i
M
m
H
h
m
h
m
C pen
i
ii
d f
d f d f (13)
subject to:
11'
0'
' =∑−
=
H
h
m
hd , m∀ (14)
max
1''
0''
'' 21 Ser d H
h
m
h ⋅≤< ∑−
=
m∀ (15)
21'''
0'''
''' ≤∑−
=
H
h
r
hd m∀ (16)
{ }1,0,, '''''' ∈m
h
m
h
m
h d d d ''','',', hhhm∀ (17)
F pen(C) represents the wireless connection by penalizing theeffective CINR perceived by the MSs over the burst. Thethresholds T min and T max can be set to the CINR criterion for theminimum and maximum MCS in the LUTs.
The assumptions about the expected users made by the network provider in the network definition, such as the user profile andspeed, influence the CINR calculation. Different MSs profilesmay require different costs for the system due to the differentchannel conditions. Therefore the network designer may penalizeeach of them differently (note that different LUTs will apply inthe SLS). Since each user will be in UL or DL and in certainchannel conditions, constraint (14) indicates that only one penaltyfunction will be applied.
In OFDMA different users can have the same “connectivity”, byhaving similar CINR over their bursts, but they can have differentburst sizes and thus, not the same throughput. The overall network
performance will therefore depend on the service requirements,bandwidth available, scheduling and frequency reuse. As a result,a separate QoS indicator is needed in the cost function.
F pen(T) is the penalty function for the MSs throughput. T min andT max can be set to the maximum and minimum throughput requestfor each service. The use of this factor in the cost functionprovides a more flexible network design in which differentbusiness plans, based on certain services for some areas, can beapplied. Constraint (15) indicates that the MS will use at least oneservice DL or UL, and a maximum of services (Ser max) in both ULand DL which can be penalized in different ways. The servicessupported by our simulator module are VoIP, video conference,web browsing and FTP.
F max can be set differently to the CINR criteria to give thisobjective more or less importance. Note that the final throughputperceived by a MS attached to a RS depends on two links, BS-RSand RS-MSs.
F pen(R) penalizes different degrees of network resiliency. In theevent of having a failure in a RS, other RSs may cover the newempty area by extending the coverage of an alternative station. Inaddition, the RSs previously attached to the faulty station need toreconnect to a new one. These procedures incur in reconfigurationcosts that are considered in this objective.
8/2/2019 A Two-Step Method for the Optimization of Antenna Azimuth Tilt and Frequency Planning in OFDMA Multihop Netwo…
http://slidepdf.com/reader/full/a-two-step-method-for-the-optimization-of-antenna-azimuth-tilt-and-frequency 5/6
During the network planning some failure events can be simulatedfor each configuration. A failure in the multihop communicationis more likely to happen for weak relay links connections. Note in(13) that the performance in this criterion is penalized over theBS-RS link, and therefore over the subset of RSs. Similarly toCINR criterion, different RS profiles can be penalized differentlyfor every channel according to the LUTs provided, adjusting T min
and T max to the CINR values to for the minimum and maximumMCS. Constraint (16) indicates that different penalties can beapplied in both UL and DL.
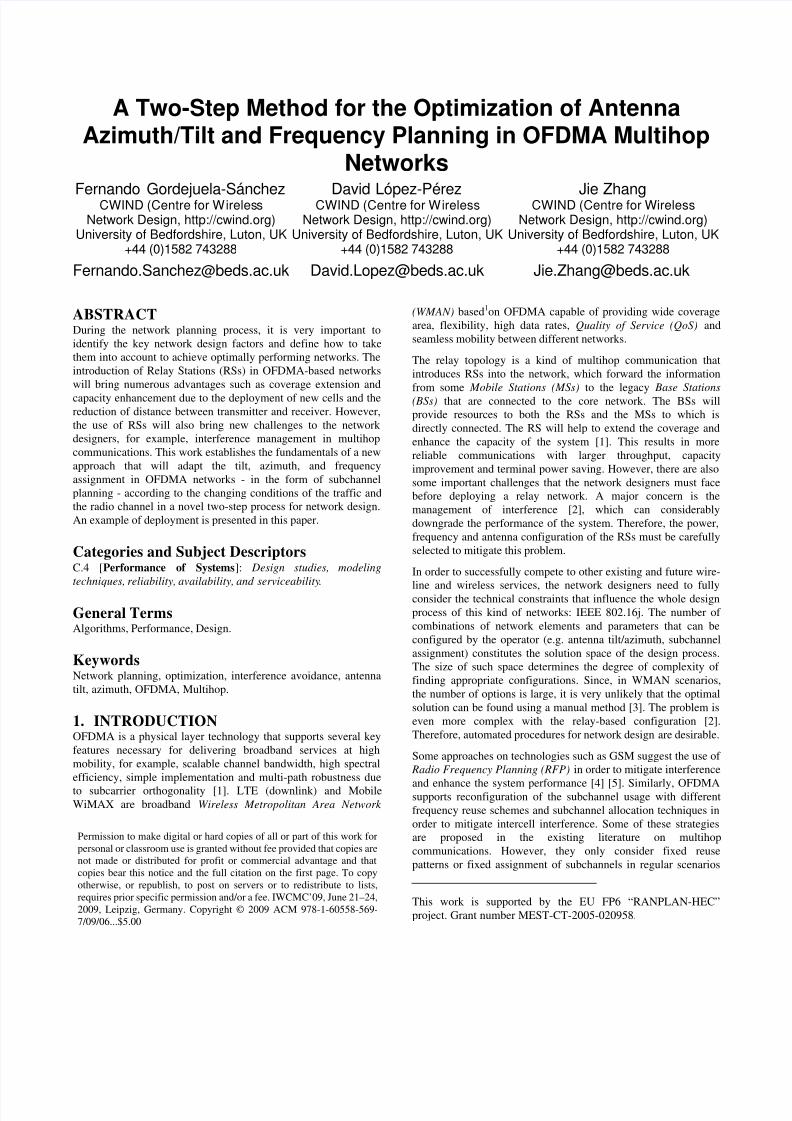
4. EXPERIMENTAL EVALUATIONAn example of network design process has been performed over arectangular area of the city of Munich (3.3km × 2.3km) using anIEEE 802.16j network. The used scenario is a non-regularOFDMA network at 3.5 GHz with a channel bandwidth of 10MHz, composed of 3 BSs (of 3 sectors) and 8 RSs. Two differenttypes of traffic pattern have been used to simulate the unevendistribution of the users across the scenario: one backgroundtraffic map and three different hot spots with a density of 50
user/km2 and 70 user/km2, respectively. The rest of parameters are
shown in Table 1.
Table 1 Simulation Parameters
Different configurations are searched by a Tabu Search algorithmin both the inner and outer optimization loop. The Tabu list size ischosen empirically in the initial tuning. The outer loop getsoptimal or at least good values for antenna tilt and azimuth (inintervals of 100) with the optimal or at least a good assignment of subchannels calculated in the inner loop. Figure 2 shows the pilotpower and user status of a single snapshot in the solution found.
Hotspots and indoor coverage in the central area benefit from thisconfiguration. However, there are a number of MSs with lowCINR levels concentrated at the edge of the coverage areas, wherethey may have a poor channel quality. Note that the penalizationis performed in different ranges and values, and depends on thenetwork designer criteria as some objectives can be given more or
less preference. Due to this fact diverse situations can be created.This solution is an example of throughput enhancement andnetwork reliability, since RSs are well covered. Other strategieswith different degrees of fairness for users or risky configurationsfor the operators can be set by tuning the values (F max, T min, T max)in the penalty function.
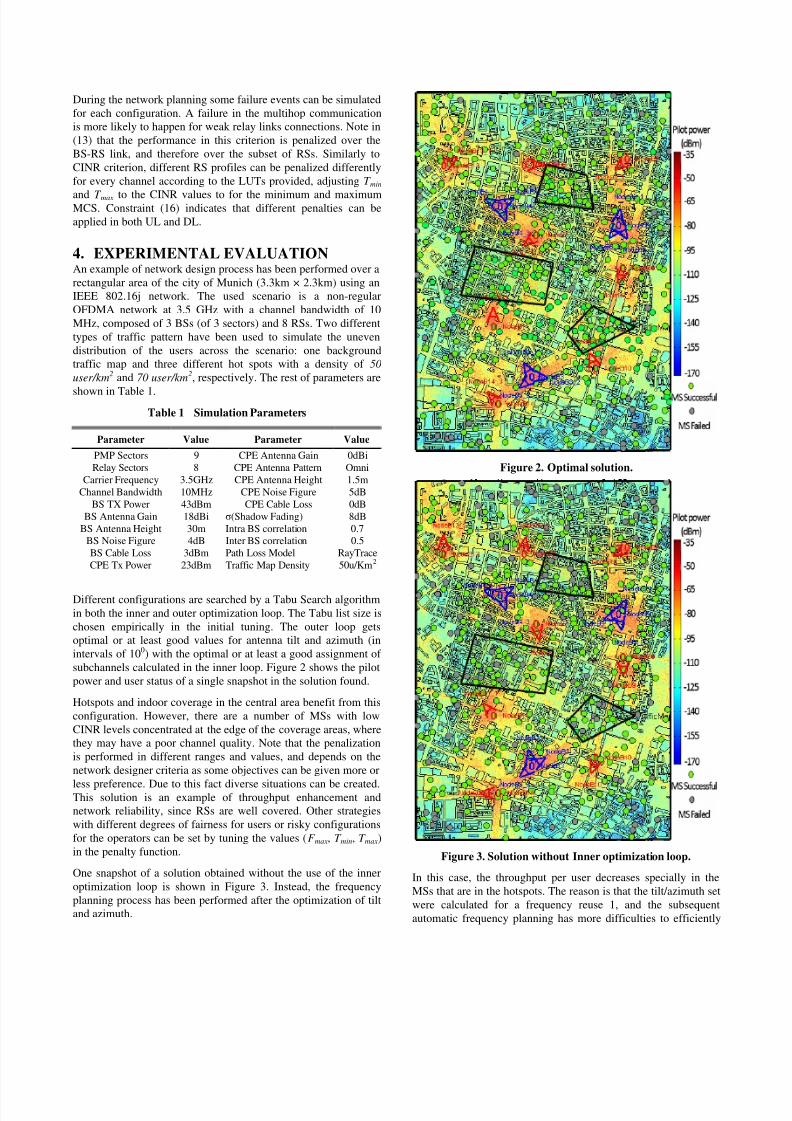
One snapshot of a solution obtained without the use of the inneroptimization loop is shown in Figure 3. Instead, the frequencyplanning process has been performed after the optimization of tiltand azimuth.
Figure 2. Optimal solution.
Figure 3. Solution without Inner optimization loop.
In this case, the throughput per user decreases specially in theMSs that are in the hotspots. The reason is that the tilt/azimuth setwere calculated for a frequency reuse 1, and the subsequentautomatic frequency planning has more difficulties to efficiently
Parameter Value Parameter Value
PMP Sectors 9 CPE Antenna Gain 0dBiRelay Sectors 8 CPE Antenna Pattern Omni
Carrier Frequency 3.5GHz CPE Antenna Height 1.5mChannel Bandwidth 10MHz CPE Noise Figure 5dB
BS TX Power 43dBm CPE Cable Loss 0dBBS Antenna Gain 18dBi σ(Shadow Fading) 8dB
BS Antenna Height 30m Intra BS correlation 0.7BS Noise Figure 4dB Inter BS correlation 0.5BS Cable Loss 3dBm Path Loss Model RayTraceCPE Tx Power 23dBm Traffic Map Density 50u/Km2

8/2/2019 A Two-Step Method for the Optimization of Antenna Azimuth Tilt and Frequency Planning in OFDMA Multihop Netwo…
http://slidepdf.com/reader/full/a-two-step-method-for-the-optimization-of-antenna-azimuth-tilt-and-frequency 6/6