a tunable microresonator sensor based on a photocrosslinking polymer microwire
TRANSCRIPT

A tunable microresonator sensor based on a photocrosslinking polymer microwireSeongjae Lee, Minhyuk Yun, and Sangmin Jeon
Citation: Applied Physics Letters 104, 053506 (2014); doi: 10.1063/1.4864272 View online: http://dx.doi.org/10.1063/1.4864272 View Table of Contents: http://scitation.aip.org/content/aip/journal/apl/104/5?ver=pdfcov Published by the AIP Publishing Articles you may be interested in An energy-efficient readout circuit for resonant sensors based on ring-down measurement Rev. Sci. Instrum. 84, 025005 (2013); 10.1063/1.4792396 Stress-based resonant volatile gas microsensor operated near the critically buckled state J. Appl. Phys. 111, 104517 (2012); 10.1063/1.4720473 High resolution microresonator-based digital temperature sensor Appl. Phys. Lett. 91, 074101 (2007); 10.1063/1.2768629 Nonconductive polymer microresonators actuated by the Kelvin polarization force Appl. Phys. Lett. 89, 163506 (2006); 10.1063/1.2362590 Ultimate limits to inertial mass sensing based upon nanoelectromechanical systems J. Appl. Phys. 95, 2682 (2004); 10.1063/1.1642738
This article is copyrighted as indicated in the article. Reuse of AIP content is subject to the terms at: http://scitation.aip.org/termsconditions. Downloaded to IP:
78.56.219.114 On: Wed, 02 Apr 2014 08:04:43
A tunable microresonator sensor based on a photocrosslinking polymermicrowire
Seongjae Lee, Minhyuk Yun, and Sangmin Jeona)
Department of Chemical Engineering, Pohang University of Science and Technology (POSTECH), Pohang,South Korea
(Received 12 December 2013; accepted 22 January 2014; published online 6 February 2014)
A polyvinylcinnamate (PVCN) microwire was attached between the two tines of a quartz tuning
fork (QTF) to form a polymer bridge. Exposure of a PVCN wire-connected QTF to ethanol vapor
decreased the modulus of the wire, resulting in a decrease in the resonance frequency. The
resonance frequency and Q factor of the resonator were measured as a function of the ethanol
vapor concentration. The photocrosslinking of the PVCN wire enhanced the sensitivity of the
QTF sensor and offered a facile route to developing a sensor with a tunable resonance frequency.VC 2014 AIP Publishing LLC. [http://dx.doi.org/10.1063/1.4864272]
The absorption of gas molecules into a polymer induces
substantial changes in the physical properties of the polymer,
including the mechanical strength and electrical resistance.1–6
Because the changes may be easily measured at room tempera-
ture, polymer-based gas sensors are considered to be a promis-
ing alternative to commercially available inorganic gas sensors
that require high temperatures for operation.7,8 Most polymer-
based gas sensors utilize conducting polymers and measure
changes in the electrical resistance upon gas absorption;3–6
however, the applicability of conducting polymer-based gas
sensors is quite limited because most polymers are not conduc-
tive. By contrast, changes in the mechanical properties of a
polymer, such as the modulus, depend strongly on the affinity
between a polymer and the gas molecules. The gas-sensitive
modulus of nearly all polymers can be used for sensing
applications.
Changes in the mechanical properties of polymers can be
measured using microresonators such as quartz crystal micro-
balances (QCMs), microcantilevers, or quartz tuning forks
(QTFs).9–14 Microresonators vibrate at resonance frequencies
that are sensitive to changes in mass or stress due to the
absorption of gas molecules. By measuring changes in the res-
onance frequency, the mass of absorbed gas molecules or the
change in the stress of the resonator can be obtained. The
mass sensitivities of the various microresonators follow the
order: microcantilevers > QCMs>QTFs.15–17 The mass sen-
sitivity of a typical QTF with a resonance frequency of 32
kHz is just�50 ng/Hz and is unsuitable for use in gas sensors.
The QTF has a unique geometry consisting of two
vibrating tines with a specific gap that permits the formation
of a free-standing polymer membrane or wire bridge
between the tines.13,14 The absorption of gas molecules into
the polymer bridge induces a change in the modulus of the
polymer bridge and affects the resonance frequency. The
suspended structure facilitates the diffusion of gas molecules
into the polymer and improves the sensitivity of the QTF.
Boussaad and Tao further improved the sensitivity of a poly-
mer microwire-connected QTF by reducing the diameter of
the polymer wire using a focused ion beam,13 but it required
an expensive vacuum process.
In this study, we used a photocrosslinkable polymer to
form a microwire on a QTF and improved the sensitivity of
the resulting sensor by photocrosslinking the polymer wire.
An increase in the polymer wire’s modulus due to photocros-
slinking increased the tension between the tines of the QTF
and amplified the frequency change measured during gas
absorption. This approach also offers a facile route to de-
velop a microresonator with a tunable resonance frequency.
Polyvinylcinnamate (PVCN) was obtained from Aldrich
(Saint Louis, MO) as a photocrosslinkable polymer. The
weight-average molecular weight (Mw) of PVCN was stated
by the manufacturer to be 200 000 g/mol. Tetrahydrofuran
(THF) was purchased from Aldrich and was used to prepare
a 10 wt. % PVCN solution. QTFs with 250 lm in width,
600 lm in thickness, and 3400 lm in length were purchased
from ECS, Inc., International (Kwangmyung, Korea). The
resonance frequency and spring constant of an uncoated
QTF were 32.758 kHz and 13 kN/m, respectively. A
home-built system consisting of a digitizer (NI PXI-5114), a
multiplexer (NI PXI-2593), and a function generator (NI
PXI-5406) was used to measure the resonance frequencies of
the QTFs. The phase and admittance of the QTF were
obtained using Labview software. The resonance frequency
and Q factor of the QTF were calculated from Lorentzian
curve fits to the conductance spectra, which were measured
in situ during the absorption of ethanol vapor by the PVCN
wire at room temperature. The concentration of ethanol
vapor was controlled by adjusting the flow rates of the dry
and wet nitrogen gas. The total flow rate of the gas stream
was fixed at 100 ml/min and wet nitrogen was obtained by
passing dry nitrogen through a gas bubbler containing pure
ethanol.
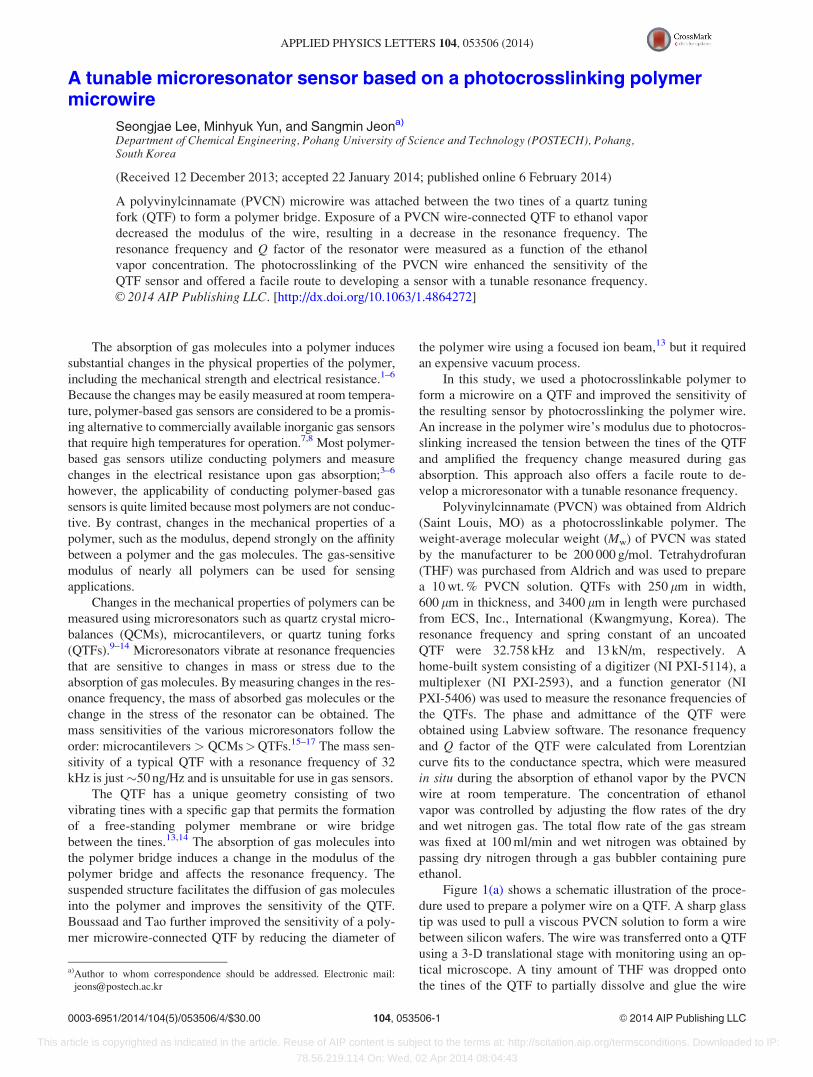
Figure 1(a) shows a schematic illustration of the proce-
dure used to prepare a polymer wire on a QTF. A sharp glass
tip was used to pull a viscous PVCN solution to form a wire
between silicon wafers. The wire was transferred onto a QTF
using a 3-D translational stage with monitoring using an op-
tical microscope. A tiny amount of THF was dropped onto
the tines of the QTF to partially dissolve and glue the wire
a)Author to whom correspondence should be addressed. Electronic mail:
0003-6951/2014/104(5)/053506/4/$30.00 VC 2014 AIP Publishing LLC104, 053506-1
APPLIED PHYSICS LETTERS 104, 053506 (2014)
This article is copyrighted as indicated in the article. Reuse of AIP content is subject to the terms at: http://scitation.aip.org/termsconditions. Downloaded to IP:
78.56.219.114 On: Wed, 02 Apr 2014 08:04:43
onto the QTF. The diameter of the PVCN wire in Figure 1(b)
was measured to be �3 lm. The polymer wire-connected
QTF was placed inside a homebuilt flow cell (2.2 ml) for sub-
sequent measurements. Figure 1(c) shows the conductance
spectra before and after attaching the PVCN wire to the QTF
under a nitrogen atmosphere. A resonance peak appeared at
32.758 kHz before attachment and this peak shifted to
32.840 kHz after attachment. The change in the resonance fre-
quency (Df) of the QTF can be affected by the change in the
effective stiffness (Dk) and the change in the mass (DM)18
Df ðk;MÞ ¼ f02
� �Dk
k0
� DM
M0
� �; (1)
where f0, M0, and k0 represent the resonance frequency,
mass, and spring constant of the bare QTF, respectively. The
increase in the resonance frequency after attachment indi-
cated that the mass effects were negligible compared to the
stiffness effects. The mass of the attached PVCN wire was
calculated from the dimensions of the optical microscopy
image and was found to be �1 ng, whereas the mass of the
bare QTF was 2.7 mg. Assuming that the spring constant did
not change after attachment of the wire, the frequency change
due to the mass loading was calculated from Eq. (1) to be
0.01 Hz. A control experiment was conducted in which the
attached wire was cut using a razor blade. The resonance fre-
quency of the QTF with the PVCN wire residue was found to
be almost identical to that of the bare QTF, indicating that the
change in resonance frequency after attachment was induced
solely by the change in the spring constant of the QTF.
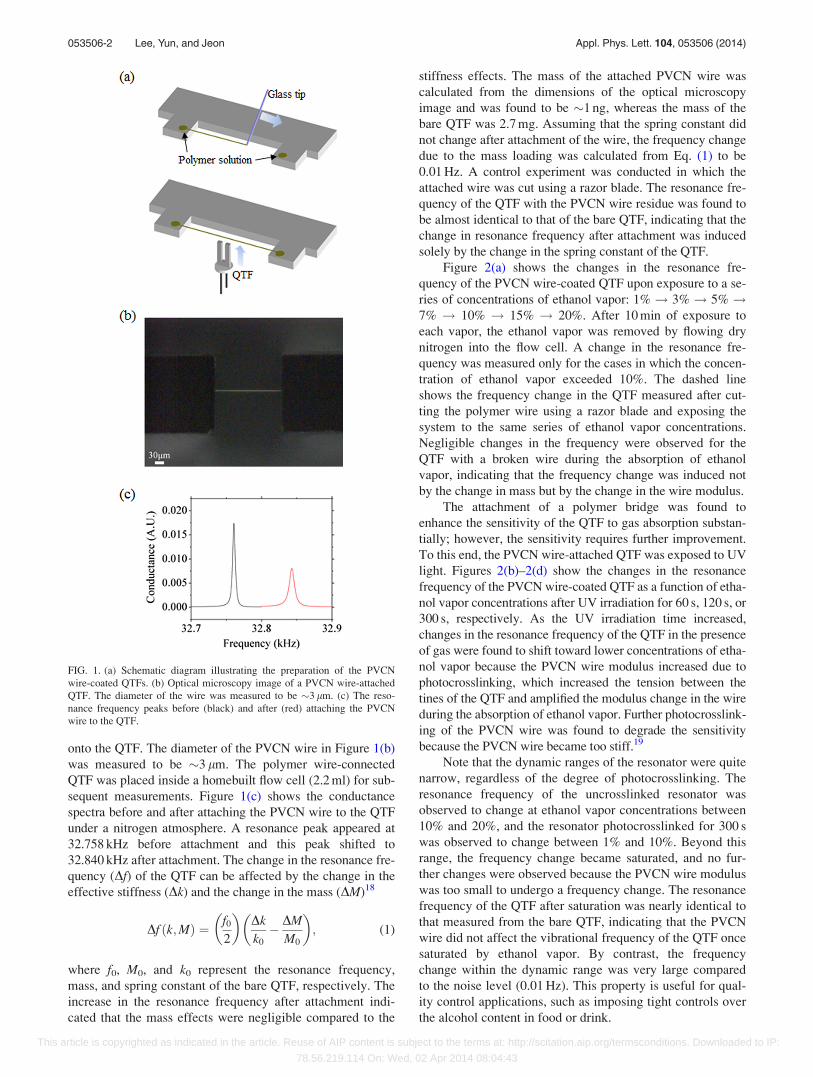
Figure 2(a) shows the changes in the resonance fre-
quency of the PVCN wire-coated QTF upon exposure to a se-
ries of concentrations of ethanol vapor: 1%! 3%! 5%!7% ! 10% ! 15% ! 20%. After 10 min of exposure to
each vapor, the ethanol vapor was removed by flowing dry
nitrogen into the flow cell. A change in the resonance fre-
quency was measured only for the cases in which the concen-
tration of ethanol vapor exceeded 10%. The dashed line
shows the frequency change in the QTF measured after cut-
ting the polymer wire using a razor blade and exposing the
system to the same series of ethanol vapor concentrations.
Negligible changes in the frequency were observed for the
QTF with a broken wire during the absorption of ethanol
vapor, indicating that the frequency change was induced not
by the change in mass but by the change in the wire modulus.
The attachment of a polymer bridge was found to
enhance the sensitivity of the QTF to gas absorption substan-
tially; however, the sensitivity requires further improvement.
To this end, the PVCN wire-attached QTF was exposed to UV
light. Figures 2(b)–2(d) show the changes in the resonance
frequency of the PVCN wire-coated QTF as a function of etha-
nol vapor concentrations after UV irradiation for 60 s, 120 s, or
300 s, respectively. As the UV irradiation time increased,
changes in the resonance frequency of the QTF in the presence
of gas were found to shift toward lower concentrations of etha-
nol vapor because the PVCN wire modulus increased due to
photocrosslinking, which increased the tension between the
tines of the QTF and amplified the modulus change in the wire
during the absorption of ethanol vapor. Further photocrosslink-
ing of the PVCN wire was found to degrade the sensitivity
because the PVCN wire became too stiff.19
Note that the dynamic ranges of the resonator were quite
narrow, regardless of the degree of photocrosslinking. The
resonance frequency of the uncrosslinked resonator was
observed to change at ethanol vapor concentrations between
10% and 20%, and the resonator photocrosslinked for 300 s
was observed to change between 1% and 10%. Beyond this
range, the frequency change became saturated, and no fur-
ther changes were observed because the PVCN wire modulus
was too small to undergo a frequency change. The resonance
frequency of the QTF after saturation was nearly identical to
that measured from the bare QTF, indicating that the PVCN
wire did not affect the vibrational frequency of the QTF once
saturated by ethanol vapor. By contrast, the frequency
change within the dynamic range was very large compared
to the noise level (0.01 Hz). This property is useful for qual-
ity control applications, such as imposing tight controls over
the alcohol content in food or drink.
FIG. 1. (a) Schematic diagram illustrating the preparation of the PVCN
wire-coated QTFs. (b) Optical microscopy image of a PVCN wire-attached
QTF. The diameter of the wire was measured to be �3 lm. (c) The reso-
nance frequency peaks before (black) and after (red) attaching the PVCN
wire to the QTF.
053506-2 Lee, Yun, and Jeon Appl. Phys. Lett. 104, 053506 (2014)
This article is copyrighted as indicated in the article. Reuse of AIP content is subject to the terms at: http://scitation.aip.org/termsconditions. Downloaded to IP:
78.56.219.114 On: Wed, 02 Apr 2014 08:04:43
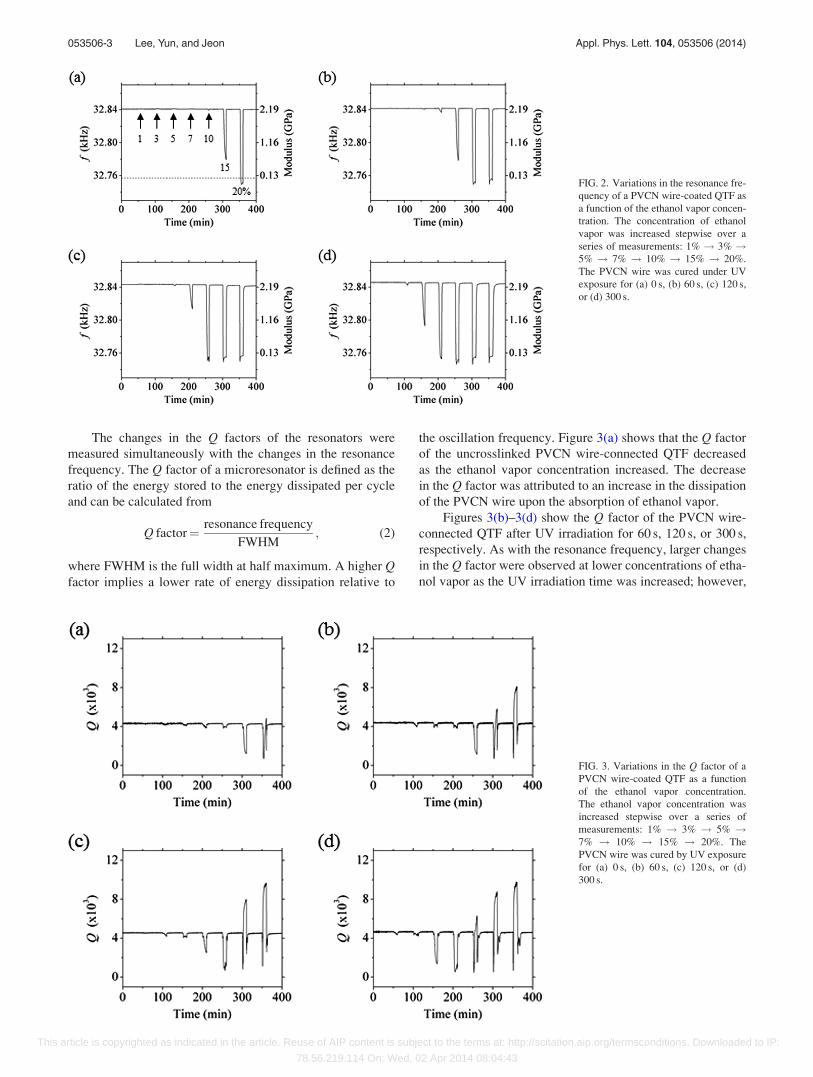
The changes in the Q factors of the resonators were
measured simultaneously with the changes in the resonance
frequency. The Q factor of a microresonator is defined as the
ratio of the energy stored to the energy dissipated per cycle
and can be calculated from
Q factor¼ resonance frequency
FWHM; (2)
where FWHM is the full width at half maximum. A higher Qfactor implies a lower rate of energy dissipation relative to
the oscillation frequency. Figure 3(a) shows that the Q factor
of the uncrosslinked PVCN wire-connected QTF decreased
as the ethanol vapor concentration increased. The decrease
in the Q factor was attributed to an increase in the dissipation
of the PVCN wire upon the absorption of ethanol vapor.
Figures 3(b)–3(d) show the Q factor of the PVCN wire-
connected QTF after UV irradiation for 60 s, 120 s, or 300 s,
respectively. As with the resonance frequency, larger changes
in the Q factor were observed at lower concentrations of etha-
nol vapor as the UV irradiation time was increased; however,
FIG. 2. Variations in the resonance fre-
quency of a PVCN wire-coated QTF as
a function of the ethanol vapor concen-
tration. The concentration of ethanol
vapor was increased stepwise over a
series of measurements: 1% ! 3% !5% ! 7% ! 10% ! 15% ! 20%.
The PVCN wire was cured under UV
exposure for (a) 0 s, (b) 60 s, (c) 120 s,
or (d) 300 s.
FIG. 3. Variations in the Q factor of a
PVCN wire-coated QTF as a function
of the ethanol vapor concentration.
The ethanol vapor concentration was
increased stepwise over a series of
measurements: 1% ! 3% ! 5% !7% ! 10% ! 15% ! 20%. The
PVCN wire was cured by UV exposure
for (a) 0 s, (b) 60 s, (c) 120 s, or (d)
300 s.
053506-3 Lee, Yun, and Jeon Appl. Phys. Lett. 104, 053506 (2014)
This article is copyrighted as indicated in the article. Reuse of AIP content is subject to the terms at: http://scitation.aip.org/termsconditions. Downloaded to IP:
78.56.219.114 On: Wed, 02 Apr 2014 08:04:43
the Q factor decreased upon exposure to lower concentrations
of ethanol vapor and increased upon exposure to higher con-
centrations. The ethanol vapor concentration at which the Qfactor increased roughly coincided with the ethanol vapor
concentration at which the wire modulus reached a minimum.
This result indicated that an increase in the Q factor at higher
concentrations of ethanol vapor resulted from the small mod-
ulus of the PVCN wire. Once the wire had been saturated
with ethanol vapor, the PVCN wire connected to the QTF did
not affect the vibrational frequency of the QTF (i.e., damping
decreased), and the Q factor approached the original Q value
of the bare QTF (12 000).
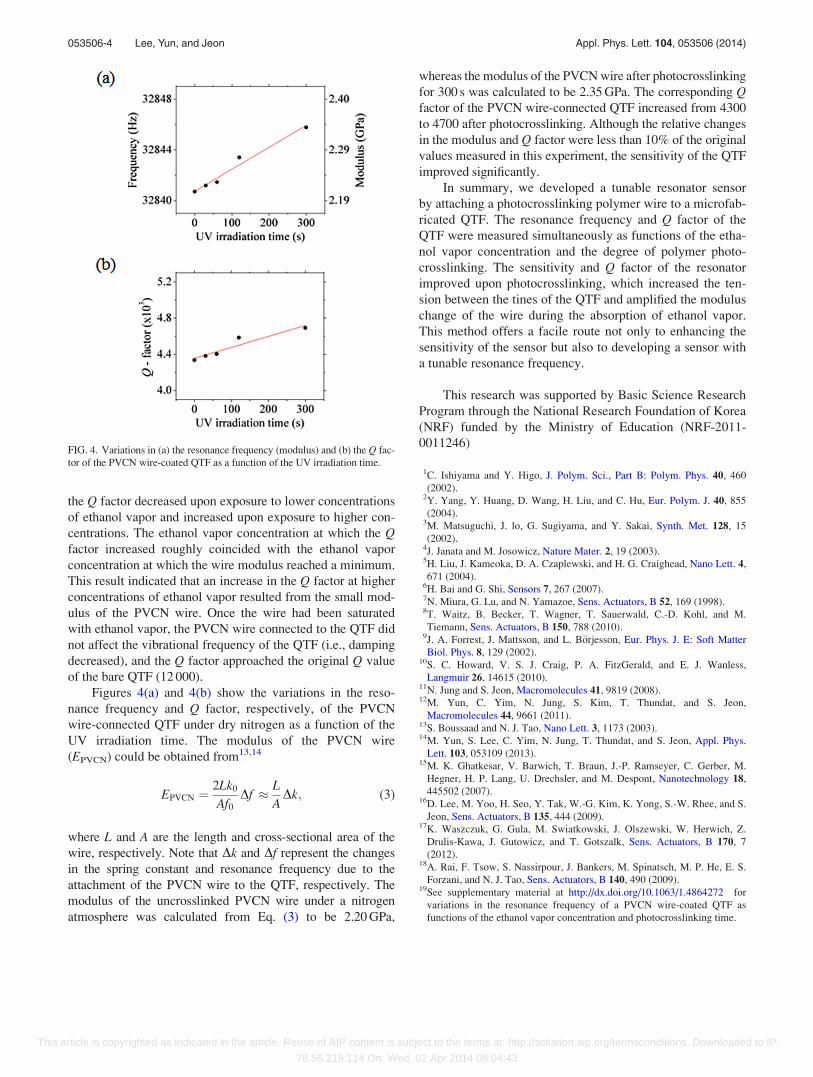
Figures 4(a) and 4(b) show the variations in the reso-
nance frequency and Q factor, respectively, of the PVCN
wire-connected QTF under dry nitrogen as a function of the
UV irradiation time. The modulus of the PVCN wire
(EPVCN) could be obtained from13,14
EPVCN ¼2Lk0
Af0
Df � L
ADk; (3)
where L and A are the length and cross-sectional area of the
wire, respectively. Note that Dk and Df represent the changes
in the spring constant and resonance frequency due to the
attachment of the PVCN wire to the QTF, respectively. The
modulus of the uncrosslinked PVCN wire under a nitrogen
atmosphere was calculated from Eq. (3) to be 2.20 GPa,
whereas the modulus of the PVCN wire after photocrosslinking
for 300 s was calculated to be 2.35 GPa. The corresponding Qfactor of the PVCN wire-connected QTF increased from 4300
to 4700 after photocrosslinking. Although the relative changes
in the modulus and Q factor were less than 10% of the original
values measured in this experiment, the sensitivity of the QTF
improved significantly.
In summary, we developed a tunable resonator sensor
by attaching a photocrosslinking polymer wire to a microfab-
ricated QTF. The resonance frequency and Q factor of the
QTF were measured simultaneously as functions of the etha-
nol vapor concentration and the degree of polymer photo-
crosslinking. The sensitivity and Q factor of the resonator
improved upon photocrosslinking, which increased the ten-
sion between the tines of the QTF and amplified the modulus
change of the wire during the absorption of ethanol vapor.
This method offers a facile route not only to enhancing the
sensitivity of the sensor but also to developing a sensor with
a tunable resonance frequency.
This research was supported by Basic Science Research
Program through the National Research Foundation of Korea
(NRF) funded by the Ministry of Education (NRF-2011-
0011246)
1C. Ishiyama and Y. Higo, J. Polym. Sci., Part B: Polym. Phys. 40, 460
(2002).2Y. Yang, Y. Huang, D. Wang, H. Liu, and C. Hu, Eur. Polym. J. 40, 855
(2004).3M. Matsuguchi, J. lo, G. Sugiyama, and Y. Sakai, Synth. Met. 128, 15
(2002).4J. Janata and M. Josowicz, Nature Mater. 2, 19 (2003).5H. Liu, J. Kameoka, D. A. Czaplewski, and H. G. Craighead, Nano Lett. 4,
671 (2004).6H. Bai and G. Shi, Sensors 7, 267 (2007).7N. Miura, G. Lu, and N. Yamazoe, Sens. Actuators, B 52, 169 (1998).8T. Waitz, B. Becker, T. Wagner, T. Sauerwald, C.-D. Kohl, and M.
Tiemann, Sens. Actuators, B 150, 788 (2010).9J. A. Forrest, J. Mattsson, and L. B€orjesson, Eur. Phys. J. E: Soft Matter
Biol. Phys. 8, 129 (2002).10S. C. Howard, V. S. J. Craig, P. A. FitzGerald, and E. J. Wanless,
Langmuir 26, 14615 (2010).11N. Jung and S. Jeon, Macromolecules 41, 9819 (2008).12M. Yun, C. Yim, N. Jung, S. Kim, T. Thundat, and S. Jeon,
Macromolecules 44, 9661 (2011).13S. Boussaad and N. J. Tao, Nano Lett. 3, 1173 (2003).14M. Yun, S. Lee, C. Yim, N. Jung, T. Thundat, and S. Jeon, Appl. Phys.
Lett. 103, 053109 (2013).15M. K. Ghatkesar, V. Barwich, T. Braun, J.-P. Ramseyer, C. Gerber, M.
Hegner, H. P. Lang, U. Drechsler, and M. Despont, Nanotechnology 18,
445502 (2007).16D. Lee, M. Yoo, H. Seo, Y. Tak, W.-G. Kim, K. Yong, S.-W. Rhee, and S.
Jeon, Sens. Actuators, B 135, 444 (2009).17K. Waszczuk, G. Gula, M. Swiatkowski, J. Olszewski, W. Herwich, Z.
Drulis-Kawa, J. Gutowicz, and T. Gotszalk, Sens. Actuators, B 170, 7
(2012).18A. Rai, F. Tsow, S. Nassirpour, J. Bankers, M. Spinatsch, M. P. He, E. S.
Forzani, and N. J. Tao, Sens. Actuators, B 140, 490 (2009).19See supplementary material at http://dx.doi.org/10.1063/1.4864272 for
variations in the resonance frequency of a PVCN wire-coated QTF as
functions of the ethanol vapor concentration and photocrosslinking time.
FIG. 4. Variations in (a) the resonance frequency (modulus) and (b) the Q fac-
tor of the PVCN wire-coated QTF as a function of the UV irradiation time.
053506-4 Lee, Yun, and Jeon Appl. Phys. Lett. 104, 053506 (2014)
This article is copyrighted as indicated in the article. Reuse of AIP content is subject to the terms at: http://scitation.aip.org/termsconditions. Downloaded to IP:
78.56.219.114 On: Wed, 02 Apr 2014 08:04:43