a tree-like bayesian structure learning algorithm for ... · pdf filea tree-like bayesian...
TRANSCRIPT

METHODOLOGY ARTICLE Open Access
A tree-like Bayesian structure learningalgorithm for small-sample datasets fromcomplex biological model systemsWeiwei Yin1,2, Swetha Garimalla3, Alberto Moreno4, Mary R. Galinski4 and Mark P. Styczynski2*
Abstract
Background: There are increasing efforts to bring high-throughput systems biology techniques to bear oncomplex animal model systems, often with a goal of learning about underlying regulatory network structures (e.g.,gene regulatory networks). However, complex animal model systems typically have significant limitations on cohortsizes, number of samples, and the ability to perform follow-up and validation experiments. These constraints areparticularly problematic for many current network learning approaches, which require large numbers of samplesand may predict many more regulatory relationships than actually exist.
Results: Here, we test the idea that by leveraging the accuracy and efficiency of classifiers, we can constructhigh-quality networks that capture important interactions between variables in datasets with few samples. We startfrom a previously-developed tree-like Bayesian classifier and generalize its network learning approach to allow forarbitrary depth and complexity of tree-like networks. Using four diverse sample networks, we demonstrate that thisapproach performs consistently better at low sample sizes than the Sparse Candidate Algorithm, a representativeapproach for comparison because it is known to generate Bayesian networks with high positive predictive value.We develop and demonstrate a resampling-based approach to enable the identification of a viable root for thelearned tree-like network, important for cases where the root of a network is not known a priori. We also developand demonstrate an integrated resampling-based approach to the reduction of variable space for the learning ofthe network. Finally, we demonstrate the utility of this approach via the analysis of a transcriptional dataset of amalaria challenge in a non-human primate model system, Macaca mulatta, suggesting the potential to captureindicators of the earliest stages of cellular differentiation during leukopoiesis.
Conclusions: We demonstrate that by starting from effective and efficient approaches for creating classifiers, wecan identify interesting tree-like network structures with significant ability to capture the relationships in thetraining data. This approach represents a promising strategy for inferring networks with high positive predictivevalue under the constraint of small numbers of samples, meeting a need that will only continue to grow as morehigh-throughput studies are applied to complex model systems.
Keywords: Bayesian networks, Network learning algorithm, Tree-like networks, Malaria, Non-human primate,Transcriptomics
* Correspondence: [email protected] of Chemical & Biomolecular Engineering, Georgia Institute ofTechnology, 311 Ferst Drive NW, Atlanta, GA 30332-0100, USAFull list of author information is available at the end of the article
© 2015 Yin et al. Open Access This article is distributed under the terms of the Creative Commons Attribution 4.0International License (http://creativecommons.org/licenses/by/4.0/), which permits unrestricted use, distribution, andreproduction in any medium, provided you give appropriate credit to the original author(s) and the source, provide a link tothe Creative Commons license, and indicate if changes were made. The Creative Commons Public Domain Dedication waiver(http://creativecommons.org/publicdomain/zero/1.0/) applies to the data made available in this article, unless otherwise stated.
Yin et al. BMC Systems Biology (2015) 9:49 DOI 10.1186/s12918-015-0194-7

BackgroundWhile systems biology techniques—whether experimen-tal or computational – are often developed on simplemodel systems, their application to increasingly complexmodel systems is one of the most exciting and promisingaspects of modern biological research. However, apply-ing these techniques to complex systems often presentsnew challenges. For example, systems biology approachesare only recently being brought to bear on non-humanprimate model systems [1–3], which can be critical totranslational biomedical research when simpler organismsare not good models of human physiology [4]. However,the number of experimental samples possible in these sys-tems is limited: using a large cohort is cost-prohibitiveand ethically questionable, and animal welfare consider-ations limit the volume and frequency of blood or othertissue sampling. Also, validation experiments in non-human primates are extremely difficult, which makes itcritical that only a small number of high-confidence hy-potheses are tested.Learning regulatory networks is a common task in sys-
tems biology research [5, 6], and one that is confoundedby the restrictions associated with complex model sys-tems. Complex model systems usually do not allow for alarge number of samples, but robustly learning networkstructure with few samples is difficult [7, 8]. For experi-mental validation complex model systems require identifi-cation of only a few high-confidence connections betweenvariables, but many common network analysis tools in-stead generate high-connectivity graphs [9] (due to indir-ect effects).Given large sample sizes, Bayesian networks are effect-
ive at identifying a small number of meaningful con-nections between features. Bayesian networks [10] areprobabilistic graphical models that account for condi-tional dependencies when finding relationships betweenfeatures. These networks do not necessarily reflect caus-ality, but they are typically concise (with limited indirecteffects) and allow for easier identification of the mostimportant relationships. However, with small samplesizes learning Bayesian networks can be difficult. For ex-ample, network learning on systems with as few as 20variables may often be tested using 500 or more samples[11]. Larger and more complex networks may requireeven more samples for robust inference, which is typic-ally infeasible in complex model systems. Bayesian net-work inference also does not computationally scale wellto large numbers of features [12], though analysis ofhigh-dimensional datasets is at the core of systems-scale,“omics” hypothesis-generating research.Classifiers, which are algorithms that predict the cat-
egory of a sample based on data about that sample, are aclass of techniques that can perform their task well evenwith comparatively few samples [13]. This is perhaps
unsurprising, since only one feature or value is to bepredicted rather than an entire network of connections.This focus only on relationships to one central feature,rather than between all of them, also typically enablesclassifiers to scale more easily to large numbers of fea-tures. However, focusing on just individual relationshipsto a central feature may ignore information that couldprovide improved predictions. To this end, Bayesian net-works have previously been used to create effective clas-sifiers [14, 15] that exploit this information content. Inthese Bayesian network based-classifiers, the actualstructure of the network is not viewed as important—itis only a means to an end of correct classification – andthey thus are typically not assessed.We hypothesized that if Bayesian network classifiers
can be so effective at prediction (even in cross-validationassessment), then they likely contain useful informationabout the underlying (regulatory) structure in the net-works being learned for the classification task, even ifthat is not an intended focus of the algorithms. The se-lection of nodes for inclusion in the model and theplacement of edges between nodes, while intendedmerely for classification purposes, may in fact capturesome of the most informative underlying structure thatwe would like to learn for biological interpretation. Thefact that there is often some observed phenotype (e.g., aclinical parameter) that one would like to explain basedon systems-scale data (e.g., transcriptomics) only furthersupports the idea of using classifiers as the basis for net-work learning: the systems-scale data can be used to“classify” the observed phenotype and lead to the learn-ing of a network.Accordingly, we chose to harness a recently-published
tree-like Bayesian network classifier [16] (effective evenfor small sample sizes) and modify it to learn regulatorynetworks from biological datasets with comparativelyfew observations. These constraints are driven by ourwork in systems biology studies of non-human primatemodels of malaria, where the number of samples ob-tained per experiment is typically not greater than 50but the number of features per experiment is sometimesin the thousands. To our knowledge, the problem ofBayesian structure learning under the constraint of ex-tremely small sample sizes has not previously been con-sidered in depth.We leveraged the extremely effective predictivity of
the previously developed tree-like Bayesian networkclassifier [16] by refining it to provide less topologicallyrestrictive learning of network structures. While this ap-proach is most applicable for trees with known roots(e.g., networks of genes associated with a specific pheno-type as the root), here we show that it can also be ap-plied to networks with an unknown root node (i.e., allnodes are of the same type). We demonstrate the efficacy
Yin et al. BMC Systems Biology (2015) 9:49 Page 2 of 18

of this classifier-based structure learning method using sim-ple synthetic models and established reference datasets. Wedemonstrate that this approach produces reliable and lim-ited predictions of network architecture under constrainedsample sizes, with the potential to generate more efficientnetwork models for complex systems. We also apply thismethodology to a real complex biological system dataset,analyzing transcriptional data from a non-human primatemodel of malaria infection to get better insight into theanimals’ response to the pathogen challenge.
MethodsBackground and problem specificationA Bayesian network is defined as B = <S, Θ>, where Sand Θ respectively represent a directed acyclic graphand a set of conditional probabilities associated with thegraph. Each vertex in the graph is a feature (or a vari-able), and a directed arc from vertex i to another vertexj shows a direct dependency relationship of feature j onfeature i. Feature i is called the parent of feature j, andfeature j is called the child of feature i. Specifically, in aBayesian network feature j is conditionally independentof all vertices that are not its children, given its parents.In this work, we look to learn S from a dataset consist-ing of M × P measurements (Dreal, a M × P data matrix),where M is the number of experiments, P is the numberof features (or variables), and M < < P.
Previous tree-like Bayesian Network (BN-TL) classifierTree-like Bayesian networks are a subset of Bayesiannetworks: they meet all of the requirements of being aBayesian network, but with the additional requirementthat all nodes except for one (the root node) haveexactly one parent, while the root node has no parents.In recent work, Lin et al. developed a classifier thatlearned a tree-like Bayesian Network (BN-TL) to per-form the classification task [16]. They showed that thismethod performed as well as or superior to three com-mon Bayesian network classifiers.Briefly, the BN-TL method constructs a tree by first
identifying the feature f* with the most mutual informa-tion with the root and places it as a child of the root. Itthen finds the feature f ’ with the most conditional mu-tual information with f* given the root and places it as achild of f*. It then places all nodes with conditional mu-tual information sufficiently close to that between f* andf ’ as children of f*. If there are any features left, a newbranch is established in a similar fashion. This process isrepeated until all features are added to the tree.Their method was tested on seven diverse datasets. Its
classification performance was shown to be comparableto or better than three common Bayesian classifiers, in-cluding naïve Bayes, a general Bayesian classifier learnedusing a K2 greedy search strategy [17], and another tree-
like algorithm [18]. Based on the strength of this ap-proach at predicting classifications, we hypothesized thatthere is likely significant useful information in this clas-sifier's network, even though that was not the stated goalof the classifier. However, the exact topology of the clas-sifier’s network was not likely to be informative: it wasflat, with a maximum of three layers and without consid-eration of potential relationships between features onthe bottom layer (see Fig. 1a). Accordingly, we sought toharness the predictive power of this classifier with moreflexible network construction to facilitate learning ofgeneralized tree-like regulatory networks (see Fig. 1b).
Computational algorithmHere, we have designed a tree-like Bayesian structurelearning algorithm (TL-BSLA) that uses an approachsimilar to the BN-TL classifier algorithm to infer a gen-eralized tree-like network (Fig. 1b). The goal of this net-work is to incorporate the most important dependencyrelationships in the given dataset. The general outline ofthe algorithm is provided in Table 1.While the most direct application of this approach is
to infer trees that explain the behavior of some specifiedroot node (e.g., a phenotype of interest or a known geneof interest), we have also designed the algorithm in amore generalized fashion to allow for the learning ofnetworks in datasets where there is not an obvious rootnode. If not otherwise provided, the algorithm starts byselecting a reasonable root feature using statisticalmethods and dataset resampling (using the subroutineRootSelection, described in more detail below). After aroot is selected, new branches are extended from theroot node by adding children to the root. The first can-didate child is the node with the largest mutual informa-tion (MI) value with the root, where MI is defined as:
MI x; yð Þ ¼X
x;y
p x; yð Þlog2p x; yð Þp xð Þp yð Þ; ð1Þ
From the root, a minimally significant MI value (basedon the ffc_filter parameter, default value of 0.01) is re-quired to allow the establishment of a new branch, helpingto filter out features with minimal relationship with theroot node if they exist. For the first established branch,child nodes to be added to that branch are searched for it-eratively (FindLayerNode), and are then configured intosub-tree structures (StructureLayerNode) if they do exist.Once all children to be added to that branch have beenidentified and appropriately structured, the remaining un-assigned node with the largest MI with the root is consid-ered for addition as a new branch; this process is repeatediteratively until all features have been added (or ignoredbecause of their small MI value with the root). The algo-rithm then returns the learned tree-like structure.
Yin et al. BMC Systems Biology (2015) 9:49 Page 3 of 18

The boldface words above are three functions used re-peatedly in the algorithm. Below we provide more detailson each function.
a) RootSelection: If there is not a specified phenotypeto be described with the dataset or an obvious rootnode for the system, then the first step of theTL-BSLA approach is to select a reasonable rootnode from the given feature set. As illustrated inTable 2, this procedure consists of four steps:
(1) Create a noisy dataset (Dnoisy, a M×(αP) matrix),where α is the ratio of synthetic noisy features toreal features. A synthetic noisy feature is createdby randomly permuting the M observations of areal feature; this is done α times for each of the Preal features.
(2) Treat every real feature as the root nodetemporarily, and consider two datasets Dreal-1 andDnoisy, where Dreal-1 is the original real datasetwith the observations for the current root nodetemporarily removed. For each feature in Dreal-1
and Dnoisy, calculate its significance level Si withthe current root node as the following:
Si ¼MItrue f i; current root
� �−mean MIperm f i; current root
� �� �
std MIperm f i; current root� �� � ;
ð2Þwhere MItrue represents the MI value betweenfeature fi∈ Dreal-1 or Dnoisy and the current root,and MIperm represents the mutual information ofrandomly permuted fi and the root. NP
permutations are used for each fi (e.g. NP = 300),and the mean and standard deviation of thepermuted MI are used to calculate Si. Thiscaptures the relative significance of therelationship between fi and the root given thespecific distribution of data in fi.
(3) For each temporarily selected root, compare theS distribution for all fi∈ Dreal-1 to the Sdistribution for all fi∈ Dnoisy (e.g., via a t-test).This captures the overall significance of theroot’s relationships with all nodes given thespecific distribution of data in Dreal.
Fig. 1 Representation of the topological constraints of two tree-like Bayesian networks. a The topology of the previous tree-like Bayesian networkclassifier (TN-BL) was constrained to three levels: a root, children of the root, and the terminal grandchildren of the root (leaf nodes). Constructionof this network did not account for conditional mutual information between siblings. b The proposed tree-like Bayesian structure learningalgorithm (TL-BSLA) has no constraints on maximum depth of the network and considers the mutual information and conditional mutual informationbetween siblings when creating the network structure
Yin et al. BMC Systems Biology (2015) 9:49 Page 4 of 18

(4) Select the feature with the largest differencebetween its two S distributions (e.g. the one withthe smallest p-value in a t-test) as the final root.This allows for the network that is inferred torepresent the strongest overall relationships inthe data.
This function returns the selected root and a revisedset of nodes D’ which includes all of the original nodesexcept for the root.
b) FindLayerNode Given the nodes fbottom (fbottom maybe a single node or a set of multiple nodes) at the
Table 1 Tree-like Bayesian Structure Learning Algorithm (TL-BSLA)
Table 2 RootSelection subroutine of TL-BSLA
Yin et al. BMC Systems Biology (2015) 9:49 Page 5 of 18

bottom layer of the current branch, the first step inthis procedure is to determine whether there existany child nodes that could continue this branch inthe next layer. A candidate feature fi will beconsidered as a possible child of some node in thecurrent bottom layer if MI’(fi; fbottom) ≥ ffc, where ffcis a user-determined parameter, MI’(fi; fbottom) is themaximum value of MI(fi; fbottom) and the conditionalmutual information (CMI) of fi and fbottom given theparent of fbottom (CMI(fi; fbottom |fbottom_parent)), andMI(fi; fbottom) is the maximum value of MI(fi; fbottom,j)for all fbottom,j∈ fbottom.
Instead of MI, the MI’ value is used here because itnot only accounts for the direct impact of the parentnodes, but also considers the indirect influence originat-ing from the grandparent nodes. The numerical value ofthe parameter ffc is a user-determined parameter. Here,we use 0.3 based on empirical experience and sugges-tions from the previously-developed Bayesian networkclassifier [16]. Although the selected value of ffc mayaffect the ultimate inferred structure, parameter sensitiv-ity analysis (discussed in detail in Results) has shownthere to be a fairly broad interval of ffc around 0.3 overwhich the algorithm’s results are insensitive.
c) StructureLayerNode The purpose of this procedureis to arrange the candidate child nodes identified inFindLayerNode into a sub-tree structure using thenodes currently in the bottom layer of the currentbranch as potential parent nodes. As schematicallydescribed in Table 3, the input of this procedureincludes the current bottom nodes (bottomNodes),which are considered as the temporary roots for thesub-tree, the corresponding parent nodes of thebottom nodes (parentsOfBottom), and the candidatepool for searched child nodes (child_pool). Theconfiguration starts with the calculation ofMI’(bottomNodesj; fi) for all bottomNodesi∈bottomNodes and fi∈ child_pool. For each fi, thebottomNodesj with the largest MI’ value with fi isidentified as a potential parent of fi; we refer to thesepairs as (bottomNodesj*, fi*). Then, each bottomNodesj*is connected by an arc to the fi* with the greatest MI’value with bottomNodesj* from among all of itspotential children fi*. For bottomNodesj
* with multiplepotential children, an additional independence test isused to determine if additional children add sufficientindependent information to allow their inclusionin this layer: if CMI(fk; fi* | bottomNodesj
*)≤ ffc_independent (default value of 0.1), an arc iscreated between bottomNodesj
* and fk. That is, fk isconsidered to be another child node of bottomNodesj
*
because it is (sufficiently close to) conditionally
independent of the other children in the layer andthus should not be a child of those nodes. Thisprocess is continued iteratively until all nodesreturned by FindLayerNode have been added to thetree.
Literature and synthetic datasetsFour examples were used to evaluate the performance ofthe proposed TL-BSLA. We developed a simple syn-thetic network (17 nodes, 15 edges) with a true treestructure except for a single node that is not connectedto the rest of the graph. In this work we refer to this net-work as synthetic-tree; the true network is illustrated inAdditional file 1: Figure S1. The other three examplenetworks used in this work are published networkswidely used in structure learning literature: the Childsystem, the Alarm system, and the Asia system (http://www.bnlearn.com/bnrepository/). The Child system is atree-like network with 20 nodes and 24 edges, but is notexactly a tree. The Asia and Alarm networks are lesstree-like networks (8 nodes, 8 edges and 37 nodes, 46edges, respectively) used to assess the algorithm’s per-formance on data drawn from underlying networksmore similar to real “omics” data. Data was generatedbased on the probabilities defined by each model net-work, with all variables being discrete.
Experimental dataTranscriptional data was used from a recent malariachallenge experiment in five rhesus macaques (Macacamulatta).
Ethics statementThe experimental design of this experiment involvingrhesus macaques (Macaca mulatta) was approved bythe Emory University Institutional Animal Care andUse Committee (IACUC) under protocol #YER-2001892-090415GA.
Malaria challenge experimental methodsThe experimental protocol was similar to that used inour previous malaria challenge experiment [19], withfour noteworthy exceptions: there was a longer follow-up period for measurements, complete blood count(CBC) profiles were determined every day, there was nobiotinylation of erythrocytes, and Plasmodium cynomolgisporozoites were used for the experimental infection.Bone marrow aspirates were taken under anesthesia withketamine at seven time points over the course of ap-proximately 100 days, corresponding to baseline, peak ofparasitemia, treatment of blood-stage parasites, and dur-ing and after relapse. Transcriptional profiles were ob-tained by sequencing on an Illumina HiSeq2000 at theYerkes National Primate Research Center Genomics
Yin et al. BMC Systems Biology (2015) 9:49 Page 6 of 18

Core. Additional details on the infection protocol, sam-pling protocol, and methods for initial processing oftranscriptional data are available in Additional file 1:Supplemental Methods.
Experimental data processingSince the transcriptional profiles consisted of continuousvariables, they were first discretized. This is a commondata processing step, as it decreases the computationalcomplexity and the minimum number of samples re-quired for accurate structure learning. We have previ-ously described methods for discretization of continuousdata and their potential impact on learned networks dur-ing structure learning [8, 20]. Here, we have taken a sim-plified approach for our proof-of-principle analysis of amalaria-based dataset, using an equal-quantile discretiza-tion to evenly divide the values for each variable into high,medium, and low values. Genes describing the recentlyidentified axes of variation across large-scale humanpopulation human cohorts were used as a starting point
for analysis, to facilitate data interpretation and networkconstruction [21].
Comparator algorithmOur main goal in this work was to test the hypothesisthat the information contained in a Bayesian networkclassifier would be sufficient to provide informativelearning of the actual underlying Bayesian network. Toprovide a benchmark for acceptable performance innetwork learning, we selected the Sparse CandidateAlgorithm (SCA) [22] as implemented in the Causal Ex-plorer package [23]. Numerous algorithms have beenpublished for structure learning of Bayesian networks,with no conclusively optimal algorithm. We selectedSCA as the main comparator because it is widely-usedand generally performs well, it is effective at handlingreasonably large-scale networks (critical for systems biol-ogy datasets), and it typically provides better positivepredictive value in its inferred networks (fewer false pos-itives per predicted positive). The avoidance of false
Table 3 StructureLayerNode subroutine of TL-BSLA
Yin et al. BMC Systems Biology (2015) 9:49 Page 7 of 18

positives is particularly important for the design of valid-ation experiments in complex model systems. In previouswork [24] we have found that many other algorithms (forexample, PC [25], Max-Min Hill Climbing [11], and ThreePhase Dependency Analysis [26]) often learn many morefalse positives than true positives when sample sizes arelimited. SCA learns a significant fraction of those truepositives with many fewer false positives, making it a de-sirable choice.
ResultsA classifier-inspired algorithm can effectively learntree-like network structuresAs described in greater detail in the Methods, we havedeveloped a tree-like Bayesian Structure Learning Algo-rithm (TL-BSLA) by building off the success of a previ-ously published tree-like Bayesian network classifier[16]. We removed some topological limitations from theexisting Bayesian network based-classifier and used con-ditional mutual information to appropriately arrange thenodes in the network.Four example networks were used to evaluate the per-
formance of the proposed TL-BSLA relative to a bench-mark algorithm. The networks included a simplesynthetic-tree network and three widely used literaturenetworks with tree-like (the Child system) and non-tree-like (the Alarm and Asia systems) structures. For eachexample, 10 randomly generated datasets were tested toreduce the impact of dataset-specific biases introducedby sampling; each dataset was analyzed using our pro-posed TL-BSLA and the well-known Sparse CandidateAlgorithm (SCA) structure learning method [22] forsample sizes ranging from 50 to 500 observations. Moredetailed justification for using SCA is provided in theMethods, but its key feature is that it typically providesgood positive predictive value (fewer false positives perpredicted positive).Three metrics were used to assess the accuracy of
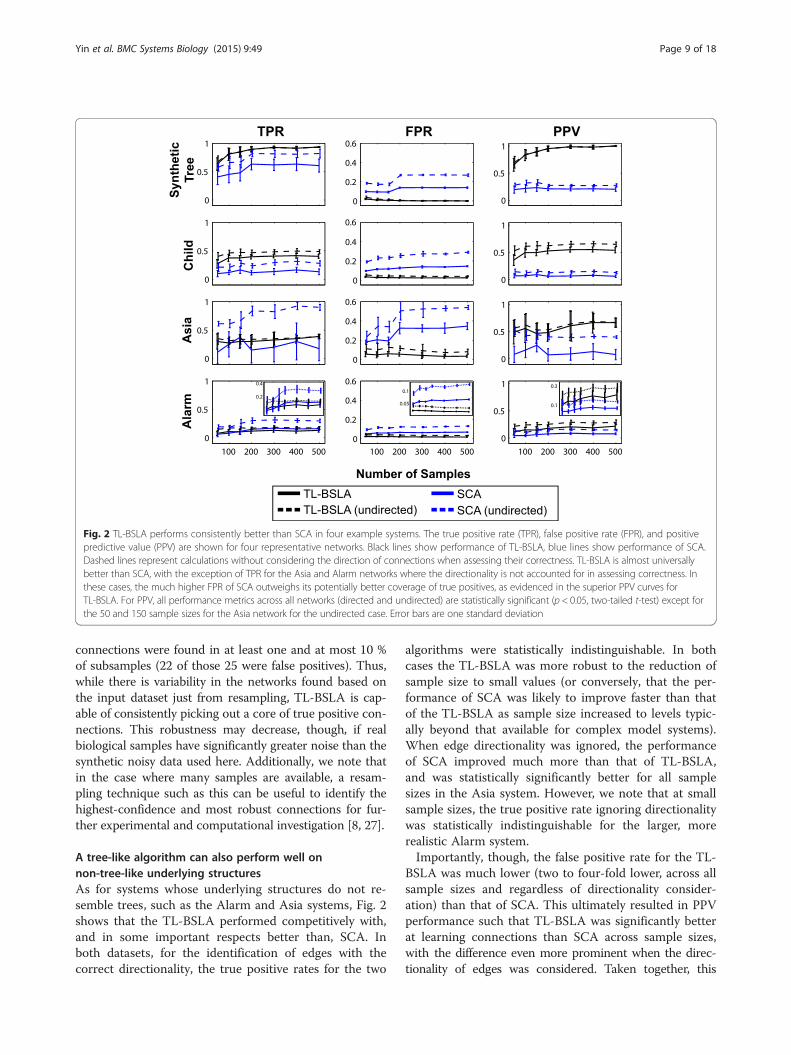
learned structures for each algorithm: (1) true positiverate (TPR), the fraction of all actual edges that are cor-rectly predicted by an algorithm; (2) false positive rate(FPR), the fraction of all actual non-edges that are incor-rectly predicted by an algorithm to be edges; and (3)positive predictive value (PPV), the fraction of predictededges that are actually edges. Worth noting is that PPVis the most relevant metric for the purposes of modelvalidation, as it determines the likelihood of success ofoften extremely expensive or difficult validation experi-ments: a low PPV will confound the experimental valid-ation of network structure and have significant costs.For identification of true positives, we considered twocases in all analyses: if a learned edge needed to be thecorrect direction in order to count as a true positive, orif the correctness of each edge was determined without
consideration of directionality. The same root was usedfor all analyses of a given network in order to providesufficient consistency for comparison; roots were se-lected as described in the Methods. The results of thisevaluation are presented in Fig. 2.In the synthetic-tree system, TL-BSLA correctly recov-
ered almost all of the correct connections even when thesample size was rather small (e.g., the average TPR was80 % when the sample size was 100; Fig. 2). In compari-son, the SCA approach achieved a lower TPR than TL-BSLA, regardless of whether directionality was consideredin assessing the accuracy of the networks. When direc-tionality was considered, SCA performed much morepoorly than TL-BSLA. This was particularly noticeable atlow sample sizes: SCA recovered no more than 50 % ofthe true edges when the sample size was below 200. Evenwithout considering directionality, the performance ofSCA on this simple system was still significantly worsethan that of TL-BSLA. Moreover, the average FPR forSCA was always greater than 10 % (for directed edges)and 20 % (ignoring directionality), which was at least 4-fold higher (and often an order of magnitude higher) thanthat of TL-BSLA. Accordingly, the PPV for TL-BSLA wasmuch better for the synthetic-tree network.The TPR for TL-BSLA was consistently higher than
for SCA for the Child system whether or not the direc-tionality of the learned edges was considered (Fig. 2).The magnitude of the difference was also fairly consistentacross the range of sample sizes; most importantly, thereare significant differences between the two methods atlow (50 or 100) sample sizes. The TL-BSLA also had amuch lower FPR than SCA, indicating that fewer incorrectedges were learned by the algorithm. As a result, the PPVof the TL-BSLA was again significantly better than thatof SCA.We also analyzed whether the networks inferred were
sensitive to changes in the input datasets. It has previ-ously been observed in biomarker discovery [27] and innetwork inference [8] that resampling of data can yielddifferent outputs for machine learning and network infer-ence algorithms. To assess this we followed a previouslypublished approach to assess robustness to resampling[27]. From a fixed set of 500 samples for the Child net-work, we selected subsets of 125 samples; we used TL-BSLA to learn networks for 100 such resampled sets, witheach set having no more than 30 % similarity to any of theothers. The average number of connections found perdataset was 19. Using the TL-BSLA, 18 connections werefound in at least 60 % of the resampled datasets, suggest-ive of robust structure learning by TL-BSLA. 13 of thoseconnections were true positives (11 with correct direction-ality). These results are consistent with the TPR and PPVperformance shown in Fig. 2. On the other hand, only 4connections were found in every subsample, and 25
Yin et al. BMC Systems Biology (2015) 9:49 Page 8 of 18
connections were found in at least one and at most 10 %of subsamples (22 of those 25 were false positives). Thus,while there is variability in the networks found based onthe input dataset just from resampling, TL-BSLA is cap-able of consistently picking out a core of true positive con-nections. This robustness may decrease, though, if realbiological samples have significantly greater noise than thesynthetic noisy data used here. Additionally, we note thatin the case where many samples are available, a resam-pling technique such as this can be useful to identify thehighest-confidence and most robust connections for fur-ther experimental and computational investigation [8, 27].
A tree-like algorithm can also perform well onnon-tree-like underlying structuresAs for systems whose underlying structures do not re-semble trees, such as the Alarm and Asia systems, Fig. 2shows that the TL-BSLA performed competitively with,and in some important respects better than, SCA. Inboth datasets, for the identification of edges with thecorrect directionality, the true positive rates for the two
algorithms were statistically indistinguishable. In bothcases the TL-BSLA was more robust to the reduction ofsample size to small values (or conversely, that the per-formance of SCA was likely to improve faster than thatof the TL-BSLA as sample size increased to levels typic-ally beyond that available for complex model systems).When edge directionality was ignored, the performanceof SCA improved much more than that of TL-BSLA,and was statistically significantly better for all samplesizes in the Asia system. However, we note that at smallsample sizes, the true positive rate ignoring directionalitywas statistically indistinguishable for the larger, morerealistic Alarm system.Importantly, though, the false positive rate for the TL-
BSLA was much lower (two to four-fold lower, across allsample sizes and regardless of directionality consider-ation) than that of SCA. This ultimately resulted in PPVperformance such that TL-BSLA was significantly betterat learning connections than SCA across sample sizes,with the difference even more prominent when the direc-tionality of edges was considered. Taken together, this
Fig. 2 TL-BSLA performs consistently better than SCA in four example systems. The true positive rate (TPR), false positive rate (FPR), and positivepredictive value (PPV) are shown for four representative networks. Black lines show performance of TL-BSLA, blue lines show performance of SCA.Dashed lines represent calculations without considering the direction of connections when assessing their correctness. TL-BSLA is almost universallybetter than SCA, with the exception of TPR for the Asia and Alarm networks where the directionality is not accounted for in assessing correctness. Inthese cases, the much higher FPR of SCA outweighs its potentially better coverage of true positives, as evidenced in the superior PPV curves forTL-BSLA. For PPV, all performance metrics across all networks (directed and undirected) are statistically significant (p < 0.05, two-tailed t-test) except forthe 50 and 150 sample sizes for the Asia network for the undirected case. Error bars are one standard deviation
Yin et al. BMC Systems Biology (2015) 9:49 Page 9 of 18
suggests that the use of a classifier-based Bayesian net-work learning strategy that is computationally efficientmay be a viable replacement for existing network learningalgorithms.Based on the across-the-board improved PPV per-
formance of the TL-BSLA and the details of how itworks, it is worth noting that the main benefit of SCA(its ability to capture a greater fraction of the true posi-tive edges) can likely be captured through iterative appli-cation of TL-BSLA. Once a root is set for TL-BSLA,areas of the network that are essentially insulated fromthat root and its subnetwork (or are otherwise independ-ent of that root) will not be considered. This is appropri-ate for classifier-based tasks, but for the purposes oflearning a complete network from large-scale data sug-gests that by initiating the algorithm with a separate rootthat was not used in the initial inference, additional truepositive edges are likely to be discovered (with likelysimilar PPV), resulting in even further improved per-formance of the TL-BSLA.
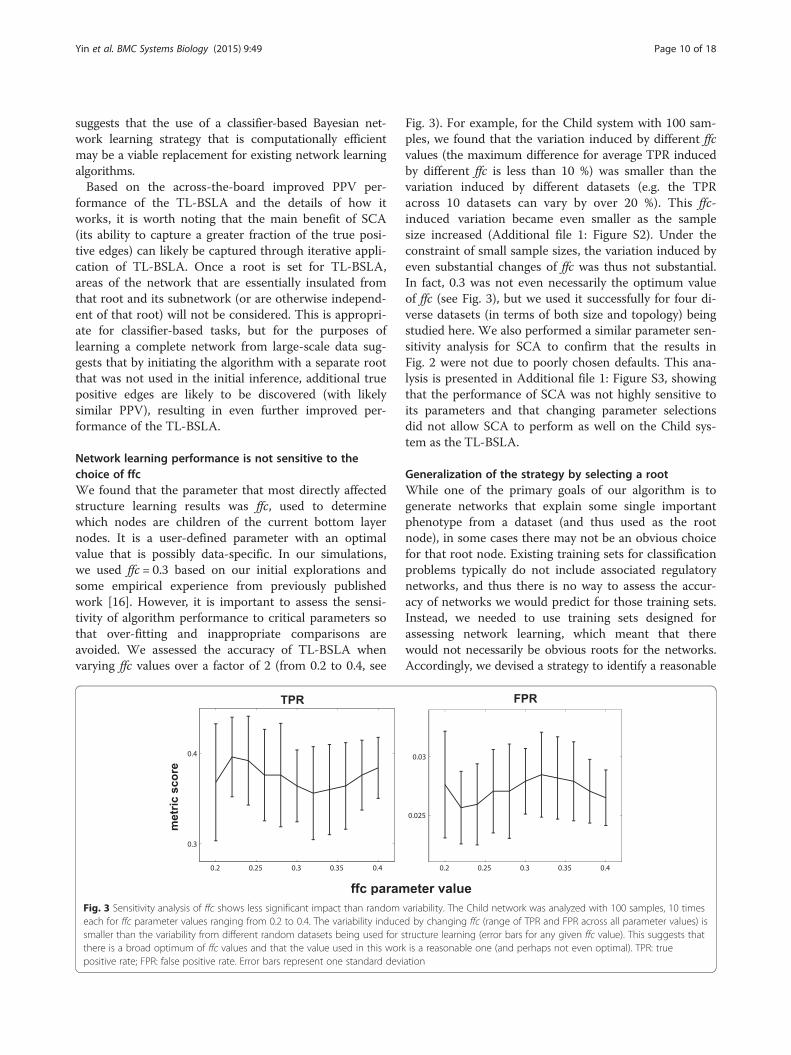
Network learning performance is not sensitive to thechoice of ffcWe found that the parameter that most directly affectedstructure learning results was ffc, used to determinewhich nodes are children of the current bottom layernodes. It is a user-defined parameter with an optimalvalue that is possibly data-specific. In our simulations,we used ffc = 0.3 based on our initial explorations andsome empirical experience from previously publishedwork [16]. However, it is important to assess the sensi-tivity of algorithm performance to critical parameters sothat over-fitting and inappropriate comparisons areavoided. We assessed the accuracy of TL-BSLA whenvarying ffc values over a factor of 2 (from 0.2 to 0.4, see
Fig. 3). For example, for the Child system with 100 sam-ples, we found that the variation induced by different ffcvalues (the maximum difference for average TPR inducedby different ffc is less than 10 %) was smaller than thevariation induced by different datasets (e.g. the TPRacross 10 datasets can vary by over 20 %). This ffc-induced variation became even smaller as the samplesize increased (Additional file 1: Figure S2). Under theconstraint of small sample sizes, the variation induced byeven substantial changes of ffc was thus not substantial.In fact, 0.3 was not even necessarily the optimum valueof ffc (see Fig. 3), but we used it successfully for four di-verse datasets (in terms of both size and topology) beingstudied here. We also performed a similar parameter sen-sitivity analysis for SCA to confirm that the results inFig. 2 were not due to poorly chosen defaults. This ana-lysis is presented in Additional file 1: Figure S3, showingthat the performance of SCA was not highly sensitive toits parameters and that changing parameter selectionsdid not allow SCA to perform as well on the Child sys-tem as the TL-BSLA.
Generalization of the strategy by selecting a rootWhile one of the primary goals of our algorithm is togenerate networks that explain some single importantphenotype from a dataset (and thus used as the rootnode), in some cases there may not be an obvious choicefor that root node. Existing training sets for classificationproblems typically do not include associated regulatorynetworks, and thus there is no way to assess the accur-acy of networks we would predict for those training sets.Instead, we needed to use training sets designed forassessing network learning, which meant that therewould not necessarily be obvious roots for the networks.Accordingly, we devised a strategy to identify a reasonable
Fig. 3 Sensitivity analysis of ffc shows less significant impact than random variability. The Child network was analyzed with 100 samples, 10 timeseach for ffc parameter values ranging from 0.2 to 0.4. The variability induced by changing ffc (range of TPR and FPR across all parameter values) issmaller than the variability from different random datasets being used for structure learning (error bars for any given ffc value). This suggests thatthere is a broad optimum of ffc values and that the value used in this work is a reasonable one (and perhaps not even optimal). TPR: truepositive rate; FPR: false positive rate. Error bars represent one standard deviation
Yin et al. BMC Systems Biology (2015) 9:49 Page 10 of 18

root node based on a statistical treatment of the specificdataset being analyzed. Our root selection procedure,RootSelection (see detailed descriptions in Methods),resamples from the existing dataset and uses dataset per-mutations to identify a reasonable, statistically meaningfulroot for learning a tree-like Bayesian network. The root isidentified as the node that has the most significant mutualinformation with the true features relative to a set of ran-domly permuted features.We used the Child and Alarm networks (as represen-
tatives of tree-like and non-tree-like underlying net-works) to assess the performance of our dataset-specific,
unbiased root selection approach. For each example, weconsidered the impact of varying the number of observa-tions (samples) for the features from 50 (a reasonablevalue for many “omics” approaches) to 500. For eachnumber of observations, we used 10 different randomlygenerated training datasets. The selected roots for eachexample are summarized in Fig. 4.The root selection approach performed quite robustly
in the tree-like networks. For the Child system (asshown in Fig. 4a), node 2 was consistently returned asthe root for all sample sizes. Even for small sample sizes(e.g., 50), node 2 was selected as the root most of time.
Fig. 4 The tree-like Bayesian Structure Learning Algorithm can select a root for structure learning in tree-like or non-tree-like networks. Roots wereselected automatically for two representative networks across a range of sample size limitations: a the tree-like Child network and b the non-tree-like Alarm network. Any node ever selected as a root has a red outline, where increasing line width indicates increasing frequency of selection as aroot. Nodes never selected as a root have blue outlines of fixed width. c A quantitative summary of the root nodes selected, as a function of samplesize. Selection from a tree-like structure is straightforward and consistent; from a non-tree-like structure there is increased variability, but reasonableroots (excluding directionality) are typically chosen. Feature 24 was used as the root for previous Alarm network learning work. It is worth noting thatselection of a better root could improve the TL-BSLA’s TPR and PPV even further
Yin et al. BMC Systems Biology (2015) 9:49 Page 11 of 18

While node 1 is actually the real root, node 2 is obviouslya reasonable second option for root selection based on thetopology of the network. There was little sensitivity of se-lected root to sample size, which is particularly valuablefor applications to small sample datasets.For the Alarm system, there was not such a strong
consistency of root selection, though the results werestill fairly insensitive to sample size. For different train-ing datasets with the same number of samples, differentroot nodes were often selected; as shown in Fig. 4b, theroots selected most often across all sample sizes werenodes 24, 35, 30 and 26. Only for a sample size of 50was the selection of root nodes particularly variable.Since the network topology of the Alarm system is nottree-like, there is no single “correct” root that character-izes the entire network, and each of these seems on ini-tial inspection to be a potentially reasonable selection,especially if directionality of edges is ignored. To recoverthe structure of the whole system, multiple trees withdifferent roots could be combined together in someform (as discussed above). While that is an interestingfuture direction, here we focus on finding a single strongsub-network with constrained sample size to demon-strate the potential for using classifier-based algorithmsto learn network structure.
Data reduction for omics-scale datasetsFor high-throughput and “omics”-scale studies, such astranscriptomics and metabolomics, datasets typicallycontain relatively few samples but thousands of features.In general, this can make it harder to identify the (likelyfew) features that are relevant to determining the pheno-type or structure of the system because the desired sig-nal may be buried in multivariate noise. For smallsample sizes, a further problem is that supervised identi-fication of the important features can often lead to over-fitting, where some linear combination of features canexplain even random results or classifications. Moreover,increasing the number of features also increases thecomputational cost for essentially all types of data ana-lysis. In order to make our structure learning methoduseful for such datasets, we developed an additionalscreening step (consistent with the approaches usedwithin the TL-BSLA) to exclude features likely irrelevantto the selected root. This method was not used in theabove assessments, and is considered as a useful additionto the algorithm proposed in Table 1.Specifically, for each feature in the dataset (fi), it is in-
cluded in the network if it satisfies Si ≥ threshold, whereSi is as used in the RootSelection subroutine and is de-fined in Equation (2). Si represents the significance ofthe mutual information between fi and the root, giventhe specific distribution of data in fi. In this work weused a threshold value of 2.6, based on statistical
arguments, previous literature [28], and empirical ex-ploration. The S value is essentially a z-score on the mu-tual information of a feature with the root based on abackground of permuted data for that feature; thus, athreshold of 2.6 on a zero-mean, unit-variance normal dis-tribution corresponds to a one-tailed significance of 0.005,where a significance lower than the typical 0.05 thresholdwas selected to limit false positives due to multiple hy-pothesis testing. Changes in threshold change how conser-vative the feature inclusion is, and thus affect the truepositive and false negative rates; variation of threshold wasnot explored due to its statistical interpretation.We tested the performance of this screening step by
adding 10-fold manually-created noisy features to the setof real features in the example datasets. These noisy fea-tures were generated via permutation of the observationswithin each real feature. Using the Child system as a rep-resentative example (see summarized results in Table 4),with node 2 as the root, we found that over 50 % of thereal features were included as significant features whenthe sample size was 50. In contrast, only 2.5 % of the noisyfeatures were selected as significant. As the sample size in-creased, the percentage of real features selected for inclu-sion gradually increased to over 80 %, indicating that mostof the real (or relevant features) had been correctly se-lected. Interestingly, the percentage of noisy featuresremained at approximately 3 % even with an order ofmagnitude more samples. This again supports the ideathat our overall structure learning approach is effective forthe case of complex model systems with limited numbersof samples. Results for the synthetic-tree and Alarm sys-tems (see summarized results in Additional file 1: Table S1and Additional file 1: Table S2) were similar to those ofthe Child system, indicating that our proposed screeningstep can generally exclude noisy features that are irrele-vant to the root across different types of underlyingnetwork structures. Thus, once the root is determined(whether through a priori knowledge or a statistical ap-proach as described above), we can focus on the featuresmost relevant to the root with a concomitant reduction incomputational complexity.
Application of TL-BSLA to analyze transcriptomic dataTo apply this approach to the analysis of real systemsbiology data, we used results from a recently-completedexperimental challenge of five rhesus monkeys (Macacamulatta) with the malaria parasite Plasmodium cyno-molgi. Transcriptional profiles were measured from bonemarrow aspirate samples that were taken seven timesover the course of three months after infection. We usedthese transcriptional profiles as the basis for the con-struction of a Bayesian network. We used the recentlydescribed axes of common variation across large-scalepopulation human cohorts [21] to provide a more focused
Yin et al. BMC Systems Biology (2015) 9:49 Page 12 of 18

analysis on transcripts likely to be informative in describ-ing the animals’ response.Figure 5a shows a representative inferred network
from the data, demonstrating the flexible nature of thenetworks that can be inferred using TL-BSLA: depend-ency relationships several levels deep are identified. Webegan with a simplified analysis using previously defined“blood informative transcripts” from previous work asbest describing uncorrelated Axes of variation in wholeblood transcriptional profiling of healthy subjects [21].There are seven main Axes most strongly observed inboth human and macaque samples (based on previouswork; Axes 8 and 9 are weaker and are typically only ob-served in much larger datasets); we compiled togetherthe ten blood informative transcripts for each of theseAxes for input to the TL-BSLA. The genes in the net-work were selected using the dimensional reductionscheme described above, yielding a network of manage-able size for visual and biological interpretation. Theroot was automatically selected from the data, using theapproach described in the Methods. There were twomain branches in the tree: one branch almost exclusivelyconsisting of Axis 3 transcripts, and one that is a com-bination of multiple transcripts from Axes 2, 4, and 7.While this network indicated potentially interesting rela-tionships between the Axes, it also suggested that deeperexploration by including more genes from each Axiswould help to better distinguish potential relationshipsfrom noise. We thus rebuilt the network from the sameroot instead using the top 25 genes from each Axis. Thisdeeper analysis of the Axes made the relationshipswithin the tree even more evident (Fig. 5b): Axes 2 and7 have a significant interaction with Axis 3, which is the
root of the tree. Each of these three Axes has a branchalmost exclusively consisting of only members of thatAxis, suggesting a coherent, significant relationship withthe level of the root gene.
DiscussionNetwork structure learning is a useful tool to help identifyunknown regulatory or causal relationships between vari-ables (features) in a system. With the rise of systems-scale“omics” data over the past two decades, structure learningmethods have been applied with increasing frequency tobiological systems for the discovery of new modules, path-ways, and regulation. However, in many cases the numberof samples available in “omics”-scale studies is small, par-ticularly in the case of complex model systems (such asnon-human primates). In addition, while these techniquesoften include measurements for many variables or features(genes, metabolites, etc.), often only a small fraction ofthem are directly relevant to the phenomenon being stud-ied. Secondary or indirect effects may make many moregenes appear to be highly correlated with each other andwith a phenomenon of interest, and these indirect effectshinder the identification of the real regulatory relationshipsin complex systems.
A tree-like network inference approach based on classifierlearning algorithmsTo address the issues associated with network learning incomplex model systems, we hypothesized that Bayesiannetwork-based classifiers that have been proven to be ef-fective with few samples and with many features may, withintheir networks, have the potential to capture importantregulatory structure in addition to their classification
Table 4 Features in the child network selected for model inclusion using a dimensional-reduction screening procedure, with node 2(selected automatically) as the root
Sample size Indices of features identified as significant Fraction of real features selected Fraction of noisy features selected
50 Real features: 3,4,5,6,7,8,9,12,14,15,20 58 % 2.5 %
Noisy features: 96,113,119,174,175
100 Real features: 1,4,5,6,7,8,9,11,12,14,15,20 63 % 0.5 %
Noisy features: 161
150 Real features: 3,4,5,6,7,8,9,11,12,14,15,20 63 % 2 %
Noisy features: 70,79,116,208
200 Real features: 3,4,5,6,7,8,9,11,12,14,15,20 63 % 1 %
Noisy features: 75,94
300 Real features: 3,4,5,6,7,8,9,10,11,12,14,15,20 68 % 3.5 %
Noisy features: 121,126,198,205,207,209,211
400 Real features: 1,3,4,5,6,7,8,9,10,11,12,14,15,20 74 % 2.5 %
Noisy features: 31,55,94,113,195
500 Real features: 1,3,4,5,6,7,8,9,10,11,12,13,14,15,19,20 84 % 3.5 %
Noisy features: 22,122,152,157,166,192,218
Yin et al. BMC Systems Biology (2015) 9:49 Page 13 of 18

prediction. Accordingly, we created a new structurelearning method, the tree-like Bayesian structure learningalgorithm (TL-BSLA), which refined a previously demon-strated effective tree-like Bayesian network classifier by
removing limitations on network topology (though stillwithin the constraints of a tree-like network). We chose tofocus on Bayesian network structures because they typic-ally provide a more succinct representation of regulatory
Fig. 5 Tree-like Bayesian networks learned from transcriptional data of a malaria challenge experiment in Macaca mulatta. Networks were learnedusing blood informative transcripts [21] to focus on potential Axes of variation in the transcriptional data. a Using the ten blood informativetranscripts as originally published, two branches emerge that best describe the root (selected automatically and which is from Axis 3), consistingof other genes from Axis 3 and a combination of multiple genes from Axes 2, 4, and 7. b Using the top 25 genes from each Axis to build anetwork based on the same root, the relationship between the Axes becomes even more evident, as both Axis 2 and Axis 7 contribute thedominant genes in parallel branches of the tree, suggesting significant but distinct mutual information with their parent and ultimately with theroot. These relationships were not evident using standard multivariate and clustering analyses, and were not expected a priori based on previousdescriptions of the axes of variation and the fact that the gene lists were derived from whole blood, not bone marrow aspirate, transcriptionalprofiling analyses
Yin et al. BMC Systems Biology (2015) 9:49 Page 14 of 18

interactions than correlation-based networks, and becausethe relationships between features are highly suggestive ofdirect interaction or regulation, each of which are valuableproperties for driving validation experiments or mathem-atical modeling efforts.
Iterative structure arrangement steps enable learning ofnetwork connectionsIn the TL-BSLA, we improved upon the previous classifier-based approach in a number of ways. We refined the ar-rangement of nodes within branches to more accuratelyreflect the relationships between those nodes as opposedto just their (conditional) mutual information with theroot node. This entailed developing a strategy to itera-tively select nodes for inclusion in a branch and to ar-range their topology in a manner reflective of likelyinteractions based on mutual information and condi-tional mutual information.Using four different networks as examples, we supported
our hypothesis on the utility of network-based classifiers forlearning regulatory structure via the effectiveness of theproposed TL-BSLA to infer reasonable regulatory networksfor a variety of different underlying topologies. For the sys-tems with tree-like structures (e.g., synthetic-tree andChild), even with a limited number of samples (50 or 100samples), the algorithm could recover most of the correctconnections with a lower false positive rate than a com-monly used structure learning algorithm, SCA.While it may not be surprising that an algorithm de-
signed to learn trees can perform fairly well for under-lying networks that do in fact resemble trees, we positthat it is still surprising that it performs substantiallybetter than an existing, widely-used structure learningapproach like SCA. The underlying networks are sparseand are ultimately rather simplified Bayesian networks;one would expect such networks to actually be fairlyeasy to infer for an algorithm like SCA. It is certainlypossible that the constraints of being a tree-like struc-ture contribute to the ability of TL-BSLA to infer accur-ate networks with fewer samples. Nonetheless, giventhat TL-BSLA can find more true positives with fewerfalse positives without any external information aboutthe true root of the system, this suggests its potentialwider utility, particularly for fairly simple networks.In networks without a tree-like structure (i.e. Alarm and
Asia), the algorithm was still able to recover a substantialportion of the original network. More importantly, wefound that the false positive rate of TL-BSLA was muchlower than SCA, which itself typically has a low false posi-tive rate [24]. This yielded a better positive predictivevalue for TL-BSLA, which makes it a more effective strat-egy for learning networks of relationships in biologicaldatasets under the constraint of small sample size.
Addition of other functionalities enables broaderapplicability of the algorithmWe addressed the inclusion of nodes via a feature selec-tion step in the algorithm. The previous classifier ex-cluded features based on a user-defined parameter thateliminated a fixed fraction of the features based on mu-tual information with the root. While this certainlymakes sense for learning a classifier (only those featuresmost directly related to the root node should be in-cluded), having a user parameter that so significantlyaffects the members and structure of a network is un-desirable for network learning. We used statistical ap-proaches to identify the features with statisticallysignificant mutual information with the root, which re-tains most of the relevant features with fairly low inclu-sion of irrelevant features. As shown in Table 4, thisscreening step shows good performance in separatingrelevant and non-relevant (noisy) features.We also addressed the issue of root selection to at-
tempt to generalize the algorithm to network learningwithout a target phenotype to be predicted. We usedmutual information-based statistical approaches to iden-tify the best candidates for roots, with robust selectionin the case of underlying tree-like structures and reason-able selection (though variable with different datasets)for underlying structures that are not tree-like.
Application to a malaria transcriptomics dataset providesleads on biological insightWe then applied this approach to a transcriptional datasetof bone marrow aspirates from a group of five M. mulattainfected with the simian malaria parasite P. cynomolgi. Fo-cusing on genes representing common Axes of transcrip-tional variation, we applied all aspects of our networkinference approach: selection of significant features basedon mutual information relative to resampled and per-muted data, identification of a root node based on the sig-nificance of the mutual information between the root andthe rest of the features, and then learning of tree-like net-work structure. The algorithm automatically constructeda network that was deeper than it was wide (suggestingsomewhat pathway-like behavior), although multiple inde-pendent branches within the network were learned.An initial network defined by the top ten most inform-
ative transcripts from each Axis suggested a possible re-lationship between four of the Axes; including moregenes in the analysis, it was clear that three of the Axes(2, 3, and 7) had a significant relationship. Each of themdominated a different branch in the network, showingthat they had significant relationships to the root gene(which is in Axis 3), but that the relationships for eachAxis to the root gene were different (since their separ-ation into different branches was based on unique con-ditional mutual information).
Yin et al. BMC Systems Biology (2015) 9:49 Page 15 of 18

The Axes of variation represent sets of genes that arepositively co-regulated in peripheral blood data sets inhumans, where each Axis tends to capture an aspect ofblood and immune system biology. Notably here, Axis 3is enriched for B-cell signaling, Axis 2 for erythropoiesis,and Axis 7 for interferon signaling. These Axes are notstrongly evident in the bone marrow since the majorblood cell types have not yet differentiated, but the tree-like Bayesian network nevertheless recovers nascent re-lationships. It is particularly notable that Axis 3 falls outas a separate branch, since there is no sign in thesegraphs of Axis 1, which largely captures T-cell signaling,nor of Axis 5, which is closely related to neutrophil ac-tivity and inflammation. We would thus argue that ouralgorithm is capable of capturing the earliest stages ofcellular differentiation during leukopoiesis when seededwith genes that are markers for the mature cell types.This finding is particularly noteworthy for a number of
reasons. First, the Axes of variation as originally derivedhad fairly low covariation with each other, with a few ex-ceptions. However, none of those exceptions were ob-served here, and relationships between Axes 2, 3, and 7were not previously observed. Second, the Axes were de-rived from whole blood transcriptional profiling, so therewas not an expectation that the same variation shouldbe seen in bone marrow aspirate transcriptional profil-ing. Their observability in bone marrow aspirates sup-ports broader utility of this approach to transcriptionalanalysis. Finally, and most importantly, the relationshipstructure between Axes 2, 3, and 7 was not identifiedfrom standard clustering and statistical analysis of thetranscriptional data (analyses not shown). Based onstandard multivariate analyses there was not an obviousrelationship between these Axes; only through the con-sideration of conditional mutual information and a net-work of interactions between genes were we able toidentify robust relationships between Axes. Thus, theBayesian, tree-like network analysis contributed uniquelyto understanding and interpretation of the data.Thus, by identifying the likely expression relationships
in our experiments of these genes revolving aroundrelated themes (B-cell signaling, erythropoiesis, andinterferon-mediated response), the network-based ana-lysis has contributed to interpretation of the data and ul-timately to directing future efforts in our studies of thehost-pathogen interaction in malaria using non-humanprimate models.
Limitations and caveatsThe requirement for our learned structure to be tree-like is an inherent limitation to our approach, as bio-logical networks are not necessarily tree-like. Therecould be significant cross-talk or combinatorial regula-tion on a given node in a true biological network.
However, the networks learned by TL-BSLA are a rea-sonable approximation even to underlying networks thatare not strongly tree-like. Moreover, multiple trees in-ferred starting from different roots could potentially bepieced together to provide a more complex network rep-resentative of multiple subnetworks but that is not tree-like. (This would also mitigate the lower true positiverate of TL-BSLA in non-tree-like networks, with itshigher positive predictive value supporting the potentialof this approach.) If nothing else, the tree-like networkapproach would serve as an excellent starting point for asearch-and-score heuristic structure learning algorithmand would help to identify which subset of nodes shouldbe included in such a search.For our comparator algorithm we used SCA, chosen
since it is a well-known and widely-used structural learn-ing algorithm with better avoidance of false positives thanmany other Bayesian structure learning algorithms (an im-portant aspect of our structure learning goals). Countlessother algorithms could have been used as comparators;nonetheless, the commonality to many of those algo-rithms is their inability to robustly learn networks underthe constraint of small sample size. In this sense, SCA is areasonable representative of existing algorithms, and TL-BSLA stands on its own as learning networks effectivelyunder this constraint. Moreover, an important goal of ourwork was to validate the hypothesis that methods devel-oped for classifier learning could have significant potentialfor learning network structure, which we have demon-strated here even if there are other Bayesian learning algo-rithms that perform slightly better than SCA.The idea that classifier learning could have significant
potential for identifying network structure has beenhinted at previously; in fact, one of the algorithms thatthe previous BN-TL classifier compared itself to expli-citly notes the potential for identifying valid relation-ships between features (in their case, specifically formass spectrometry data) [18]. However, this algorithmalso restricted itself to a very flat topology making it dif-ficult to find deeper, more complex regulatory relation-ships as is enabled by the TL-BSLA.We also note that our approach did not exploit the tem-
poral aspect of the samples in constructing the network.This information could potentially enable improved struc-ture learning, whether by exploiting the relationship ofconsecutive samples or by enabling connections betweenvariables that represent regulatory loops as is possibleusing dynamic Bayesian networks [29–31]. However, ro-bustly learning dynamic Bayesian networks requires evenmore samples than learning general Bayesian networks,which is counter to the goal of the TL-BSLA.Finally, we note that for the transcriptional data, since
feature selection and root selection are based on permu-tations and resampling, replicate runs can yield slightly
Yin et al. BMC Systems Biology (2015) 9:49 Page 16 of 18

different results. Multiple runs were performed for thenetworks in Fig. 5, with the ones presented being highlyrepresentative of all of the runs; differences between runswere in the inclusion of a few different genes and resultingslight changes in topology at the bottom of a tree (thoughthe topology at the top of a tree is highly conserved).
ConclusionsTaking together the novel aspects of our tree-like struc-ture learning algorithm with the validation on transcrip-tional data from a malaria challenge experiment in a non-human primate macaque model system, we have shownthat Bayesian network-based classifiers can be the basisfor meaningful inference of regulatory network structure.The algorithm we designed for this task, TL-BSLA, is aneffective and useful algorithm for structure learning in sys-tems biology data under the constraint of small samplesize and is better than an existing, widely-used structuralinference algorithm. We have demonstrated its efficacyfor systems exactly meeting its tree-like assumptions, forsystems that only slightly deviate from tree-like assump-tions, and for systems that deviate substantially from tree-like assumptions. By including data-specific assessment ofthe significance of mutual information, we have enabledthe identification of a reasonable root for an arbitrarydataset, as well as the identification and elimination ofspurious features. We believe this approach has particu-larly significant promise for the integration of differenttypes of datasets, where some molecular-level explan-ation (e.g., gene expression) is desired that explains someobserved phenotype (e.g., clinical parameter) that canserve as the root of the tree-like structure. This repre-sents a promising addition to the set of tools for prob-abilistic graphical model and Bayesian structure learning,filling a need for high-confidence analysis of complexsystems with few samples and many variables.
Availability and requirementsProject name: Tree-like Bayesian Structure LearningAlgorithmProject home page: http://styczynski.chbe.gatech.edu/TL-BSLA (also available as supplementary informationfor this paper)Operation system: Platform independentProgramming language: MATLABOther requirements: developed on MATLAB R2011a;backwards compatibility unknownLicense: FreeBSDRestrictions for non-academic use: None.
Additional file
Additional file 1: Supplementary Figures, Tables, andMethods. (DOCX 993 kb)
AbbreviationsBN-TL: Tree-like Bayesian network classifier; FPR: False positive rate; PPV: Positivepredictive value; SCA: Sparse candidate algorithm; TL-BSLA: Tree-like Bayesianstructure learning algorithm; TPR: True positive rate.
Competing interestsThe authors declare that they have no competing interests.
Authors’ contributionsWY conceived of the study, implemented the structure learning algorithm,designed and carried out the computational experiments, and helped draftthe manuscript. SG processed the transcriptional data, helped analyze thelearned transcriptional network, and helped draft the manuscript. MRG andAM designed and supervised the animal experiments providing the samplesfor the transcriptional dataset. MPS conceived of the study, participated in itsdesign and coordination, and drafted the manuscript. All authors revised themanuscript, and read and approved the final manuscript.
AcknowledgementsThe authors thank all of the members of MaHPIC for their contributions tothe project that helped enable the generation of the dataset used in thiswork. The authors in particular thank Gregory Gibson for his suggestions,support with the transcriptional analysis, and feedback on the manuscript.They also thank Megan Cole for critical review of and suggestions for themanuscript. The authors thank Zachary Johnson and the Yerkes GenomicsCore for performing the sequencing for the transcriptional data, and AlekseyZimin and Rob Norgren for providing annotated M. mulatta genomesequence for the transcriptional data. This project has been funded in wholeor in part with federal funds from the National Institute of Allergy andInfectious Diseases; National Institutes of Health, Department of Health andHuman Services [Contract No. HHSN272201200031C].
Author details1Key Laboratory for Biomedical Engineering of Education Ministry,Department of Biomedical Engineering, Zhejiang University, Hangzhou, P. R.China. 2School of Chemical & Biomolecular Engineering, Georgia Institute ofTechnology, 311 Ferst Drive NW, Atlanta, GA 30332-0100, USA. 3School ofBiology, Georgia Institute of Technology, Atlanta, GA, USA. 4Division ofInfectious Diseases, Emory Vaccine Center, Yerkes National Primate ResearchCenter, Emory University School of Medicine, Emory University, Atlanta, GA,USA.
Received: 30 April 2015 Accepted: 6 August 2015
References1. Barrenas F, Palermo RE, Agricola B, Agy MB, Aicher L, Carter V, et al. Deep
transcriptional sequencing of mucosal challenge compartment from rhesusmacaques acutely infected with simian immunodeficiency virus implicatesloss of cell adhesion preceding immune activation. J Virol. 2014;88:7962–72.
2. Peng X, Thierry-Mieg J, Thierry-Mieg D, Nishida A, Pipes L, Bozinoski M, et al.Tissue-specific transcriptome sequencing analysis expands the non-humanprimate reference transcriptome resource (NHPRTR). Nucleic Acids Res.2015;43:D737–42.
3. Salinas JL, Kissinger JC, Jones DP, Galinski MR. Metabolomics in the fightagainst malaria. Mem Inst Oswaldo Cruz. 2014;109:589–97.
4. Joyner C, Barnwell JW, Galinski MR. No more monkeying around: primatemalaria model systems are key to understanding Plasmodium vivax liver-stage biology, hypnozoites, and relapses. Front Microbiol. 2015;6:145.
5. Hecker M, Lambeck S, Toepfer S, van Someren E, Guthke R. Gene regulatorynetwork inference: data integration in dynamic models-a review.Biosystems. 2009;96:86–103.
6. Styczynski MP, Stephanopoulos G. Overview of computational methods for theinference of gene regulatory networks. Comput Chem Eng. 2005;29:519–34.
7. Zuk O, Margel S, Domany E. On the Number of Samples Needed to Learnthe Correct Structure of a Bayesian Network. in Proceedings of the Twenty-Second Conference on Uncertainty in Artificial Intelligence (UAI2006)(Cambridge, MA, USA).
8. Yin W, Kissinger JC, Moreno A, Galinski MR, Styczynski MP. From genome-scaledata to models of infectious disease: a Bayesian network-based strategy to
Yin et al. BMC Systems Biology (2015) 9:49 Page 17 of 18

drive model development. Math Biosci. 2015 in press. doi:10.1016/j.mbs.2015.06.006
9. Young WC, Raftery AE, Yeung KY. Fast Bayesian inference for generegulatory networks using ScanBMA. BMC Syst Biol. 2014;8:47.
10. Friedman N, Linial M, Nachman I, Pe’er D. Using Bayesian networks toanalyze expression data. J Comput Biol. 2000;7:601–20.
11. Tsamardinos I, Brown LE, Aliferis CF. The max-min hill-climbing Bayesiannetwork structure learning algorithm. Mach Learn. 2006;65:31–78.
12. Chickering DM, Heckerman D, Meek C. Large-sample learning of Bayesiannetworks is NP-hard. J Mach Learn Res. 2004;5:1287–330.
13. Kotsiantis SB, Zaharakis ID, Pintelas PE. Machine learning: a review ofclassification and combining techniques. Artif Intell Rev. 2006;26:159–90.
14. Carvalho AM, Oliveira AL, Sagot MF. Efficient learning of Bayesian networkclassifiers - An extension to the TAN classifier. Ai 2007: Advances in ArtificialIntelligence, Proceedings. 2007;4830: 16–25.
15. Friedman N, Geiger D, Goldszmidt M. Bayesian network classifiers. MachLearn. 1997;29:131–63.
16. Lin X, Ma P, Li X, Jiang J, Xiao N, Yang F. A learning method of Bayesiannetwork structure. In: Fuzzy Systems and Knowledge Discovery (FSKD), 9thInternational Conference on 666–70. Sichuan, China: IEEE; 2012.
17. Cooper GF, Herskovits E. A Bayesian Method for the Induction ofProbabilistic Networks from Data. Mach Learn. 1992;9:309–47.
18. Kuschner KW, Malyarenko DI, Cooke WE, Cazares LH, Semmes OJ, Tracy ER.A Bayesian network approach to feature selection in mass spectrometrydata. BMC Bioinformatics. 2010;11:177.
19. Moreno A, Cabrera-Mora M, Garcia A, Orkin J, Strobert E, Barnwell JW, et al.Plasmodium coatneyi in rhesus macaques replicates the multisystemicdysfunction of severe malaria in humans. Infect Immun. 2013;81:1889–904.
20. Lee KJ, Yin W, Arafat D, Tang Y, Uppal K, Tran V, et al. Comparativetranscriptomics and metabolomics in a rhesus macaque drug administrationstudy. Front Cell Dev Biol. 2014;2:54.
21. Preininger M, Arafat D, Kim J, Nath AP, Idaghdour Y, Brigham KL, et al.Blood-informative transcripts define nine common axes of peripheral bloodgene expression. PLoS Genet. 2013;9:e1003362.
22. Friedman N, Nachman I, Peer D. Learning Bayesian network structure frommassive datasets: The “sparse candidate” algorithm. Uncertainty in ArtificialIntelligence, Proceedings; 1999. 206–15.
23. Aliferis CF, Tsamardinos I, Statnikov AR, Brown LE. Causal explorer: A causalprobabilistic network learning toolkit for biomedical discovery Metmbs'03:Proceedings of the International Conference on Mathematics and EngineeringTechniques in Medicine and Biological Sciences; 2003. 371–6.
24. Abu-Hakmeh KA. Assessing the use of voting methods to improve Bayesiannetwork structure learning. Georgia Institute of Technology: Georgia; 2012.
25. Spirtes P, Glymour C, Meek C. Causation, Prediction, and Search. New York:Springer; 1993.
26. Cheng J, Greiner R, Kelly J, Bell D, Liu WR. Learning Bayesian networks fromdata: An information-theory based approach. Artif Intell. 2002;137:43–90.
27. Li J, Lenferink AE, Deng Y, Collins C, Cui Q, Purisima EO, et al. Identificationof high-quality cancer prognostic markers and metastasis network modules.Nat Commun. 2010;1:34.
28. Steuer R, Kurths J, Daub CO, Weise J, Selbig J. The mutual information:detecting and evaluating dependencies between variables. Bioinformatics.2002;18 Suppl 2:S231–40.
29. Boyen X, Friedman N, Koller D. Discovering the hidden structure of complexdynamic systems Uncertainty in Artificial Intelligence, Proceedings; 1999. 91–100.
30. Ghahramani Z. Learning dynamic Bayesian networks. Adaptive Processing ofSequences and Data Structures. 1998;1387:168–97.
31. Husmeier D. Sensitivity and specificity of inferring genetic regulatoryinteractions from microarray experiments with dynamic Bayesian networks.Bioinformatics. 2003;19:2271–82.
Submit your next manuscript to BioMed Centraland take full advantage of:
• Convenient online submission
• Thorough peer review
• No space constraints or color figure charges
• Immediate publication on acceptance
• Inclusion in PubMed, CAS, Scopus and Google Scholar
• Research which is freely available for redistribution
Submit your manuscript at www.biomedcentral.com/submit
Yin et al. BMC Systems Biology (2015) 9:49 Page 18 of 18