a tour-based mode choice model for commuters in...
TRANSCRIPT

sustainability
Article
A Tour-Based Mode Choice Model for Commutersin Indonesia
Faza Fawzan Bastarianto 1,2, Muhammad Zudhy Irawan 1,* , Charisma Choudhury 2,David Palma 2 and Imam Muthohar 1
1 Department of Civil and Environmental Engineering Universitas Gadjah Mada, Jln. Grafika No.2Bulaksumur, 55281 Yogyakarta, Indonesia; [email protected] (F.F.B.);[email protected] (I.M.)
2 Institute for Transport Studies University of Leeds, 34-40 University Road, Leeds LS2 9JT, UK;[email protected] (C.C.); [email protected] (D.P.)
* Correspondence: [email protected]; Tel.: +62-878-386-90515
Received: 19 December 2018; Accepted: 30 January 2019; Published: 2 February 2019�����������������
Abstract: With the advent of activity-based modelling, transport planners’ focus has shifted fromisolated trips to tours. Tours are series of interconnected trips that start and finish at home. There aredifferent types of tours; we focus on two: hwh (start at home; go to work; and then go back home)and hw+wh (where + represents a non-work activity). Tour types introduce a new dimension to thetraditional problem of travel mode choice, as the mode choice might be influenced by the type oftour. This study attempts to measure and compare the relationship between tour type and modechoice using three different modelling approaches: Multinomial Logit (MNL); Nested Logit (NL)and Cross-Nested Logit (CNL). We compare each approach using secondary data from a largersurvey: 24-h daily activity patterns of 420 commuters between Bekasi and Jakarta; one of the busiestcommuting routes in Indonesia. Among other results, we found that gender and income significantlyinfluence commuter’s choice of mode and that reducing travel time and cost can increase the ridershipof public transport. Furthermore, the NL and CNL models showed significant improvement overthe simpler MNL when grouping the alternatives based on tour types. This points to a significantinfluence of the tour type on the mode choice. Policy recommendations to increase traveler’swellbeing are also formulated.
Keywords: tour-based mode choice; commute; revealed preference; nested logit; cross-nested logit
1. Introduction
As the capital city of Indonesia, Jakarta is a big attraction to the cities surrounding it, such asBogor, Depok, Tangerang, and Bekasi. Thus it generates trips which are growing every year due toincreasing urbanization. Bekasi, which is a city located on the east side of Jakarta, contributes thelargest number of commuters to Jakarta consisting of about 14.8% [1]. This number consists of 204,240commuters who use different modes for their trips, such as private car, motorcycle, bus, commuter line(hereafter: KRL), minibus, online taxi, etc. As many commuters travel to Jakarta from Bekasi, there aresome problems between these two cities, such as severe traffic congestion and lack of high qualitypublic transport serving the two cities. Therefore, there is a need for robust mode choice models toinvestigate the behavior of commuters between these two cities.
Review of related literature shows that the mode choice decisions are affected not only by thelevel-of-service of the modes (e.g., travel time, cost, etc.), but also the purpose and nature (e.g., numberof stops, trip-chain pattern, etc.) [2]. As a result, tour-based mode choice analysis have been conductedin developed countries up to today. Examples include the European national models in countries
Sustainability 2019, 11, 788; doi:10.3390/su11030788 www.mdpi.com/journal/sustainability
Sustainability 2019, 11, 788 2 of 20
such as The Netherlands [3], Sweden [4,5], and Denmark [6], or US cities such as San Francisco [7,8],Boston [9], and Portland [10]. However, there are fewer studies of travel behaviour specifically intour-based mode choice in developing countries [11]. The reason for this might be related to a lack ofdata relating to either surveys of household travel or traffic pattern and other resource limitations.
The tours themselves have many variations such as hwh, hwh+, hw+wh, hw+wh+, hw++wh, hsh,hs+sh, hs++sh. Description of these kinds of tour types are for the tour types that have “w” and “s”representing tour type including at least one work (w) activity and one school (s) activity, respectively.The symbol (+)represents that the tour includes one additional stop for another activity [9], and thesymbol “h” represents home. Understanding the relationship between tour types and modes is vitalfor sustainable planning and policy strategies aimed at private vehicles reduction and public transportpromotion. Thus, the tour-based mode choice of the commuters specifically in a developing countrywill be the emphasis of this study.
Concerning methodology and model structure, to date, many studies have used the multinomiallogit (MNL), nested logit (NL), and cross-nested logit (CNL) models. The MNL model is a traditionallogit model, which is widely used in transport research due to its simplicity and reliability. The NLmodel is an extension of the MNL model, where the choices can be structured in different levels andnests, each nest grouping correlated alternatives, in such a way that each alternative can only belong toone nest. Finally, the CNL model is a generalization of the NL model, allowing alternatives to belongto more than one nest [12]. Hess et al. [13] point out that the CNL model can capture more correlationpatterns of alternatives rather than a three-level NL structure, in a multi-dimensional choice process.However, there is an absence of studies comparing different logit model structures specifically indeveloping countries.
Therefore, the main aim of this investigation is to develop logit model structures of tour-basedmode choice model for commuters in developing countries, specifically from Bekasi to Jakarta.The study focuses on analysing the relationship between the tour types and mode choice of thecommuters, and investigating the attributes that influence the commuters on choosing their modeand tour type. The mode choice will be based on characteristics of the respondents. This study willalso explore different logit model structures between simple choice model or MNL, NL, and advancedchoice model or CNL to see which structure best estimates the relationship between the tour typesand mode choice. Also, the results of this study could be analysed further to formulate policyrecommendation to improve the trip quality of the commuters from Bekasi to Jakarta.
2. Literature Review
2.1. Tour-Based Model
The tour-based modelling approach assumes a trip chain as the basic decision unit for anindividual. Trip chains start at an individuals’ home, take them to one or more activity locations,and finish at the starting point [9]. The tour-based model approach can be used to developmore complex disaggregate choice modelling, such as activity-based model and tour-based modechoice model. This study, however, uses a tour-based mode choice model for analysing the data.The tour-based mode choice model can give us a better understanding of the relationship of individualdecision to travel in daily activity with a particular mode used [14]. Some factors influence individuals’travel mode choice, such as built environment factors, socio-economic factors, attitudinal factors, andtrip chain [15].
In terms of modelling a large class of models with the set of alternatives which can be partitionedinto subsets, a NL specification is a common model structure used especially for tour-based modechoice since it can effectively model multidimensional choice processes in a natural hierarchy [9],unlike other discrete choice models. Since this model has two-levels of modelling; the marginalprobabilities (upper model) and the conditional probabilities (lower models), which subsequently will
Sustainability 2019, 11, 788 3 of 20
be incorporated into a nest [12]. In the case of the tour-based mode choice model, the upper levels arethe tour type and the lower levels are travel modes used.
The studies undertaken by Ho and Mulley [16] used two-levels NL model to investigate thetour-based mode choice of joint household travel patterns in Sydney. Their model structure is dividedinto joint travel patterns in the upper level and travel modes in the lower level. The upper levelrepresents an individual’s choice of joint travel activity amongst household members while the lowerlevel exhibits an individual’s choice of main travel mode between public transport, car, and walking.By separating alternatives into two levels, this model has allowed each household member to choose themain travel mode to maximise their personal utility on their choice of joint travel patterns. The results ofthe model show that higher joint household travel in the weekend days is directed toward recreationaland maintenance trips by using public transport. Meanwhile, in contrast, weekday travel is moreoriented to work, and education trips by either individuals or shared rides are dominated by thecar mode.
Another study of modelling approach conducted by Miller et al. [14] gives a comprehensiveexplanation of tour-based mode choice. The tour-based mode choice model in its study is modelledby determining the travel mode for each trip on an individual’s home-based tour which consistsof a set of trip chains from home to one or more destinations including a non-homebased tour.The non-home-based tour consists of the trips that start from a particular place, such as workplace,school, market, etc., and end at the same place. A conceptual model of its approach is to integratethe tour level and travel mode level in a single tour. The results of the model show a good fit of themodel with over 89% of observed modes being chosen on average. The predicted mode shares are veryclosely matched with observed mode shares. This is different with conventional logit model wherepredicted, and observed mode shares are forced to be relatively matched by using some selection ofalternative-specific parameter values.
Furthermore, there is a vast amount of literature examining tour-based mode choice using simplechoice models such as NL and MNL, but it is a challenge to find relevant literature about modellingtour-based mode choice using advanced mode choice model. Thus, it is essential to develop thetour-based mode choice model using advanced mode choice, such as using CNL, since this model isbelieved to have more significant results than the other three kinds of NL models [17].
2.2. Travel Behavior Studies in Jakarta, Indonesia
Several studies about travel behaviour in Jakarta and developing countries have been undertakenby researchers in recent years. These studies are critical for stakeholders to determine the outcomesof policies before implementing them. Even though conducting these studies is essential, there arefew studies of tour-based mode choice in developing countries. Most of the studies that have beenundertaken focus on mode choice [18–21], travel behaviour [22–24], and activity-travel patterns [25,26].While their results are useful to inform policy, they tend to ignore the influence of tour type on modechoice or focus on time of use more than travel behavior.
However, there are several studies which have been done mainly in Jakarta. Most of the studiesused data collected from The National Planning and Development Agency of the Republic of Indonesia(Bappenas) and Japan International Cooperation Agency (JICA) which conducted a household travelsurvey from 28th of June 2002 to 8th of November 2002. This data aimed to study an integratedtransportation master plan (SITRAMP) 2004 over Jakarta Metropolitan Area (JMA). Still, there aredeficient studies with other data sources to investigate further of disaggregate choice model in Jakarta.
The study of Yagi and Mohammadian [27] using SITRAMP 2004 data focused on joint modelsof home-based tour to build an activity-based modelling framework for Jakarta. They used a NLmodel to develop four different activity types; work, school, maintenance, and discretionary. Travelmodes are divided into the eight most commonly used modes in the region. The overall results ofthe model show that the model structure, choice alternatives, and critical variables significantly differfrom other activity-based models in developed countries. In Jakarta, they found that shared ride is

Sustainability 2019, 11, 788 4 of 20
often associated with people who employ chauffeurs, meaning that this mode is common amonghigh-income people. Income has a significant influence on mode choice. For instance, the utility of aprivate vehicle or a taxi increases as income rises, while the utility of a motorcycle, public transport,and non-motorized transport increases as income declines. Gender, age, and status of individualsdirectly increase the utilities of specific travel modes. Male respondents have higher use of privatevehicles and females have higher use of public transport and taxis. In addition, full-time workers havegreater use of private modes and homemakers have greater use of non-motorized transport.
Using the same SITRAMP 2004 data, Dharmowijoyo et al. [28] examined the variability intravellers’ activity-travel patterns in JMA. The explanatory variables are daily constraints, land use,road network conditions, and resources. The study looks at the influences of these variables onactivity-travel patterns such as travel mode choices, a number of trips, trip chains, departure time,and total daily travel time interact with each other. The trips are made by workers, students,and non-workers. The results show that some variables influencing activity-travel patterns indeveloping countries are similar to developed countries, but others differ. The variables, such asindividual, household, transport network, and land use, significantly influence workers and students’activity-travel patterns, with the exception of the departure time variable. They are more likely touse motorised modes to travel and have lesser daily trips for those who have high-income than otherincome levels. Their activity-travel patterns are also more predictable, especially during weekdays,and more flexible during weekend days. On the other hand, because non-workers have much moreflexible time, they are not significantly influenced by departure time, travel time spent, and modeshares. Furthermore, older non-workers have daily trips with more trip chains using motorised modesthan others.
3. Methodology
The relationship between tour type and mode of travel has been mostly modelled using logitmodels such as MNL [29] and NL [16]. Meanwhile, one of the advanced logit models, CNL, has rarelybeen used in modelling this relationship. The simplicity of MNL was one consideration that this specificmodel is selected, following NL which could estimate the correlation among different alternativeswithin specific groups or nests. Finally, one of the most advanced logit models, CNL, is used toestimate the correlation among alternatives in different groups or nests.
We tested a single NL model structure, with two levels, where the upper level captures thetour types, while the lower level represents a joint choice of mode choice and tour type. Meanwhile,the CNL structure has four nests based on tour types (hwh and hw+wh) and vehicle types (privatevehicles and public transport). Additionally, we estimated a simpler MNL model without any nest.Figures 1–3 present the structures of these models.
Sustainability 2019, 11 FOR PEER REVIEW 5
Alternative 5
(HW+WH_MC)
Decision‐maker takes hw+wh tour type and chooses motorcycle as a
mode of travel to commute
Alternative 6
(HW+WH_CAR)
Decision‐maker takes hw+wh tour type and chooses a car as a mode of
travel to commute
Alternative 7
(HW+WH_BUS)
Decision‐maker takes hw+wh tour type and chooses a public transport
bus as a mode of travel to commute
Alternative 8
(HW+WH_KRL)
Decision‐maker takes hw+wh tour type and chooses KRL commuter
line train as a mode of travel to commute
The utility function of each alternative is different since varying parameters are included in each
function. Each parameter is assumed to have significant effect on the value of utility. The utility
function for all alternatives is presented in Equation (1) to Equation (8) below.
𝑈 _ 𝐴𝑆𝐶 𝐴𝑆𝐶 𝛽 ∗ 𝑇𝐶 𝛽 ∗ 𝑇𝑇 𝛽𝐼𝑁𝐶 ∗ 𝐿𝑂𝑊 𝐼𝑁𝐶𝑂𝑀𝐸 (1)
𝑈 _ 𝐴𝑆𝐶 𝐴𝑆𝐶 𝛽 ∗ 𝑇𝐶 𝛽 ∗ 𝑇𝑇 𝛽𝐼𝑁𝐶 ∗ 𝐻𝐼𝐺𝐻 𝐼𝑁𝐶𝑂𝑀𝐸 (2)
𝑈 _ 𝐴𝑆𝐶 𝐴𝑆𝐶 𝛽 ∗ 𝑇𝐶 𝛽 ∗ 𝑇𝑇 𝛽𝐺𝐸𝑁 ∗ 𝐹𝐸𝑀𝐴𝐿𝐸 (3)
𝑈 _ 𝐴𝑆𝐶 𝐴𝑆𝐶 𝛽 ∗ 𝑇𝐶 𝛽 ∗ 𝑇𝑇 𝛽𝐺𝐸𝑁 ∗ 𝐹𝐸𝑀𝐴𝐿𝐸 (4)
𝑈 _ 𝐴𝑆𝐶 𝛽 ∗ 𝑇𝐶 𝛽 ∗ 𝑇𝑇 𝛽𝐼𝑁𝐶 ∗ 𝐼𝑁𝐶 1 𝛽∗ 𝑃𝐴𝑅𝑇 𝑇𝐼𝑀𝐸 𝑊𝑂𝑅𝐾𝐸𝑅
(5)
𝑈 _ 𝐴𝑆𝐶 𝛽 ∗ 𝑇𝐶 𝛽 ∗ 𝑇𝑇 𝛽𝐼𝑁𝐶 ∗ 𝐻𝐼𝐺𝐻 𝐼𝑁𝐶𝑂𝑀𝐸𝛽 ∗ 𝑃𝐴𝑅𝑇 𝑇𝐼𝑀𝐸 𝑊𝑂𝑅𝐾𝐸𝑅
(6)
𝑈 _ 𝐴𝑆𝐶 𝛽 ∗ 𝑇𝐶 𝛽 ∗ 𝑇𝑇 𝛽𝐺𝐸𝑁 ∗ 𝐿𝑂𝑊 𝐼𝑁𝐶𝑂𝑀𝐸 𝛽∗ 𝑃𝐴𝑅𝑇 𝑇𝐼𝑀𝐸 𝑊𝑂𝑅𝐾𝐸𝑅
(7)
𝑈 _ 𝛽 ∗ 𝑇𝐶 𝛽 ∗ 𝑇𝑇 𝛽𝐺𝐸𝑁 ∗ 𝐿𝑂𝑊 𝐼𝑁𝐶𝑂𝑀𝐸 𝛽∗ 𝑃𝐴𝑅𝑇 𝑇𝐼𝑀𝐸 𝑊𝑂𝑅𝐾𝐸𝑅
(8)
The equations above show the utility function for all alternatives. The βTC, βTT, βINCL MC, βINCH
CAR, βGEN, and βPURPOSE are the dummy variables of mode and socio‐demographic of the commuters
related to travel cost, travel time, low income for motorcycle users, high income for car users, gender,
and travel purpose. These dummy variables will explicitly indicate the behavioural trend of
commuters in choosing their mode choice and tour types. The alternative specific constant (ASC) of
each alternative shows the average effect on the utility of all factors outside of the observed
parameters [12]. The presence of alternative specific constant in each function eliminates the error
term or unobserved portion of utility ε in the utility function. Moreover, a variety of alternative
specific dummies are included in the model to investigate the household travel behaviour and
attitudes such as income, gender, and travel purpose of the commuters. Meanwhile, the differences
between three logit models will be described and drawn in the figures below.
T1 MC T1 C T1 BUS T1 KRL T2 MC T2 C T2 BUS T2 KRL
Figure 1. Multinomial logit model structure.
The MNL model structure is drawn in Figure 1 above. There are eight alternatives to the model
which have the same level of choices. Where T represents the tour type of the commuters, which is
divided into T1 and T2 to represent hwh and hw+wh, while MC, C, BUS, and KRL are motorcycle,
car, bus, commuter line train, respectively.
Figure 1. Multinomial logit model structure.Sustainability 2019, 11 FOR PEER REVIEW 6
T1 (hwh) T2 (hw+wh)
T2 MC T2 C T2 BUST1 MC T1 C T1 BUS T1 KRL T2 KRL
Figure 2. Nested logit model structure.
Figure 2 illustrates the model structure of NL that is deployed in this study. This model structure
is a two‐level NL where the upper level is partitioned of tour type into two nests and the lower level
is the joint choice of tour types and travel mode of the commuters. Thus, by using a NL model, the
correlation between these two tour types will be explored in this model.
Private Vehicle
T1 (hwh) T2 (hw+wh)
T2 MC T2 C T2 BUST1 MC T1 C T1 BUS T1 KRL T2 KRL
Public Transport
Figure 3. Cross‐nested logit model structure.
Figure 3 above demonstrates that the CNL model is similar with NL, but the alternatives in the
lower level could be the member of one or more nest in the upper level. In this model, the upper level
consists of four nests: hwh, hw+wh, private vehicle, and public transport, whereas the lower level
includes joint choice of tour types and modes. Each joint choice belongs to two nests both tour type
and vehicle type. However, this structure can be drawn in NL structure but it requires either two
different NL structures based on tour types and vehicle types or combined nest in three level NL
structure based on the study conducted by Hess et al. [13]. Therefore, by using the CNL structure
from this model, the correlation pattern among alternatives across the nest can be more easily
apprehended.
4. Data Description
4.1. Study Area
The capital city of Indonesia, Jakarta, has a population of 10,277,628 which is around 3.97% of
the total Indonesian population [30]. The administrative, industrial, and commercial activity in
Indonesia is centralised in Jakarta. This causes rapid development in Jakarta where there are plentiful
constructions sites, infrastructure facilities, as well as a fleet of public transport to increase the
mobility of the people inside and toward Jakarta. Therefore, it attracts many people in Indonesia to
work and live there as permanent residents. However, for the people who live in the cities
surrounding Jakarta, they are commuters. In terms of the origin‐destination (OD) of the commuters,
Bekasi city is set to be the origin, whereas the Special Region of Jakarta is chosen to be the destination,
including the municipalities within those two cities. The map of Jakarta Metropolitan Area (JMA) is
shown in Figure 4 below.
Figure 2. Nested logit model structure.

Sustainability 2019, 11, 788 5 of 20
Sustainability 2019, 11 FOR PEER REVIEW 6
T1 (hwh) T2 (hw+wh)
T2 MC T2 C T2 BUST1 MC T1 C T1 BUS T1 KRL T2 KRL
Figure 2. Nested logit model structure.
Figure 2 illustrates the model structure of NL that is deployed in this study. This model structure
is a two‐level NL where the upper level is partitioned of tour type into two nests and the lower level
is the joint choice of tour types and travel mode of the commuters. Thus, by using a NL model, the
correlation between these two tour types will be explored in this model.
Private Vehicle
T1 (hwh) T2 (hw+wh)
T2 MC T2 C T2 BUST1 MC T1 C T1 BUS T1 KRL T2 KRL
Public Transport
Figure 3. Cross‐nested logit model structure.
Figure 3 above demonstrates that the CNL model is similar with NL, but the alternatives in the
lower level could be the member of one or more nest in the upper level. In this model, the upper level
consists of four nests: hwh, hw+wh, private vehicle, and public transport, whereas the lower level
includes joint choice of tour types and modes. Each joint choice belongs to two nests both tour type
and vehicle type. However, this structure can be drawn in NL structure but it requires either two
different NL structures based on tour types and vehicle types or combined nest in three level NL
structure based on the study conducted by Hess et al. [13]. Therefore, by using the CNL structure
from this model, the correlation pattern among alternatives across the nest can be more easily
apprehended.
4. Data Description
4.1. Study Area
The capital city of Indonesia, Jakarta, has a population of 10,277,628 which is around 3.97% of
the total Indonesian population [30]. The administrative, industrial, and commercial activity in
Indonesia is centralised in Jakarta. This causes rapid development in Jakarta where there are plentiful
constructions sites, infrastructure facilities, as well as a fleet of public transport to increase the
mobility of the people inside and toward Jakarta. Therefore, it attracts many people in Indonesia to
work and live there as permanent residents. However, for the people who live in the cities
surrounding Jakarta, they are commuters. In terms of the origin‐destination (OD) of the commuters,
Bekasi city is set to be the origin, whereas the Special Region of Jakarta is chosen to be the destination,
including the municipalities within those two cities. The map of Jakarta Metropolitan Area (JMA) is
shown in Figure 4 below.
Figure 3. Cross-nested logit model structure.
The tour types from the data are divided into eight types as previously stated in the introduction.However, there are only two groups with high variations of tour type and mode choice that will beanalysed in this study: hwh and hw+wh.
In regard to mode choice, the private vehicles in this study are limited to private car andmotorcycle as these are the primary private vehicles used in the context of the Jakarta MetropolitanArea. Meanwhile, public transport is divided into bus and KRL commuter line train, since these twomodes are the modes with the highest occupancy of commuters.
The interaction between tour type and mode choice generates eight alternatives or sets of choiceswhich are described in Table 1.
Table 1. Sets of choices of alternatives in the model.
Set of Choices Description
Alternative 1 (HWH_MC) Decision-maker takes hwh tour type and chooses motorcycle as a modeof travel to commute
Alternative 2 (HWH_CAR) Decision-maker takes hwh tour type and chooses a car as a mode oftravel to commute
Alternative 3 (HWH_BUS) Decision-maker takes hwh tour type and chooses a public transport busas a mode of travel to commute
Alternative 4 (HWH_KRL) Decision-maker takes hwh tour type and chooses KRL commuter linetrain as a mode of travel to commute
Alternative 5 (HW+WH_MC) Decision-maker takes hw+wh tour type and chooses motorcycle as amode of travel to commute
Alternative 6 (HW+WH_CAR) Decision-maker takes hw+wh tour type and chooses a car as a mode oftravel to commute
Alternative 7 (HW+WH_BUS) Decision-maker takes hw+wh tour type and chooses a public transportbus as a mode of travel to commute
Alternative 8 (HW+WH_KRL) Decision-maker takes hw+wh tour type and chooses KRL commuterline train as a mode of travel to commute
The utility function of each alternative is different since varying parameters are included in eachfunction. Each parameter is assumed to have significant effect on the value of utility. The utilityfunction for all alternatives is presented in Equation (1) to Equation (8) below.
UHWH_MC = ASCHWH + ASCMC + βTC ∗ TCMC + βTT ∗ TTMC + βINCL MC ∗ LOW INCOME (1)
UHWH_CAR = ASCHWH + ASCCAR + βTC ∗ TCCAR + βTT ∗ TTCAR + βINCH CAR ∗ HIGH INCOME (2)
UHWH_BUS = ASCHWH + ASCBUS + βTC ∗ TCBUS + βTT ∗ TTBUS + βGENBUS ∗ FEMALE (3)
UHWH_KRL = ASCHWH + ASCKRL + βTC ∗ TCKRL + βTT ∗ TTKRL + βGENKRL ∗ FEMALE (4)

Sustainability 2019, 11, 788 6 of 20
UHW+WH_MC = ASCMC + βTC ∗ TCMC + βTT ∗ TTMC + βINCL MC ∗ (INCMC == 1) + βPURPOSE∗PART TIME WORKER
(5)
UHW+WH_CAR = ASCCAR + βTC ∗ TCCAR + βTT ∗ TTCAR + βINCH CAR ∗ HIGH INCOME+βPURPOSE ∗ PART TIME WORKER
(6)
UHW+WH_BUS = ASCBUS + βTC ∗ TCBUS + βTT ∗ TTBUS + βGENBUS ∗ LOW INCOME + βPURPOSE∗PART TIME WORKER
(7)
UHW+WH_KRL = βTC ∗ TCKRL + βTT ∗ TTKRL + βGENKRL ∗ LOW INCOME + βPURPOSE∗PART TIME WORKER
(8)
The equations above show the utility function for all alternatives. The βTC, βTT, βINCL MC,βINCH CAR, βGEN, and βPURPOSE are the dummy variables of mode and socio-demographic of thecommuters related to travel cost, travel time, low income for motorcycle users, high income for carusers, gender, and travel purpose. These dummy variables will explicitly indicate the behaviouraltrend of commuters in choosing their mode choice and tour types. The alternative specific constant(ASC) of each alternative shows the average effect on the utility of all factors outside of the observedparameters [12]. The presence of alternative specific constant in each function eliminates the error termor unobserved portion of utility ε in the utility function. Moreover, a variety of alternative specificdummies are included in the model to investigate the household travel behaviour and attitudes suchas income, gender, and travel purpose of the commuters. Meanwhile, the differences between threelogit models will be described and drawn in the figures below.
The MNL model structure is drawn in Figure 1 above. There are eight alternatives to the modelwhich have the same level of choices. Where T represents the tour type of the commuters, which isdivided into T1 and T2 to represent hwh and hw+wh, while MC, C, BUS, and KRL are motorcycle, car,bus, commuter line train, respectively.
Figure 2 illustrates the model structure of NL that is deployed in this study. This model structureis a two-level NL where the upper level is partitioned of tour type into two nests and the lower levelis the joint choice of tour types and travel mode of the commuters. Thus, by using a NL model,the correlation between these two tour types will be explored in this model.
Figure 3 above demonstrates that the CNL model is similar with NL, but the alternatives in thelower level could be the member of one or more nest in the upper level. In this model, the upperlevel consists of four nests: hwh, hw+wh, private vehicle, and public transport, whereas the lowerlevel includes joint choice of tour types and modes. Each joint choice belongs to two nests both tourtype and vehicle type. However, this structure can be drawn in NL structure but it requires eithertwo different NL structures based on tour types and vehicle types or combined nest in three level NLstructure based on the study conducted by Hess et al. [13]. Therefore, by using the CNL structure fromthis model, the correlation pattern among alternatives across the nest can be more easily apprehended.
4. Data Description
4.1. Study Area
The capital city of Indonesia, Jakarta, has a population of 10,277,628 which is around 3.97%of the total Indonesian population [30]. The administrative, industrial, and commercial activity inIndonesia is centralised in Jakarta. This causes rapid development in Jakarta where there are plentifulconstructions sites, infrastructure facilities, as well as a fleet of public transport to increase the mobilityof the people inside and toward Jakarta. Therefore, it attracts many people in Indonesia to workand live there as permanent residents. However, for the people who live in the cities surroundingJakarta, they are commuters. In terms of the origin-destination (OD) of the commuters, Bekasi city isset to be the origin, whereas the Special Region of Jakarta is chosen to be the destination, includingthe municipalities within those two cities. The map of Jakarta Metropolitan Area (JMA) is shown inFigure 4 below.

Sustainability 2019, 11, 788 7 of 20Sustainability 2019, 11 FOR PEER REVIEW 7
Figure 4. Location map of Jakarta Metropolitan Area (JMA) [31].
There are several modes of transport to commute from Bekasi to Jakarta, such as a private car,
motorcycles, bus, and the KRL commuter line train. According to the survey from Statistics of DKI
Jakarta Province [1], they pointed out that the number of commuters from the outskirts of Jakarta is
1.38 million which is comprising the cities of Bekasi, Depok, Bogor, and Tangerang. The modal shift
consists of 58 percent of commuters using motorcycles, 12.8 percent of commuters using cars, and 27
percent using public transport, such as buses and KRL commuter line trains. The highest number of
commuters was contributed by Bekasi which is about 14.8 percent of the total number of commuters.
4.2. Daily Activity Patterns Survey Data
The survey was conducted by Irawan et al. [32] by using the random sampling technique. The
survey obtained three kinds of data: socio‐demographic and travel data, as revealed preference data
and stated preferences data. These data were obtained at the stations and offices both in Bekasi and
Jakarta and these data are useful to analyse complex travel behaviour and forecasting travel demand
for the planning project of the new LRT system from Bekasi to East Jakarta. However, the stated
preference data was not analysed in this study. The sample profiles used in this study is shown in
Table 2.
Table 2. Sample profiles in the study.
Variables Category Frequenc
y
Percentag
e
Socio‐demographic characteristics at individual level[32]
Gender Male 292 69.52
Female 128 30.48
Travel purpose Full‐time worker 412 98.10
Part‐time worker 8 1.90
Household characteristics[32]
Monthly
income
Low income < 4 million IDR 145 34.52
Medium income 4 ‐ 6 million IDR 118 28.10
High income > 6 million IDR 157 37.38
Ownership Vehicle ownership 377 89.76
Car ownership 70 16.67
Tour types characteristics[32]
Figure 4. Location map of Jakarta Metropolitan Area (JMA) [31].
There are several modes of transport to commute from Bekasi to Jakarta, such as a private car,motorcycles, bus, and the KRL commuter line train. According to the survey from Statistics of DKIJakarta Province [1], they pointed out that the number of commuters from the outskirts of Jakarta is1.38 million which is comprising the cities of Bekasi, Depok, Bogor, and Tangerang. The modal shiftconsists of 58 percent of commuters using motorcycles, 12.8 percent of commuters using cars, and 27percent using public transport, such as buses and KRL commuter line trains. The highest number ofcommuters was contributed by Bekasi which is about 14.8 percent of the total number of commuters.
4.2. Daily Activity Patterns Survey Data
The survey was conducted by Irawan et al. [32] by using the random sampling technique.The survey obtained three kinds of data: socio-demographic and travel data, as revealed preferencedata and stated preferences data. These data were obtained at the stations and offices both in Bekasi andJakarta and these data are useful to analyse complex travel behaviour and forecasting travel demandfor the planning project of the new LRT system from Bekasi to East Jakarta. However, the statedpreference data was not analysed in this study. The sample profiles used in this study is shown inTable 2.
The survey collected socio-demographic data which is relevant to tour-based mode choice.The characteristics of socio-demographic of the commuters include monthly income, gender, and thetype of profession of the commuters. Meanhile, the tour type characteristics of the commuterswere grouped into eight groups, which included two tour types with four different travel modes.The summary of socio-demographics and tour types of the commuters from Bekasi to Jakarta is shownin Table 2 above.
Based on the data above, it can be examined that the total number of commuters from Bekasito Jakarta is large compared to the total number of population of Bekasi City. Around 10% of thetotal population of Bekasi City are commuters. The sample size of commuters surveyed in this studyis 420 commuters from 501 initial sample size. This number can be assumed to represent the totalnumber of commuters by using Slovin Sampling Theory.
According to Table 2 above, the percentage of monthly income of the commuters is equallyvaried from low income to high income. In addition, the average monthly income of the commuterswas around six million Indonesian Rupiah. Thus, due to this financial limitations, generally, vehicleownership is limited to owning one car and two or more motorcycles for each household, since it is not

Sustainability 2019, 11, 788 8 of 20
very common to have more than one car per household in developing countries [34]. Regarding thetour type of commuters, Figure 5 shows the number of tours and the tour type selected for this study.
Table 2. Sample profiles in the study.
Variables Category Frequency Percentage
Socio-demographic characteristics at individual level [32]
GenderMale 292 69.52
Female 128 30.48
Travel purpose Full-time worker 412 98.10Part-time worker 8 1.90
Household characteristics [32]
Monthly incomeLow income < 4 million IDR 145 34.52
Medium income 4–6 million IDR 118 28.10High income > 6 million IDR 157 37.38
Ownership Vehicle ownership 377 89.76Car ownership 70 16.67
Tour types characteristics [32]
Tour types of commuters
hwh - Motorcycle 56 13.33hwh - Car 12 2.86hwh - Bus 49 11.67hwh - KRL 17 4.05
hw+wh - Motorcycle 161 38.33hw+wh - Car 38 9.05hw+wh - Bus 46 10.95hw+wh - KRL 41 9.76
Characteristics of population and study area
Population, employment,and geography situation
City Bekasi City [33] Jakarta [33]Population (million) 2.803 10.937Survey area (km2) 210.49 662.33
Population density (person/km2) 11413 15,517.38Total number of commuters [1] 204,240
Number of commuters surveyed (N) [32] 420Sustainability 2019, 11 FOR PEER REVIEW 9
(a) (b)
Figure 5. (a) Initial tour type of commuters; (b) Tour type selected
The initial data of tour type is shown in Figure 5a. There are eight tour types which include tour
purpose to workplace and school. Furthermore, the tour is varied and not limited to only one
destination since there will be one or more additional stop for another activity, such as lunch,
meeting, shopping, and other destinations within the tour. From Figure 5b, it can be seen that the
tour types hw+wh and hwh are the two most dominant tour types of the commuter. Thus, the tour
type of commuters is simplified into two types from eight types collected based on initial data which
will be analysed in this study. Consequently, there is no tour type for school purpose used in this
study due to the limitation of its data. The proportion of these two types are 32% and 68% for hwh
and hw+wh. The tour type hw+wh is the most dominant tour type since most of the Bekasi to Jakarta
commuters are the workers who have an additional trip purpose in the workplace. Usually, they
would take trips for lunch during the afternoon break. Meanwhile, the hwh tours is in the second
rank of number of tours, since there are several workplaces or offices which are integrated with many
facilities, such as shopping malls and food courts, so that commuters do not have to take an extra a
trip to other places during break times. Furthermore, the information of modal share of commuters
from Bekasi to Jakarta is shown in Figure 6 below.
Figure 6. Modal share of commuters from Bekasi to Jakarta
27.57
1.41
58.15
2.41 5.431.61 2.82 0.60
0.00
10.00
20.00
30.00
40.00
50.00
60.00
70.00
Number of tours (%)
Tour typesh : home, w : work, s : school, + : 1 additional stop for
another activity
hwh32%
hw+wh68%
hwh hw+wh
51.67
11.90
22.62
13.81
0.00
10.00
20.00
30.00
40.00
50.00
60.00
Motorcycle Private car Bus KRLCommuter
Line
Modal share (%
)
Travel mode
Figure 5. (a) Initial tour type of commuters; (b) Tour type selected.

Sustainability 2019, 11, 788 9 of 20
The initial data of tour type is shown in Figure 5a. There are eight tour types which includetour purpose to workplace and school. Furthermore, the tour is varied and not limited to only onedestination since there will be one or more additional stop for another activity, such as lunch, meeting,shopping, and other destinations within the tour. From Figure 5b, it can be seen that the tour typeshw+wh and hwh are the two most dominant tour types of the commuter. Thus, the tour type ofcommuters is simplified into two types from eight types collected based on initial data which will beanalysed in this study. Consequently, there is no tour type for school purpose used in this study due tothe limitation of its data. The proportion of these two types are 32% and 68% for hwh and hw+wh.The tour type hw+wh is the most dominant tour type since most of the Bekasi to Jakarta commutersare the workers who have an additional trip purpose in the workplace. Usually, they would take tripsfor lunch during the afternoon break. Meanwhile, the hwh tours is in the second rank of number oftours, since there are several workplaces or offices which are integrated with many facilities, such asshopping malls and food courts, so that commuters do not have to take an extra a trip to other placesduring break times. Furthermore, the information of modal share of commuters from Bekasi to Jakartais shown in Figure 6 below.
Sustainability 2019, 11 FOR PEER REVIEW 9
Figure 5. (a) Initial tour type of commuters; (b) Tour type selected
The initial data of tour type is shown in Figure 5a. There are eight tour types which include tour
purpose to workplace and school. Furthermore, the tour is varied and not limited to only one
destination since there will be one or more additional stop for another activity, such as lunch,
meeting, shopping, and other destinations within the tour. From Figure 5b, it can be seen that the
tour types hw+wh and hwh are the two most dominant tour types of the commuter. Thus, the tour
type of commuters is simplified into two types from eight types collected based on initial data which
will be analysed in this study. Consequently, there is no tour type for school purpose used in this
study due to the limitation of its data. The proportion of these two types are 32% and 68% for hwh
and hw+wh. The tour type hw+wh is the most dominant tour type since most of the Bekasi to Jakarta
commuters are the workers who have an additional trip purpose in the workplace. Usually, they
would take trips for lunch during the afternoon break. Meanwhile, the hwh tours is in the second
rank of number of tours, since there are several workplaces or offices which are integrated with many
facilities, such as shopping malls and food courts, so that commuters do not have to take an extra a
trip to other places during break times. Furthermore, the information of modal share of commuters
from Bekasi to Jakarta is shown in Figure 6 below.
Figure 6. Modal share of commuters from Bekasi to Jakarta
According to the data in Figure 6, the modal share of commuters from Bekasi to Jakarta is
dominated by motorcycle, contributing 51.67%, followed by public transport, and third is bus and
KRL train with modal share of about 22.62% and 13.81%. Lastly, car is the last choice for the
commuters, with the percentage of 11.90%. This initial analysis is in line with the study conducted by
Yagi et al. [35] which found that the motorcycle is the most dominant mode used in many urban areas
in developing countries such as Jakarta and there was less modal share of public transport. In
addition to the data above, the modal share for the hwh and hw+wh tour types is drawn in Figure 7
and Figure 8 respectively.
51.67
11.90
22.62
13.81
0.00
10.00
20.00
30.00
40.00
50.00
60.00
Motorcycle Private car Bus KRLCommuter
Line
Modal share (%
)
Travel mode
Figure 6. Modal share of commuters from Bekasi to Jakarta.
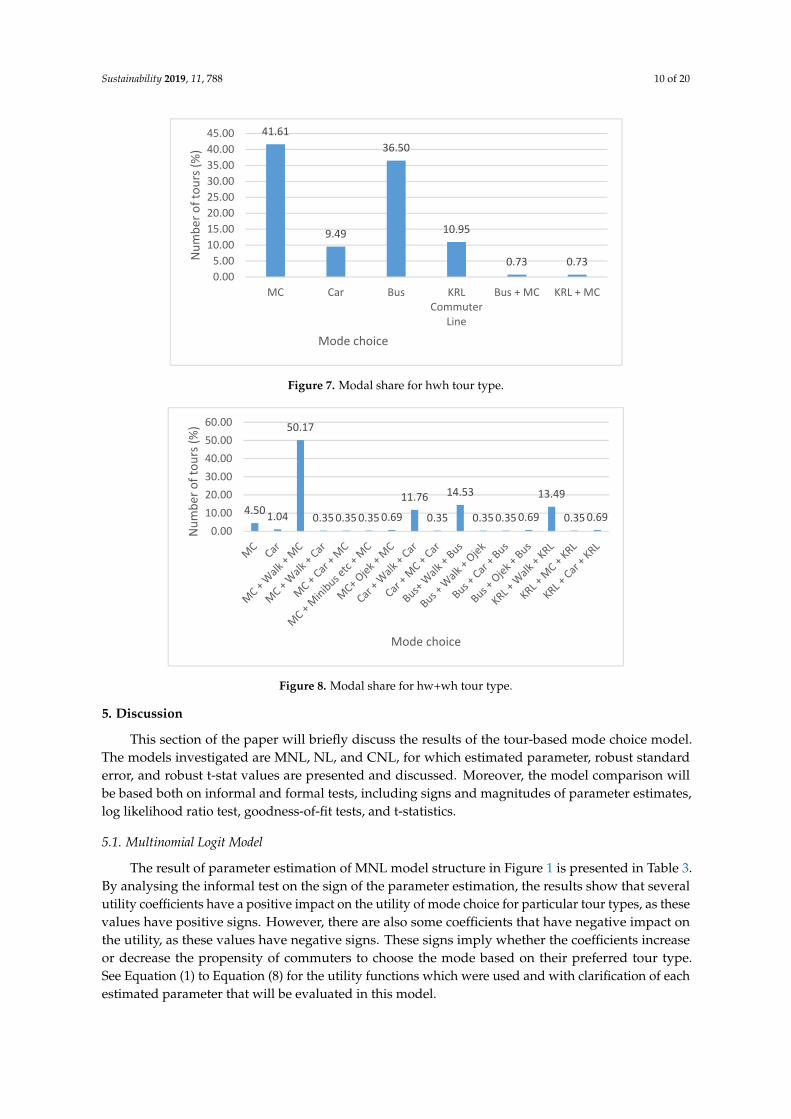
According to the data in Figure 6, the modal share of commuters from Bekasi to Jakarta isdominated by motorcycle, contributing 51.67%, followed by public transport, and third is bus and KRLtrain with modal share of about 22.62% and 13.81%. Lastly, car is the last choice for the commuters,with the percentage of 11.90%. This initial analysis is in line with the study conducted by Yagi et al. [35]which found that the motorcycle is the most dominant mode used in many urban areas in developingcountries such as Jakarta and there was less modal share of public transport. In addition to the dataabove, the modal share for the hwh and hw+wh tour types is drawn in Figures 7 and 8 respectively.
The figures above imply that both motorcycle and bus are the most commonly chosen modes forthe commuters when they are going to work and going back home with no additional trip within theworkplaces. The modal shares for motorcycle and bus in the hwh tour type are 41.61% and 36.50%,respectively. On the other hand, almost 50.17% of the commuters choose motorcycle as the primarymode for the tour type of going to work and going back home with at least one additional trip in theworkplace. This number is the highest modal share compared to other modes in hw+wh tour type.
Sustainability 2019, 11, 788 10 of 20Sustainability 2019, 11 FOR PEER REVIEW 10
Figure 7. Modal share for hwh tour type
Figure 8. Modal share for hw+wh tour type
The figures above imply that both motorcycle and bus are the most commonly chosen modes
for the commuters when they are going to work and going back home with no additional trip within
the workplaces. The modal shares for motorcycle and bus in the hwh tour type are 41.61% and
36.50%, respectively. On the other hand, almost 50.17% of the commuters choose motorcycle as the
primary mode for the tour type of going to work and going back home with at least one additional
trip in the workplace. This number is the highest modal share compared to other modes in hw+wh
tour type.
5. Discussion
This section of the paper will briefly discuss the results of the tour‐based mode choice model.
The models investigated are MNL, NL, and CNL, for which estimated parameter, robust standard
error, and robust t‐stat values are presented and discussed. Moreover, the model comparison will be
based both on informal and formal tests, including signs and magnitudes of parameter estimates, log
likelihood ratio test, goodness‐of‐fit tests, and t‐statistics.
5.1. Multinomial Logit Model
The result of parameter estimation of MNL model structure in Figure 1 is presented in Table 3.
By analysing the informal test on the sign of the parameter estimation, the results show that several
41.61
9.49
36.50
10.95
0.73 0.730.00
5.00
10.00
15.00
20.00
25.00
30.00
35.00
40.00
45.00
MC Car Bus KRLCommuter
Line
Bus + MC KRL + MC
Number of tours (%)
Mode choice
4.501.04
50.17
0.350.350.350.69
11.76
0.35
14.53
0.350.350.69
13.49
0.350.690.00
10.00
20.00
30.00
40.00
50.00
60.00
Number of tours (%)
Mode choice
Figure 7. Modal share for hwh tour type.
Sustainability 2019, 11 FOR PEER REVIEW 10
Figure 7. Modal share for hwh tour type
Figure 8. Modal share for hw+wh tour type
The figures above imply that both motorcycle and bus are the most commonly chosen modes
for the commuters when they are going to work and going back home with no additional trip within
the workplaces. The modal shares for motorcycle and bus in the hwh tour type are 41.61% and
36.50%, respectively. On the other hand, almost 50.17% of the commuters choose motorcycle as the
primary mode for the tour type of going to work and going back home with at least one additional
trip in the workplace. This number is the highest modal share compared to other modes in hw+wh
tour type.
5. Discussion
This section of the paper will briefly discuss the results of the tour‐based mode choice model.
The models investigated are MNL, NL, and CNL, for which estimated parameter, robust standard
error, and robust t‐stat values are presented and discussed. Moreover, the model comparison will be
based both on informal and formal tests, including signs and magnitudes of parameter estimates, log
likelihood ratio test, goodness‐of‐fit tests, and t‐statistics.
5.1. Multinomial Logit Model
The result of parameter estimation of MNL model structure in Figure 1 is presented in Table 3.
By analysing the informal test on the sign of the parameter estimation, the results show that several
41.61
9.49
36.50
10.95
0.73 0.730.00
5.00
10.00
15.00
20.00
25.00
30.00
35.00
40.00
45.00
MC Car Bus KRLCommuter
Line
Bus + MC KRL + MC
Number of tours (%)
Mode choice
4.501.04
50.17
0.350.350.350.69
11.76
0.35
14.53
0.350.350.69
13.49
0.350.690.00
10.00
20.00
30.00
40.00
50.00
60.00
Number of tours (%)
Mode choice
Figure 8. Modal share for hw+wh tour type.
5. Discussion
This section of the paper will briefly discuss the results of the tour-based mode choice model.The models investigated are MNL, NL, and CNL, for which estimated parameter, robust standarderror, and robust t-stat values are presented and discussed. Moreover, the model comparison willbe based both on informal and formal tests, including signs and magnitudes of parameter estimates,log likelihood ratio test, goodness-of-fit tests, and t-statistics.
5.1. Multinomial Logit Model
The result of parameter estimation of MNL model structure in Figure 1 is presented in Table 3.By analysing the informal test on the sign of the parameter estimation, the results show that severalutility coefficients have a positive impact on the utility of mode choice for particular tour types, as thesevalues have positive signs. However, there are also some coefficients that have negative impact onthe utility, as these values have negative signs. These signs imply whether the coefficients increaseor decrease the propensity of commuters to choose the mode based on their preferred tour type.See Equation (1) to Equation (8) for the utility functions which were used and with clarification of eachestimated parameter that will be evaluated in this model.
Sustainability 2019, 11, 788 11 of 20
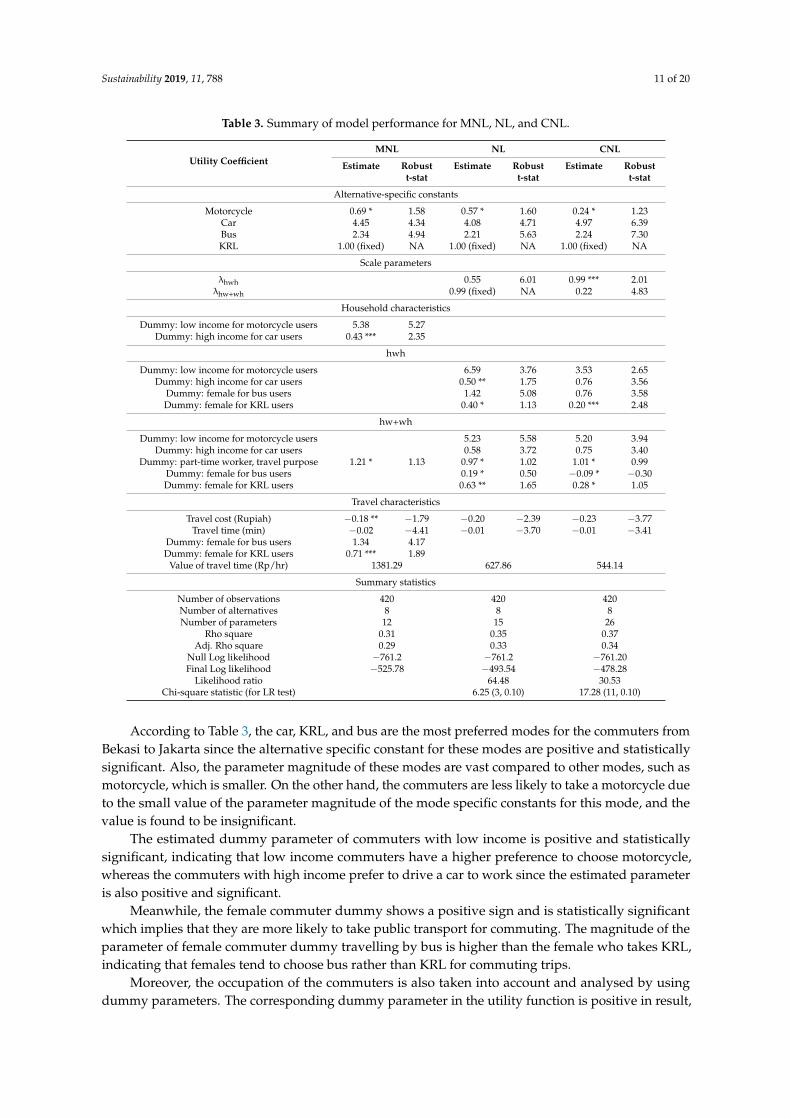
Table 3. Summary of model performance for MNL, NL, and CNL.
Utility CoefficientMNL NL CNL
Estimate Robustt-stat
Estimate Robustt-stat
Estimate Robustt-stat
Alternative-specific constants
Motorcycle 0.69 * 1.58 0.57 * 1.60 0.24 * 1.23Car 4.45 4.34 4.08 4.71 4.97 6.39Bus 2.34 4.94 2.21 5.63 2.24 7.30KRL 1.00 (fixed) NA 1.00 (fixed) NA 1.00 (fixed) NA
Scale parameters
λhwh 0.55 6.01 0.99 *** 2.01λhw+wh 0.99 (fixed) NA 0.22 4.83
Household characteristics
Dummy: low income for motorcycle users 5.38 5.27Dummy: high income for car users 0.43 *** 2.35
hwh
Dummy: low income for motorcycle users 6.59 3.76 3.53 2.65Dummy: high income for car users 0.50 ** 1.75 0.76 3.56
Dummy: female for bus users 1.42 5.08 0.76 3.58Dummy: female for KRL users 0.40 * 1.13 0.20 *** 2.48
hw+wh
Dummy: low income for motorcycle users 5.23 5.58 5.20 3.94Dummy: high income for car users 0.58 3.72 0.75 3.40
Dummy: part-time worker, travel purpose 1.21 * 1.13 0.97 * 1.02 1.01 * 0.99Dummy: female for bus users 0.19 * 0.50 −0.09 * −0.30Dummy: female for KRL users 0.63 ** 1.65 0.28 * 1.05
Travel characteristics
Travel cost (Rupiah) −0.18 ** −1.79 −0.20 −2.39 −0.23 −3.77Travel time (min) −0.02 −4.41 −0.01 −3.70 −0.01 −3.41
Dummy: female for bus users 1.34 4.17Dummy: female for KRL users 0.71 *** 1.89
Value of travel time (Rp/hr) 1381.29 627.86 544.14
Summary statistics
Number of observations 420 420 420Number of alternatives 8 8 8Number of parameters 12 15 26
Rho square 0.31 0.35 0.37Adj. Rho square 0.29 0.33 0.34
Null Log likelihood −761.2 −761.2 −761.20Final Log likelihood −525.78 −493.54 −478.28
Likelihood ratio 64.48 30.53Chi-square statistic (for LR test) 6.25 (3, 0.10) 17.28 (11, 0.10)
According to Table 3, the car, KRL, and bus are the most preferred modes for the commuters fromBekasi to Jakarta since the alternative specific constant for these modes are positive and statisticallysignificant. Also, the parameter magnitude of these modes are vast compared to other modes, such asmotorcycle, which is smaller. On the other hand, the commuters are less likely to take a motorcycle dueto the small value of the parameter magnitude of the mode specific constants for this mode, and thevalue is found to be insignificant.
The estimated dummy parameter of commuters with low income is positive and statisticallysignificant, indicating that low income commuters have a higher preference to choose motorcycle,whereas the commuters with high income prefer to drive a car to work since the estimated parameteris also positive and significant.
Meanwhile, the female commuter dummy shows a positive sign and is statistically significantwhich implies that they are more likely to take public transport for commuting. The magnitude of theparameter of female commuter dummy travelling by bus is higher than the female who takes KRL,indicating that females tend to choose bus rather than KRL for commuting trips.
Moreover, the occupation of the commuters is also taken into account and analysed by usingdummy parameters. The corresponding dummy parameter in the utility function is positive in result,
Sustainability 2019, 11, 788 12 of 20
which explains that the commuters who have a part-time job are more likely to have flexible tour type.However, this attribute is found to not be statistically significant at 10% error tolerance.
Therefore, based on the findings above, it could be argued that the income and gender influencethe probability of the commuters to choose the travel mode. However, besides all of the attributesabove that contribute positively to utility, there are two differing attributes that are negative andstatistically significant: travel time and travel cost. Thus, these attributes decrease the propensity ofthe utility of the commuters in choosing their mode. The estimated value of travel cost is found to behigher than the travel time. For this reason, the commuters have a higher preference to choose thecheapest mode, followed by the fastest mode.
In terms of summary statistics of the total 420 observations, there are 11 parameters estimatedand eight alternatives evaluated. In addition, the goodness-of-fit of the models such as the rho squareand adjusted rho square values are 0.31 and 0.29, respectively, which means that these values aresubstantially high. Therefore, it can be stated from the goodness-of-fit test that the model has a goodfit to the data.
5.2. Nested Logit Model
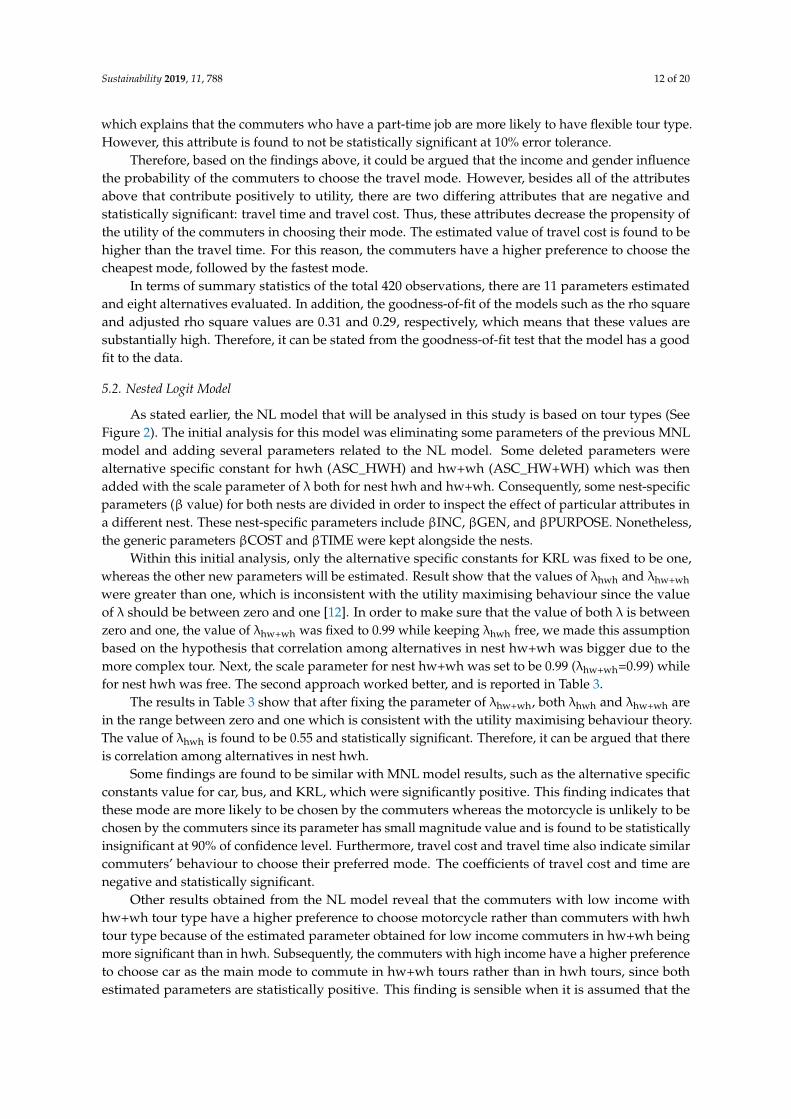
As stated earlier, the NL model that will be analysed in this study is based on tour types (SeeFigure 2). The initial analysis for this model was eliminating some parameters of the previous MNLmodel and adding several parameters related to the NL model. Some deleted parameters werealternative specific constant for hwh (ASC_HWH) and hw+wh (ASC_HW+WH) which was thenadded with the scale parameter of λ both for nest hwh and hw+wh. Consequently, some nest-specificparameters (β value) for both nests are divided in order to inspect the effect of particular attributes ina different nest. These nest-specific parameters include βINC, βGEN, and βPURPOSE. Nonetheless,the generic parameters βCOST and βTIME were kept alongside the nests.
Within this initial analysis, only the alternative specific constants for KRL was fixed to be one,whereas the other new parameters will be estimated. Result show that the values of λhwh and λhw+whwere greater than one, which is inconsistent with the utility maximising behaviour since the valueof λ should be between zero and one [12]. In order to make sure that the value of both λ is betweenzero and one, the value of λhw+wh was fixed to 0.99 while keeping λhwh free, we made this assumptionbased on the hypothesis that correlation among alternatives in nest hw+wh was bigger due to themore complex tour. Next, the scale parameter for nest hw+wh was set to be 0.99 (λhw+wh=0.99) whilefor nest hwh was free. The second approach worked better, and is reported in Table 3.
The results in Table 3 show that after fixing the parameter of λhw+wh, both λhwh and λhw+wh arein the range between zero and one which is consistent with the utility maximising behaviour theory.The value of λhwh is found to be 0.55 and statistically significant. Therefore, it can be argued that thereis correlation among alternatives in nest hwh.
Some findings are found to be similar with MNL model results, such as the alternative specificconstants value for car, bus, and KRL, which were significantly positive. This finding indicates thatthese mode are more likely to be chosen by the commuters whereas the motorcycle is unlikely to bechosen by the commuters since its parameter has small magnitude value and is found to be statisticallyinsignificant at 90% of confidence level. Furthermore, travel cost and travel time also indicate similarcommuters’ behaviour to choose their preferred mode. The coefficients of travel cost and time arenegative and statistically significant.
Other results obtained from the NL model reveal that the commuters with low income withhw+wh tour type have a higher preference to choose motorcycle rather than commuters with hwhtour type because of the estimated parameter obtained for low income commuters in hw+wh beingmore significant than in hwh. Subsequently, the commuters with high income have a higher preferenceto choose car as the main mode to commute in hw+wh tours rather than in hwh tours, since bothestimated parameters are statistically positive. This finding is sensible when it is assumed that the

Sustainability 2019, 11, 788 13 of 20
commuters who have private vehicles tend to have complex tour types, particularly in their workplacerather than having a fixed tour type, such as hwh.
Other findings of this model indicate that there are different behaviours of commuters who takedifferent tour types. Female commuters are more likely to take a bus in hwh tours than hw+wh toursas the estimated parameter is found to be positive and statistically significant for hwh tours, unlikehw+wh tours, which is insignificant. However, female commuters tend to choose KRL rather than buswhen they have hw+wh tour type, as the estimated parameter for females to take KRL is significantlypositive for nest hw+wh.
In terms of commuters’ occupations, the results show similar findings to the MNL model results.The commuters who have a part-time job show a tendency to have the hw+wh tour type due to theirflexibility. However, this parameter is found to be statistically insignificant at the 90% confidence level.
The statistics summary of 420 observations show that there are 15 parameters obtained from eightalternatives. The results of the goodness-of-fit test was shown to be higher than the MNL model sincethe rho square and adjusted rho square increased to 0.35 and 0.33, respectively. Hence, this resultimplies that this NL model has a good fit to the data. Moreover, the likelihood ratio test between NLand MNL has a result of 64.48, which, in regard to chi-square statistic, is greater than the critical valueof three degrees of freedom and the 90% confidence level used in this study. Thus, this indicates thatthe parameter estimations (See Equation (1) to Equation (8)) in this model are considerably differentfrom zero.
5.3. Cross-Nested Logit Model
The CNL model provides a higher degree of flexibility in capturing wider correlation patternsamong alternatives than the two previous models that have been used [36]. The restricting aspectof grouping some alternatives in one nest in NL model can interrupt in capturing the correlation ofalternatives that may belong to more than one nest. Since each of the alternatives belong to morethan one nest, as shown in Figure 3, this model structure is appropriate and efficient to be used in theanalyses rather than using two NL models based on tour types and vehicle types.
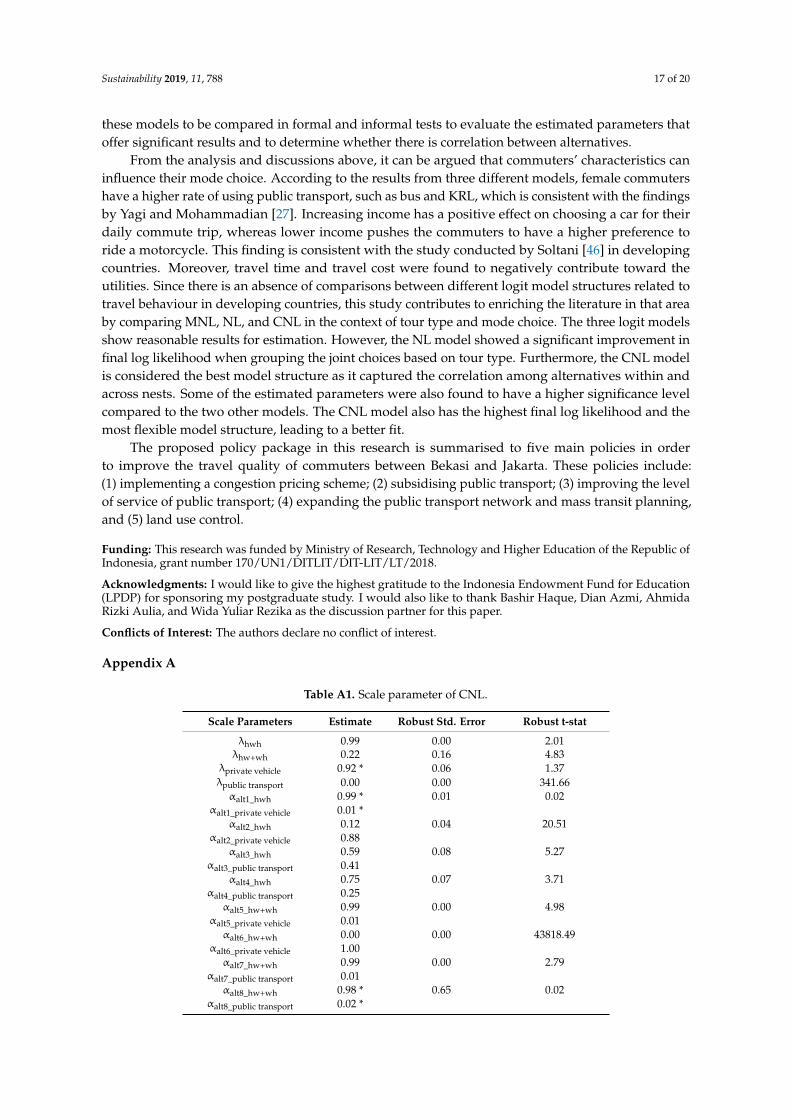
Therefore, in this model, it is assumed that each joint choice alternatives of commuters will beallocated in two nests according to tour type and vehicle type. The upper level represents the tourtypes and vehicle types, while the lower level consists of the joint choice alternatives. The estimationresults for the CNL model are shown in Table 3. The final values of λ and α shown in the Table 3 andAppendix A have been transformed using the logit transformation equation, as during estimation anappropriate logit transformation was used to avoid these values going outside the [0, 1] interval.
According to the findings, it can be said that the CNL model can categorize the correlation amongalternatives in different nests since all α values were below one, with the exception the value of α foralternative six to nest private vehicle which has a scale parameter of about one. While the highestcorrelation between alternative and nest is detected for the commuters who select car in hw+wh tourswith nest hw+wh, followed by the commuters who ride a motorcycle in hwh and hw+wh tours withthe nest private vehicles, and the commuters who take a bus and KRL in hw+wh tours with the nestpublic transport.
In terms of correlation among alternatives in each nest, the λ values show that these values are lessthan one, meaning that correlation among alternatives exist. The λ values for hwh tours, hw+wh tours,private vehicle, and public transport are 0.99, 0.22, 0.92, and 0.00 respectively. Moreover, by using thet-test, all λ values are different from one. The most apparent correlation among alternatives was foundfor the nest public transport, meanwhile, the lowest correlation is on the nest hwh.
On the other hand, the modes car, bus, and KRL are still the most preferred mode for thecommuters, whereas the motorcycle is less preferred. It is found that the parameter magnitude of caris the highest among the other modes, followed by bus and then KRL.
Consistent with the previous result, the generic parameters of travel cost and travel time havereasonable significance and correct signs. Based on the magnitude value of these generic parameters,

Sustainability 2019, 11, 788 14 of 20
the commuters tend to choose the cheapest mode rather than the fastest mode as the estimatedparameters are shown to be −0.23 and −0.01 for travel cost and travel time, correspondingly.
Most of the dummy parameters for commuters’ income show reasonable significance.The commuters’ income in this model also shows the same interpretation as the previous model.The low income commuters have a preference to ride motorcycles, whereas high income commutershave a higher preference to drive cars.
Contrary to the results of the previous model for the female commuter dummy, the dummyparameter is found to be significantly positive for female commuters who take public transport inhwh tours, whereas it is insignificant for hw+wh tours. This indicates that female commuters havethe tendency to make use of public transport in simple tours rather than complex tours. Moreover,the female commuter is found to be more likely to choose bus rather than KRL, as the magnitude valuefor bus is higher than KRL.
Similar to the findings in the two previous models, part-time workers are less likely to makesimple tours, since the parameter is found to be positive in complex tours but it is not significant.Therefore, this logit model also could not capture a significant result for this parameter.
The summary of the statistical analysis of this model shows that there are 26 parameters obtainedfrom eight alternatives. The goodness of fit and final log likelihood is improved compared to the twoprevious models. The rho square and adjusted rho square are found to be 0.37 and 0.3, respectively,while the final log likelihood is −478.28. Thus, the likelihood ratio compared to the NL is found to be30.53, statistically significant at 10% tolerance of error and with 11 degrees of freedom.
5.4. Model Comparison
In the three logit models above, the utility parameter of mode and tour type for the commutersare estimated by using individual and socio-demographic data to investigate commuter preferencesfor travel modes when taking their tour type. This section will present the comparison of similarattributes used at least for two of three logit models that have been used in this study. The comparisonof the three models’ performances above is presented in Table 3.
As shown in Table 3, it can be seen that the three logit models used: MNL, NL, and CNL, mostlyyield similar results concerning the alternative specific constants and estimated parameters with similarsigns and magnitude. Furthermore, the estimated parameters from individual and socio-demographicdata also have similar significance levels.
However, some parameters were found to have different significance results associated with thedummy female commuters. This can be found by estimating nest-specific parameters of the dummyfemale commuter in two different nests in the NL and CNL models. This indicates that the NL andCNL models provide a better estimation for a particular group of alternatives.
Dummy part time commuter was found to be non-significant in all models. This might be becausethe data provided little evidence that part-time commuters tend to have complex tours in theircommute, since the proportion of part-time workers is only 1.90% of the total sample.
The generic parameters and alternative specific constants are used in the same utility functionsfor the three models. Thus, these parameters are easily compared based on the significant results.The CNL model provides the highest t-test value compared to the other models, indicating that CNL ismore appropriate in evaluating the estimated parameters than MNL and NL.
Based on the findings, it was shown that the alternative specific constants for motorcycles has thelowest magnitude compared to other modes. However, from the initial descriptive analysis, this modewas found to be most commonly used by the commuters. This is because the travel cost and traveltime for motorcycle were found to be the lowest compared to other modes based on the data source.Therefore, the utility of motorcycle is greater than other modes.
Going further, all of the λ parameters in the CNL model are significantly different from oneanother. It implies that this model is also more robust to capturing increasing correlation inside the

Sustainability 2019, 11, 788 15 of 20
nests. Likewise, α parameters have reasonable significance, which means that correlation amongalternatives in different nests could be captured.
Based on the comparison table above, it can be seen that the values of travel time (VTT)are different among the three models. The MNL has the highest VTT at about 1381.29 IDR/hourwhile the CNL has the lowest VTT at around 544.14 IDR/hour. These values are sensible in theIndonesian context.
Regarding the formal testing of the result, the CNL model shows better improvement comparedto the MNL and NL models. The final log likelihood value increases from about −525.78 in theMNL to −493.54 in the NL model and then improved to −478.28 in the CNL model. Likewise,the goodness-of-fit test, which includes rho square and adjusted rho square, also shows better resultcompared to the values obtained in both MNL and NL models, since these values in CNL model arefound to be the highest. Furthermore, by using the likelihood ratio test, the CNL model is significantlybetter at the 90% and 99% confidence levels. According to this study, therefore, the CNL model isargued to be the optimum model among the tested ones, to be used in the estimation of parametersamong multi-alternatives in nesting structures that may belong to other nests. Moreover, NL is alsoconsidered to have significant improvement of final log likelihood for nesting the choices based on tourtypes, indicating that the NL model is also appropriate to evaluate nesting structure in a tour-basedmode choice model.
5.5. Policy Recommendations
Based on the findings from the previous sections, some policy implications can be formulatedto improve the travel quality of commuters from Bekasi to Jakarta. The policy implications in thisreport will likely be related to the findings of commuter behaviour from Bekasi to Jakarta. The policy isformulated based on previous studies and case studies both from developed and developing countriesthat result in significant quality improvement for urban mobility including for the commuters as thepolicy has been implemented. Thus, there are five policy implications proposed based on commuterbehaviour analysed in this study to improve the travel quality for commuters. The policy implicationsare summarized in Table 4 and the rationale for recommending them are described below.
Table 4. Proposed policy implications to improve travel quality of commuters.
Policy Policy Makers Description
Implementing congestionpricing scheme
Jakarta’s and Bekasi’sgovernmentToll operator
Road pricing and dynamic toll charges based on time,location and vehicle type by using smart technologies
such as IU and cameras.
Subsidising the publictransport
Jakarta’s and Bekasi’sgovernment
Subsidy for public transport to keep the ticket fareaffordable for commuters in all social groups.
Improving level of serviceof public transport Public transport operators
Increasing the level of service of public transport byimproving reliability, comfort, and safety.
Implementing an integrated ticketing system
Expanding publictransport network andmass transit planning
Jakarta’s and Bekasi’sgovernment
Public transport operators
The expansion of the public transport network can beboth rail-based (MRT, LRT) and road-based (BRT)
Planning of mass transit for commuters
Land use control Jakarta’s and Bekasi’sgovernment
Planning an integrated transport hub by implementingtransit-oriented development in the central business
district in Jakarta
The findings show that travel cost has a negative impact on utility. Therefore, by increasing thetravel cost of private vehicles and reducing the travel cost of public transport, it will significantlyencourage people to shift from private vehicles to public transport for their commuting activities.A congestion pricing scheme is one of the policies that is believed to have successfully reduced thetraffic both into and out of the city centre, increased traffic speed, and promoted a modal shift fromprivate vehicles to public transport [37,38]. As the congestion pricing is sensitive for the commuters

Sustainability 2019, 11, 788 16 of 20
from different income groups [18], the congestion pricing scheme could be implemented in toll roadsand existing congested links between Bekasi and Jakarta. The scheme can set to be dynamically basedon location, time, and vehicle type. This policy can be significantly implemented during peak hourswhen the congestion is often occurring between two cities and targeting the private car.
Further, the revenue from road pricing allows the government to invest in operational andinfrastructure facilities of the public transportation system. This strategy is important in order toensure that the policy will be maintained in sustainable ways. Since ticket fare has a significant effecton influencing travel behaviour [39], investment in the public transport system could be implementedby having a subsidy for public transport. Therefore, the operator can offer a ticket fare which isaffordable for all social groups to increase the ridership of public transport [40]. Dissanayake andMorikawa [34] investigated the “push and pull” policy strategy in the Bangkok metropolitan regionusing the NL model. The strategy considered a road pricing scheme for cars and motorcycles combinedwith reducing ticket fares of public transportation by 50%. The results show that travel usage by carand motorcycle reduced and the ridership of public transport increased.
As the estimated parameter for travel time is found to be statistically negative, it is importantto reduce the travel time by having good reliability of public transport. S. Jain et al. [41] found thatcommuters were satisfied with the public transport due to its high frequency, adherence to the schedule,and less travel time. They also pointed out that about 96% of commuters are willing to shift to publictransport if all above services or criteria are fulfilled for the commuters. Moreover, Ho and Mulley [16]investigated the feasibility of a modal shift from cars to public transport by reducing the ticket fareand increasing the travel time of public transport. They pointed out that this strategy is feasible toattract people to public transport. Another policy of an operator to enhance the service level of publictransport is by implementing an integrated ticketing system that can be used by the commuters for allpublic transport services between Bekasi and Jakarta.
Currently, Jakarta has been constructing the first rail-based transit in Indonesia, LRT and MRT.The MRT is built in the Jakarta area to move people within the city centre, whereas the LRT togetherwith BRT is built to support the MRT as feeder services from the outskirts of Jakarta to the city centre,such as from Bekasi to Jakarta. Furthermore, expansion of the BRT, LRT, and MRT network in Jakartaand the cities surrounding it, is crucial to meet the travel demand. Sohoni et al. [42] conducted a studyto see the behaviour of commuters due to the new rail transit mode. They found that about 60% of thecommuters who were using private vehicles were willing to shift to the new metro rail line. Therefore,the presence of this new rail transit network and expansion of public transport network could increasethe attractiveness and convenience of using public transport [43], which could encourage more peopleto choose public transport rather than private vehicles for their daily commute.
In terms of transport and land use planning, Jakarta, as the destination of the commuter, shouldconsider implementing integrated transport hubs where commercial developments and offices areconnected to the public transport system. This system is widely known as transit-oriented development.This integration is considered to reduce traffic, improve urban environment quality, and increase themodal share of public transport [44,45].
In summary, the high cost of private vehicle usage combined with the affordable ticket prices andbetter service level of public transport may reduce the level of private vehicle usage and increase theappeal of using public transport. Furthermore, network expansion and transit-oriented developmentare considered to encourage more commuters to choose public transport instead of private vehicles.
6. Conclusions
This study attempted to present the discrete choice models of different logit models analysis usingMNL, NL, and CNL models. The models were specified to estimate the relationship between tour typeand mode choice and influencing attributes of the commuters from Bekasi to Jakarta by consideringthe travel patterns and socio-demographic data of the respondents. The estimation of these modelsused a set of secondary data obtained from the travel diary of commuters. This set of data allowed
Sustainability 2019, 11, 788 17 of 20
these models to be compared in formal and informal tests to evaluate the estimated parameters thatoffer significant results and to determine whether there is correlation between alternatives.
From the analysis and discussions above, it can be argued that commuters’ characteristics caninfluence their mode choice. According to the results from three different models, female commutershave a higher rate of using public transport, such as bus and KRL, which is consistent with the findingsby Yagi and Mohammadian [27]. Increasing income has a positive effect on choosing a car for theirdaily commute trip, whereas lower income pushes the commuters to have a higher preference toride a motorcycle. This finding is consistent with the study conducted by Soltani [46] in developingcountries. Moreover, travel time and travel cost were found to negatively contribute toward theutilities. Since there is an absence of comparisons between different logit model structures related totravel behaviour in developing countries, this study contributes to enriching the literature in that areaby comparing MNL, NL, and CNL in the context of tour type and mode choice. The three logit modelsshow reasonable results for estimation. However, the NL model showed a significant improvement infinal log likelihood when grouping the joint choices based on tour type. Furthermore, the CNL modelis considered the best model structure as it captured the correlation among alternatives within andacross nests. Some of the estimated parameters were also found to have a higher significance levelcompared to the two other models. The CNL model also has the highest final log likelihood and themost flexible model structure, leading to a better fit.
The proposed policy package in this research is summarised to five main policies in orderto improve the travel quality of commuters between Bekasi and Jakarta. These policies include:(1) implementing a congestion pricing scheme; (2) subsidising public transport; (3) improving the levelof service of public transport; (4) expanding the public transport network and mass transit planning,and (5) land use control.
Funding: This research was funded by Ministry of Research, Technology and Higher Education of the Republic ofIndonesia, grant number 170/UN1/DITLIT/DIT-LIT/LT/2018.
Acknowledgments: I would like to give the highest gratitude to the Indonesia Endowment Fund for Education(LPDP) for sponsoring my postgraduate study. I would also like to thank Bashir Haque, Dian Azmi, AhmidaRizki Aulia, and Wida Yuliar Rezika as the discussion partner for this paper.
Conflicts of Interest: The authors declare no conflict of interest.
Appendix A
Table A1. Scale parameter of CNL.
Scale Parameters Estimate Robust Std. Error Robust t-stat
λhwh 0.99 0.00 2.01λhw+wh 0.22 0.16 4.83
λprivate vehicle 0.92 * 0.06 1.37λpublic transport 0.00 0.00 341.66αalt1_hwh 0.99 * 0.01 0.02
αalt1_private vehicle 0.01 *αalt2_hwh 0.12 0.04 20.51
αalt2_private vehicle 0.88αalt3_hwh 0.59 0.08 5.27
αalt3_public transport 0.41αalt4_hwh 0.75 0.07 3.71
αalt4_public transport 0.25αalt5_hw+wh 0.99 0.00 4.98
αalt5_private vehicle 0.01αalt6_hw+wh 0.00 0.00 43818.49
αalt6_private vehicle 1.00αalt7_hw+wh 0.99 0.00 2.79
αalt7_public transport 0.01αalt8_hw+wh 0.98 * 0.65 0.02
αalt8_public transport 0.02 *

Sustainability 2019, 11, 788 18 of 20
References
1. Statistics of DKI Jakarta Province. Commuter of DKI Jakarta Province; Statistics of DKI Jakarta Province: Jakarta,Indonesia, 2015.
2. Ben-Akiva, M.E.; Bowman, J.L.; Ramming, S.; Walker, J. Behavioral Realism in Urban Transportation PlanningModels. In Proceedings of the Transportation Models in the Policy-Making Process: A Symposium in Memory ofGreig Harvey; Asilomar Conference Center: Pacific Grove, CA, USA, 1998.
3. Hague Consulting Group. The Netherlands National Model, 1990: The National Model System for Traffic andTransport; Hague Consulting Group: Wellington, New Zealand, 1992.
4. Algers, S.; Daly, A.; Widlert, S. Modelling Travel Behaviour to Support Policy Making in Stockholm.In Understanding Travel Behaviour in an Era of Change; Stopher, P., Lee-Gosselin, M., Eds.; Elsevier: Amsterdam,The Netherlands, 1997; pp. 547–569, ISBN 0-08-042390-6.
5. Beser, M.; Algers, S. SAMPERS—The New Swedish National Travel Demand Forecasting Tool. In NationalTransport Models. Advances in Spatial Science; Lundqvist, L., Mattsson, L., Eds.; Springer: Berlin/Heidelberg,Germany, 2002; pp. 101–118.
6. Fosgerau, M. PETRA—An Activity-based Approach to Travel Demand Analysis. In National Transport Models.Advances in Spatial Science; Lundqvist, L., Mattsson, M., Eds.; Springer: Berlin/Heidelberg, Germany, 2002;pp. 134–145.
7. Bradley, M.; Outwater, M.; Jonnalagadda, N.; Ruiter, E. Estimation of activity-based mocrosimulationmodel for San Francisco. In Proceedings of the 80th Annual Meeting of the Transportation Research Board,Washington, DC, USA, 7–11 January 2001.
8. Jonnalagadda, N.; Freedman, J.; Davidson, W.A.; Hunt, J.D. Development of Microsimulation Activity-BasedModel for San Francisco: Destination and Mode Choice Models. Transp. Res. Rec. J. Transp. Res. Board 2001,1777, 25–35. [CrossRef]
9. Bowman, J.L.; Ben-Akiva, M.E. Activity-based disaggregate travel demand model system with activityschedules. Transp. Res. Part A Policy Pract. 2000, 35, 1–28. [CrossRef]
10. Bowman, J.L.; Bradley, M.; Shiftan, Y.; Lawton, K.; Ben-Akiva, M. Demonstration of an Activity-Based Modelfor Portland. In Proceedings of the 8th World Conference on Transport Research, Antwerp, Belgium, 12–17July 1999.
11. Dissanayake, D.; Morikawa, T. Investigating household vehicle ownership, mode choice and trip sharingdecisions using a combined revealed preference/stated preference Nested Logit model: Case study inBangkok Metropolitan Region. J. Transp. Geogr. 2010, 18, 402–410. [CrossRef]
12. Train, K.E. Discrete Choice Methods with Simulation, 2nd ed.; Cambridge University Press: New York, NY,USA, 2009; ISBN 9780521747387.
13. Hess, S.; Fowler, M.; Adler, T.; Bahreinian, A. A joint model for vehicle type and fuel type choice: Evidencefrom a cross-nested logit study. Transportation 2012, 39, 593–625. [CrossRef]
14. Miller, E.J.; Roorda, M.J.; Carrasco, J.A. A tour-based model of travel mode choice. Transportation 2005, 32,399–422. [CrossRef]
15. Hu, H.; Xu, J.; Shen, Q.; Shi, F.; Chen, Y. Travel mode choices in small cities of China: A case study ofChangting. Transp. Res. Part D Transp. Environ. 2018, 59, 361–374. [CrossRef]
16. Ho, C.; Mulley, C. Tour-based mode choice of joint household travel patterns on weekend and weekday.Transportation 2013, 40, 789–811. [CrossRef]
17. Yang, L.; Zheng, G.; Zhu, X. Cross-nested logit model for the joint choice of residential location, travel mode,and departure time. Habitat Int. 2013, 38, 157–166. [CrossRef]
18. Siddique, M.A.B.; Choudhury, C.F. Modelling the Behavioural Response to Congestion Pricing in Dhaka,Bangladesh. Transp. Dev. Econ. 2017, 3, 23. [CrossRef]
19. Santoso, D.S.; Tsunokawa, K. Spatial transferability and updating analysis of mode choice models indeveloping countries. Transp. Plan. Technol. 2005, 28, 341–358. [CrossRef]
20. Irawan, M.Z.; Belgiawan, P.F.; Widyaparaga, A.; Deendarlianto, X.; Budiman, A.; Muthohar, I.; Sopha, B.M.A market share analysis for hybrid cars in Indonesia. Case Stud. Transp. Policy 2017, 6, 336–341. [CrossRef]

Sustainability 2019, 11, 788 19 of 20
21. Leinia, A.V.; Muthohar, I.; Fauzi, I. The application of random regret minimization on commuter’s modechoice behaviour: Model-Fit comparisons with Rum-Modelling (case: Comparison between Matsuyama andYogyakarta). In Proceedings of the 1st International Symposium on Transportation Studies for DevelopingCountries (ISTSDC 2017); MATEC Web of Conferences, Hasanuddin, Sudan, 3–5 November 2017.
22. Irawan, M.Z.; Putri, M.K.; Belgiawan, P.F.; Dwitasari, R. Analyzing Commuters’ Behavior on Egress Tripfrom Railway Stations in Yogyakarta, Indonesia. Open Transp. J. 2017, 11, 53–66. [CrossRef]
23. Hyodo, T.; Montalbo, C.M., Jr.; Fujiwara, A.; Soehodho, S. Urban Travel Behaviour Characteristics of 13Cities based on Household Interview Survey data. J. East. Asia Soc. Transp. Stud. 2005, 6, 23–38.
24. Irawan, M.Z.; Sumi, T. Motorcycle-based adolescents’ travel behaviour during the school morning commuteand the effect of intra-household interaction on departure time and mode choice. Transp. Plan. Technol. 2012,35, 263–279. [CrossRef]
25. Dharmowijoyo, D.B.E.; Susilo, Y.O.; Karlström, A. Analysing the complexity of day-to-day individualactivity-travel patterns using a multidimensional sequence alignment model: A case study in the BandungMetropolitan Area, Indonesia. J. Transp. Geogr. 2017, 64, 1–12. [CrossRef]
26. Irawan, M.Z.; Munawar, A.; Dewanti; Muktaf, F. Analyzing the Effect of Trip Pattern on the Mode ChoiceDecision of LRT in Palembang City. In Proceedings of the the World Congress on Engineering, London, UK,4–6 July 2018; pp. 145–148.
27. Yagi, S.; Mohammadian, A. Joint Models of Home-Based Tour Mode and Destination Choices: Applicationsto a Developing Country. Transp. Res. Rec. J. Transp. Res. Board 2008, 2076, 29–40. [CrossRef]
28. Dharmowijoyo, D.B.E.; Susilo, Y.O.; Karlström, A. Day-to-day variability in travellers’ activity-travel patternsin the Jakarta metropolitan area. Transportation 2016, 43, 601–621. [CrossRef]
29. Lekshmi, G.R.A.; Landge, V.S.; Kumar, V.S.S. Activity Based Travel Demand Modeling of ThiruvananthapuramUrban Area. Transp. Res. Procedia 2016, 17, 498–505. [CrossRef]
30. Statistics of DKI Jakarta Province. Jakarta in Figures; Statistics of DKI Jakarta Province: Jakarta, Indonesia,2017; ISBN 0215.2150.
31. Google Maps Bekasi—Google Maps. Available online: https://www.google.co.id/maps/place/Bekasi,+Kota+Bks,+Jawa+Barat,+Indonesia/@-6.2614904,106.7753868,10.75z/data=!4m5!3m4!1s0x2e698c6900964f69:0xd00495351896398!8m2!3d-6.2382699!4d106.9755726 (accessed on 18 August 2018).
32. Irawan, M.Z.; Munawar, A.; Dewanti. Pemodelan Dan Penyusunan Pedoman Standar Pemilihan Tipe AngkutanUmum Perkotaan Di Indonesia; Universitas Gadjah Mada: Yogyakarta, Indonesia, 2017.
33. Statistics of Bekasi Municipality. Bekasi Municipality in Figures; Statistics of Bekasi Municipality: Bekasi,Indonesia, 2017; ISBN 1907.3763.
34. Dissanayake, D.; Morikawa, T. Household Travel Behavior in Developing Countries: Nested Logit Model ofVehicle Ownership, Mode Choice, and Trip Chaining. Transp. Res. Rec. 2002, 1805, 45–52. [CrossRef]
35. Yagi, S.; Nobel, D.; Kawaguchi, H. Time Series Comparison of Joint Mode and Destination Choice Models inChanging Transportation Environment. Transp. Res. Rec. J. Transp. Res. Board 2013, 2394, 100–110. [CrossRef]
36. Wen, C.-H.; Koppelman, F.S. The generalized nested logit model. Transp. Res. Part B Methodol. 2001, 35,627–641. [CrossRef]
37. Menon, A.; Lam, S.; Fan, S. Singapore’s road pricing system: Its past, present and future. ITE J. 1993, 63,44–48.
38. Olszewski, P.; Xie, L. Modelling the effects of road pricing on traffic in Singapore. Transp. Res. Part APolicy Pract. 2005, 39, 755–772. [CrossRef]
39. Taylor, B.D.; Miller, D.; Iseki, H.; Fink, C. Nature and/or nurture? Analyzing the determinants of transitridership across US urbanized areas. Transp. Res. Part A Policy Pract. 2009, 43, 60–77. [CrossRef]
40. Levinson, D.M.; Zhao, J. Introduction to the Special Issue on Value Capture for Transportation Finance.J. Transp. Land Use 2012, 5, 1–3. [CrossRef]
41. Jain, S.; Aggarwal, P.; Kumar, P.; Singhal, S.; Sharma, P. Identifying public preferences using multi-criteriadecision making for assessing the shift of urban commuters from private to public transport: A case study ofDelhi. Transp. Res. Part F Traffic Psychol. Behav. 2014, 24, 60–70. [CrossRef]
42. Sohoni, A.V.; Thomas, M.; Rao, K.V.K. Mode shift behavior of commuters due to the introduction of new railtransit mode. Transp. Res. Procedia 2017, 25, 2603–2618. [CrossRef]
43. Diao, M. Towards sustainable urban transport in Singapore: Policy instruments and mobility trends.Transp. Policy 2018, in press. [CrossRef]

Sustainability 2019, 11, 788 20 of 20
44. Nasri, A.; Zhang, L. The analysis of transit-oriented development (TOD) in Washington, D.C. and Baltimoremetropolitan areas. Transp. Policy 2014, 32, 172–179. [CrossRef]
45. Hasibuan, H.S.; Soemardi, T.P.; Koestoer, R.; Moersidik, S. The Role of Transit Oriented Development inConstructing Urban Environment Sustainability, the Case of Jabodetabek, Indonesia. Procedia Environ. Sci.2014, 20, 622–631. [CrossRef]
46. Soltani, A. Social and urban form determinants of vehicle ownership; evidence from a developing country.Transp. Res. Part A Policy Pract. 2017, 96, 90–100. [CrossRef]
© 2019 by the authors. Licensee MDPI, Basel, Switzerland. This article is an open accessarticle distributed under the terms and conditions of the Creative Commons Attribution(CC BY) license (http://creativecommons.org/licenses/by/4.0/).