a thesis submitted to - soest · nutrient loading andmicrobial indicators of fecal contamination in...
TRANSCRIPT

NUTRIENT LOADING AND MICROBIAL INDICATORS OF FECAL
CONTAMINATION IN THE SURFACE WATERS OF LAIE POINT, OAHU
A THESIS SUBMITTED TO THE GLOBAL ENVIRONMENTAL SCIENCE
UNDERGRADUATE DIVISION IN PARTIAL FULFILLMENT OF THE REQUIREMENTS FOR THE DEGREE OF
BACHELOR OF SCIENCE
IN
GLOBAL ENVIRONMENTAL SCIENCE
MAY 2006
By Christopher Pashby Kontoes
Thesis Advisors
Mark Merrifield James Cowen
We certify that we have read this thesis and that, in our opinion, it is satisfactory in
scope and quality as a thesis for the degree of Bachelor of Science in Global
Environmental Science.
THESIS ADVISORS,
__________________________ Mark Merrifield Department of Oceanography
__________________________ James Cowen Department of Oceanography
ii
ACKNOWLEDGEMENTS
Sincere appreciation is extended to Dr. Mark Merrifield and Dr. James Cowen for their
assistance and guidance in the preparation of this project and manuscript. In addition,
special thanks to Watson Okubo and Joshua Marvit of the State of Hawaii Department
of Health, Clean Water Branch, for their generosity and assistance in water collection
and analysis. Thank you to my wife Jackie Kontoes for being so understanding and
providing encouragement throughout this experience. Thanks also to Jerome Aucan for
assistance with the SBE 26 Seagauge as well as to all who provided valuable input.
iii

ABSTRACT
Cesspool usage on Laie Point, Oahu may be introducing excessive nutrient
contaminants and harmful pathogens into nearby marine waters. The purpose of this
study was to investigate the occurrence of excessive nutrient loading as well as the
occurrence of microbial indicators of fecal contamination in the surface waters around
Laie Point, and to assess the risk of contamination due to the use of on-site sewage
disposal systems. Water samples were collected under State of Hawaii Department of
Health (DOH) standards at various time intervals, under differing environmental
conditions, and were analyzed for NH3+, NO3
-, total N and total P, as well as for the
fecal indicator organisms enterococci and Clostridium perfringens. This assessment has
demonstrated excessive nutrient loading and the presence of fecal indicators above the
State of Hawaii DOH standards on a number of occasions, consistent with wastewater
effluent. Positive correlations, within the 95% confidence range, found between
enterococci and NO3- (0.93) and total N (0.85) suggest that surface waters receive both,
nutrient and pathogenic contamination, simultaneously. There is also evidence of an
inverse correlation between fecal indicators and salinity (correlation coefficient of -0.81
for enterococci and -0.83 for Clostridium perfringens, 95% confidence level); thus,
indicating the possibility that the freshwater in the Laie Point cesspools is directly
contributing to a nutrient and pathogenic load to the surface waters. This contamination
is potentially harmful to the environment and could present health risks to persons in
contact with contaminated waters.
iv

TABLE OF CONTENTS
Acknowledgements ............................................................................................ iii
Abstract ................................................................................................................iv
List of Tables .......................................................................................................vi
List of Figures.................................................................................................... vii
List of Abbreviations ...........................................................................................ix
Preface .................................................................................................................. x
Chapter 1: Introduction ........................................................................................ 1
Chapter 2: Method ................................................................................................ 7
Study Area ...................................................................................................... 7
Sites ................................................................................................................ 8
Dye Seeding ................................................................................................. 10
Tides ............................................................................................................. 10
Water Collection .......................................................................................... 11
Nutrient Analysis ......................................................................................... 13
Fecal Indicator Organism Analysis ............................................................. 13
Chapter 3: Results and Discussion..................................................................... 14
Dye Seeding ................................................................................................. 14
Environmental Conditions ........................................................................... 15
Nutrients ....................................................................................................... 17
January 30, 2006 .................................................................................... 23
February 22, 2006 .................................................................................. 23
March 20, 2006 ...................................................................................... 23
Results and Discussion of Averages ..................................................... 24
Fecal Indicator Organisms ........................................................................... 26
February 22, 2006 .................................................................................. 30
March 20, 2006 ...................................................................................... 30
April 3, 2006 .......................................................................................... 31
April 6, 2006 .......................................................................................... 31
v
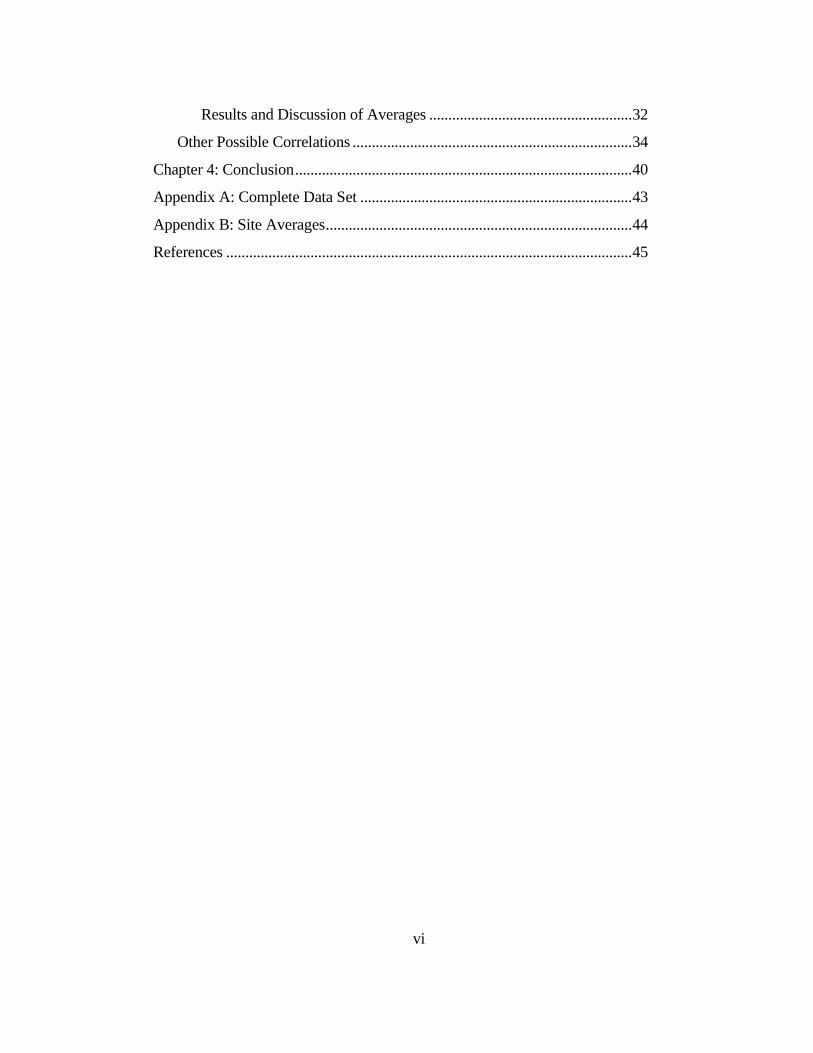
Results and Discussion of Averages ..................................................... 32
Other Possible Correlations ......................................................................... 34
Chapter 4: Conclusion ........................................................................................ 40
Appendix A: Complete Data Set ....................................................................... 43
Appendix B: Site Averages ................................................................................ 44
References .......................................................................................................... 45
vi
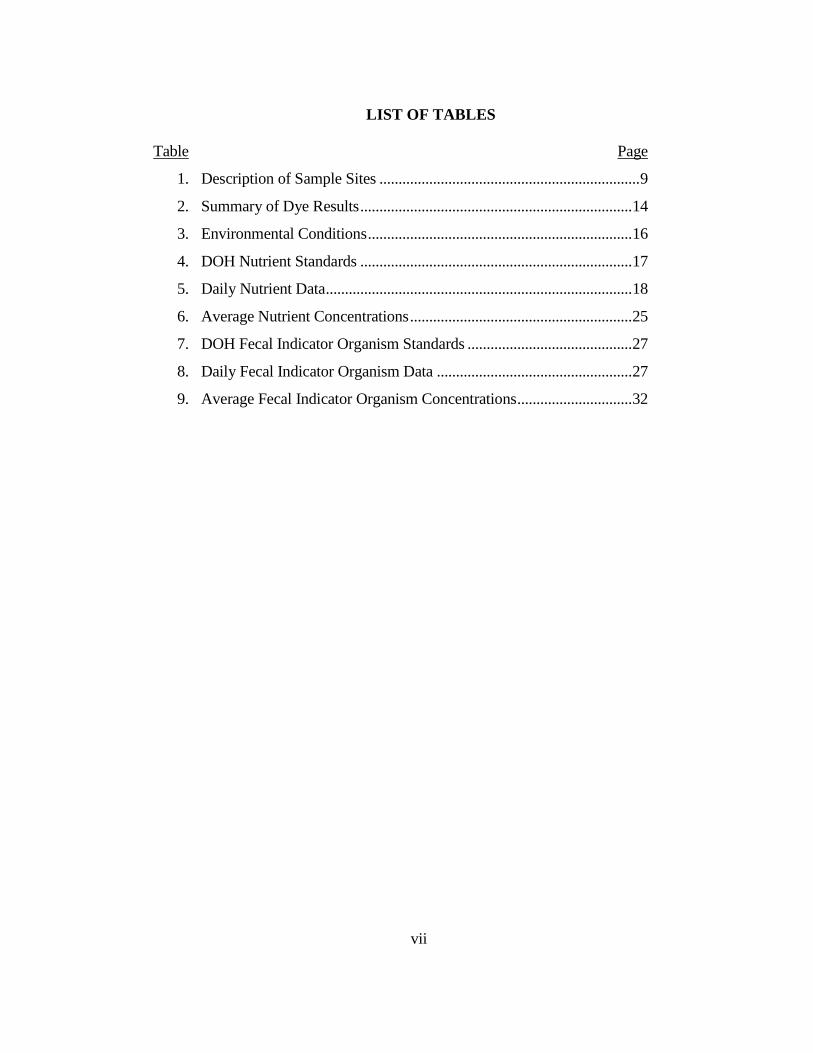
LIST OF TABLES
Table Page
1. Description of Sample Sites .................................................................... 9
2. Summary of Dye Results ....................................................................... 14
3. Environmental Conditions ..................................................................... 16
4. DOH Nutrient Standards ....................................................................... 17
5. Daily Nutrient Data ................................................................................ 18
6. Average Nutrient Concentrations .......................................................... 25
7. DOH Fecal Indicator Organism Standards ........................................... 27
8. Daily Fecal Indicator Organism Data ................................................... 27
9. Average Fecal Indicator Organism Concentrations .............................. 32
vii
LIST OF FIGURES
Figure Page
1. Typical cesspool design ........................................................................... 1
2. Groundwater flow rate during an ebbing tide ......................................... 4
3. Groundwater flow rate during a rain event ............................................. 5
4. Locational map of the Laie Point ............................................................ 7
5. Geologic soil distribution of Laie Point .................................................. 8
6. Distribution of sample sites ..................................................................... 9
7. Collection containers ............................................................................. 12
8. Hydrolab Quanta instrument ................................................................. 12
9. Technicon Auto Analyzer 3 Digital Colorimeter ................................. 13
10. Distribution of Ammonium ................................................................... 19
11. Distribution of Nitrate ............................................................................ 20
12. Distribution of Total Nitrogen ............................................................... 21
13. Distribution of Total Phosphorus .......................................................... 22
14. Distribution of Site Averages for Nutrients .......................................... 25
15. Distribution of Enterococci ................................................................... 28
16. Distribution of Clostridium Perfringens ............................................... 29
17. Distribution of Site Averages for Fecal Indicator Organisms .............. 33
18. Enterococci, Rain and Malekahana Enterococci .................................. 35
19. C. Perfringens, Rain and Malekahana C. Perfringens, ........................ 35
20. Enterococci at Malekahana and Laie Point ........................................... 36
21. Salinity vs Fecal indicator Organism Concentrations .......................... 38
22. Scaled Averages for Various Water Quality Parameters...................... 39
viii
LIST OF ABBREVIATIONS
Abbreviation Meaning
C.Perfringens ........................................................... Clostridium Perfringens
CFU .............................................................................. Colony forming units
DOH ............................................................................. Department of Health
EPA........................................................... Environmental Protection Agency
N ........................................................................................................ Nitrogen
NH4+ ............................................................................................. Ammonium
NO3- ...................................................................................................... Nitrate
NOAA ............... National Oceanographic and Atmospheric Administration
OSDS ............................................................ On-site sewage disposal system
P ..................................................................................................... Phosphorus
USDA ............................................ United States Department of Agriculture
ix
PREFACE
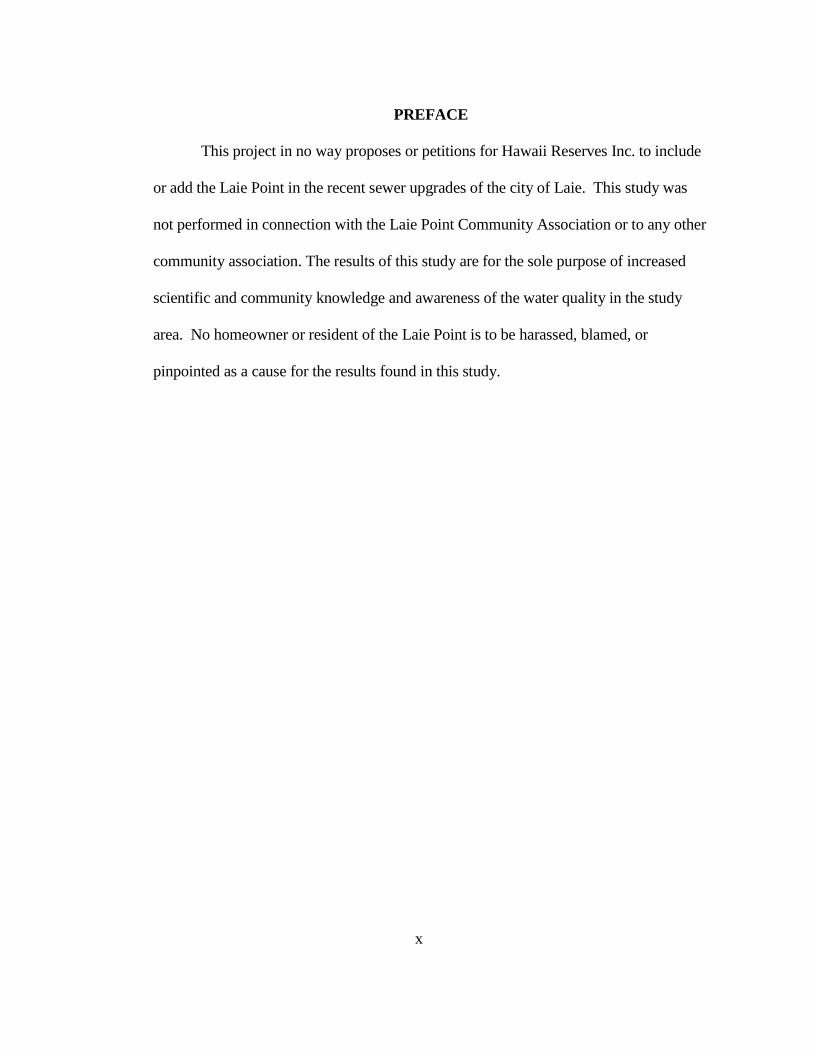
This project in no way proposes or petitions for Hawaii Reserves Inc. to include
or add the Laie Point in the recent sewer upgrades of the city of Laie. This study was
not performed in connection with the Laie Point Community Association or to any other
community association. The results of this study are for the sole purpose of increased
scientific and community knowledge and awareness of the water quality in the study
area. No homeowner or resident of the Laie Point is to be harassed, blamed, or
pinpointed as a cause for the results found in this study.
x
CHAPTER 1 INTRODUCTION
Contamination of groundwater by pollutants from on-site sewage disposal
systems (OSDS) has long been recognized as a cause of eutrophication and health issues
in lakes, but only recently have studies suggested similar groundwater-related issues in
tropical marine waters [Lapointe et al., 1990]. OSDS are non-sewered wastewater
treatment systems such as septic systems and cesspools [Lapointe et al., 1990; Paul et
al., 1995a; Paul et al., 1995b]. Both systems are similar and are used primarily for
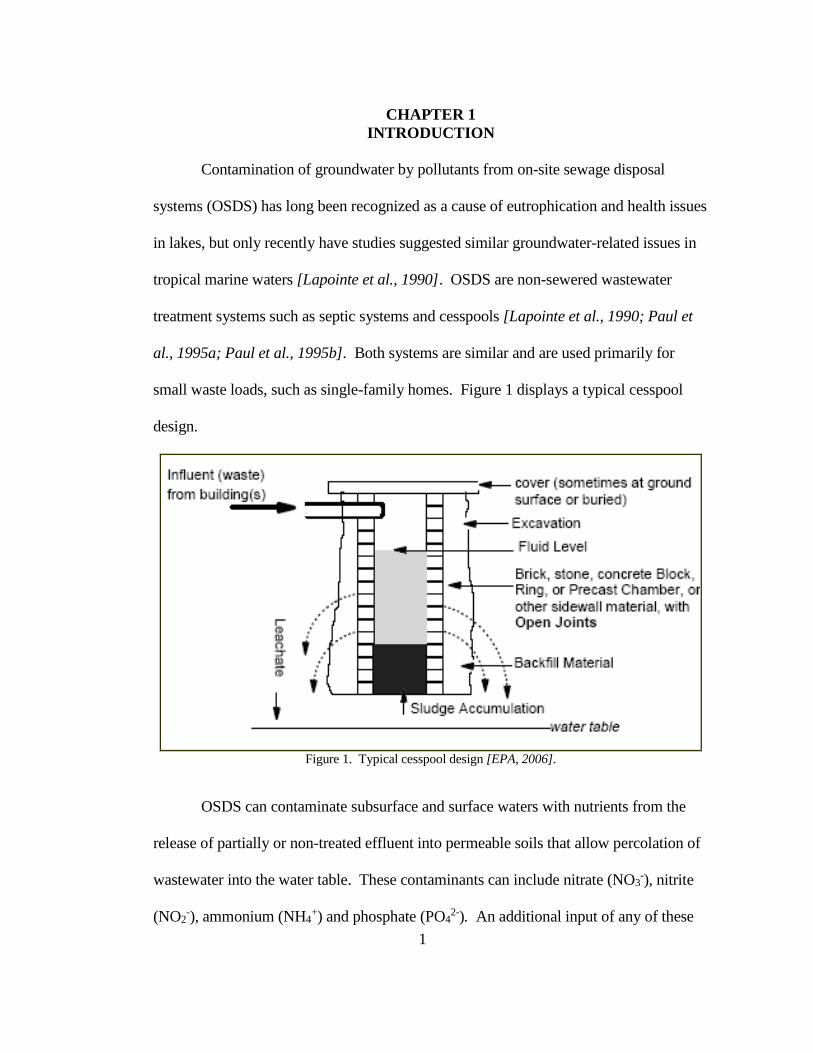
small waste loads, such as single-family homes. Figure 1 displays a typical cesspool
design.
Figure 1. Typical cesspool design [EPA, 2006].
OSDS can contaminate subsurface and surface waters with nutrients from the
release of partially or non-treated effluent into permeable soils that allow percolation of
wastewater into the water table. These contaminants can include nitrate (NO3-), nitrite
(NO2-), ammonium (NH4
+) and phosphate (PO42-). An additional input of any of these
1
nutrients into an oligotrophic environment may stimulate phytoplankton and other algal
growth, causing eutrophication, the tendency of an aquatic system to accumulate
nutrients and organic matter as a result of excess photosynthesis. While eutrophication
occurs naturally, it may be accelerated by human activities [Laws, 2000]. Problems
associated with eutrophication include sediment build-up, poor water clarity, hypoxia or
anoxia, algal overgrowth, and loss of reefs [Lapointe, 1987; Lapointe, 1989; Lapointe &
O’Connell, 1989; McComb et al., 1981; Smith et al., 1981; Griffin et al., 1999; Paul et
al., 1995a; Paul et al., 1995b].
In addition to nutrient loading of subsurface and surface waters, OSDS are
known to be a source of microbial contamination [Keswick, 1984]. Microbial pathogens
in human sewage include Salmonella, Shigella ssp., Vibrio cholera, enterotoxigenic
Escherichia coli, and over 100 different types of pathogenic viruses [Paul et al., 1995b].
Illnesses directly associated with groundwater contamination from OSDS have included
hepatitis, gastroenteritis, and Norwalk virus dysentery [Paul et al., 1995b; Griffin,
1999], all of which pose health risks to persons exposed to contaminated water.
The general consensus has been that contaminated water would undergo in situ
uptake (water polishing), by such processes as bacterial utilization, adsorption of
phosphate by a carbonate matrix, and that significant dilution of the sewage would occur
before reaching surface waters [Corbett et al., 2000]. However, if this water polishing
does not take place, and the flux of effluent into surface waters is high, human and
ecosystem health would be at risk, and different wastewater disposal methods would be
necessary [Corbett et al., 2000]. Despite cesspools being more widely used in Hawaii
2

than in any other state in the country [EPA 2006], much of the research testing the
general consensus of OSDS contamination has been on islands such as the Florida Keys
and Bermuda, where OSDS use is concentrated in high density subdivisions and the
height difference between the water table and septic tank or cesspool discharge is
minimal [Lapointe, 1989; Lapointe et al., 1990; Paul et al., 1995a; Paul et al., 1995b].
According to Lapointe et al. [1990], the highest concentrations of nitrate, nitrite,
ammonium and phosphate in groundwater of the Florida Keys, occurred in areas
adjacent to OSDS, with concentrations varying greatly between sample sites. It was
also noted by Lapointe et al. [1990], that in the Florida Keys, there were significant
seasonal variations in the concentration of each species in both ground and surface
water. Groundwater concentrations increased 400-fold for nitrate plus nitrite and
ammonium, as compared to the control (Florida Keys groundwater); soluble reactive
phosphate concentrations increased 70-fold compared to the control [Lapointe et al.,
1990]. Surface water concentrations increased 5-fold for nitrate plus nitrite, as
compared to the control (Florida Keys groundwater); ammonium remained similar, and
soluble reactive phosphate was more than double that of the control. It was also found
that groundwater N:P ratios are elevated in locations near OSDS and increased with
increasing distance from the OSDS [Lapointe et al., 1990], indicating absorption of
phosphate by the matrix while nitrogen percolated.
In studies of various microbial communities associated with OSDS, Griffin et al.
[1999] found that 95% of surface water sites on the Florida Keys tested positive for at
least one human enteric virus, 63% of sites tested positive for Hepatitis A virus, and
3
10% tested positive for Norwalk viruses. According to Paul et al. [1995b], eight of
fourteen marine surface water sites possessed at least one fecal indicator level above
background and one site had fecal coliform levels exceeding Florida standards. Paul et
al. [1995a] found that when OSDS were seeded with a viral tracer, it took 31h for the
tracer to reach a site near the ocean (about 137 m from the seeded OSDS) and 55h for
the tracer to reach an offshore site (about 850 m from the seeded OSDS); this
demonstrates that the carbonate substrate of the Florida Keys is very permeable.
On low coastal zones of islands, such as the Florida Keys, Hawaii and Bermuda,
groundwater flow is partially regulated by tidal influence and flow is primarily in a
lateral direction [Lapointe et al., 1990]. This is due in part to the common geology of
coastal islands creating an “aquatard” at the interface of a limestone base overlain with
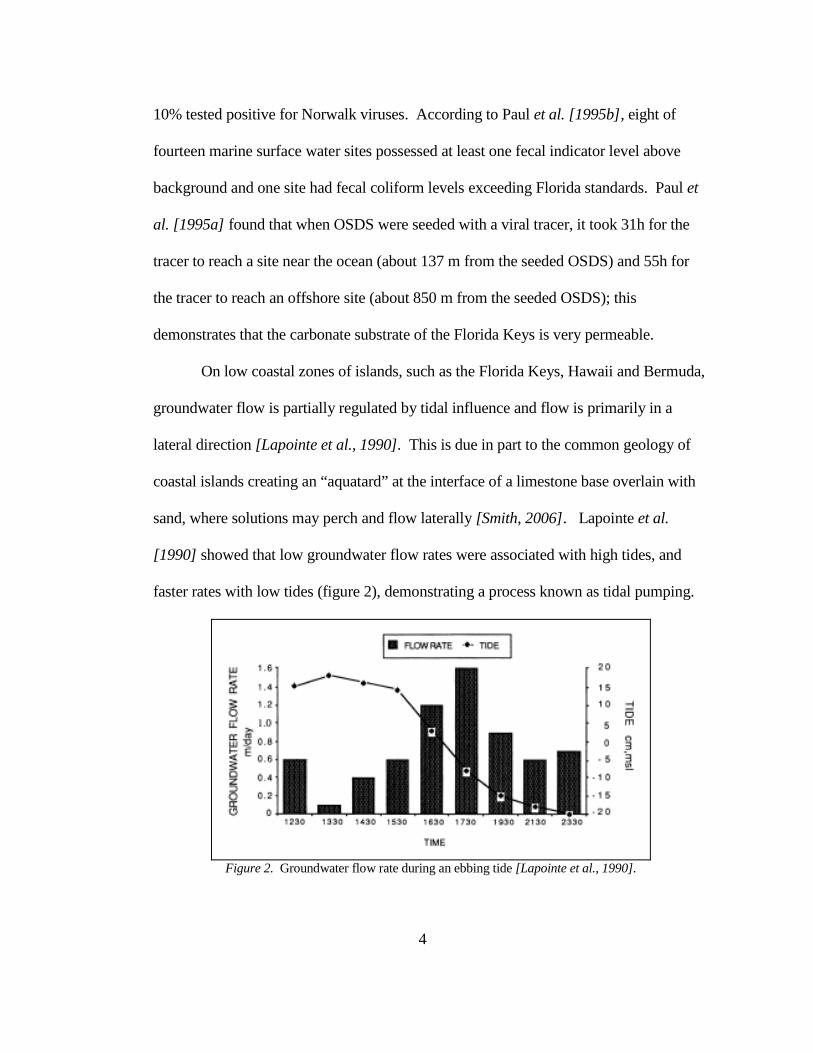
sand, where solutions may perch and flow laterally [Smith, 2006]. Lapointe et al.
[1990] showed that low groundwater flow rates were associated with high tides, and
faster rates with low tides (figure 2), demonstrating a process known as tidal pumping.
Figure 2. Groundwater flow rate during an ebbing tide [Lapointe et al., 1990].
4
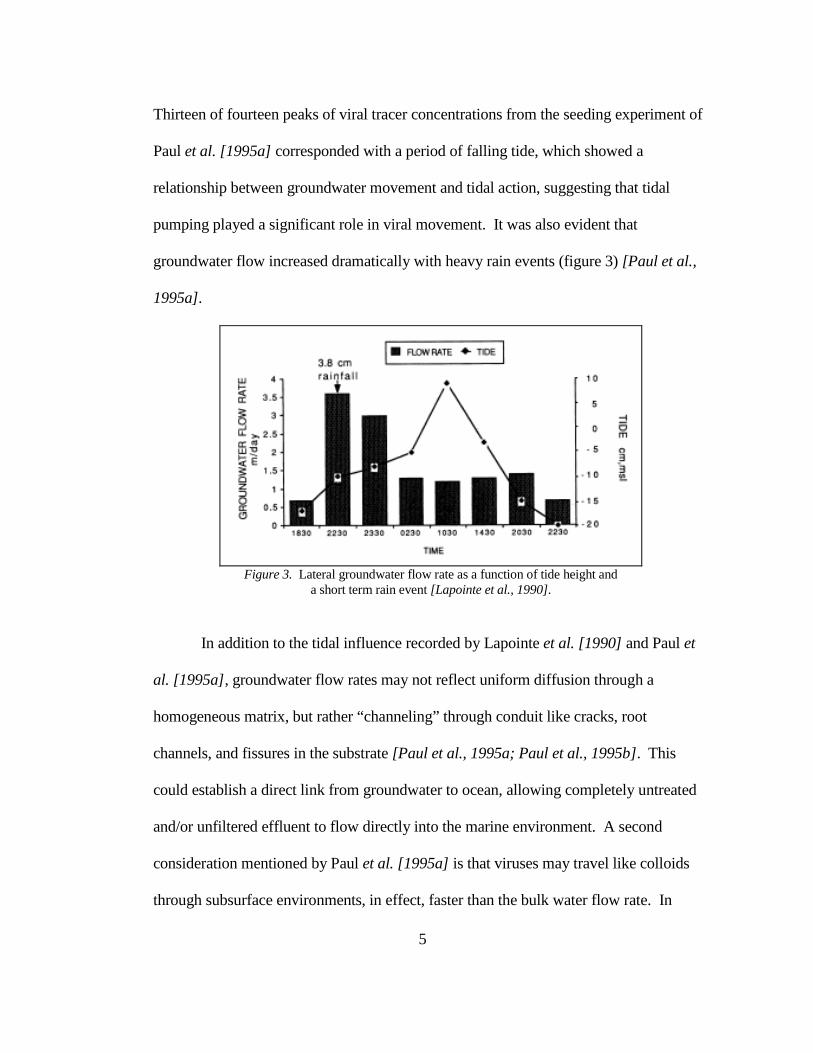
Thirteen of fourteen peaks of viral tracer concentrations from the seeding experiment of
Paul et al. [1995a] corresponded with a period of falling tide, which showed a
relationship between groundwater movement and tidal action, suggesting that tidal
pumping played a significant role in viral movement. It was also evident that
groundwater flow increased dramatically with heavy rain events (figure 3) [Paul et al.,
1995a].
Figure 3. Lateral groundwater flow rate as a function of tide height and
a short term rain event [Lapointe et al., 1990].
In addition to the tidal influence recorded by Lapointe et al. [1990] and Paul et
al. [1995a], groundwater flow rates may not reflect uniform diffusion through a
homogeneous matrix, but rather “channeling” through conduit like cracks, root
channels, and fissures in the substrate [Paul et al., 1995a; Paul et al., 1995b]. This
could establish a direct link from groundwater to ocean, allowing completely untreated
and/or unfiltered effluent to flow directly into the marine environment. A second
consideration mentioned by Paul et al. [1995a] is that viruses may travel like colloids
through subsurface environments, in effect, faster than the bulk water flow rate. In
5
either case, the contaminants in the wastewater would not have time to undergo
sufficient in situ uptake (water polishing), because of its increased groundwater
transport.
The purpose of this study was to investigate the occurrence of excessive nutrient
loading as well as the occurrence of microbial indicators of fecal contamination in the
surface waters around Laie Point, Oahu and to assess the risk of contamination due to
the use of OSDS. This location was chosen due to the concentration of approximately
100 cesspools currently in use on a single, small peninsula. The nutrient contaminants
chosen for analysis includes NH4+, NO3
-, total N and total P, all of which may contribute
to eutrophication. The fecal indicators chosen include enterrococci and Clostridium
perfringens; both have shown resilience in the environment. Specifically, enterococci
may indicate a specific portion of the fecal streptococci and C. perfringens has been
suggested as a better indicator of contamination due to the nature of the spore, allowing
enhanced survival in marine waters [Paul et al., 1995b].
6
CHAPTER 2 METHOD
Study Area
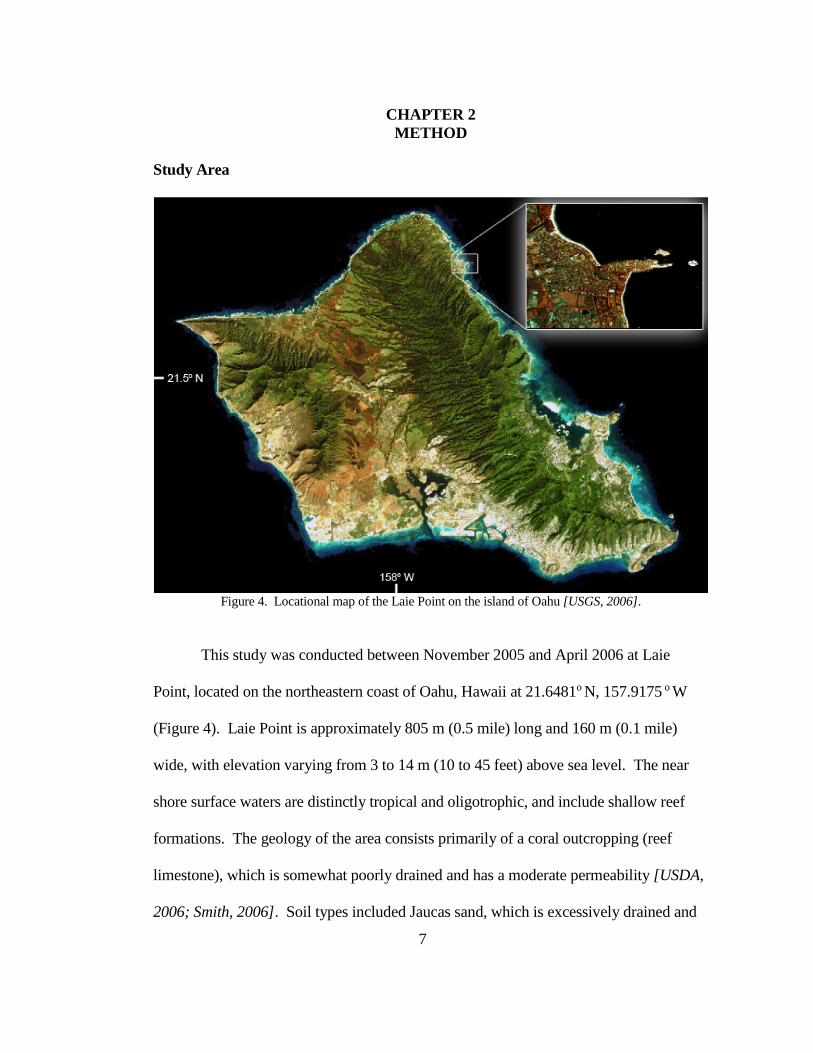
Figure 4. Locational map of the Laie Point on the island of Oahu [USGS, 2006].
This study was conducted between November 2005 and April 2006 at Laie
Point, located on the northeastern coast of Oahu, Hawaii at 21.6481o N, 157.9175 o W
(Figure 4). Laie Point is approximately 805 m (0.5 mile) long and 160 m (0.1 mile)
wide, with elevation varying from 3 to 14 m (10 to 45 feet) above sea level. The near
shore surface waters are distinctly tropical and oligotrophic, and include shallow reef
formations. The geology of the area consists primarily of a coral outcropping (reef
limestone), which is somewhat poorly drained and has a moderate permeability [USDA,
2006; Smith, 2006]. Soil types included Jaucas sand, which is excessively drained and
7
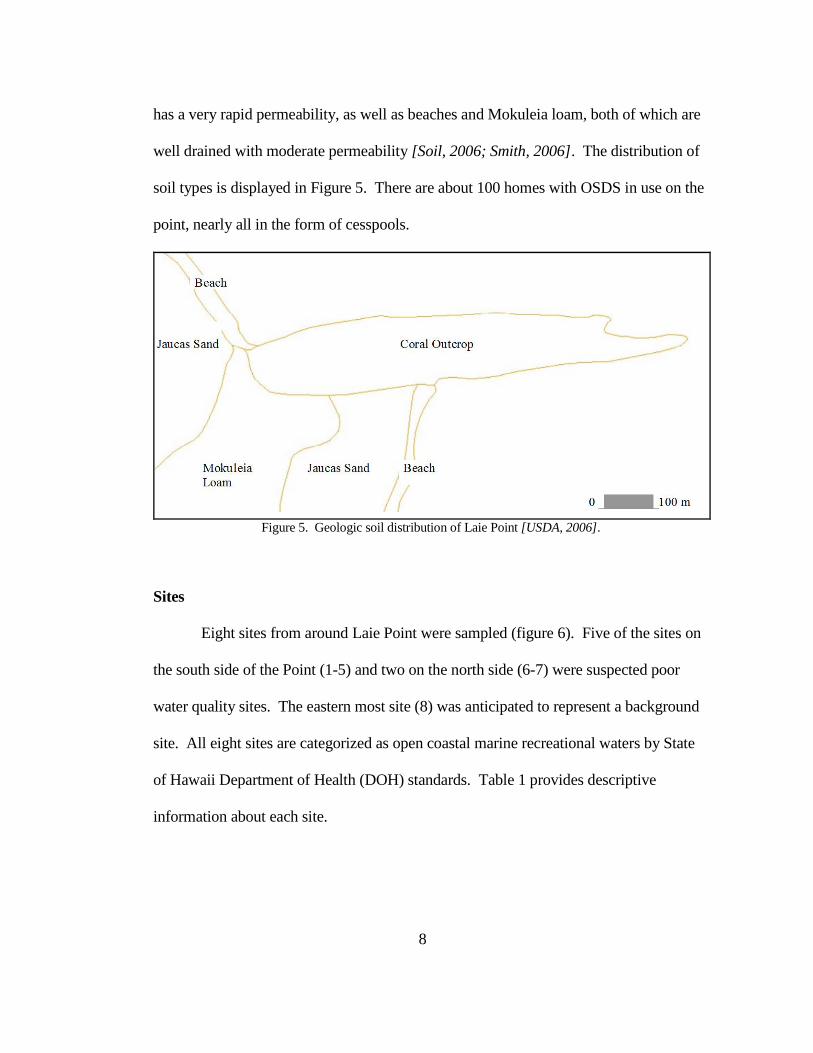
has a very rapid permeability, as well as beaches and Mokuleia loam, both of which are
well drained with moderate permeability [Soil, 2006; Smith, 2006]. The distribution of
soil types is displayed in Figure 5. There are about 100 homes with OSDS in use on the
point, nearly all in the form of cesspools.
Figure 5. Geologic soil distribution of Laie Point [USDA, 2006].
Sites
Eight sites from around Laie Point were sampled (figure 6). Five of the sites on
the south side of the Point (1-5) and two on the north side (6-7) were suspected poor
water quality sites. The eastern most site (8) was anticipated to represent a background
site. All eight sites are categorized as open coastal marine recreational waters by State
of Hawaii Department of Health (DOH) standards. Table 1 provides descriptive
information about each site.
8

Figure 6. Spatial distribution of sample site locations [USGS, 2006].
Table 1. Description of sample sites.
Site Coordinates Description of Site
1 157.9176oW 21.6459 oN
Approximately 75 m from shore in a shallow (0.5 m) sand bottom channel in the reef. Reef between the Point and site 1 is very shallow (0.25 m) and is deepest in channels near the shore.
2 157.9173 oW 21.6474 oN
Tide pool area near shore. Crabs and small fish visible. Some algal cover.
3 157.9169 oW, 21.674 oN
Crabs and small fish visible. Abundant algal cover. Wave activity substantially diminished due to fringing reef.
4 157.9166 oW, 21.6475 oN
Similar to site 3. Samples were collected from near a crevice in the wall of the Point.
5 157.9163 oW, 21.6475 oN
Similar to site 3. Samples were collected from a large crevice in the wall of the Point.
6 157.9188 oW, 21.6489 oN
Small, shaded cave. Coarse sand bottom. Cave extends a short distance under a house. Water flows in and out via a small opening.
7 157.9217 oW, 21.6484 oN
Just offshore from the outlet of a small runoff reservoir from a nearby shopping center.
8 157.9129 oW, 21.6480 oN
Proposed control site. Approximately 5 m deep. Vigorous mixing due to waves breaking against the Point.
9

Dye Seeding
Trace-A-Leak Dye tablets from the Presto Dyechem Co. Inc. were used to
visually locate possible “channeling” described by Paul et al. [1995a; 1995b]. The
dilution rate for one tablet per 60 gallons of water equals 1ppm concentration in clear
water. Each tablet dissolves in one to three minutes. The dye test was performed twice
on the south side of the point. On November 18, 2005, 50 tablets were flushed via toilet
in 10 homes; 9 homes confirmed flushing the dye between 9:00am - 10:00am. On
December 4, 2005, 150 tablets were flushed via toilet in 7 homes; 5 homes confirmed
flushing dye between 9:00am - 9:30am. Visual observations for the presence of dye in
the ocean commenced at 9:00am on each day. Sites 1 through 5 were patrolled from the
beach, tide pools, and from the point every hour until dusk (approximately 6:00pm);
further patrolling resumed the following morning at random intervals. Sites 6 and 7
were briefly patrolled approximately every four hours from on the point until dusk;
further patrolling commenced the following morning at random intervals. Homeowners
participating in the dye seeding desired to remain anonymous.
Tides
A Sea Bird Electronics 26 Seagauge wave and tide recorder was deployed on
December 15, 2005 at 157.9153oW, 21.6464 oN. This instrument employs a Digiquartz
pressure sensor with typical application accuracy of 0.01% and detection range of 0 to
200 psi. Tides were computed as the mean water depth over the pressure sensor during
each burst recorded by the sensor. Due to battery life, 59.5 days of tides were recorded;
10

therefore, tides during actual samplings were projected, based on comparison of the
Seagauge data and a NOAA tide chart for Laie Bay, Hawaii [NOAA, 2006b].
Water Collection
Surface water samples were collected between January 30, 2006 and April 6,
2006. Water samples and ancillary data were collected according to State of Hawaii
DOH standards, either by or under supervision of a DOH employee. Each sample for
nutrient analysis was collected by hand from just below the surface into two factory-
washed, clear 1-liter low-density polyethylene cube-containers and into one distilled
water-rinsed, opaque 2-liter high-density polyethylene container (Figure 7). Each
sample for fecal indicator analysis was collected into a UV sterilized, 1-liter high-
density polyethylene container. In all cases except for the bacterial samples, the
containers and caps were rinsed with the water to be sampled three times before filling.
Physical contact with surface water near sample sites was minimized when possible.
All samples were placed on ice after collection. Temperature, salinity, dissolved
oxygen, and pH was measured using a Hydrolab Quanta water-monitoring instrument
(Figure 8) immediately after water collection.
11

Figure 7. Water sample collection containers described above
(Fecal indicator organism collection bottles are not shown).
Figure 8. Hydrolab Quanta water monitoring instrument.
12
Nutrient Analysis
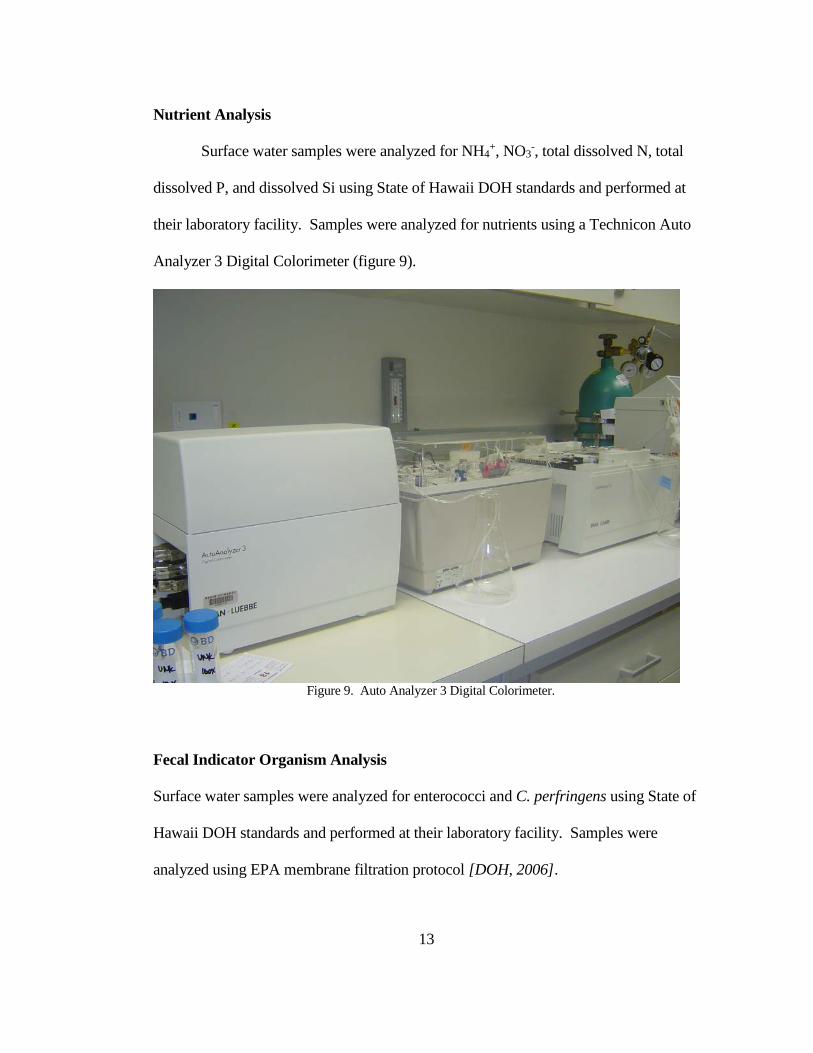
Surface water samples were analyzed for NH4+, NO3
-, total dissolved N, total
dissolved P, and dissolved Si using State of Hawaii DOH standards and performed at
their laboratory facility. Samples were analyzed for nutrients using a Technicon Auto
Analyzer 3 Digital Colorimeter (figure 9).
Figure 9. Auto Analyzer 3 Digital Colorimeter.
Fecal Indicator Organism Analysis
Surface water samples were analyzed for enterococci and C. perfringens using State of
Hawaii DOH standards and performed at their laboratory facility. Samples were
analyzed using EPA membrane filtration protocol [DOH, 2006].
13

CHAPTER 3 RESULTS AND DISCUSSION
Dye Seeding
Table 2 presents the dye seeding results. Of the 10 homes provided with dye on
November 18, 2005, 90% confirmed adding the dye to their cesspool via a toilet. This
amount of dye would result in visible dye detection of 1.02x10⁵ liters (27,000 gals) of
water. On December 5, 2005, 71% of the homes provided with dye confirmed adding
the dye, which would lead to visible detection of 1.70x10⁵ liters (45,000 gals) of dyed
water. The surface waters surrounding Laie Point showed no sign of dye color on any
of the days monitored.
Table 2. Summary of dye seeding results for each site.
Date of Seeding Quantity of Dye Tablets
Quantity of Homes Seeded Site Dye Observed
November 18, 2005 50 10*
1 2 3 4 5 6 7 8
No No No No No No No No
December 5, 2005 150 7**
1 2 3 4 5 6 7 8
No No No No No No No No
* 9 homes confirmed flushing dye ** 5 homes confirmed flushing dye
There is a very high possibility that the dilution of dye was too great to achieve
visual detection in surface waters. The rate of percolation into marine waters, combined
14
with mixing action from waves and currents could dilute the dye to a concentration
below visual detection. Dilution, below detectable concentrations, could have also been
reached if the effluent seeps very slowly into the surface waters. Other potential
problems associated with the dye seeding experiment included an unknown quantity of
solid material that may be a source of dye absorption, resulting in a further reduction of
dye in the effluent. Other explanations for the absence of dye in marine waters are that a
channel or fissure necessary for direct fluid flow either does not exist or leads to an
offshore location, or that such channels lead to a site that was not visible during surface
water monitoring. It is also possible that in the absence of such channels, transport of
dye toward observation sites was too slow to be observed within the observation time
frame.
Environmental Conditions
This study was conducted over a period of time when environmental conditions
varied greatly. In particular, this study measured nutrient and fecal indicator
concentrations before, during and after a major rainstorm. Table 3 summarizes
environmental conditions over the course of this study.
15
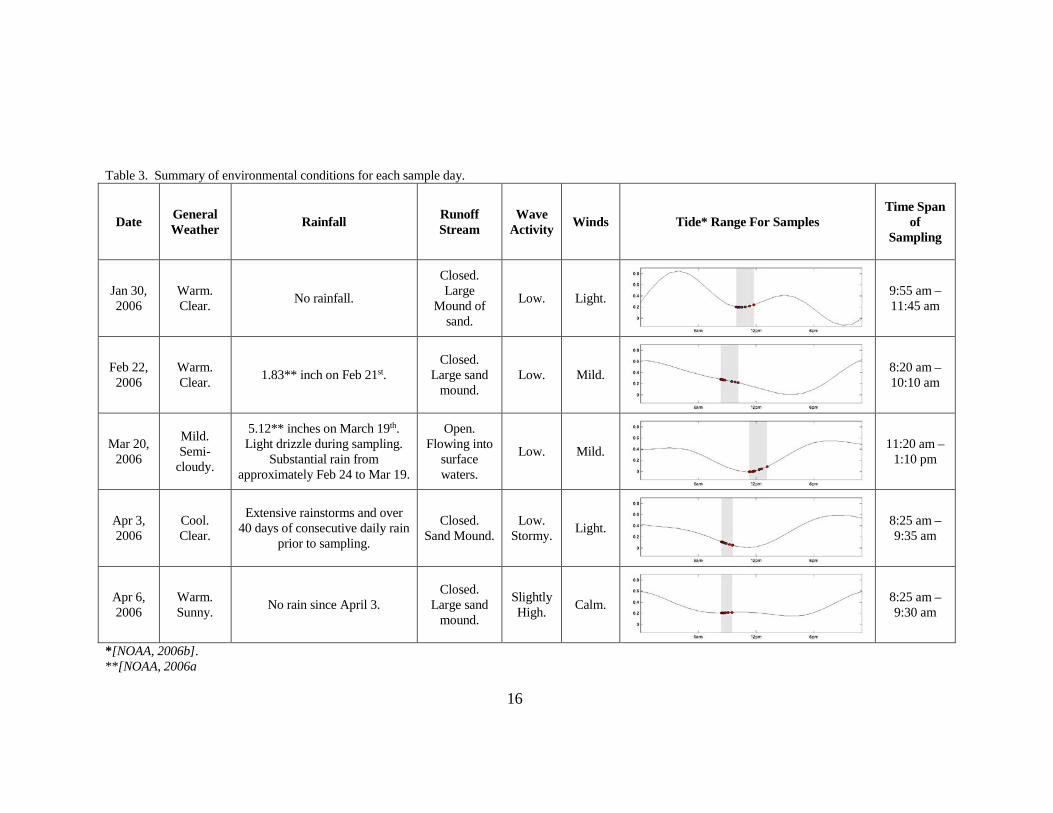
Table 3. Summary of environmental conditions for each sample day.
Date General Weather Rainfall Runoff
Stream Wave
Activity Winds Tide* Range For Samples Time Span
of Sampling
Jan 30, 2006
Warm. Clear. No rainfall.
Closed. Large
Mound of sand.
Low. Light.
9:55 am – 11:45 am
Feb 22, 2006
Warm. Clear. 1.83** inch on Feb 21st.
Closed. Large sand
mound. Low. Mild.
8:20 am – 10:10 am
Mar 20, 2006
Mild. Semi-
cloudy.
5.12** inches on March 19th. Light drizzle during sampling.
Substantial rain from approximately Feb 24 to Mar 19.
Open. Flowing into
surface waters.
Low. Mild.
11:20 am – 1:10 pm
Apr 3, 2006
Cool. Clear.
Extensive rainstorms and over 40 days of consecutive daily rain
prior to sampling.
Closed. Sand Mound.
Low. Stormy. Light.
8:25 am – 9:35 am
Apr 6, 2006
Warm. Sunny. No rain since April 3.
Closed. Large sand
mound.
Slightly High. Calm.
8:25 am – 9:30 am
*[NOAA, 2006b]. **[NOAA, 2006a
16

Nutrients
Table 4 summarizes the State of Hawaii DOH standards for nutrients in open
coastal waters. Table 5 presents the complete data set for nutrients with values that
exceed DOH standards highlighted. The complete data set, including ancillary data, is
included in Appendix A. Figures 10 – 13 display a spatial distribution of results for
each site on each sample day. Marker sizes in figures 10 – 13 represent relative
concentrations of NH3+, NO3
-, total N and total P, respectively. Refer to table 3 for
environmental conditions for each day.
Table 4. Summary of State of Hawaii DOH nutrient standards [DOH, 2006]. DOH standard criteria for all Hawaiian open coastal waters*
PARAMETER STANDARD (mg/L)
Ammonium (mg N from NH3+/L) 0.002
Nitrate + nitrite (mg [NO3- + N02
-]/L) 0.0035
Total Nitrogen (mg N/L) 0.110
Total Phosphorus (mg P/L) 0.016 * Open coastal waters are defined as marine waters bounded by the 183 m depth contour and the shoreline, excluding a specific set of bays.
17
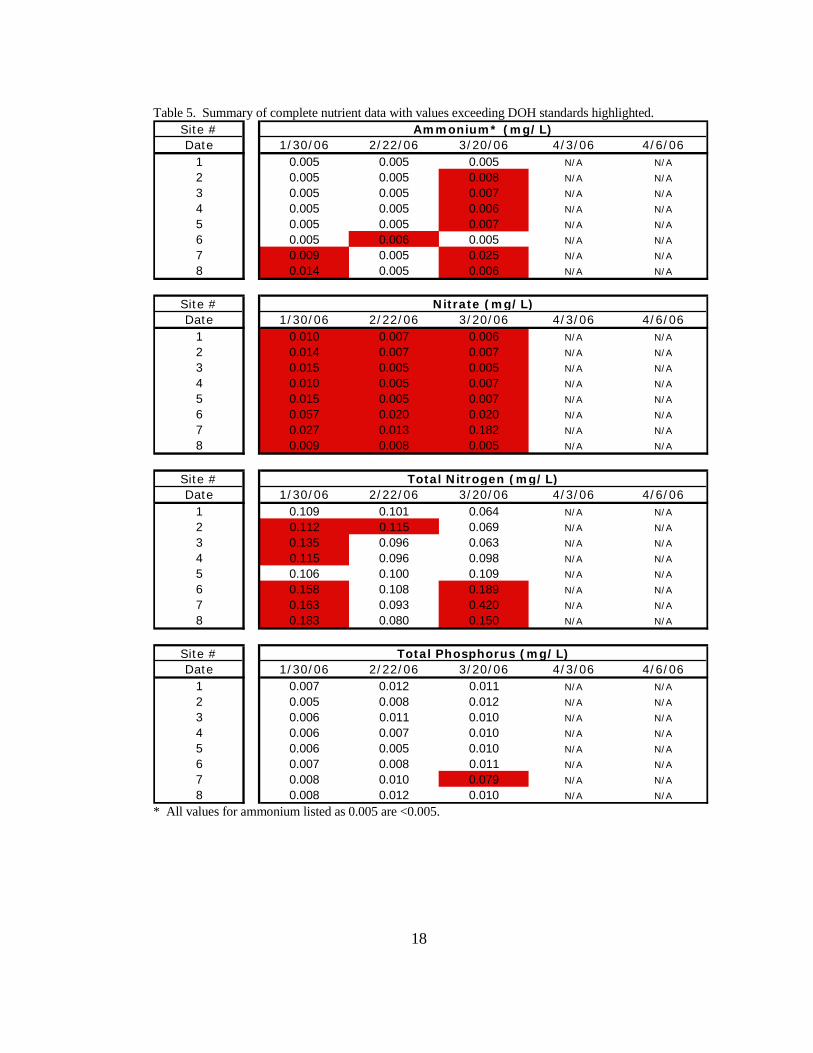
Table 5. Summary of complete nutrient data with values exceeding DOH standards highlighted.
* All values for ammonium listed as 0.005 are <0.005.
Site #Date 1/30/06 2/22/06 3/20/06 4/3/06 4/6/06
1 0.005 0.005 0.005 N/A N/A2 0.005 0.005 0.008 N/A N/A3 0.005 0.005 0.007 N/A N/A4 0.005 0.005 0.006 N/A N/A5 0.005 0.005 0.007 N/A N/A6 0.005 0.006 0.005 N/A N/A7 0.009 0.005 0.025 N/A N/A8 0.014 0.005 0.006 N/A N/A
Site #Date 1/30/06 2/22/06 3/20/06 4/3/06 4/6/06
1 0.010 0.007 0.006 N/A N/A2 0.014 0.007 0.007 N/A N/A3 0.015 0.005 0.005 N/A N/A4 0.010 0.005 0.007 N/A N/A5 0.015 0.005 0.007 N/A N/A6 0.057 0.020 0.020 N/A N/A7 0.027 0.013 0.182 N/A N/A8 0.009 0.008 0.005 N/A N/A
Site #Date 1/30/06 2/22/06 3/20/06 4/3/06 4/6/06
1 0.109 0.101 0.064 N/A N/A2 0.112 0.115 0.069 N/A N/A3 0.135 0.096 0.063 N/A N/A4 0.115 0.096 0.098 N/A N/A5 0.106 0.100 0.109 N/A N/A6 0.158 0.108 0.189 N/A N/A7 0.163 0.093 0.420 N/A N/A8 0.183 0.080 0.150 N/A N/A
Site #Date 1/30/06 2/22/06 3/20/06 4/3/06 4/6/06
1 0.007 0.012 0.011 N/A N/A2 0.005 0.008 0.012 N/A N/A3 0.006 0.011 0.010 N/A N/A4 0.006 0.007 0.010 N/A N/A5 0.006 0.005 0.010 N/A N/A6 0.007 0.008 0.011 N/A N/A7 0.008 0.010 0.079 N/A N/A8 0.008 0.012 0.010 N/A N/A
Ammonium* (mg/L)
Nitrate (mg/L)
Total Nitrogen (mg/L)
Total Phosphorus (mg/L)
18

Figure 10. Spatial distribution of ammonium observed at each site, for each sample day. Marker sizes are relative to observations.
19

Figure 11. Spatial distribution of nitrate observed at each site, for each sample day. Marker sizes are relative to observations.
20

Figure 12. Spatial distribution of total nitrogen observed at each site, for each sample day. Marker sizes are relative to observations.
21
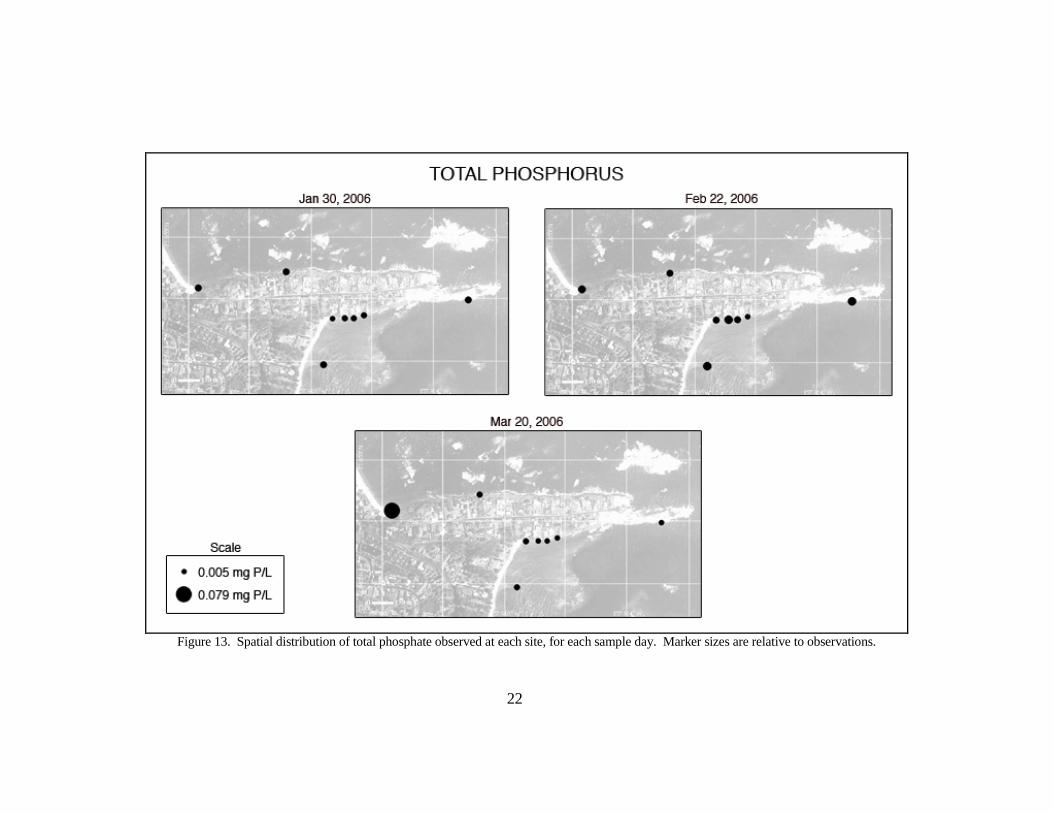
Figure 13. Spatial distribution of total phosphate observed at each site, for each sample day. Marker sizes are relative to observations.
22

January 30, 2006
Sites 7 and 8 exceeded the State of Hawaii DOH standard of 0.002 mg/L for N
from NH3+ (NNH3+) in open costal waters [DOH, 2004] (0.009 mg NNH3+/L and 0.014
mg NNH3+/L, respectively). Nitrite (NO2-) concentrations were negligible; therefore,
NO3- alone will be compared to the State of Hawaii DOH standard for [NO3
- + NO2- ] of
0.0035 mg/L [DOH, 2004]. All eight sites exceeded the [NO3- + NO2
- ] standard by a
minimum of 3-fold, with the highest concentration observed at site 6. Six of eight sites
exceeded the DOH total N standard of 0.110 mg/L [DOH, 2004]; the highest values
were found at sites 6,7,and 8, respectively. Total P concentrations were consistently
below the State of Hawaii DOH standard of 0.016 mg/L.
February 22, 2006
NH3+ concentrations were below DOH standards at each site, with the exception
of site 6, which had a concentration of 0.006 mg NNH3+/L. All sites exceeded the [NO3-
+ NO2- ] DOH standard; site 6 had the greatest concentration at 0.020 mg NO3
-/L. The
DOH total N standard was exceeded only at site 2, although, all sites approached the
DOH standard. Total P was consistently below the DOH standard.
March 20, 2006
Heavy rains throughout March preceded the samplings on March 20th. The
runoff stream was open and flowing directly into the surface waters near site 7 (table 3).
This is a likely source of elevated nutrient concentrations at site 7 for March 20th. Six of
23
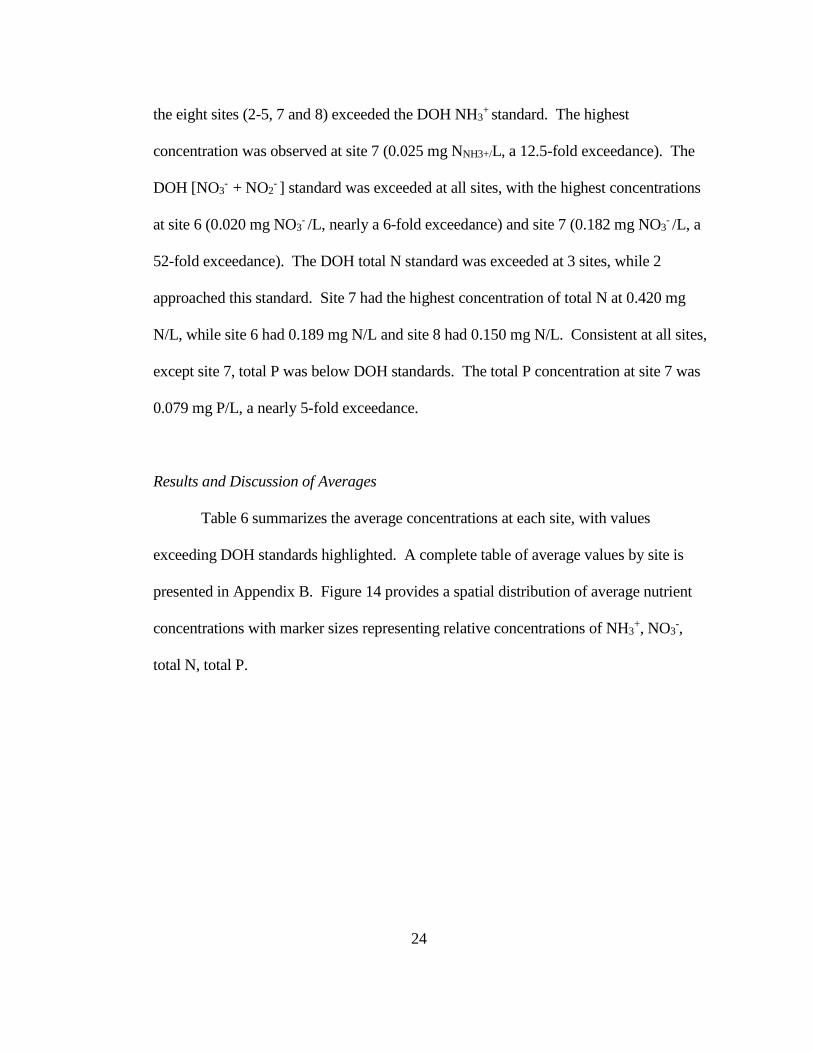
the eight sites (2-5, 7 and 8) exceeded the DOH NH3+ standard. The highest
concentration was observed at site 7 (0.025 mg NNH3+/L, a 12.5-fold exceedance). The
DOH [NO3- + NO2
- ] standard was exceeded at all sites, with the highest concentrations
at site 6 (0.020 mg NO3- /L, nearly a 6-fold exceedance) and site 7 (0.182 mg NO3
- /L, a
52-fold exceedance). The DOH total N standard was exceeded at 3 sites, while 2
approached this standard. Site 7 had the highest concentration of total N at 0.420 mg
N/L, while site 6 had 0.189 mg N/L and site 8 had 0.150 mg N/L. Consistent at all sites,
except site 7, total P was below DOH standards. The total P concentration at site 7 was
0.079 mg P/L, a nearly 5-fold exceedance.
Results and Discussion of Averages
Table 6 summarizes the average concentrations at each site, with values
exceeding DOH standards highlighted. A complete table of average values by site is
presented in Appendix B. Figure 14 provides a spatial distribution of average nutrient
concentrations with marker sizes representing relative concentrations of NH3+, NO3
-,
total N, total P.
24
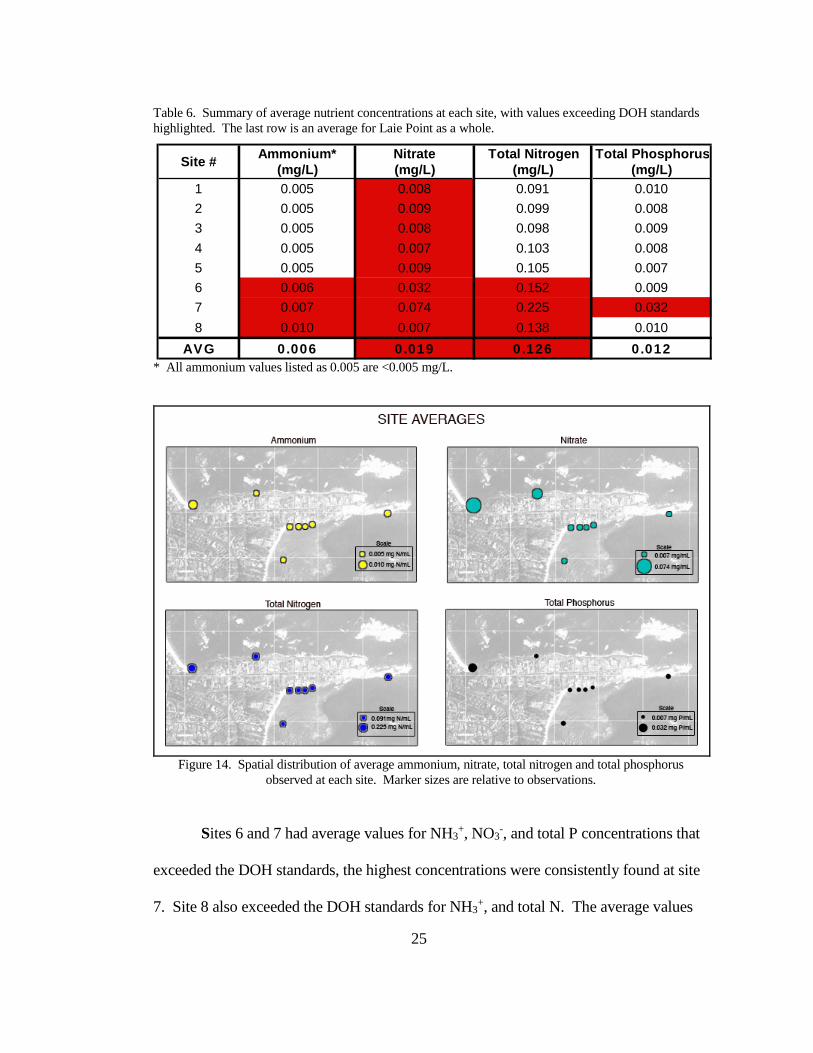
Table 6. Summary of average nutrient concentrations at each site, with values exceeding DOH standards highlighted. The last row is an average for Laie Point as a whole.
* All ammonium values listed as 0.005 are <0.005 mg/L.
Figure 14. Spatial distribution of average ammonium, nitrate, total nitrogen and total phosphorus
observed at each site. Marker sizes are relative to observations.
Sites 6 and 7 had average values for NH3+, NO3
-, and total P concentrations that
exceeded the DOH standards, the highest concentrations were consistently found at site
7. Site 8 also exceeded the DOH standards for NH3+, and total N. The average values
1 0.005 0.008 0.091 0.0102 0.005 0.009 0.099 0.0083 0.005 0.008 0.098 0.0094 0.005 0.007 0.103 0.0085 0.005 0.009 0.105 0.0076 0.006 0.032 0.152 0.0097 0.007 0.074 0.225 0.0328 0.010 0.007 0.138 0.010
AVG 0.006 0.019 0.126 0.012
Ammonium* (mg/L)
Nitrate (mg/L)
Total Nitrogen (mg/L)
Total Phosphorus (mg/L)Site #
25
for site 7 are heavily biased due to the extremely high values measured for March 20th,
when the runoff stream was open. Site 6 displayed higher concentrations of NO3- in all
previous samplings, as well as for NH3+ and total N on Feb 22nd. Total P only fluctuated
slightly and was within DOH standards throughout the study with site averages being
nearly consistent. These results are similar to the results found by Lapointe et al.
[1990], where P was consistently low while N appeared in excess. This suggests
absorption of P by the carbonate substrate of Laie Point.
The average concentrations for Laie Point, as a whole, exceeded DOH standards
for NH3+ (3-fold), NO3
- (over 5-fold) and total N. The surface waters at Laie Point,
appeared to be nutrient loaded during the course of this study. If persistent, this nutrient
loading may result in eutrophication, loss of reefs and a decline in reef organisms.
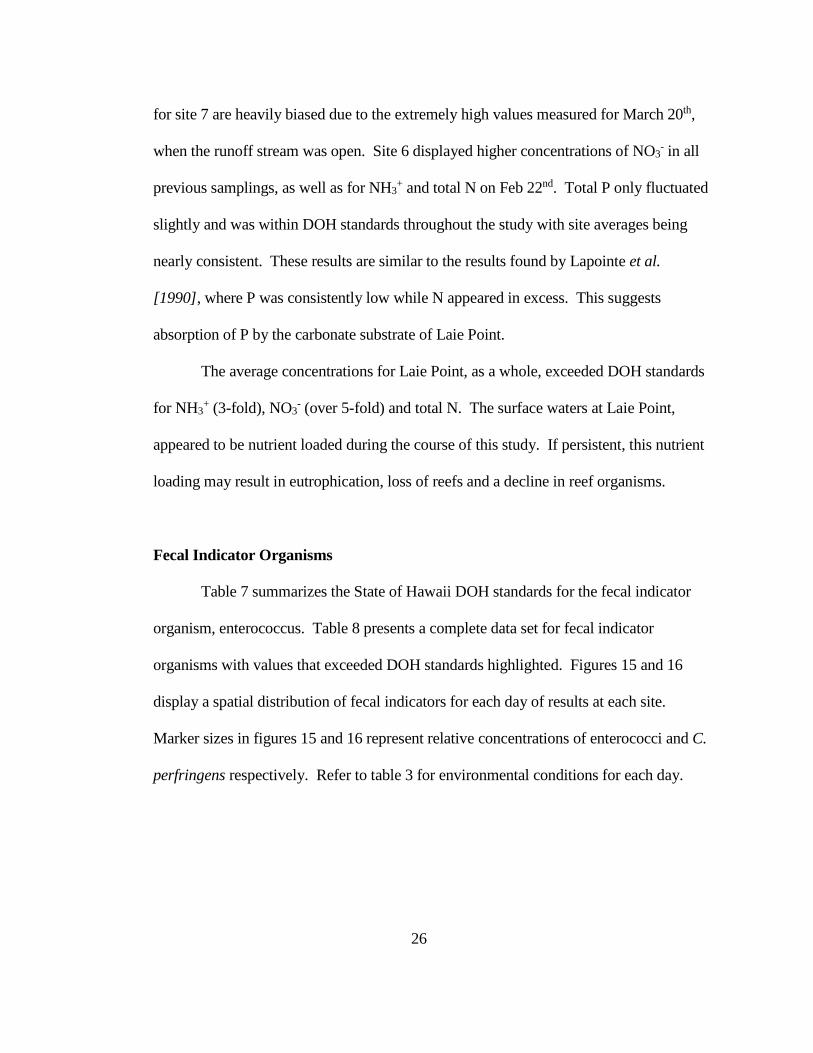
Fecal Indicator Organisms
Table 7 summarizes the State of Hawaii DOH standards for the fecal indicator
organism, enterococcus. Table 8 presents a complete data set for fecal indicator
organisms with values that exceeded DOH standards highlighted. Figures 15 and 16
display a spatial distribution of fecal indicators for each day of results at each site.
Marker sizes in figures 15 and 16 represent relative concentrations of enterococci and C.
perfringens respectively. Refer to table 3 for environmental conditions for each day.
26
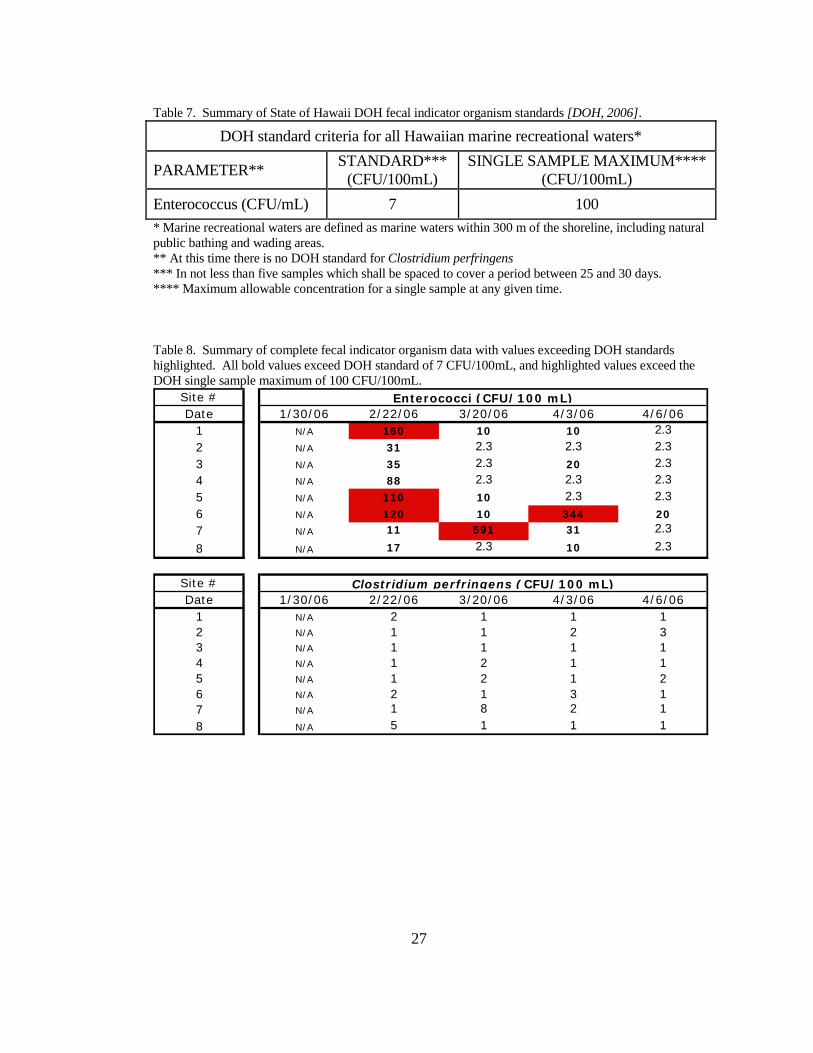
Table 7. Summary of State of Hawaii DOH fecal indicator organism standards [DOH, 2006]. DOH standard criteria for all Hawaiian marine recreational waters*
PARAMETER** STANDARD*** (CFU/100mL)
SINGLE SAMPLE MAXIMUM**** (CFU/100mL)
Enterococcus (CFU/mL) 7 100 * Marine recreational waters are defined as marine waters within 300 m of the shoreline, including natural public bathing and wading areas. ** At this time there is no DOH standard for Clostridium perfringens *** In not less than five samples which shall be spaced to cover a period between 25 and 30 days. **** Maximum allowable concentration for a single sample at any given time. Table 8. Summary of complete fecal indicator organism data with values exceeding DOH standards highlighted. All bold values exceed DOH standard of 7 CFU/100mL, and highlighted values exceed the DOH single sample maximum of 100 CFU/100mL.
Site #Date 1/30/06 2/22/06 3/20/06 4/3/06 4/6/06
1 N/A 160 10 10 2.32 N/A 31 2.3 2.3 2.33 N/A 35 2.3 20 2.34 N/A 88 2.3 2.3 2.35 N/A 110 10 2.3 2.36 N/A 120 10 344 207 N/A 11 591 31 2.3
8 N/A 17 2.3 10 2.3
Site #Date 1/30/06 2/22/06 3/20/06 4/3/06 4/6/06
1 N/A 2 1 1 12 N/A 1 1 2 33 N/A 1 1 1 14 N/A 1 2 1 15 N/A 1 2 1 26 N/A 2 1 3 17 N/A 1 8 2 18 N/A 5 1 1 1
Enterococci (CFU/100 mL)
Clostridium perfringens (CFU/100 mL)
27

Figure 15. Spatial distribution of Enterococci levels observed at each site, for each sample day. Marker sizes are relative to observations and plotted on a
logarithmic scale due to a large range of values.
28
Figure 16. Spatial distribution of Clostridium perfringens levels observed at each site, for each sample day. Marker sizes are relative to observations.
29
February 22, 2006
All sites exceeded the State of Hawaii DOH standard of 7 enterrococci
CFU/100mL for marine recreational waters [DOH, 2004]. Three of eight sites also
exceeded the State of Hawaii DOH single sample maximum of 100 enterococci
CFU/100mL for marine recreational waters [DOH, 2004]. Concentrations of
enterococci were low at site 2 and increased in value toward site 5. These values,
compared to the tidal record at the time of sampling, possibly suggest some dependence
on tidal pumping; although, significant evidence is lacking. The largest value of
enterococci (160 CFU/100mL) was observed at site 1, with the next highest at site 6
(120 CFU/100mL). C. perfringens levels were all relatively low with the exception of
site 8 where 5 C. perfringens CFU/100mL were measured.
March 20, 2006
Four sites exceeded the DOH standard for enterococci and site 7 exceeded the
single sample maximum by nearly 6-fold. This is most likely due to the runoff stream,
which was flowing directly into the marine surface water near this site (table 3). Levels
of enterococci were very low at sites 2, 3 and 4 and increased at site 5, possibly
suggesting a tidal influence. A C. Perfringens concentration of 8 CFU/100mL was
measured at site 7, most likely due to the runoff stream. This correlates well with the
observed enterococci at this site (correlation coefficient of 0.99 with 99% confidence).
30

April 3, 2006
Five sites exceeded the DOH standard for enterococci and site 6 exceeded the
DOH single sample maximum by nearly 3.5-fold. The high concentration of
enterococci at site 6 does not seem to be associated with the presence of the runoff
stream for two major reasons. First, site 7 had only 10% of the enterococci observed at
site 6 on this particular day and, second, only March 20th had higher levels observed at
site 7 than at site 6 (which had less than 2% of the observed enterococci at site 7 on
March 20th). Sites 2, 4 and 5 had very low levels of enterococci, but were much higher
at site 3. C. perfringens levels were all relatively low; site 6 having the highest
concentration at 3 CFU/100mL.
April 6, 2006
April 6th had the lowest concentrations of enterococci. Site 6 was the only
sample to exceeded the DOH standard for enterococci and all sites were below the DOH
single sample maximum. The difference between low and high tide was very small
(table 3), and is consistent with the constant concentrations of enterococci at sites 2
through 5. C. perfringens levels were all relatively low with a very slight increase at
site 2.
31
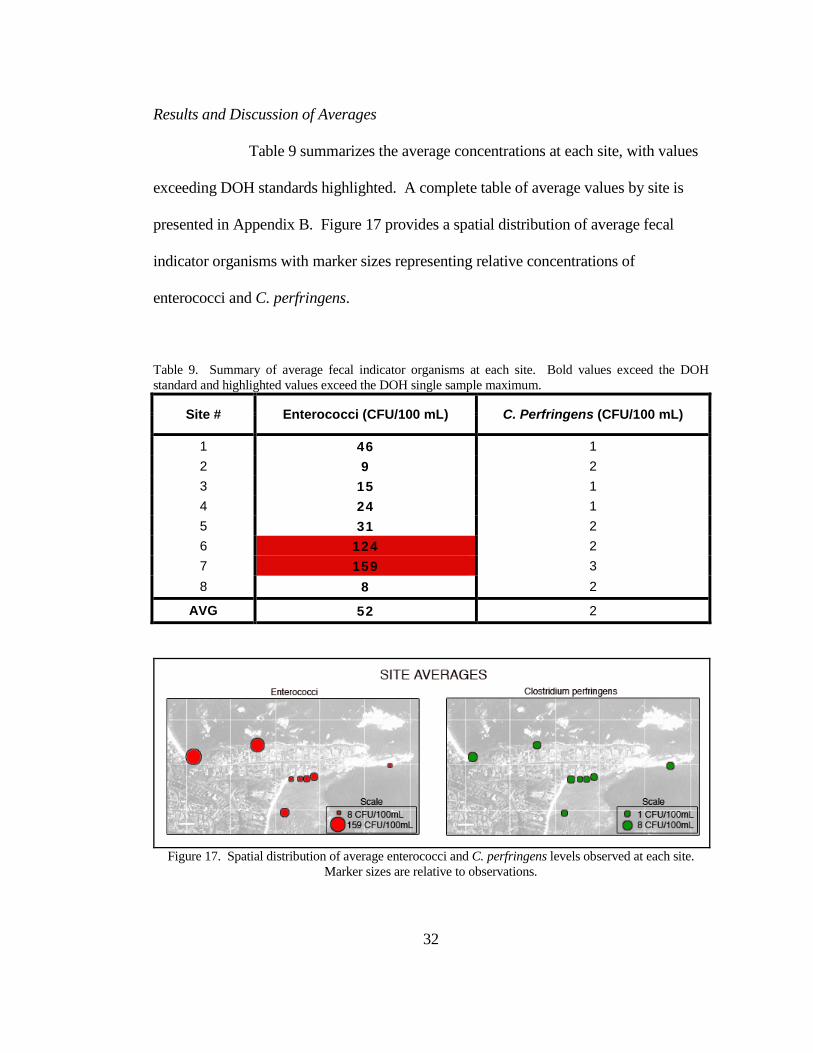
Results and Discussion of Averages
Table 9 summarizes the average concentrations at each site, with values
exceeding DOH standards highlighted. A complete table of average values by site is
presented in Appendix B. Figure 17 provides a spatial distribution of average fecal
indicator organisms with marker sizes representing relative concentrations of
enterococci and C. perfringens.
Table 9. Summary of average fecal indicator organisms at each site. Bold values exceed the DOH standard and highlighted values exceed the DOH single sample maximum.
Site # Enterococci (CFU/100 mL) C. Perfringens (CFU/100 mL)
1 46 1 2 9 2 3 15 1 4 24 1 5 31 2 6 124 2 7 159 3 8 8 2
AVG 52 2
Figure 17. Spatial distribution of average enterococci and C. perfringens levels observed at each site.
Marker sizes are relative to observations.
32
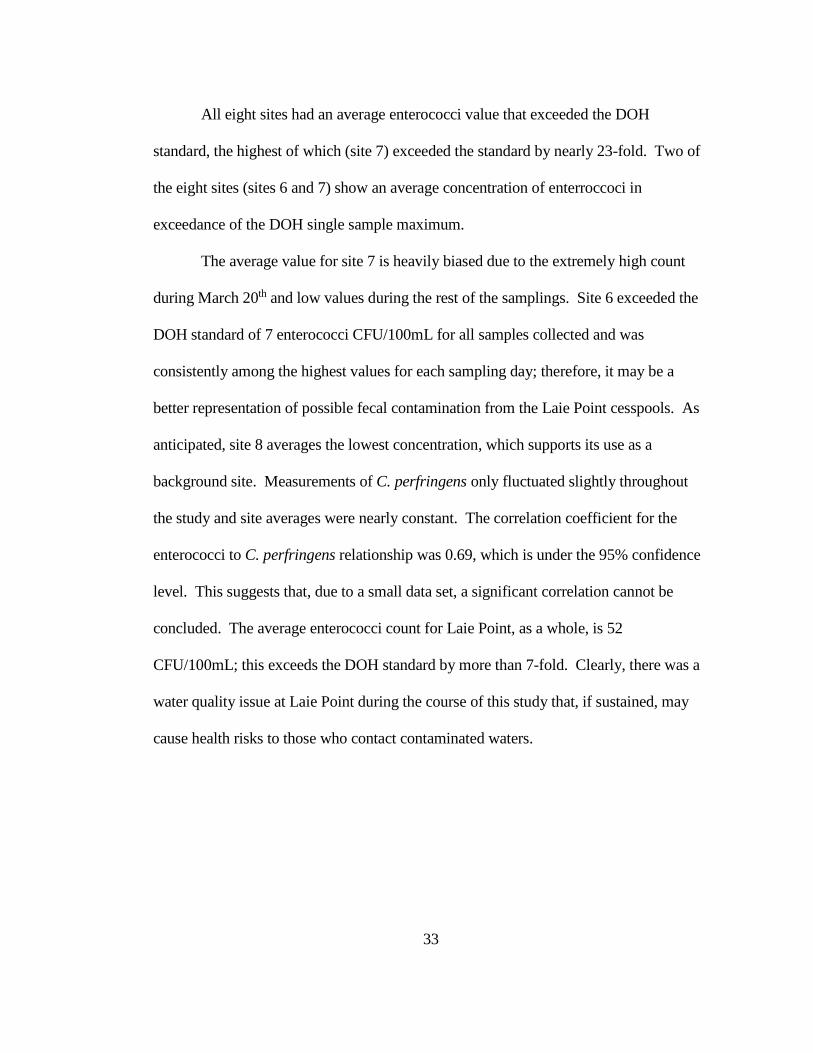
All eight sites had an average enterococci value that exceeded the DOH
standard, the highest of which (site 7) exceeded the standard by nearly 23-fold. Two of
the eight sites (sites 6 and 7) show an average concentration of enterroccoci in
exceedance of the DOH single sample maximum.
The average value for site 7 is heavily biased due to the extremely high count
during March 20th and low values during the rest of the samplings. Site 6 exceeded the
DOH standard of 7 enterococci CFU/100mL for all samples collected and was
consistently among the highest values for each sampling day; therefore, it may be a
better representation of possible fecal contamination from the Laie Point cesspools. As
anticipated, site 8 averages the lowest concentration, which supports its use as a
background site. Measurements of C. perfringens only fluctuated slightly throughout
the study and site averages were nearly constant. The correlation coefficient for the
enterococci to C. perfringens relationship was 0.69, which is under the 95% confidence
level. This suggests that, due to a small data set, a significant correlation cannot be
concluded. The average enterococci count for Laie Point, as a whole, is 52
CFU/100mL; this exceeds the DOH standard by more than 7-fold. Clearly, there was a
water quality issue at Laie Point during the course of this study that, if sustained, may
cause health risks to those who contact contaminated waters.
33

Other Possible Correlations
Rain events have been shown to increase groundwater flow [Paul et al., 1995a]
and were suspected to increase contamination around Laie Point. Figure 18 shows a
plot of enterococci from Laie and Malekahana, a neighboring site regularly sampled by
the DOH, and overlaid with rain for the area. Figure 19 displays C. perfringens from
both locations as well as rain. It is apparent that a major rain event had little impact on
levels of contamination at either location.
Figure 20 is a plot of enterococci measurements for Malekahana and Laie Point,
to provide a sense of water quality comparison. Malekahana is located on the north side
of Laie Bay, approximately 2 km north of Laie Point, and near a river mouth. There are
very few homes near Malekahana and those that are there, are connected to a sewer
system. The DOH samples water quality at Malekahana on a monthly basis. From this
time series it is apparent that, with the exception of March 8th, Malekahana appears to
have consistently superior water quality to that of Laie Point. This provides further
indication that a local contamination source, such as the cesspools or runoff stream, is a
major factor in influencing the water quality of Laie Point.
34

Figure 18. Enterococci concentrations from Malekahana and Laie Point, overlaid with rain.
Figure 19. C. perfringens concentrations from Malekahana and Laie Point, overlaid with rain.
35

Figure 20. A comparison of enterococci concentrations at Malekahana and Laie Point. The dashed line indicates the DOH standard of 7 CFU/100mL
and the x-axis maximum indicates the DOH single sample maximum of 100 CFU/100mL.
36

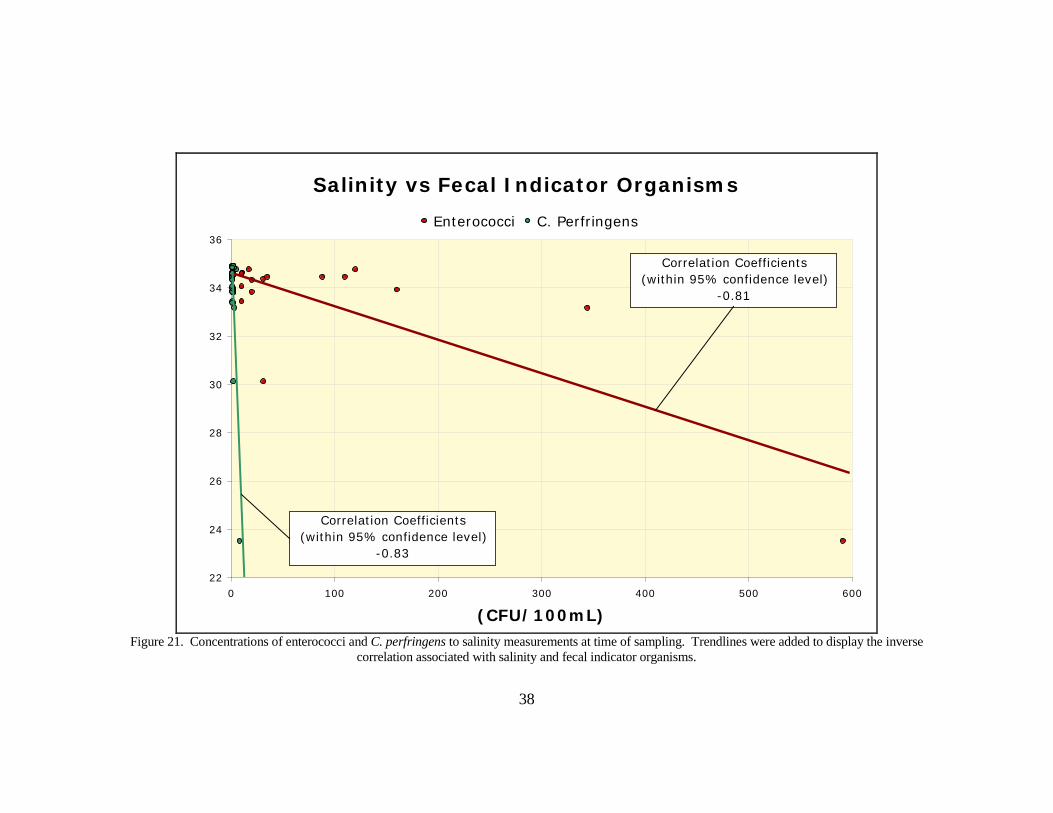
Salinity was found to correlate inversely with site averages for enterococci (-
0.81) and C. perfringens (-0.83) (figure 21); both of these values exceeded the 95%
significance limit. A very high site-specific correlation occurred at site 7, where the
correlation coefficient for enterococci and salinity was -0.94, and -0.97 for C.
perfringens and salinity, raising the confidence level to 99%. This high inverse
correlation, suggests that a large freshwater input (such as the runoff stream near site
7) is largely responsible for contamination. Enterococci also displayed a significant
inverse correlation with salinity (-0.86) at site 6, which exceeded the 95% significance
limit. Cesspool discharge may be another source for decreased salinity and may be the
source of enterococci at site 6, as well as at other sites. It appears that the runoff
stream might influence the concentrations at site 6; although, it is also important to
note that on March 20th, when the stream was open, site 6 had an enterococci count of
only 10 CFU/100mL, while 591 CFU/100mL were measured at site 7. This is not
consistent with runoff significantly contributing to contamination at site 6. Other
significant correlations (within the 95% confidence limit) were found for enterococci
to NO3- (0.93) and enterococci to total N (0.85); suggesting surface waters receive
both, nutrient and pathogenic contamination, simultaneously. Figure 22 provides a
visual representation of the relationships between measured parameters.
37
Salinity vs Fecal Indicator Organisms
22
24
26
28
30
32
34
36
0 100 200 300 400 500 600
(CFU/100mL)
Enterococci C. Perfringens
Correlation Coefficients(within 95% confidence level)
-0.83
Correlation Coefficients(within 95% confidence level)
-0.81
Figure 21. Concentrations of enterococci and C. perfringens to salinity measurements at time of sampling. Trendlines were added to display the inverse
correlation associated with salinity and fecal indicator organisms.
38

Figure 22. Averages at each sample site for all parameters measured. Each parameter was scaled by dividing all values by the minimum value of that parameter
(enterococci, has also been divided by 4 in order to narrow the range of values).
39

CHAPTER 4 CONCLUSION
In summary, this study was conducted over a period of intense rainstorms.
Excessive nutrient loading, above DOH standards, was found on every day sampled,
which consisted of pre-storm and during storm conditions. Fecal indicators were also
found to be above DOH standards for at least one site for each day samples were
collected, consisting of pre, during and post storm conditions; on 75% of days sampling
took place, the DOH single sample maximum was exceeded. Significant correlations
were found between measured parameters, such as salinity and fecal indicator
organisms. Mostly due to a lack of data and large sampling variability, no significant
correlation was found suggesting an influence due to tidal pumping. Neither was a
significant correlation found linking the nutrient and microbial load at Laie Point to that
of Malekahana, a nearby site frequently monitored by the DOH.
The purpose of this study was to investigate the occurrence of excessive nutrient
loading as well as the occurrence of microbial indicators of fecal contamination in the
surface waters around Laie Point, and to assess the risk of near-shore contamination due
to the use of OSDS. This water quality assessment of the Laie Point has demonstrated
excessive nutrient loading and the presence of fecal indicators above EPA and DOH
standards, at times, consistent with contaminants derived from wastewater effluent.
This perhaps indicates the possibility that freshwater from the Laie Point cesspools is
directly contributing to an excess nutrient and pathogenic load in the surface waters.
This load is potentially harmful to the environment and could present health risks to
persons in contact with the contaminated water. This study, however, presents only a
40

preliminary assessment of water quality and does not address seasonal differences and
lacks a sufficient time series of data to properly indicate the cause of contamination.
Therefore, additional research is required to determine the extent to which the Laie Point
cesspools are contributing to the deterioration of water quality.
Suggestions for additional research include further dye or tracer studies,
increasing the frequency and distribution of sampling, sampling over a longer time
period and obtaining an extensive simultaneous data set of water quality and
environmental parameters. The dye seeding requires calculation of dye quantity taking
into account cesspool size, potential losses by absorption to solid material and diffusion
upon contact with marine water. A fluorometer should be used to detect concentrations
of dye below levels detectable by the naked eye. The north side of Laie Point should be
seeded with dye, in particular, near the location of site 6. Seeding near site 6 has the
potential to result in identification of a major freshwater source at site 6, other than the
possibility of the runoff stream. The frequency of sampling in this study was limited,
and hourly sampling over a longer time span would provide better insight to
relationships of contamination and short-term variable environmental conditions. More
sampling sites could give an indication of where, and if contamination is concentrated.
A longer time series would also yield more insight into and provide a better
representation of the average water quality. A longer time series could also be useful in
determining variability on diurnal and seasonal scales or correlation to various
environmental conditions. In order to determine if tidal pumping is a major factor in
leaching contamination, waves and tides need to be recorded over the course of the
41

entire study with multiple samples collected during complete tidal cycles. Other water
and environmental parameters, such as salinity, should be monitored more closely.
Monitoring of groundwater flow in the substrate would also be helpful in determining
the effectiveness of in situ uptake (water polishing) by the coralline substrate.
42
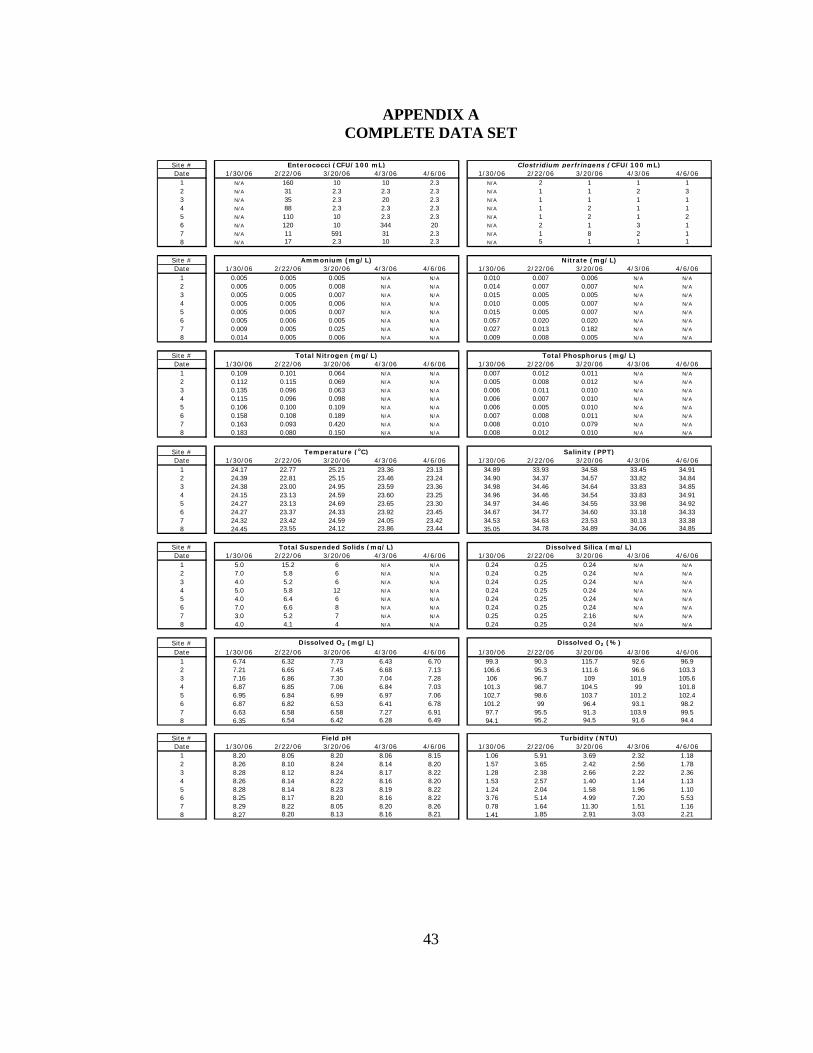
APPENDIX A COMPLETE DATA SET
Site #Date 1/30/06 2/22/06 3/20/06 4/3/06 4/6/06 1/30/06 2/22/06 3/20/06 4/3/06 4/6/06
1 8.20 8.05 8.20 8.06 8.15 1.06 5.91 3.69 2.32 1.182 8.26 8.10 8.24 8.14 8.20 1.57 3.65 2.42 2.56 1.783 8.28 8.12 8.24 8.17 8.22 1.28 2.38 2.66 2.22 2.364 8.26 8.14 8.22 8.16 8.20 1.53 2.57 1.40 1.14 1.135 8.28 8.14 8.23 8.19 8.22 1.24 2.04 1.58 1.96 1.106 8.25 8.17 8.20 8.16 8.22 3.76 5.14 4.99 7.20 5.537 8.29 8.22 8.05 8.20 8.26 0.78 1.64 11.30 1.51 1.168 8.27 8.20 8.13 8.16 8.21 1.41 1.85 2.91 3.03 2.21
Field pH Turbidity (NTU)
Site #Date 1/30/06 2/22/06 3/20/06 4/3/06 4/6/06 1/30/06 2/22/06 3/20/06 4/3/06 4/6/06
1 N/A 160 10 10 2.3 N/A 2 1 1 12 N/A 31 2.3 2.3 2.3 N/A 1 1 2 33 N/A 35 2.3 20 2.3 N/A 1 1 1 14 N/A 88 2.3 2.3 2.3 N/A 1 2 1 15 N/A 110 10 2.3 2.3 N/A 1 2 1 26 N/A 120 10 344 20 N/A 2 1 3 17 N/A 11 591 31 2.3 N/A 1 8 2 18 N/A 17 2.3 10 2.3 N/A 5 1 1 1
Site #Date 1/30/06 2/22/06 3/20/06 4/3/06 4/6/06 1/30/06 2/22/06 3/20/06 4/3/06 4/6/06
1 0.005 0.005 0.005 N/A N/A 0.010 0.007 0.006 N/A N/A2 0.005 0.005 0.008 N/A N/A 0.014 0.007 0.007 N/A N/A3 0.005 0.005 0.007 N/A N/A 0.015 0.005 0.005 N/A N/A4 0.005 0.005 0.006 N/A N/A 0.010 0.005 0.007 N/A N/A5 0.005 0.005 0.007 N/A N/A 0.015 0.005 0.007 N/A N/A6 0.005 0.006 0.005 N/A N/A 0.057 0.020 0.020 N/A N/A7 0.009 0.005 0.025 N/A N/A 0.027 0.013 0.182 N/A N/A8 0.014 0.005 0.006 N/A N/A 0.009 0.008 0.005 N/A N/A
Site #Date 1/30/06 2/22/06 3/20/06 4/3/06 4/6/06 1/30/06 2/22/06 3/20/06 4/3/06 4/6/06
1 0.109 0.101 0.064 N/A N/A 0.007 0.012 0.011 N/A N/A2 0.112 0.115 0.069 N/A N/A 0.005 0.008 0.012 N/A N/A3 0.135 0.096 0.063 N/A N/A 0.006 0.011 0.010 N/A N/A4 0.115 0.096 0.098 N/A N/A 0.006 0.007 0.010 N/A N/A5 0.106 0.100 0.109 N/A N/A 0.006 0.005 0.010 N/A N/A6 0.158 0.108 0.189 N/A N/A 0.007 0.008 0.011 N/A N/A7 0.163 0.093 0.420 N/A N/A 0.008 0.010 0.079 N/A N/A8 0.183 0.080 0.150 N/A N/A 0.008 0.012 0.010 N/A N/A
Site #Date 1/30/06 2/22/06 3/20/06 4/3/06 4/6/06 1/30/06 2/22/06 3/20/06 4/3/06 4/6/06
1 24.17 22.77 25.21 23.36 23.13 34.89 33.93 34.58 33.45 34.912 24.39 22.81 25.15 23.46 23.24 34.90 34.37 34.57 33.82 34.843 24.38 23.00 24.95 23.59 23.36 34.98 34.46 34.64 33.83 34.854 24.15 23.13 24.59 23.60 23.25 34.96 34.46 34.54 33.83 34.915 24.27 23.13 24.69 23.65 23.30 34.97 34.46 34.55 33.98 34.926 24.27 23.37 24.33 23.92 23.45 34.67 34.77 34.60 33.18 34.337 24.32 23.42 24.59 24.05 23.42 34.53 34.63 23.53 30.13 33.388 24.45 23.55 24.12 23.86 23.44 35.05 34.78 34.89 34.06 34.85
Site #Date 1/30/06 2/22/06 3/20/06 4/3/06 4/6/06 1/30/06 2/22/06 3/20/06 4/3/06 4/6/06
1 5.0 15.2 6 N/A N/A 0.24 0.25 0.24 N/A N/A2 7.0 5.8 6 N/A N/A 0.24 0.25 0.24 N/A N/A3 4.0 5.2 6 N/A N/A 0.24 0.25 0.24 N/A N/A4 5.0 5.8 12 N/A N/A 0.24 0.25 0.24 N/A N/A5 4.0 6.4 6 N/A N/A 0.24 0.25 0.24 N/A N/A6 7.0 6.6 8 N/A N/A 0.24 0.25 0.24 N/A N/A7 3.0 5.2 7 N/A N/A 0.25 0.25 2.16 N/A N/A8 4.0 4.1 4 N/A N/A 0.24 0.25 0.24 N/A N/A
Site #Date 1/30/06 2/22/06 3/20/06 4/3/06 4/6/06 1/30/06 2/22/06 3/20/06 4/3/06 4/6/06
1 6.74 6.32 7.73 6.43 6.70 99.3 90.3 115.7 92.6 96.92 7.21 6.65 7.45 6.68 7.13 106.6 95.3 111.6 96.6 103.33 7.16 6.86 7.30 7.04 7.28 106 96.7 109 101.9 105.64 6.87 6.85 7.06 6.84 7.03 101.3 98.7 104.5 99 101.85 6.95 6.84 6.99 6.97 7.06 102.7 98.6 103.7 101.2 102.46 6.87 6.82 6.53 6.41 6.78 101.2 99 96.4 93.1 98.27 6.63 6.58 6.58 7.27 6.91 97.7 95.5 91.3 103.9 99.58 6.35 6.54 6.42 6.28 6.49 94.1 95.2 94.5 91.6 94.4
Clostridium perfringens (CFU/100 mL)
Temperature (oC) Salinity (PPT)
Dissolved O2 (mg/L) Dissolved O2 (%)
Enterococci (CFU/100 mL)
Total Suspended Solids (mg/L) Dissolved Silica (mg/L)
Total Phosphorus (mg/L)
Ammonium (mg/L) Nitrate (mg/L)
Total Nitrogen (mg/L)
43
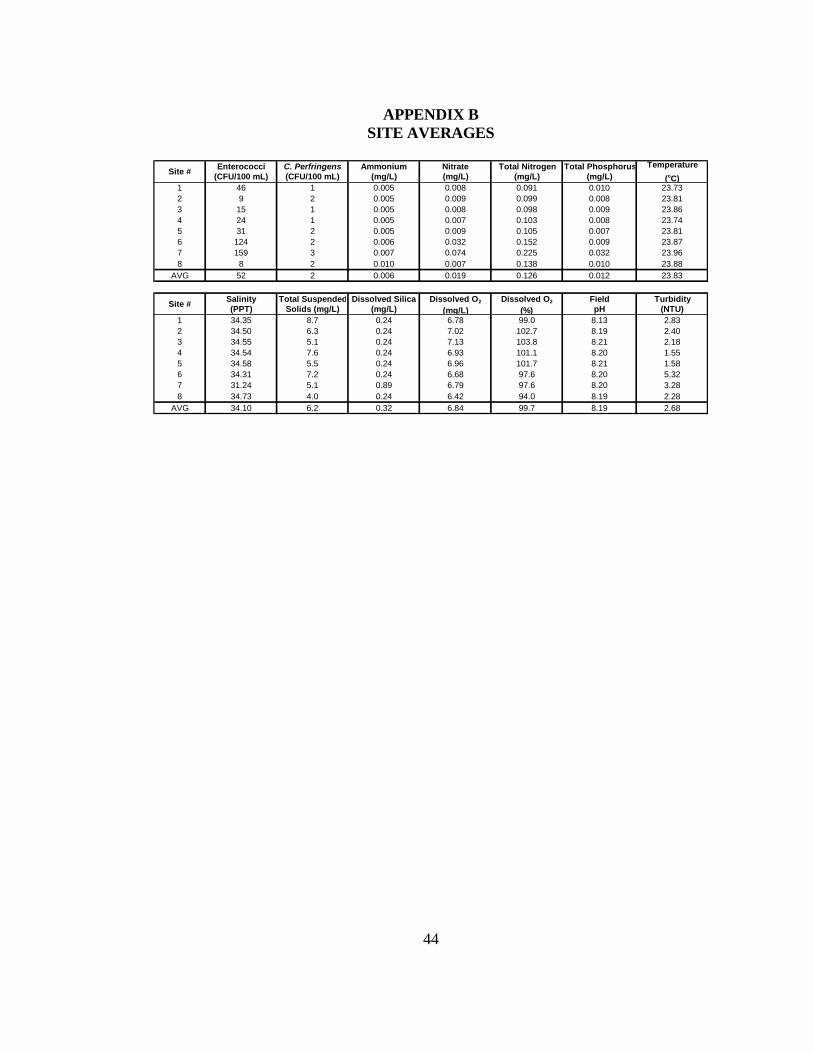
APPENDIX B SITE AVERAGES
1 46 1 0.005 0.008 0.091 0.010 23.732 9 2 0.005 0.009 0.099 0.008 23.813 15 1 0.005 0.008 0.098 0.009 23.864 24 1 0.005 0.007 0.103 0.008 23.745 31 2 0.005 0.009 0.105 0.007 23.816 124 2 0.006 0.032 0.152 0.009 23.877 159 3 0.007 0.074 0.225 0.032 23.968 8 2 0.010 0.007 0.138 0.010 23.88
AVG 52 2 0.006 0.019 0.126 0.012 23.83
1 34.35 8.7 0.24 6.78 99.0 8.13 2.832 34.50 6.3 0.24 7.02 102.7 8.19 2.403 34.55 5.1 0.24 7.13 103.8 8.21 2.184 34.54 7.6 0.24 6.93 101.1 8.20 1.555 34.58 5.5 0.24 6.96 101.7 8.21 1.586 34.31 7.2 0.24 6.68 97.6 8.20 5.327 31.24 5.1 0.89 6.79 97.6 8.20 3.288 34.73 4.0 0.24 6.42 94.0 8.19 2.28
AVG 34.10 6.2 0.32 6.84 99.7 8.19 2.68
Temperature (oC)
Salinity (PPT)
Total Suspended Solids (mg/L)
Dissolved Silica (mg/L)
Ammonium (mg/L)
Nitrate (mg/L)
Total Nitrogen (mg/L)
Total Phosphorus (mg/L)
Dissolved O2
(mg/L)Dissolved O2
(%)
Site #
Site #
Enterococci (CFU/100 mL)
C. Perfringens (CFU/100 mL)
Field pH
Turbidity (NTU)
44
REFERENCES
Corbett, RD; Kump, L; Dillon, K; Burnett, W; Chanton, J. 2000. Fate of Wastewater-Borne Nutrients Under Low Discharge Conditions in the Subsurface of the Florida Keys, USA. Marine Chemistry. 69:99-115.
Environmental Protection Agency (EPA). 2006. Region 9 Water Programs;
Underground Injection Control; Cesspools in Hawaii. Retrieved March 20, 2006 from the EPA website, http://www.epa.gov/region09/water/groundwater/uic-hicesspools.html
Griffin, DW; Gibson III, CJ; Lipp, EK; Riley, K; Paul III, JH & Rose, JB. 1999. Detection of Viral Pathogens by Reverse Transcriptase PCR and of Microbial Indicators by Standard Methods in the Canals of the Florida Keys. Applied and Environmental Microbiology. Vol. 65, no. 9: 4118–4125.
Keswik,BH. 1984. Sources of Groundwater Pollution, p 39-64. In: Paul, JH; Rose, JB;
Jiang, S; Kellogg, C & Shinn, E. 1995. Occurrence of Fecal Indicator Bacteria in Surface Waters and the Subsurface Aquifer in Key Largo, Florida. Applied and Environmental Microbiology. Vol. 61, no. 1: 2235-2241.
Lapointe, BE. 1987. Phosphorus and Nitrogen-limited Photosynthesis and Growth of
Gracilaria tikvahiae (Rhodophyceae) in the Florida Keys: An Experimental Field Study. Marine Biology. 93: 561-568.
Lapointe, BE. 1989. Macroalgal Production and Nutrient Relations in Oligotrophic
Areas of Florida Bay. Bulletin of Marine Science. 44: 312-323. Lapointe, BE & O’Connell, JD. 1989. Nutrient-enhanced growth of Cladophora
prolifera in Harrington Sound, Bermuda: eutrophication of a confined, phosphorus-limited marine ecosystem. Estuarine, Coastal and Shelf Science. 28:347-360.
Lapointe, BE; O’Connell, JD & Garrett, GS. 1990. Nutrient Couplings between On-
Site Sewage Disposal Systems, Groundwaters, and Near-shore Surface Waters of the Florida Keys. Biogeochemistry. Vol. 10, No. 3: 289-307.
Laws, EA. 2000. Aquatic Pollution: An introductory text, 3rd Edition. 639 pp.. John
Wiley & Sons, Inc. New York, NY. McComb, AJ; Atkins, RP; Birch, PB; Gordon, DM & Lukatelich, RJ. 1981.
Eutrophication in the Peel-Harvy Estuarine System, Western Australia. In: Lapointe, BE; O’Connell, JD; Garrett, GS. 1990. Nutrient Couplings between On-Site Sewage Disposal Systems, Groundwaters, and Near-shore Surface Waters of the Florida Keys. Biogeochemistry, Vol. 10, No. 3: 289-307.
45
National Oceanograpic and Atmospheric Administration (NOAA): National Weather
Service and Forecasting Office. 2006. Hydronet Archived Data: Punaluu (HI-03) Rain Gauge Data. Information received online from the NOAA web site, http://www.prh.noaa.gov/hnl/hydro/hydronet/hydronet-data.php
National Oceanograpic and Atmospheric Administration (NOAA): Center for
Operational Oceanographic Products and Services. 2006. Water Level Observations: Tide Prediction for Mokuoloe. Retrieved from the NOAA web site, http://co-ops.nos.noaa.gov/data_res.html
Paul, JH; Rose, JB; Brown, J; Shinn, EA; Miller, S & Farrah, SR. 1995. Viral tracer
studies indicate contamination of marine waters by sewage disposal practices in Key Largo, Florida. Applied and Environmental Microbiology, Vol. 61, no. 1: 2230-2234.
Paul, JH; Rose, JB; Jiang, S; Kellogg, C & Shinn, E. 1995. Occurrence of Fecal
Indicator Bacteria in Surface Waters and the Subsurface Aquifer in Key Largo, Florida. Applied and Environmental Microbiology, Vol. 61, no. 1: 2235-2241.
Smith, C (USDA Hawaii State Soil Scientist) .<[email protected]>. 2006,
April 5. USDA Soil Survey Assistance. Personal email to C. Kontoes <[email protected]>.
Smith, SV; Kimmerer, WJ; Laws, EA, Brock, RE & Walsh TW. 1981. Kaneohe Bay
sewage diversion Experiment: Perspectives on Ecosystem Response to Nutritional Perturbation. Pacific Science. 35: 279-397.
State of Hawaii Department of Health (DOH). 2004. Hawaii Administrative Rules,
Title 11, Department of Health, Chapter 54, Water Quality Standards. Retrieved on March 20, 2006 from the DOH web site, http://www.hawaii.gov/health/about/rules/11-54.pdf
United States Department of Agriculture (USDA): Natural Resources Conservation
Service. 2006. Online Web Soil Survey and Official Soil Series Descriptions. Retrieved April 5, 2006 from the USDA NRCS web site, http://websoilsurvey.nrcs.usda.gov/app/WebSoilSurvey.aspx http://soils.usda.gov/technical/classification/osd/index.html
46