a thesis submitted in partial fulfillment … · mercury bioaccumulation through food webs in...
TRANSCRIPT

Mercury bioaccumulation through food webs in acidic lakes at Kejimkujik National Park and National Historic Site, Nova Scotia
by
Brianna Wyn
Bachelor of Science, University of Regina, 2005
A THESIS SUBMITTED IN PARTIAL FULFILLMENT OF THE REQUIREMENTS FOR THE DEGREE OF
Master of Science
In the Graduate Academic Unit of Biology Supervisor: Karen Kidd, Ph.D., Biology and Canadian Rivers Institute Examining Board: Chris Gray, Ph.D., Chemistry and Biology, Chair
Kelly Munkittrick, Ph.D, Biology and Canadian Rivers Institute
External Examiner: Keith De’Bell, Ph.D., Mathematical Sciences, University of
New Brunswick
This thesis is accepted
Dean of Graduate Studies
THE UNIVERSITY OF NEW BRUNSWICK
December, 2007
©Brianna Wyn, 2008

ii
ABSTRACT
Mercury (Hg) contamination of the environment is a widespread problem
and the accumulation of Hg through food webs can cause toxic effects in top
predators. Studies in the mid-1990s showed that yellow perch (Perca
flavescens) and common loons (Gavia immer) from Kejimkujik National Park and
National Historic Site (KNPNHS), Nova Scotia had higher Hg than other regions
of North America. We returned to KNPNHS in 2006 and found that Hg in perch
increased an average of 26% over the last decade. Hg bioaccumulation rates
(determined using stable nitrogen isotopes of biota) were expected to be higher
in these acidic lakes than in circumneutral ones, but no differences were
detected. Hg at the base of the food web was a better predictor of Hg in these
fish than the bioaccumulation rates. These results illustrate that inputs of Hg
have increased and that other species in KNPNHS are also at a greater risk of
Hg toxication than in the past.

iii
ACKNOWLEDGEMENTS
I acknowledge Natural Sciences and Engineering Research Council of
Canada (NSERC), Environment Canada, and Parks Canada for supporting this
project. I would like to thank all the people that helped me collect and process
samples including Michelle Dobrin, Andrea Hicks, Tim Barrett, Heather Loomer,
Mark Gautreau, Leanne Baker, Leslie Carroll, Karen, Scott, and Marshall Kidd,
Kelly Munkittrick, Robin Brown, and Cor Wyn. Thank you to Chris McCarthy,
Darien Ure, Sally O’Grady, Kelly Munkittrick, Jeff Houlahan, Tim Jardine, Tom
Clair, Abbey Ouellett, Art Cook, Heather Stewart, and Steve Beauchamp for
unpublished data, information and assistance, sample processing, and expert
advice. I would like to recognize my supervisor, Karen Kidd, and my supervisory
committee, Neil Burgess and Allen Curry, for their guidance and wisdom
throughout my program, and additionally to Karen for her endless patience and
quick return of my thesis drafts. Thanks to my family and friends, especially
Heidi, for keeping me sane. Last, but not least, I especially like to thank my
husband, Cor, for his unconditional love and understanding while “putting up with
me”.

iv
Table of Contents
ABSTRACT ...........................................................................................................ii
ACKNOWLEDGEMENTS ..................................................................................... iii
Table of Contents .................................................................................................iv
List of Tables ........................................................................................................vi
List of Figures ...................................................................................................... vii
1 Introduction .................................................................................................... 1 1.1 Mercury .................................................................................................. 1
1.1.1 Mercury in the abiotic environment ................................................. 1 1.1.2 Mercury in the food web .................................................................. 5
1.2 Stable carbon and nitrogen .................................................................... 7 1.3 Acidification .......................................................................................... 10 1.4 Kejimkujik National Park and National Historic Site ............................. 12 1.5 Objectives of this study ........................................................................ 14
2 A decade later: Potential causes for increased mercury concentrations in yellow perch at Kejimkujik National Park and National Historic Site, Nova Scotia 15
2.1 Abstract ................................................................................................ 15 2.2 Introduction .......................................................................................... 16 2.3 Methods ............................................................................................... 18
2.3.1 Study site ...................................................................................... 18 2.3.2 Sample collection .......................................................................... 19 2.3.3 Stable isotope analyses ................................................................ 22 2.3.4 Mercury analyses .......................................................................... 23 2.3.5 Data transformations and analyses ............................................... 24
2.4 Results ................................................................................................. 28 2.4.1 Dermal punch conversions – 2006 ................................................ 28 2.4.2 Yellow perch 1996/1997 (data from Carter et al. 2001) ................. 29 2.4.3 Yellow Perch 2006 ........................................................................ 30 2.4.4 Changes through time ................................................................... 32 2.4.5 Water Chemistry ........................................................................... 33 2.4.6 Factors influencing Hg in yellow perch .......................................... 35
2.5 Discussion ............................................................................................ 35 2.5.1 External influences on Hg concentrations ..................................... 36 2.5.2 Influence of physical and chemical characteristics of lakes on Hg in fish 38 2.5.3 Influence of biological parameters on Hg concentrations in fish ... 41 2.5.4 Comparisons and implications ...................................................... 43 2.5.5 Conclusions .................................................................................. 45
3 Mercury bioaccumulation in the acidic lakes of Kejimkujik National Park and National Historic Site, Nova Scotia ..................................................................... 56
v
3.1 Abstract ................................................................................................ 56 3.2 Introduction .......................................................................................... 57 3.3 Methods ............................................................................................... 59
3.3.1 Study site ...................................................................................... 59 3.3.2 Sample collection .......................................................................... 60 3.3.3 Stable isotope analyses ................................................................ 62 3.3.4 Mercury analyses .......................................................................... 63 3.3.5 Data transformations ..................................................................... 65 3.3.6 Data analysis................................................................................. 68
3.4 Results ................................................................................................. 70 3.4.1 Food web structure ....................................................................... 70 3.4.2 Hg concentrations and influential factors ...................................... 72 3.4.3 Hg bioaccumulation ....................................................................... 75
3.5 Discussion ............................................................................................ 77 3.5.1 Food web structure ....................................................................... 78 3.5.2 Hg in biota ..................................................................................... 80
3.6 Conclusions .......................................................................................... 86
4 Summary and implications of findings ....................................................... 102 4.1 Temporal trends and Hg bioaccumulation .......................................... 103 4.2 Implications and future work ............................................................... 107
Bibliography ...................................................................................................... 112
Appendix 1: Raw data ...................................................................................... 126
Appendix 2: Size class analysis ........................................................................ 152
Appendix 3: Polynomial regression analysis .................................................... 153
Appendix 4: Paired t-test analysis .................................................................... 155
Appendix 5: Growth rates ................................................................................. 156
Vita

vi
List of Tables
Table 2-1: Physical characteristics of selected lakes in Kejimkujik National Park and National Historic Site. .................................................................................. 47 Table 2-2: Mean chemical characteristics of selected lakes in Kejimkujik National Park and National Historic Site ........................................................................... 48 Table 2-3: Mean (± SD) length, weight, condition, age, whole body total Hg
concentrations, standardized total Hg concentrations, 15N, and trophic positions of yellow perch (YP) caught in 1996/1997 and 2006 from lakes in Kejimkujik National Park (range in parentheses). ................................................................ 49 Table 2-4: Regression coefficients for log Hg-log length relationships in yellow perch captured in 1996/1997 and 2006 in 10 lakes in Kejimkujik National Park and National Historic Site, Nova Scotia. ............................................................. 51 Table 3-1: Mean (± SD) physical and chemical (2005 – 2006) characteristics of Beaverskin (n = 4), North Cranberry (n = 1), Pebbleloggitch (n = 4), and Puzzle (n = 1) lakes in Kejimkujik National Park and National Historic Site, Nova Scotia ........................................................................................................................... 88
Table 3-2: Mean (± SD) MeHg, 13C, 15N, and trophic positions of select invertebrates from Beaverskin, North Cranberry, Pebbleloggitch, and Puzzle lakes in Kejimkujik National Park and National Historic Site, Nova Scotia. ........ 89 Table 3-3: Mean (± SD) length, weight, condition, age, Hg, and %MeHg of golden shiner, banded killifish, yellow perch, and brown bullhead in four lakes (Beaverskin, North Cranberry, Pebbleloggitch, and Puzzle) at Kejimkujik National Park and National Historic Site, Nova Scotia ...................................................... 91
Table 3-4: Mean (± SD) 13C, lipid corrected 13C, proportion of C derived from
littoral sources, 15N, and trophic positions of golden shiner, banded killifish, yellow perch, and brown bullhead in four lakes (Beaverskin, North Cranberry, Pebbleloggitch, and Puzzle) at Kejimkujik National Park and National Historic Site, Nova Scotia. ............................................................................................... 93
Table 3-5: Slopes and intercepts of Hg*15N regressions for Beaverskin, North Cranberry, Pebbleloggitch, and Puzzle lakes. .................................................... 95
Table 3-6: Hg bioaccumulation rates (slope of Hg-15N regression) and locations for 4 lakes in Kejimkujik National Park and National Historic Site (KNPNHS) and from pertinent literature. ..................................................................................... 95
vii
List of Figures
Figure 2-1: Ten study lakes in Kejimkujik National Park and National Historic Site, Nova Scotia, Canada. .......................................................................................... 52
Figure 2-2: Yellow perch log-Hg*log-length relationships in 10 lakes in Kejimkujik National Park and National Historic Site for 1996/1997 and 2006. ........................ 53 Figure 2-3: pH of 10 lakes in Kejimkujik National Park and National Historic Site in 1995-1997 and 2005-2006. ...................................................................................... 54
Figure 2-4: Mean (±SD) Hg concentration in 12-cm yellow perch in 10 lakes in Kejimkujik National Park and National Historic Site, Nova Scotia. ........................ 55
Figure 3-1: Four study lakes in Kejimkujik National Park and National Historic Site, Nova Scotia, Canada. .......................................................................................... 96
Figure 3-2: Mean (± SD) 15N and 13C (‰) of fish and pelagic, profundal, and littoral invertebrates from Beaverskin Lake, 2006. .................................................. 97
Figure 3-3: Mean (± SD) 15N and 13C (‰) of fish and pelagic, profundal, and littoral invertebrates from North Cranberry Lake, 2006. ........................................... 98
Figure 3-4: Mean (± SD) 15N and 13C (‰) of fish and pelagic, profundal, and littoral invertebrates from Pebbleloggitch Lake, 2006. ............................................. 99
Figure 3-5: Mean (± SD) 15N and 13C (‰) of fish and pelagic, profundal, and littoral invertebrates Puzzle Lake, 2006. .................................................................. 100
Figure 3-6: Regressions of log-Hg (µg/g) versus 15N (‰) for fish and invertebrates collected from Beaverskin (solid line), North Cranberry (long dash), Pebbleloggitch (short dash), and Puzzle (dotted) lakes at Kejimkujik National Park and National Historic Site, 2006. ...................................................................... 101
1
1 Introduction
Many freshwater ecosystems are currently contaminated with mercury
(Hg) despite efforts to reduce the release of Hg to environments. Hg, particularly
the toxic methylmercury (MeHg), biomagnifies up aquatic food webs such that
predatory fish can have substantially elevated Hg concentrations, and humans
and fish-eating wildlife that tend to consume large-bodied fishes can be exposed
to toxic and sub-lethal concentrations of this neurotoxicant (Wiener et al. 2003,
Burgess 2005). Aquatic ecosystems receive Hg inputs from natural (e.g.,
bedrock and till) and anthropogenic sources (Wiener et al. 2003), although only
the anthropogenic emissions can be and have been reduced. Kejimkujik
National Park and National Historic Site, Nova Scotia has well-known issues of
Hg contamination of fish and waterfowl (Carter et al. 2001, Burgess et al. 2005,
Drysdale et al. 2005, Evers et al. 2007), and is an ideal location to investigate
temporal changes in Hg contamination in fishes and factors influencing Hg
accumulation in freshwater food webs.
1.1 Mercury
1.1.1 Mercury in the abiotic environment
Hg is naturally emitted to the atmosphere through vapourization from
water, soil, or bedrock; release of particulates during tectonic and geothermal
transformations; forest fires; and various biological processes (Nriagu 1989,
Lindqvist et al. 1991). Currently, the release of Hg from anthropogenic sources

2
such as fossil-fueled power generating stations, municipal and industrial waste
incineration, pulp and paper mills, coal burners, and ore refineries is
approximately double that of the natural sources (Lindqvist et al. 1991, Mason et
al. 1994, Pacyna et al. 2006). Conservative estimates state that anthropogenic
activities have increased global atmospheric Hg0 and Hg2+ concentrations by at
least 50% over the last century (Slemr and Langer 1992, Lorey and Driscoll
1999, Roos-Barraclough et al. 2006).
Nearly all natural Hg emissions from aquatic and terrestrial sources are in
the elemental Hg (Hg0) form, while anthropogenic emissions consist of 20-60%
ionic Hg (Hg2+) and 40-80% Hg0 (Lindqvist et al. 1991, Mason et al. 1994). Hg2+
is highly reactive and rapidly deposited to the earth via wet and dry deposition
(Mason et al. 1994). Atmospheric Hg0 oxidation reactions are very slow and are
largely balanced by the reverse reduction reactions (Mason et al. 1994). As
such, Hg0 has an atmospheric residence time of approximately one year, and the
atmospheric Hg pool consists of approximately 95% Hg0 (Lindqvist et al. 1991,
Mason et al. 1994, Morel et al. 1998). Atmospheric Hg0 is readily transported
around the globe but is eventually oxidized by O3 to Hg2+ then deposited as wet
or dry precipitate (Lindqvist et al. 1991, Mason et al. 1994, Morel et al. 1998).
These processes cause lakes and rivers near anthropogenic point sources to be
strongly influenced by inputs of Hg2+ pollution, while aquatic environments in
remote areas receive anthropogenic Hg inputs from long range transport and
deposition (Mason et al. 1994).

3
In the aquatic environment, Hg is present as the ionic (Hg2+) and organic
(MeHg) species, with complexes to chlorine, hydroxide, sulfide, and organic
matter (Watras et al. 1995, Morel et al. 1998). Hg0 is not a significant aqueous
Hg species because it is neither abundant nor readily soluble in water (Morel et
al. 1998). In aerobic waters, Hg2+ complexes comprise 71 to 95% of total
aqueous Hg species, while the more toxic form, MeHg, comprises up to 89% of
Hg species in anoxic conditions (Gill and Bruland 1990, Watras et al. 1998,
Chadwick et al. 2006). The relative abundance of each species is largely
determined by the net rate of biotic MeHg production, mainly by sulfate-reducing
bacteria (SRB).
The rate at which SRB methylate Hg2+ to MeHg is influenced by the
environmental factors that alter microbial metabolism, particularly temperature,
carbon concentration, substrate (Hg2+) availability, redox conditions, and pH of
the water (Gilmour et al. 1992). As Hg methylation is predominately a
biologically-mediated process, elevated temperatures, substrate concentrations,
and nutrient (i.e. dissolved organic carbon, DOC) availability typically enhance
MeHg production by increasing metabolic rates of bacteria (Xun et al. 1987,
Tranvik 1988, Bodaly et al. 1993). Because SRB are anaerobic organisms,
reduced oxygen levels also enhance MeHg production (Matilainen 1995). Hg
accumulation by SRB (a prerequisite for methylation) occurs through a facilitated
transport mechanism (Kelly et al. 2003); therefore the aqueous Hg complex must
be small enough to cross the microbial membrane. DOC particles bound to Hg
are too large to be taken up by bacteria and are unavailable to SRB (Kelly et al.
4
2003). As a result, high DOC concentrations reduce MeHg production rates
(Miskimmin et al. 1992, Kelly et al. 2003) except under acidic (pH < 6) conditions
where hydrogen ions protonate the DOC complexes and release the Hg (typically
Hg2+), making it available for SRB (Kelly et al. 2003). Acidic conditions also
increase microbial Hg accumulation and methylation through enhanced efficiency
of the membrane transport mechanism (Kelly et al. 2003).
Factors influencing total Hg concentrations in a water body also include
percent wetlands in the surrounding watershed, DOC content, and pH. Wetlands
are producers and exporters of MeHg and DOC to downstream environments
(Mierle and Ingram 1991, St. Louis et al. 1994, Rudd 1995) and the aqueous
MeHg concentration in a lake is directly and positively proportional to the percent
of its watershed that is covered by wetlands (St. Louis et al. 1994). High
aqueous DOC concentrations elevate bacterial metabolic rates and directly
increase aqueous MeHg concentrations because DOC is a nutrient source for
bacteria (Tranvik 1988). Wetlands exporting DOC also export DOC-bound Hg
because Hg binds to negatively charged functional groups on organic matter
(Mierle and Ingram 1991, Driscoll et al. 1995, Hintelmann et al. 1995, Morel et al.
1998). In acidic conditions, the DOC-bound Hg is displaced off the complex and
the pool of bioavailable Hg increases (Hintelmann et al. 1995). In summary,
lakes with low pH, high DOC concentrations, and high percent wetlands tend to
have high aqueous and bioavailable Hg concentrations (Driscoll et al. 1995,
Watras et al. 1995).
5
1.1.2 Mercury in the food web
Hg concentrations in organisms at the base of the food web are influenced
by the concentration and speciation of Hg in water, which are enhanced in low
pH and high DOC conditions as previously explained (Watras et al. 1998, Chen
et al. 2005). Although all animals absorb some Hg from water, phytoplankton are
the only organisms that consistently accumulate the majority of their Hg from
water, making them the primary pathway through which MeHg is introduced into
food webs (Hall et al. 1997, Watras et al. 1998). Phytoplankton sequester MeHg
in cellular vacuoles while Hg2+ binds to thiol groups in the plasma membrane
(Mason et al. 1995). Herbivorous zooplankton consume algae and digest the
cellular contents but excrete the membrane (Mason et al. 1995). Consequently,
they retain higher quantities of MeHg than Hg2+ and exhibit a 4-fold greater
assimilation efficiency of MeHg than Hg2+ (Mason et al. 1995).
MeHg binds to sulfhydryl groups of amino acids (Rabenstein 1978) and is
transferred from prey to consumer with such high efficiency that more than 90%
of Hg in top predators occurs as MeHg (Rabenstein 1978, Huckabee et al. 1979,
Becker and Bigham 1995). Accumulation of MeHg within proteinaceous tissues
and low excretion rates result in increasing concentrations of MeHg from prey to
predator (Watras et al. 1998, McIntyre and Beauchamp 2007). Fish absorb
aqueous MeHg through the gills (Ponce and Bloom 1991), but more than 85% of
their MeHg uptake is through dietary exposure (Hall et al. 1997). As such, top
predators from lakes with longer food chains can have more than double the Hg
than those in lakes with shorter food chains (Cabana et al. 1994).
6
Fish accumulate MeHg faster than it is excreted, which results in the
accumulation of this contaminant in their tissues (Trudel and Rasmussen 1997).
Hg concentrations often directly correlate with length, weight, or age of fish
(Carter et al. 2001, Evans et al. 2005). For a given length, older fish tend to have
higher MeHg than younger ones because of the longer exposure time and long
biological half-life of MeHg (Trudel and Rasmussen 1997, Carter et al. 2001,
Evans et al. 2005). During periods of enhanced growth, fish Hg concentrations
do not increase much, or at all, because of growth dilution (Scott and Armstrong
1972, Trudel and Rasmussen 2006).
MeHg concentrations in top predators can reach concentrations that
induce toxic and sub-lethal effects (Scheuhammer and Blancher 1994, Wiener et
al. 2003, Burgess 2005, Burgess and Meyer 2008). Laboratory studies indicate
that whole body Hg concentrations of 10 µg/g wet weight can cause mortality in
sub-adult rainbow trout, but that 1-5 µg Hg/g wet weight will induce chronic, sub-
lethal effects in fish (Niimi and Kissoon 1994). The mechanisms for these effects
include MeHg-induced oxidation of lipid membranes, altered receptor binding,
and inhibition of enzyme and hormone synthesis (Baatrup 1991, Berntssen et al.
2003). The alterations caused by MeHg intoxication induce neurologic
symptoms including disruption of olfactory senses and the inability to detect and
locate prey or evade predators, reduced coordination leading to the inability to
capture prey, and reduced gonadal development (Lockhart et al. 1972, Baatrup
1991, Berntssen et al. 2003). For fish-eating birds, reduced reproductive
capacity and population size are among the most significant effects of Hg

7
contamination (Barr 1986). Excessive human consumption of contaminated fish
and shellfish can reduce coordination, and induce tremors, tunnel vision, renal
failure, and coma (Environment Canada 2003); thus Health Canada asserts that
fish with more than 0.5 µg total Hg per gram wet weight are not fit to sell for
human consumption (Health Canada 2007).
1.2 Stable carbon and nitrogen
Stable isotope analysis is a powerful tool to determine diet in wild animal
populations. An animal’s isotopic content reflects the energy source of its diet
(e.g., benthic, pelagic, or profundal in lakes) and its trophic level (Cabana and
Rasmussen 1994). Chemical and physical processes, such as enzymatic
reactions and differential rates of diffusion of molecules, cause changes in the
ratios of heavy (e.g., carbon-13, 13C) to light (e.g., carbon-12, 12C) isotopes
(Gaebler et al. 1966, Peterson and Fry 1987). The unique characteristics of each
isotope (see below) have been increasingly used by ecologists to better
understand dietary habits of organisms and food web structures (Peterson and
Fry 1987). The application of stable isotope analyses have been used
specifically in freshwater ecology to understand habitat use (Kling et al. 1992,
Kidd et al. 2003) and energy flows (Peterson and Fry 1987, Cabana and
Rasmussen 1994, Swanson et al. 2003), and to trace contaminant
bioaccumulation through food webs (Kidd et al. 1998, 2003).
In tissues, the proportion of the heavy isotope of carbon, 13C (compared to
the light 12C, expressed as 13C), is relatively unchanged between prey and
8
consumer (Deniro and Epstein 1978, Post 2002) and can be used to trace
underlying energy sources through food webs. 13C forms only ~1% of the C pool
(Hecky and Hesslein 1995), and the physical environment and chemical
reactions of photosynthesis cause characteristic enrichment or depletion of the
13C content of primary producers. Low concentrations of dissolved CO2 occur in
boundary layers of plants in standing waters, which reduces discrimination
against 13C and results in higher 13C in organisms from these habitats (Keeley
and Sandquist 1992, Hecky and Hesslein 1995). Pelagic or offshore waters
typically have adequate supplies of dissolved CO2 because of diffusion from the
atmosphere and thin boundary layers, causing pelagic organisms to have more
negative 13C (Hecky and Hesslein 1995). Respired CO2 is depleted of 13C and
primary producers and consumers from areas with high decomposition rates (i.e.
profundal zones) use more respired CO2 than atmospheric CO2 and
subsequently display very low 13C (Keeley and Sandquist 1992). Thus,
profundal and pelagic primary producers and their consumers typically have
more negative 13C compared to littoral organisms (Hecky and Hesslein 1995,
Vander Zanden and Rasmussen 1999).
The ratio of the heavy to light nitrogen isotopes (15N/14N, expressed as
15N) provides a signature by which trophic leves can be traced through the
ecosystem (Peterson and Fry 1987). C isotopes only fractionate 0.4 parts per
thousand (‰) on average between prey and predator whereas 15N increases an
average of 3.4‰ with each trophic level (Minagawa and Wada 1984, Post 2002).
Thus, 15N provides a means to determine the trophic position of a consumer.
9
Tissues accumulate 15N over a long time period and represent the average
feeding behaviour of the animal. Consequently, stable isotope analyses provide
a better representation of an organism’s dietary habits than the snapshot
provided through gut content analysis (Peterson and Fry 1987, Vander Zanden et
al. 1997). Isotopic values are also continuous measures and can account for
omnivory and subtle differences in consumer trophic positions among systems
with different species assemblages (Cabana and Rasmussen 1994, Kidd et al.
1998).
Baseline 15N may differ among lakes because of many factors affecting
the nitrogen cycle, such as inorganic N recycling, activities of N-fixing
cyanobacteria, or application of N-containing agricultural chemicals (Cabana and
Rasmussen 1996, France and Schlaepfer 2000). If differences occur, then
consumer 15N must be standardized to a baseline value before inter- and intra-
site comparisons can be made (Cabana and Rasmussen 1996, Vander Zanden
and Rasmussen 1999). Typically, a long-lived primary consumer is found within
each lake (e.g., freshwater mussel), and its isotopic value is set as the baseline
against which all other organisms in that lake are calibrated (Cabana and
Rasmussen 1996). Finally, the differences in these standardized signatures
between animals reveals relative trophic positioning and can also be used to
calculate food chain length (Cabana and Rasmussen 1996, Vander Zanden et al.
1997).
A number of studies have found strong positive relationships between Hg
concentrations in organisms and their trophic position, as measured by 15N,

10
suggesting that Hg bioaccumulation can be quantified through the food web
using stable isotope analyses (Cabana and Rasmussen 1994, Kidd et al. 1995).
Subsequently, researchers have used the slope of the log Hg-15N regression to
quantify Hg biomagnification up through the food web and compare the rates
among systems (Kidd et al. 1995, Atwell et al. 1998, Power et al. 2002). To date,
bioaccumulation rates have been calculated for lakes in the Arctic (rate = 0.20;
Atwell et al. 1998), temperate regions (0.17 – 0.29; McIntyre and Beauchamp
2007, Karen Kidd, unpublished data), and the tropics (0.20 – 0.28; (Bowles et al.
2001, Kidd et al. 2003), and the slopes appear to be similar among regions
regardless of climate or food web differences. No one has quantified
bioaccumulation rates for acidic systems where Hg concentrations in top
predators tend to be higher than those in circumneutral systems (Watras et al.
1998, Chen et al. 2005).
1.3 Acidification
Anthropogenic emissions of acidifying substances such as ammonium,
sulfuric acid, and nitric acid have caused the widespread acidification of aquatic
and terrestrial habitats, and induced changes in species abundances, richness,
and community structures (Beamish and Harvey 1972, Havas and Rosseland
1995, Freedman and Beauchamp 1998, Driscoll et al. 2003). Deposition of these
substances onto terrestrial and aquatic habitats causes leaching of base cations
and the eventual deterioration of the buffering capacity and subsequent
acidification of the ecosystem (Jeffries 1997). For example, in the 1960s the pH
11
of lakes near Sudbury, Ontario decreased up to 1 unit during a period where
annual emissions of sulfur dioxide exceeded 2.5 million tonnes (Snucins et al.
2001). In aquatic habitats, fish extirpations begin to occur below pH 6 and this
level is used to designate ecosystems that have been damaged by acidification
(Jeffries 1997).
Acidification and the associated changes in water chemistry cause
adverse effects in aquatic organisms. Increased aqueous concentrations of
hydrogen (i.e. reduced pH) and heavy metals result in iono-regulatory failure and
the inability to maintain homeostasis as well as the disruption of respiratory and
circulatory systems (Havas and Rosseland 1995). At a population level, the
increased ionic stress can alter chemosensory functioning and reduce egg
hatching success to the degree that fish and invertebrate reproduction can be
substantially impaired (Havas and Rosseland 1995, Freedman and Beauchamp
1998). Studies have consistently illustrated that acidified systems exhibit
reduced biodiversity (Jeffries et al. 1998, Schartau et al. 2001) although there
has not been an examination of the subsequent effects on food web structure or
contaminant flow in these stressed systems.
The discovery of the extirpation of fish from a number of lakes in the
1960s brought the acidification issue to light (Beamish and Harvey 1972), and in
the late 1980s governments from Canada and the United States agreed to
reduce the emissions of acidifying substances. The Air Quality Agreement
mandated a reduction of sulfur dioxide emissions (which are converted to sulfuric
acid in the atmosphere) to 1980 levels (Jeffries 1997). Although Canadian
12
targets have been met, North American goals will not be re-evaluated until 2010
(Jeffries 1997). Between 1984 and 1997, regions in eastern Canada
experienced reductions in sulfate deposition and generally observed
corresponding decreases of aqueous SO42- and H+ concentrations; this has not
always been coincident with increases in pH of surface waters (Clair et al. 2002).
Only lakes in the Sudbury, Ontario region appear to have exhibited some
biological recovery in association with increased aquatic pH (Gunn and Keller
1990, Jeffries et al. 1998, Clair et al. 2002). Researchers suggest that there is a
lag between the chemical and biological recoveries of all acidified ecosystems
(Jeffries et al. 1998, Snucins et al. 2001) and that some locations will not return
to pre-acidification states without further emission reductions (Jeffries et al. 1998,
Snucins et al. 2001, Clair et al. 2002).
1.4 Kejimkujik National Park and National Historic Site
Despite the remoteness of Kejimkujik National Park and National Historic
Site (KNPNHS), Nova Scotia, from major urban and industrial centers, lakes in
this park are acidic and heavily contaminated with Hg. Studies in the mid-1990s
showed that the resident loon population in KNPNHS had blood Hg
concentrations 2 to 6 times higher than those in other locations in North America
(Evers et al. 1998, Burgess et al. 2005). The major sources of Hg to the park are
atmospheric deposition and weathering of bedrock and till (O'Driscoll et al.
2005b). Although bedrock supplies Hg to the area, the geological formations at
KNPNHS contain lower Hg concentrations than other sites in the region
13
(Sangster et al. 2005, Smith et al. 2005). In contrast, although the mean Hg
concentrations in ambient air and precipitation are not significantly different from
other regions of North America, the volume of precipitation, and thus the total
amount of Hg deposited at KNPNHS, is greater than in other remote areas in
eastern Canada (Beauchamp et al. 1998). In addition, the abundance of
wetlands in the park, low buffering capacity of the bedrock, and high DOC
concentrations of KNPNHS lakes produce naturally acidic conditions that favour
Hg methylation and accumulation in food web organisms (O'Driscoll et al.
2005b). Overall, KNPNHS appears to have slightly elevated atmospheric inputs
of Hg as well as the chemical conditions that promote elevated biotic
concentrations of this contaminant (Drysdale et al. 2005, O'Driscoll et al. 2005b).
The lakes in KNPNHS have pH values below 6.0, the threshold below
which biological damage occurs (Jeffries 1997, Carter et al. 2001, O'Driscoll et al.
2005b). Twenty of the 24 lakes studied in 1996/1997 contained yellow perch, the
main loon prey species (Barr 1996), with Hg concentrations above the guideline
for the protection of fish-eating wildlife (Carter et al. 2001). In light of the Hg and
sulfur dioxide emission reductions in North America since 1991 (Welch 1998)
and the time elapsed since the previous Hg survey, it was timely to return to the
park and re-evaluate the concentrations of Hg in yellow perch.

14
1.5 Objectives of this study
The current study revisits lakes in Kejimkujik National Park and National
Historic Site one decade after elevated Hg concentrations in yellow perch and
common loons were found. The main objectives of the study were:
1. To determine whether Hg concentrations in yellow perch in KNPNHS have
decreased since the mid-1990s in concert with reduced emissions and deposition
of acidifying substances.
2. To characterize the food webs of four acidic lakes to assess whether a)
elevated trophic position or b) atypical accumulation rates explain the elevated
Hg concentrations in yellow perch in KNPNHS when compared to circumneutral
systems.
15
2 A decade later: Potential causes for increased mercury
concentrations in yellow perch at Kejimkujik National Park
and National Historic Site, Nova Scotia
2.1 Abstract
Although anthropogenic emissions of mercury (Hg) increased more than
2-fold during the last century, they have been decreasing since 1995. Studies
from the mid-1990s showed that yellow perch (Perca flavescens) from Kejimkujik
National Park and National Historic Site (KNPNHS), Nova Scotia had high Hg
concentrations compared to the same species from other parts of north-eastern
North America, and that common loons (Gavia immer) in the park had 2 – 6
times more Hg in their blood than at other locations. In this study, ten of these
lakes in KNPNHS were re-examined in 2006 to determine whether there have
been changes in Hg in the loon’s main prey, yellow perch. Four to nine yellow
perch were captured in each lake for each size class (5-10 cm, 10-15, cm, and
15-20cm). Total Hg concentrations (whole body) were measured and compared
among years within each lake using analysis of covariance (ANCOVA) with
length as a covariate. Overall, Hg concentrations in yellow perch increased an
average of 26% between 1996/1997 and 2006. In 2006, all 10 lakes had yellow
perch with standardized mean Hg concentrations exceeding the tissue
concentration (0.21 µg/g) that is associated with 50% reduction in maximum

16
productivity of loons. The results of this study illustrate that Hg contamination
continues to pose a threat to aquatic ecosystems in Atlantic Canada and that
further reductions in the deposition of Hg and acidifying substances are required
to reduce the impact on ecosystem health in this region.
2.2 Introduction
Mercury (Hg) contamination of the environment is a worldwide issue, as
abiotic Hg concentrations are currently double those of the last century even
though the 1995 - 2000 period showed a 2% decrease in global Hg emissions
(Mason et al. 1994, Pacyna and Pacyna 2001, Pacyna et al. 2006, Roos-
Barraclough et al. 2006). The increased abiotic contamination is largely a result
of anthropogenic Hg emissions from coal-fired power generation and waste
incineration (Pacyna et al. 2006). Hg from these and other emissions can be
deposited near the original source or transported around the globe such that the
pollution may influence locations near to or remote from the source (Lindqvist et
al. 1991, Mason et al. 1994). Once deposited, inorganic Hg can be transformed
into methyl mercury (MeHg), which accumulates up food webs to toxic levels in
top predators (Gilmour et al. 1992, Wiener et al. 2003, Harris et al. 2007). In
particular, 97% of the consumption advisories for freshwater sport fish in Canada
issued in 1997 were due to elevated concentrations of MeHg (Environment
Canada 2003).
In 1991, the Canadian and American governments initiated programs to
reduce emissions of Hg and acidifying substances (particularly sulfuric

17
compounds) to the atmosphere in an effort to reduce MeHg concentrations in fish
(Jeffries 1997, Welch 1998, Pacyna et al. 2006). Substantial reductions in
regional atmospheric Hg and S concentrations have occurred in areas near
urban or industrial centres (Jeffries 1997, Hrabik and Watras 2002, Temme et al.
2007) but remote locations like those in Atlantic Canada are only experiencing
minor changes in gaseous Hg and lake acidity (Jeffries 1997, Clair et al. 2002,
Temme et al. 2007). For example, gaseous Hg concentrations at Kejimkujik
National Park and National Historic Site (KNPNHS), Nova Scotia increased
(significantly) by 3.3% between 1995 and 2005, whereas concentrations from
southern Quebec and Ontario significantly decreased by an average of 10.4%
over the same time frame (Temme et al. 2007).
All temporal trend studies done to date showed decreases in Hg
concentrations in fish between 0 – 5.1% per year in conjunction with sulfate and
Hg deposition reductions (Hrabik and Watras 2002, Johnston et al. 2003,
Madsen and Stern 2007, Rasmussen et al. 2007). Reduced deposition of Hg
was related to 5% annual declines in yellow perch while deacidification caused
reductions in fish Hg on the order of 0.8% per year (Hrabik and Watras 2002).
Reduced deposition and fish Hg also result in lower Hg concentrations in
feathers, blood, and eggs of fish-eating birds (Frederick et al. 2002, Fevold et al.
2003). It appears that reductions in Hg emissions are transferred into
contaminant reductions in biota, but that recovery can take 10 years or more
(Johnston et al. 2003).

18
More than a decade has passed since the initiation of Hg abatement
programs. The objective of this study was to examine whether Hg
concentrations in fish have subsequently decreased in a region known to have
high Hg. Studies in the mid-1990s showed that the resident common loon (Gavia
immer) populations in KNPNHS had 2 – 6 times more Hg in their blood than loon
populations in other parts of North America (Evers et al. 1998, Burgess et al.
2005). Yellow perch are the main prey for loons (Barr 1996), and most of the
lakes examined in 1996 and 1997 contained perch with mean Hg concentrations
exceeding the 0.21 µg/g threshold where common loons have 50% reduced
maximum productivity (Carter et al. 2001, Drysdale et al. 2005, Burgess and
Meyer 2008). Lake acidity (pH < 6) and wet deposition of Hg have not changed
significantly in KNPNHS since 1997 (Clair et al. 2002, Tordon et al. 2006), but
the total emissions of Hg from North America declined 32% between 1995 and
2000 (Pacyna and Pacyna 2002, Pacyna et al. 2006). In 2006 we revisited lakes
studied in 1996 and 1997 to determine whether Hg concentrations in yellow
perch declined in response to reductions in Hg emissions and to understand
factors affecting Hg in fish using stable isotopes and water chemistry data.
2.3 Methods
2.3.1 Study site
KNPNHS is in south-western Nova Scotia, Canada (Figure 2-1) and is not
impacted by major industrial developments or other point sources of pollutants
(O'Driscoll et al. 2005b). The park is downwind of major North American urban
19
and industrial centres, and Hg and acidifying substances originating from these
areas are transported to and deposited in the region (Drysdale 2005, Temme et
al. 2007). The lakes in KNPNHS are particularly sensitive to acidification and
have high aqueous Hg concentrations and low pH because of the low buffering
capacity of the bedrock and the abundance of wetlands, particularly acid-
producing bogs and fens (Kerekes et al. 1989, Wood and Rubec 1989, Rencz et
al. 2003, O'Driscoll et al. 2005b). The lakes are all oligotrophic and acidic (pH <
6) but vary in size (from 33 to 2632 ha), dissolved organic carbon (DOC) content
(2.7 to 11.9 mg/L; Tables 2-1 and 2-2), and fish community diversity [3 to 12
species per lake; (Kerekes 1975b)]. The sites are also generally polymictic with
stratification and oxygen depletion only occurring in the deepest locations that
represent < 1% of lake volume (Kerekes 1975a). The 10 lakes revisited in 2006
were chosen because they represented the range of Hg concentrations in yellow
perch measured by Environment Canada and Parks Canada in 1996/1997
(Carter et al. 2001, Drysdale et al. 2005).
2.3.2 Sample collection
Fishing occurred in late summer of each sampling year: July and August
1996 and 1997, and August and September 2006. We targeted nine yellow
perch from each size class in each lake that represent the sizes of perch
consumed by common loons (Barr 1996): 5-10 cm (representing fish aged 1-2
years), 10-15 cm (2-5 years), and 15-20 cm (> 5 years) (Burgess et al. 1998a,
Rutherford et al. 1998). Fork length, weight and scales were obtained from each
20
fish; all organisms were kept cool on ice and then frozen within 24 hr of capture.
Condition was calculated as (weight / length3)*100. In 1996 and 1997 all fish
were lethally sampled. In 2006 small fish were lethally sampled and perch > 18
cm were sampled using a dermal punch. All fish were sampled according to
protocols approved by the University of New Brunswick Animal Care Committee.
To calibrate the Hg and isotope concentrations between the non-lethal
(dermal punch) and lethal (fillet or whole body) samples, four to nine large (15-20
cm) yellow perch were collected in each of 3 lakes (Kejimkujik, Cobrielle, and Big
Dam West) and sampled using the dermal punch and lethal techniques. Fish
were anaesthetized with clove oil, a dermal punch (4 mm diameter) was used to
remove three samples of dorsal muscle tissue [34 – 164 mg wet weight each;
(Baker et al. 2004)], and then the fish were sacrificed to obtain the fillet (30 – 300
mg wet weight) and whole body samples. The epidermis was removed from the
biopsy sample, and then all tissues were sealed in a plastic bag and frozen for
later analyses. In all other lakes, fish > 18 cm were sampled with the dermal
punch, the wound was covered with Vetbond, and then the fish was allowed to
recover before it was returned to the lake.
Littoral invertebrates were collected from all lakes in August and
September 2006. Fish in these lakes feed mainly on littoral carbon sources (see
Chapter 3), therefore littoral primary consumers (Limnephilidae: Limnephilus or
Lepidoptera: Parapoynx) were collected to standardize the isotopic signatures of
the fish for the baseline signature of each lake (Cabana and Rasmussen 1996).
21
Invertebrates were live-sorted to major taxa in the field and frozen within 24 hr of
collection.
Surface water samples (n=1/lake/date) were collected in spring
(May/June) and fall (September/October) of 2005 and 2006 by Environment
Canada and analysed by their lab in Moncton, New Brunswick. Each sample
was analysed for nitrate, sulfate, ammonia, pH, total phosphorous, total nitrogen,
and dissolved organic carbon (DOC)1 using procedures described in Vaidya et al.
(2000). Total and methyl Hg concentrations were also determined for the fall
2006 samples. Historic water chemistry data for these lakes were obtained for
spring and fall from the literature (Carter et al. 2001, Drysdale et al. 2005) and
from Tom Clair (Environment Canada, unpublished data). Data are presented as
means from 1995 – 1997 (n = 6; 3 years of semi-annual sampling) and 2005 –
2006 (n = 4; 2 years of semi-annual sampling). Exceptions include 1995 – 1997
results for Big Dam East, North Cranberry, and Puzzle lakes where means (n =
1) were obtained from Carter et al. (2001), and North Cranberry and Puzzle were
only sampled again in fall 2006 (n = 1).
In May 2007, surface water was collected from each lake to assess
chlorophyll a content. Water (1L, n = 3 per lake) was concentrated onto a 1.2 µm
glass fiber filter, then each filter was wrapped in tinfoil to avoid photodegradation
and frozen. Chlorophyll a concentrations were subsequently analysed
fluorometrically at Acadia University, Wolfville, Nova Scotia.
1 Total organic carbon was measured in 1995-1997, total and dissolved were measured in 2006. In 2006,
the dissolved fraction always exceeded 76.3% of the total.
22
In the laboratory, invertebrates and fish were sorted and prepared for
isotope and Hg analyses. All tools for handling invertebrates were rinsed in a 5%
HCl acid bath between samples, and tools to homogenize fish were washed in
soapy water and then rinsed with excess volumes of distilled water. Cases were
removed from the invertebrates, and the limnephilids and lepidopterans were
identified to Family according to Merritt and Cummins (1996). A skinless dorsal
muscle sample was removed from each fish for isotope analysis and then the
whole bodies were homogenized. Fish muscle and whole body homogenates,
and whole body composites of invertebrates (n ≥ 2) were freeze dried and
ground for Hg and stable isotope analyses. Fish samples were weighed before
and after lyophylization to determine the percent moisture.
2.3.3 Stable isotope analyses
Isotope ratios of the fish were obtained from individual dermal punch or
fillet samples and invertebrates were analysed as composites (n ≥ 2) of whole
bodies. Analyses were performed on a Thermo-Finnigan DeltaPlus isotope ratio
mass spectrometer at the Stable Isotopes in Nature Laboratory at the University
of New Brunswick (UNB), Fredericton. All isotopic ratios are provided in the delta
notation, where
15N = [(Rsample / Rstandard) – 1] x 1000
and R denotes the ratio of heavy to light isotope (15N/14N) in the sample or
standard. Atmospheric nitrogen is the internationally recognized standard, and
ammonium sulfate (N2; 15N = 20.3‰) was the isotopic standard. Accuracy of

23
the standard was 0.24‰ (n = 10). Precision of duplicate samples had one
standard deviation of 0.12‰ (n = 51).
2.3.4 Mercury analyses2
In 1996/1997, whole bodies of 677 yellow perch were homogenized and
then used to create 242 composite samples by pooling homogenate from 1 to 3
fish of similar length in each lake (Carter et al. 2001, Drysdale et al. 2005). The
composite samples (maximum 9 per lake except for Kejimkujik and Peskawa,
which had 9 x 3 samples each) were analysed for total Hg content at the
Environment Canada lab, Moncton, NB according to standard protocols
(Environment Canada 1982). Sulphuric acid, dichromate, and UV photooxidation
were used to oxidize the organomercury compounds in the tissues to inorganic
Hg compounds, then the inorganic compounds were reduced to elemental Hg
with stannous sulphate (10 w/v) in hydroxylamine sulphate-sodium chloride
solution (12% w/v; Carter et al. 2001, Drysdale et al. 2005). Total Hg content
was then measured by cold-vapour atomic-absorption spectrometry and runs had
a mean reference material (DORM-2; dogfish muscle; National Research Council
of Canada) recovery of 103.3 ± 4.5% (93.33 – 107.96%; n = 10) and precision
within 3.7% (n = 40). A subset of 23 composite tissues analysed for MeHg using
the Advanced Mercury Analyser (AMA-254) had 95.5 ± 6.7% of total Hg as MeHg
(Drysdale et al. 2005).
2 Selenium analyses were performed but are not included in this chapter. See Appendix 1.
24
Fish samples collected in 2006 were analysed individually for total Hg
content at UNB in Fredericton. Muscle and whole body tissues were analysed
using atomic absorption spectrometry on a Milestone DMA-80 Direct Mercury
Analyzer. Mean DORM-2 recovery was 94.6 ± 2.0% (90.3 – 101.2, n = 60), and
precision of replicate samples was between 0.3 and 15% (n = 85). Blanks were
run every 12 samples and had a mean concentration of 0.01 µg/g, or 3.3% of the
mean sample Hg concentration. Results were not corrected for the Hg observed
in blanks.
Thirty yellow perch captured in 2006 were analysed both at UNB and the
National Wildlife Research Centre (NWRC) in Ottawa for quality assurance.
Total Hg content of tissues were measured at NWRC using an AMA-254. NWRC
analyses in 2006 had a mean reference material recovery of 111.3 ± 7.0%
(DOLT-3, dogfish liver tissue, National Research Council of Canada; OT-1566b,
oyster tissue, National Institute of Standards and Technology; n = 8), and
precision was within 5.9%. On average, raw data were 21.3 ± 17.4% higher at
NWRC (range 80.3 – 160.4%), although the difference was reduced to 5.4%
(non-significance; t-test p = 0.87) after correcting for the recovery from reference
materials.
2.3.5 Data transformations and analyses
Recoveries of the standard reference materials of Hg differed among labs,
runs, and years; therefore, Hg concentrations in fish were adjusted to the mean
within-year recovery of the standards (94.6% in 2006 at UNB and 103.3% in

25
1996/1997 at Moncton; within-run recoveries were available for 2006 data but not
for earlier data, so mean recoveries were used). The 1996/1997 Hg data were
measured as wet weights (ww) but the 2006 Hg concentrations were measured
as dry weights (dw); 2006 Hg data were converted to ww using individual
moisture contents.
Twenty-one fish (of 242 yellow perch captured) were sampled for dermal
punch and fillet isotope ratios and dermal punch, fillet, and whole body Hg
concentrations in 2006. Regression analysis (general linear model, GLM) was
used to convert the Hg and isotope concentrations between the non-lethal
dermal punch concentrations and the fillet or whole body techniques (see
results).
To compare trophic positions (TP) of the fish across lakes, the mean 15N
of the primary consumer (Limnephilidae or Lepidoptera) from that lake was
subtracted from the fish 15N. This adjusted value (15Nadj) was used to calculate
TP: (15Nadj/ 3.4) + 2. This equation assumes that the average N enrichment
observed between subsequent trophic levels is 3.4‰ and that the primary
consumer has a trophic level of 2 (Minagawa and Wada 1984, Vander Zanden et
al. 1997, Post 2002).
Fewer fish were captured in Big Dam East and Cobrielle Lakes, therefore
the analyses for these lakes were limited to the 5-15 cm and 10-20 cm sized fish,
respectively. All data were inspected for normality and homogeneity of variances
using the Kolmogorov-Smirnov Lilliefors test and F-ratio, respectively, and length
and Hg were log10-transformed to normalize the data. Deviations from normality

26
and homoscedasticity remained in Pebbleloggitch, Peskawa, Peskowesk, and
Puzzle lakes; ANOVA and regression are robust to somewhat severe violations
of the assumptions (Zar 1999) and were considered appropriate for the current
analyses.
Spatial variation in the invertebrate and fish data was evaluated each
year. In 2006, 15N of the primary consumers were compared among lakes using
analysis of variance (ANOVA) to determine whether baseline 15N varied across
lakes. Among-lake differences in mean log-lengths, log-weights, ages, and
trophic position (2006 only) of yellow perch were evaluated using ANOVA, with
Tukey’s multiple comparison tests. Among-lake differences in condition and
length-at-age of perch were evaluated using analysis of covariance (ANCOVA)
with log-length as the dependent variable and log-weight or age as the covariate.
A significant interaction indicated that growth rates differed among lakes. If the
interaction was not significant then differences in the intercept signified
differences in condition or length-at-age among the lakes. Studentized residuals
were examined for all regressions, ANOVAs, and ANCOVAs, and outliers were
identified as data with studentized residuals exceeding an absolute value of 3.
All analyses were performed using SYSTAT 10 for Windows (α = 0.05).
Temporal changes in yellow perch Hg concentrations within each lake
were analysed using ANCOVA3. In each lake, an ANCOVA with log-Hg as the
dependent variable, year as the categorical variable, and log-length as the
covariate was used to determine whether the Hg concentrations changed
3 Temporal trends in fish Hg were also evaluated within size classes via two-sample t-tests, across sizes
with polynomial regression, and across lakes with paired t-tests of the standardized Hg concentrations.
Results are presented in Appendices 2 - 4, respectively.

27
between 1996/1997 and 2006. If the log-length*year interaction was not
significant, it was removed and the model was re-tested. A significant difference
in the intercept of the new model revealed that Hg concentrations changed
between 1996/1997 and 2006.
Although 5-20 cm perch were targeted, the unstandardized mean Hg
concentrations could not be compared between lakes in KNPNHS or to data from
other studies because not all sizes of fish were captured in Big Dam East or
Cobrielle Lakes. Across all lakes, the mean length of yellow perch caught in both
years was 12 cm so this was used as a standardized length. A simple linear
regression between log-Hg and log-length was calculated for each lake in each
year and then the 12-cm log-Hg concentration was back-calculated from the
equation. No significant log Hg-log length relationships were found at Beaverskin
in 2006 (mean length 12.3 ± 3.9cm) or at Peskowesk in 1996/1997 (mean length
11.3 ± 3.2 cm; see Results), therefore unadjusted mean Hg concentrations were
used.
Water chemistry parameters were evaluated to assess their potential
influence on altered Hg concentrations among years. When water-chemistry
parameters were below detection limits, one half of the limit was used for
statistical analysis. Data were log or square-root transformed to approximate the
normal distribution. Temporal changes in water chemistry were evaluated across
lakes using paired t-tests of the mean concentration in each lake in each year (n
= 10/year). Simple regressions (general linear model, GLM) were performed for
each year, across all lakes to determine which water chemistry parameters were
28
significantly related to standardized log-Hg concentrations in yellow perch in that
year. The percent change of Hg in yellow perch was regressed against the
percent change of each water chemistry parameter and lake physical
characteristics, and the percent change in water chemistry variables were
regressed against the lake physical characteristics to evaluate factors influencing
the changes through time.
2.4 Results
2.4.1 Dermal punch conversions – 2006
Twenty one yellow perch were sampled in 2006 for Hg concentrations in
dermal punch, fillet, and whole body. A highly significant relationship between
log-Hg in dermal punches and whole bodies was observed:
Whole-body equivalent [Hg ww] = 0.60 x dermal punch [Hg ww]; r2 =
0.942; GLM, p < 0.001
Whenever only dermal punches were collected, Hg concentrations were adjusted
to whole-body equivalents using the above equation. In addition, Hg in dermal
punches and fillet samples were significantly related (fillet Hg ww = 0.998*punch
Hg ww, r2 = 0.992; GLM, p < 0.001) on a 1:1 line and no further transformations
of these data were done. Human consumption advisories are based on Hg
concentrations in fish fillets; whole body concentrations were also converted to a
fillet-equivalent concentration using:
Fillet equivalent [THg ww] = 1.77 x whole body [THg ww], r2 = 0.902; GLM,
p < 0.001
29
Dermal punch 15N of the 21 yellow perch from Big Dam West, Cobrielle,
and Kejimkujik lakes were significantly related to fillet 15N values. The resulting
equation was used to convert all dermal punch isotope ratios to fillet equivalents:
Fillet-equivalent 15N = 0.94 x Dermal punch 15N; r2 = 0.895; GLM, p <
0.0001
2.4.2 Yellow perch 1996/1997 (data from Carter et al. 2001)
Lengths, weights, and ages of yellow perch did not vary significantly
(ANOVA, p > 0.61) among the 10 lakes in KNPNHS with lake means ranging
from 10.0 ± 2.4 to 14.6 ± 2.4 cm for fork length, 13.32 ± 9.71 to 39.32 ± 20.07 g
for weight, and 3.7 ± 1.4 to 5.6 ± 2.3 years for age (Table 2-3). Perch from Big
Dam West had significantly higher condition (i.e. fatter fish; ANCOVA intercept, p
< 0.003; Table 2-3) than any other lake. Growth rates were not significantly
(ANCOVA interaction, p > 0.06) different among lakes, but length-at-age was
greatest for the perch in Beaverskin (Tukey test of ANCOVA intercept, p < 0.04;
Appendix 5). Geometric mean Hg concentrations (12-cm standard length)
ranged from 0.15 µg/g in Pebbleloggitch to 0.33 µg/g in North Cranberry Lake.
Log-Hg was positively (GLM, p < 0.012, r2 > 0.61; Figure 2-2) related to log-fork
length in all lakes except Peskowesk (GLM, p > 0.13).
For lakes where all sizes (5-20 cm) of fish were captured, yellow perch
from North Cranberry had the highest mean Hg (ANOVA, p < 0.003). Low size-
standardized Hg concentrations (0.15 – 0.20 µg/g ww) occurred in

30
Pebbleloggitch, Big Dam East, Cobrielle, and Beaverskin lakes; moderate
concentrations (0.22 – 0.25 µg/g ww) were found in Peskowesk, Puzzle, Big Dam
West, and Peskawa; and the highest concentrations (0.28 – 0.33 µg/g ww) were
reported in Kejimkujik and North Cranberry (Table 2-3). Log-Hg*age
accumulation rates at Pebbleloggitch and Peskowesk were significantly
(ANCOVA interaction, p = 0.004) lower than at the other lakes. No differences in
Hg accumulation with log-length or log-weight were observed among lakes
(ANCOVA interaction, p > 0.07). Standardized Hg concentrations were lowest in
the lakes with the highest length-at-age (i.e. Beaverskin and Cobrielle; GLM, p =
0.014; Appendix 5); no other biological characteristics significantly (GLM, p >
0.081) predicted 12-cm Hg in perch. Neither physical (GLM, p > 0.13) nor
chemical (GLM, p > 0.23) characteristics of the lakes could explain the variation
in Hg concentrations among the lakes.
2.4.3 Yellow Perch 2006
No significant (ANOVA, p > 0.05) differences in size or age were observed
among lakes for yellow perch captured in 2006, and mean length, weight, and
age ranged across lakes from 10.0 ± 2.0 to 13.8 ± 1.8 cm, 11.93 ± 7.19 to 32.23
± 28.34 g, and 3.9 ± 1.1 to 5.3 ± 2.4 years, respectively (Table 2-3). Perch
growth was significantly (ANCOVA interaction, p < 0.001) higher at Beaverskin,
Big Dam East, Kejimkujik, Peskawa, and Peskowesk lakes than at Big Dam
West, Cobrielle, North Cranberry, and Peskowesk (see Appendix 5). Condition
factors varied significantly (ANCOVA interaction, p < 0.003) among lakes, with

31
Big Dam East having the lowest condition fish, and Peskowesk, Peskawa,
Kejimkujik, and Big Dam West containing the perch with the highest condition
(Table 2-3).
Comparison of only the lakes where all sizes of fish were captured (5-20
cm) revealed that log-Hg concentrations were significantly (ANOVA, p = 0.04)
higher in North Cranberry than in any other lake. Standardized Hg
concentrations ranged from low values (0.23 – 0.26 µg/g) in Pebbleloggitch, Big
Dam West, Peskawa, and Big Dam East, to moderate concentrations (0.30 –
0.34 µg/g) in Beaverskin, Cobrielle, Peskowesk, Puzzle, and Kejimkujik, to a high
concentration in North Cranberry (0.44 µg/g; Table 2-3). Fish from all lakes
except Beaverskin had significant (GLM, p < 0.013 except p = 0.53 at
Beaverskin) relationships between log Hg and log length.
15N of the primary consumers (Limnephilidae and Lepidoptera) were
significantly (ANOVA, p = 0.001) different among the lakes, ranging from means
of -0.04 to 2.51‰ (n = 1 – 3; Table 2-3). Mean trophic positions of yellow perch
were significantly (Tukey test, p < 0.001) higher in Beaverskin (4.05 ± 0.11) and
North Cranberry (4.01 ±0.16) than for the perch in the other lakes, and the fish in
Peskawa (3.84 ±0.12), Pebbleloggitch (3.77 ± 0.17), Big Dam West (3.71 ± 0.16),
and Kejimkujik (3.68 ± 0.19) were also significantly (Tukey test, p < 0.03)
trophically elevated above the perch in the remaining lakes (TP < 3.57; Table 2-
3). Trophic position of perch varied by up to 0.84 levels within a given lake, and
significantly (GLM, p < 0.047) increased with length of perch in all lakes except
Beaverskin, Pebbleloggitch, and Peskowesk (GLM, p > 0.28).
32
In 2006, mean Hg concentrations in yellow perch were elevated in lakes
where mean age was also higher. Log-Hg accumulation rates calculated using
log-length, log-weight, age or 15N were all significantly (ANCOVA interaction, p
< 0.008) different among lakes. For example, Hg*age accumulation was lower
for perch in Beaverskin (0.000) and Peskowesk (0.025) but higher in Big Dam
East (0.120) than the other lakes (0.039 – 0.078). Standardized perch Hg
concentrations were not associated with accumulation rates (as described above;
GLM, p > 0.14), growth rates (p = 0.37), length-at-age (p = 0.63), mean length (p
= 0.28), weight (p = 0.27), condition (p = 0.45) or trophic position (p = 0.34) of
fish across lakes but mean standardized Hg did increase with increasing mean
age (although not significantly, GLM, p = 0.08, Table 2-3). Yellow perch mean
Hg concentrations for 2006 were significantly (GLM, p = 0.04) positively related
to aqueous aluminum concentrations but not to any other physical or chemical
parameters.
2.4.4 Changes through time
When comparing yellow perch from 1996/1997 to those from 2006, log
lengths, log weights, and ages did not differ significantly within lakes but some
differences in fish condition were observed (Table 2-3). The rate of increase in
length with weight changed for perch in Beaverskin (ANCOVA interaction, p =
0.013), North Cranberry (p = 0.01), and Peskawa (p = 0.047) lakes. Mean
condition of fish was significantly lower in 2006 than in 1996/1997 for yellow
33
perch from Big Dam East (0.10 g/cm3, 9%; ANCOVA intercept, p = 0.01) and Big
Dam West (0.08 g/cm3, 8%, p = 0.01) Lakes.
Hg concentrations increased in 7 of the 10 lakes (ANCOVA intercept, p <
0.016; Table 2-4) from 1996/1997 to 2006 (Figure 2-2). Significant (p < 0.001;
Table 2-4) increases (mean 26% overall or mean 31.6% for within lake mean
changes across all lakes) in log-Hg concentrations in yellow perch between
1996/1997 and 2006 were measured at Big Dam East, Cobrielle, Kejimkujik,
North Cranberry, Pebbleloggitch, Peskawowesk, and Puzzle lakes (Figure 2-2),
while the slopes of Hg increase with perch length decreased significantly in
Beaverskin and Peskawa (ANCOVA interaction, p < 0.02). For the latter 2 lakes,
Hg appeared to be higher in small fish from 2006 compared to those in
1996/1997 (Figure 2-2), and a two-sample t-test revealed a significant increase in
the mean Hg in yellow perch in Beaverskin (p = 0.02). Hg concentration changes
ranged from 0.01 (0.04% per year, Big Dam West, Table 2-3) to 0.11 µg/g (5.8%
per year, Beaverskin Lake).
2.4.5 Water Chemistry
Between 1995 and 2006 aqueous sulfate concentrations decreased 0.10
to 0.30 mg/L in each lake (among-lakes paired t-test, p < 0.001) and nitrate
concentrations increased significantly across the lakes (p < 0.001; Table 2-2).
Concurrent with the changes in the concentrations of acidifying compounds,
overall aqueous pH increased (p = 0.01; Figure 2-3) and conductance decreased
significantly (p = 0.04) over the past decade. Although neither aqueous Hg or

34
DOC concentrations changed through time (p > 0.21), the within-lake percent
change of each factor was negatively related to the within-lake percent change in
pH between 1995-1997 and 2005/2006 for all 10 lakes (GLM, p < 0.03, r2 >
0.45). Percent change of aqueous Hg among the lakes was marginally,
negatively related (p = 0.09, r2 = 0.32) to the ratio of lake surface area to
catchment area. Although DOC concentrations were similar in 1995-1997 and
2005/2006, concentrations decreased by 0.7 and 1.1 mg/L at Big Dam West and
Cobrielle, respectively, and increased between 0.2 and 2.3 mg/L in the other
lakes, the greatest of which occurred in the largest lakes (Tables 2-1 and 2-2).
Notably, in both 1995-1997 and 2005-2006, lakes with elevated DOC
concentrations also had low pH and elevated conductance and aqueous Hg and
aluminum when compared to other systems. Concentrations of aluminum (Al),
magnesium (Mg) and chlorine (Cl) were similar (p > 0.19) in 1995-1997 and
2005-2006 for the 10 KNPNHS lakes (Table 2-2).
Chlorophyll a and dissolved phosphorous concentrations measured in
2006 illustrate that the lakes in KNPNHS were oligotrophic. All chlorophyll
concentrations were below 0.40 µg/L except in Big Dam West (0.52 µg/L) and
Peskawa (1.10 µg/L; Table 2-2). Both the lowest and highest chlorophyll
concentrations (0.17 and 1.10 µg/L) occurred in the largest lakes in the park,
Kejimkujik and Peskawa lakes, respectively. Dissolved phosphorous
concentrations ranged from 0.006 mg/L in Big Dam East to 0.016 mg/L in
Pebbleloggitch Lake and did not co-vary with chlorophyll a content (Pearson’s
correlation, r = -0.11).

35
2.4.6 Factors influencing Hg in yellow perch
Factors influencing Hg in yellow perch changed through time. Multiple
stepwise regressions between 12-cm Hg in yellow perch and age, pH, log DOC,
log lake area, square root of %wetlands surrounding a lake, and log flushing rate
indicated a significant relationship between Hg and DOC, flushing rate, and age
in 1996:
Std Hg = 0.079 ± 0.088 + 0.045 ± 0.018 (age at 12cm) – 0.223 ± 0.072
(log-DOC) + 0.155 ± 0.045 (log-flushing rate); p = 0.026, r2 = 0.77
No significant (stepwise GLM, p > 0.22) relationships were found in 2006
between standardized Hg in yellow perch and any biological, physical, or
chemical parameters. The percent change in mean Hg in yellow perch between
1996/1997 and 2006 for each of the 10 lakes was negatively related to log-
catchment area (GLM, p = 0.04), flushing rate (p = 0.01), percent change in
aqueous Hg (p = 0.09), and percent change in DOC (p = 0.051 including Big
Dam West as an outlier, p = 0.35 excluding it), and positively related to lake
surface area:catchment area (p = 0.03).
2.5 Discussion
Hg concentrations in yellow perch in KNPNHS increased 26% on average
between 1996/1997 and 2006. These results were unexpected considering that

36
Hg deposition at KNPNHS did not change during this period (Tordon et al. 2006)
and that sulfate deposition to the region declined 30% (Clair et al. 2002). Despite
evidence for relationships between fish Hg and physical (e.g., %wetlands, lake
area), chemical (e.g., pH, DOC), or biological (e.g., growth rates) characteristics
in other studies (Driscoll et al. 1995, Chen et al. 2005, Kamman et al. 2005), few
such relationships were found in either 1996 or 2006 at KNPNHS. Rather, it was
mainly physical parameters (catchment area, ratio of surface area to catchement
area, or flushing rate) that were related to the temporal changes in Hg in yellow
perch. It is apparent that the changes in biotic Hg concentrations in KNPNHS
through time differ from patterns shown in the literature to cause spatial variation
in Hg in these fish.
2.5.1 External influences on Hg concentrations
Despite the 32% reduction in total Hg emissions from North America
recently (Pacyna and Pacyna 2002, Pacyna et al. 2006) and 30% reductions in
sulfate deposition at KNPNHS (Clair et al. 2002), Hg concentrations in yellow
perch increased 26% (2.6% per year) on average between 1996/1997 and 2006.
In contrast, Hg concentrations in walleye and yellow perch in northern Wisconsin
decreased by 0.5 – 5.1% each year (Hrabik and Watras 2002, Madsen and Stern
2007, Rasmussen et al. 2007) and forage and predaceous fishes from the
Canadian Arctic, northern Manitoba, and northern Ontario had either reductions
(approximately 1% per year) or no change in Hg concentrations during the past
10 to 20 years (Johnston et al. 2003, Muir et al. 2005). The reduced Hg in fish in
37
these studies was attributed to concurrent declines in sulfate deposition (and
subsequent reductions in MeHg production by sulfate-reducing bacteria), and
were speculated to correlate with Hg deposition reductions (Hrabik and Watras
2002, Johnston et al. 2003, Drevnick et al. 2007, Rasmussen et al. 2007).
The mean annual increase in Hg concentrations of yellow perch (2.6%) at
KNPNHS was three times higher than the annual increase (0.8%) observed in
southern Wisconsin, the only other research showing increases in Hg
concentrations in lacustrine fish through time (Rasmussen et al. 2007).
Rasmussen et al. (2007) speculated that the increasing fish Hg concentrations
were due to potential increases in Hg deposition in the southern part of the state.
Hg deposition rates have not changed significantly at KNPNHS between 1995
and 2005 (Tordon et al. 2006, Temme et al. 2007), suggesting other mechanisms
behind the increased Hg in the park’s fish.
The increases in fish Hg concentrations in KNPNHS may be due to the
increased release of Hg and acids from surrounding wetlands. Release of stored
acids and Hg from forests, lake catchments, and sediments have been shown to
maintain or enhance lake acidities and aqueous Hg contents, thus delaying
recovery of the aquatic systems (Bayley et al. 1986, St. Louis et al. 1994,
Snucins et al. 2001, Harris et al. 2007). In an experimental scenario, the release
of previously deposited Hg from uplands and wetlands was up to 100 times
greater than the release of recently deposited Hg (Harris et al. 2007); this
illustrates that a time lag will occur between reduced atmospheric Hg deposition
and amelioration of Hg concentrations in fish. Thus, export of acid and Hg
38
compounds from the surrounding wetlands may be counteracting the effects of
reduced Hg emissions in North America, and the continued release of such
compounds from wetlands will continue to affect biota for some time.
2.5.2 Influence of physical and chemical characteristics of lakes on Hg in fish
Temporal increases in concentrations of Hg in fish at KNPNHS may be the
result of enhanced Hg methylation caused by higher lake temperatures or
reduced oxygen concentrations (Bodaly et al. 1993, Benoit et al. 2003). Recent
studies of the 2 deepest lakes in KNPNHS, Kejimkujik and Peskowesk, showed
that autumn temperature profiles have not changed since the 1970s, but that
hypolimnetic oxygen concentrations are significantly lower than previously
reported (Brylinsky 2006, 2007). Lower oxygen can enhance Hg methylation
activities of anaerobic SRB and could explain the observed increases in fish Hg
concentrations (Matilainen 1995, Brylinsky 2006, 2007). A broader analysis of
temporal changes in temperature and oxygen profiles at KNPNHS, including an
examination of the smaller and shallower lakes, may help to explain the higher
Hg concentrations in yellow perch in 2006.
The significant positive relationship between mean 12-cm Hg in perch
sampled in 1996/1997 and flushing rate (multiple regression) suggests that lakes
with elevated flushing rates have increased inputs of Hg to the base of the food
web. The negative relationship between the pecent change in Hg in yellow perch
through time and flushing rate may be related to the depleted oxygen
concentrations of the lakes over this timeframe, illustrating that lakes with lower

39
flushing rates were experiencing increased stagnation and enhanced MeHg
production (Matilainen 1995).
The positive relationship between the percent change in Hg in yellow
perch between 1996/1997 and 2006 and the lake surface area to catchment area
ratio may further support the theory of increased MeHg production and
availability within KNPNHS lakes. High ratios represent lakes with little influence
from the surrounding environment, and the KNPNHS pattern is contrary to
previous research showing increased fish Hg in lakes with large catchments and
low surface area:catchment area ratios (Drysdale et al. 2005, Chen et al. 2005).
In KNPNHS, this ratio was negatively related with flushing rate, again suggesting
that stagnation of waters may have enhanced Hg methylation and caused the
increase in yellow perch Hg concentrations over the past decade.
Despite the increased aquatic pH in some lakes at KNPNHS, the
continually high inputs of acidifying substances (Clair et al. 2002) may partly
explain the lack of recovery of the aquatic food webs from Hg contamination.
Sulphur (S) emissions have decreased globally and in north-eastern North
America (Jeffries 1997, Stoddard et al. 1999, Snucins et al. 2001), and sulfate
deposition and aqueous sulfate concentrations in lakes at KNPNHS have
concurrently declined [Table 2-2; (Clair et al. 2002)]. However, because
emissions of acidic nitrogenous substances have not been controlled, N
deposition and aqueous nitrate concentrations are increasing both globally and at
KNPNHS [Table 2-2; (Jeffries 1997, Stoddard et al. 1999, Clair et al. 2002)].
Although there was not a significant relationship between the change in Hg in
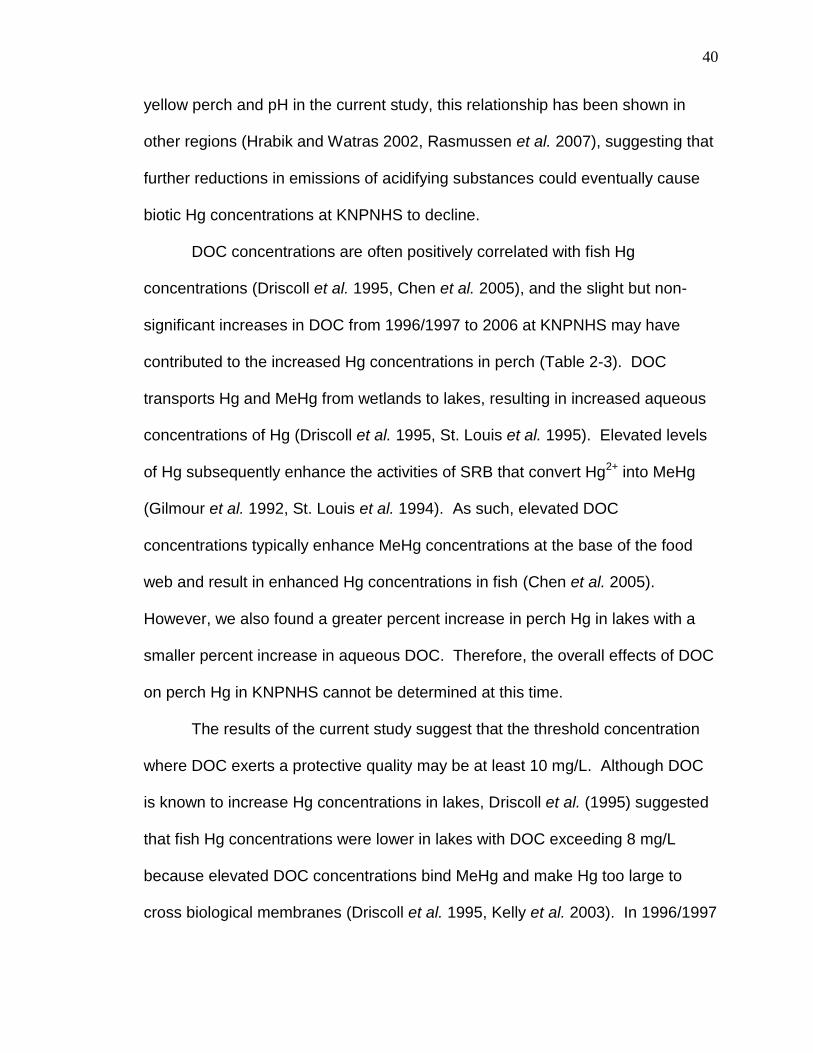
40
yellow perch and pH in the current study, this relationship has been shown in
other regions (Hrabik and Watras 2002, Rasmussen et al. 2007), suggesting that
further reductions in emissions of acidifying substances could eventually cause
biotic Hg concentrations at KNPNHS to decline.
DOC concentrations are often positively correlated with fish Hg
concentrations (Driscoll et al. 1995, Chen et al. 2005), and the slight but non-
significant increases in DOC from 1996/1997 to 2006 at KNPNHS may have
contributed to the increased Hg concentrations in perch (Table 2-3). DOC
transports Hg and MeHg from wetlands to lakes, resulting in increased aqueous
concentrations of Hg (Driscoll et al. 1995, St. Louis et al. 1995). Elevated levels
of Hg subsequently enhance the activities of SRB that convert Hg2+ into MeHg
(Gilmour et al. 1992, St. Louis et al. 1994). As such, elevated DOC
concentrations typically enhance MeHg concentrations at the base of the food
web and result in enhanced Hg concentrations in fish (Chen et al. 2005).
However, we also found a greater percent increase in perch Hg in lakes with a
smaller percent increase in aqueous DOC. Therefore, the overall effects of DOC
on perch Hg in KNPNHS cannot be determined at this time.
The results of the current study suggest that the threshold concentration
where DOC exerts a protective quality may be at least 10 mg/L. Although DOC
is known to increase Hg concentrations in lakes, Driscoll et al. (1995) suggested
that fish Hg concentrations were lower in lakes with DOC exceeding 8 mg/L
because elevated DOC concentrations bind MeHg and make Hg too large to
cross biological membranes (Driscoll et al. 1995, Kelly et al. 2003). In 1996/1997

41
and 2006, Pebbleloggitch Lake contained the highest DOC concentrations (10.7
and 11.9 mg C/L, respectively) and the lowest fish Hg concentrations across all
lakes, supporting the theory that DOC reduces the bioavailability of Hg. In
contrast, Big Dam West had a mean DOC concentration of 9.3 mg/L in
1996/1997, but had among the highest 12-cm mean Hg concentrations for yellow
perch. A protective DOC threshold of 10 mg/L appears more applicable for the
pH ranges in KNPNHS.
2.5.3 Influence of biological parameters on Hg concentrations in fish
Differences in length-at-age (growth) of perch may explain the atypical
temporal trends in fish Hg for Big Dam West. Although among year differences
in size, age, or growth could have caused the Hg concentration changes through
time for most of the lakes in KNPNHS (Scott and Armstrong 1972, Watras et al.
1998), the only difference in the means of these parameters was found in Big
Dam West in 2006; fish from this lake were consistently longer for a given age
than those sampled in 1996/1997. Although Hg concentrations often increase
with length (as reported here), increased length-at-age in 2006 at Big Dam West
co-occurred with a reduction in yellow perch condition as compared to 1996/1997
suggesting that the lack of significant differences in Hg between years was due
to dilution of Hg in faster growing fish (Scott and Armstrong 1972, Trudel and
Rasmussen 2006). Increased growth of fish could be due to increased aqueous
pH or productivity, or changes in food web structure and species abundance
42
(Rodgers and Qadri 1982, Chen et al. 2000, Kovecses et al. 2005, Trudel and
Rasmussen 2006).
Increases in lake productivity can reduce Hg concentrations in fish by
diluting the Hg in algae and zooplankton at the base of the food web (Pickhardt
et al. 2002, 2005). In KNPNHS, aquatic phosphorous concentrations were
elevated in 2006 compared to 1972, but the enhanced productivity should have
caused Hg concentration reductions (Pickhardt et al. 2002, 2005) rather than the
increases observed in the current study. Total phosphorous contents of the
lakes at KNPNHS were not measured in 1996/1997, but ranged from 0.095 x 10⁻³
to 0.86 x 10⁻³ mg/L in 1972 (Kerekes 1975a). In 2002 – 2006, phosphorous
concentrations ranged from 0.003 to 0.020 mg/L, indicating at least a 3-fold
increase in the nutrient load of the lakes over the past thirty years, although the
cause for the increase is unknown at present.
Increases in Hg bioaccumulation rates could have caused the elevated Hg
concentrations observed in perch at KNPNHS in 2006; however, accumulation of
Hg with length decreased significantly (ANCOVA interaction, p < 0.02) in 2 of 10
lakes at KNPNHS between 1996/1997 and 2006 and did not change in the other
8 lakes. The slope of the Hg-length regression decreased from 1.36 to 0.0 in
Beaverskin, and from 1.34 to 0.81 in Peskawa between 1996/1997 and 2006,
respectively, and these changes did not coincide with either the highest
concentration changes through time or with the highest concentrations in 2006
across lakes (Figure 2-2). Increased Hg accumulation through time is typically
associated with reduced fish growth (Trudel and Rasmussen 1997, Greenfield et
43
al. 2001, Trudel and Rasmussen 2006), but growth did not change among years
in these lakes.
Several studies, including this one (Chapter 3), have shown that mercury
concentrations are higher in fish at higher trophic positions [as determined using
15N; (Cabana et al. 1994, Atwell et al. 1998, Power et al. 2002, Kidd et al.
2003)]. It is possible that the trophic position of perch has increased from
1996/1997 to 2006, and contributed to their higher contemporary Hg. 15N in
perch were not measured in 1996/1997, so it is not possible to determine
whether changes in food web structure contributed to these temporal trends.
Future work will involve isotopic analysis of archived samples to determine
whether the perch captured in 1996/1997 had lower 15N, thus causing lower Hg
concentrations than the fish caught in 2006 (Cabana and Rasmussen 1994, Kidd
et al. 1995).
2.5.4 Comparisons and implications
Yellow perch collected from KNPNHS in 2006 have elevated Hg
concentrations compared to other remote sites. Perch Hg concentrations ranged
from 0.09 to 0.75 µg/g wet weight (Table 2-3), and were higher than the whole
body Hg concentrations measured for yellow perch in rural Wisconsin (0.02 to
0.54 µg/g wet weight) for a similar size range of fish (Watras et al. 1998). The
overall mean Hg concentration of perch from KNPNHS (1.26 ± 0.57 µg/g dw) was
4 times higher than the mean of 0.30 ± 0.12 µg/g (dw) reported for yellow perch
in 25 lakes in Ontario and Manitoba (Johnston et al. 2003). Indeed, KNPNHS

44
has been identified as one of 8 “biological hotspots” of mercury contamination in
northeastern North America (Evers et al. 2007).
The observed increases in Hg concentrations in yellow perch in KNPNHS
over the past decade suggest that other species in the park are also at risk of Hg
toxicity. Yellow perch are the main prey of common loons [Gavia immer; (Barr
1996)], and loons consuming yellow perch with mean Hg concentrations
exceeding 0.21 µg/g exhibit 50% reduction in maximum productivity (Burgess
and Meyer 2008). In 1996/1997, only 6 lakes had yellow perch with 12-cm mean
Hg exceeding the threshold, but in 2006, standardized mean Hg concentrations
exceeded 0.21 µg/g in all 10 lakes (Figure 2-4). In addition, in 1996/1997, no
lakes had standardized Hg concentrations in perch exceeding 0.41 µg/g, the
endpoint for complete reproductive failure in loons (Burgess and Meyer 2008),
yet yellow perch in North Cranberry exceeded this threshold in 2006 (Figure 2-4).
These increases suggest that loons in the park will increasingly experience
reduced reproductive success and could eventually exhibit complete reproductive
failure on certain lakes (Barr 1986, Burgess and Meyer 2008).
Yellow perch are also prey for sport fish (Scott and Crossman 1998),
which likely also have increased in their Hg concentrations since 1996/1997. In
1996/1997, brook trout and white perch from KNPNHS had mean Hg
concentrations of 0.31 ± 0.22 (ranging from 0.06 – 1.37µg/g ww) and 1.03 ± 0.45
µg/g (range: 0.35 to 2.30 µg/g ww), respectively (d'Entremont et al. 1998,
Drysdale et al. 2005). Across all lakes, 12-cm mean Hg concentrations in yellow
perch increased 0.06 µg/g, or 26%, on average between 1996/1997 and 2006
45
suggesting that sport fish in KNPNHS could currently have mean Hg
concentrations of 0.39 and 1.30 µg/g, with maximum concentrations between
1.73 and 2.90 µg/g. The lowest change in 12-cm Hg concentrations over this
time period was a decrease of 4% in Big Dam West while the greatest change
occurred in Beaverskin Lake (58%), illustrating that substantial variation in the
risk of Hg exposure for fish and wildlife occurs within the park.
Higher yellow perch Hg concentrations in 2006 than in 1996/1997 suggest
that fishermen are also at greater risk of Hg exposure through fish consumption.
Health Canada suggests that adults should limit their consumption of fish with
more than 0.5 µg Hg/g wet weight (Health Canada 2007). Seven of the KNPNHS
lakes had mean fillet Hg concentrations for yellow perch that would be unsafe for
human consumption, and the fillet Hg-length relationship reveals that in 7 of the
10 lakes perch larger than 12 cm exceed 0.5 µg/g. New Brunswick and Nova
Scotian governments generally advise people not to consume wild fish longer
than 25 cm (d'Entremont et al. 1998) and, although people generally do not
consume yellow perch, Hg concentrations for other sports fish in KNPNHS
should be assessed in light of the results of this study.
2.5.5 Conclusions
Between 1996/1997 and 2006, yellow perch Hg concentrations increased
significantly in 70% of lakes examined in KNPNHS. Accumulation rates also
changed significantly in an additional 20% of lakes. Although the causes are
currently speculative, enhanced DOC concentrations, depletion of lake oxygen
46
contents, release of acidifying substances and Hg from wetlands, and altered fish
growth may have played a role in the results. This work is the first to illustrate Hg
concentration increases in fish despite reductions in North American Hg and
sulfate emissions, suggesting that further emission reductions are required,
specifically for nitrate and other acidifying substances. Continued examination of
factors that have changed through time and of parameters that increase Hg
concentrations at the base of the food web are required before we can
understand why Hg in perch increased at KNPNHS. The results of this work
illustrate the need for continued monitoring of biotic Hg contamination within the
park and other seemingly remote and pristine regions.
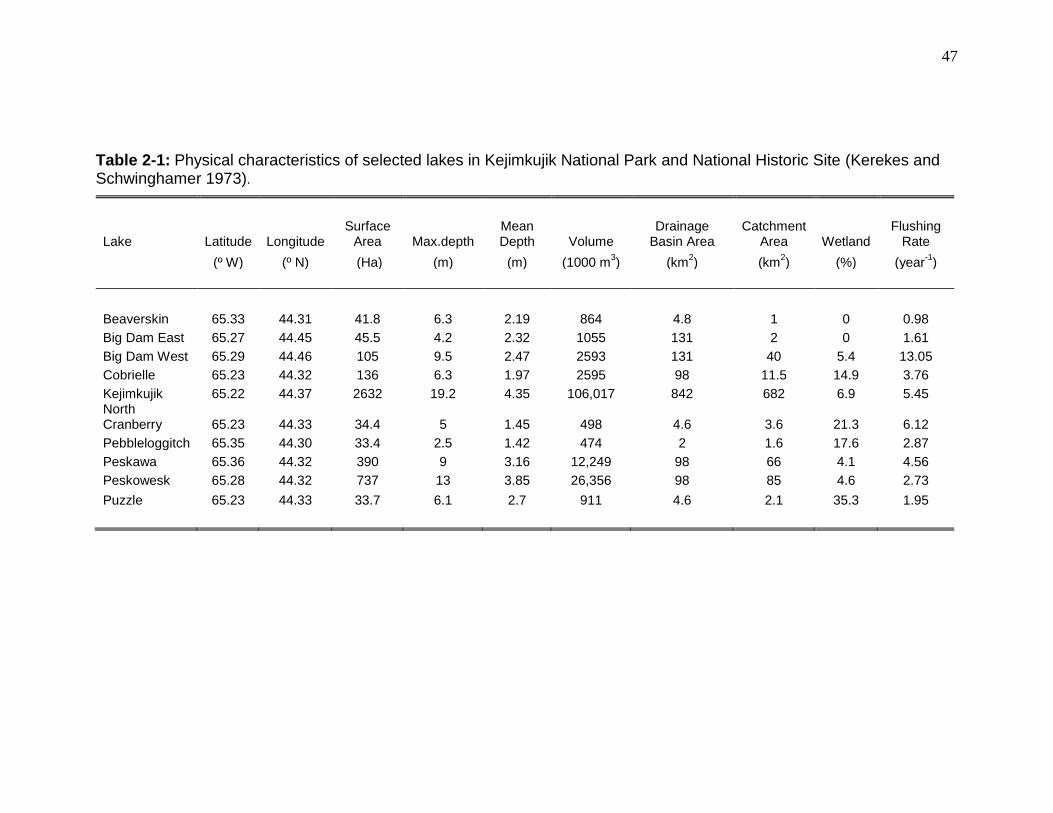
47
Table 2-1: Physical characteristics of selected lakes in Kejimkujik National Park and National Historic Site (Kerekes and Schwinghamer 1973).
Lake Latitude Longitude Surface
Area Max.depth Mean Depth Volume
Drainage Basin Area
Catchment Area Wetland
Flushing Rate
(º W) (º N) (Ha) (m) (m) (1000 m3) (km
2) (km
2) (%) (year
-1)
Beaverskin 65.33 44.31 41.8 6.3 2.19 864 4.8 1 0 0.98
Big Dam East 65.27 44.45 45.5 4.2 2.32 1055 131 2 0 1.61
Big Dam West 65.29 44.46 105 9.5 2.47 2593 131 40 5.4 13.05
Cobrielle 65.23 44.32 136 6.3 1.97 2595 98 11.5 14.9 3.76
Kejimkujik 65.22 44.37 2632 19.2 4.35 106,017 842 682 6.9 5.45 North Cranberry 65.23 44.33 34.4 5 1.45 498 4.6 3.6 21.3 6.12
Pebbleloggitch 65.35 44.30 33.4 2.5 1.42 474 2 1.6 17.6 2.87
Peskawa 65.36 44.32 390 9 3.16 12,249 98 66 4.1 4.56
Peskowesk 65.28 44.32 737 13 3.85 26,356 98 85 4.6 2.73
Puzzle 65.23 44.33 33.7 6.1 2.7 911 4.6 2.1 35.3 1.95

48
Table 2-2: Mean (± SD) chemical characteristics of selected lakes in Kejimkujik National Park and National Historic Site (Carter et al. 2001, Tom Clair, Environment Canada, unpublished data).
pH Hg (aq) DOC SO4 NO3 Cond. N Mg Al K Ca Fe P Chl a
Lake Year (ng/L)# (mg/L) (mg/L) (mg/L) (µS/cm) (mg/L) (mg/L) (mg/L) (mg/L) (mg/L) (mg/L) (mg/L) (µg/L)
Beaverskin 1996 5.3 1.54 2.5 1.91 0.01* 21.8 0.06 0.31 0.04* 0.22 0.30 0.02*
Beaverskin 2006 5.5 0.70 2.7 1.63 0.02* 19.7 0.05 0.31 0.03 0.23 0.31 0.02* 0.007 0.207 Big Dam East 1996 5.9 2.78 3.7 1.80 23.8 0.07 0.38 0.07 0.21 0.61 0.04
Big Dam East 2006 6.0 1.70 4.0 1.70 0.02* 22.7 0.11 0.37 0.07 0.24 0.57 0.03* 0.006 0.329 Big Dam West 1996 5.0 5.01 9.3 1.78 0.01* 29.8 0.10 0.35 0.20 0.32 0.60 0.17
Big Dam West 2006 5.1 5.60 8.6 1.63 0.02* 31.6 0.17 0.36 0.18 0.29 0.56 0.14 0.012 0.522 Cobrielle 1996 5.3 2.60 4.3 1.79 0.01* 22.3 0.07 0.30 0.10 0.21 0.37 0.09
Cobrielle 2006 5.5 0.80 3.4 1.49 0.02* 18.6 0.11 0.28 0.09 0.21 0.30 0.05 0.006 0.249 Kejimkujik 1996 5.0 3.54 7.4 1.99 0.01* 27.9 0.08 0.36 0.16 0.28 0.58 0.20
Kejimkujik 2006 5.0 4.80 8.5 1.70 0.02 26.1 0.18 0.37 0.20 0.28 0.51 0.24 0.014 0.169 N.Cranberry 1996 5.1 1.93 4.5 1.74 21.1 0.10 0.29 0.08 0.18 0.42 0.07
N.Cranberry 2006 5.4 1.70 4.4 1.42 0.01* 19.7 0.26 0.32 0.09 0.33 0.38 0.19 0.008 0.231 Pebbleloggitch 1996 4.5 5.32 10.7 1.86 0.01* 30.4 0.11 0.30 0.19 0.21 0.29 0.16
Pebbleloggitch 2006 4.5 7.00 11.9 1.50 0.02* 31.2 0.21 0.27 0.25 0.22 0.28 0.19 0.016 0.205 Peskawa 1996 4.7 3.80 6.4 2.00 0.01* 26.8 0.09 0.27 0.20* 0.26 0.27 0.11*
Peskawa 2006 4.7 5.10 8.7 1.72 0.02* 25.9 0.16 0.28 0.27 0.25 0.31 0.17 0.009 1.098 Peskowesk 1996 4.8 2.74 5.8 1.98 0.02* 24.9 0.09 0.28 0.24 0.25 0.31 0.12
Peskowesk 2006 4.8 3.40 7.0 1.68 0.04* 23.3 0.17 0.30 0.24 0.27 0.31 0.15 0.006 0.217 Puzzle 1996 5.3 0.87 3.3 1.62 20.5 0.09 0.29 0.05 0.26 0.35 0.09
Puzzle 2006 5.5 0.90 3.0 1.39 0.01* 18.6 0.20 0.31 0.05 0.32 0.33 0.15 0.01 0.323
* - one or more values below detection. # n = 1

49
Table 2-3: Mean (± SD) length, weight, condition, age, whole body total Hg concentrations, standardized total Hg
concentrations, 15N, and trophic positions of yellow perch (YP) caught in 1996/1997 and 2006 from lakes in Kejimkujik National Park and National Historic Site (range in parentheses). Stable N ratios were adjusted for primary consumer (PC) baseline data (see text for details).
Lake
Year n
Length (cm)
Weight (g)
Condition (g/cm
3)
Age (yr)
Hg (µg/g ww)
12-cm Hg
(µg/g ww)
PC 15
N (n) (‰)
YP 15
N (‰)
Trophic Position
Beaverskin 1996 10 11.6 ± 3.2 20.63 ± 14.71 1.10 ± 0.05 3.7 ± 1.4 0.19 ± 0.08 0.20
(7.2 / 16.0) (4.11 / 44.68) (1.01 / 1.18) (2 / 6) (0.08 / 0.34)
2006 23 12.3 ± 3.9 27.74 ± 26.09 1.10 ± 0.07 4.1 ± 1.9 0.30 ± 0.04 0.30 1.00 ± 0.35 7.97± 0.37 4.05 ± 0.11
(7.9 / 19.0) (4.98 / 80.20) (0.99 / 1.27) (2 / 7) (0.20 / 0.40) (3) (7.30 / 8.56) (3.85 / 4.22)
Big Dam East 1996 6 10.0 ± 2.4 13.32 ± 9.71 1.16 ± 0.08 4.0 ± 1.4 0.14 ± 0.05 0.18
(6.9 / 13.4) (4.04 / 30.85) (1.03 / 1.27) (2 / 6) (0.07 / 0.21)
2006 17 10.0 ± 2.0 11.93 ± 7.19 1.06 ± 0.07 3.9 ± 1.1 0.20 ± 0.09 0.26 2.40 7.33 ± 0.44 3.45 ± 0.13
(7.9 / 13.2) (5.20 / 26.68) (0.92 / 1.18) (3 / 6) (0.10 / 0.41) (1) (6.82 / 8.12) (3.30 / 3.68)
Big Dam West 1996 7 10.8 ± 3.4 21.40 ± 18.50 1.31 ± 0.07 5.5 ± 2.4 0.21 ± 0.09 0.23
(6.3 / 16.1) (3.09 / 55.66) (1.21 / 1.44) (1 / 9) (0.08 / 0.30)
2006 21 11.2 ± 2.6 20.43 ± 15.59 1.23 ± 0.07 4.4 ± 1.9 0.22 ± 0.08 0.23 0.99 6.80 ± 0.54 3.71 ± 0.16
(7.2 / 16.2) (4.52 / 55.98) (1.07 / 1.39) (2 / 8) (0.10 / 0.41) (1) (5.40 / 8.28) (3.30 / 4.14)
Cobrielle 1996 6 14.6 ± 2.4 39.32 ± 20.07 1.16 ± 0.07 5.0 ± 1.2 0.25 ± 0.07 0.19
(11.2 / 18.1) (14.78 / 72.14) (1.04 / 1.22) (3 / 7) (0.19 / 0.38)
2006 12 13.8 ± 1.8 31.04 ± 14.38 1.11 ± 0.12 4.8 ± 1.1 0.35 ± 0.08 0.29 2.51 7.68 ± 0.20 3.52 ± 0.06
(11.8 / 16.2) (13.52 / 56.68) (0.82 / 1.33) (3 / 6) (0.24 / 0.52) (1) (7.38 / 8.01) (3.43 / 3.62)
Kejimkujik 1996 23 11.3 ± 3.2 21.77 ± 18.79 1.16 ± 0.09 5.2 ± 2.3 0.27 ± 0.10 0.28
(6.6 / 17.0) (3.13 / 67.00) (1.01 / 1.36) (2 / 10) (0.11 / 0.48)
2006 24 11.8 ± 4.1 27.84 ± 25.66 1.20 ± 0.13 5.0 ± 2.3 0.34 ± 0.16 0.34 1.66 7.38 ± 0.65 3.68 ± 0.19
(5.4 / 19.2) (1.80 / 75.28) (0.92 / 1.51) (1 / 9) (0.15 / 0.70) (1) (6.42 / 8.79) (3.40 / 4.10)
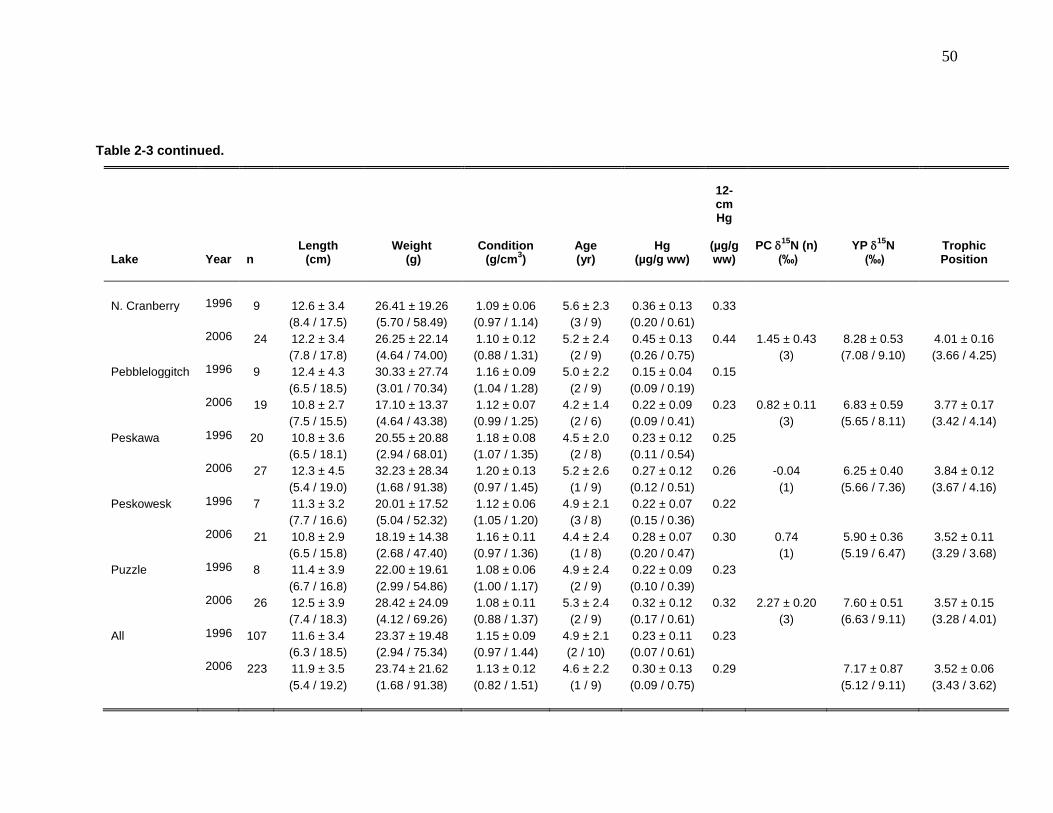
50
Table 2-3 continued.
Lake
Year n
Length (cm)
Weight (g)
Condition (g/cm
3)
Age (yr)
Hg (µg/g ww)
12-cm Hg
(µg/g ww)
PC 15
N (n) (‰)
YP 15
N (‰)
Trophic Position
N. Cranberry 1996 9 12.6 ± 3.4 26.41 ± 19.26 1.09 ± 0.06 5.6 ± 2.3 0.36 ± 0.13 0.33
(8.4 / 17.5) (5.70 / 58.49) (0.97 / 1.14) (3 / 9) (0.20 / 0.61)
2006 24 12.2 ± 3.4 26.25 ± 22.14 1.10 ± 0.12 5.2 ± 2.4 0.45 ± 0.13 0.44 1.45 ± 0.43 8.28 ± 0.53 4.01 ± 0.16
(7.8 / 17.8) (4.64 / 74.00) (0.88 / 1.31) (2 / 9) (0.26 / 0.75) (3) (7.08 / 9.10) (3.66 / 4.25)
Pebbleloggitch 1996 9 12.4 ± 4.3 30.33 ± 27.74 1.16 ± 0.09 5.0 ± 2.2 0.15 ± 0.04 0.15
(6.5 / 18.5) (3.01 / 70.34) (1.04 / 1.28) (2 / 9) (0.09 / 0.19)
2006 19 10.8 ± 2.7 17.10 ± 13.37 1.12 ± 0.07 4.2 ± 1.4 0.22 ± 0.09 0.23 0.82 ± 0.11 6.83 ± 0.59 3.77 ± 0.17
(7.5 / 15.5) (4.64 / 43.38) (0.99 / 1.25) (2 / 6) (0.09 / 0.41) (3) (5.65 / 8.11) (3.42 / 4.14)
Peskawa 1996 20 10.8 ± 3.6 20.55 ± 20.88 1.18 ± 0.08 4.5 ± 2.0 0.23 ± 0.12 0.25
(6.5 / 18.1) (2.94 / 68.01) (1.07 / 1.35) (2 / 8) (0.11 / 0.54)
2006 27 12.3 ± 4.5 32.23 ± 28.34 1.20 ± 0.13 5.2 ± 2.6 0.27 ± 0.12 0.26 -0.04 6.25 ± 0.40 3.84 ± 0.12
(5.4 / 19.0) (1.68 / 91.38) (0.97 / 1.45) (1 / 9) (0.12 / 0.51) (1) (5.66 / 7.36) (3.67 / 4.16)
Peskowesk 1996 7 11.3 ± 3.2 20.01 ± 17.52 1.12 ± 0.06 4.9 ± 2.1 0.22 ± 0.07 0.22
(7.7 / 16.6) (5.04 / 52.32) (1.05 / 1.20) (3 / 8) (0.15 / 0.36)
2006 21 10.8 ± 2.9 18.19 ± 14.38 1.16 ± 0.11 4.4 ± 2.4 0.28 ± 0.07 0.30 0.74 5.90 ± 0.36 3.52 ± 0.11
(6.5 / 15.8) (2.68 / 47.40) (0.97 / 1.36) (1 / 8) (0.20 / 0.47) (1) (5.19 / 6.47) (3.29 / 3.68)
Puzzle 1996 8 11.4 ± 3.9 22.00 ± 19.61 1.08 ± 0.06 4.9 ± 2.4 0.22 ± 0.09 0.23
(6.7 / 16.8) (2.99 / 54.86) (1.00 / 1.17) (2 / 9) (0.10 / 0.39)
2006 26 12.5 ± 3.9 28.42 ± 24.09 1.08 ± 0.11 5.3 ± 2.4 0.32 ± 0.12 0.32 2.27 ± 0.20 7.60 ± 0.51 3.57 ± 0.15
(7.4 / 18.3) (4.12 / 69.26) (0.88 / 1.37) (2 / 9) (0.17 / 0.61) (3) (6.63 / 9.11) (3.28 / 4.01)
All 1996 107 11.6 ± 3.4 23.37 ± 19.48 1.15 ± 0.09 4.9 ± 2.1 0.23 ± 0.11 0.23
(6.3 / 18.5) (2.94 / 75.34) (0.97 / 1.44) (2 / 10) (0.07 / 0.61)
2006 223 11.9 ± 3.5 23.74 ± 21.62 1.13 ± 0.12 4.6 ± 2.2 0.30 ± 0.13 0.29 7.17 ± 0.87 3.52 ± 0.06
(5.4 / 19.2) (1.68 / 91.38) (0.82 / 1.51) (1 / 9) (0.09 / 0.75) (5.12 / 9.11) (3.43 / 3.62)
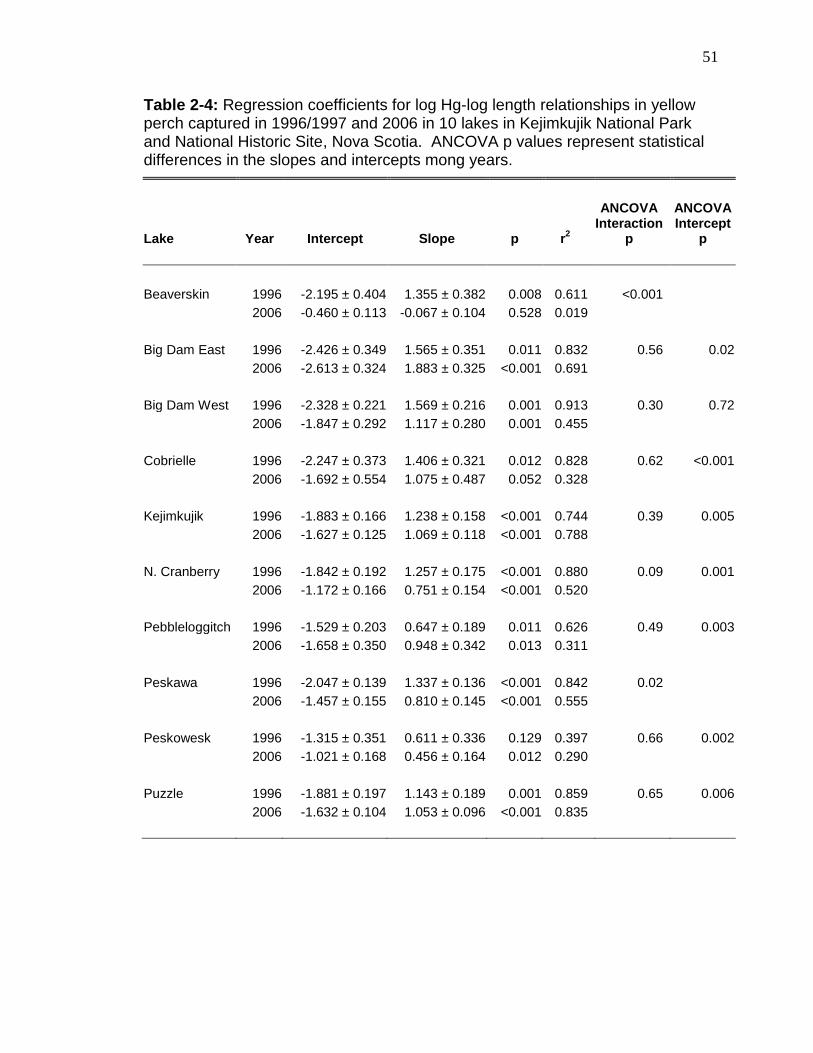
51
Table 2-4: Regression coefficients for log Hg-log length relationships in yellow perch captured in 1996/1997 and 2006 in 10 lakes in Kejimkujik National Park and National Historic Site, Nova Scotia. ANCOVA p values represent statistical differences in the slopes and intercepts mong years.
Lake Year Intercept Slope p r2
ANCOVA Interaction
p
ANCOVA Intercept
p
Beaverskin 1996 -2.195 ± 0.404 1.355 ± 0.382 0.008 0.611 <0.001
2006 -0.460 ± 0.113 -0.067 ± 0.104 0.528 0.019
Big Dam East 1996 -2.426 ± 0.349 1.565 ± 0.351 0.011 0.832 0.56 0.02
2006 -2.613 ± 0.324 1.883 ± 0.325 <0.001 0.691
Big Dam West 1996 -2.328 ± 0.221 1.569 ± 0.216 0.001 0.913 0.30 0.72
2006 -1.847 ± 0.292 1.117 ± 0.280 0.001 0.455
Cobrielle 1996 -2.247 ± 0.373 1.406 ± 0.321 0.012 0.828 0.62 <0.001
2006 -1.692 ± 0.554 1.075 ± 0.487 0.052 0.328
Kejimkujik 1996 -1.883 ± 0.166 1.238 ± 0.158 <0.001 0.744 0.39 0.005
2006 -1.627 ± 0.125 1.069 ± 0.118 <0.001 0.788
N. Cranberry 1996 -1.842 ± 0.192 1.257 ± 0.175 <0.001 0.880 0.09 0.001
2006 -1.172 ± 0.166 0.751 ± 0.154 <0.001 0.520
Pebbleloggitch 1996 -1.529 ± 0.203 0.647 ± 0.189 0.011 0.626 0.49 0.003
2006 -1.658 ± 0.350 0.948 ± 0.342 0.013 0.311
Peskawa 1996 -2.047 ± 0.139 1.337 ± 0.136 <0.001 0.842 0.02
2006 -1.457 ± 0.155 0.810 ± 0.145 <0.001 0.555
Peskowesk 1996 -1.315 ± 0.351 0.611 ± 0.336 0.129 0.397 0.66 0.002
2006 -1.021 ± 0.168 0.456 ± 0.164 0.012 0.290
Puzzle 1996 -1.881 ± 0.197 1.143 ± 0.189 0.001 0.859 0.65 0.006
2006 -1.632 ± 0.104 1.053 ± 0.096 <0.001 0.835
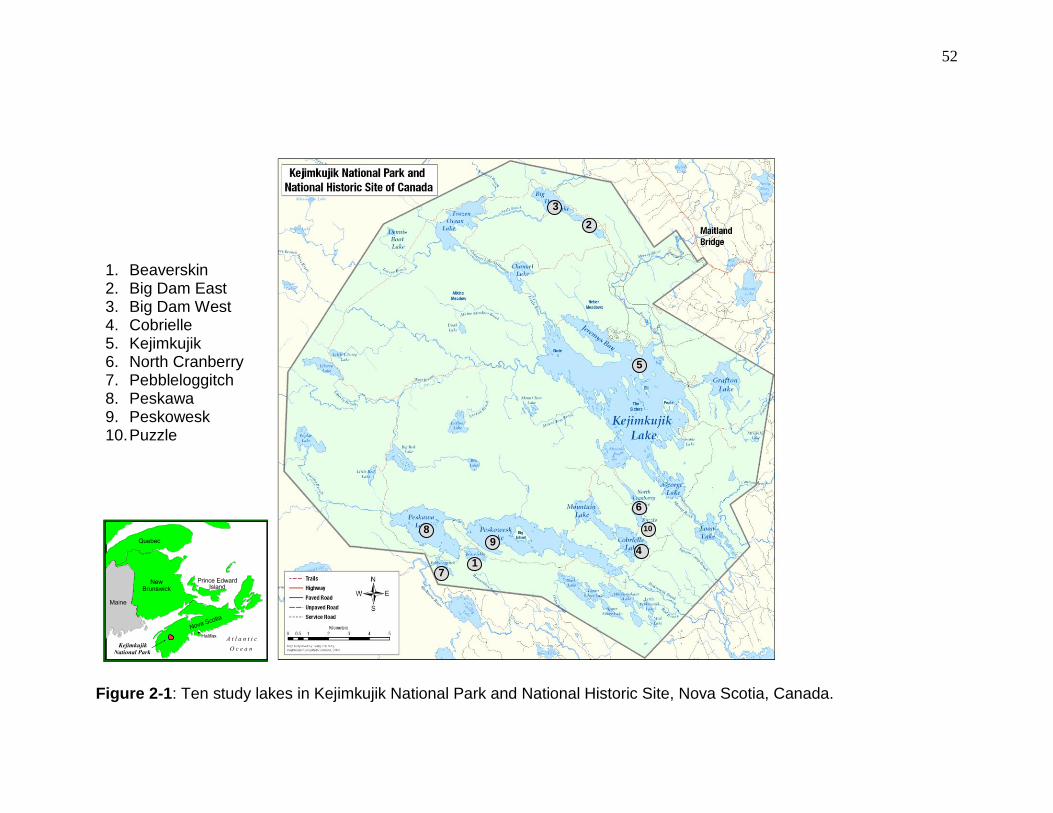
52
Figure 2-1: Ten study lakes in Kejimkujik National Park and National Historic Site, Nova Scotia, Canada.
1 7
6
10
9 8
5
4
2
3
1. Beaverskin 2. Big Dam East 3. Big Dam West 4. Cobrielle 5. Kejimkujik 6. North Cranberry 7. Pebbleloggitch 8. Peskawa 9. Peskowesk 10. Puzzle
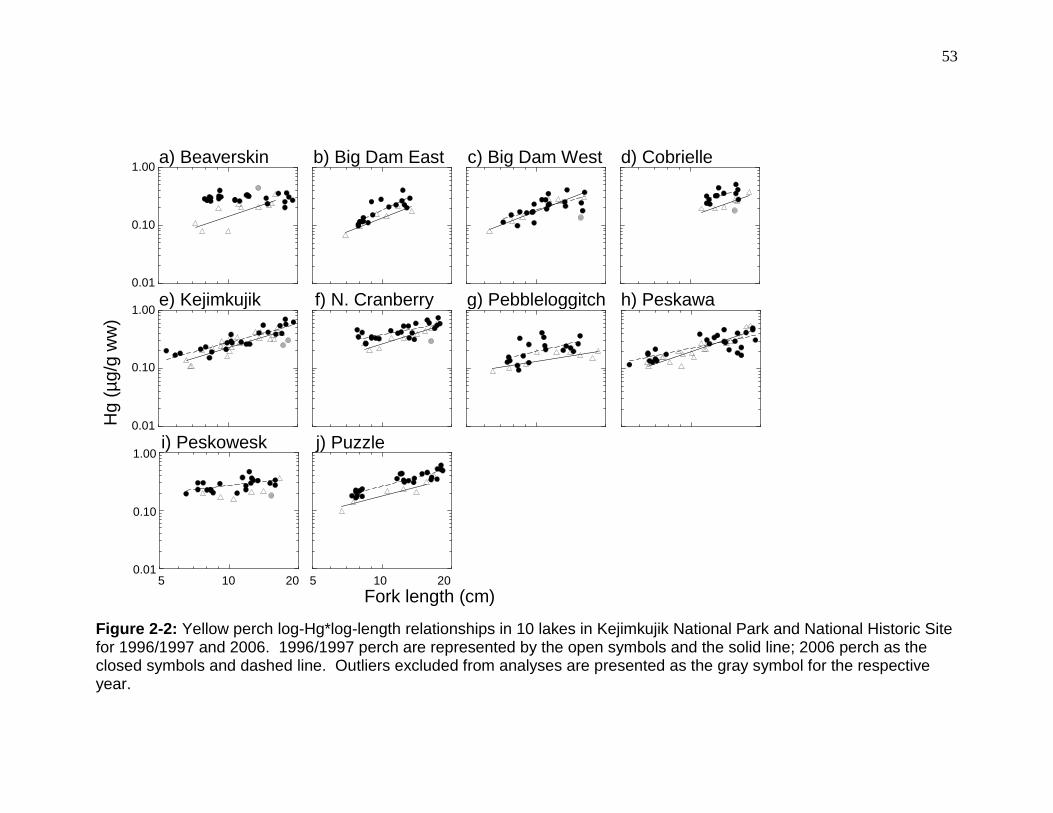
53
Figure 2-2: Yellow perch log-Hg*log-length relationships in 10 lakes in Kejimkujik National Park and National Historic Site for 1996/1997 and 2006. 1996/1997 perch are represented by the open symbols and the solid line; 2006 perch as the closed symbols and dashed line. Outliers excluded from analyses are presented as the gray symbol for the respective year.
0.01
0.10
1.00
a) Beaverskin b) Big Dam East c) Big Dam West
i) Peskowesk j) Puzzle
0.01
0.10
1.00
0.01
0.10
1.00 f) N. Cranberry e) Kejimkujik h) Peskawa g) Pebbleloggitch
Fork length (cm)
Hg
(µ
g/g
ww
)
d) Cobrielle
5 10 20 10 5 20
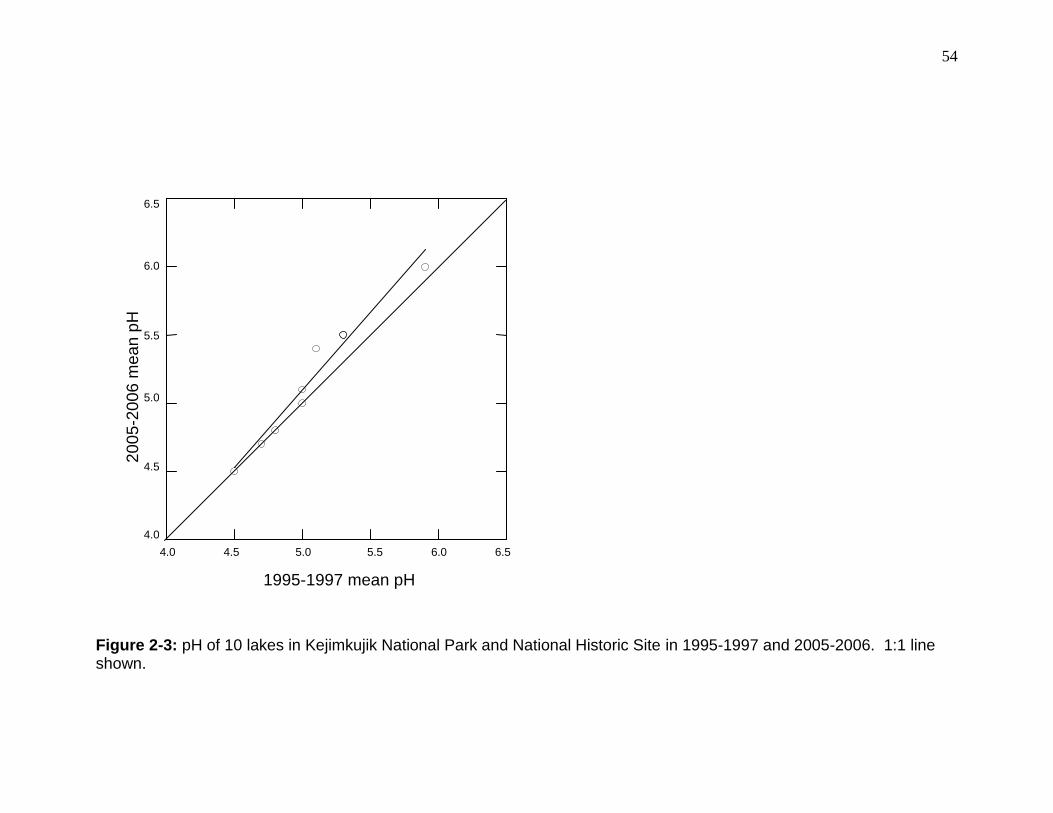
54
Figure 2-3: pH of 10 lakes in Kejimkujik National Park and National Historic Site in 1995-1997 and 2005-2006. 1:1 line shown.
4.0 4.5 5.0 5.5 6.0 6.5
1995-1997 mean pH
4.0
4.5
5.0
5.5
6.0
6.5
20
05
-20
06
mea
n p
H

55
Figure 2-4: Mean (±SD) Hg concentration in 12-cm yellow perch in 10 lakes in Kejimkujik National Park and National Historic Site, Nova Scotia. Grey bars represent 1996 concentrations; black bars represent 2006 concentrations. Lower dashed line is 0.21 µg/g ww and upper dashed line is 0.41 µg/g ww, the thresholds where reproduction in common loons is reduced 50 and 100%, respectively.

56
3 Mercury bioaccumulation in the acidic lakes of Kejimkujik
National Park and National Historic Site, Nova Scotia
3.1 Abstract
Mercury (Hg) concentrations in fish from acidic lakes (pH < 6.0) are
typically elevated above those from circumneutral systems. It is unknown
whether high Hg bioaccumulation rates through food webs can explain the
elevated Hg concentrations in top predators from low pH lakes. Hg
concentrations increase up food webs and are highly correlated with trophic
position (TP, as determined by stable nitrogen isotopes; 15N); the slope of the
Hg-15N regression can be used to quantify bioaccumulation of this pollutant in
lakes. In this study, log Hg-15N slopes and food web structures of 4 acidic lakes
(pH 4.5 – 5.5) in Kejimkujik National Park and National Historic Site (KNPNHS),
Nova Scotia were examined to determine whether atypical Hg bioaccumulation
occurs in low pH systems and explains the elevated Hg concentrations in the
predatory fish, yellow perch (Perca flavescens). Littoral, pelagic, and profundal
invertebrates and yellow perch, golden shiner (Notemigonus crysoleucas), and
banded killifish (Fundulus diaphanus) were captured in 2006 from each lake and
analysed for MeHg (invertebrates) or total Hg (fish). Hg bioaccumulation rates
varied significantly among the 4 KNPNHS lakes, but the log Hg-15N slopes were
within the range published for circumneutral lakes. Hg bioaccumulation rates
appear to be consistent across systems regardless of their physical, chemical,
and biological characteristics. In contrast, MeHg contamination of lower trophic
57
organisms was significantly higher in lakes with high Hg concentrations in the
yellow perch. The elevated MeHg concentrations in lower trophic organisms in
the KNPNHS food webs help to explain the high Hg concentrations reported in
fish and loons from these lakes.
3.2 Introduction
The organic form of mercury (Hg), methyl mercury (MeHg),
bioaccumulates up aquatic food webs to concentrations that can produce toxic
and sub-lethal reproductive and behavioural effects in predatory fish and their
consumers (Burgess 2005, Burgess and Meyer 2007). MeHg accumulates in
protein structures and is transferred from prey to predator with greater efficiency
than inorganic Hg (Rabenstein and Evans 1978, Hintelmann et al. 1995, Watras
et al. 1998). At lower trophic levels, aquatic invertebrates have between 3 and
100% of their total Hg (THg) occurring as MeHg, whereas the proportion of MeHg
in fish consistently exceeds 75% because of the biomagnification of this pollutant
through the food web (Becker and Bigham 1995, Tremblay et al. 1996a, Watras
et al. 1998, Fournier et al. 2002). Hg concentrations in aquatic biota vary widely
among lakes and are influenced by factors including their trophic level, size, age,
and habitat use, and aquatic pH and dissolved organic carbon (DOC)
concentrations (Bodaly et al. 1993, Chen et al. 2005, Drysdale et al. 2005,
Kamman et al. 2005). It is unknown, however, whether differences in Hg
concentrations of top predators among lakes are due to differences in Hg
bioaccumulation rates in the supporting food webs.

58
Analysis of stable isotope ratios of carbon and nitrogen are useful tools to
measure use of different energy sources and trophic positioning, respectively,
because an animal’s isotopic content reflects the isotopic ratio of its diet (Deniro
and Epstein 1978, Minagawa and Wada 1984, Peterson and Fry 1987, Cabana
and Rasmussen 1994). Chemical and physical fractionation results in the
accumulation of the heavier isotope within the organism. The carbon (13C)
isotope fractionates slightly [0.4 ± 1.3‰; (Deniro and Epstein 1978)] between
prey and predator and can be traced back to primary producers at the base of
the food web [on a site-by-site basis; (Doucett et al. 1996, Vander Zanden and
Rasmussen 1999)]. In contrast, the heavier isotope of nitrogen (15N) increases
an average of 3.4 parts per thousand (‰) with each trophic transfer, providing a
means by which relative position within the food web can be determined
(Minagawa and Wada 1984). Because both 15N and Hg increase through the
food web, the slope of the relationship between Hg and 15N can be used to
quantify Hg bioaccumulation (Kidd et al. 1995). Indeed, several studies have
found significant relationships between Hg concentrations in organisms and their
15N, demonstrating that Hg bioaccumulation can be quantified through the food
web using stable isotope analyses (Cabana and Rasmussen 1994, Kidd et al.
1995, McIntyre and Beauchamp 2007).
Hg concentrations in aquatic predators tend to be significantly higher in
acidic systems than in circumneutral ones (Watras et al. 1998, Kamman et al.
2005), and previous studies have not entirely explained the cause(s) for this
variation (Kamman et al. 2005). As such, one objective of this study was to

59
examine factors affecting Hg in yellow perch from acidic lakes, including food
web structure, trophic level, bioaccumulation rates (using Hg versus 15N), and
Hg at the base of the food web. The second objective was to compare the Hg
versus 15N relationships found in 4 acidic lakes to those in the literature for
circumneutral systems to determine whether elevated Hg concentrations in top
predators from acidic systems were due to higher bioaccumulation of Hg through
these food webs.
3.3 Methods
3.3.1 Study site
Kejimkujik National Park and National Historic Site (KNPNHS) is located in
southwestern Nova Scotia, Canada (Figure 3-1). It is remote from point sources
of pollutants but is downwind of major American and Canadian urban centres.
All lakes in the park are acidic [pH < 6; (O'Driscoll et al. 2005b)] because of poor
buffering capacity of the bedrock, abundance of bogs and fens, and the
atmospheric deposition of acidifying substances (Kerekes 1975a, Ginn et al.
2007). North American emissions of acidifying substances have declined, but
this has resulted in only slight improvements in the chemical conditions of these
lakes between 1983 and 2002 and very little biotic recovery between 1981 and
1997 (Jeffries et al. 1998, Clair et al. 2002, Doka et al. 2003). The four sites
chosen for the current study are small (33.4 – 41.8 ha) oligotrophic lakes that
60
have different water chemistry characteristics (e.g., pH 4.5 – 5.5) and fish
communities (Table 3-1).
3.3.2 Sample collection
Fish and aquatic invertebrates were collected from Beaverskin, North
Cranberry, Pebbleloggitch, and Puzzle lakes in 2006. Pelagic, profundal, and
littoral invertebrates were sampled in May, July, and August with Wisconsin nets
(153 µm), Ekman dredges, and sweep nets, respectively. Nine yellow perch
(Perca flavescens) from each of three size classes (5-10 cm, 10-15 cm, and 15-
23 cm), 15 golden shiner (Notemigonus crysoleucas), 15 banded killifish
(Fundulus diaphanous), and 10 brown bullhead (Ameiurus nebulosus) were
captured (when present) in August and September with fyke nets. To minimize
the impact of the study on this stressed ecosystem, non-lethal fish sampling was
used whenever possible. All fish handling procedures were approved by the
Animal Care Committee at the University of New Brunswick. Fish > 18 cm were
anaesthetized with clove oil, a dermal punch (4 mm) was used to remove three
samples of dorsal muscle (0.034 – 0.164 g each), the wound was closed with
VetBond, and the fish was allowed to recover before being released into the lake
(Baker et al. 2004). Small-bodied fish (< 18 cm) were sampled lethally. Weight
(0.01 g) and fork length (1 mm) were measured for all fish, and scales were
obtained from each perch for ageing. Fish condition was calculated as 100 *
weight / length3. Immediately after collection, invertebrates were live-sorted to
61
the major taxa (except zooplankton), and all organisms were frozen for further
analysis.
Water chemistry parameters were obtained for each lake to evaluate their
influence on Hg bioaccumulation. Environment Canada (EC) collected a single
surface water sample from each lake in spring and fall 2006. All samples were
analysed for nitrate, sulfate, pH, alkalinity, conductivity, total phosphorous, total
mercury, total nitrogen, and DOC concentrations at the EC Laboratory, Moncton,
New Brunswick according to the protocols of Vaidya et al (2000). Dissolved
parameters were measured in 0.45 µm filtrate. Triplicate surface water samples
were collected for chlorophyll a analysis in spring 2007. Water was concentrated
onto 1.2 µm GF/C filters then chlorophyll concentrations were measured
fluorometrically at Acadia University, Wolfville, Nova Scotia. Water chemistry
parameters are listed for the four lakes in Table 3-1.
In the laboratory, fish and invertebrate samples were prepared for stable
isotope and Hg analyses. Macroinvertebrate samples were thawed and
identified to the lowest possible taxa using Merritt and Cummins (1996), Thorp
and Covich (2001), and Needham and Westfall (1955), and removed from their
cases when present. Petri dishes and forceps were soaked in a 5% HCl bath
between samples. Only taxa where enough biomass (> 50 mg dry weight) was
collected for each sampling date at each lake were processed for isotopes and
MeHg. Skinless fillet samples were dissected from the dorsal muscle of the fish.
Composite macroinvertebrate samples (n > 2 individuals; one sample/date), bulk
zooplankton (3 samples/date for stable isotope analysis; pooled to 1/date for

62
MeHg), individual fish muscle (fillet or dermal punch), and whole bodied fish were
freeze-dried and then homogenized with a pre-cleaned mortar and pestle, coffee
grinder, or blender depending on the size of the sample. Tools were washed
with soapy water and rinsed with excess amounts of distilled water to minimize
cross-sample contamination. Fish samples were weighed before and after
freeze drying to obtain moisture content.
3.3.3 Stable isotope analyses
Composite invertebrate samples and individual fish fillets or dermal
punches were analyzed for 13C and 15N on a Thermo Finnigan DeltaPlus isotope
ratio mass spectrometer at the Stable Isotopes in Nature Laboratory at the
University of New Brunswick (UNB), Fredericton. Isotope ratios are reported in
delta notation, calculated as:
13C or 15N (‰) = [(Rsample/ Rstandard) - 1] x 1000,
where R represents the ratio of the heavy to light isotope (i.e. 13C/12C or 15N/14N).
The global standard is PeeDee belemnite for 13C and atmospheric nitrogen for
15N; laboratory isotopic standards were sucrose (CH6, International Atomic
Energy Agency; 13C = -10.4‰) and ammonium sulfate (N2, International Atomic
Energy Agency; 15N = 20.3‰). Measurements were highly accurate, with
absolute deviation from the accepted values of less than 0.1‰ (n = 10 for each
standard). Replicate analysis of every 10th sample revealed that precision was
within 0.1 ‰ (one SD; n = 51).

63
3.3.4 Mercury analyses
Sub-samples of fish dermal punches, fillets, or whole bodies were
analyzed for total Hg using atomic absorption spectrometry on a Milestone DMA-
80 Direct Mercury Analyzer at UNB. Quality assurance and control included an
inter-laboratory comparison of 30 yellow perch and 20 golden shiner whole-body
samples with the National Wildlife Research Centre of Environment Canada
(NWRC; atomic absorption spectrometry) in Ottawa and analysis of standard
reference materials (SRM), blanks, replicates, and a working lab standard (1
yellow perch sample) within each analytical run. SRM recoveries at UNB
(DORM-2, dogfish muscle, National Research Council of Canada, NRCC) were
94.6 2.0% (range 90.3 – 101.2%, n = 60) and 111.3 7.0% (range unavailable,
n = 8) at NWRC (DOLT-3, dogfish liver, NRCC; Oyster Tissue 1566 b, National
Institute of Standards and Technology). Precision of the within-lab standard at
UNB was 11.8% (n = 16) while samples run in triplicate had precision within
13.5% (n = 85). Precision at NWRC was within 5.9% (n = 10). Blanks at UNB
were never more than 1.6% of the respective sample values; therefore the values
presented herein were not corrected for blank values. Blank results were not
available from NWRC. Of the fifty samples analysed at both labs, yellow perch
Hg results were highly correlated between labs (slope = 0.95, r2 = 0.95, p <
0.001, n = 31), while golden shiner Hg had a weaker correlation (slope = 0.82, r2
= 0.59, p = 0.02, n = 19). Only data acquired from UNB were used in the
subsequent analyses as this would reduce the error associated with converting
64
NWRC results to UNB-equivalent values. Data are presented as dry weight (dw)
concentrations unless otherwise stated.
MeHg analyses were performed at 3 laboratories: NWRC, Flett Research
Ltd (Winnipeg, MB), and the University of Ottawa (U Ottawa). Thirty yellow perch
and 20 golden shiner representing a range of THg concentrations were sent to
NWRC for organic Hg analysis. These samples were extracted into toluene as
methyl mercuric bromide, the bromide complex was partitioned into the aqueous
phase, then the organic content of the aqueous extract was analysed by atomic
absorption spectrometry (MET-CHEM-AA-04E). Low mass invertebrate samples
(< 30 mg, n = 20) were analysed by fluorescence following EPA method 1630 at
Flett Research Ltd. All other invertebrate samples (mass > 30 mg, n = 50) were
extracted at UNB and then analysed for MeHg content at U Ottawa. Samples
were digested with KOH, partitioned into acidic KBr/CuSO4, then the extract was
separated by gas chromatography (GC) and the organic Hg content was
determined by atomic fluorescence spectrometry (Cai et al. 1997). SRM
recoveries were 94.3 5.7% (DORM-2 and DOLT-3, n = 9) at NWRC. Within-
run DORM-2 recoveries were 88.2 and 94.6% (n = 2) at Flett Research, and
106.9 10.9 and 97.8 5.5% at U Ottawa. Precision of samples was within
15.3% (n = 8) at NWRC, 7.3% (n = 10) at Flett Research, and 15.6% (n = 29) at
U Ottawa.

65
3.3.5 Data transformations
Dermal punches were obtained from 13 yellow perch that were longer
than 18cm, and their stable isotope ratios and Hg concentrations needed to be
converted into values comparable to the rest of the data set. Using data from the
calibration study (see Chapter 2), fillet and dermal punch 15N or 13C were
regressed and produced highly significant relationships. Subsequently, the
stable isotope ratios of the punches were converted into fillet equivalent ratios
according to the following equations:
Fillet-equivalent 15N = 0.94 x Dermal punch 15N; r2 = 0.895; p < 0.001, n
= 21
Fillet-equivalent 13C = 1.015 x Dermal punch 13C; r2 = 0.996; p < 0.001,
n = 21
Stable isotope ratios were corrected for variations in baseline 15N and
lipid content before comparisons among species and between lakes. Because
fish relied mainly on littoral carbon (see Results), a littoral primary consumer
(caddisfly, Family Limnephilidae) common to all lakes was chosen to adjust the
15N of the other food web organisms. The Limnephilidae had significantly
(ANOVA, p < 0.05) different 15N ratios among the lakes, with means ranging
from 0.82 ± 0.11 (n = 3) in Pebbleloggitch to 2.27 ± 0.20‰ (n = 3) in Puzzle.
Baseline 15N corrections and trophic position (TP) calculations were: (15Nsample
– 15Nlimnephilid)/3.4 + 2 (Cabana and Rasmussen 1996). TP data were used for
all inter-lake comparisons of trophic position. Analysis of food web structures
66
was based on raw 13C data. The C:N ratios (a surrogate of lipid content) were
significantly (ANOVA, p < 0.05) different among the species within each lake;
therefore, the 13C data were mathematically corrected for lipid content before
habitat usage was compared:
13Clipid = 3.32 + 0.99 x C:N (Post et al. 2007).
The IsoError mixing model (Phillips and Gregg 2001) was then used to estimate
the proportion of carbon derived from the littoral (compared to pelagic carbon)
habitat used by each fish species. The data were not corrected for diet-tissue
fractionation of 13C. Zooplankton were the pelagic endmember and the mean of
all littoral invertebrates was used as the littoral endmember. Values exceeding
100% were treated as 100%.
Hg concentrations of the 13 dermal punch samples were converted into
whole body equivalent concentrations to facilitate comparisons with the rest of
the dataset. Regression analyses of the Hg concentrations in yellow perch whole
bodies and dermal punches (calibration study, see Chapter 2) produced the
following equation that was used for the conversion:
Whole-body equivalent [THg dw] = 0.57 x dermal punch [THg dw]; r2 =
0.920; p < 0.001, n = 21
To compare differences in bioaccumulation slopes when using either
MeHg or THg for fish, THg were converted to MeHg as follows after correction for
SRM recoveries. Six of 27 yellow perch and 5 of 15 golden shiner caught in
each lake (except at Pebbleloggitch because golden shiner do not occur there)

67
were analysed for both THg and MeHg. Regression coefficients could not be
used to convert the data from THg to MeHg because the relationship between
MeHg (measured at NWRC) and THg (measured at UNB) was highly significant
(GLM, p < 0.0001, r2 = 0.89, n = 30) for yellow perch, but not significant (GLM, p
= 0.056, r2 = 0.48, n = 8) for golden shiner. Instead, the mean percentage of THg
present as MeHg for each species within each lake (see Table 3-3) was used.
Banded killifish were not analysed for MeHg and were assumed to have the
same %MeHg as the golden shiner. Yellow perch, golden shiner, and banded
killifish THg (and therefore MeHg) data were corrected for 94.6% recovery
(UNB), and invertebrate samples were corrected to the within-run recoveries at
Flett Laboratories or at U Ottawa. Unless otherwise stated, all results are
presented as the corrected values.
Previous investigations of Hg bioaccumulation rates through food webs
have used MeHg or THg in fish and Hg concentrations in either wet or dry
weights. For the current study, different methods of calculating Hg
bioaccumulation rates were evaluated prior to comparing the results among
lakes. Two types of Hg data (THgfish or MeHgfish; dry weight vs wet weight) were
contrasted to examine their impact on Hg bioaccumulation rates (slope of log Hg
- 15N regression). Previous work has shown that THg concentrations in fish are
> 75% MeHg, and often > 90% in predaceous fish (Watras et al. 1998); therefore
some of the previous work on Hg bioaccumulation measured MeHgfish directly
(Bowles et al. 2001, McIntyre and Beauchamp 2007), whereas others assumed
that THg approximated the MeHg concentrations (Atwell et al. 1998, Kidd et al.
68
2003). THgfish used in the current calculations were measured directly while the
MeHg concentrations were calculated using MeHg:THg ratios for yellow perch
and golden shiner. Hg bioaccumulation rates were also tested for the effect of
using dry versus wet weight concentrations. Some studies reported Hg
bioaccumulation rates using wet weights (Kidd et al. 2003, McIntyre and
Beauchamp 2007), while others used dry weights (Atwell et al. 1998). For the
current study, % moisture was measured in the fish but not in the invertebrates;
invertebrate wet weight Hg concentrations were calculated assuming 80% water
content (Hall et al. 1998).
Prior to any statistical analyses, data were inspected for normality and
homoscedasticity using Kolmogorov-Smirnov’s test and F-ratios, respectively.
Fish lengths and weights, and all Hg data were log-transformed to approximate
the normal distribution. Outliers were identified as those with studentized
residuals exceeding an absolute value of 3.0.
3.3.6 Data analysis
Log lengths, log weights, ages, trophic positions and log Hg of all
organisms were compared among the lakes using analysis of variance (ANOVA)
and Tukey’s multiple comparison tests for each species. Condition of each fish
species was compared among lakes using analysis of covariance (ANCOVA)
with length as the dependent variable, weight as the independent, and lake as
the categorical variable. Normally, among-lake comparisons of fish Hg should be
done using ANCOVA, with length, weight, or age as a covariate. This technique

69
could not be used for the banded killifish, golden shiner, or the yellow perch in
Beaverskin Lake because none of these parameters were significantly (GLM, p >
0.12) related to Hg.
Linear regression analyses of log Hg and 15N were used to calculate food
web bioaccumulation rates (slopes). Regression slopes were compared among
lakes and for dry versus wet weight or THgfish versus MeHgfish within lakes using
ANCOVA with log Hg as the dependent variable and 15N as covariate. Alpha
was corrected for multiple pairwise analyses of ANCOVA interactions using the
Bonferroni correction; with 10 possible analyses, the corrected alpha was
reduced to 0.005 (0.05 / 10). When the slopes were not significantly different,
the intercepts were compared using a Tukey’s multiple comparison test.
In each lake, log Hg concentrations of each fish species were regressed
against the log length, log weight, condition, age (perch only), or 15N of that
species to determine the effects of these factors on fish Hg concentrations.
Stepwise linear regressions were used to determine the importance of log length,
age, 15N, and 13C in determining Hg concentrations in yellow perch.
Differences in length-at-age of perch among lakes were evaluated from the
significance of the intercepts of ANCOVA, with length as the dependent factor,
age as covariate, and lake as the grouping variable. All analyses were
performed on SYSTAT 10 for Windows with α = 0.05. All results are presented
as mean ± standard deviation (SD) unless stated otherwise.
70
3.4 Results4
3.4.1 Food web structure
All four lakes in KNPNHS had similar food web structures with respect to
the use and flow of carbon (Figures 3-2 – 3-5). The pelagic and profundal
invertebrates consistently had depleted 13C in each lake when compared to the
littoral macroinvertebrates (Figures 3-2 – 3-5). Although 13C of the chironomids
was more depleted than in the other lakes, results from North Cranberry Lake are
representative of the carbon flow in all lakes; mean 13C of the littoral
macroinvertebrates were more enriched and ranged from -31.64 ± 1.48
(Limnephilidae) to -28.54 ± 0.25‰ (Heptageniidae; Figure 3-3, Table 3-2), and
zooplankton and profundal chironomids had more depleted means of -35.20 ±
1.53 and -39.53 ± 1.01‰, respectively. In all lakes, mean 13C of fishes were
also enriched and similar to the values observed for littoral invertebrates,
indicating that they fed mainly on littoral carbon sources (Figures 3-2 – 3-5, Table
3-4). Golden shiner and 5-10 cm yellow perch typically had the most depleted
13C, with means ranging from -30.26 ± 0.71 to -28.80 ± 1.39‰ for golden shiner
in North Cranberry and Puzzle, respectively (Table 3-4) and -29.32 ± 1.84 to -
28.06 ± 0.42 ‰ for small perch in Pebbleloggitch and Beaverskin, respectively.
Littoral carbon use by golden shiner ranged between 46.79 ± 9.80 and 100% in
Beaverskin and Puzzle, respectively (Table 3-4). Other fishes in Beaverskin and
Pebbleloggitch Lakes consumed more than 85% of their carbon from in the
4 Raw data are provided in Appendix 1

71
littoral zone, while all yellow perch and banded killifish in North Cranberry and
Puzzle Lakes relied 100% on littoral carbon (Table 3-2).
The 15N data indicated distinct trophic levels in these four lakes of
KNPNHS. Limnephilids and heptagenids typically had the lowest mean 15N
(e.g. 1.45 ± 0.43 and 2.26 ±0.78‰, respectively, in North Cranberry), illustrating
that that these invertebrates were primary consumers (Table 3-2, Figures 3-2 –
3-5). The dragonfly nymph, Aeshna umbrosa, had the highest 15N of the
invertebrates (e.g. 4.32 ± 0.12 in North Cranberry; Figures 3-2 – 3-5), which was
between 2 and 3‰ higher than that of the limnephilids and heptagenids,
suggesting that this invertebrate preys upon other invertebrates. All fish in these
lakes had 15N values that were 3 - 6‰ higher than the littoral invertebrates,
suggesting that most fishes were insectivorous or omnivorous, relying either
partially or completely on near-shore invertebrates. In particular, this degree of
enrichment suggests that fish were likely feeding on the most 15N enriched littoral
macroinvertebrates (e.g. Aeshna umbrosa). Fish in each lake had similar 15N
(Table 3-4; Figures 3-2 – 3-5). The large yellow perch were typically more
enriched than the smaller individuals, but the mean 15N of yellow perch was not
related to the diversity or type of fishes present. The invertebrates and fishes in
North Cranberry Lake had the highest 15N, while those in Pebbleloggitch had
the lowest 15N; the differences among lakes were reduced when the data were
adjusted for baseline 15N (Table 3-3 and 3-4).
72
3.4.2 Hg concentrations and influential factors
MeHg concentrations increased by a factor of 3 to 8 between the least and
most contaminated invertebrates within each lake, i.e. from the limnephilids to
the aeshnids (Table 3-2). Mean MeHg of limnephilids, chironomids, and
aeshnids were significantly (ANOVA, p < 0.03) higher in Puzzle and North
Cranberry than in Pebbleloggitch and Beaverskin lakes. There were no
differences among lakes for each of the other invertebrate families (p > 0.19).
Within each lake, 13C among the littoral macroinvertebrates did not explain a
significant (GLM, p > 0.13) proportion of the variation in their MeHg
concentrations. In contrast, macroinvertebrate 15N accounted for more than
31.4% of the variation in MeHg concentrations within each of the 4 lakes (GLM, p
< 0.02).
Hg concentrations in golden shiner were significantly (ANOVA, p < 0.02)
higher in North Cranberry (1.81 ± 0.67 µg/g) than in either Beaverskin (1.00 ±
0.43 µg/g) or Puzzle (0.95 ± 0.23 µg/g; Table 3-3) lakes. Golden shiner from
North Cranberry were significantly (ANOVA, p < 0.012) shorter and lighter than
those from Puzzle Lake (7.4 ± 0.6 versus 9.0 ± 1.7 cm; 4.22 ± 1.05 versus 9.05 ±
6.22 g; Table 3-3), although condition factors were significantly (p < 0.03) higher
in Beaverskin than the other 2 lakes. In Beaverskin and North Cranberry Lakes,
shiner had lower littoral carbon usage (46.79 ± 9.80 and 61.97 ± 7.12%,
respectively; Table 3-4) and significantly (p = 0.02) higher trophic positions (3.91
± 0.07 and 3.83 ± 0.09, respectively) than shiner in Puzzle Lake (100% and 3.48
± 0.11 levels, respectively). Overall, the shiner in Puzzle were longer and
73
heavier, had more littoral carbon in their diet and lower trophic positions, and had
the lowest Hg concentrations of all the lakes (Table 3-4). Within lakes, only
golden shiner in Beaverskin Lake had Hg concentrations that were significantly
(GLM, p < 0.03, r2 > 0.90) positively predicted by length or weight. 15N was
significantly (GLM, p = 0.002, r2 = 0.53) positively related to length for the golden
shiner from Beaverskin but negatively related for the same species from Puzzle
Lake (GLM, p = 0.006, r2 = 0.45).
Banded killifish in Beaverskin and North Cranberry Lakes had mean Hg
concentrations of 1.86 ± 0.65 and 1.65 ± 0.57 µg/g (Table 3-3), respectively,
which were significantly (ANOVA, p < 0.01) higher than the mean concentration
in the killifish from Puzzle Lake (0.81 ± 0.19 µg/g). Lengths of the banded killifish
were significantly (ANOVA, p < 0.01) different in all three lakes where they
occurred, with North Cranberry (7.2 ± 0.7 cm) < Puzzle (7.8 ± 0.5 cm) <
Beaverskin (8.6 ± 0.7 cm; Table 3-3). Weights were similar (p = 0.07) between
Puzzle and North Cranberry (3.83 ± 0.73 and 3.18 ± 0.92 g), and significantly (p
< 0.005) lower than in Beaverskin (5.16 ± 1.20 g). Mean condition of killifish was
similar among the lakes (ANCOVA intercept, p > 0.09), and trophic positions of
the killifish in North Cranberry and Beaverskin were significantly (p < 0.001)
higher than in Puzzle Lakes. Littoral carbon use was lowest in killifish from
Beaverskin (84.74 ± 6.56%), while those from North Cranberry and Puzzle relied
completely on littoral carbon (Table 3-4). Thus, similar to the golden shiner,
killifish Hg concentrations across lakes were elevated in short, light fish that were
trophically elevated. Killifish in Beaverskin had a significant (GLM, p = 0.039, r2 =
74
0.697) positive Hg - log weight relationship, and trophic position explained
between 66.6% (North Cranberry) and 86.4% (Puzzle; p < 0.05) of the variation
in Hg concentrations within each lake (GLM, p < 0.01). 15N was also positively
related to length for the killifish from Beaverskin (p = 0.003, r2 = 0.51) and Puzzle
(p = 0.002, r2 = 0.55) Lakes.
Mean Hg concentrations of yellow perch were highest at North Cranberry
(2.16 ± 1.27 µg/g), moderate at Beaverskin and Puzzle (1.29 ± 0.41 and 1.49 ±
0.55 µg/g, respectively), and lowest at Pebbleloggitch (0.96 ± 0.35 µg/g; ANOVA,
p < 0.03 among low, medium, and high groups; Table 3-3). No significant
differences were found among lakes in mean log-length (p = 0.88), log-weight (p
= 0.86), age (p = 0.19), or growth rate (ANCOVA interaction, p = 0.13) of yellow
perch (Table 3-3), but length-at-age was significantly greater (ANCOVA intercept,
p < 0.001) in Beaverskin and Pebbleloggitch compared to the other lakes.
Differences in mean condition could not be compared among lakes because of a
significant interaction in the ANCOVA (p = 0.009). Mean trophic positions of
perch in Beaverskin and North Cranberry (4.06 ± 0.10 and 4.04 ± 0.18,
respectively) were significantly (ANOVA, p < 0.001) higher than perch in
Pebbleloggitch (3.77 ± 0.17), which was also higher than the same species from
Puzzle (3.57 ± 0.15) Lake.
In contrast to the other species, log Hg concentrations of yellow perch
within each lake were significantly related to their log lengths and log weights.
Simple linear regressions indicated that log length, log weight, or 15N
significantly (GLM, p < 0.04) predicted between 15.1 and 81.2% of the variation
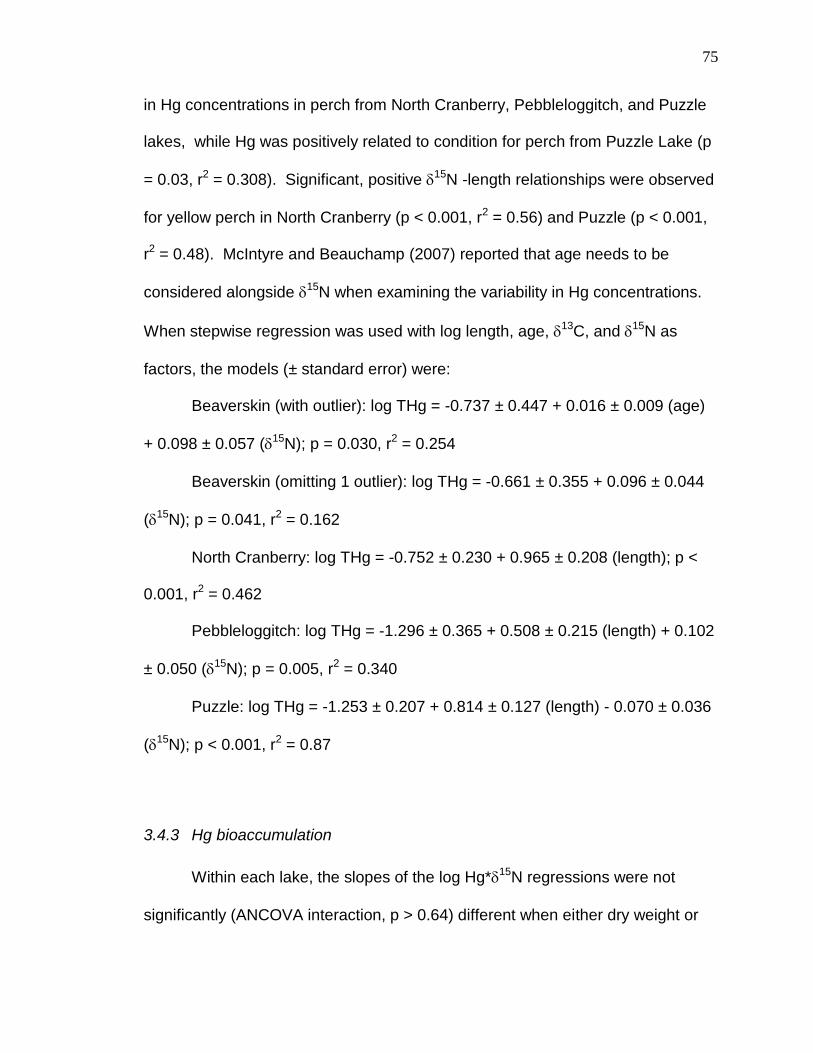
75
in Hg concentrations in perch from North Cranberry, Pebbleloggitch, and Puzzle
lakes, while Hg was positively related to condition for perch from Puzzle Lake (p
= 0.03, r2 = 0.308). Significant, positive 15N -length relationships were observed
for yellow perch in North Cranberry (p < 0.001, r2 = 0.56) and Puzzle (p < 0.001,
r2 = 0.48). McIntyre and Beauchamp (2007) reported that age needs to be
considered alongside 15N when examining the variability in Hg concentrations.
When stepwise regression was used with log length, age, 13C, and 15N as
factors, the models (± standard error) were:
Beaverskin (with outlier): log THg = -0.737 ± 0.447 + 0.016 ± 0.009 (age)
+ 0.098 ± 0.057 (15N); p = 0.030, r2 = 0.254
Beaverskin (omitting 1 outlier): log THg = -0.661 ± 0.355 + 0.096 ± 0.044
(15N); p = 0.041, r2 = 0.162
North Cranberry: log THg = -0.752 ± 0.230 + 0.965 ± 0.208 (length); p <
0.001, r2 = 0.462
Pebbleloggitch: log THg = -1.296 ± 0.365 + 0.508 ± 0.215 (length) + 0.102
± 0.050 (15N); p = 0.005, r2 = 0.340
Puzzle: log THg = -1.253 ± 0.207 + 0.814 ± 0.127 (length) - 0.070 ± 0.036
(15N); p < 0.001, r2 = 0.87
3.4.3 Hg bioaccumulation
Within each lake, the slopes of the log Hg*15N regressions were not
significantly (ANCOVA interaction, p > 0.64) different when either dry weight or
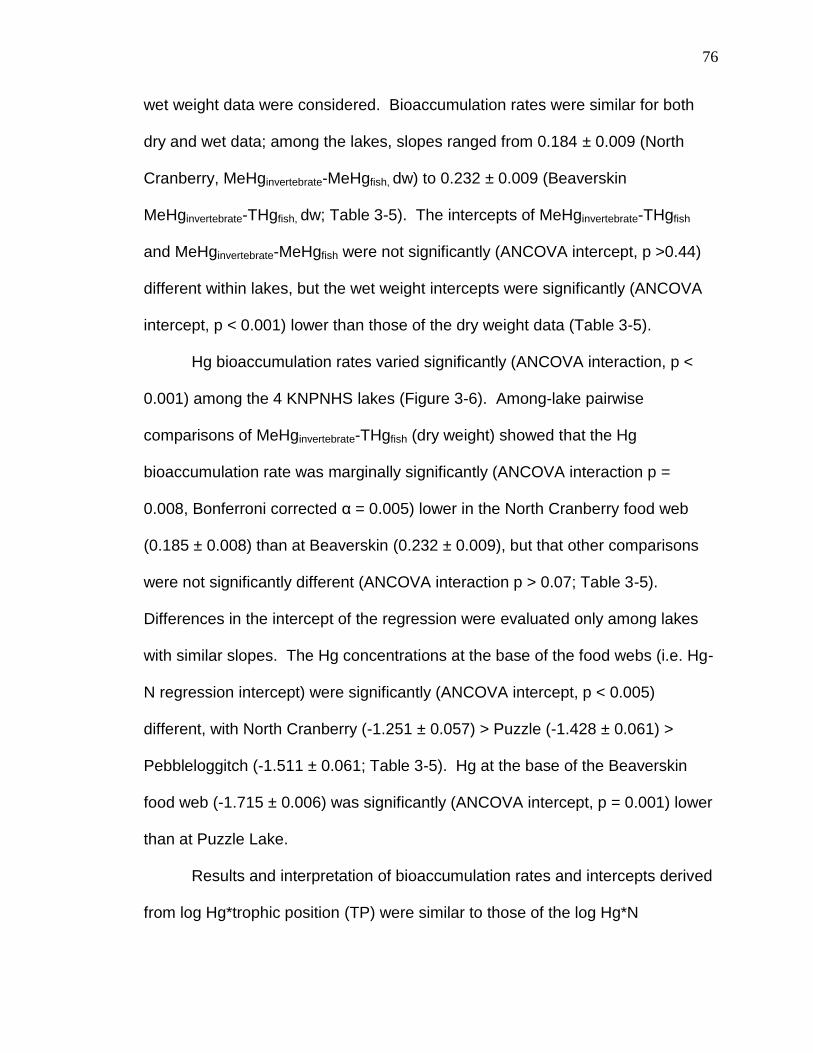
76
wet weight data were considered. Bioaccumulation rates were similar for both
dry and wet data; among the lakes, slopes ranged from 0.184 ± 0.009 (North
Cranberry, MeHginvertebrate-MeHgfish, dw) to 0.232 ± 0.009 (Beaverskin
MeHginvertebrate-THgfish, dw; Table 3-5). The intercepts of MeHginvertebrate-THgfish
and MeHginvertebrate-MeHgfish were not significantly (ANCOVA intercept, p >0.44)
different within lakes, but the wet weight intercepts were significantly (ANCOVA
intercept, p < 0.001) lower than those of the dry weight data (Table 3-5).
Hg bioaccumulation rates varied significantly (ANCOVA interaction, p <
0.001) among the 4 KNPNHS lakes (Figure 3-6). Among-lake pairwise
comparisons of MeHginvertebrate-THgfish (dry weight) showed that the Hg
bioaccumulation rate was marginally significantly (ANCOVA interaction p =
0.008, Bonferroni corrected α = 0.005) lower in the North Cranberry food web
(0.185 ± 0.008) than at Beaverskin (0.232 ± 0.009), but that other comparisons
were not significantly different (ANCOVA interaction p > 0.07; Table 3-5).
Differences in the intercept of the regression were evaluated only among lakes
with similar slopes. The Hg concentrations at the base of the food webs (i.e. Hg-
N regression intercept) were significantly (ANCOVA intercept, p < 0.005)
different, with North Cranberry (-1.251 ± 0.057) > Puzzle (-1.428 ± 0.061) >
Pebbleloggitch (-1.511 ± 0.061; Table 3-5). Hg at the base of the Beaverskin
food web (-1.715 ± 0.006) was significantly (ANCOVA intercept, p = 0.001) lower
than at Puzzle Lake.
Results and interpretation of bioaccumulation rates and intercepts derived
from log Hg*trophic position (TP) were similar to those of the log Hg*N
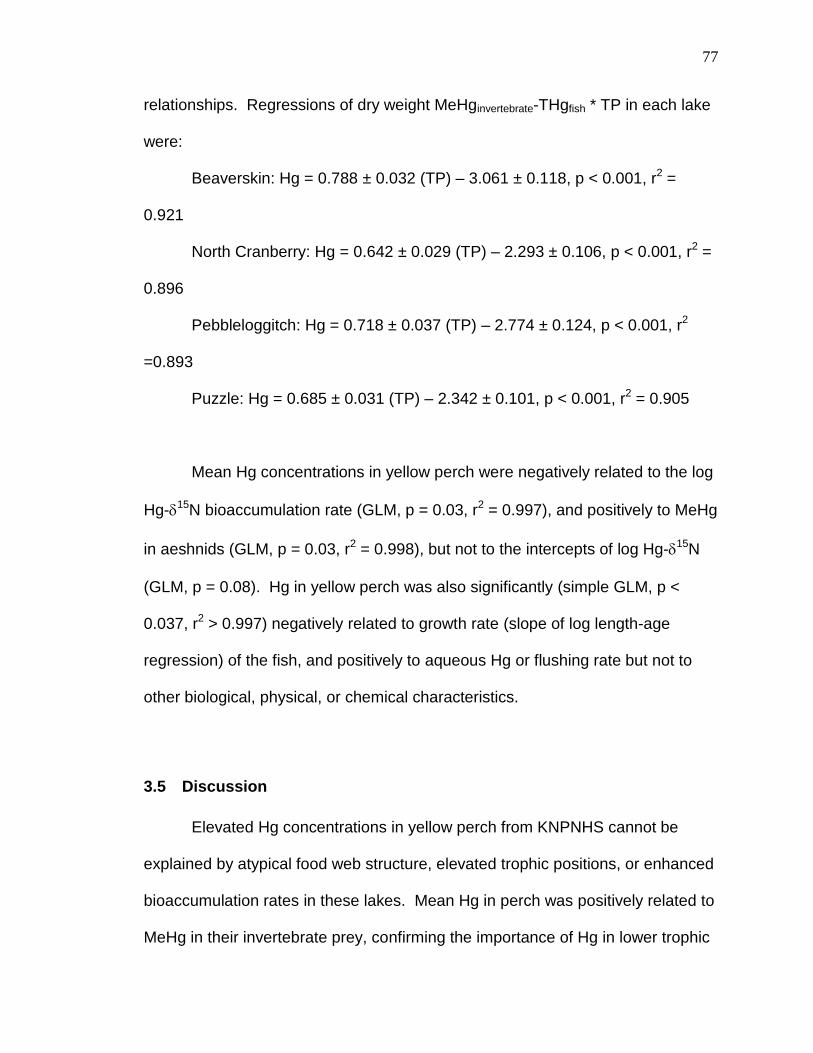
77
relationships. Regressions of dry weight MeHginvertebrate-THgfish * TP in each lake
were:
Beaverskin: Hg = 0.788 ± 0.032 (TP) – 3.061 ± 0.118, p < 0.001, r2 =
0.921
North Cranberry: Hg = 0.642 ± 0.029 (TP) – 2.293 ± 0.106, p < 0.001, r2 =
0.896
Pebbleloggitch: Hg = 0.718 ± 0.037 (TP) – 2.774 ± 0.124, p < 0.001, r2
=0.893
Puzzle: Hg = 0.685 ± 0.031 (TP) – 2.342 ± 0.101, p < 0.001, r2 = 0.905
Mean Hg concentrations in yellow perch were negatively related to the log
Hg-15N bioaccumulation rate (GLM, p = 0.03, r2 = 0.997), and positively to MeHg
in aeshnids (GLM, p = 0.03, r2 = 0.998), but not to the intercepts of log Hg-15N
(GLM, p = 0.08). Hg in yellow perch was also significantly (simple GLM, p <
0.037, r2 > 0.997) negatively related to growth rate (slope of log length-age
regression) of the fish, and positively to aqueous Hg or flushing rate but not to
other biological, physical, or chemical characteristics.
3.5 Discussion
Elevated Hg concentrations in yellow perch from KNPNHS cannot be
explained by atypical food web structure, elevated trophic positions, or enhanced
bioaccumulation rates in these lakes. Mean Hg in perch was positively related to
MeHg in their invertebrate prey, confirming the importance of Hg in lower trophic

78
organisms for predicting Hg in predators (Watras et al. 1998). Hg
bioaccumulation rates differed significantly among lakes at KNPNHS, but were
similar to bioaccumulation rates in habitats with different lake chemistries, fish
diversity, and climate (Atwell et al. 1998, Kidd et al. 2003).
3.5.1 Food web structure
Carbon use and dietary habits of invertebrates and fishes in the acidic
lakes in KNPNHS were similar to those reported in the literature. As expected,
13C of littoral macroinvertebrates was enriched while profundal and pelagic
invertebrates had depleted 13C, suggesting a distinct reliance of these
organisms on littoral or pelagic primary producers, respectively (Kidd et al. 1999).
Fishes from the KNPNHS lakes relied mainly on littoral carbon sources although
there were some minor deviations in dietary habits of species and size classes
from lake to lake. In accord with the findings from this study, banded killifish from
West Long Lake, NB had enriched 13C (approximately -26.8 to -24.0‰
compared to -35.5 to -31.8‰ in white sucker) while golden shiner from Trout
Lake, NB had depleted 13C (approximately -2‰ compared to the yellow perch;
Barry Hanson 2004). As we found for yellow perch at KNPNHS, the same
species in Ritchie Lake, Michigan also relied heavily on nearshore carbon
[approximately -24.0 to -25.5‰ for the fish; limnephilids and zooplankton had
13C of approximately -25.5 to -24.0 and -33.5 to -29.0‰, respectively (Gorski et
al. 2003)]. Although yellow perch inhabit open waters, they primarily eat littoral
macroinvertebrates and some small benthic fishes as is evidenced by gut content
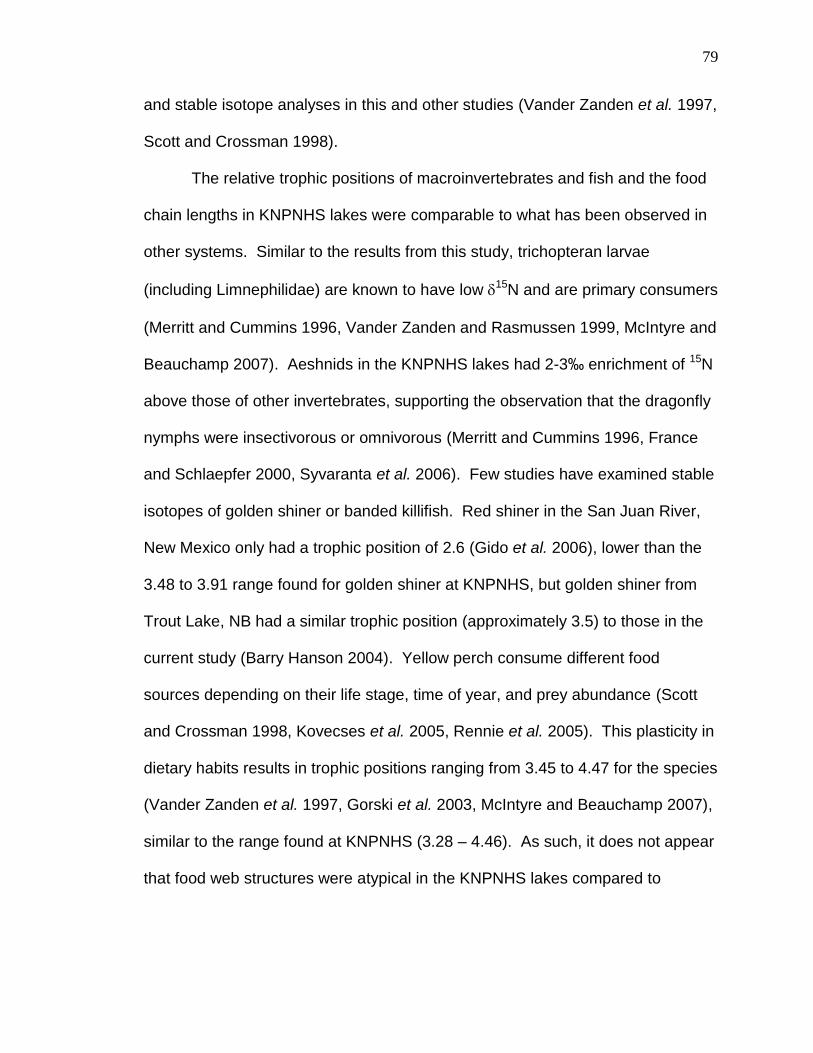
79
and stable isotope analyses in this and other studies (Vander Zanden et al. 1997,
Scott and Crossman 1998).
The relative trophic positions of macroinvertebrates and fish and the food
chain lengths in KNPNHS lakes were comparable to what has been observed in
other systems. Similar to the results from this study, trichopteran larvae
(including Limnephilidae) are known to have low 15N and are primary consumers
(Merritt and Cummins 1996, Vander Zanden and Rasmussen 1999, McIntyre and
Beauchamp 2007). Aeshnids in the KNPNHS lakes had 2-3‰ enrichment of 15N
above those of other invertebrates, supporting the observation that the dragonfly
nymphs were insectivorous or omnivorous (Merritt and Cummins 1996, France
and Schlaepfer 2000, Syvaranta et al. 2006). Few studies have examined stable
isotopes of golden shiner or banded killifish. Red shiner in the San Juan River,
New Mexico only had a trophic position of 2.6 (Gido et al. 2006), lower than the
3.48 to 3.91 range found for golden shiner at KNPNHS, but golden shiner from
Trout Lake, NB had a similar trophic position (approximately 3.5) to those in the
current study (Barry Hanson 2004). Yellow perch consume different food
sources depending on their life stage, time of year, and prey abundance (Scott
and Crossman 1998, Kovecses et al. 2005, Rennie et al. 2005). This plasticity in
dietary habits results in trophic positions ranging from 3.45 to 4.47 for the species
(Vander Zanden et al. 1997, Gorski et al. 2003, McIntyre and Beauchamp 2007),
similar to the range found at KNPNHS (3.28 – 4.46). As such, it does not appear
that food web structures were atypical in the KNPNHS lakes compared to

80
circumneutral ones, and they cannot explain the elevated Hg in yellow perch
from the region.
Dietary habits of fishes were similar across the lakes in KNPNHS. Golden
shiner and small yellow perch typically consume zooplankton and
macroinvertebrates (Scott and Crossman 1998), although littoral carbon use
calculated in the current study suggests that shiner in Beaverskin and North
Cranberry were more zooplanktivorous than those in the other KNPNHS lakes
(Table 3-2 and 3-4). By the end of the first summer yellow perch shift to diets
consisting of Odonates and other littoral invertebrates (Scott and Crossman
1998), and this is supported by the enriched 13C of larger perch in all KNPNHS
food webs. Trophic positions and 15N were similar among all size classes of
yellow perch in Beaverskin and Pebbleloggitch, but large yellow perch in North
Cranberry and Puzzle Lakes were trophically elevated, suggesting that these fish
were more piscivorous than the smaller fish within those lakes. Across all sizes,
mean trophic positions were similar for all fishes in a given lake, but the lakes
where fishes consumed more offshore carbon (e.g., Beaverskin) tended to have
fish with higher trophic positions, suggesting greater piscivory within the offshore
food webs.
3.5.2 Hg in biota
Invertebrates at KNPNHS had higher MeHg concentrations compared to
other freshwater systems without point sources of contamination. Mean MeHg
concentrations in zooplankton at KNPNHS ranged from 0.09 ± 0.04 to 0.23 ±
81
0.12 ug/g dw and were higher than the mean concentrations in zooplankton from
2 lakes in Isle Royale National Park, Michigan [0.049 and 0.074 µg/g dw; (Gorski
et al. 2003)] and to those from 15 natural lakes in northern Wisconsin [0.053 µg/g
dw; (Watras et al. 1998)]. Amphipods, like most of the other littoral primary
consumers in KNPNHS, had MeHg concentrations (0.09 ± 0.04 – 0.18 ± 0.03
µg/g dw) that were 2.5 to 7.5 times higher than a references lake (L632) at the
Environmental Lakes Area [0.018 to 0.057 µg/g dw; (Hall et al. 1998)]. Aeshnid
[predator; (Merritt and Cummins 1996)] MeHg concentrations from the current
study (0.17 ± 0.03 – 0.44 ± 0.17 µg/g) were 2 to 10 times higher than those in
related species from uncontaminated lakes (Tremblay et al. 1996a, Hall et al.
1998, Gorski et al. 2003).
As was found for the invertebrates, Hg concentrations in fish from
KNPNHS were higher than those from uncontaminated regions. Only a single
study was found documenting Hg concentrations in golden shiner and banded
killifish although values for other forage fish were available. Mean Hg
concentrations for golden shiner and banded killifish in KNPNHS were 0.27 ±
0.12 and 0.32 ± 0.15 µg/g ww, respectively, while MeHg concentrations of these
species collected from acidic lakes in New Brunswick in 1996 and 1997 were
0.11 ±0.05 and 0.08 ± 0.04 µg/g ww, respectively (Barry Hanson 2004). Mean
concentrations from KNPNHS were also higher than those of northern redbelly
dace (Phoxinus eos) or fathead minnow (Pimephales promelas) from reference
lakes in the Experimental Lakes Area, Ontario (approximately 0.15 and 0.25 µg/g
ww, respectively; Kidd et al. 1999), and they were 2 to 3 times higher than those

82
reported in pumpkinseed (Lepomis gibbosus) and spottail shiner (Notropis
hudsonius) from various lakes in northwestern Ontario (Swanson et al. 2003).
The mean MeHg concentration of yellow perch from KNPNHS (0.36 ± 0.21 µg/g
ww) was more than double that of the mean concentrations for yellow perch in
Lake Washington (0.127 ± 0.013 µg/g ww, calculated from Table 1; McIntyre and
Beauchamp 2007) even though the mean fish lengths were much longer than
those caught in KNPNHS (22.8 ± 1.5 cm compared to 13.8 ± 5.2 cm at KNPNHS;
McIntyre and Beauchamp 2007). These findings support the characterization of
KNPNHS as a “hotspot” of biological Hg concentrations in northeastern North
America (Evers et al. 2007).
Differences in bioaccumulation rates among the lakes in KNPNHS were
driven by MeHg at the base of the food web. For the two lakes, Beaverskin and
North Cranberry, where significant differences in slopes were detected, trophic
positions of the invertebrates were similar but limnephilids, chironomids, and
aeshnids in North Cranberry had significantly higher MeHg (Table 3-2, Figure 3-
6). Despite significantly higher mean Hg in fishes at North Cranberry Lake,
slopes for the 2 lakes converged at the upper trophic levels, illustrating that the
MeHg concentrations of the lower trophic organisms is a more important
determinant of Hg bioaccumulation rates through these food webs.
Bioaccumulation rates calculated for the 4 acidic lakes in KNPNHS were
similar to those reported from other regions (Table 3-6). Although we observed
significant differences in the slopes of the log Hg – 15N (and log Hg – TP)
relationships within KNPNHS (Table 3-5), the rates were similar to those reported
83
in the Canadian Arctic and Malawi and lower than those in Papua New Guinea
and certain areas of Canada and the United States (Table 3-6). We originally
predicted that Hg bioaccumulation rates in acidic ecosystems, such as those of
KNPNHS, would exceed those of other regions because fish Hg concentrations
tend to be higher in acidic conditions (Chen et al. 2005); however our results
refute this hypothesis. Considering that the bioaccumulation rates in the
literature were quantified in lakes across a range of climates, pH gradients, and
with different fish communities, it appears that rates of Hg bioaccumulation are
similar in some lakes despite the variable lake characteristics. As such,
bioaccumulation rates cannot explain the higher contaminant concentrations in
top predators from acidic ecosystems compared to those in circumneutral ones.
Although Hg bioaccumulation rates appear similar among systems, it is
difficult to directly compare results across studies when different ranges of
trophic levels are sampled. For example, Atwell et al. (1998) quantified the Hg
bioaccumulation rate using particulate organic matter (e.g. algal and detrital
material), invertebrates, fish, birds, and polar bears, whereas the current study
focused on invertebrates and fish only. If one examines only the invertebrates
and fish data from Atwell et al., the bioaccumulation rate of Hg would be lower
and would, in turn, affect the conclusions about the rate of trophic transfer of Hg
across systems. When the mean Hg and 15N for adult loons in KNPNHS
(Burgess and Hobson 2006) were added to the current data set, the slopes
increased to between 0.23 and 0.27 (Evers et al. 1998, Burgess et al. 2005).

84
Future comparisons of bioaccumulation rates across systems should be limited
to the same range of trophic levels.
Contrary to the expectations, the KNPNHS lakes with the highest
bioaccumulation rates had yellow perch with the lowest Hg concentrations. At
KNPNHS, MeHg in the predaceous dragonfly, which was likely prey for the perch
(as determined by 13C and 15N), was a better predictor of Hg concentration in
yellow perch than the Hg bioaccumulation rates. Variation in MeHg of lower
trophic organisms is known to be an important indicator of Hg in fish (Watras et
al. 1998) and this study confirms that this was a more useful predictor of Hg in
yellow perch than bioaccumulation rate. Unfortunately, log Hg-15N intercepts
from KNPNHS cannot be compared to those in the literature until the slopes of
the regressions are deemed statistically comparable.
Hg concentrations within invertebrates and fish were also predicted by the
organism’s trophic position and size (fish only), and this helps to explain the
differences in Hg concentrations of predatory fish among systems. Animals
generally increase their trophic position and accumulate Hg as they grow, and
both trophic position and size are generally positively associated with high Hg
concentrations in animals (Kidd et al. 2003, Kamman et al. 2005, McIntyre and
Beauchamp 2007). In the current study, Hg concentrations of larger fish (i.e.
yellow perch) were often significantly predicted by length or weight, whereas 15N
or trophic position were better predictors of Hg in smaller fish and invertebrates.
It has been suggested that age should be included when quantifying
bioaccumulation of Hg to separate the effects of length of exposure from trophic

85
enrichment of the contaminant (McIntyre and Beauchamp 2007). In the current
study, age explained an additional 8-21% of the Hg concentrations over and
above that explained by 15N and confirms that age is an important variable in
predicting Hg in fishes. However, stepwise regressions of the factors influencing
Hg concentrations in yellow perch varied among lakes and age was a significant
predictor in 1 case whereas size and 15N were factors in 3 lakes.
In KNPNHS, the highest Hg concentrations in biota occurred in lakes with
higher flushing rates, e.g., North Cranberry (Table 3-1). The positive relationship
between flushing rate and biotic Hg likely occurred because a higher amount of
Hg is being delivered to the system (Shanley et al. 2005, Harris et al. 2007). The
current work suggests that enhanced flushing rates increased Hg inputs to the
base of the food web and heightened renewal of Hg from external sources.
Low biotic Hg concentrations were measured in a lake with high
aqueous Hg and DOC concentrations, illustrating that elevated DOC can reduce
the biological availability of Hg (Driscoll et al. 1995, Watras et al. 1998, Chen et
al. 2005). Pebbleloggitch Lake had higher aqueous Hg and DOC concentrations
than the other 3 lakes (Table 3-1), but the animals all had the lowest Hg
concentrations. Typically, aqueous Hg (particularly MeHg) is accumulated by
phytoplankton and transferred through the food web (Pickhardt et al. 2002,
2005), resulting in high fish Hg concentrations in lakes with high aqueous Hg
(Watras et al. 1998, Gorski et al. 2003). MeHg and DOC are formed within
wetlands, and lakes with a high percentage of wetlands have elevated DOC and
Hg within the biota (St. Louis et al. 1994, Driscoll et al. 1995). The Hg – DOC

86
complex dissociates in lakes, especially acidic ones, thus enhancing the aqueous
MeHg concentration that is available to phytoplankton for uptake (Hintelmann et
al. 1995, Watras et al. 1998, Kelly et al. 2003, Pickhardt and Fisher 2007).
Considering these factors, it was unexpected that Pebbleloggitch would exhibit
the lowest biotic Hg concentrations; however, Driscoll et al. (1995) proposed that
DOC concentrations greater than 8 mg/L induce protective qualities upon the
system by binding the MeHg to make it unavailable. This notion was supported
by the work in Chapter 2 while suggesting that a critical DOC level of 10 mg/L is
more appropriate.
The relationships between enhanced Hg in fish and elevated Hg in lower
trophic organisms or reduced growth rates found in the current study support the
theories in the literature (Watras et al. 1998, Trudel and Rasmussen 2006). This
is the first study to report a significant, negative relationship between Hg in
predaceous fish to the Hg bioaccumulation rate of the aquatic food web. The
cause of this pattern cannot be explained at this time.
3.6 Conclusions
This was the first study to examine the influence of using various types of
data on Hg bioaccumulation rates and Hg concentrations at the base of the food
web. This research showed that Hg bioaccumulation rates were not affected by
the type of data used to calculate the regression, but that Hg concentrations at
the base of the food web (intercepts) were significantly higher when dry weight
data are used to formulate the model.

87
This was also the first study to examine whether Hg bioaccumulation rates
increase with deceasing lake pH or food web complexity. Although Hg
bioaccumulation rates did not vary among acidic and certain circumneutral
systems or among lakes with differing fish communities, MeHg concentrations in
a lower-trophic-level organism was positively related with Hg concentrations in its
predator the yellow perch. Hg concentrations in perch were also elevated in
lakes with high flushing rates, which likely increased the inputs of Hg to the base
of the food webs. Biotic Hg concentrations were predicted by 15N, illustrating
that trophic position is an important determinant of the Hg concentrations of
predaceous fish. Since trophic positions of yellow perch in this study were
similar to those in other systems, the elevated Hg concentrations in fish and
loons from KNPNHS appear to be caused by elevated Hg concentrations in the
lower trophic organisms, and not by atypical food web structures or
bioaccumulation rates.
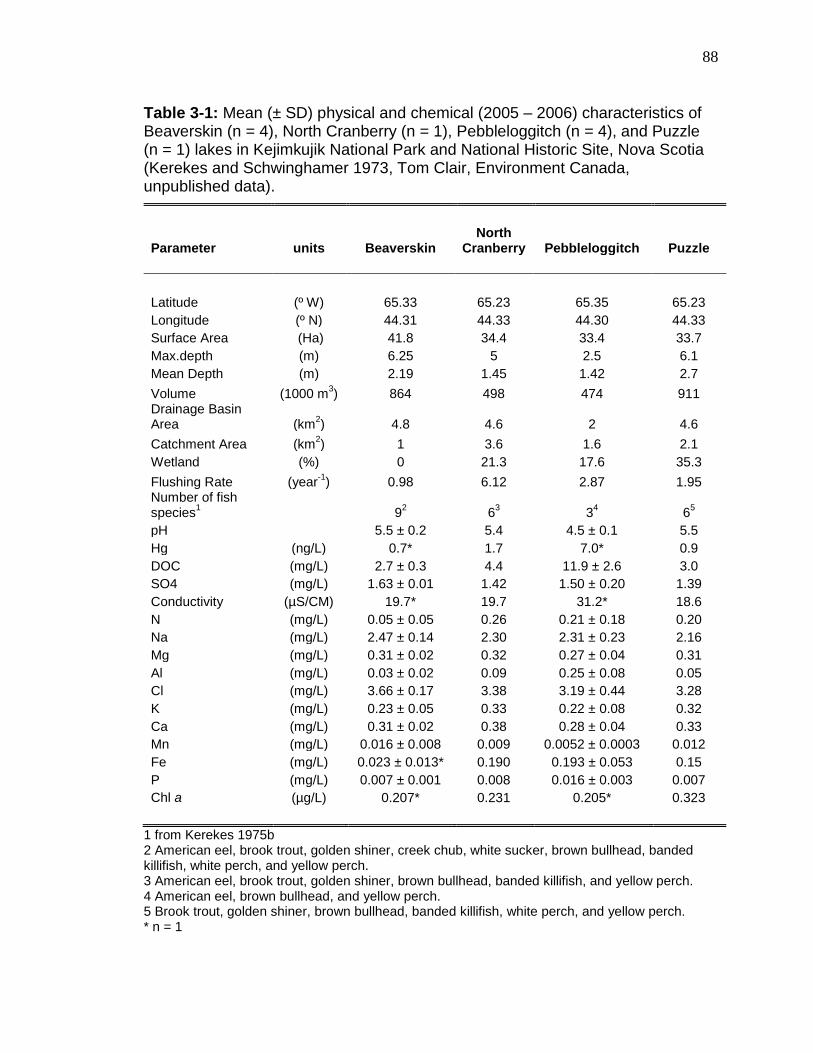
88
Table 3-1: Mean (± SD) physical and chemical (2005 – 2006) characteristics of Beaverskin (n = 4), North Cranberry (n = 1), Pebbleloggitch (n = 4), and Puzzle (n = 1) lakes in Kejimkujik National Park and National Historic Site, Nova Scotia (Kerekes and Schwinghamer 1973, Tom Clair, Environment Canada, unpublished data).
Parameter units Beaverskin North
Cranberry Pebbleloggitch Puzzle
Latitude (º W) 65.33 65.23 65.35 65.23
Longitude (º N) 44.31 44.33 44.30 44.33
Surface Area (Ha) 41.8 34.4 33.4 33.7
Max.depth (m) 6.25 5 2.5 6.1
Mean Depth (m) 2.19 1.45 1.42 2.7
Volume (1000 m3) 864 498 474 911
Drainage Basin Area (km
2) 4.8 4.6 2 4.6
Catchment Area (km2) 1 3.6 1.6 2.1
Wetland (%) 0 21.3 17.6 35.3
Flushing Rate (year-1
) 0.98 6.12 2.87 1.95 Number of fish species
1 9
2 6
3 3
4 6
5
pH 5.5 ± 0.2 5.4 4.5 ± 0.1 5.5
Hg (ng/L) 0.7* 1.7 7.0* 0.9
DOC (mg/L) 2.7 ± 0.3 4.4 11.9 ± 2.6 3.0
SO4 (mg/L) 1.63 ± 0.01 1.42 1.50 ± 0.20 1.39
Conductivity (µS/CM) 19.7* 19.7 31.2* 18.6
N (mg/L) 0.05 ± 0.05 0.26 0.21 ± 0.18 0.20
Na (mg/L) 2.47 ± 0.14 2.30 2.31 ± 0.23 2.16
Mg (mg/L) 0.31 ± 0.02 0.32 0.27 ± 0.04 0.31
Al (mg/L) 0.03 ± 0.02 0.09 0.25 ± 0.08 0.05
Cl (mg/L) 3.66 ± 0.17 3.38 3.19 ± 0.44 3.28
K (mg/L) 0.23 ± 0.05 0.33 0.22 ± 0.08 0.32
Ca (mg/L) 0.31 ± 0.02 0.38 0.28 ± 0.04 0.33
Mn (mg/L) 0.016 ± 0.008 0.009 0.0052 ± 0.0003 0.012
Fe (mg/L) 0.023 ± 0.013* 0.190 0.193 ± 0.053 0.15
P (mg/L) 0.007 ± 0.001 0.008 0.016 ± 0.003 0.007
Chl a (µg/L) 0.207* 0.231 0.205* 0.323
1 from Kerekes 1975b 2 American eel, brook trout, golden shiner, creek chub, white sucker, brown bullhead, banded killifish, white perch, and yellow perch. 3 American eel, brook trout, golden shiner, brown bullhead, banded killifish, and yellow perch. 4 American eel, brown bullhead, and yellow perch. 5 Brook trout, golden shiner, brown bullhead, banded killifish, white perch, and yellow perch. * n = 1

89
Table 3-2: Mean (± SD) MeHg, 13C, 15N, and trophic positions of select invertebrates from Beaverskin, North Cranberry, Pebbleloggitch, and Puzzle lakes in Kejimkujik National Park and National Historic Site, Nova Scotia (range in parentheses).
Lake n MeHg 13
C 13
Clipid 15
N Trophic position
(µg/g dw) (‰) (‰) (‰)
Beaverskin Aeshna
umbrosa 3 0.25 ± 0.05 -27.88 ± 0.67 -26.99 ± 0.95 3.88 ± 0.40 2.85 ± 0.12
(0.20 / 0.30) (-28.50 / -27.16) (-27.98 / -26.10) (3.51 / 4.31) (2.74 / 2.97)
Amphipoda 3 0.14 ± 0.06 -27.27 ± 0.46 - 26.21± 0.42 4.41 ± 0.87 3.01 ± 0.26
(0.07 / 0.18) (-27.73 / -26.82) (-26.55 / -25.75) (3.68 / 5.38) (2.79 / 3.29)
Chironomidae 3 0.07 ± 0.02 -26.96 ± 2.02 -25.77 ± 2.10 2.73 ± 0. 34 2.51 ± 0.10
-littoral (0.05 / 0.10) (-28.42 / -24.65) (-27.25 / -23.37) (2.52 / 3.13) (2.45 / 2.63)
Chironomidae -30.12 ± 1.04 -28.95 ± 1.39 4.46 ± 0.57 3.02 ± 0.17
-profundal (-31.30 / -29.32) (-30.50 / -27.79) (3.91 / 5.08) (2.86 / 3.19)
Heptageniidae 1 0.07 -27.94 -26.82 1.47 2.14
Limnephilidae 3 0.03 ± 0.01 -29.40 ± 1.22 -26.55 ± 1.27 1.00 ± 0. 35 2.00 ± 0.10
(0.03 / 0.04) (-30.77 / -28.42) (-27.81 / -25.27) (0.71 / 1.38) (1.91 / 2.11)
Zooplankton 2 0.11 -32.51 ± 1.09 -30.89 4.39 3.00
(0.10 / 0.12) (-33.56 / -31.38) (-31.59 / -30.20) (4.21 / 4.56) (2.95 / 3.05)
North Cranberry Aeshna
umbrosa 3 0.44 ± 0.17 -29.43 ± 1.74 -28.74 ± 1.92 4.32 ± 0. 12 2.84 ± 0.04
(0.33 / 0.64) (-31.38 / -28.02) (-30.95 / -27.54) (4.21 / 4.44) (2.81 / 2.88)
Amphipoda 3 0.17 ± 0.05 -29.14 ± 0.37 -27.74 ± 0.40 1.91 ± 0. 27 2.13 ± 0. 09
(0.12 / 0.22) (-29.51 / -28.77) (-28.07 / -27.29) (1.70 / 2.22) (2.07 / 2.23)
Chironomidae 3 0.19 ± 0.04 -30.23 ± 0.76 -29.10 ± 0.79 3.51 ± 0. 51 2.61 ± 0.15
-littoral (0.16 / 0.24) (-30.76 / -29.36) (-29.72 / -28.21) (2.93 / 3.85) (2.44 / 2.71)
Chironomidae -39.53 ± 1.01 -38.45 ± 0.97 2.11 ± 1.83 2.19 ± 0.54
-profundal (-40.57 / -38.56) (-39.38 / -37.44) (0.64 / 4.16) (1.76 / 2.80)
Heptageniidae 3 0.18 ± 0.08 -28.54 ± 0.25 -27.69 ± 0.31 2.26 ± 0. 78 2.24 ± 0. 23
(0.08 / 0.23) (-28.76 / -28.27) (-27.90 / -27.34) (1.72 / 3.15) (2.08 / 2.5)
Limnephilidae 3 0.09 ± 0.02 -31.64 ± 1.48 -28.55 ± 1.47 1.45 ± 0. 43 2.00 ± 0.13
(0.07 / 0.11) (-32.74 / -29.96) (-29.67 / -26.89) (1.00 / 1.86) (1.87 / 2.12)
Zooplankton 3 0.23 ± 0.12 -35.20 ± 1.53 -34.08 ± 0.1.45 4.51 ± 0. 90 2.90 ± 0. 27
(0.09 / 0.31) (-36.41 / -33.48) (-35.03 / -32.42) (3.88 / 5.55) (2.72 / 3.21)

90
Table 3-2 continued.
Lake n MeHg 13
C 13
Clipid 15
N
Trophic position
(µg/g dw) (‰) (‰) (‰)
Pebbleloggitch Aeshna
umbrosa 3 0.17 ± 0.03 -28.79 ± 0.56 -28.01 ± 0.29 3.27 ± 0. 53 2.72 ± 0. 15
(0.14 / 0.19) (-29.30 / -28.20) (-28.20 / -27.68) (2.68 / 3.72) (2.55 / 2.85)
Amphipoda 3 0.09 ± 0.04 -29.39 ± 1.74 -28.09 ± 1.71 2.46 ± 1.09 2.48 ± 0. 32
(0.05 / 0.12) (-31.32 / -27.95) (-30.00 / -26.69) (1.22 / 3.21) (2.12 / 2.70)
Chironomidae 3 0.08 ± 0.02 -29.30 ± 0.64 -28.20 ± 0.58 2.66 ± 0. 39 2.54 ± 0. 11
-littoral (0.07 / 0.10) (-29.79 / -28.57) (-28.81 / -27.65) (2.21 / 2.90) (2.41 / 2.61)
Chironomidae - -35.02 ± 1.69 -33.92 ± 1.49 4.78 ± 0.18 3.16 ± 0.05
-profundal (-36.11 / -35.02) (-34.86 / -32.21) (4.63 / 4.98) (3.12 / 3.22)
Heptageniidae 3 0.07 ± 0.03 -29.36 ± 0.15 -28.23 ± 0.63 1.10 ± 0. 51 2.08 ± 0. 15
(0.04 / 0.09) (-29.51 / -29.22) (-28.96 / -27.85) (0.51 / 1.43) (1.91 / 2.18)
Limnephilidae 3 0.05 ± 0.02 -31.13 ± 0.1.26 -27.63 ± 0.78 0.82 ± 0. 11 2.00 ± 0.03
(0.03 / 0.08) (-32.57 / -30.20) (-28.36 / -26.81) (0.69 / 0.90) (1.96 / 2.02)
Zooplankton 3 0.09 ± 0.04 -35.81 ± 1.43 -34.78 ± 1.39 3.10 ± 0. 97 2.67 ± 0. 29
(0.05 / 0.12) (-36.87 / -34.18) -35.83 / -33.20) (2.26 / 4.17) (2.42 / 2.98)
Puzzle Aeshna
umbrosa 3 0.35 ± 0.03 -30.79 ± 0.1.91 -29.99 ± 1.66 4.28 ± 0. 25 2.59 ± 0. 08
(0.32 / 0.38) (-32.98 / -29.50) (-31.86 / -28.69) (4.13 / 4.58) (2.55 / 2.68)
Amphipoda 3 0.18 ± 0.03 -29.15 ± 0.43 -27.92 ± 0.22 4.05 ± 0. 66 2.52 ± 0. 19
(0.15 / 0.21) (-29.56 / -28.70) (-28.08 / -27.67) (3.31 / 4.59) (2.31 / 2.68)
Chironomidae 3 0.14 ± 0.04 -32.26 ± 1.18 -31.19 ± 1.27 3.27 ± 0. 38 2.29 ± 0. 11
-littoral (0.12 / 0.18) (-33.29 / -30.96) (-32.19 / -29.76) (2.96 / 3.69) (2.20 / 2.42)
Chironomidae - -34.99 ± 1.45 -33.98 ± 1.47 5.30 ± 0.63 2.89 ± 0.18
-profundal (-36.02 / -33.97) (-35.02 / -32.94) (4.86 / 5.75) (2.76 / 3.02)
Heptageniidae 2 0.11 -28.94 ± 0.85 -28.63 1.79 1.86
(0.08 / 0.13) (-29.69 / -28.02) (-28.93 / -28.32) (1.75 / 1.82) (1.85 / 1.87)
Limnephilidae 3 0.15 ± 0.07 -31.59 ± 0.77 -28.65 ± 0.62 2.27 ± 0. 20 2.00 ± 0.56
(0.08 / 0.22) (-32.28 / -30.75) (-29.17 / -27.96) (2.09 / 2.48) (1.95 / 2.06)
Zooplankton 3 0.16 ± 0.07 -34.69 ± 1.82 -33.60 ± 1.67 4.31 ± 0. 58 2.60 ± 0. 17
(0.08 / 0.20) (-36.58 / -32.94) (-35.26 / -31.91) (3.92 / 4.98) (2.49 / 2.80)

91
Table 3-3: Mean (± SD) length, weight, condition, age, Hg, and %MeHg of golden shiner, banded killifish, yellow perch, and brown bullhead in four lakes (Beaverskin, North Cranberry, Pebbleloggitch, and Puzzle) at Kejimkujik National Park and National Historic Site, Nova Scotia (range in parentheses).
Lake n Length Weight Condition Age Hg MeHg/THg
(cm) (g) (103 g/cm
3) (years) (µg/g dw) (%)
Beaverskin
Golden Shiner 15 7.8 ± 1.5 6.04 ± 4.26 1.13 ± 0.05 1.00 ± 0.43 (6) 90.16 ± 5.07
(6.4 / 11.4) (2.84 / 17.96) (1.07 / 1.21) (0.67 / 1.69) (83.87 / 94.75)
Banded Killifish 15 8.6 ± 0.7 5.16 ± 1.20 0.79 ± 0.04 1.86 ± 0.65 (6) -
(7.7 / 9.9) (3.58 / 7.18) (0.74 / 0.87) (0.87 / 2.84)
Yellow Perch 27 13.3 ± 4.6 37.03 ± 36.51 1.11 ± 0.07 4.6 ± 2.2 1.36 ± 0.43 94.72 ± 11.62
(7.9 / 22.6) (4.98 / 138.82) (0.99 / 1.27) (2 / 9) (0.94 / 3.02) (91.28 / 103.79)
Brown Bullhead 10 15.1 ± 3.6 49.38 ± 34.79 1.23 ± 0.08 -
(9.0 / 21.7) (8.98 / 125.68) (1.12 / 1.35)
North Cranberry
Golden Shiner 15 7.4 ± 0.6 4.22 ± 1.05 1.03 ± 0.04 1.81 ± 0.67 (6) 86.21 ± 8.51
(6.4 / 8.5) (2.72 / 6.24) (0.97 / 1.10) (1.03 / 2.56) (80.16 / 98.33)
Banded Killifish 15 7.2 ± 0.7 3.18 ± 0.92 0.85 ± 0.04 1.65 ± 0.57 (6) -
(6.0 / 8.7) (1.86 / 5.18) (0.79 / 0.91) (1.14 / 2.64)
Yellow Perch 27 13.1 ± 4.0 33.31 ± 30.33 1.10 ± 0.12 5.56 ± 2.47 2.26 ± 1.34 95.17 ± 2.54
(7.8 / 21.5) (4.64 / 107.96) (0.88 / 1.31) (2 / 9) (1.20 / 6.92) (91.31 / 97.49)
Brown Bullhead 10 16.2 ± 1.2 56.29 ± 16.49 1.30 ± 0.13 -
(14.6 / 19.0) (38.34 / 96.76) (1.16 / 1.51)
- = not measured
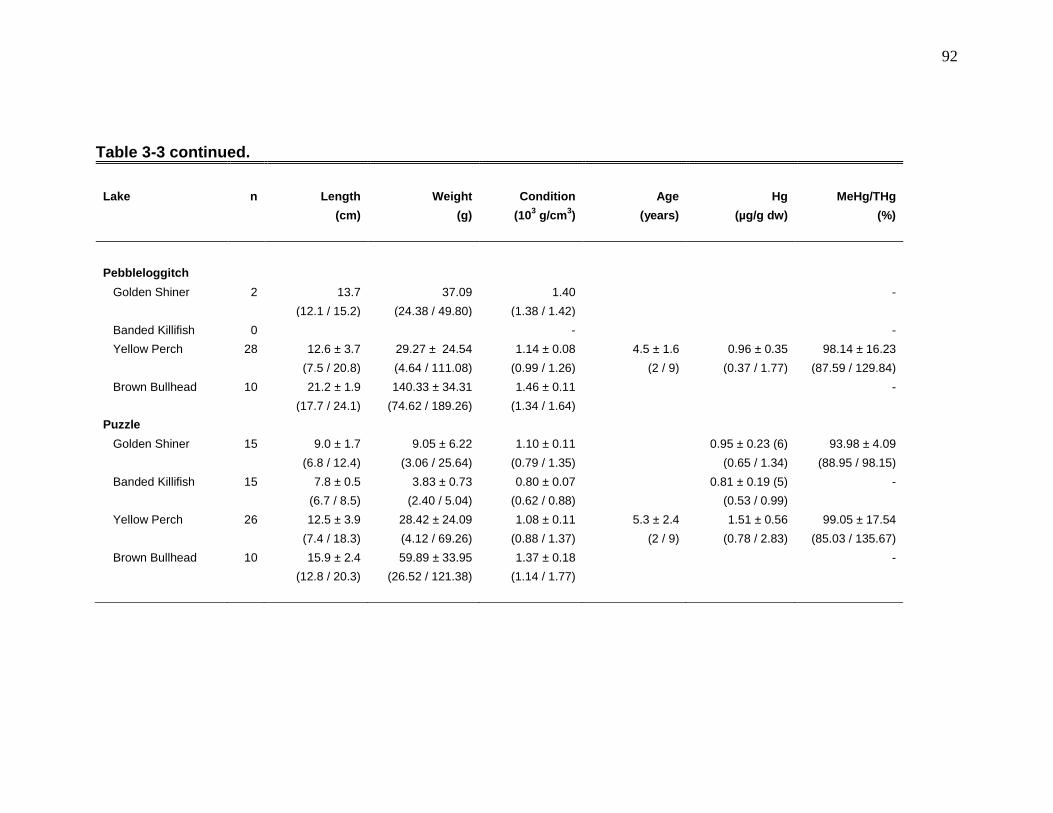
92
Table 3-3 continued.
Lake n Length Weight Condition Age Hg MeHg/THg
(cm) (g) (103 g/cm
3) (years) (µg/g dw) (%)
Pebbleloggitch
Golden Shiner 2 13.7 37.09 1.40 -
(12.1 / 15.2) (24.38 / 49.80) (1.38 / 1.42)
Banded Killifish 0 - -
Yellow Perch 28 12.6 ± 3.7 29.27 ± 24.54 1.14 ± 0.08 4.5 ± 1.6 0.96 ± 0.35 98.14 ± 16.23
(7.5 / 20.8) (4.64 / 111.08) (0.99 / 1.26) (2 / 9) (0.37 / 1.77) (87.59 / 129.84)
Brown Bullhead 10 21.2 ± 1.9 140.33 ± 34.31 1.46 ± 0.11 -
(17.7 / 24.1) (74.62 / 189.26) (1.34 / 1.64)
Puzzle
Golden Shiner 15 9.0 ± 1.7 9.05 ± 6.22 1.10 ± 0.11 0.95 ± 0.23 (6) 93.98 ± 4.09
(6.8 / 12.4) (3.06 / 25.64) (0.79 / 1.35) (0.65 / 1.34) (88.95 / 98.15)
Banded Killifish 15 7.8 ± 0.5 3.83 ± 0.73 0.80 ± 0.07 0.81 ± 0.19 (5) -
(6.7 / 8.5) (2.40 / 5.04) (0.62 / 0.88) (0.53 / 0.99)
Yellow Perch 26 12.5 ± 3.9 28.42 ± 24.09 1.08 ± 0.11 5.3 ± 2.4 1.51 ± 0.56 99.05 ± 17.54
(7.4 / 18.3) (4.12 / 69.26) (0.88 / 1.37) (2 / 9) (0.78 / 2.83) (85.03 / 135.67)
Brown Bullhead 10 15.9 ± 2.4 59.89 ± 33.95 1.37 ± 0.18 -
(12.8 / 20.3) (26.52 / 121.38) (1.14 / 1.77)
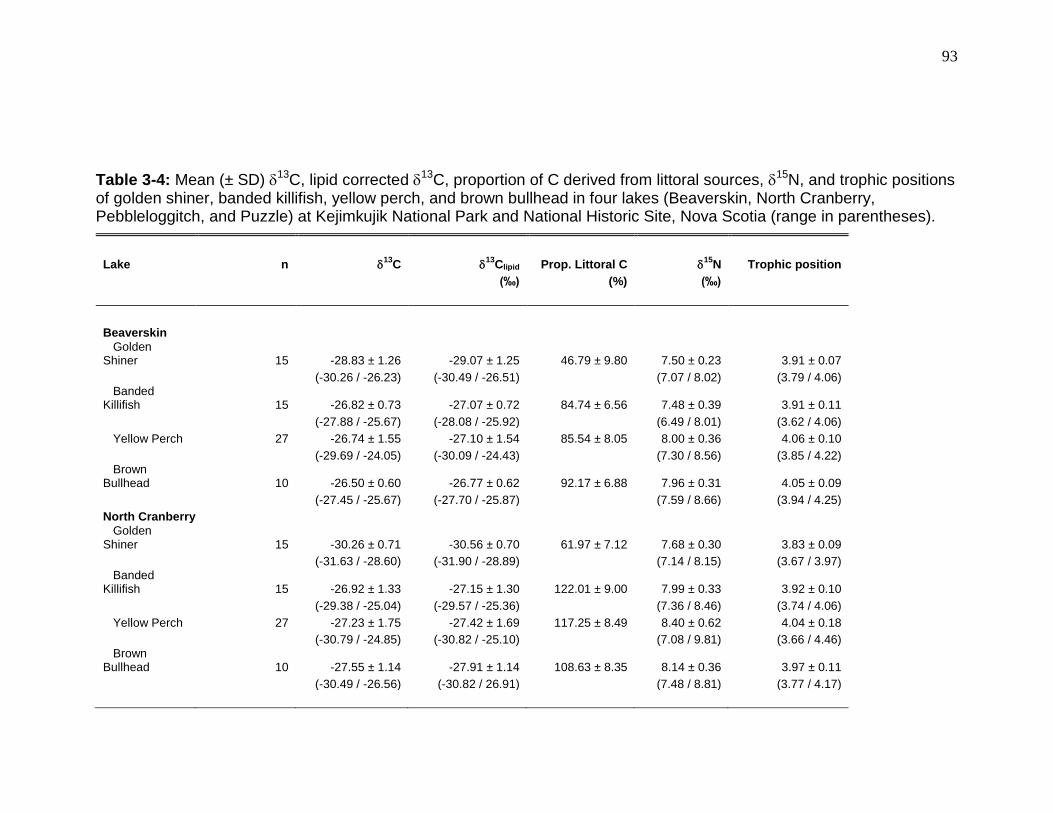
93
Table 3-4: Mean (± SD) 13C, lipid corrected 13C, proportion of C derived from littoral sources, 15N, and trophic positions of golden shiner, banded killifish, yellow perch, and brown bullhead in four lakes (Beaverskin, North Cranberry, Pebbleloggitch, and Puzzle) at Kejimkujik National Park and National Historic Site, Nova Scotia (range in parentheses).
Lake n 13
C 13
Clipid Prop. Littoral C 15
N Trophic position
(‰) (%) (‰)
Beaverskin Golden Shiner 15 -28.83 ± 1.26 -29.07 ± 1.25 46.79 ± 9.80 7.50 ± 0.23 3.91 ± 0.07
(-30.26 / -26.23) (-30.49 / -26.51) (7.07 / 8.02) (3.79 / 4.06) Banded Killifish 15 -26.82 ± 0.73 -27.07 ± 0.72 84.74 ± 6.56 7.48 ± 0.39 3.91 ± 0.11
(-27.88 / -25.67) (-28.08 / -25.92) (6.49 / 8.01) (3.62 / 4.06)
Yellow Perch 27 -26.74 ± 1.55 -27.10 ± 1.54 85.54 ± 8.05 8.00 ± 0.36 4.06 ± 0.10
(-29.69 / -24.05) (-30.09 / -24.43) (7.30 / 8.56) (3.85 / 4.22) Brown Bullhead 10 -26.50 ± 0.60 -26.77 ± 0.62 92.17 ± 6.88 7.96 ± 0.31 4.05 ± 0.09
(-27.45 / -25.67) (-27.70 / -25.87) (7.59 / 8.66) (3.94 / 4.25)
North Cranberry Golden Shiner 15 -30.26 ± 0.71 -30.56 ± 0.70 61.97 ± 7.12 7.68 ± 0.30 3.83 ± 0.09
(-31.63 / -28.60) (-31.90 / -28.89) (7.14 / 8.15) (3.67 / 3.97) Banded Killifish 15 -26.92 ± 1.33 -27.15 ± 1.30 122.01 ± 9.00 7.99 ± 0.33 3.92 ± 0.10
(-29.38 / -25.04) (-29.57 / -25.36) (7.36 / 8.46) (3.74 / 4.06)
Yellow Perch 27 -27.23 ± 1.75 -27.42 ± 1.69 117.25 ± 8.49 8.40 ± 0.62 4.04 ± 0.18
(-30.79 / -24.85) (-30.82 / -25.10) (7.08 / 9.81) (3.66 / 4.46) Brown Bullhead 10 -27.55 ± 1.14 -27.91 ± 1.14 108.63 ± 8.35 8.14 ± 0.36 3.97 ± 0.11
(-30.49 / -26.56) (-30.82 / 26.91) (7.48 / 8.81) (3.77 / 4.17)

94
Table 3-4 continued.
Lake n 13
C 13
Clipid Prop. Littoral C 15
N Trophic position
(‰) (%) (‰)
Pebbleloggitch
Golden Shiner 2 -28.31 -28.49 93.19 6.43 3.65
(-28.47 / -28.15) (-28.65 / -28.33 (6.23 / 6.62) 3.59 / 3.71 Banded Killifish 0
Yellow Perch 28 -28.77 ± 1.27 -29.03 ± 1.26 85.19 ± 4.76 6.84 ± 0.56 3.77 ± 0.17
(-32.08 / -27.04) (-32.32 / -27.32) (5.65 / 8.11) (3.42 / 4.14) Brown Bullhead 10 -29.85 ± 0.30 -30.14± 0.36 68.74 ± 4.62 6.88 ± 0.29 3.78 ± 0.08
(-30.39 / -29.43) (-30.79 / -29.57) (6.41 / 7.31) (3.65 / 3.91)
Puzzle
Golden Shiner 15 -28.80 ± 1.39 -29.11 ± 1.39 102.05 ± 12.30 7.31 ± 0.37 3.48 ± 0.11
(-30.91 / -26.55) (-31.16 / -26.79) (6.61 / 7.80) (3.28 / 3.63) Banded Killifish 15 -26.49 ± 0.67 -26.80 ± 0.66 154.54 ± 18.80 7.04 ± 0.34 3.40 ± 0.10
(-27.83 / -25.07) (-28.14 / -25.-407) (6.31 / 7.56) (3.19 / 3.56)
Yellow Perch 26 -27.15 ± 1.52 -27.48 ± 1.50 139.09 ± 16.57 7.60 ± 0.51 3.57 ± 0.15
(-30.30 / -25.13) (-30.58 / -25.48) (6.63 / 9.11) (3.28 / 4.01) Brown Bullhead 10 -27.62 ± 0.42 -27.96 ± 0.41 128.18 ± 13.46 7.64 ± 0.50 3.58 ± 0.15
(-28.67 / -27.26) (-28.98 / -27.62) (6.63 / 8.36) (3.28 / 3.79)
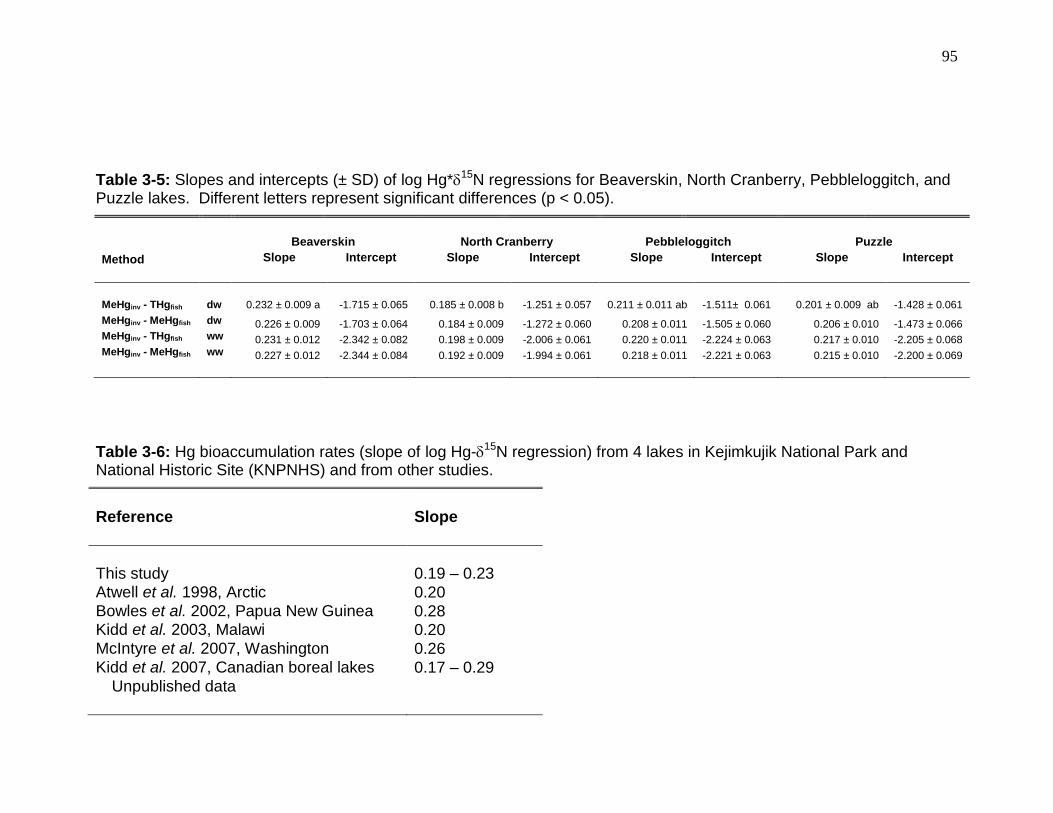
95
Table 3-5: Slopes and intercepts (± SD) of log Hg*15N regressions for Beaverskin, North Cranberry, Pebbleloggitch, and Puzzle lakes. Different letters represent significant differences (p < 0.05).
Beaverskin North Cranberry Pebbleloggitch Puzzle
Method Slope Intercept Slope Intercept Slope Intercept Slope Intercept
MeHginv - THgfish dw 0.232 ± 0.009 a -1.715 ± 0.065 0.185 ± 0.008 b -1.251 ± 0.057 0.211 ± 0.011 ab -1.511± 0.061 0.201 ± 0.009 ab -1.428 ± 0.061
MeHginv - MeHgfish dw 0.226 ± 0.009 -1.703 ± 0.064 0.184 ± 0.009 -1.272 ± 0.060 0.208 ± 0.011 -1.505 ± 0.060 0.206 ± 0.010 -1.473 ± 0.066 MeHginv - THgfish ww 0.231 ± 0.012 -2.342 ± 0.082 0.198 ± 0.009 -2.006 ± 0.061 0.220 ± 0.011 -2.224 ± 0.063 0.217 ± 0.010 -2.205 ± 0.068 MeHginv - MeHgfish ww 0.227 ± 0.012 -2.344 ± 0.084 0.192 ± 0.009 -1.994 ± 0.061 0.218 ± 0.011 -2.221 ± 0.063 0.215 ± 0.010 -2.200 ± 0.069
Table 3-6: Hg bioaccumulation rates (slope of log Hg-15N regression) from 4 lakes in Kejimkujik National Park and National Historic Site (KNPNHS) and from other studies.
Reference Slope
This study 0.19 – 0.23 Atwell et al. 1998, Arctic 0.20 Bowles et al. 2002, Papua New Guinea 0.28 Kidd et al. 2003, Malawi 0.20 McIntyre et al. 2007, Washington 0.26 Kidd et al. 2007, Canadian boreal lakes 0.17 – 0.29
Unpublished data

96
Figure 3-1: Four study lakes in Kejimkujik National Park and National Historic Site, Nova Scotia, Canada.
1
3
2
4
1. Beaverskin 2. North Cranberry 3. Pebbleloggitch 4. Puzzle

97
Figure 3-2: Mean (± SD) 15N and 13C (‰) of fish and pelagic, profundal, and littoral invertebrates from Beaverskin Lake, 2006.
13
C
-36 -34 -32 -30 -28 -26 -24 -22
1
5N
0
2
4
6
8
10
au
am
c-l
c-p
hep
ld
z
yp1 yp2yp3
gs bkf
bb
Aeshna umbrosaau
Amphipodaam
Chironomidae - littoralc-l
Chironomidae - profundalc-p
Heptageniidaehep
Limnephilidaeld
Zooplanktonz
Yellow Perch 5-10 cmyp1
Yellow Perch 10-15 cmyp2
Yellow Perch >15 cmyp3
Golden Shinergs
Banded Killifishbkf
Brown Bullheadbb
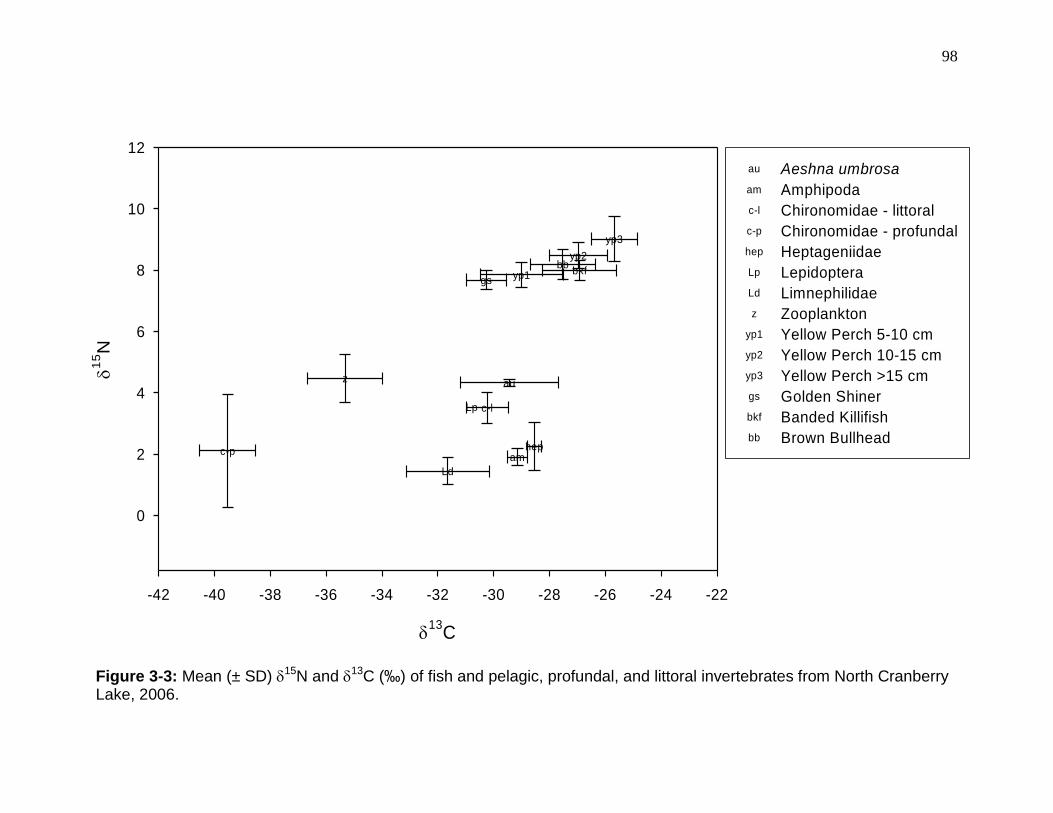
98
Figure 3-3: Mean (± SD) 15N and 13C (‰) of fish and pelagic, profundal, and littoral invertebrates from North Cranberry Lake, 2006.
13
C
-42 -40 -38 -36 -34 -32 -30 -28 -26 -24 -22
1
5N
0
2
4
6
8
10
12
au
am
c-l
c-p hep
Lp
Ld
z
yp1
yp2
yp3
gsbkf
bb
Aeshna umbrosaau
Amphipodaam
Chironomidae - littoralc-l
Chironomidae - profundalc-p
Heptageniidaehep
LepidopteraLp
LimnephilidaeLd
Zooplanktonz
Yellow Perch 5-10 cmyp1
Yellow Perch 10-15 cmyp2
Yellow Perch >15 cmyp3
Golden Shinergs
Banded Killifishbkf
Brown Bullheadbb
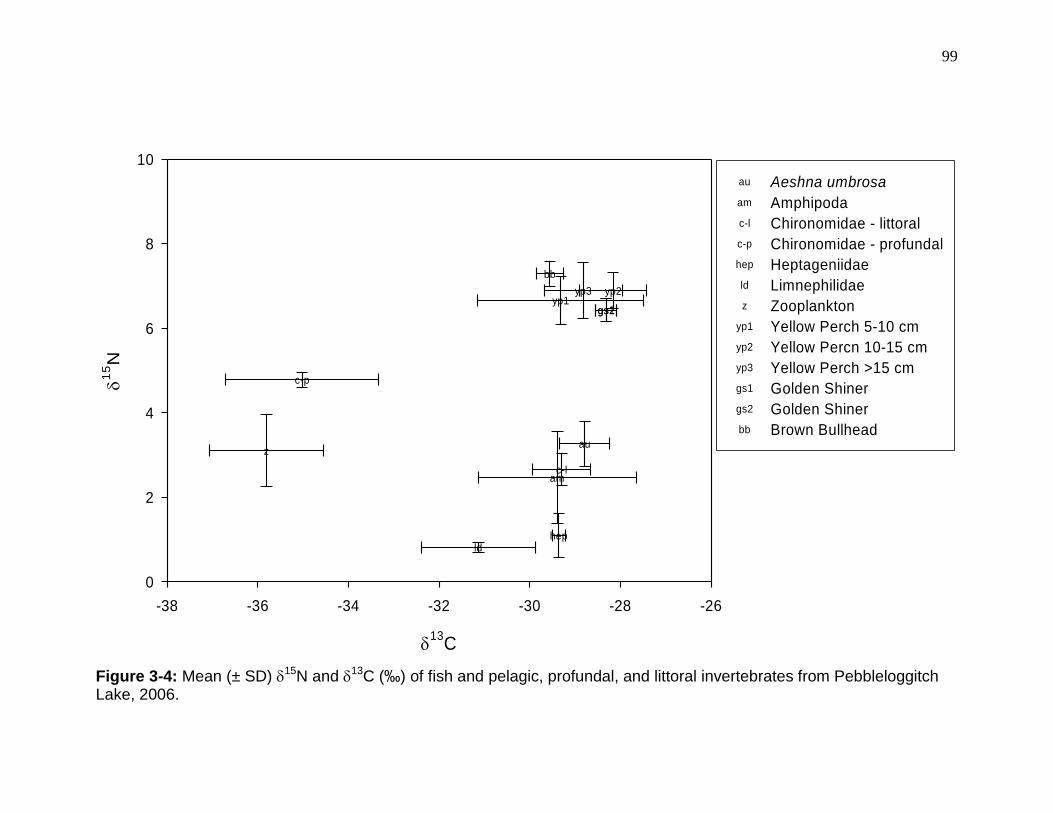
99
Figure 3-4: Mean (± SD) 15N and 13C (‰) of fish and pelagic, profundal, and littoral invertebrates from Pebbleloggitch Lake, 2006.
13
C
-38 -36 -34 -32 -30 -28 -26
1
5N
0
2
4
6
8
10
au
amc-l
c-p
hepld
z
yp1yp2yp3
gs1gs2
bb
Aeshna umbrosaau
Amphipodaam
Chironomidae - littoralc-l
Chironomidae - profundalc-p
Heptageniidaehep
Limnephilidaeld
Zooplanktonz
Yellow Perch 5-10 cmyp1
Yellow Percn 10-15 cmyp2
Yellow Perch >15 cmyp3
Golden Shinergs1
Golden Shinergs2
Brown Bullheadbb
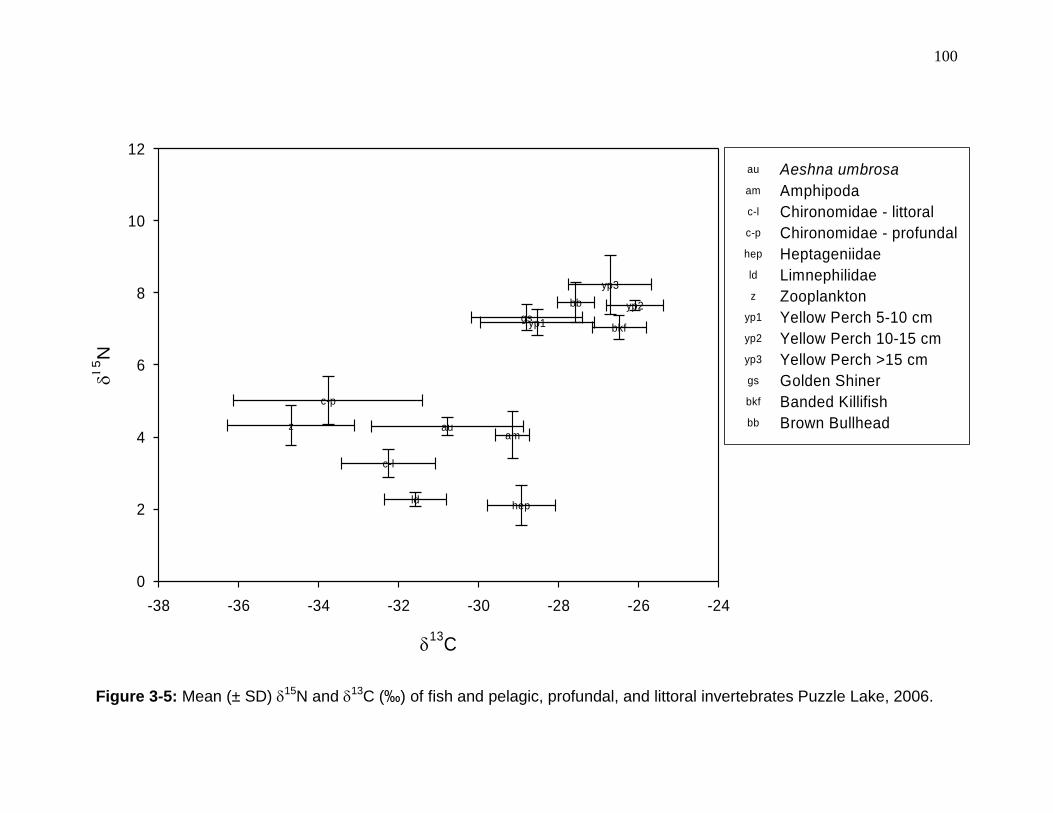
100
Figure 3-5: Mean (± SD) 15N and 13C (‰) of fish and pelagic, profundal, and littoral invertebrates Puzzle Lake, 2006.
13
C
-38 -36 -34 -32 -30 -28 -26 -24
5N
0
2
4
6
8
10
12
auam
c-l
c-p
hepld
z
yp1
yp2
yp3
gsbkf
bb
Aeshna umbrosaau
Amphipodaam
Chironomidae - littoralc-l
Chironomidae - profundalc-p
Heptageniidaehep
Limnephilidaeld
Zooplanktonz
Yellow Perch 5-10 cmyp1
Yellow Perch 10-15 cmyp2
Yellow Perch >15 cmyp3
Golden Shinergs
Banded Killifishbkf
Brown Bullheadbb
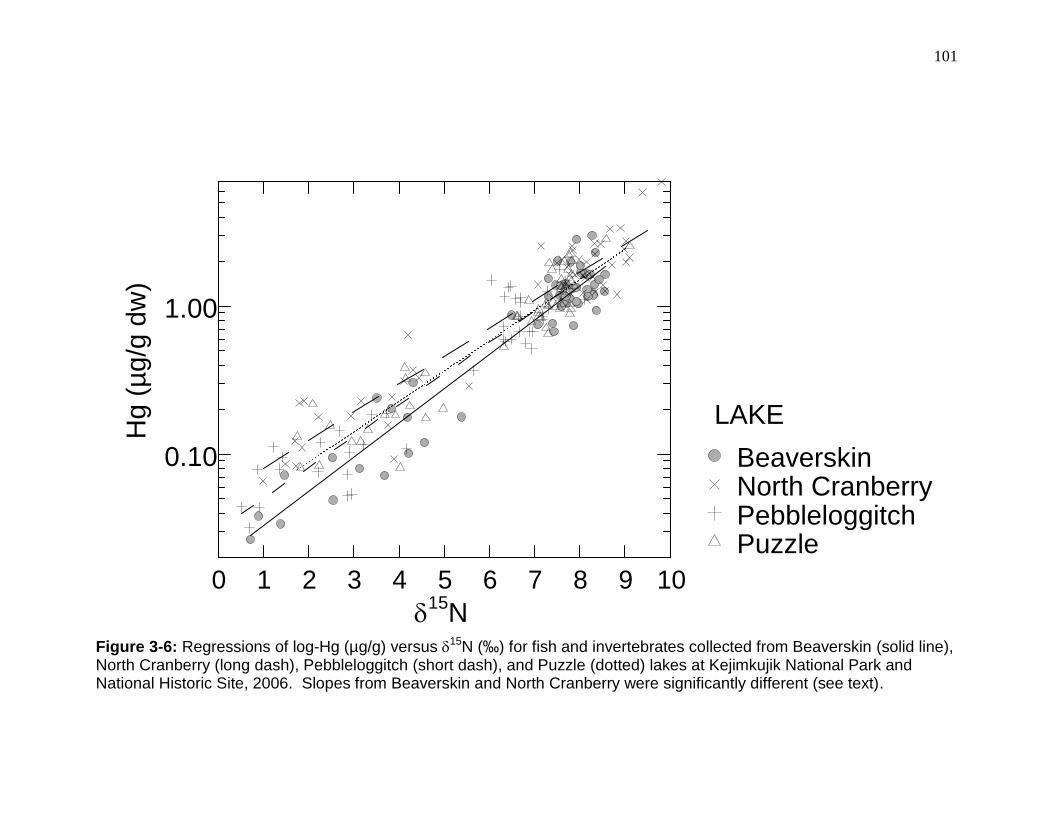
101
Figure 3-6: Regressions of log-Hg (µg/g) versus 15N (‰) for fish and invertebrates collected from Beaverskin (solid line), North Cranberry (long dash), Pebbleloggitch (short dash), and Puzzle (dotted) lakes at Kejimkujik National Park and National Historic Site, 2006. Slopes from Beaverskin and North Cranberry were significantly different (see text).
0 1 2 3 4 5 6 7 8 9 10
15
N
0.10
1.00
Hg
(µ
g/g
dw
)
Puzzle
Pebbleloggitch
North Cranberry
Beaverskin
LAKE

102
4 Summary and implications of findings
Regional and global emissions of mercury (Hg) and acidifying substances
increased more than 2-fold over the past century because of emissions from
coal-fired power plants, chlor-alkali facilities, gold mining, and other
anthropogenic activities; some reductions have been reported more recently
(Mason et al. 1994, Keller et al. 2001, Snucins et al. 2001, Pacyna et al. 2006,
Roos-Barraclough et al. 2006). These emissions were carried in air currents and
deposited on the landscape, and subsequently caused Hg concentrations in
freshwater biota to increase to sublethal concentrations (Wiener et al. 2003,
Evers et al. 2007, Munthe et al. 2007). Improved technologies have helped
remove these contaminants from industrial exhaust (specifically flue gas
desulfurisation) and reduce North American Hg and sulfate emissions by up to to
90% over the past 10 - 40 years [varies by region and contaminant; (Jeffries
1997, Keller et al. 2001, Pacyna and Pacyna 2002, Keller et al. 2003, Pacyna et
al. 2006)]. From enclosure experiments we know that increased deposition of Hg
to lakes directly increases Hg in fish (Orihel et al. 2007); therefore global
reductions in Hg emissions were expected to cause concentration reductions in
fish. This study was designed to assess whether there have been any reductions
in Hg concentrations in yellow perch from ten lakes at Kejimkujik National Park
and National Historic Site (KNPNHS), Nova Scotia since the previous study in
1996 and 1997. These lakes are acidic and have enhanced accumulation of Hg
in their biota, to the degree that previous studies reported elevated Hg

103
concentrations in fish and loons compared to those in other regions of North
America (Evers et al. 1998, Carter et al. 2001, Burgess et al. 2005, Drysdale et
al. 2005, Evers et al. 2007). The second objective of this thesis was to determine
whether Hg bioaccumulation rates in four acidified lakes at KNPNHS were
significantly higher than those in non-acidic systems and could therefore explain
the elevated concentrations of Hg in fish in this park.
4.1 Temporal trends and Hg bioaccumulation
Despite 0 and 30% reductions in the wet deposition of Hg and sulfate,
respectively, at KNPNHS over the past decade (Clair et al. 2002, Temme et al.
2007), this study showed that Hg concentrations in yellow perch increased an
average of 26% between 1996 and 2006 across the ten systems, with annual
changes ranging from 0.04 to 5.8% within each lake (Chapter 2). Concentration
increases resulted in a higher percentage of perch in each lake that exceed the
thresholds for toxicity to their main predator, the common loon (Gavia immer).
Other studies have reported stable or decreasing Hg concentrations (up to 80%)
in fish over the past 10-30 years in association with reduced anthropogenic Hg
loading (Johnston et al. 2003, Munthe et al. 2007, Rasmussen et al. 2007); this is
the first study to find Hg concentration increases in fish coincident with unaltered
wet deposition of Hg.
Considering that atmospheric inputs of Hg did not change through time at
KNPNHS (Tordon et al. 2006, Temme et al. 2007), the higher Hg concentrations
in yellow perch must be due to enhanced inputs from wetlands or uplands or

104
increased internal processing of Hg to forms that are more available for uptake
into the food web. Although studies showed that increases in Hg deposition
directly on to a lake’s surface waters caused Hg concentrations in fish to rise
(Paterson et al. 2006, Orihel et al. 2007), Hg inputs from wetlands and uplands
may be 65 – 96% of the total inputs to a lake (O'Driscoll et al. 2005a, Harris et al.
2007) and likely act as a longer term source of mercury to these systems.
Alternately, large lakes at KNPNHS had reduced oxygen concentrations in 2006
compared to the 1970s (Brylinsky 2006, 2007) and increased anoxia in the lakes
between 1996 and 2006 could have increased Hg methylation rates and
subsequently enhanced Hg concentrations in fish through higher uptake at the
base of the food web (Matilainen 1995). Although temperature profiles did not
change in the large lakes, those of the small lakes have not been examined over
time and any increase in temperatures could also increase rates of MeHg
production (Benoit et al. 2003).
Biological characteristics did not explain the Hg concentration increases
through time at KNPNHS. Growth rates of the yellow perch increased in 2 lakes
and explained the lack of Hg increases through time therein, but there were not
differences in growth, size, or age to explain the general increases in Hg
concentrations in yellow perch between 1996 and 2006. Stable isotopes were
not measured in the perch in 1996, but the trophic positions and littoral carbon
use, as determined by 15N and 13C, respectively, of yellow perch captured in
2006 were not different from those in circumneutral systems where lower Hg
concentrations have been reported (Vander Zanden et al. 1997, Gorski et al.
105
2003, McIntyre and Beauchamp 2007). 15N of archived samples of yellow perch
need to be measured to determine whether increased trophic positions caused
the Hg increases in perch at KNPNHS between 1996 and 2006.
It is possible that the increase in Hg concentrations in yellow perch in
KNPNHS were caused by an increase in the trophic transfer (biomagnification
rates) of mercury up through the food web. In Chapter 3 we showed that
concentrations of mercury in organisms were significantly predicted by their
trophic position, and that bioaccumulation rates differed significantly from one
lake to another. However, Hg was highest in perch from lakes with elevated Hg
in the invertebrates, rather than those with higher Hg-15N slopes, suggesting
that inputs to the base of the food web have changed since the mid-1990s rather
than the efficiencies of mercury transfer from prey to predator.
Increases in Hg concentrations in yellow perch are supported by Hg
increases in littoral macroinvertebrates over the same timeframe. Although
analyses of food webs were not completed as part of the studies from
1996/1997, dragonfly nymphs were collected from several lakes in KNPNHS and
analysed for total Hg (Gabriel 1998). When the 1997 dragonfly data were
converted to dry weight MeHg concentrations [assuming 63.8% MeHg for
dragonfly nymphs; (Tremblay et al. 1996a, Gorski et al. 2003)] and 80% moisture
(Hall et al. 1998)] the concentrations increased from ~0.09 to 0.26 (288%) at
Beaverskin, 0.09 to 0.44 (488%) at North Cranberry, and 0.09 to 0.17 µg MeHg/g
dry weight (188%) at Pebbleloggitch (Gabriel 1998). The proportional increases
in aeshnid Hg are substantially higher than those observed in the yellow perch
106
over the same time period, which may be a function of the uncertainties in
converting the data to dry weight MeHg concentrations, although it also reflects
the fact that the ratio of the Hg concentration of prey:predator (i.e.
biomagnification factor) decreases with each additional trophic level (Watras et
al. 1998, DeForest et al. 2007). The reasons for the increased Hg in lower-
trophic-level organisms, be it increased inputs from wetlands or elevated in situ
production of MeHg, are speculative at this time. Temporal assessment of Hg
concentrations in primary or secondary consumers and Hg bioaccumulation
through food webs would help to understand why the yellow perch Hg
concentrations increased over the past decade.
Fish from acidic (pH < 6) lakes tend to have higher Hg concentrations than
those from circumneutral lakes (Watras et al. 1998, Chen et al. 2005), although
no study had determined whether this was because of elevated Hg
bioaccumulation through the acidic food webs. In Chapter 3 we used slopes
from the Hg -15N regressions to show that Hg bioaccumulation rates for the
lakes in KNPNHS did not exceed those of some lakes in other regions with
different physical (e.g. lake size, temperature), chemical (e.g. pH), or biological
(e.g. number of fish species) characteristics (Atwell et al. 1998, Kidd et al. 2003).
This, in turn, illustrated that differences in Hg bioaccumulation rates cannot
explain the elevated Hg concentrations of predaceous fish from acidified lakes.
Rather, as discussed previously, the Hg concentrations in lower trophic
organisms were good predictors of Hg concentrations in yellow perch at
KNPNHS; further study is required to determine if this can explain differences in

107
Hg concentrations in top predators from a broader suite of systems. Previous
studies have examined the Hg-15N relationship in circumneutral systems; this
was the first study to use this tool to examine food web structure and Hg
bioaccumulation in acidic, species-poor lakes. This study in KNPNHS and those
in the literature (Atwell et al. 1998, Bowles et al. 2001, Kidd et al. 2003, McIntyre
and Beauchamp 2007) have shown that the technique can be applied across
systems that differ in water quality, climate, and species composition.
More studies are using Hg bioaccumulation rates to understand the
elevated Hg concentrations in top predators; however, Hg concentrations are
reported as MeHg or total Hg, or as dry or wet weights (Atwell et al. 1998,
Bowles et al. 2001, Kidd et al. 2003, McIntyre and Beauchamp 2007), making
among-system comparisons difficult. This study showed that bioaccumulation
rates do not vary with the type of Hg data used in the regression (for fish),
although intercepts (i.e. Hg at the base of the food web) were significantly higher
with dry weight than wet weight data. Data analyses in these studies should be
standardized so that future comparisons of Hg bioaccumulation rates and Hg
concentrations at the base of the food web are not confounded by such
differences.
4.2 Implications and future work
The increases in yellow perch Hg concentrations between 1996/1997 and
2006 suggest that other organisms in KNPNHS are likely at increased risk of Hg
toxicity. Studies on current Hg concentrations and reproductive success in

108
common loons (Gavia immer) in KNPNHS are necessary to determine the
current degree of toxic effects in the loon population. The observation that the
number of lakes with mean Hg concentrations in yellow perch exceeding the
threshold were common loons have 50% reduced maximum reproductivity [0.21
µg/g; (Burgess and Meyer 2007)] increased from 60 to 100% between 1996/1997
and 2006 illustrates that this species is at greater risk from the elevated MeHg
contamination of KNPNHS lakes. In 1995-1997, 92% of loons in KNPNHS
already had blood Hg concentrations exceeding the concentration where loons
have reduced breeding behaviour (e.g. tendency to build nests) and number of
chicks fledged (Burgess et al. 1998b, Burgess et al. 2005). Sports fish in this
park will also likely have higher Hg concentrations than in the past,
demonstrating a need for a re-evaluation of the guidelines regarding the size of
fish that is safe for human consumption.
Local remediation of Hg contamination of the KNPNHS food webs is not
likely an option. Acidic lakes can be limed to increase the pH and reduce MeHg
production and Hg bioavailability (Andersson et al. 1995, Mailman et al. 2006).
The lakes at KNPNHS are naturally acidic (Ginn et al. 2007), and elevating the
lake pH to circumneutral levels would be highly unnatural and not sustainable,
and an abrupt change in pH would have deleterious effects on the biota (Havas
and Rosseland 1995). Another technique that has been shown to reduce Hg in
fish is to intensively fish the lakes to reduce population numbers and enhance
fish growth rates or change their dietary habits (Verta 1990, Mailman et al. 2006).
Fish in the acid-stressed, oligotrophic lakes at KNPNHS have lower growth rates
109
than other lakes (Carter et al. 2001); therefore, intensive fishing would not
necessarily cause population growth and reduced fish Hg through growth
dilution. Finally, nutrient additions to the lakes could increase the productivity
and reduce Hg concentrations in fish through bloom dilution (Pickhardt et al.
2002, 2005, Mailman et al. 2006); again, however, this would not be sustainable
in these oligotrophic lakes. With few practical local remediation options
available, regional deposition of Hg and acidifying substances will have to decline
further before concentrations in perch at KNPNHS will return to 1996 levels.
It is important to continue to monitor Hg concentrations in perch at
KNPNHS to assess the impacts of future reductions in Hg emissions and
acidifying substances on these ecosystems, determine Hg toxicity for other
species (i.e. loons), and evaluate management options related to Hg
concentrations in biota (e.g. remediation). This thesis focused on temporal
trends in yellow perch but the correlation between MeHg in dragonfly nymphs
and yellow perch in a subset of lakes suggests that this invertebrate may be a
feasible surrogate for fish sampling. However, the effort to sample sufficient
masses of dragonfly nymphs (~100 mg dry weight) is greater than for sampling
fish, and invertebrates are shorter lived and have more variable Hg
concentrations within seasons than fish (Slotton et al. 1995). In addition, the cost
of analyzing total Hg in fish tissues is less than that of measuring MeHg (i.e. for
invertebrate samples). Overall, yellow perch are currently the most efficient, cost
effective, and ecologically relevant (to loons) organism for long term monitoring
programs (Wiener et al. 2007). The larger perch (> 18 cm) could be sampled

110
non-lethally; although these have less dietary importance to the loons, they can
be used to determine concentrations of Hg available to humans.
Most temporal trend studies were completed in regions where declining
atmospheric Hg inputs were expected to reduce Hg concentrations in fish
(Francesconi et al. 1997, Haines et al. 2003, Munthe et al. 2007). One region
had increases in fish Hg related to enhanced Hg deposition (Rasmussen et al.
2007), while two other regions had no significant change in Hg concentrations in
fish after more than 10 years (Johnston et al. 2003, Rasmussen et al. 2007).
This is the only study illustrating Hg increases in fish from natural lakes that were
not exposed to enhanced Hg deposition. These findings suggest that additional
temporal trend studies on other natural systems should be done. Considering
that more than 65% of the Hg inputs to a lake come from wetlands or uplands
and can act as a long term source of this pollutant (O'Driscoll et al. 2005a, Harris
et al. 2007), temporal trend analyses of fish in wetland dominated lakes, like
those in KNPNHS, may show concentration increases similar to those found in
the current study.
Rates of decline of Hg in fish populations may also be affected by the
dietary habits of the species; MeHg may be more bioavailable to and recycled in
the littoral food web (as compared to the pelagic food web), thus reducing rates
of recovery from Hg contamination (Orihel et al. 2008). In enclosure experiments
where spikes of Hg were added to the water column, MeHg concentrations in
short-lived pelagic organisms (e.g. zooplankton) decreased more rapidly than
those of longer-lived, sediment-dwelling invertebrates and fish (Orihel et al.
111
2008), illustrating that it may take many years before yellow perch (which feed
almost entirely in the littoral zone, Chapter 3) in KNPNHS have reduced Hg
concentrations. In addition, previous studies showed that Hg concentrations in
fishes from the pelagic food web can be significantly lower than those from
benthic habitats (Kidd et al. 2003). The high reliance on benthic production may
be another factor behind the lack of declines in yellow perch mercury
concentrations in KNPNHS.
Further studies are needed to understand the factors influencing Hg
concentrations at the base of food web, and how these factors change through
time or from one system to another. Few studies have quantified dry deposition
of Hg although more than one third of Hg inputs to the landscape are from dry
deposition (Miller et al. 2005). Therefore these inputs to the base of the food
web are obviously not accounted for in the current understanding of Hg dynamics
and require further investigation. The release of previously deposited Hg from
wetlands and uplands exceeds that of recently deposited Hg (Harris et al. 2007),
yet the factors influencing MeHg production and export from wetland are not fully
understood (St. Louis et al. 1994, Shanley et al. 2005). Research on the
parameters influencing in-lake methylation, demethylation, and volatilization
(e.g., temperature, oxygen, ligand concentration), especially at subtler
differences that have occasionally been examined (e.g. Tranvik 1988, Miskimmin
et al. 1992, O'Driscoll et al. 2004, Siciliano et al. 2005)] would aid in
understanding the large increase in biotic Hg concentrations over the last
decade.

112
Bibliography
Andersson, P., H. Borg, and P. Karrhage. 1995. Mercury in Fish Muscle in Acidified and Limed Lakes. Water Air and Soil Pollution 80:889-892.
Atwell, L., K. A. Hobson, and H. E. Welch. 1998. Biomagnification and bioaccumulation of mercury in an arctic marine food web: insights from stable nitrogen isotope analysis. Canadian Journal of Fisheries and Aquatic Sciences 55:1114-1121.
Baatrup, E. 1991. Structural and Functional-Effects of Heavy-Metals on the Nervous-System, Including Sense-Organs, of Fish. Comparative Biochemistry and Physiology C-Pharmacology Toxicology & Endocrinology 100:253-257.
Baker, R. F., P. J. Blanchfield, M. J. Paterson, R. J. Flett, and L. Wesson. 2004. Evaluation of nonlethal methods for the analysis of mercury in fish tissue. Transactions of the American Fisheries Society 133:568-576.
Barr, J. F. 1986. Population dynamics of the common loon (Gavia immer) associated with mercury-contaminated waters in northwestern Ontario. Canadian Wildlife Service.
Barr, J. F. 1996. Aspects of Common Loon (Gavia immer) feeding biology on its breeding ground. Hydrobiologia 321:119-144.
Barry Hanson, E. 2004. Mercury concentrations and trophic interactions of fish species in southwestern New Brunswick lakes. Masters of Science. University of New Brunswick, Fredericton, NB.
Bayley, S. E., R. S. Behr, and C. A. Kelly. 1986. Retention and Release of S from a Fresh-Water Wetland. Water Air and Soil Pollution 31:101-114.
Beamish, R. J., and H. H. Harvey. 1972. Acidification of the La Cloche Mountain Lakes, Ontario, and resulting fish mortalities. Journal of Fisheries Research Board of Canada 29:1131-1143.
Beauchamp, S., N. Burgess, A. d'Entremont, R. Tordon, G. Brun, D. Leger, W. Schroeder, and J. Abraham. 1998. Mercury in air, water and biota in Kejimkujik National Park, Nova Scotia, Canada. in N. W. P. Munro and J. H. M. Willison, editors. Linking protected areas with work landscapes conserving biodiversity; Proceedings of the third international conference on science and management of Protected Areas / 12-16 May 1997. Science and Management of Protected Areas Association, Wolfville.
Becker, D. S., and G. N. Bigham. 1995. Distribution of Mercury in the Aquatic Food-Web of Onondaga Lake, New-York. Water Air and Soil Pollution 80:563-571.
Benoit, J. M., C. C. Gilmour, A. Heyes, R. P. Mason, and C. L. Miller. 2003. Geochemical and biological controls over methylmercury production and degradation in aquatic ecosystems. Pages 262-297 in Biogeochemistry of Environmentally Important Trace Elements. AMER CHEMICAL SOC, Washington.
Berntssen, M. H. G., A. Aatland, and R. D. Handy. 2003. Chronic dietary mercury exposure causes oxidative stress, brain lesions, and altered behaviour in Atlantic salmon (Salmo salar) parr. Aquatic Toxicology 65:55-72.
113
Bodaly, R. A., J. W. M. Rudd, R. J. P. Fudge, and C. A. Kelly. 1993. Mercury Concentrations in Fish Related to Size of Remote Canadian Shield Lakes. Canadian Journal of Fisheries and Aquatic Sciences 50:980-987.
Bowles, K. C., S. C. Apte, W. A. Maher, M. Kawei, and R. Smith. 2001. Bioaccumulation and biomagnification of mercury in Lake Murray, Papua New Guinea. Canadian Journal of Fisheries and Aquatic Sciences 58:888-897.
Brylinsky, M. 2006. Assessment of changes in cold water lake habitat in the Upper Mersey watershed. Prepared for the Mersey Tobeatic Research Institute Acadia University.
Brylinsky, M. 2007. Further assessment of changes in cold water lake habitat in the Upper Mersey watershed. Prepared for the Mersey Tobeatic Research Institute. Acadia University, Wolfville, NS.
Burgess, N. M. 2005. Mercury in biota and its effects. Pages 235-258 in M. B. Parsons and J. B. Percival, editors. Mercury: Sources, Measurements, Cycles and Effects. Mineral. Assoc. Canada.
Burgess, N. M., A. A. d'Entremont, C. Drysdale, O. C. Vaidya, and G. L. Brun. 1998a. Mercury in yellow perch in Kejimkujik National Park in Mercury in Atlantic Canada: A progress Report. Mercury Team, Regional Science Coordinating Committee, Environment Canada - Atlantic Region. Sackville, NB.
Burgess, N. M., D. C. Evers, and J. D. Kaplan. 2005. Mercury and other contaminants in common loons breeding in Atlantic Canada. Ecotoxicology 14:241-252.
Burgess, N. M., D. C. Evers, J. D. Kaplan, M. Duggan, and J. J. Kerekes. 1998b. Mercury and reproductive success of common loons breeding in the Maritimes in Mercury in Atlantic Canada: A progress Report. Mercury Team, Regional Science Coordinating Committee, Environment Canada - Atlantic Region. Sackville, NB.
Burgess, N. M., and K. Hobson. 2006. Bioaccumulation of mercury in yellow perch (Perca flavescens) and common loons (Gavia immer) in relation to lake chemistry in Atlantic Canada. Hydrobiologia 567:275-282.
Burgess, N. M., and M. W. Meyer. 2007. Methylmercury exposure associated with reduced productivity in common loons. Ecotoxicology accepted.
Burgess, N. M., and M. W. Meyer. 2008. Methylmercury exposure associated with reduced productivity in common loons. Ecotoxicology accepted.
Cabana, G., and J. B. Rasmussen. 1994. Modeling Food-Chain Structure and Contaminant Bioaccumulation Using Stable Nitrogen Isotopes. Nature 372:255-257.
Cabana, G., and J. B. Rasmussen. 1996. Comparing aquatic food chains using nitrogen isotopes. Proceedings of the National Academy of Sciences of the United States of America 93:10844-10847.
Cabana, G., A. Tremblay, J. Kalff, and J. B. Rasmussen. 1994. Pelagic Food-Chain Structure in Ontario Lakes - a Determinant of Mercury Levels in Lake Trout (Salvelinus namaycush). Canadian Journal of Fisheries and Aquatic Sciences 51:381-389.
114
Cai, Y., G. Tang, R. Jaffe, and R. Jones. 1997. Evaluation of some isolation methods for organomercury determination in soil and fish samples by capillary gas chromatography - Atomic fluorescence spectrometry. International Journal of Environmental Analytical Chemistry 68:331-345.
Carter, J., C. Drysdale, N. Burgess, S. Beauchamp, G. Brun, and A. d'Entremont. 2001. Mercury concentrations in yellow perch (Perca flavescens) from 24 lakes at Kejimkujik National Park, Nova Scotia. Parks Canada - Technical reports in ecosystem Science. Report 031.
Chadwick, S. P., C. L. Babiarz, J. P. Hurley, and D. E. Armstrong. 2006. Influences of iron, manganese, and dissolved organic carbon on the hypolimnetic cycling of amended mercury. Science of the Total Environment 368:177-188.
Chen, C. Y., R. S. Stemberger, N. C. Kamman, B. M. Mayes, and C. L. Folt. 2005. Patterns of Hg bioaccumulation and transfer in aquatic food webs across multi-lake studies in the northeast US. Ecotoxicology 14:135-147.
Chen, C. Y., R. S. Stemberger, B. Klaue, J. D. Blum, P. C. Pickhardt, and C. L. Folt. 2000. Accumulation of heavy metals in food web components across a gradient of lakes. Limnology and Oceanography 45:1525-1536.
Clair, T. A., J. M. Ehrman, A. J. Ouellet, G. Brun, D. Lockerbie, and C. U. Ro. 2002. Changes in freshwater acidification trends in Canada's Atlantic Provinces: 1983-1997. Water Air and Soil Pollution 135:335-354.
DeForest, D. K., K. V. Brix, and W. J. Adams. 2007. Assessing metal bioaccumulation in aquatic environments: The inverse relationship between bioaccumulation factors, trophic transfer factors and exposure concentration. Aquatic Toxicology 84:236-246.
Deniro, M. J., and S. Epstein. 1978. Influence of Diet on Distribution of Carbon Isotopes in Animals. Geochimica Et Cosmochimica Acta 42:495-506.
d'Entremont, A., J. Carter, N. Burgess, C. Drysdale, G. Brun, and S. Beauchamp. 1998. Mercury concentrations in brook trout and white perch from Kejimkujik National Park, Nova Scotia. Parks Canada Technical Reports in Ecosystem Science.
Doka, S. E., D. K. McNicol, M. L. Mallory, I. Wong, C. K. Minns, and N. D. Yan. 2003. Assessing potential for recovery of biotic richness and indicator species due to changes in acidic deposition and lake pH in five areas of southeastern Canada. Environmental Monitoring and Assessment 88:53-101.
Doucett, R. R., D. R. Barton, K. R. A. Guiguer, G. Power, and R. J. Drimmie. 1996. Comment: Critical examination of stable isotope analysis as a means for tracing carbon pathways in stream ecosystems. Canadian Journal of Fisheries and Aquatic Sciences 53:1913-1915.
Drevnick, P. E., D. E. Canfield, P. R. Gorski, A. L. C. Shinneman, D. R. Engstrom, D. C. G. Muir, G. R. Smith, P. J. Garrison, L. B. Cleckner, J. P. Hurley, R. B. Noble, R. R. Otter, and J. T. Oris. 2007. Deposition and cycling of sulfur controls mercury accumulation in Isle Royale fish. Environmental Science & Technology DOI: 10.1021/es0712322.

115
Driscoll, C. T., V. Blette, C. Yan, C. L. Schofield, R. Munson, and J. Holsapple. 1995. The Role of Dissolved Organic Carbon in the Chemistry and Bioavailability of Mercury in Remote Adirondack Lakes. Water Air and Soil Pollution 80:499-508.
Driscoll, C. T., K. M. Driscoll, M. J. Mitchell, and D. J. Raynal. 2003. Effects of acidic deposition on forest and aquatic ecosystems in New York State. Environmental Pollution 123:327-336.
Drysdale, C. 2005. Kejimkujik National Park and Kejimkujik National Historic Site. Pages 1-3 in N. J. O'Driscoll, A.N. Rencz, and D.R.S. Lean, editor. Mercury cycling in a wetland-dominate ecosystem: A multidisciplinary study. Society of Environmental Toxicology and Chemistry (SETAC), Pensacola (FL).
Drysdale, C., N. M. Burgess, A. d'Entremont, J. Carter, and G. Brun. 2005. Mercury in brook trout, white perch, and yellow perch in Kejimkujik National Park. Pages 323-348 in N. J. O'Driscoll, A.N. Rencz, and D.R.S. Lean, editor. Mercury cycling in a wetland dominated ecosystem: A multidisciplinary study. Society of Environmental Toxicology and Chemistry (SETAC), Pensacola, FL.
Environment Canada. 1982. Analytical methods manual. Inland Waters Directorate, Environment Canada, Ottawa, ON.
Environment Canada. 2003. Mercury: Fishing for Answers. ISBN 0-662-67112-0, Water Policy and Coordination Directorate, Environment Canada, Hull, QC.
Evans, M. S., W. L. Lockhart, L. Doetzel, G. Low, D. Muir, K. Kidd, G. Stephens, and J. Delaronde. 2005. Elevated mercury concentrations in fish in lakes in the Mackenzie River Basin: The role of physical, chemical and biological factors. Science of the Total Environment 351-352:479-500.
Evers, D. C., Y. J. Han, C. T. Driscoll, N. C. Kamman, M. W. Goodale, K. F. Lambert, T. M. Holsen, C. Y. Chen, T. A. Clair, and T. Butler. 2007. Biological mercury hotspots in the northeastern United States and southeastern Canada. Bioscience 57:29-43.
Evers, D. C., J. D. Kaplan, M. W. Meyer, P. S. Reaman, W. E. Braselton, A. Major, N. Burgess, and A. M. Scheuhammer. 1998. Geographic trend in mercury measured in common loon feathers and blood. Environmental Toxicology and Chemistry 17:173-183.
Fevold, B. M., M. W. Meyer, P. W. Rasmussen, and S. A. Temple. 2003. Bioaccumulation patterns and temporal trends of mercury exposure in Wisconsin common loons. Ecotoxicology 12:83-93.
Fournier, F., W. H. Karasov, K. P. Kenow, M. W. Meyer, and R. K. Hines. 2002. The oral bioavailability and toxicokinetics of methylmercury in common loon (Gavia immer) chicks. Comparative Biochemistry and Physiology a-Molecular and Integrative Physiology 133:703-714.
France, R. L., and M. A. Schlaepfer. 2000. C-13 and N-15 depletion in components of a foodweb from an ephemeral boreal wetland compared to boreal lakes: putative evidence for microbial processes. Hydrobiologia 439:1-6.
116
Francesconi, K. A., R. C. J. Lenanton, N. Caputi, and S. Jones. 1997. Long-term study of mercury concentrations in fish following cessation of a mercury-containing discharge. Marine Environmental Research 43:27-40.
Frederick, P. C., M. G. Spalding, and R. Dusek. 2002. Wading birds as bioindicators of mercury contamination in Florida, USA: Annual and geographic variation. Environmental Toxicology and Chemistry 21:163-167.
Freedman, B., and S. Beauchamp. 1998. Implications of atmospheric change for biodiversity of aquatic ecosystems in Canada. Environmental Monitoring and Assessment 49:271-280.
Gabriel, C. E. 1998. The accumulation of mercury in aquatic ecosystems at Kejimkujik National Park, NS. BSc. Thesis. Dalhousie University, Halifax, NS.
Gaebler, O. H., T. G. Vitti, and R. Vukmirovich. 1966. Isotope effects in metabolism of 14N and 15N from unlabeled dietary proteins. Canadian Journal of Biochemistry 44:1249 - 1257.
Gido, K. B., N. R. Franssen, and D. L. Propst. 2006. Spatial variation in delta N-15 and delta C-13 supercript stopC isotopes in the San Juan River, New Mexico and Utah: implications for the conservation of native fishes. Environmental Biology of Fishes 75:197-207.
Gill, G. A., and K. W. Bruland. 1990. Mercury Speciation in Surface Fresh-Water Systems in California and Other Areas. Environmental Science & Technology 24:1392-1400.
Gilmour, C. C., E. A. Henry, and R. Mitchell. 1992. Sulfate Stimulation of Mercury Methylation in Fresh-Water Sediments. Environmental Science & Technology 26:2281-2287.
Ginn, B. K., B. F. Cumming, and J. P. Smol. 2007. Assessing pH changes since pre-industrial times in 51 low-alkalinity lakes in Nova Scotia, Canada. Canadian Journal of Fisheries and Aquatic Sciences 64:1043-1054.
Gorski, P. R., L. B. Cleckner, J. P. Hurley, M. E. Sierszen, and D. E. Armstrong. 2003. Factors afffecting enhanced mercury bioaccumulation in inland lakes of Isle Royale National Park, USA. Science of the Total Environment 304:327-348.
Greenfield, B. K., T. R. Hrabik, C. J. Harvey, and S. R. Carpenter. 2001. Predicting mercury levels in yellow perch: use of water chemistry, trophic ecology, and spatial traits. Canadian Journal of Fisheries and Aquatic Sciences 58:1419-1429.
Gunn, J. M., and W. Keller. 1990. Biological Recovery of an Acid Lake after Reductions in Industrial Emissions of Sulfur. Nature 345:431-433.
Haines, T. A., T. W. May, R. T. Finlayson, and S. E. Mierzykowski. 2003. Factors affecting food chain transfer of mercury in the vicinity of the Nyanza Site, Sudbury River, Massachusetts. Environmental Monitoring and Assessment 86:211-232.
Hall, B. D., R. A. Bodaly, R. J. P. Fudge, J. W. M. Rudd, and D. M. Rosenberg. 1997. Food as the Dominant Pathway of Methylmercury Uptake by Fish. Water Air and Soil Pollution 100:13-24.
117
Hall, B. D., D. M. Rosenberg, and A. P. Wiens. 1998. Methyl mercury in aquatic insects from an experimental reservoir. Canadian Journal of Fisheries and Aquatic Sciences 55:2036-2047.
Harris, R. C., J. W. M. Rudd, M. Amyot, C. L. Babiarz, K. G. Beaty, P. J. Blanchard, R. A. Bodaly, B. A. Branfireun, C. C. Gilmour, J. A. Graydon, A. Heyes, H. Hintelmann, J. P. Hurley, C. A. Kelly, D. P. Krabbenhoft, S. E. Lindberg, R. P. Mason, M. J. Paterson, C. L. Podemski, A. Robinson, K. A. Sandilands, G. R. Southworth, V. L. St. Louis, and M. T. Tate. 2007. Whole-ecosystem study shows rapid fish-mercury response to changes in mercury deposition. Proc. Natl. Acad. Sci. U.S.A. DOI: 10.1073/pnas.0704186104.
Havas, M., and B. O. Rosseland. 1995. Response of zooplankton, benthos, and fish to acidification: An overview. Water Air and Soil Pollution 85:51-62.
Health Canada. 2007. Updating the existing risk management strategy for mercury in retail fish. Cat. H164-55/2007E-PDF, Bureau of Chemical Safety, Food Directorate, Health Products and Food Branch, Ottawa.
Hecky, R. E., and R. H. Hesslein. 1995. Contributions of benthic algae to lake food webs as revealed by stable isotope analysis. Journal of the North American Benthological Society 14:631-653.
Hintelmann, H., P. M. Welbourn, and R. D. Evans. 1995. Binding of Methylmercury Compounds by Humic and Fulvic-Acids. Water Air and Soil Pollution 80:1031-1034.
Hrabik, T. R., and C. J. Watras. 2002. Recent declines in mercury concentration in a freshwater fishery: isolating the effects of de-acidification and decreased atmospheric mercury deposition in Little Rock Lake. Science of the Total Environment 297:229-237.
Huckabee, J. W., J. W. Elwood, and S. G. Hildebrand. 1979. Accumulation of mercury in freshwater biota. Pages 277-302 in J. O. Nriagu, editor. The biogeochemistry of mercury in the environment. Elsevier/North-Holland Biomedical Press, New York.
Jeffries, D. S., editor. 1997. 1997 Canadian Acid Rain Assessment, Volume 3: The effects on Canada's lakes, rivers and wetlands. Ministry of the Environment, Ottawa, Ontario, Canada.
Jeffries, D. S., S. E. Doka, M. L. Mallory, F. Norouzian, A. Storey, and I. Wong. 1998. Aquatic effects of acidic deposition in Canada: present and predicted future situation. Revue des Sciences de l'eau special:129-143.
Johnston, T. A., W. C. Leggett, R. A. Bodaly, and H. K. Swanson. 2003. Temporal changes in mercury bioaccumulation by predatory fishes of boreal lakes following the invasion of an exotic forage fish. Environmental Toxicology and Chemistry 22:2057-2062.
Kamman, N. C., N. M. Burgess, C. T. Driscoll, H. A. Simonin, W. Goodale, J. Linehan, R. Estabrook, M. Hutcheson, A. Major, A. M. Scheuhammer, and D. A. Scruton. 2005. Mercury in freshwater fish of northeast North America - A geographic perspective based on fish tissue monitoring databases. Ecotoxicology 14:163-180.
118
Keeley, J. E., and D. R. Sandquist. 1992. Carbon - Fresh-Water Plants. Plant Cell and Environment 15:1021-1035.
Keller, W., P. Dillon, J. Heneberry, M. Malette, and J. Gunn. 2001. Sulphate in Sudbury, Ontario, Canada, lakes: Recent trends and status. Water Air and Soil Pollution 130:793-798.
Keller, W., J. H. Heneberry, and S. S. Dixit. 2003. Decreased acid deposition and the chemical recovery of Killarney, Ontario, lakes. Ambio 32:183-189.
Kelly, C. A., J. W. M. Rudd, and M. H. Holoka. 2003. Effect of pH on mercury uptake by an aquatic bacterium: Implications for Hg cycling. Environmental Science & Technology 37:2941-2946.
Kerekes, J. 1975a. Aquatic Resources Inventory, Kejimkujik National Park. Part 6: Limnological conditions in thirty lakes. Canadian Wildlife Service, Halifax, NS.
Kerekes, J. 1975b. Aquatic Resources Inventory, Kejimkujik National Park. Part 7: Distribution of fishes. Canadian Wildlife Service, Halifax, NS.
Kerekes, J., B. Freedman, S. Beauchamp, and R. Tordon. 1989. Physical and Chemical Characteristics of Three Acidic, Oligotrophic Lakes and Their Watersheds in Kejimkujik-National-Park, Nova-Scotia. Water Air and Soil Pollution 46:99-117.
Kerekes, J., and P. Schwinghamer. 1973. Aquatic Reseources Inventory, Kejimkujik National Park. Part 2: Lake drainage and morphometry. Canadian Wildlife Service, Halifax, NS.
Kidd, K. A., H. A. Bootsma, R. H. Hesslein, W. L. Lockhart, and R. E. Hecky. 2003. Mercury concentrations in the food web of Lake Malawi, East Africa. Journal of Great Lakes Research 29:258-266.
Kidd, K. A., R. H. Hesslein, R. J. P. Fudge, and K. A. Hallard. 1995. The Influence of Trophic Level as Measured by d15N on Mercury Concentrations in Fresh-Water Organisms. Water Air and Soil Pollution 80:1011-1015.
Kidd, K. A., R. H. Hesslein, B. J. Ross, K. Koczanski, G. R. Stephens, and D. C. G. Muir. 1998. Bioaccumulation of organochlorines through a remote freshwater food web in the Canadian Arctic. Environmental Pollution 102:91-103.
Kidd, K. A., M. J. Paterson, R. H. Hesslein, D. C. G. Muir, and R. E. Hecky. 1999. Effects of northern pike (Esox lucius) additions on pollutant accumulation and food web structure, as determined by delta C-13 and delta N-15, in a eutrophic and an oligotrophic lake. Canadian Journal of Fisheries and Aquatic Sciences 56:2193-2202.
Kling, G. W., B. Fry, and W. J. Obrien. 1992. Stable Isotopes and Planktonic Trophic Structure in Arctic Lakes. Ecology 73:561-566.
Kovecses, J., G. D. Sherwood, and J. B. Rasmussen. 2005. Impacts of altered benthic invertebrate communities on the feeding ecology of yellow perch (Perca flavescens) in metal-contaminated lakes. Canadian Journal of Fisheries and Aquatic Sciences 62:153-162.
Lindqvist, O., K. Johansson, M. Aastrup, A. Andersson, L. Bringmark, G. Hovsenius, L. Hakanson, A. Iverfeldt, M. Meili, and B. Timm. 1991.

119
Mercury in the Swedish Environment - Recent Research on Causes, Consequences and Corrective Methods. Water Air and Soil Pollution 55:R11-&.
Lockhart, W. L., J. F. Uthe, A. R. Kenney, and P. M. Mehrle. 1972. Methylmercury in Northern Pike (Esox lucius): Distribution, Elimination, and Some Biochemical Characteristics of Contaminated Fish. Journal of Fisheries Research Board of Canada 29:1519-1523.
Lorey, P., and C. T. Driscoll. 1999. Historical trends of mercury deposition in Adirondack lakes. Environmental Science & Technology 33:718-722.
Madsen, E. R., and H. S. Stern. 2007. Time trends of methylmercury in walleye in northern Wisconsin: A hierarchical Bayesian analysis. Environmental Science & Technology 41:4568-4573.
Mailman, M., L. Stepnuk, N. Cicek, and R. A. Bodaly. 2006. Strategies to lower methyl mercury concentrations in hydroelectric reservoirs and lakes: A review. Science of the Total Environment 368:224-235.
Mason, R. P., W. F. Fitzgerald, and F. M. M. Morel. 1994. The Biogeochemical Cycling of Elemental Mercury - Anthropogenic Influences. Geochimica Et Cosmochimica Acta 58:3191-3198.
Mason, R. P., J. R. Reinfelder, and F. M. M. Morel. 1995. Bioaccumulation of mercury and methylmercury. Water Air and Soil Pollution 80:915-921.
Matilainen, T. 1995. Involvement of Bacteria in Methylmercury Formation in Anaerobic Lake Waters. Water Air and Soil Pollution 80:757-764.
McIntyre, J. K., and D. A. Beauchamp. 2007. Age and trophic position dominate bioaccumulation of mercury and organochlorines in the food web of Lake Washington. Science of the Total Environment 372:571-584.
Merritt, R. W., and K. W. Cummins. 1996. An introduction to the aquatic insects of North America; Third edition. Kendall/Hunt Publishing Company, Dubuque.
Mierle, G., and R. Ingram. 1991. The Role of Humic Substances in the Mobilization of Mercury from Watersheds. Water Air and Soil Pollution 56:349-357.
Miller, E. K., A. Vanarsdale, G. J. Keeler, A. Chalmers, L. Poissant, N. C. Kamman, and R. Brulotte. 2005. Estimation and mapping of wet and dry mercury deposition across northeastern North America. Ecotoxicology 14:53-70.
Minagawa, M., and E. Wada. 1984. Stepwise Enrichment of 15N Along Food Chains: Further Evidence and the Relation between d15N and Animal Age. Geochimica Et Cosmochimica Acta 48:1135-1140.
Miskimmin, B. M., J. W. M. Rudd, and C. A. Kelly. 1992. Influence of Dissolved Organic Carbon, pH, and Microbial Respiration Rates on Mercury Methylation and Demethylation in Lake Water. Canadian Journal of Fisheries and Aquatic Sciences 49:17-22.
Morel, F. M. M., A. M. L. Kraepiel, and M. Amyot. 1998. The chemical cycle and bioaccumulation of mercury. Annual Review of Ecology and Systematics 29:543-566.

120
Muir, D., X. W. Wang, D. Bright, L. Lockhart, and G. Kock. 2005. Spatial and temporal trends of mercury and other metals in landlocked char from lakes in the Canadian Arctic archipelago. Science of the Total Environment 351:464-478.
Munthe, J., R. A. Bodaly, B. A. Branfireun, C. T. Driscoll, C. C. Gilmour, R. Harris, M. Horvat, M. Lucotte, and O. Malm. 2007. Recovery of mercury-contaminated fisheries. Ambio 36:33-44.
Needham, J. G., and M. J. Westfall Jr. 1955. A manual of the Dragonflies of North America (Anisoptera). University of California Press, Berkeley.
Niimi, A. J., and G. P. Kissoon. 1994. Evaluation of the Critical Body Burden Concept Based on Inorganic and Organic Mercury Toxicity to Rainbow-Trout (Oncorhynchus-Mykiss). Archives of Environmental Contamination and Toxicology 26:169-178.
Nriagu, J. O. 1989. A Global Assessment of Natural Sources of Atmospheric Trace-Metals. Nature 338:47-49.
O'Driscoll, N. J., S. T. Beauchamp, T. A. Clair, A. N. Rencz, K. H. Telmer, S. D. Siciliano, and D. R. S. Lean. 2005a. Mercury mass balance for Big Dam West Lake, Kejimkujik Park: the role of volatilization. Pages 303-320 in N. J. O'Driscoll, A. N. Rencz, and D. R. S. Lean, editors. Mercury cycling in a wetland-dominate ecosystem: A multidisciplinary study. SETAC (Society of Environmental Toxicology and Chemistry), Pensacola, FL.
O'Driscoll, N. J., D. R. S. Lean, L. L. Loseto, R. Carignan, and S. D. Siciliano. 2004. Effect of dissolved organic carbon on the photoproduction of dissolved gaseous mercury in lakes: Potential impacts of forestry. Environmental Science & Technology 38:2664-2672.
O'Driscoll, N. J., A. N. Rencz, and D. R. S. Lean. 2005b. Review of factors affecting mercury fate in Kejimkujik Park, Nova Scotia. Pages 5-13 in N. J. O'Driscoll, A. N. Rencz, and D. R. S. Lean, editors. Mercury cycling in a wetland-dominate ecosystem: A multidisciplinary study. Society of Environmental Toxicology and Chemistry(SETAC), Pensacola (FL).
Orihel, D. M., M. J. Paterson, P. J. Blanchfield, R. A. Bodaly, C. C. Gilmour, and H. Hintelmann. 2008. Temporal changes in the distribution, methylation, and bioaccumulation of newly deposited mercury in an aquatic ecosystem. Environmental Pollution in press.
Orihel, D. M., M. J. Paterson, P. J. Blanchfield, R. A. Bodaly, and H. Hintelmann. 2007. Experimental evidence of a linear relationship between inorganic mercury loading and methylmercury accumulation by aquatic biota. Environmental Science & Technology 41:4952-4958.
Pacyna, E. G., and J. M. Pacyna. 2002. Global emission of mercury from anthropogenic sources in 1995.
Pacyna, E. G., J. M. Pacyna, F. Steenhuisen, and S. Wilson. 2006. Global anthropogenic mercury emission inventory for 2000. Atmospheric Environment 40:4048-4063.
Pacyna, J. M., and E. G. Pacyna. 2001. An assessment of global and regional emissions of trace metals to the atmosphere from anthropogenic sources worldwide. Environmental Review 9:269-298.

121
Paterson, M. J., P. J. Blanchfield, C. Podemski, H. H. Hintelmann, C. C. Gilmour, R. Harris, N. Ogrinc, J. W. M. Rudd, and K. A. Sandilands. 2006. Bioaccumulation of newly deposited mercury by fish and invertebrates: an enclosure study using stable mercury isotopes. Canadian Journal of Fisheries and Aquatic Sciences 63:2213-2224.
Peterson, B. J., and B. Fry. 1987. Stable isotopes in ecosystem studies. Annual review of ecology and systematics 18:293-320.
Phillips, D. L., and J. W. Gregg. 2001. Uncertainty in source partitioning using stable isotopes. Oecologia 127:171-179.
Pickhardt, P. C., and N. S. Fisher. 2007. Accumulation of inorganic and methylmercury by freshwater phytoplankton in two contrasting water bodies. Environmental Science & Technology 41:125-131.
Pickhardt, P. C., C. L. Folt, C. Y. Chen, B. Klaue, and J. D. Blum. 2002. Algal blooms reduce the uptake of toxic methylmercury in freshwater food webs. Proceedings of the National Academy of Sciences of the United States of America 99:4419-4423.
Pickhardt, P. C., C. L. Folt, C. Y. Chen, B. Klaue, and J. D. Blum. 2005. Impacts of zooplankton composition and algal enrichment on the accumulation of mercury in an experimental freshwater food web. Science of the Total Environment 339:89-101.
Ponce, R. A., and N. S. Bloom. 1991. Effect of pH on the Bioaccumulation of Low-Level, Dissolved Methylmercury by Rainbow-Trout (Oncorhynchus mykiss). Water Air and Soil Pollution 56:631-640.
Post, D. M. 2002. Using stable isotopes to estimate trophic position: Models, methods, and assumptions. Ecology 83:703-718.
Post, D. M., C. A. Layman, D. A. Arrington, G. Takimoto, J. Quattrochi, and C. G. Montana. 2007. Getting to the fat of the matter: models, methods and assumptions for dealing with lipids in stable isotope analyses. Oecologia 152:179-189.
Power, M., G. M. Klein, K. Guiguer, and M. K. H. Kwan. 2002. Mercury accumulation in the fish community of a sub-Arctic lake in relation to trophic position and carbon sources. Journal of Applied Ecology 39:819-830.
Rabenstein, D. L. 1978. The aqueous solution chemistry of methylmercury and its complexes. Accounts of Chemical Research 11:100-107.
Rabenstein, D. L., and C. A. Evans. 1978. Mobility of Methylmercury in Biological-Systems. Bioinorganic Chemistry 8:107-114.
Rasmussen, P. W., C. S. Schrank, and P. A. Campfield. 2007. Temporal trends in mercury concentrations in Wisconsin walleye (Sander vitreus), 1982 - 2005. Ecotoxicology DOI 10.107/s10646-007-0160-2.
Rencz, A. N., N. J. O'Driscoll, G. E. M. Hall, T. Peron, K. Telmer, and N. M. Burgess. 2003. Spatial variation and correlations of mercury levels in the terrestrial and aquatic components of a wetland dominated ecosystem: Kejimkujik Park, Nova Scotia, Canada. Water Air and Soil Pollution 143:271-288.
122
Rennie, M. D., N. C. Collins, B. J. Shuter, J. W. Rajotte, and P. Couture. 2005. A comparison of methods for estimating activity costs of wild fish populations: more active fish observed to grow slower. Canadian Journal of Fisheries and Aquatic Sciences 62:767-780.
Rodgers, D. W., and S. U. Qadri. 1982. Growth and Mercury Accumulation in Yearling Yellow Perch, Perca flavescens, in the Ottawa River, Ontario. Environmental Biology of Fishes 7:377-383.
Roos-Barraclough, F., N. Givelet, A. K. Cheburkin, W. Shotyk, and S. A. Norton. 2006. Use of Br and Se in peat to reconstruct the natural and anthropogenic fluxes of atmospheric Hg: A 10000-year record from Caribou Bog, Maine. Environmental Science & Technology 40:3188-3194.
Rudd, J. W. M. 1995. Sources of Methyl Mercury to Fresh-Water Ecosystems - a Review. Water Air and Soil Pollution 80:697-713.
Rutherford, L. A., G. Brun, G. R. J. Julien, F. Hebert, and R. E. Mroz. 1998. Mercury in Yellow Perch Study in Mercury in Atlantic Canada: A progress report. Mercury Team, Regional Science Coordinating Committee, Environment Canada - Atlantic Region. Sackville, NB.
Sangster, A., P. K. Smith, and G. E. Hall. 2005. Dissolved organic carbon and mercury reconnaissance survey of surface waters in Kejimkujik Park. in N. J. O'Driscoll, A.N. Rencz, and D.R.S. Lean, editor. Mercury cycling in a wetland dominated ecosystem: A multidisciplinary study. Society of Environ Toxicol Chem (SETAC), Pensacola (FL).
Schartau, A. K., B. Walseng, and E. Snucins. 2001. Correlation between Microcrustaceans and Environmental Variables along an Acidification Gradient in Sudbury, Canada. Water Air and Soil Pollution 130:1325-1330.
Scheuhammer, A. M., and P. J. Blancher. 1994. Potential risk to common loons (Gavia immer) from methylmercury exposure in acidified lakes. Hydrobiologia (Historical Archive) 279-280:445-455.
Scott, D. P., and F. A. J. Armstrong. 1972. Mercury concentration in relation to size in several species of freshwater fishes from Manitoba and northwestern Ontario. Journal of the Fisheries Research Board of Canada 29:1685-1690.
Scott, W. B., and E. J. Crossman. 1998. Freshwater fishes of Canada. Galt House Publications Ltd., Oakville.
Shanley, J. B., N. C. Kamman, T. A. Clair, and A. Chalmers. 2005. Physical controls on total and methylmercury concentrations in streams and lakes of the northeastern USA. Ecotoxicology 14:125-134.
Siciliano, S. D., N. J. O'Driscoll, R. Tordon, J. Hill, S. Beauchamp, and D. R. S. Lean. 2005. Abiotic production of methylmercury by solar radiation. Environmental Science & Technology 39:1071-1077.
Slemr, F., and E. Langer. 1992. Increase in Global Atmospheric Concentrations of Mercury Inferred from Measurements over the Atlantic Ocean. Nature 355:434-437.
Slotton, D. G., J. E. Reuter, and C. R. Goldman. 1995. Mercury Uptake Patterns of Biota in a Seasonally Anoxic Northern California Reservoir. Water Air and Soil Pollution 80:841-850.

123
Smith, P. K., A. L. Sangster, and A. O'Beirne-Ryan. 2005. Bedrock mercury at Kejimkujik National Park, Nova Scotia. in N. J. O'Driscoll, A.N. Rencz, and D.R.S. Lean, editor. Mercury cycling in a wetland dominated ecosystem: A multidisciplinary study. Society of Environmental Toxicology and Chemistry (SETAC), Pensacola, FL.
Snucins, E., J. Gunn, B. Keller, S. Dixit, A. Hindar, and A. Henriksen. 2001. Effects of regional reductions in sulphur deposition on the chemical and biological recovery of lakes within Killarney Park, Ontario, Canada. Environmental Monitoring and Assessment 67:179-194.
St. Louis, V. L., J. W. M. Rudd, C. A. Kelly, and L. A. Barrie. 1995. Wet deposition of methyl mercury in northwestern Ontario compared to other geographic locations. Water Air and Soil Pollution 80:405-414.
St. Louis, V. L., J. W. M. Rudd, C. A. Kelly, K. G. Beaty, N. S. Bloom, and R. J. Flett. 1994. Importance of wetlands as sources of methyl mercury to boreal forest ecosystems. Canadian Journal of Fisheries and Aquatic Sciences 51:1065-1076.
Stoddard, J. L., D. S. Jeffries, A. Lukewille, T. A. Clair, P. J. Dillon, C. T. Driscoll, M. Forsius, M. Johannessen, J. S. Kahl, J. H. Kellogg, A. Kemp, J. Mannio, D. T. Monteith, P. S. Murdoch, S. Patrick, A. Rebsdorf, B. L. Skjelkvale, M. P. Stainton, T. Traaen, H. van Dam, K. E. Webster, J. Wieting, and A. Wilander. 1999. Regional trends in aquatic recovery from acidification in North America and Europe. Nature 401:575-578.
Swanson, H. K., T. A. Johnston, W. C. Leggett, R. A. Bodaly, R. R. Doucett, and R. A. Cunjak. 2003. Trophic positions and mercury bioaccumulation in rainbow smelt (Osmerus mordax) and native forage fishes in northwestern Ontario lakes. Ecosystems 6:289-299.
Syvaranta, J., H. Hamalainen, and R. I. Jones. 2006. Within-lake variability in carbon and nitrogen stable isotope signatures. Freshwater Biology 51:1090-1102.
Temme, C., P. Blanchard, A. Steffen, C. Banic, S. Beauchamp, L. Poissant, R. Tordon, and B. Wiens. 2007. Trend, seasonal and multivariate analysis study of total gaseous mercury data from the Canadian atmospheric mercury measurement network (CAMNet). Atmospheric Environment:doi: 10.1016/j.atmosenv.2007.1002.1021.
Thorp, J. H., and A. P. Covich. 2001. Ecology and classification of North American freshwater invertebrates, 2nd edition. Academic Press, San Diego.
Tordon, R., J. Dalziel, and S. Beauchamp. 2006. Mercury in air and precipitation in Atlantic Canada. Science Report Series 2006-08, Meteorological Service of Canada, Atlantic Region, Dartmouth, N.S.
Tranvik, L. J. 1988. Availability of Dissolved Organic-Carbon for Planktonic Bacteria in Oligotrophic Lakes of Differing Humic Content. Microbial Ecology 16:311-322.
Tremblay, A., M. Lucotte, and I. Rheault. 1996a. Methylmercury in a benthic food web of two hydroelectric reservoirs and a natural lake of Northern Quebec (Canada). Water Air and Soil Pollution 91:255-269.

124
Tremblay, G., J. F. Doyon, and R. Schetagne. 1996b. Environmental monitoring of the La Grand Complex. Monitoring of mercury levels in fish: approach and methods. Joint Report of the Direction principale Communications et Environment, Hydro Quebec and Groupe-conseil Genivar inc.:33 p. and appendices.
Tremblay, G., P. Legendre, J. F. Doyon, R. Verdon, and R. Schetagne. 1998. The use of polynomial regression analysis with indicator variables for interpretation of mercury in fish data. Biogeochemistry 40:189-201.
Trudel, M., and J. B. Rasmussen. 1997. Modeling the elimination of mercury by fish. Environmental Science & Technology 31:1716-1722.
Trudel, M., and J. B. Rasmussen. 2006. Bioenergetics and mercury dynamics in fish: a modelling perspective. Canadian Journal of Fisheries and Aquatic Sciences 63:1890-1902.
Vaidya, O. C., G. D. Howell, and D. A. Leger. 2000. Evaluation of the distribution of mercury in lakes in Nova Scotia and Newfoundland (Canada). Water Air and Soil Pollution 117:353-369.
Vander Zanden, M. J., G. Cabana, and J. B. Rasmussen. 1997. Comparing trophic position of freshwater fish calculated using stable nitrogen isotope ratios (d15N) and literature dietary data. Canadian Journal of Fisheries and Aquatic Sciences 54:1142-1158.
Vander Zanden, M. J., and J. B. Rasmussen. 1999. Primary consumer d13C and d15N and the trophic position of aquatic consumers. Ecology 80:1395-1404.
Verta, M. 1990. Changes in Fish Mercury Concentrations in an Intensively Fished Lake. Canadian Journal of Fisheries and Aquatic Sciences 47:1888-1897.
Watras, C. J., R. C. Back, S. Halvorsen, R. J. M. Hudson, K. A. Morrison, and S. P. Wente. 1998. Bioaccumulation of mercury in pelagic freshwater food webs. Science of the Total Environment 219:183-208.
Watras, C. J., K. A. Morrison, J. S. Host, and N. S. Bloom. 1995. Concentration of Mercury Species in Relationship to Other Site-Specific Factors in the Surface Waters of Northern Wisconsin Lakes. Limnology and Oceanography 40:556-565.
Welch, D. 1998. Air quality issues, monitoring and management in Canadian national parks. Pages 363-377 in N. W. P. Munro and J. H. M. Willison, editors. Linking protected areas with working landscapes conserving biodiversity: Proceedings of the third international conference on science and management of protected areas / 12-16 May 1997. Science and Managenment of Protected Areas Association, Wolfville.
Wiener, J. G., R. A. Bodaly, S. S. Brown, M. Lucotte, M. C. Newman, D. B. Porcella, R. J. Reash, and E. B. Swain. 2007. Monitoring and evaluating trends in methylmercury accumulation in aquatic biota. Pages 87-122 in R. Harris, D. P. Krabbenhoft, R. P. Mason, M. W. Murray, R. Reash, and T. Saltman, editors. Ecosystem responses to mercury contamination: Indicators of change. SETAC (Society of Environmental Toxicology and Chemistry), Pensacola, FL.
125
Wiener, J. G., D. P. Krabbenhoft, G. H. Heinz, and A. M. Scheuhammer. 2003. Ecotoxicology of Mercury. Pages 409-463 in D. J. Hoffman, B.A. Rattner, G.A. Burton, Jr., and J. Cairns, Jr., editor. Handbook of Ecotoxicology, Second Edition. Lewis Publishers, New York.
Wood, J. A., and C. D. A. Rubec. 1989. Chemical Characterization of Several Wetlands in Kejimkujik-National-Park, Nova-Scotia. Water Air and Soil Pollution 46:177-186.
Xun, L., N. E. R. Campbell, and J. W. M. Rudd. 1987. Measurements of Specific Rates of Net Methyl Mercury Production in the Water Column and Surface Sediments of Acidified and Circumneutral Lakes. Canadian Journal of Fisheries and Aquatic Sciences 44:750-757.
Zar, J. H. 1999. Biostatistical analysis, Fourth edition. Prentice-Hall, Upper Saddle River, NJ.
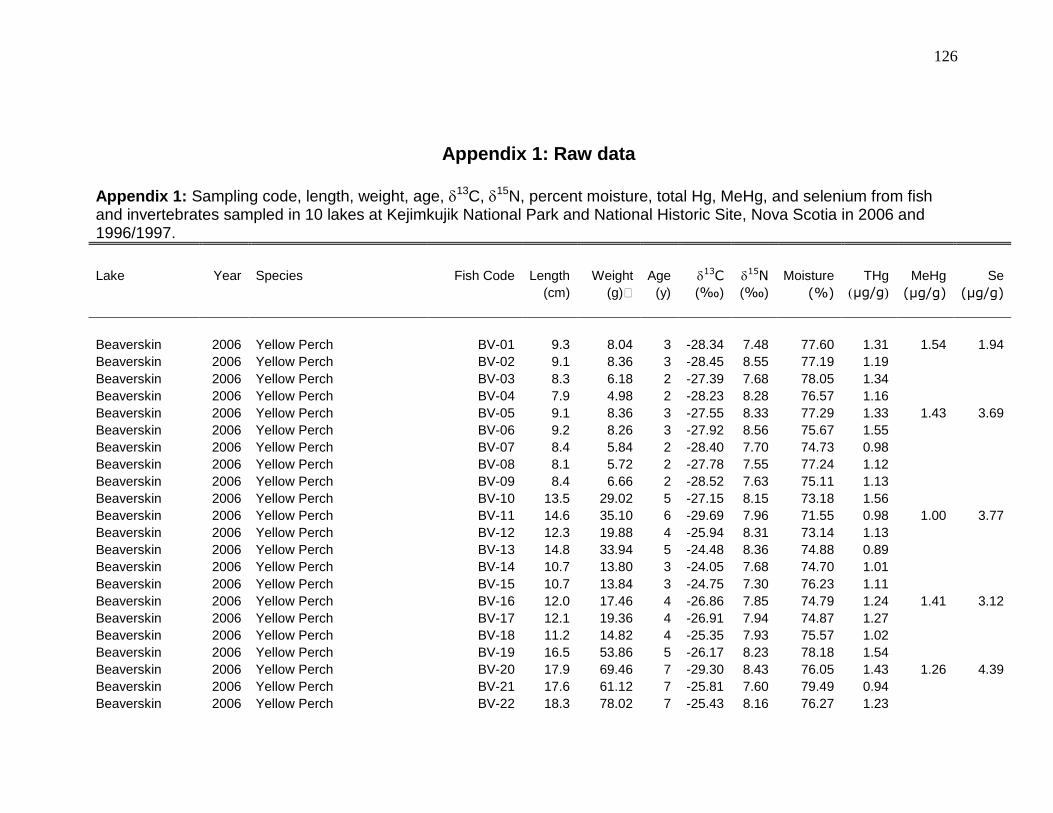
126
Appendix 1: Raw data
Appendix 1: Sampling code, length, weight, age, 13C, 15N, percent moisture, total Hg, MeHg, and selenium from fish and invertebrates sampled in 10 lakes at Kejimkujik National Park and National Historic Site, Nova Scotia in 2006 and 1996/1997.
Lake Year Species Fish Code Length Weight Age 13C
15N Moisture THg MeHg Se
(cm) (g) (y) (‰) (‰) (%) µg/g) (µg/g) (µg/g)
Beaverskin 2006 Yellow Perch BV-01 9.3 8.04 3 -28.34 7.48 77.60 1.31 1.54 1.94
Beaverskin 2006 Yellow Perch BV-02 9.1 8.36 3 -28.45 8.55 77.19 1.19
Beaverskin 2006 Yellow Perch BV-03 8.3 6.18 2 -27.39 7.68 78.05 1.34
Beaverskin 2006 Yellow Perch BV-04 7.9 4.98 2 -28.23 8.28 76.57 1.16
Beaverskin 2006 Yellow Perch BV-05 9.1 8.36 3 -27.55 8.33 77.29 1.33 1.43 3.69
Beaverskin 2006 Yellow Perch BV-06 9.2 8.26 3 -27.92 8.56 75.67 1.55
Beaverskin 2006 Yellow Perch BV-07 8.4 5.84 2 -28.40 7.70 74.73 0.98
Beaverskin 2006 Yellow Perch BV-08 8.1 5.72 2 -27.78 7.55 77.24 1.12
Beaverskin 2006 Yellow Perch BV-09 8.4 6.66 2 -28.52 7.63 75.11 1.13
Beaverskin 2006 Yellow Perch BV-10 13.5 29.02 5 -27.15 8.15 73.18 1.56
Beaverskin 2006 Yellow Perch BV-11 14.6 35.10 6 -29.69 7.96 71.55 0.98 1.00 3.77
Beaverskin 2006 Yellow Perch BV-12 12.3 19.88 4 -25.94 8.31 73.14 1.13
Beaverskin 2006 Yellow Perch BV-13 14.8 33.94 5 -24.48 8.36 74.88 0.89
Beaverskin 2006 Yellow Perch BV-14 10.7 13.80 3 -24.05 7.68 74.70 1.01
Beaverskin 2006 Yellow Perch BV-15 10.7 13.84 3 -24.75 7.30 76.23 1.11
Beaverskin 2006 Yellow Perch BV-16 12.0 17.46 4 -26.86 7.85 74.79 1.24 1.41 3.12
Beaverskin 2006 Yellow Perch BV-17 12.1 19.36 4 -26.91 7.94 74.87 1.27
Beaverskin 2006 Yellow Perch BV-18 11.2 14.82 4 -25.35 7.93 75.57 1.02
Beaverskin 2006 Yellow Perch BV-19 16.5 53.86 5 -26.17 8.23 78.18 1.54
Beaverskin 2006 Yellow Perch BV-20 17.9 69.46 7 -29.30 8.43 76.05 1.43 1.26 4.39
Beaverskin 2006 Yellow Perch BV-21 17.6 61.12 7 -25.81 7.60 79.49 0.94
Beaverskin 2006 Yellow Perch BV-22 18.3 78.02 7 -25.43 8.16 76.27 1.23
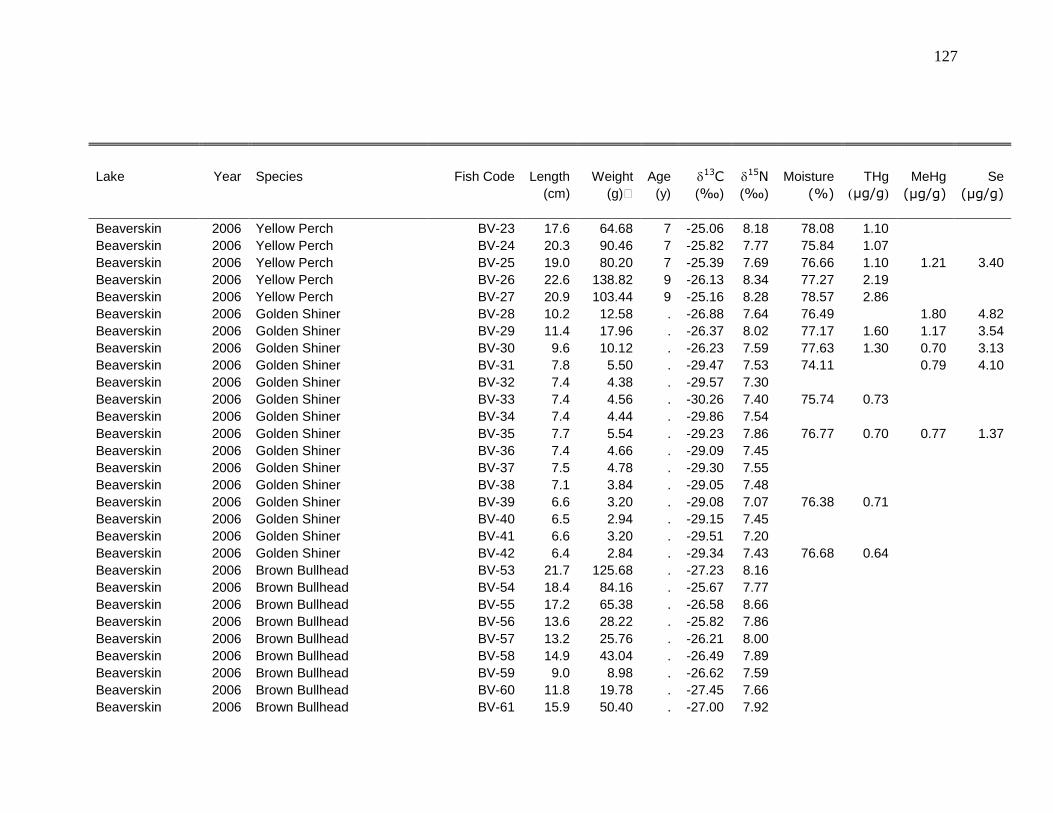
127
Lake Year Species Fish Code Length Weight Age 13C
15N Moisture THg MeHg Se
(cm) (g) (y) (‰) (‰) (%) µg/g) (µg/g) (µg/g)
Beaverskin 2006 Yellow Perch BV-23 17.6 64.68 7 -25.06 8.18 78.08 1.10
Beaverskin 2006 Yellow Perch BV-24 20.3 90.46 7 -25.82 7.77 75.84 1.07
Beaverskin 2006 Yellow Perch BV-25 19.0 80.20 7 -25.39 7.69 76.66 1.10 1.21 3.40
Beaverskin 2006 Yellow Perch BV-26 22.6 138.82 9 -26.13 8.34 77.27 2.19
Beaverskin 2006 Yellow Perch BV-27 20.9 103.44 9 -25.16 8.28 78.57 2.86
Beaverskin 2006 Golden Shiner BV-28 10.2 12.58 . -26.88 7.64 76.49 1.80 4.82
Beaverskin 2006 Golden Shiner BV-29 11.4 17.96 . -26.37 8.02 77.17 1.60 1.17 3.54
Beaverskin 2006 Golden Shiner BV-30 9.6 10.12 . -26.23 7.59 77.63 1.30 0.70 3.13
Beaverskin 2006 Golden Shiner BV-31 7.8 5.50 . -29.47 7.53 74.11 0.79 4.10
Beaverskin 2006 Golden Shiner BV-32 7.4 4.38 . -29.57 7.30
Beaverskin 2006 Golden Shiner BV-33 7.4 4.56 . -30.26 7.40 75.74 0.73
Beaverskin 2006 Golden Shiner BV-34 7.4 4.44 . -29.86 7.54
Beaverskin 2006 Golden Shiner BV-35 7.7 5.54 . -29.23 7.86 76.77 0.70 0.77 1.37
Beaverskin 2006 Golden Shiner BV-36 7.4 4.66 . -29.09 7.45
Beaverskin 2006 Golden Shiner BV-37 7.5 4.78 . -29.30 7.55
Beaverskin 2006 Golden Shiner BV-38 7.1 3.84 . -29.05 7.48
Beaverskin 2006 Golden Shiner BV-39 6.6 3.20 . -29.08 7.07 76.38 0.71
Beaverskin 2006 Golden Shiner BV-40 6.5 2.94 . -29.15 7.45
Beaverskin 2006 Golden Shiner BV-41 6.6 3.20 . -29.51 7.20
Beaverskin 2006 Golden Shiner BV-42 6.4 2.84 . -29.34 7.43 76.68 0.64
Beaverskin 2006 Brown Bullhead BV-53 21.7 125.68 . -27.23 8.16
Beaverskin 2006 Brown Bullhead BV-54 18.4 84.16 . -25.67 7.77
Beaverskin 2006 Brown Bullhead BV-55 17.2 65.38 . -26.58 8.66
Beaverskin 2006 Brown Bullhead BV-56 13.6 28.22 . -25.82 7.86
Beaverskin 2006 Brown Bullhead BV-57 13.2 25.76 . -26.21 8.00
Beaverskin 2006 Brown Bullhead BV-58 14.9 43.04 . -26.49 7.89
Beaverskin 2006 Brown Bullhead BV-59 9.0 8.98 . -26.62 7.59
Beaverskin 2006 Brown Bullhead BV-60 11.8 19.78 . -27.45 7.66
Beaverskin 2006 Brown Bullhead BV-61 15.9 50.40 . -27.00 7.92
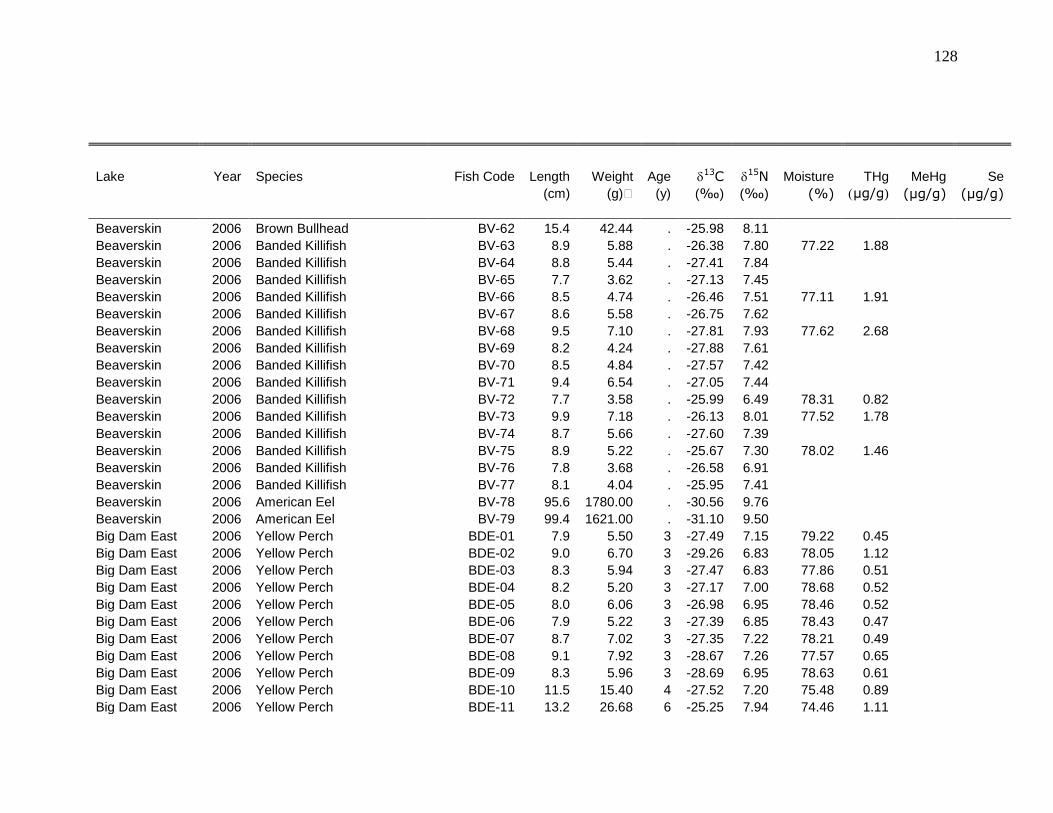
128
Lake Year Species Fish Code Length Weight Age 13C
15N Moisture THg MeHg Se
(cm) (g) (y) (‰) (‰) (%) µg/g) (µg/g) (µg/g)
Beaverskin 2006 Brown Bullhead BV-62 15.4 42.44 . -25.98 8.11
Beaverskin 2006 Banded Killifish BV-63 8.9 5.88 . -26.38 7.80 77.22 1.88
Beaverskin 2006 Banded Killifish BV-64 8.8 5.44 . -27.41 7.84
Beaverskin 2006 Banded Killifish BV-65 7.7 3.62 . -27.13 7.45
Beaverskin 2006 Banded Killifish BV-66 8.5 4.74 . -26.46 7.51 77.11 1.91
Beaverskin 2006 Banded Killifish BV-67 8.6 5.58 . -26.75 7.62
Beaverskin 2006 Banded Killifish BV-68 9.5 7.10 . -27.81 7.93 77.62 2.68
Beaverskin 2006 Banded Killifish BV-69 8.2 4.24 . -27.88 7.61
Beaverskin 2006 Banded Killifish BV-70 8.5 4.84 . -27.57 7.42
Beaverskin 2006 Banded Killifish BV-71 9.4 6.54 . -27.05 7.44
Beaverskin 2006 Banded Killifish BV-72 7.7 3.58 . -25.99 6.49 78.31 0.82
Beaverskin 2006 Banded Killifish BV-73 9.9 7.18 . -26.13 8.01 77.52 1.78
Beaverskin 2006 Banded Killifish BV-74 8.7 5.66 . -27.60 7.39
Beaverskin 2006 Banded Killifish BV-75 8.9 5.22 . -25.67 7.30 78.02 1.46
Beaverskin 2006 Banded Killifish BV-76 7.8 3.68 . -26.58 6.91
Beaverskin 2006 Banded Killifish BV-77 8.1 4.04 . -25.95 7.41
Beaverskin 2006 American Eel BV-78 95.6 1780.00 . -30.56 9.76
Beaverskin 2006 American Eel BV-79 99.4 1621.00 . -31.10 9.50
Big Dam East 2006 Yellow Perch BDE-01 7.9 5.50 3 -27.49 7.15 79.22 0.45
Big Dam East 2006 Yellow Perch BDE-02 9.0 6.70 3 -29.26 6.83 78.05 1.12
Big Dam East 2006 Yellow Perch BDE-03 8.3 5.94 3 -27.47 6.83 77.86 0.51
Big Dam East 2006 Yellow Perch BDE-04 8.2 5.20 3 -27.17 7.00 78.68 0.52
Big Dam East 2006 Yellow Perch BDE-05 8.0 6.06 3 -26.98 6.95 78.46 0.52
Big Dam East 2006 Yellow Perch BDE-06 7.9 5.22 3 -27.39 6.85 78.43 0.47
Big Dam East 2006 Yellow Perch BDE-07 8.7 7.02 3 -27.35 7.22 78.21 0.49
Big Dam East 2006 Yellow Perch BDE-08 9.1 7.92 3 -28.67 7.26 77.57 0.65
Big Dam East 2006 Yellow Perch BDE-09 8.3 5.96 3 -28.69 6.95 78.63 0.61
Big Dam East 2006 Yellow Perch BDE-10 11.5 15.40 4 -27.52 7.20 75.48 0.89
Big Dam East 2006 Yellow Perch BDE-11 13.2 26.68 6 -25.25 7.94 74.46 1.11
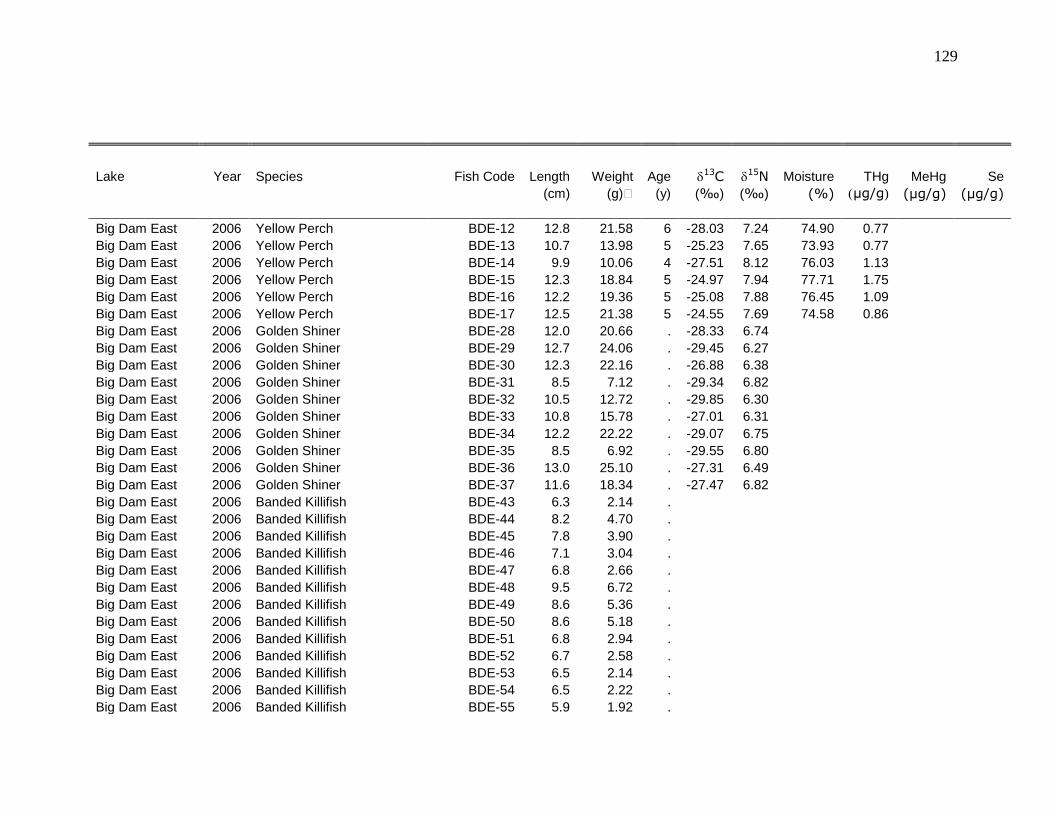
129
Lake Year Species Fish Code Length Weight Age 13C
15N Moisture THg MeHg Se
(cm) (g) (y) (‰) (‰) (%) µg/g) (µg/g) (µg/g)
Big Dam East 2006 Yellow Perch BDE-12 12.8 21.58 6 -28.03 7.24 74.90 0.77
Big Dam East 2006 Yellow Perch BDE-13 10.7 13.98 5 -25.23 7.65 73.93 0.77
Big Dam East 2006 Yellow Perch BDE-14 9.9 10.06 4 -27.51 8.12 76.03 1.13
Big Dam East 2006 Yellow Perch BDE-15 12.3 18.84 5 -24.97 7.94 77.71 1.75
Big Dam East 2006 Yellow Perch BDE-16 12.2 19.36 5 -25.08 7.88 76.45 1.09
Big Dam East 2006 Yellow Perch BDE-17 12.5 21.38 5 -24.55 7.69 74.58 0.86
Big Dam East 2006 Golden Shiner BDE-28 12.0 20.66 . -28.33 6.74
Big Dam East 2006 Golden Shiner BDE-29 12.7 24.06 . -29.45 6.27
Big Dam East 2006 Golden Shiner BDE-30 12.3 22.16 . -26.88 6.38
Big Dam East 2006 Golden Shiner BDE-31 8.5 7.12 . -29.34 6.82
Big Dam East 2006 Golden Shiner BDE-32 10.5 12.72 . -29.85 6.30
Big Dam East 2006 Golden Shiner BDE-33 10.8 15.78 . -27.01 6.31
Big Dam East 2006 Golden Shiner BDE-34 12.2 22.22 . -29.07 6.75
Big Dam East 2006 Golden Shiner BDE-35 8.5 6.92 . -29.55 6.80
Big Dam East 2006 Golden Shiner BDE-36 13.0 25.10 . -27.31 6.49
Big Dam East 2006 Golden Shiner BDE-37 11.6 18.34 . -27.47 6.82
Big Dam East 2006 Banded Killifish BDE-43 6.3 2.14 .
Big Dam East 2006 Banded Killifish BDE-44 8.2 4.70 .
Big Dam East 2006 Banded Killifish BDE-45 7.8 3.90 .
Big Dam East 2006 Banded Killifish BDE-46 7.1 3.04 .
Big Dam East 2006 Banded Killifish BDE-47 6.8 2.66 .
Big Dam East 2006 Banded Killifish BDE-48 9.5 6.72 .
Big Dam East 2006 Banded Killifish BDE-49 8.6 5.36 .
Big Dam East 2006 Banded Killifish BDE-50 8.6 5.18 .
Big Dam East 2006 Banded Killifish BDE-51 6.8 2.94 .
Big Dam East 2006 Banded Killifish BDE-52 6.7 2.58 .
Big Dam East 2006 Banded Killifish BDE-53 6.5 2.14 .
Big Dam East 2006 Banded Killifish BDE-54 6.5 2.22 .
Big Dam East 2006 Banded Killifish BDE-55 5.9 1.92 .

130
Lake Year Species Fish Code Length Weight Age 13C
15N Moisture THg MeHg Se
(cm) (g) (y) (‰) (‰) (%) µg/g) (µg/g) (µg/g)
Big Dam East 2006 Banded Killifish BDE-56 6.2 1.82 .
Big Dam East 2006 Banded Killifish BDE-57 5.9 1.90 .
Big Dam West 2006 Yellow Perch BDW-01 9.6 10.92 3 -28.23 5.40 72.73 0.58
Big Dam West 2006 Yellow Perch BDW-02 9.8 12.04 3 -28.61 6.63 76.44 0.93
Big Dam West 2006 Yellow Perch BDW-03 9.7 11.08 3 -30.39 6.69 75.64 0.67
Big Dam West 2006 Yellow Perch BDW-04 9.8 11.80 3 -28.89 6.16 75.00 0.42 0.53 2.22
Big Dam West 2006 Yellow Perch BDW-05 8.3 7.08 2 -32.58 6.45 75.87 0.39
Big Dam West 2006 Yellow Perch BDW-06 7.2 4.52 2 -29.86 6.73 77.38 0.48
Big Dam West 2006 Yellow Perch BDW-07 7.8 5.66 2 -30.56 6.73 77.74 0.64
Big Dam West 2006 Yellow Perch BDW-08 8.5 7.18 3 -28.61 6.65 74.39 0.63 0.68 1.68
Big Dam West 2006 Yellow Perch BDW-09 9.1 8.76 3 -29.19 6.89 73.95 0.60
Big Dam West 2006 Yellow Perch BDW-10 11.1 14.58 4 -28.23 6.55 75.69 0.75 0.81 2.10
Big Dam West 2006 Yellow Perch BDW-11 11.0 16.28 5 -29.40 6.79 75.01 1.05
Big Dam West 2006 Yellow Perch BDW-12 11.3 17.62 5 -28.44 6.68 74.98 0.85
Big Dam West 2006 Yellow Perch BDW-13 11.4 19.98 5 -27.65 6.94 76.10 0.92
Big Dam West 2006 Yellow Perch BDW-14 10.6 14.20 5 -30.28 7.10 74.44 1.03 0.95 1.60
Big Dam West 2006 Yellow Perch BDW-15 13.6 29.74 5 -29.20 8.28 76.33 1.63
Big Dam West 2006 Yellow Perch BDW-16 13.4 32.74 5 -28.98 7.09 71.57 0.71
Big Dam West 2006 Yellow Perch BDW-17 13.3 29.90 7 -28.25 6.76 73.52 0.90
Big Dam West 2006 Yellow Perch BDW-18 11.3 17.52 4 -28.91 6.77 74.91 1.33
Big Dam West 2006 Yellow Perch BDW-19 15.9 55.98 7 -28.99 7.22 76.20 0.71
Big Dam West 2006 Yellow Perch BDW-20 26.2 242.22 12 -29.41 9.06 71.73 3.18
Big Dam West 2006 Yellow Perch BDW-21 21.0 134.22 9 -30.68 7.55 75.33 2.44
Big Dam West 2006 Yellow Perch BDW-22 20.2 134.70 9 -29.98 8.34 74.90 1.73 1.45 1.34
Big Dam West 2006 Yellow Perch BDW-23 21.5 148.02 10 -29.02 9.34 75.73 3.23
Big Dam West 2006 Yellow Perch BDW-24 20.8 114.58 9 -28.17 8.33 74.52 1.25
Big Dam West 2006 Yellow Perch BDW-25 16.2 55.26 8 -29.30 7.59 79.19 1.69 1.66 1.93
Big Dam West 2006 Yellow Perch BDW-26 15.7 46.16 8 -30.08 6.60 78.21 1.07
Big Dam West 2006 Yellow Perch BDW-27 15.6 55.01 7 -29.47 6.45 72.95 0.48
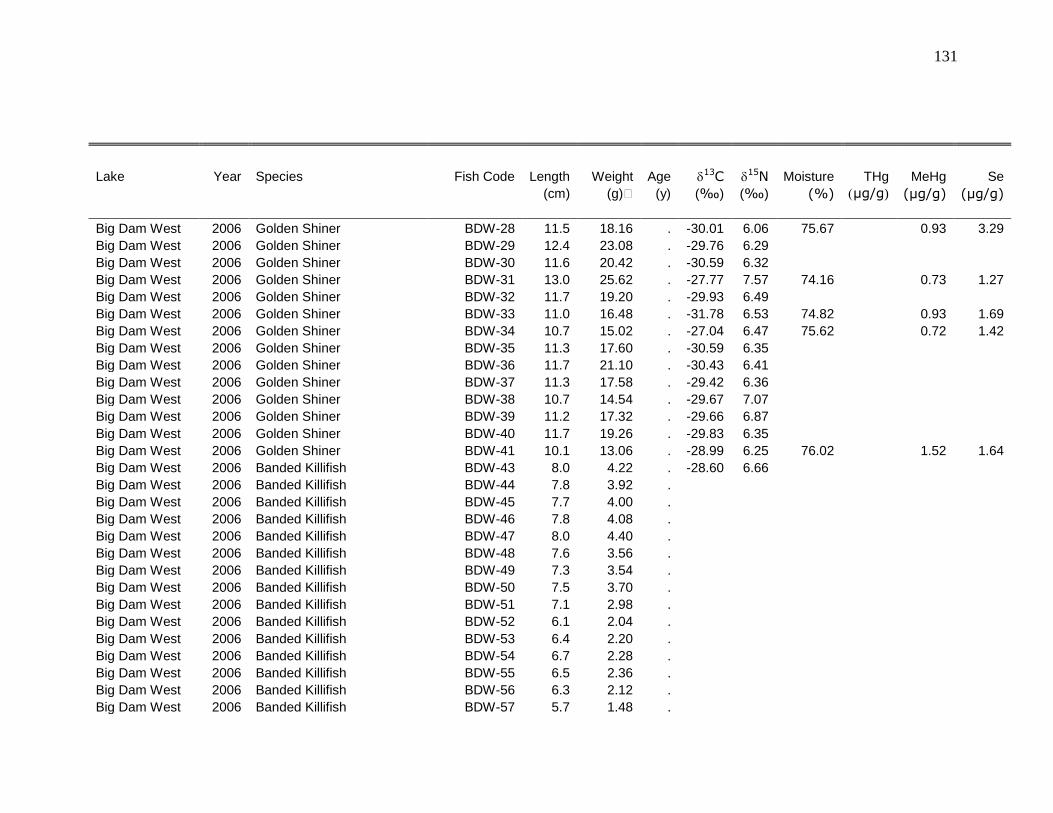
131
Lake Year Species Fish Code Length Weight Age 13C
15N Moisture THg MeHg Se
(cm) (g) (y) (‰) (‰) (%) µg/g) (µg/g) (µg/g)
Big Dam West 2006 Golden Shiner BDW-28 11.5 18.16 . -30.01 6.06 75.67 0.93 3.29
Big Dam West 2006 Golden Shiner BDW-29 12.4 23.08 . -29.76 6.29
Big Dam West 2006 Golden Shiner BDW-30 11.6 20.42 . -30.59 6.32
Big Dam West 2006 Golden Shiner BDW-31 13.0 25.62 . -27.77 7.57 74.16 0.73 1.27
Big Dam West 2006 Golden Shiner BDW-32 11.7 19.20 . -29.93 6.49
Big Dam West 2006 Golden Shiner BDW-33 11.0 16.48 . -31.78 6.53 74.82 0.93 1.69
Big Dam West 2006 Golden Shiner BDW-34 10.7 15.02 . -27.04 6.47 75.62 0.72 1.42
Big Dam West 2006 Golden Shiner BDW-35 11.3 17.60 . -30.59 6.35
Big Dam West 2006 Golden Shiner BDW-36 11.7 21.10 . -30.43 6.41
Big Dam West 2006 Golden Shiner BDW-37 11.3 17.58 . -29.42 6.36
Big Dam West 2006 Golden Shiner BDW-38 10.7 14.54 . -29.67 7.07
Big Dam West 2006 Golden Shiner BDW-39 11.2 17.32 . -29.66 6.87
Big Dam West 2006 Golden Shiner BDW-40 11.7 19.26 . -29.83 6.35
Big Dam West 2006 Golden Shiner BDW-41 10.1 13.06 . -28.99 6.25 76.02 1.52 1.64
Big Dam West 2006 Banded Killifish BDW-43 8.0 4.22 . -28.60 6.66
Big Dam West 2006 Banded Killifish BDW-44 7.8 3.92 .
Big Dam West 2006 Banded Killifish BDW-45 7.7 4.00 .
Big Dam West 2006 Banded Killifish BDW-46 7.8 4.08 .
Big Dam West 2006 Banded Killifish BDW-47 8.0 4.40 .
Big Dam West 2006 Banded Killifish BDW-48 7.6 3.56 .
Big Dam West 2006 Banded Killifish BDW-49 7.3 3.54 .
Big Dam West 2006 Banded Killifish BDW-50 7.5 3.70 .
Big Dam West 2006 Banded Killifish BDW-51 7.1 2.98 .
Big Dam West 2006 Banded Killifish BDW-52 6.1 2.04 .
Big Dam West 2006 Banded Killifish BDW-53 6.4 2.20 .
Big Dam West 2006 Banded Killifish BDW-54 6.7 2.28 .
Big Dam West 2006 Banded Killifish BDW-55 6.5 2.36 .
Big Dam West 2006 Banded Killifish BDW-56 6.3 2.12 .
Big Dam West 2006 Banded Killifish BDW-57 5.7 1.48 .
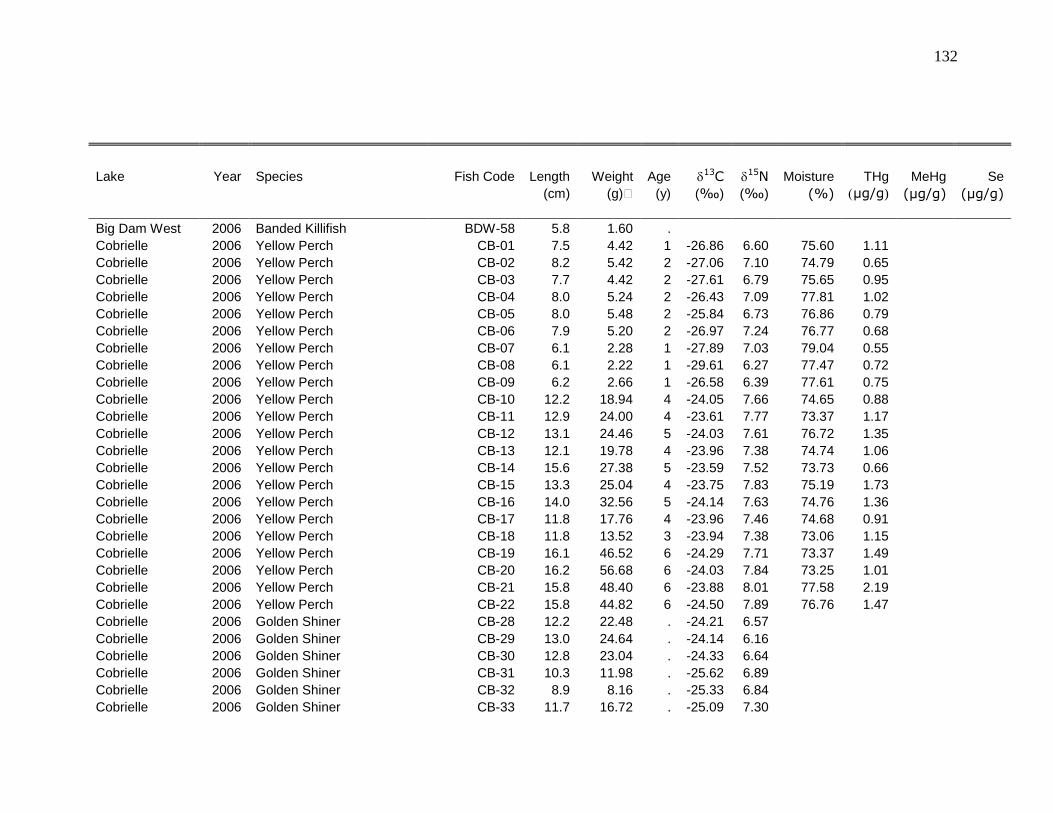
132
Lake Year Species Fish Code Length Weight Age 13C
15N Moisture THg MeHg Se
(cm) (g) (y) (‰) (‰) (%) µg/g) (µg/g) (µg/g)
Big Dam West 2006 Banded Killifish BDW-58 5.8 1.60 .
Cobrielle 2006 Yellow Perch CB-01 7.5 4.42 1 -26.86 6.60 75.60 1.11
Cobrielle 2006 Yellow Perch CB-02 8.2 5.42 2 -27.06 7.10 74.79 0.65
Cobrielle 2006 Yellow Perch CB-03 7.7 4.42 2 -27.61 6.79 75.65 0.95
Cobrielle 2006 Yellow Perch CB-04 8.0 5.24 2 -26.43 7.09 77.81 1.02
Cobrielle 2006 Yellow Perch CB-05 8.0 5.48 2 -25.84 6.73 76.86 0.79
Cobrielle 2006 Yellow Perch CB-06 7.9 5.20 2 -26.97 7.24 76.77 0.68
Cobrielle 2006 Yellow Perch CB-07 6.1 2.28 1 -27.89 7.03 79.04 0.55
Cobrielle 2006 Yellow Perch CB-08 6.1 2.22 1 -29.61 6.27 77.47 0.72
Cobrielle 2006 Yellow Perch CB-09 6.2 2.66 1 -26.58 6.39 77.61 0.75
Cobrielle 2006 Yellow Perch CB-10 12.2 18.94 4 -24.05 7.66 74.65 0.88
Cobrielle 2006 Yellow Perch CB-11 12.9 24.00 4 -23.61 7.77 73.37 1.17
Cobrielle 2006 Yellow Perch CB-12 13.1 24.46 5 -24.03 7.61 76.72 1.35
Cobrielle 2006 Yellow Perch CB-13 12.1 19.78 4 -23.96 7.38 74.74 1.06
Cobrielle 2006 Yellow Perch CB-14 15.6 27.38 5 -23.59 7.52 73.73 0.66
Cobrielle 2006 Yellow Perch CB-15 13.3 25.04 4 -23.75 7.83 75.19 1.73
Cobrielle 2006 Yellow Perch CB-16 14.0 32.56 5 -24.14 7.63 74.76 1.36
Cobrielle 2006 Yellow Perch CB-17 11.8 17.76 4 -23.96 7.46 74.68 0.91
Cobrielle 2006 Yellow Perch CB-18 11.8 13.52 3 -23.94 7.38 73.06 1.15
Cobrielle 2006 Yellow Perch CB-19 16.1 46.52 6 -24.29 7.71 73.37 1.49
Cobrielle 2006 Yellow Perch CB-20 16.2 56.68 6 -24.03 7.84 73.25 1.01
Cobrielle 2006 Yellow Perch CB-21 15.8 48.40 6 -23.88 8.01 77.58 2.19
Cobrielle 2006 Yellow Perch CB-22 15.8 44.82 6 -24.50 7.89 76.76 1.47
Cobrielle 2006 Golden Shiner CB-28 12.2 22.48 . -24.21 6.57
Cobrielle 2006 Golden Shiner CB-29 13.0 24.64 . -24.14 6.16
Cobrielle 2006 Golden Shiner CB-30 12.8 23.04 . -24.33 6.64
Cobrielle 2006 Golden Shiner CB-31 10.3 11.98 . -25.62 6.89
Cobrielle 2006 Golden Shiner CB-32 8.9 8.16 . -25.33 6.84
Cobrielle 2006 Golden Shiner CB-33 11.7 16.72 . -25.09 7.30
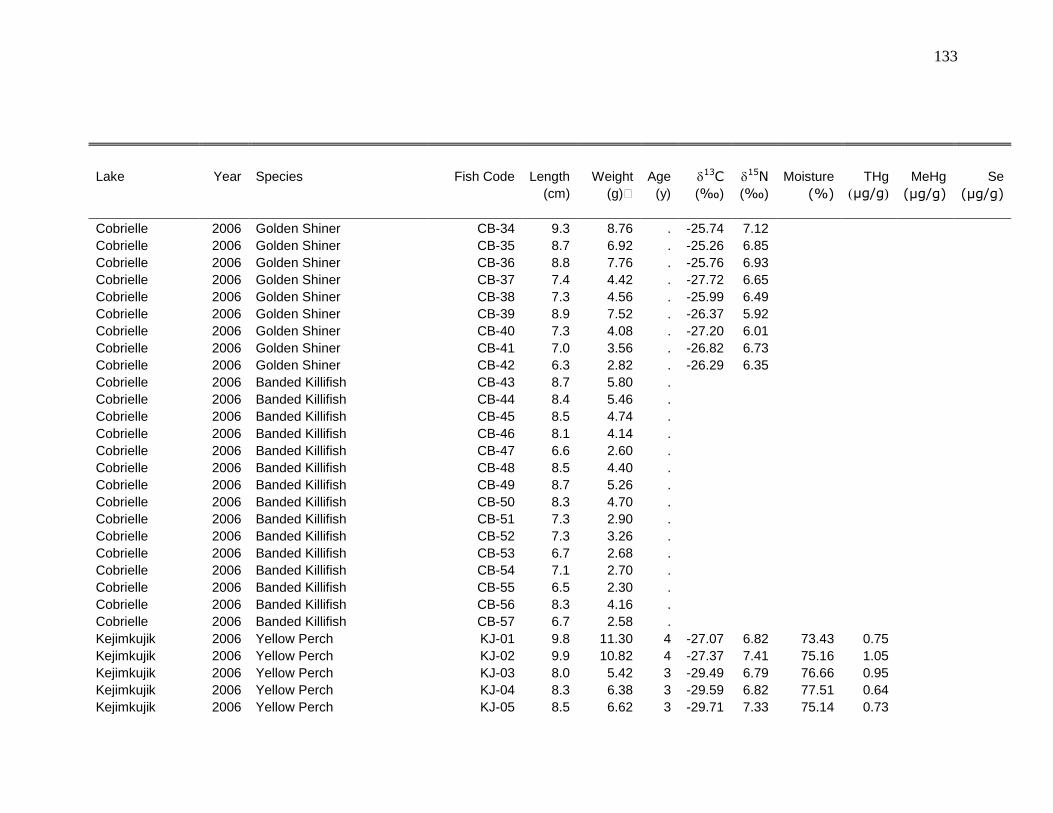
133
Lake Year Species Fish Code Length Weight Age 13C
15N Moisture THg MeHg Se
(cm) (g) (y) (‰) (‰) (%) µg/g) (µg/g) (µg/g)
Cobrielle 2006 Golden Shiner CB-34 9.3 8.76 . -25.74 7.12
Cobrielle 2006 Golden Shiner CB-35 8.7 6.92 . -25.26 6.85
Cobrielle 2006 Golden Shiner CB-36 8.8 7.76 . -25.76 6.93
Cobrielle 2006 Golden Shiner CB-37 7.4 4.42 . -27.72 6.65
Cobrielle 2006 Golden Shiner CB-38 7.3 4.56 . -25.99 6.49
Cobrielle 2006 Golden Shiner CB-39 8.9 7.52 . -26.37 5.92
Cobrielle 2006 Golden Shiner CB-40 7.3 4.08 . -27.20 6.01
Cobrielle 2006 Golden Shiner CB-41 7.0 3.56 . -26.82 6.73
Cobrielle 2006 Golden Shiner CB-42 6.3 2.82 . -26.29 6.35
Cobrielle 2006 Banded Killifish CB-43 8.7 5.80 .
Cobrielle 2006 Banded Killifish CB-44 8.4 5.46 .
Cobrielle 2006 Banded Killifish CB-45 8.5 4.74 .
Cobrielle 2006 Banded Killifish CB-46 8.1 4.14 .
Cobrielle 2006 Banded Killifish CB-47 6.6 2.60 .
Cobrielle 2006 Banded Killifish CB-48 8.5 4.40 .
Cobrielle 2006 Banded Killifish CB-49 8.7 5.26 .
Cobrielle 2006 Banded Killifish CB-50 8.3 4.70 .
Cobrielle 2006 Banded Killifish CB-51 7.3 2.90 .
Cobrielle 2006 Banded Killifish CB-52 7.3 3.26 .
Cobrielle 2006 Banded Killifish CB-53 6.7 2.68 .
Cobrielle 2006 Banded Killifish CB-54 7.1 2.70 .
Cobrielle 2006 Banded Killifish CB-55 6.5 2.30 .
Cobrielle 2006 Banded Killifish CB-56 8.3 4.16 .
Cobrielle 2006 Banded Killifish CB-57 6.7 2.58 .
Kejimkujik 2006 Yellow Perch KJ-01 9.8 11.30 4 -27.07 6.82 73.43 0.75
Kejimkujik 2006 Yellow Perch KJ-02 9.9 10.82 4 -27.37 7.41 75.16 1.05
Kejimkujik 2006 Yellow Perch KJ-03 8.0 5.42 3 -29.49 6.79 76.66 0.95
Kejimkujik 2006 Yellow Perch KJ-04 8.3 6.38 3 -29.59 6.82 77.51 0.64
Kejimkujik 2006 Yellow Perch KJ-05 8.5 6.62 3 -29.71 7.33 75.14 0.73

134
Lake Year Species Fish Code Length Weight Age 13C
15N Moisture THg MeHg Se
(cm) (g) (y) (‰) (‰) (%) µg/g) (µg/g) (µg/g)
Kejimkujik 2006 Yellow Perch KJ-06 7.6 5.02 3 -29.95 7.14 73.99 0.77
Kejimkujik 2006 Yellow Perch KJ-07 6.2 2.64 2 -30.49 6.42 77.40 0.76
Kejimkujik 2006 Yellow Perch KJ-08 5.9 2.36 1 -30.50 6.93 77.37 0.71
Kejimkujik 2006 Yellow Perch KJ-09 5.4 1.80 1 -29.41 6.64 76.74 0.82
Kejimkujik 2006 Yellow Perch KJ-10 10.3 10.04 4 -28.34 7.20 78.69 1.70
Kejimkujik 2006 Yellow Perch KJ-11 10.4 11.94 4 -27.99 7.36 78.35 1.19
Kejimkujik 2006 Yellow Perch KJ-12 11.4 19.48 5 -27.62 7.06 73.41 1.01
Kejimkujik 2006 Yellow Perch KJ-13 10.3 13.40 5 -27.24 6.78 74.76 1.09
Kejimkujik 2006 Yellow Perch KJ-14 14.9 42.03 7 -26.74 7.21 75.25 1.59
Kejimkujik 2006 Yellow Perch KJ-15 14.2 43.20 7 -27.71 7.86 75.04 2.10
Kejimkujik 2006 Yellow Perch KJ-16 13.6 32.88 7 -27.22 8.07 74.72 1.52
Kejimkujik 2006 Yellow Perch KJ-17 12.0 21.60 6 -26.70 7.43 74.97 0.99
Kejimkujik 2006 Yellow Perch KJ-18 12.4 24.42 6 -26.38 7.90 73.74 0.94
Kejimkujik 2006 Yellow Perch KJ-19 19.2 74.30 7 -26.71 8.36 77.49 2.63
Kejimkujik 2006 Yellow Perch KJ-20 17.1 70.96 7 -28.26 8.24 74.67 1.49
Kejimkujik 2006 Yellow Perch KJ-21 17.3 75.01 8 -27.32 7.05 76.94 1.03
Kejimkujik 2006 Yellow Perch KJ-22 17.8 75.28 8 -26.21 7.83 76.81 2.34
Kejimkujik 2006 Yellow Perch KJ-23 17.7 68.16 9 -26.79 8.79 79.97 3.31
Kejimkujik 2006 Yellow Perch KJ-24 18.2 76.26 8 -26.09 7.24 74.00 1.11
Kejimkujik 2006 Yellow Perch KJ-25 16.8 59.44 8 -26.08 6.53 76.88 2.23
Kejimkujik 2006 Yellow Perch KJ-26 16.1 48.72 7 -26.76 8.29 77.76 1.64
Kejimkujik 2006 Golden Shiner KJ-28 10.8 16.04 . -29.83 5.90
Kejimkujik 2006 Golden Shiner KJ-29 9.6 10.34 . -27.89 6.67
Kejimkujik 2006 Golden Shiner KJ-30 8.2 6.10 . -29.82 5.74
Kejimkujik 2006 Golden Shiner KJ-31 12.5 22.92 . -29.45 6.19
Kejimkujik 2006 Golden Shiner KJ-32 7.7 5.04 . -29.04 6.15
Kejimkujik 2006 Golden Shiner KJ-33 10.4 15.08 . -29.99 6.02
Kejimkujik 2006 Golden Shiner KJ-34 7.8 5.74 . -29.84 6.15
Kejimkujik 2006 Golden Shiner KJ-35 11.8 21.58 . -27.84 6.03

135
Lake Year Species Fish Code Length Weight Age 13C
15N Moisture THg MeHg Se
(cm) (g) (y) (‰) (‰) (%) µg/g) (µg/g) (µg/g)
Kejimkujik 2006 Golden Shiner KJ-36 7.9 6.02 . -29.85 6.25
Kejimkujik 2006 Golden Shiner KJ-37 7.7 5.78 . -29.41 6.30
Kejimkujik 2006 Golden Shiner KJ-38 9.3 9.90 . -28.05 6.02
Kejimkujik 2006 Golden Shiner KJ-39 9.0 8.56 . -30.08 5.89
Kejimkujik 2006 Golden Shiner KJ-40 9.5 10.30 . -29.22 7.11
Kejimkujik 2006 Golden Shiner KJ-41 10.0 11.82 . -27.96 6.73
Kejimkujik 2006 Golden Shiner KJ-42 8.1 6.42 . -28.85 6.58
Kejimkujik 2006 Banded Killifish KJ-43 8.2 4.82 .
Kejimkujik 2006 Banded Killifish KJ-44 8.1 5.02 .
Kejimkujik 2006 Banded Killifish KJ-45 7.9 4.36 .
Kejimkujik 2006 Banded Killifish KJ-46 7.5 3.96 .
Kejimkujik 2006 Banded Killifish KJ-47 8.0 4.50 .
Kejimkujik 2006 Banded Killifish KJ-48 8.5 5.44 .
Kejimkujik 2006 Banded Killifish KJ-49 8.1 4.54 .
Kejimkujik 2006 Banded Killifish KJ-50 8.7 5.66 .
Kejimkujik 2006 Banded Killifish KJ-51 8.7 5.86 .
Kejimkujik 2006 Banded Killifish KJ-52 8.5 5.20 .
Kejimkujik 2006 Banded Killifish KJ-53 8.0 4.12 .
Kejimkujik 2006 Banded Killifish KJ-54 7.1 3.20 .
Kejimkujik 2006 Banded Killifish KJ-55 7.8 4.04 .
Kejimkujik 2006 Banded Killifish KJ-56 7.7 3.84 .
Kejimkujik 2006 Banded Killifish KJ-57 6.7 2.56 .
North Cranberry 2006 Yellow Perch NC-01 9.7 9.46 3 -27.17 7.65 76.52 1.31
North Cranberry 2006 Yellow Perch NC-02 9.0 7.48 3 -27.18 8.30 79.00 1.50
North Cranberry 2006 Yellow Perch NC-03 9.4 7.92 3 -29.83 8.20 80.21 1.58
North Cranberry 2006 Yellow Perch NC-04 8.5 6.20 3 -27.32 7.80 78.00 1.14
North Cranberry 2006 Yellow Perch NC-05 7.9 4.64 2 -30.70 7.08 75.05 1.33
North Cranberry 2006 Yellow Perch NC-06 8.5 6.18 2 -29.57 8.33 78.40 1.18
North Cranberry 2006 Yellow Perch NC-07 9.0 6.44 3 -28.52 7.90 78.41 1.53 1.46 2.07

136
Lake Year Species Fish Code Length Weight Age 13C
15N Moisture THg MeHg Se
(cm) (g) (y) (‰) (‰) (%) µg/g) (µg/g) (µg/g)
North Cranberry 2006 Yellow Perch NC-08 8.2 5.54 2 -29.93 7.72 77.35 1.73 1.60 1.45
North Cranberry 2006 Yellow Perch NC-09 7.8 4.80 2 -30.79 7.61 77.62 1.95
North Cranberry 2006 Yellow Perch NC-10 13.1 24.20 6 -26.61 8.56 73.67 1.20
North Cranberry 2006 Yellow Perch NC-11 12.1 21.12 6 -26.76 9.03 78.75 1.88
North Cranberry 2006 Yellow Perch NC-12 13.8 30.06 7 -27.01 8.52 77.41 1.31
North Cranberry 2006 Yellow Perch NC-13 13.0 23.92 6 -26.65 9.10 74.81 2.02
North Cranberry 2006 Yellow Perch NC-14 10.9 12.56 4 -26.32 8.72 76.51 1.79
North Cranberry 2006 Yellow Perch NC-15 13.5 26.02 6 -29.32 8.08 74.97 1.54
North Cranberry 2006 Yellow Perch NC-16 12.4 22.34 6 -26.03 7.86 77.79 2.28 2.32 2.92
North Cranberry 2006 Yellow Perch NC-17 14.0 33.60 8 -27.86 8.33 77.59 2.51 2.98 3.73
North Cranberry 2006 Yellow Perch NC-18 11.7 17.12 5 -26.11 8.08 74.82 1.51
North Cranberry 2006 Yellow Perch NC-19 17.5 66.94 8 -25.98 8.68 77.56 3.14 2.92 3.23
North Cranberry 2006 Yellow Perch NC-20 17.3 60.40 8 -26.53 8.99 77.57 2.32
North Cranberry 2006 Yellow Perch NC-21 17.8 74.00 9 -25.85 8.34 73.75 2.13
North Cranberry 2006 Yellow Perch NC-22 16.9 61.22 7 -26.12 7.99 76.31 1.95
North Cranberry 2006 Yellow Perch NC-23 15.7 47.84 8 -25.03 8.90 79.72 3.17 2.85 2.78
North Cranberry 2006 Yellow Perch NC-24 16.0 50.06 8 -25.07 9.03 77.92 2.60
North Cranberry 2006 Yellow Perch NC-25 21.2 107.12 9 -25.19 9.39 78.26 5.56
North Cranberry 2006 Yellow Perch NC-26 16.3 54.14 7 -26.99 8.82 75.50 1.13
North Cranberry 2006 Yellow Perch NC-27 21.5 107.96 9 -24.85 9.81 77.08 6.54
North Cranberry 2006 Golden Shiner NC-28 8.1 5.82 . -28.60 7.78 79.91 1.54 2.15 2.18
North Cranberry 2006 Golden Shiner NC-29 8.5 6.24 . -30.11 7.49 78.87 1.86 2.00 3.29
North Cranberry 2006 Golden Shiner NC-30 7.9 4.96 . -30.31 8.03 78.02 1.92 2.82
North Cranberry 2006 Golden Shiner NC-31 7.7 4.84 . -30.95 7.90 78.69 1.62 2.40
North Cranberry 2006 Golden Shiner NC-32 7.1 3.50 . -29.88 7.33
North Cranberry 2006 Golden Shiner NC-33 6.6 2.96 . -29.83 7.30 80.39 0.98
North Cranberry 2006 Golden Shiner NC-34 7.8 4.62 . -30.56 7.85
North Cranberry 2006 Golden Shiner NC-35 7.7 4.90 . -30.08 7.97 78.33 0.85 3.69
North Cranberry 2006 Golden Shiner NC-36 6.5 2.86 . -30.59 7.69

137
Lake Year Species Fish Code Length Weight Age 13C
15N Moisture THg MeHg Se
(cm) (g) (y) (‰) (‰) (%) µg/g) (µg/g) (µg/g)
North Cranberry 2006 Golden Shiner NC-37 7.5 4.32 . -31.03 7.84 79.60 2.42
North Cranberry 2006 Golden Shiner NC-38 7.0 3.60 . -31.63 7.61
North Cranberry 2006 Golden Shiner NC-39 7.5 4.50 . -30.36 7.31
North Cranberry 2006 Golden Shiner NC-40 7.1 3.84 . -29.52 8.15 78.87 1.05
North Cranberry 2006 Golden Shiner NC-41 6.4 2.72 . -29.99 7.74
North Cranberry 2006 Golden Shiner NC-42 7.2 3.68 . -30.53 7.14 79.29 2.41
North Cranberry 2006 Banded Killifish NC-43 8.7 5.18 . -25.34 8.13 78.87 1.46
North Cranberry 2006 Banded Killifish NC-44 7.6 3.84 . -28.35 8.07 77.73 1.16
North Cranberry 2006 Banded Killifish NC-45 6.4 2.36 . -28.45 7.99
North Cranberry 2006 Banded Killifish NC-46 7.5 3.42 . -28.31 8.23
North Cranberry 2006 Banded Killifish NC-47 7.5 3.42 . -25.98 8.18
North Cranberry 2006 Banded Killifish NC-48 7.3 3.12 . -26.18 8.46 79.17 2.50
North Cranberry 2006 Banded Killifish NC-49 6.7 2.70 . -29.38 8.15 78.24 1.89
North Cranberry 2006 Banded Killifish NC-50 8.3 4.74 . -25.22 7.86
North Cranberry 2006 Banded Killifish NC-51 7.7 3.86 . -26.47 7.94
North Cranberry 2006 Banded Killifish NC-52 6.8 2.74 . -27.42 7.77 78.85 1.30
North Cranberry 2006 Banded Killifish NC-53 6.5 2.32 . -25.04 7.40 78.61 1.07
North Cranberry 2006 Banded Killifish NC-54 6.9 3.00 . -26.03 8.46
North Cranberry 2006 Banded Killifish NC-55 6.7 2.52 . -27.11 8.16
North Cranberry 2006 Banded Killifish NC-56 6.8 2.64 . -27.82 7.67
North Cranberry 2006 Banded Killifish NC-57 6.0 1.86 . -26.70 7.36
North Cranberry 2006 Brown Bullhead NC-58 16.5 64.92 . -27.08 8.28
North Cranberry 2006 Brown Bullhead NC-59 15.0 47.02 . -28.13 8.10
North Cranberry 2006 Brown Bullhead NC-60 14.6 38.34 . -27.62 8.08
North Cranberry 2006 Brown Bullhead NC-61 16.0 48.16 . -26.56 8.33
North Cranberry 2006 Brown Bullhead NC-62 16.5 53.78 . -30.49 7.98
North Cranberry 2006 Brown Bullhead NC-63 15.6 45.44 . -26.69 8.18
North Cranberry 2006 Brown Bullhead NC-64 17.1 64.92 . -26.73 8.35
North Cranberry 2006 Brown Bullhead NC-65 15.4 54.98 . -27.51 7.75
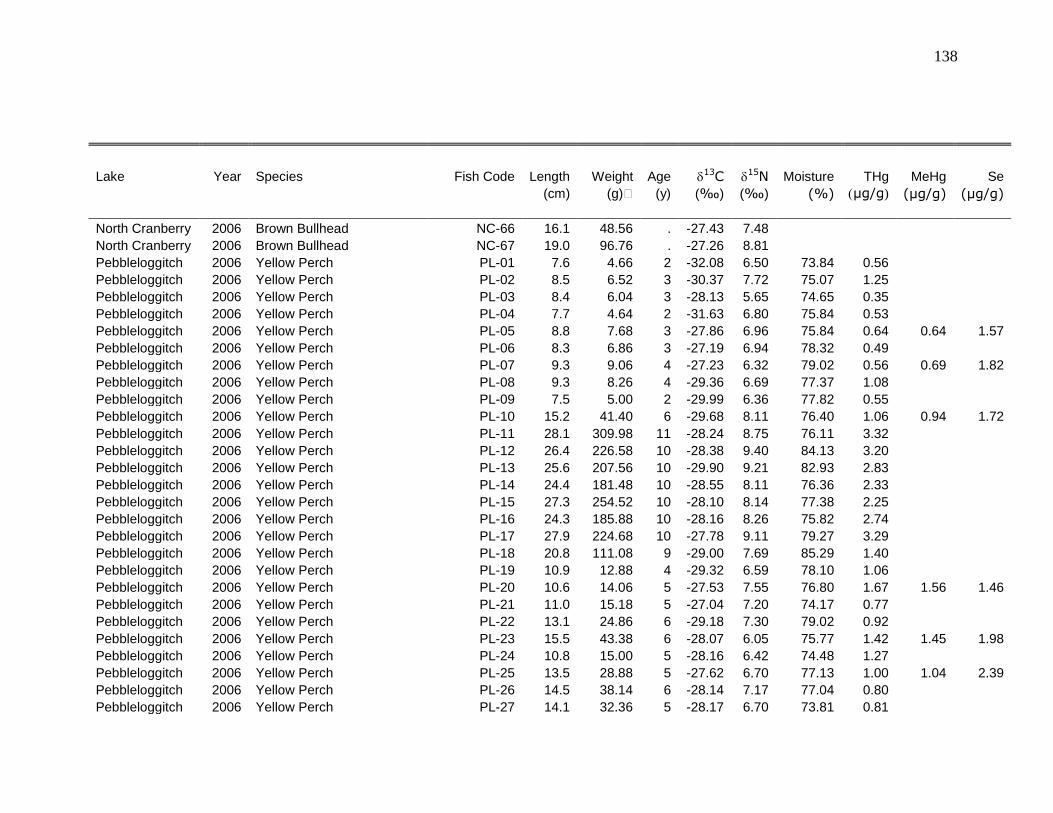
138
Lake Year Species Fish Code Length Weight Age 13C
15N Moisture THg MeHg Se
(cm) (g) (y) (‰) (‰) (%) µg/g) (µg/g) (µg/g)
North Cranberry 2006 Brown Bullhead NC-66 16.1 48.56 . -27.43 7.48
North Cranberry 2006 Brown Bullhead NC-67 19.0 96.76 . -27.26 8.81
Pebbleloggitch 2006 Yellow Perch PL-01 7.6 4.66 2 -32.08 6.50 73.84 0.56
Pebbleloggitch 2006 Yellow Perch PL-02 8.5 6.52 3 -30.37 7.72 75.07 1.25
Pebbleloggitch 2006 Yellow Perch PL-03 8.4 6.04 3 -28.13 5.65 74.65 0.35
Pebbleloggitch 2006 Yellow Perch PL-04 7.7 4.64 2 -31.63 6.80 75.84 0.53
Pebbleloggitch 2006 Yellow Perch PL-05 8.8 7.68 3 -27.86 6.96 75.84 0.64 0.64 1.57
Pebbleloggitch 2006 Yellow Perch PL-06 8.3 6.86 3 -27.19 6.94 78.32 0.49
Pebbleloggitch 2006 Yellow Perch PL-07 9.3 9.06 4 -27.23 6.32 79.02 0.56 0.69 1.82
Pebbleloggitch 2006 Yellow Perch PL-08 9.3 8.26 4 -29.36 6.69 77.37 1.08
Pebbleloggitch 2006 Yellow Perch PL-09 7.5 5.00 2 -29.99 6.36 77.82 0.55
Pebbleloggitch 2006 Yellow Perch PL-10 15.2 41.40 6 -29.68 8.11 76.40 1.06 0.94 1.72
Pebbleloggitch 2006 Yellow Perch PL-11 28.1 309.98 11 -28.24 8.75 76.11 3.32
Pebbleloggitch 2006 Yellow Perch PL-12 26.4 226.58 10 -28.38 9.40 84.13 3.20
Pebbleloggitch 2006 Yellow Perch PL-13 25.6 207.56 10 -29.90 9.21 82.93 2.83
Pebbleloggitch 2006 Yellow Perch PL-14 24.4 181.48 10 -28.55 8.11 76.36 2.33
Pebbleloggitch 2006 Yellow Perch PL-15 27.3 254.52 10 -28.10 8.14 77.38 2.25
Pebbleloggitch 2006 Yellow Perch PL-16 24.3 185.88 10 -28.16 8.26 75.82 2.74
Pebbleloggitch 2006 Yellow Perch PL-17 27.9 224.68 10 -27.78 9.11 79.27 3.29
Pebbleloggitch 2006 Yellow Perch PL-18 20.8 111.08 9 -29.00 7.69 85.29 1.40
Pebbleloggitch 2006 Yellow Perch PL-19 10.9 12.88 4 -29.32 6.59 78.10 1.06
Pebbleloggitch 2006 Yellow Perch PL-20 10.6 14.06 5 -27.53 7.55 76.80 1.67 1.56 1.46
Pebbleloggitch 2006 Yellow Perch PL-21 11.0 15.18 5 -27.04 7.20 74.17 0.77
Pebbleloggitch 2006 Yellow Perch PL-22 13.1 24.86 6 -29.18 7.30 79.02 0.92
Pebbleloggitch 2006 Yellow Perch PL-23 15.5 43.38 6 -28.07 6.05 75.77 1.42 1.45 1.98
Pebbleloggitch 2006 Yellow Perch PL-24 10.8 15.00 5 -28.16 6.42 74.48 1.27
Pebbleloggitch 2006 Yellow Perch PL-25 13.5 28.88 5 -27.62 6.70 77.13 1.00 1.04 2.39
Pebbleloggitch 2006 Yellow Perch PL-26 14.5 38.14 6 -28.14 7.17 77.04 0.80
Pebbleloggitch 2006 Yellow Perch PL-27 14.1 32.36 5 -28.17 6.70 73.81 0.81

139
Lake Year Species Fish Code Length Weight Age 13C
15N Moisture THg MeHg Se
(cm) (g) (y) (‰) (‰) (%) µg/g) (µg/g) (µg/g)
Pebbleloggitch 2007 Yellow Perch PB-68 16.1 42.10 -29.09 6.48 79.73 1.35
Pebbleloggitch 2007 Yellow Perch PB-69 17.0 57.70 -28.96 7.28 80.53 1.25
Pebbleloggitch 2007 Yellow Perch PB-70 15.5 43.00 -30.24 7.58 79.39 1.09
Pebbleloggitch 2007 Yellow Perch PB-71 16.2 50.60 -28.45 6.64 79.50 0.84
Pebbleloggitch 2007 Yellow Perch PB-72 15.8 49.60 -29.30 6.89 78.14 0.69
Pebbleloggitch 2007 Yellow Perch PB-73 16.9 58.40 -27.75 6.66 79.92 0.70
Pebbleloggitch 2007 Yellow Perch PB-74 16.4 54.90 -27.83 6.31 79.38 0.74
Pebbleloggitch 2007 Yellow Perch PB-75 13.3 27.30 -28.26 6.34 81.32 1.15
Pebbleloggitch 2006 Golden Shiner PL-28 12.1 24.38 . -28.47 6.23
Pebbleloggitch 2006 Golden Shiner PL-29 15.2 49.80 . -28.15 6.62
Pebbleloggitch 2006 Brown Bullhead PL-43 19.5 121.32 . -29.64 7.26
Pebbleloggitch 2006 Brown Bullhead PL-44 17.7 74.62 . -29.78 6.71
Pebbleloggitch 2006 Brown Bullhead PL-45 22.8 167.92 . -29.48 6.92
Pebbleloggitch 2006 Brown Bullhead PL-46 24.1 189.26 . -29.43 6.63
Pebbleloggitch 2006 Brown Bullhead PL-47 22.0 163.92 . -30.13 7.12
Pebbleloggitch 2006 Brown Bullhead PL-48 21.3 145.52 . -29.71 6.83
Pebbleloggitch 2006 Brown Bullhead PL-49 19.8 122.36 . -30.01 7.31
Pebbleloggitch 2006 Brown Bullhead PL-50 20.5 118.58 . -29.96 6.89
Pebbleloggitch 2006 American Eel PL-51 85.4 1114.00 . -32.94 8.63
Pebbleloggitch 2006 American Eel PL-52 63.5 424.00 . -32.17 7.56
Pebbleloggitch 2006 Brown Bullhead PL-53 22.8 174.34 . -30.39 6.41
Pebbleloggitch 2006 Brown Bullhead PL-54 21.1 125.42 . -29.98 6.68
Peskawa 2006 Yellow Perch PS-01 18.5 91.38 9 -27.56 7.05 80.65
Peskawa 2006 Yellow Perch PS-02 18.5 69.86 9 -27.25 7.36 81.26 2.55
Peskawa 2006 Yellow Perch PS-03 19.0 90.24 9 -26.77 6.16 78.50 1.38
Peskawa 2006 Yellow Perch PS-04 15.5 45.04 7 -26.45 6.64 76.13 1.19
Peskawa 2006 Yellow Perch PS-05 16.5 65.16 8 -27.12 5.71 78.28 1.01
Peskawa 2006 Yellow Perch PS-06 15.9 57.08 7 -26.80 6.38 78.39 0.82
Peskawa 2006 Yellow Perch PS-07 16.5 57.78 7 -25.88 5.96 80.77 0.84

140
Lake Year Species Fish Code Length Weight Age 13C
15N Moisture THg MeHg Se
(cm) (g) (y) (‰) (‰) (%) µg/g) (µg/g) (µg/g)
Peskawa 2006 Yellow Perch PS-08 17.3 71.76 8 -27.76 6.21 77.31 1.76
Peskawa 2006 Yellow Perch PS-09 15.9 45.40 7 -26.98 6.76 78.61 1.82
Peskawa 2006 Yellow Perch PS-10 10.9 15.24 5 -27.98 6.13 75.82 1.55
Peskawa 2006 Yellow Perch PS-11 11.7 17.66 5 -26.78 6.38 76.72 1.28
Peskawa 2006 Yellow Perch PS-12 14.6 39.60 6 -27.07 5.66 77.39 0.89
Peskawa 2006 Yellow Perch PS-13 13.9 36.22 6 -28.53 6.37 75.18 1.81
Peskawa 2006 Yellow Perch PS-14 14.1 32.92 6 -26.54 6.59 74.62 1.06
Peskawa 2006 Yellow Perch PS-15 13.9 34.96 6 -27.60 5.79 76.58 1.19
Peskawa 2006 Yellow Perch PS-16 12.6 24.98 5 -26.75 6.39 75.47 1.34
Peskawa 2006 Yellow Perch PS-17 12.0 19.46 5 -29.47 6.08 75.64 1.05
Peskawa 2006 Yellow Perch PS-18 13.0 24.96 5 -27.62 6.69 76.36 1.50
Peskawa 2006 Yellow Perch PS-19 7.0 3.74 3 -29.27 6.19 76.32 0.87
Peskawa 2006 Yellow Perch PS-20 6.8 3.26 2 -29.84 6.10 78.75 0.58
Peskawa 2006 Yellow Perch PS-21 7.1 3.88 2 -29.53 5.87 79.53 0.64
Peskawa 2006 Yellow Perch PS-22 7.8 5.22 2 -27.99 5.89 76.18 0.70
Peskawa 2006 Yellow Perch PS-23 5.4 1.68 1 -30.20 5.83 79.35 0.54
Peskawa 2006 Yellow Perch PS-24 6.6 2.80 1 -29.36 6.08 78.84 0.61
Peskawa 2006 Yellow Perch PS-25 6.5 2.96 2 -29.36 6.29 77.42 0.74
Peskawa 2006 Yellow Perch PS-26 6.5 3.04 . -29.77 6.19 74.87 0.70
Peskawa 2006 Yellow Perch PS-27 7.0 3.90 2 -30.63 5.96 77.08 0.61
Peskowesk 2006 Yellow Perch PK-01 8.5 7.36 3 -29.24 6.16 73.41 0.72
Peskowesk 2006 Yellow Perch PK-02 8.0 6.10 2 -27.56 5.12 76.17 0.90
Peskowesk 2006 Yellow Perch PK-03 9.1 8.16 4 -29.93 6.38 75.06 1.11
Peskowesk 2006 Yellow Perch PK-04 7.3 4.26 1 -29.23 6.03 75.28 0.88
Peskowesk 2006 Yellow Perch PK-05 7.3 3.76 1 -28.44 5.42 76.26 1.20
Peskowesk 2006 Yellow Perch PK-06 7.7 5.02 2 -28.24 5.89 76.01 1.19
Peskowesk 2006 Yellow Perch PK-07 8.3 6.08 2 -27.49 6.36 76.19 0.90
Peskowesk 2006 Yellow Perch PK-08 8.3 6.46 2 -29.46 5.13 74.32 0.85
Peskowesk 2006 Yellow Perch PK-09 6.5 2.68 1 -28.47 6.15 75.89 0.77
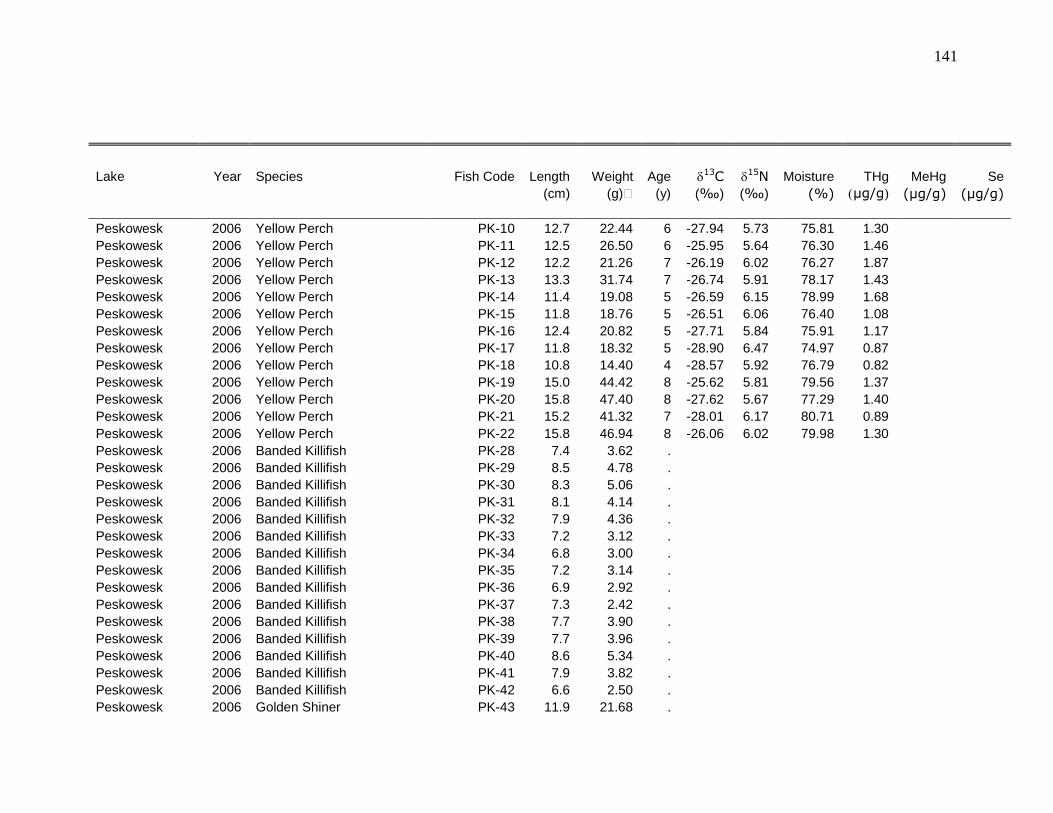
141
Lake Year Species Fish Code Length Weight Age 13C
15N Moisture THg MeHg Se
(cm) (g) (y) (‰) (‰) (%) µg/g) (µg/g) (µg/g)
Peskowesk 2006 Yellow Perch PK-10 12.7 22.44 6 -27.94 5.73 75.81 1.30
Peskowesk 2006 Yellow Perch PK-11 12.5 26.50 6 -25.95 5.64 76.30 1.46
Peskowesk 2006 Yellow Perch PK-12 12.2 21.26 7 -26.19 6.02 76.27 1.87
Peskowesk 2006 Yellow Perch PK-13 13.3 31.74 7 -26.74 5.91 78.17 1.43
Peskowesk 2006 Yellow Perch PK-14 11.4 19.08 5 -26.59 6.15 78.99 1.68
Peskowesk 2006 Yellow Perch PK-15 11.8 18.76 5 -26.51 6.06 76.40 1.08
Peskowesk 2006 Yellow Perch PK-16 12.4 20.82 5 -27.71 5.84 75.91 1.17
Peskowesk 2006 Yellow Perch PK-17 11.8 18.32 5 -28.90 6.47 74.97 0.87
Peskowesk 2006 Yellow Perch PK-18 10.8 14.40 4 -28.57 5.92 76.79 0.82
Peskowesk 2006 Yellow Perch PK-19 15.0 44.42 8 -25.62 5.81 79.56 1.37
Peskowesk 2006 Yellow Perch PK-20 15.8 47.40 8 -27.62 5.67 77.29 1.40
Peskowesk 2006 Yellow Perch PK-21 15.2 41.32 7 -28.01 6.17 80.71 0.89
Peskowesk 2006 Yellow Perch PK-22 15.8 46.94 8 -26.06 6.02 79.98 1.30
Peskowesk 2006 Banded Killifish PK-28 7.4 3.62 .
Peskowesk 2006 Banded Killifish PK-29 8.5 4.78 .
Peskowesk 2006 Banded Killifish PK-30 8.3 5.06 .
Peskowesk 2006 Banded Killifish PK-31 8.1 4.14 .
Peskowesk 2006 Banded Killifish PK-32 7.9 4.36 .
Peskowesk 2006 Banded Killifish PK-33 7.2 3.12 .
Peskowesk 2006 Banded Killifish PK-34 6.8 3.00 .
Peskowesk 2006 Banded Killifish PK-35 7.2 3.14 .
Peskowesk 2006 Banded Killifish PK-36 6.9 2.92 .
Peskowesk 2006 Banded Killifish PK-37 7.3 2.42 .
Peskowesk 2006 Banded Killifish PK-38 7.7 3.90 .
Peskowesk 2006 Banded Killifish PK-39 7.7 3.96 .
Peskowesk 2006 Banded Killifish PK-40 8.6 5.34 .
Peskowesk 2006 Banded Killifish PK-41 7.9 3.82 .
Peskowesk 2006 Banded Killifish PK-42 6.6 2.50 .
Peskowesk 2006 Golden Shiner PK-43 11.9 21.68 .
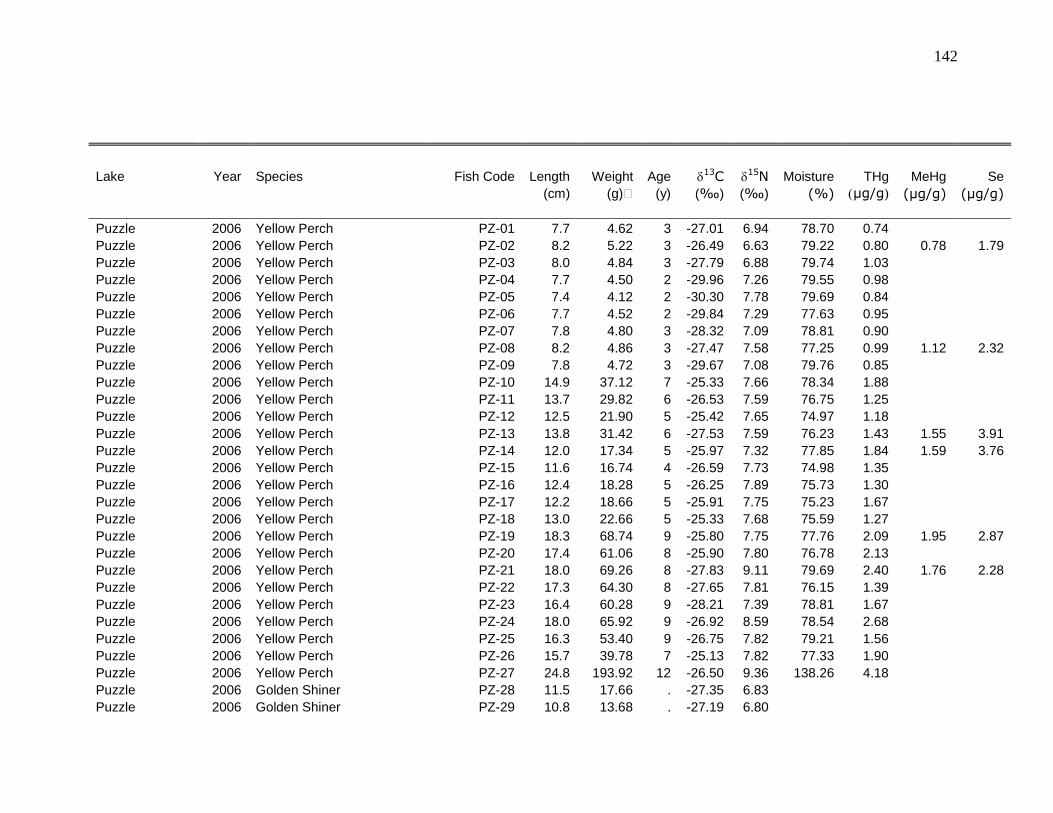
142
Lake Year Species Fish Code Length Weight Age 13C
15N Moisture THg MeHg Se
(cm) (g) (y) (‰) (‰) (%) µg/g) (µg/g) (µg/g)
Puzzle 2006 Yellow Perch PZ-01 7.7 4.62 3 -27.01 6.94 78.70 0.74
Puzzle 2006 Yellow Perch PZ-02 8.2 5.22 3 -26.49 6.63 79.22 0.80 0.78 1.79
Puzzle 2006 Yellow Perch PZ-03 8.0 4.84 3 -27.79 6.88 79.74 1.03
Puzzle 2006 Yellow Perch PZ-04 7.7 4.50 2 -29.96 7.26 79.55 0.98
Puzzle 2006 Yellow Perch PZ-05 7.4 4.12 2 -30.30 7.78 79.69 0.84
Puzzle 2006 Yellow Perch PZ-06 7.7 4.52 2 -29.84 7.29 77.63 0.95
Puzzle 2006 Yellow Perch PZ-07 7.8 4.80 3 -28.32 7.09 78.81 0.90
Puzzle 2006 Yellow Perch PZ-08 8.2 4.86 3 -27.47 7.58 77.25 0.99 1.12 2.32
Puzzle 2006 Yellow Perch PZ-09 7.8 4.72 3 -29.67 7.08 79.76 0.85
Puzzle 2006 Yellow Perch PZ-10 14.9 37.12 7 -25.33 7.66 78.34 1.88
Puzzle 2006 Yellow Perch PZ-11 13.7 29.82 6 -26.53 7.59 76.75 1.25
Puzzle 2006 Yellow Perch PZ-12 12.5 21.90 5 -25.42 7.65 74.97 1.18
Puzzle 2006 Yellow Perch PZ-13 13.8 31.42 6 -27.53 7.59 76.23 1.43 1.55 3.91
Puzzle 2006 Yellow Perch PZ-14 12.0 17.34 5 -25.97 7.32 77.85 1.84 1.59 3.76
Puzzle 2006 Yellow Perch PZ-15 11.6 16.74 4 -26.59 7.73 74.98 1.35
Puzzle 2006 Yellow Perch PZ-16 12.4 18.28 5 -26.25 7.89 75.73 1.30
Puzzle 2006 Yellow Perch PZ-17 12.2 18.66 5 -25.91 7.75 75.23 1.67
Puzzle 2006 Yellow Perch PZ-18 13.0 22.66 5 -25.33 7.68 75.59 1.27
Puzzle 2006 Yellow Perch PZ-19 18.3 68.74 9 -25.80 7.75 77.76 2.09 1.95 2.87
Puzzle 2006 Yellow Perch PZ-20 17.4 61.06 8 -25.90 7.80 76.78 2.13
Puzzle 2006 Yellow Perch PZ-21 18.0 69.26 8 -27.83 9.11 79.69 2.40 1.76 2.28
Puzzle 2006 Yellow Perch PZ-22 17.3 64.30 8 -27.65 7.81 76.15 1.39
Puzzle 2006 Yellow Perch PZ-23 16.4 60.28 9 -28.21 7.39 78.81 1.67
Puzzle 2006 Yellow Perch PZ-24 18.0 65.92 9 -26.92 8.59 78.54 2.68
Puzzle 2006 Yellow Perch PZ-25 16.3 53.40 9 -26.75 7.82 79.21 1.56
Puzzle 2006 Yellow Perch PZ-26 15.7 39.78 7 -25.13 7.82 77.33 1.90
Puzzle 2006 Yellow Perch PZ-27 24.8 193.92 12 -26.50 9.36 138.26 4.18
Puzzle 2006 Golden Shiner PZ-28 11.5 17.66 . -27.35 6.83
Puzzle 2006 Golden Shiner PZ-29 10.8 13.68 . -27.19 6.80

143
Lake Year Species Fish Code Length Weight Age 13C
15N Moisture THg MeHg Se
(cm) (g) (y) (‰) (‰) (%) µg/g) (µg/g) (µg/g)
Puzzle 2006 Golden Shiner PZ-30 12.4 25.64 . -26.55 6.61 76.60 0.80 0.99 2.68
Puzzle 2006 Golden Shiner PZ-31 10.3 12.04 . -28.22 7.80 77.18 0.90 0.91 2.48
Puzzle 2006 Golden Shiner PZ-32 8.7 6.78 . -27.60 7.32 77.90 0.87 2.82
Puzzle 2006 Golden Shiner PZ-33 9.9 10.98 . -27.67 7.08 77.89 0.80 1.20 2.99
Puzzle 2006 Golden Shiner PZ-34 9.7 10.24 . -28.80 7.35
Puzzle 2006 Golden Shiner PZ-35 7.1 4.08 . -30.75 7.27
Puzzle 2006 Golden Shiner PZ-36 8.6 6.90 . -28.75 7.59 78.84 1.27
Puzzle 2006 Golden Shiner PZ-37 8.2 6.16 . -28.59 7.22
Puzzle 2006 Golden Shiner PZ-38 7.9 5.14 . -29.28 7.74
Puzzle 2006 Golden Shiner PZ-39 7.7 4.92 . -29.85 7.30
Puzzle 2006 Golden Shiner PZ-40 7.5 5.00 . -30.91 7.30 77.89 0.62
Puzzle 2006 Golden Shiner PZ-41 6.8 3.54 . -30.58 7.78 78.63 0.98
Puzzle 2006 Golden Shiner PZ-42 7.3 3.06 . -29.97 7.70
Puzzle 2006 Banded Killifish PZ-43 7.9 4.12 . -25.07 7.46 80.20 0.94
Puzzle 2006 Banded Killifish PZ-44 8.5 4.38 . -26.34 7.14 78.39 0.79
Puzzle 2006 Banded Killifish PZ-45 7.5 3.52 . -26.73 7.13
Puzzle 2006 Banded Killifish PZ-46 8.3 4.46 . -27.83 7.25 79.14 0.67
Puzzle 2006 Banded Killifish PZ-47 7.8 4.16 . -27.22 7.16
Puzzle 2006 Banded Killifish PZ-48 7.9 3.72 . -25.96 7.56 79.24 0.91
Puzzle 2006 Banded Killifish PZ-49 7.9 4.10 . -27.14 6.98
Puzzle 2006 Banded Killifish PZ-50 8.0 3.96 . -25.82 7.32
Puzzle 2006 Banded Killifish PZ-51 7.7 3.76 . -26.37 7.01
Puzzle 2006 Banded Killifish PZ-52 8.3 4.54 . -26.82 7.08
Puzzle 2006 Banded Killifish PZ-53 7.3 3.06 . -26.62 6.57
Puzzle 2006 Banded Killifish PZ-54 7.6 3.62 . -25.93 6.77
Puzzle 2006 Banded Killifish PZ-55 8.4 5.04 . -26.23 7.14
Puzzle 2006 Banded Killifish PZ-56 6.7 2.54 . -26.35 6.31 78.99 0.50
Puzzle 2006 Banded Killifish PZ-57 7.3 2.40 . -26.94 6.69 81.64
Puzzle 2006 Brown Bullhead PZ-58 16.2 48.38 . -27.62 8.04
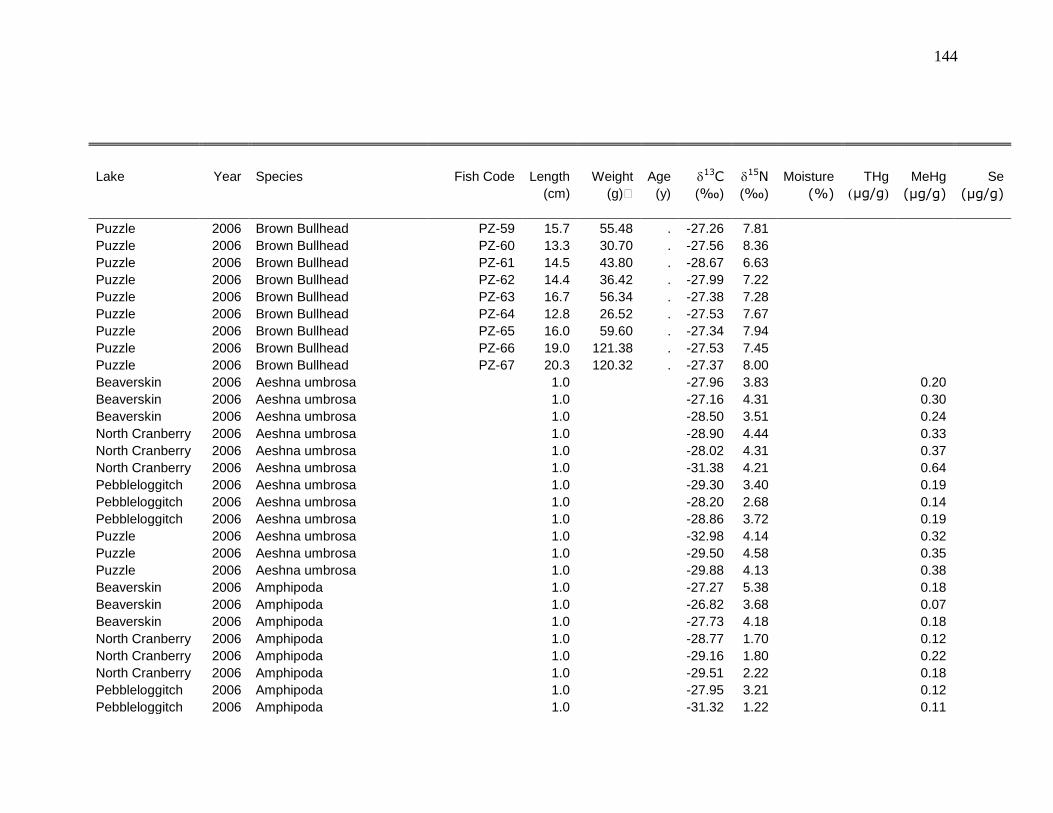
144
Lake Year Species Fish Code Length Weight Age 13C
15N Moisture THg MeHg Se
(cm) (g) (y) (‰) (‰) (%) µg/g) (µg/g) (µg/g)
Puzzle 2006 Brown Bullhead PZ-59 15.7 55.48 . -27.26 7.81
Puzzle 2006 Brown Bullhead PZ-60 13.3 30.70 . -27.56 8.36
Puzzle 2006 Brown Bullhead PZ-61 14.5 43.80 . -28.67 6.63
Puzzle 2006 Brown Bullhead PZ-62 14.4 36.42 . -27.99 7.22
Puzzle 2006 Brown Bullhead PZ-63 16.7 56.34 . -27.38 7.28
Puzzle 2006 Brown Bullhead PZ-64 12.8 26.52 . -27.53 7.67
Puzzle 2006 Brown Bullhead PZ-65 16.0 59.60 . -27.34 7.94
Puzzle 2006 Brown Bullhead PZ-66 19.0 121.38 . -27.53 7.45
Puzzle 2006 Brown Bullhead PZ-67 20.3 120.32 . -27.37 8.00
Beaverskin 2006 Aeshna umbrosa 1.0 -27.96 3.83 0.20
Beaverskin 2006 Aeshna umbrosa 1.0 -27.16 4.31 0.30
Beaverskin 2006 Aeshna umbrosa 1.0 -28.50 3.51 0.24
North Cranberry 2006 Aeshna umbrosa 1.0 -28.90 4.44 0.33
North Cranberry 2006 Aeshna umbrosa 1.0 -28.02 4.31 0.37
North Cranberry 2006 Aeshna umbrosa 1.0 -31.38 4.21 0.64
Pebbleloggitch 2006 Aeshna umbrosa 1.0 -29.30 3.40 0.19
Pebbleloggitch 2006 Aeshna umbrosa 1.0 -28.20 2.68 0.14
Pebbleloggitch 2006 Aeshna umbrosa 1.0 -28.86 3.72 0.19
Puzzle 2006 Aeshna umbrosa 1.0 -32.98 4.14 0.32
Puzzle 2006 Aeshna umbrosa 1.0 -29.50 4.58 0.35
Puzzle 2006 Aeshna umbrosa 1.0 -29.88 4.13 0.38
Beaverskin 2006 Amphipoda 1.0 -27.27 5.38 0.18
Beaverskin 2006 Amphipoda 1.0 -26.82 3.68 0.07
Beaverskin 2006 Amphipoda 1.0 -27.73 4.18 0.18
North Cranberry 2006 Amphipoda 1.0 -28.77 1.70 0.12
North Cranberry 2006 Amphipoda 1.0 -29.16 1.80 0.22
North Cranberry 2006 Amphipoda 1.0 -29.51 2.22 0.18
Pebbleloggitch 2006 Amphipoda 1.0 -27.95 3.21 0.12
Pebbleloggitch 2006 Amphipoda 1.0 -31.32 1.22 0.11

145
Lake Year Species Fish Code Length Weight Age 13C
15N Moisture THg MeHg Se
(cm) (g) (y) (‰) (‰) (%) µg/g) (µg/g) (µg/g)
Pebbleloggitch 2006 Amphipoda 1.0 -28.91 2.96 0.05
Puzzle 2006 Amphipoda 1.0 -29.19 4.59 0.18
Puzzle 2006 Amphipoda 1.0 -29.56 3.31 0.15
Puzzle 2006 Amphipoda 1.0 -28.70 4.24 0.21
Beaverskin 2006 Chironomidae - littoral 1.0 -27.80 3.13 0.08
Beaverskin 2006 Chironomidae - littoral 1.0 -24.65 2.54 0.05
Beaverskin 2006 Chironomidae - littoral 1.0 -28.42 2.52 0.10
North Cranberry 2006 Chironomidae - littoral 1.0 -29.36 3.76 0.16
North Cranberry 2006 Chironomidae - littoral 1.0 -30.60 2.93 0.18
North Cranberry 2006 Chironomidae - littoral 1.0 -30.74 3.85 0.24
Pebbleloggitch 2006 Chironomidae - littoral 1.0 -28.57 2.86 0.07
Pebbleloggitch 2006 Chironomidae - littoral 1.0 -29.79 2.21 0.08
Pebbleloggitch 2006 Chironomidae - littoral 1.0 -29.52 2.90 0.10
Puzzle 2006 Chironomidae - littoral 1.0 -30.96 3.16 0.12
Puzzle 2006 Chironomidae - littoral 1.0 -33.29 2.96 0.12
Puzzle 2006 Chironomidae - littoral 1.0 -32.53 3.69 0.18
Beaverskin 2006 Heptageniida 1.0 . -27.94 1.47 0.07
Beaverskin 2006 Heptageniida 1.0 . -26.24 1.58 0.72
Beaverskin 2006 Heptageniida 1.0 . -28.07 2.39
North Cranbe 2006 Heptageniida 1.0 . -28.59 1.72 0.08
North Cranbe 2006 Heptageniida 1.0 . -28.76 1.90 0.23
North Cranbe 2006 Heptageniida 1.0 . -28.27 3.15 0.23
Pebbleloggit 2006 Heptageniida 1.0 . -29.35 0.51 0.04
Pebbleloggit 2006 Heptageniida 1.0 . -29.51 1.43 0.09
Pebbleloggit 2006 Heptageniida 1.0 . -29.22 1.35 0.08
Puzzle 2006 Heptageniida 1.0 . -29.11 1.82 0.08
Puzzle 2006 Heptageniida 1.0 . -29.69 1.75 0.13
Puzzle 2006 Heptageniida 1.0 . -28.02 2.74
Big Dam East 2006 Lepidoptera 1.0 -28.73 2.40

146
Lake Year Species Fish Code Length Weight Age 13C
15N Moisture THg MeHg Se
(cm) (g) (y) (‰) (‰) (%) µg/g) (µg/g) (µg/g)
Cobrielle 2006 Lepidoptera 1.0 -28.90 2.51
North Cranberry 2006 Lepidoptera 1.0 -30.78 3.53
Peskowesk 2006 Lepidoptera 1.0 -28.43 0.74
Beaverskin 2006 Limnephilidae 1.0 -30.77 0.90 0.04
Beaverskin 2006 Limnephilidae 1.0 -28.42 1.38 0.03
Beaverskin 2006 Limnephilidae 1.0 -29.01 0.71 0.03
North Cranberry 2006 Limnephilidae 1.0 -32.24 1.00 0.07
North Cranberry 2006 Limnephilidae 1.0 -32.74 1.86 0.11
North Cranberry 2006 Limnephilidae 1.0 -29.96 1.49 0.09
Pebbleloggitch 2006 Limnephilidae 1.0 -30.20 0.69 0.03
Pebbleloggitch 2006 Limnephilidae 1.0 -32.57 0.90 0.04
Pebbleloggitch 2006 Limnephilidae 1.0 -30.63 0.86 0.08
Puzzle 2006 Limnephilidae 1.0 -31.73 2.09 0.22
Puzzle 2006 Limnephilidae 1.0 -30.75 2.23 0.08
Puzzle 2006 Limnephilidae 1.0 -32.28 2.48 0.16
Big Dam West 2006 Limnephilidae 1.0 -35.22 0.99
Peskawa 2006 Limnephilidae 1.0 -32.15 -0.04
Kejimkujik 2006 Pycnopsyche 1.0 -26.46 1.66
Beaverskin 2006 Zooplankton 1.0 -32.59 4.21 0.10
Beaverskin 2006 Zooplankton 1.0 -31.38 4.56 0.12
Beaverskin 2006 Zooplankton 1.0 -33.56 4.34
North Cranberry 2006 Zooplankton 1.0 -33.48 3.88 0.09
North Cranberry 2006 Zooplankton 1.0 -36.41 4.11 0.31
North Cranberry 2006 Zooplankton 1.0 -35.70 5.55 0.29
Pebbleloggitch 2006 Zooplankton 1.0 -34.18 2.87 0.05
Pebbleloggitch 2006 Zooplankton 1.0 -36.37 2.26 0.12
Pebbleloggitch 2006 Zooplankton 1.0 -36.87 4.17 0.11
Puzzle 2006 Zooplankton 1.0 -32.94 4.03 0.08
Puzzle 2006 Zooplankton 1.0 -34.56 3.92 0.18
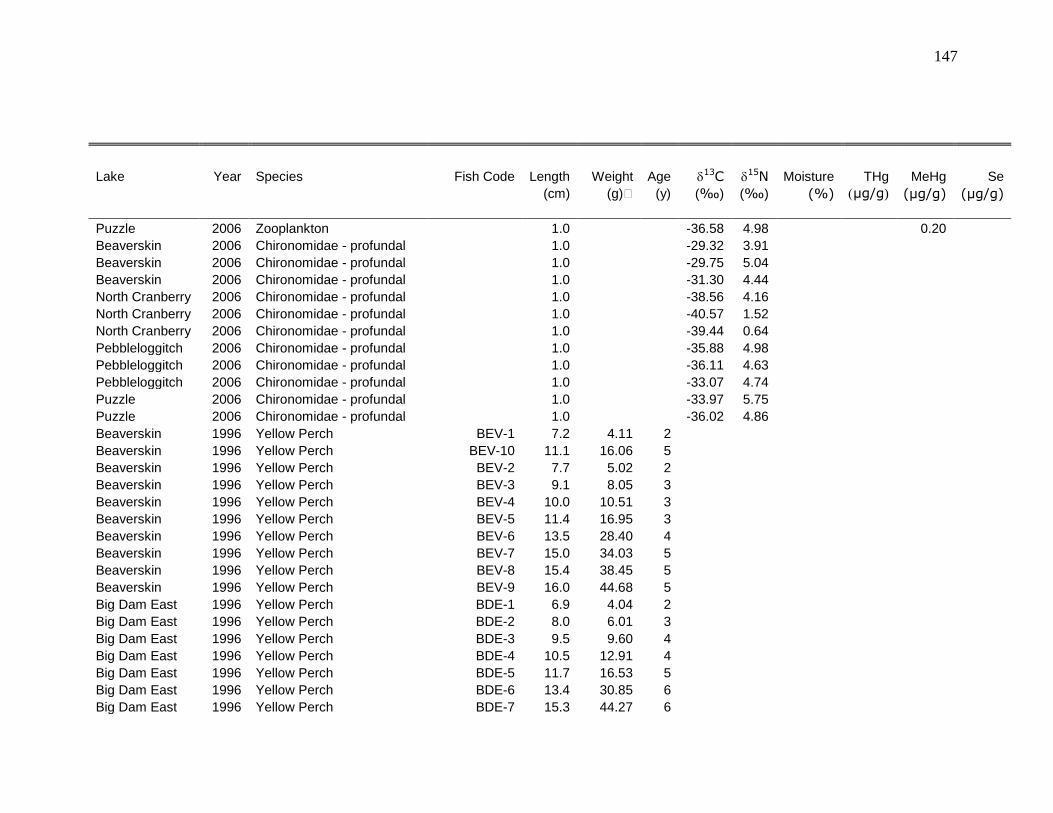
147
Lake Year Species Fish Code Length Weight Age 13C
15N Moisture THg MeHg Se
(cm) (g) (y) (‰) (‰) (%) µg/g) (µg/g) (µg/g)
Puzzle 2006 Zooplankton 1.0 -36.58 4.98 0.20
Beaverskin 2006 Chironomidae - profundal 1.0 -29.32 3.91
Beaverskin 2006 Chironomidae - profundal 1.0 -29.75 5.04
Beaverskin 2006 Chironomidae - profundal 1.0 -31.30 4.44
North Cranberry 2006 Chironomidae - profundal 1.0 -38.56 4.16
North Cranberry 2006 Chironomidae - profundal 1.0 -40.57 1.52
North Cranberry 2006 Chironomidae - profundal 1.0 -39.44 0.64
Pebbleloggitch 2006 Chironomidae - profundal 1.0 -35.88 4.98
Pebbleloggitch 2006 Chironomidae - profundal 1.0 -36.11 4.63
Pebbleloggitch 2006 Chironomidae - profundal 1.0 -33.07 4.74
Puzzle 2006 Chironomidae - profundal 1.0 -33.97 5.75
Puzzle 2006 Chironomidae - profundal 1.0 -36.02 4.86
Beaverskin 1996 Yellow Perch BEV-1 7.2 4.11 2
Beaverskin 1996 Yellow Perch BEV-10 11.1 16.06 5
Beaverskin 1996 Yellow Perch BEV-2 7.7 5.02 2
Beaverskin 1996 Yellow Perch BEV-3 9.1 8.05 3
Beaverskin 1996 Yellow Perch BEV-4 10.0 10.51 3
Beaverskin 1996 Yellow Perch BEV-5 11.4 16.95 3
Beaverskin 1996 Yellow Perch BEV-6 13.5 28.40 4
Beaverskin 1996 Yellow Perch BEV-7 15.0 34.03 5
Beaverskin 1996 Yellow Perch BEV-8 15.4 38.45 5
Beaverskin 1996 Yellow Perch BEV-9 16.0 44.68 5
Big Dam East 1996 Yellow Perch BDE-1 6.9 4.04 2
Big Dam East 1996 Yellow Perch BDE-2 8.0 6.01 3
Big Dam East 1996 Yellow Perch BDE-3 9.5 9.60 4
Big Dam East 1996 Yellow Perch BDE-4 10.5 12.91 4
Big Dam East 1996 Yellow Perch BDE-5 11.7 16.53 5
Big Dam East 1996 Yellow Perch BDE-6 13.4 30.85 6
Big Dam East 1996 Yellow Perch BDE-7 15.3 44.27 6

148
Lake Year Species Fish Code Length Weight Age 13C
15N Moisture THg MeHg Se
(cm) (g) (y) (‰) (‰) (%) µg/g) (µg/g) (µg/g)
Big Dam East 1996 Yellow Perch BDE-8 16.0 46.30 8
Big Dam West 1996 Yellow Perch BDW-1 6.3 3.09 2
Big Dam West 1996 Yellow Perch BDW-2 7.9 6.27 3
Big Dam West 1996 Yellow Perch BDW-3 8.7 8.08 4
Big Dam West 1996 Yellow Perch BDW-4 11.3 18.85 7
Big Dam West 1996 Yellow Perch BDW-5 12.4 25.71 7
Big Dam West 1996 Yellow Perch BDW-6 13.1 32.12 7
Big Dam West 1996 Yellow Perch BDW-7 16.1 55.66 8
Cobrielle 1996 Yellow Perch COB-1 11.2 14.78 4
Cobrielle 1996 Yellow Perch COB-2 12.8 25.67 4
Cobrielle 1996 Yellow Perch COB-3 14.1 31.62 5
Cobrielle 1996 Yellow Perch COB-4 15.6 44.30 5
Cobrielle 1996 Yellow Perch COB-5 16.0 47.42 6
Cobrielle 1996 Yellow Perch COB-6 18.1 72.14 7
Kejimkujik 1996 Yellow Perch KEJ(FAI)-1 6.9 3.86 2
Kejimkujik 1996 Yellow Perch KEJ(FAI)-2 9.3 9.92 4
Kejimkujik 1996 Yellow Perch KEJ(FAI)-3 9.6 10.31 4
Kejimkujik 1996 Yellow Perch KEJ(FAI)-4 10.2 12.23 5
Kejimkujik 1996 Yellow Perch KEJ(FAI)-5 11.2 17.67 6
Kejimkujik 1996 Yellow Perch KEJ(FAI)-6 13.2 24.49 7
Kejimkujik 1996 Yellow Perch KEJ(FAI)-7 15.8 49.20 5
Kejimkujik 1996 Yellow Perch KEJ(JER)-1 6.6 3.13 2
Kejimkujik 1996 Yellow Perch KEJ(JER)-2 8.5 6.40 3
Kejimkujik 1996 Yellow Perch KEJ(JER)-3 9.4 8.44 4
Kejimkujik 1996 Yellow Perch KEJ(JER)-4 10.2 11.30 4
Kejimkujik 1996 Yellow Perch KEJ(JER)-5 12.5 21.58 5
Kejimkujik 1996 Yellow Perch KEJ(JER)-6 13.9 30.60 6
Kejimkujik 1996 Yellow Perch KEJ(JER)-7 15.7 48.61 8
Kejimkujik 1996 Yellow Perch KEJ(JER)-8 17.0 67.00 9

149
Lake Year Species Fish Code Length Weight Age 13C
15N Moisture THg MeHg Se
(cm) (g) (y) (‰) (‰) (%) µg/g) (µg/g) (µg/g)
Kejimkujik 1996 Yellow Perch KEJ(SNA)-1 6.9 3.43 2
Kejimkujik 1996 Yellow Perch KEJ(SNA)-2 7.7 5.13 2
Kejimkujik 1996 Yellow Perch KEJ(SNA)-3 9.9 10.39 5
Kejimkujik 1996 Yellow Perch KEJ(SNA)-4 10.4 12.02 5
Kejimkujik 1996 Yellow Perch KEJ(SNA)-5 11.0 14.67 5
Kejimkujik 1996 Yellow Perch KEJ(SNA)-6 13.7 30.08 7
Kejimkujik 1996 Yellow Perch KEJ(SNA)-7 15.2 46.23 9
Kejimkujik 1996 Yellow Perch KEJ(SNA)-8 16.3 53.93 10
North Cranberry 1996 Yellow Perch NCR-1 8.4 5.70 3
North Cranberry 1996 Yellow Perch NCR-2 8.8 7.03 3
North Cranberry 1996 Yellow Perch NCR-3 9.7 10.42 3
North Cranberry 1996 Yellow Perch NCR-4 11.0 14.57 5
North Cranberry 1996 Yellow Perch NCR-5 12.4 21.95 5
North Cranberry 1996 Yellow Perch NCR-6 14.2 29.88 6
North Cranberry 1996 Yellow Perch NCR-7 15.4 41.26 7
North Cranberry 1996 Yellow Perch NCR-8 16.3 48.44 8
North Cranberry 1996 Yellow Perch NCR-9 17.5 58.49 9
Pebbleloggitch 1996 Yellow Perch PEB-1 6.5 3.01 3
Pebbleloggitch 1996 Yellow Perch PEB-2 7.6 4.65 3
Pebbleloggitch 1996 Yellow Perch PEB-3 9.0 8.10 3
Pebbleloggitch 1996 Yellow Perch PEB-4 10.1 12.02 4
Pebbleloggitch 1996 Yellow Perch PEB-5 12.3 19.13 5
Pebbleloggitch 1996 Yellow Perch PEB-6 14.1 34.59 6
Pebbleloggitch 1996 Yellow Perch PEB-7 15.5 47.64 6
Pebbleloggitch 1996 Yellow Perch PEB-8 17.6 68.46 8
Pebbleloggitch 1996 Yellow Perch PEB-9 18.5 75.34 9
Peskawa 1996 Yellow Perch PWA(CAB)-1 6.5 3.13 2
Peskawa 1996 Yellow Perch PWA(CAB)-2 7.5 4.93 3
Peskawa 1996 Yellow Perch PWA(CAB)-3 9.2 8.78 3

150
Lake Year Species Fish Code Length Weight Age 13C
15N Moisture THg MeHg Se
(cm) (g) (y) (‰) (‰) (%) µg/g) (µg/g) (µg/g)
Peskawa 1996 Yellow Perch PWA(CAB)-4 10.3 14.16 4
Peskawa 1996 Yellow Perch PWA(CAB)-5 11.4 16.31 5
Peskawa 1996 Yellow Perch PWA(CAB)-6 14.8 37.30 7
Peskawa 1996 Yellow Perch PWA(CAM)-1 6.5 2.94 2
Peskawa 1996 Yellow Perch PWA(CAM)-2 7.6 4.74 3
Peskawa 1996 Yellow Perch PWA(CAM)-3 8.8 7.35 3
Peskawa 1996 Yellow Perch PWA(CAM)-4 10.1 11.12 4
Peskawa 1996 Yellow Perch PWA(CAM)-5 11.0 16.20 5
Peskawa 1996 Yellow Perch PWA(CAM)-6 11.7 18.40 6
Peskawa 1996 Yellow Perch PWA(POR)-1 6.7 3.63 2
Peskawa 1996 Yellow Perch PWA(POR)-2 8.1 6.63 3
Peskawa 1996 Yellow Perch PWA(POR)-3 9.1 9.07 3
Peskawa 1996 Yellow Perch PWA(POR)-4 11.6 19.49 4
Peskawa 1996 Yellow Perch PWA(POR)-5 14.2 38.60 7
Peskawa 1996 Yellow Perch PWA(POR)-6 17.4 66.90 8
Peskawa 1996 Yellow Perch PWA(POR)-7 16.4 53.34 6
Peskawa 1996 Yellow Perch PWA(POR)-8 18.1 68.01 8
Peskowesk 1996 Yellow Perch PSK-1 7.7 5.04 3
Peskowesk 1996 Yellow Perch PSK-2 8.4 6.33 3
Peskowesk 1996 Yellow Perch PSK-3 9.2 8.08 3
Peskowesk 1996 Yellow Perch PSK-4 10.4 12.45 4
Peskowesk 1996 Yellow Perch PSK-5 12.5 22.40 6
Peskowesk 1996 Yellow Perch PSK-6 14.1 33.47 7
Peskowesk 1996 Yellow Perch PSK-7 16.6 52.32 8
Peskowesk 1996 Yellow Perch PSK-8 20.0 96.70 7
Puzzle 1996 Yellow Perch PUZ-1 6.7 2.99 2
Puzzle 1996 Yellow Perch PUZ-2 7.5 4.24 3
Puzzle 1996 Yellow Perch PUZ-3 8.0 5.52 3
Puzzle 1996 Yellow Perch PUZ-4 10.5 12.60 4
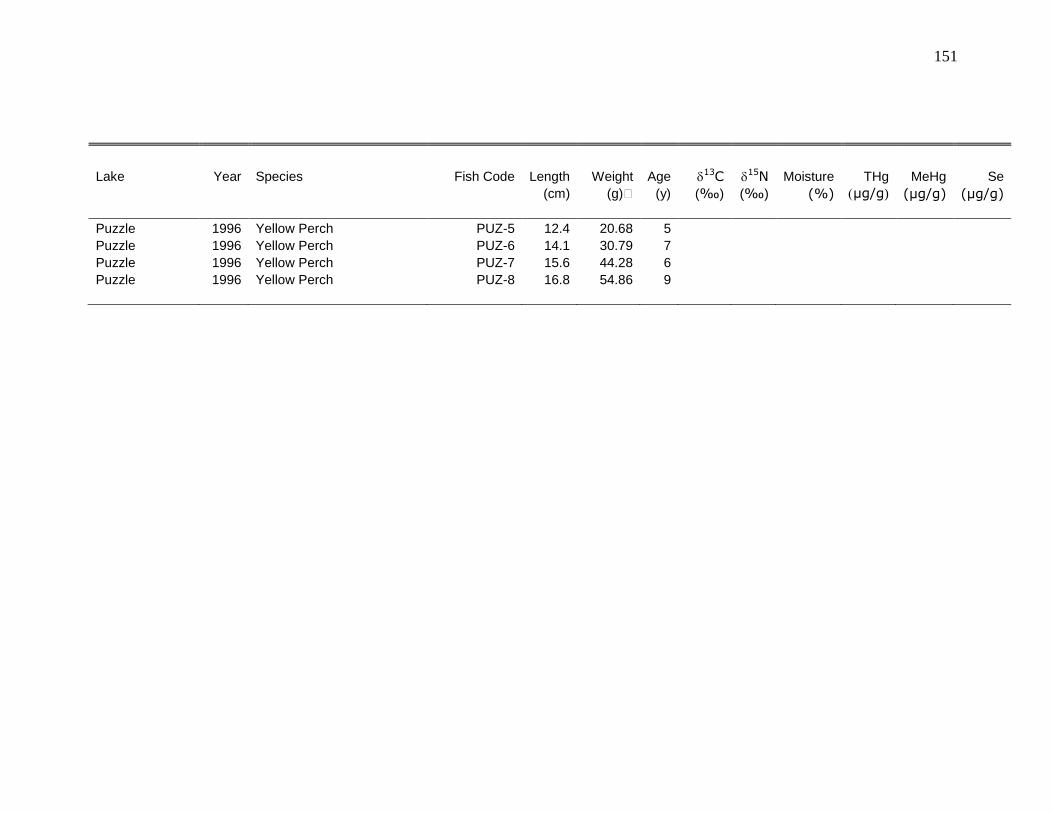
151
Lake Year Species Fish Code Length Weight Age 13C
15N Moisture THg MeHg Se
(cm) (g) (y) (‰) (‰) (%) µg/g) (µg/g) (µg/g)
Puzzle 1996 Yellow Perch PUZ-5 12.4 20.68 5
Puzzle 1996 Yellow Perch PUZ-6 14.1 30.79 7
Puzzle 1996 Yellow Perch PUZ-7 15.6 44.28 6
Puzzle 1996 Yellow Perch PUZ-8 16.8 54.86 9
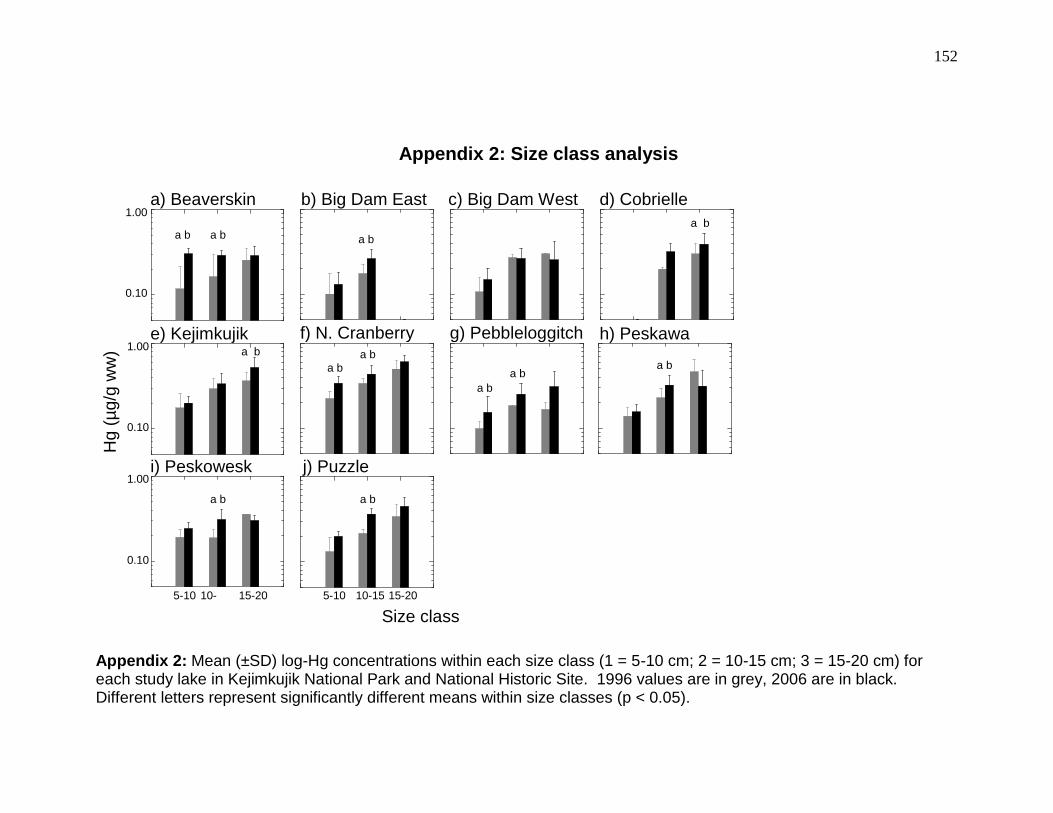
152
Appendix 2: Size class analysis
Appendix 2: Mean (±SD) log-Hg concentrations within each size class (1 = 5-10 cm; 2 = 10-15 cm; 3 = 15-20 cm) for each study lake in Kejimkujik National Park and National Historic Site. 1996 values are in grey, 2006 are in black. Different letters represent significantly different means within size classes (p < 0.05).
a) Beaverskin b) Big Dam East c) Big Dam West d) Cobrielle
g) Pebbleloggitch h) Peskawa
i) Peskowesk j) Puzzle
e) Kejimkujik
Hg (
µg/g
ww
)
Size class (cm)
5-10 10-15
15-20
a b a b a b
a b
a b
a b
a b
a b
a b a b
5-10 10-15 15-20
a b
a b
0.10
1.00
f) N. Cranberry
0.10
1.00
0.10
1.00
153
Appendix 3: Polynomial regression analysis
Analysis of covariance (ANCOVA) and t-tests force data into linear relationships although none may exist
(Tremblay et al. 1996b). For this reason the data were also tested with the polynomial regression to determine whether
non-linear (i.e. quadratic) models fit the Hg-length relationships more accurately. The polynomial regression model
includes a dummy variable for year (1996/1997 = 0, 2006 = 1), and requires that each fish log-length be centred to reduce
correlation between terms [length-centred, LC = individual log-length – lake’s mean log-length of both years combined;
(Tremblay et al. 1996b, Tremblay et al. 1998)]. The model was:
log-Hg = LC + LC2 + year + year*LC + year*LC2.
Backward stepwise regression was used to identify terms significantly related to log-Hg in that lake, and only these terms
were retained in the equation. If the year, year-LC, or year-LC2 terms were retained in the equation, then Hg
concentrations were significantly different among years. If LC2 or year*LC2 were included in the equation then the
relationship was non-linear, suggesting that the polynomial equation may be more appropriate than a linear regression.
Polynomial regression analysis revealed that Hg concentrations in fish increased significantly (p < 0.03) between
1996/1997 and 2006 for all lakes except Big Dam West.
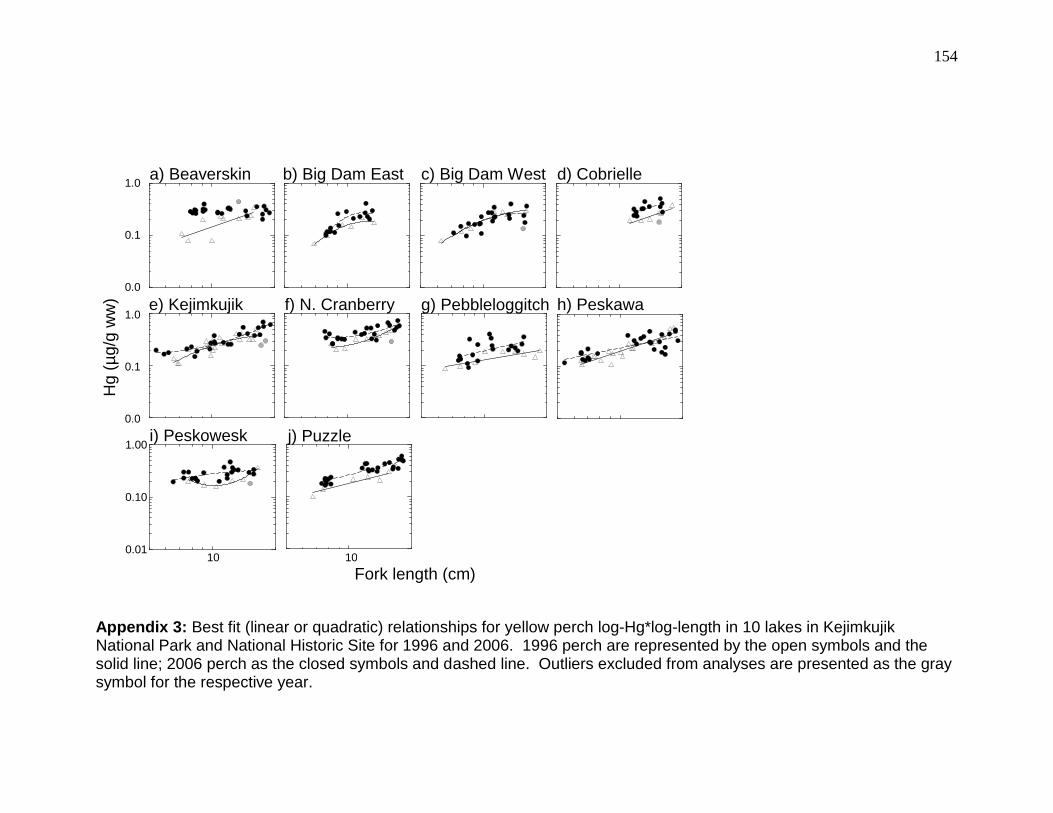
154
Appendix 3: Best fit (linear or quadratic) relationships for yellow perch log-Hg*log-length in 10 lakes in Kejimkujik National Park and National Historic Site for 1996 and 2006. 1996 perch are represented by the open symbols and the solid line; 2006 perch as the closed symbols and dashed line. Outliers excluded from analyses are presented as the gray symbol for the respective year.
10
j) Puzzle
d) Cobrielle
g) Pebbleloggitch h) Peskawa
a) Beaverskin
Fork length (cm)
0.01
0.10
1.00
e) Kejimkujik
c) Big Dam West
0.01
0.10
1.00
f) N. Cranberry
i) Peskowesk
10
Hg (
µg/g
ww
)
b) Big Dam East
0.01
0.10
1.00
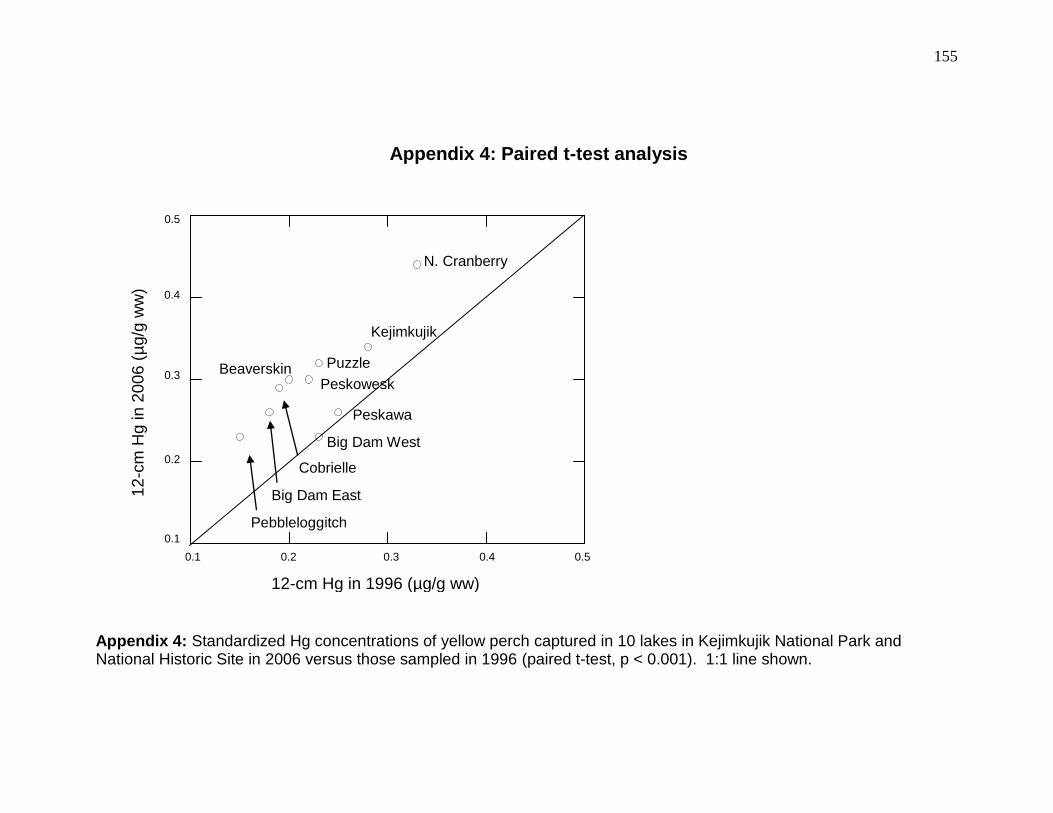
155
Appendix 4: Paired t-test analysis
Appendix 4: Standardized Hg concentrations of yellow perch captured in 10 lakes in Kejimkujik National Park and National Historic Site in 2006 versus those sampled in 1996 (paired t-test, p < 0.001). 1:1 line shown.
0.1 0.2 0.3 0.4 0.5
12-cm Hg in 1996 (µg/g ww)
0.1
0.2
0.3
0.4
0.5
Big Dam East
Big Dam West
Beaverskin Puzzle
Kejimkujik
Pebbleloggitch
Peskawa
N. Cranberry
Cobrielle
12
-cm
Hg in
20
06
(µ
g/g
ww
)
Peskowesk
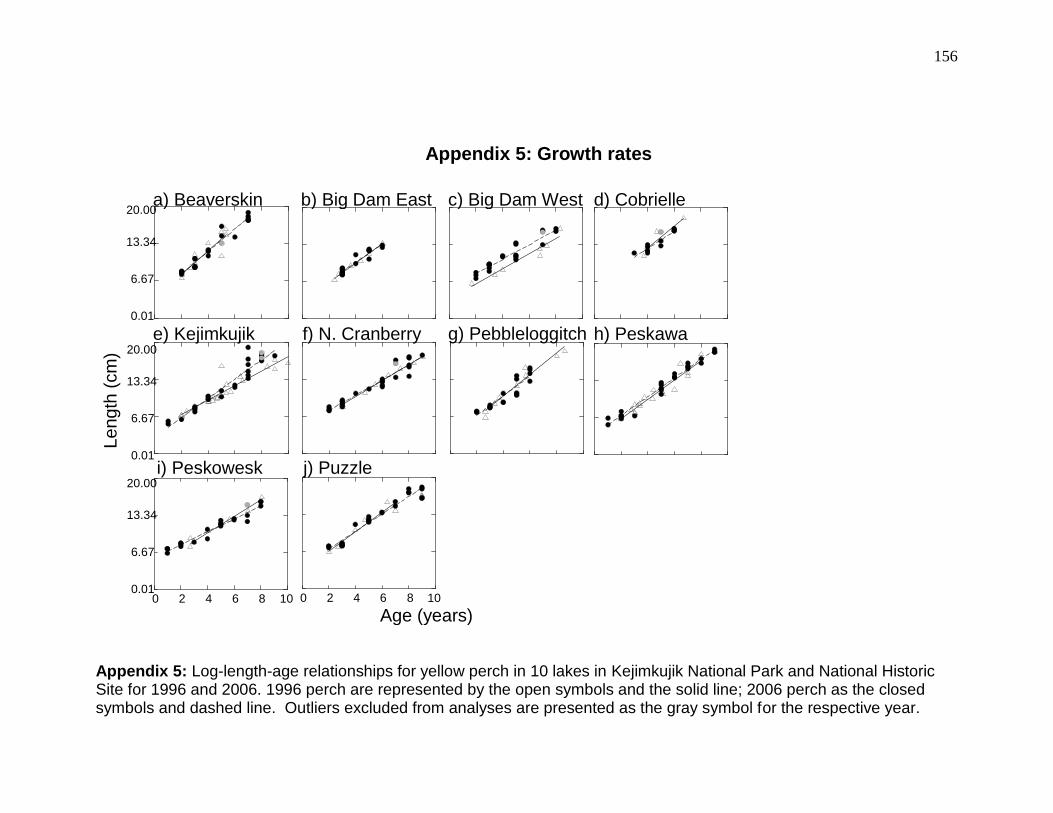
156
Appendix 5: Growth rates
Appendix 5: Log-length-age relationships for yellow perch in 10 lakes in Kejimkujik National Park and National Historic Site for 1996 and 2006. 1996 perch are represented by the open symbols and the solid line; 2006 perch as the closed symbols and dashed line. Outliers excluded from analyses are presented as the gray symbol for the respective year.
0.01
6.67
13.34
20.00
0 2 4 6 8 10
Age (years)
b) Big Dam East c) Big Dam West d) Cobrielle
g) Pebbleloggitch f) N. Cranberry h) Peskawa
a) Beaverskin
e) Kejimkujik
0.01
6.67
13.34
20.00
0.01
6.67
13.34
20.00 i) Peskowesk j) Puzzle
0 2 4 6 8 10
Le
ng
th (
cm
)
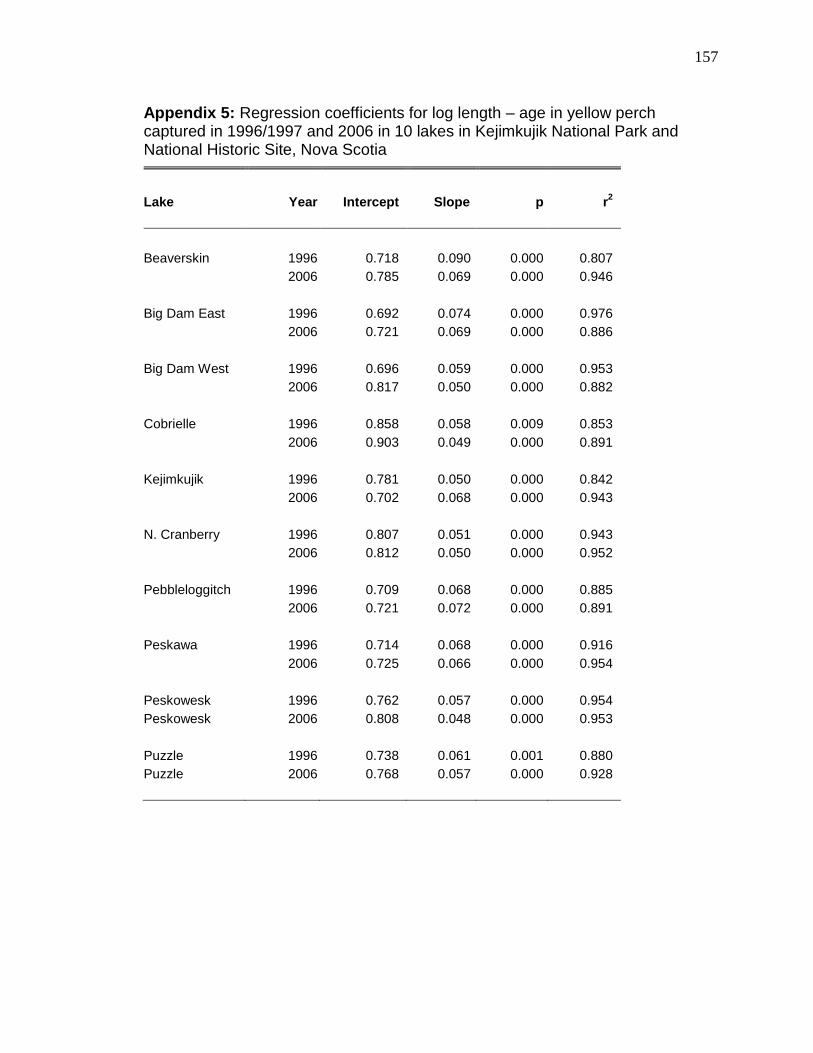
157
Appendix 5: Regression coefficients for log length – age in yellow perch captured in 1996/1997 and 2006 in 10 lakes in Kejimkujik National Park and National Historic Site, Nova Scotia
Lake Year Intercept Slope p r2
Beaverskin 1996 0.718 0.090 0.000 0.807
2006 0.785 0.069 0.000 0.946
Big Dam East 1996 0.692 0.074 0.000 0.976
2006 0.721 0.069 0.000 0.886
Big Dam West 1996 0.696 0.059 0.000 0.953
2006 0.817 0.050 0.000 0.882
Cobrielle 1996 0.858 0.058 0.009 0.853
2006 0.903 0.049 0.000 0.891
Kejimkujik 1996 0.781 0.050 0.000 0.842
2006 0.702 0.068 0.000 0.943
N. Cranberry 1996 0.807 0.051 0.000 0.943
2006 0.812 0.050 0.000 0.952
Pebbleloggitch 1996 0.709 0.068 0.000 0.885
2006 0.721 0.072 0.000 0.891
Peskawa 1996 0.714 0.068 0.000 0.916
2006 0.725 0.066 0.000 0.954
Peskowesk 1996 0.762 0.057 0.000 0.954
Peskowesk 2006 0.808 0.048 0.000 0.953
Puzzle 1996 0.738 0.061 0.001 0.880
Puzzle 2006 0.768 0.057 0.000 0.928
Vita
Brianna Wyn
Bachelor of Science, University of Regina, 2005
Publications:
Wyn, B., J. N. Sweetman, P. R. Leavitt, and D. B. Donald. 2007. Historical metal
concentrations in lacustrine food webs revealed using fossil ephippia from
Daphnia. Ecological Applications 17:754-764.
Conference Presentations:
Wyn, B., K. Kidd, R.A. Curry, and N. Burgess. Oral Presentation. Mercury
bioaccumulation in freshwater systems. Aquatic Toxicity Workshop, Halifax, Nova
Scotia, September 30 – October 3, 2007.
Wyn, B., K. Kidd, R.A. Curry, and N. Burgess. Poster Presentation. A decade later:
Changes in yellow perch mercury concentrations in Kejimkujik National Park, Nova
Scotia. Aquatic Toxicity Workshop, Halifax, Nova Scotia, September 30 – October
3, 2007.
Wyn, B., K. Kidd, R.A. Curry, and N. Burgess. Poster Presentation. Factors affecting
mercury concentrations in fish from acidified food webs in Kejimkujik National
Park, Nova Scotia. Society of Canadian Limnologists and Canadian Council of
Freshwater Fisheries Research, Montreal, Quebec, January 4-6, 2007
Wyn, B. Oral Presentation. Mercury in the fish and aquatic food webs of Kejimkujik
National Park. Kejimkujik - Mersey Tobeatic Research Institute Research
Conference, Kejimkujik National Park, Nova Scotia, June 6-7, 2006
Wyn, B. Oral Presentation. Historical changes in heavy metal deposition and retention in
two anthropogenically-impacted eutrophic lakes in southern Saskatchewan. Prairie
Universities Biological Symposium, Saskatoon, Saskatchewan, February 2005.