a thesis presented to the faculty of the ... systems. well control and modern seismic attribute...
TRANSCRIPT

AQUITANIAN (LOWER MIOCENE) DEPOSITIONAL SYSTEMS: VINTON DOME,
ONSHORE, GULF OF MEXICO, SOUTHWEST LOUISIANA
A THESIS
PRESENTED TO
THE FACULTY OF THE DEPARTMENT OF GEOSCIENCES
UNIVERSITY OF HOUSTON
IN PARTIAL FULFILMENT
OF THE REQUIREMENTS FOR THE DEGREE
MASTER OF SCIENCE IN GEOLOGY
BY
MORENIKE OLAYINKA COKER
DECEMBER 2006

ii
AQUITANIAN (LOWER MIOCENE) DEPOSITIONAL SYSTEMS: VINTON DOME,
ONSHORE, GULF OF MEXICO, SOUTHWEST LOUISIANA
MORENIKE OLAYINKA COKER
APPROVED:
DR. KURT MARFURT, CHAIRMAN
DR. JANOK BHATTACHARYA, PROFESSOR
MR. GREGORY JONES, STRATIGRAPHER, EXXONMOBIL
DEAN, COLLEGE OF NATURAL SCIENCES AND MATHEMATICS

iii
ACKNOWLEDGEMENTS
My gratitude goes to the Almighty God for His infinite power, guidance and
grace in accomplishing this program. My special thanks go to my committee
members, Dr. Kurt Marfurt, Dr. Janok Bhattacharya and Mr. Gregory Jones
(Exxonmobil) for their guidance, readiness, open-mindedness and contributions to
my thesis. I also acknowledge the support of Dr. Charlotte Sullivan, Dr. Michael
Murphy and Dr. Donald Van Nieuwenhuise for their useful discussions and module
reviews along the course of the study. The following companies are also
acknowledged for their assistance in providing biostratigraphic data: E. H. Stork, JR.
and Associates, Paleo Control, Inc., Paleo Data, Inc., Shell Offshore Inc., and Unocal
Corporation.

iv
DEDICATION
I dedicate this thesis to all my children, Michael Oladapo, Christopher
Oluwaseun, Francis Oluwafunmbi and Agnes Morenike Oluwakemi, my husband
and my parents, for all their support during the Master’s degree program at the
Geosciences Department of the University of Houston.

v
AQUITANIAN (LOWER MIOCENE) DEPOSITIONAL SYSTEMS: VINTON DOME,
ONSHORE, GULF OF MEXICO, SOUTHWEST LOUISIANA
AN ABSTRACT OF A THESIS
PRESENTED TO
THE FACULTY OF THE DEPARTMENT OF GEOSCIENCES
UNIVERSITY OF HOUSTON
IN PARTIAL FULFILMENT
OF THE REQUIREMENTS FOR THE DEGREE
MASTER OF SCIENCE IN GEOLOGY
BY
MORENIKE OLAYINKA COKER
DECEMBER 2006

vi
ABSTRACT
Biostratigraphic, geophysical, sequence-stratigraphic, and well data
evaluation of the complexly faulted Vinton Dome field in the northwest Gulf of
Mexico basin resulted in an improved Upper Oligocene and Lower Miocene
stratigraphic architecture and provided new insights into the Chattian and Aquitanian
depositional systems. Well control and modern seismic attribute analysis reveal the
relation between the depositional environment, structural patterns and salt tectonics.
The structural setting of the Miocene shelf is the result of the hereditary
Upper Oligocene structural design, and substantial evolution of sediment dispersal
onto a thick column of the Anahuac shale and onto unstable salt bodies. The dome is
characterized by a counter-regional fault, and three peripheral fault sets, each having
a different outline and basis for its formation. Fine scale isotropic polygonal faults,
averaging 200 ft (~ 60 m) in size, exist throughout the dome. Imaging of fine
polygonal structures has been rarely documented in the Gulf of Mexico basin,
although larger scale polygonal faults have been reported in the North Sea Basin.
Salt movement had set the stage for thinning and thickening of the Upper
Chattian strata, creating unconformities, slumps, and onlap against the salt plug,
whereas the Aquitanian is characterized by syn-deposition, and an unconformity as a
result of sea-level fall and increased sedimentation, perhaps also caused by the salt
withdrawal processes. Stratigraphic evaluation of the Upper Chattian reveals shale
deformation structures that resemble sinuous sandy channel deposits that could
contribute to pitfalls in seismic interpretation.

vii
During sea level falls in the Late Oligocene to Early Miocene, the depocenter
shifted from the west to the south with unconformities characterizing the southern
parts of the dome. Transgressive systems tracts represented by the Late Oligocene
Anahuac shale deposits are overlain by the highstand systems tracts of the Early
Miocene Aquitanian deltaic sandstones.

viii
TABLE OF CONTENTS
CHAPTER ONE: INTRODUCTION ------------------------------------- 1
1.1 REGIONAL GEOLOGIC SETTING ---------------------------------- 2 1.2 PREVIOUS STUDY ------------------------------------------------------ 8
1.2.1 General Stratigraphy ---------------------------------------- 8 1.2.2 Vinton Salt Dome ---------------------------------------- 12
1.3 STUDY AREA ----------------------------------------------------- 13
CHAPTER TWO: METHOD OF STUDY ----------------------------------------- 22
2.1 CHALLENGES ----------------------------------------------------- 22 2.2 DATA --------------------------------------------------------------- 23 2.3 WELL TO SEISMIC TIE ------------------------------------------- 25 2.4 MAPPING TECHNIQUES ------------------------------------------- 28 2.5 SEISMIC ATTRIBUTES ------------------------------------------- 30 2.5.1 Attributes Sensitive to Structure ------------------------ 31
2.5.2 Amplitude Attributes ---------------------------------- 33 2.5.3 Waveform Similarity Attributes ------------------------ 33 CHAPTER THREE: SALT TECTONICS AND STRUCTURAL DEVELOPMENT --------------------------------- 36
3.1 PRINCIPLES AND APPLICATIONS ---------------------------------- 36 3.1.1 Observations and Discussions on Structure of Vinton Dome
------------------------ 39 3.2 STRUCTURAL EVALUATION ---------------------------------- 46 3.2.1 Salt Shape ------------------------------------------------------ 46 3.2.2 Faults -------------------------------------------------- 48 3.2.2.1 Major Faults -------------------------------- 48 3.2.2.2 Polygonal “Mosaic” Fractures -------------- 56 3.2.3 Discussion on Faults ---------------------------------- 63 3.2.4 Impact on Sedimentation ---------------------------------- 64 3.2.5 Appendices ---------------------------------- 70

ix
CHAPTER FOUR: INTEGRATED INTERPRETATION ----------------------- 74
4.1 APPLIED BIOSTRATIGRAPHY ---------------------------------- 74 4.2 LOG INTERPRETATION -------------------------------------------- 80 4.3 SEQUENCE STRATIGRAPHY ---------------------------------- 90 4.3.1 Sequence Stratigraphic Analysis by Well Logs ---- 91 4.4 SEISMIC INTERPRETATION ---------------------------------- 97
CHAPTER FIVE: CONCLUSIONS ----------------------------------------- 115 REFERENCES: ------ ----------------------------------------- 118

1
CHAPTER ONE
INTRODUCTION
Small compartmentalized reservoirs are becoming increasingly economic in
complexly faulted producing areas, such as the Vinton Salt Dome area. Production
in the Vinton Dome, Onshore Gulf of Mexico has continued for over a century, but
few published studies have focused on the geology of the shallow Miocene strata,
which were presumed wet, partly due to the early-favored highly prolific and deeper
Oligocene reservoirs, and largely due to lack of imaging technology to identify small
by-passed fault compartments (Thompson & Eichelberger, 1928). Nevertheless, the
Miocene strata are locally highly prolific at Vinton Dome, with ten acre fault blocks
producing as much as 1 million barrels of oil (SONRIS Database Access, 2006).
New seismic attribute technology, developed at the University of Houston,
has the potential to identify small or subtle subsurface features. My study tested the
applicability of these new volumetric seismic attributes on deltaic-shelfal Aquitanian
and Chattian strata constrained by biostratigraphic data. Attributes including
coherence, curvature, and amplitude gradients, can be used to identify channels,
channel belts, fault compartments, polygonal faults, deformation structures,
subaqueous channels and prodelta turbidites. Using seismic, biostratigraphic, and a
variety of well and engineering data, I am able to identify depocenters, depositional
systems tracts, facies migration and stacking patterns, and their relations to salt
tectonism.

2
My study not only characterizes the deposition of the Lower Miocene
sandstones at Vinton Dome, it also highlights shale deformation structures that could
otherwise simply be interpreted as fluvial structures, which may contribute to pitfalls
in seismic interpretation, and also helps to develop workflows for navigating through
the abundance of attributes available to seismic interpreters.
1.1 REGIONAL GEOLOGIC SETTING
The Vinton Dome is located on the northern Gulf of Mexico shelf. The basin
initialized in the Middle Jurassic during the break up of the North American
lithospheric plate from the South American and African plates as a result of seafloor
spreading associated with the break up of the Pangean supercontinent. (Salvador,
1987; Worall & Snelson, 1989). Regional subsidence, influx of marine waters, and
restricted seawater circulation resulted in the deposition of a thick sequence of
Jurassic evaporite deposits. These evaporite deposits (Figure 1) are thought to have
been originally contiguous, but were later separated into a northern and southern belt
by continued seafloor spreading during the Mid-Late Jurassic (Marton & Buffler,
1993; McBride et al., 1998).
The northern salt, typically referred to as the Louann salt, is the major source
of salt migration in the northern Gulf of Mexico. Following the evaporite deposition,
clastic and carbonate sediments were deposited onto the salt resulting in basinward
and upward migration of the salt (Salvador, 1987; Watkins et al., 1996). The
Cenozoic era was a period of extensive deposition of terrigenous sediments to the

3
basin (Galloway, 2001) (Figure 2). The northern part of the Gulf of Mexico basin
was fed from the west, northwest, and north by sediments delivered by a major
complex of avulsing river systems and reworked coastal sediments (Worall &
Snelson, 1989).
Figure 1: Paleogeographic map of the Middle Jurassic salt belt before Cenozoic deposits (Salvador, 1987)
The Miocene stratigraphic interval in the Gulf of Mexico is marked by 2
supersequences (Figures 3 & 4), each beginning with a gradual transgression, and
ending with an abrupt regression (Fillon & Lawless, 2000). The first supersequence
began below the Basal Miocene and ended at the middle Middle Miocene. The
second supersequence extended beyond the Miocene into the Pliocene (Fillon &

4
Lawless, 1999). Periods of slow transgression due to gradual sea-level rise allow
sediments to accumulate on the shelf and to gradually aggrade, while conforming to
accommodation provided by salt withdrawal. Periods of major regression are
marked by the formation of major disconformities or major by-pass of the shelf and
deposition onto basin slopes and the adjacent abyssal plains.
However, sediments can be transported from the Gulf of Mexico shelf to
reach the basin floor, by major by-pass during regression (at lowstands of sea-level),
and also by gradual fill and spill processes primarily controlled by salt tectonics
(Hamiter et al., 1997; Combellas-Biggot & Galloway, 2002) as illustrated in Figure
2. Though sediment accumulation rate was non-uniform, especially during the
Early Miocene, accumulation is expected to be greatest on the shelf during periods of
rising sea level.
S u b s a l t S t r a t a
S a l t b o d i e sM i n i - b a s i n s
L a n d
S e a w a r d
D ir e c t io n o f s e d i m e n t t r a n s p o r t a t io n
Figure 2: Illustration of sediment deposition and transportation along fill and spill minibasins on salt bodies. Not drawn to scale.

5
Figure 3: Sea Level and Depositional Cycles of the Lower Miocene (after Fillon et al., 1997) LJ – Lenticulina jeffersonensis; SD – Siphonina davisi; MA – Marginulina ascensionensis; G6 – Gyroidina “6”; AB – Amphistegina “B”.
List of Abbreviations for Figures 3 and 4; LH – Lenticulina hanseni; SD – Siphonina davisi; MA - Marg A – Marginulina ascensionensis; Rob ‘chamb’ - Robulus chambersi; G6 - Gyro “6” – Gyroidina ‘6’; Epon ornat – Eponides ornata; Rob ‘L’ – Robulus L; AB - Amph ‘B’ – Amphistegina ‘B’; Cib Op – Cibicides opima; Cris “W” – Cristellaria ‘W’; Cris “I” – Cristellaria ‘I’; Big hum – Bigenerina humblei; Tex “W” – Textularia W; Cib carst “1”– Cibicides carstensi ‘1’; Cib inflat – Cibicides inflata; Tex “L” – Textularia ‘L’; Rob “E” – Robulus ‘E’
MIOCENE

6
Figure 4: Coastal Onlap Curve, Miocene, Northern Gulf of Mexico
(Modified after Fillon, 1997) SS = Supersequence
M I O
C E
N E
M
IDD
LELO
WER
UPPER
PLIO
MESSINIAN TO
RTO
NIA
N
SERA
VALLIA
LAN
GH
IAN
B
UR
DIG
ALIA
AQ
UITA
NIA
N
Rob “E” [3]
Amph “L” [3]
Disc “12” [4]
Big hum [3]
-- 13 --
-- 14 --
-- 15 --
-- 16 --
-- 12 --
-- 11 --
-- 10 --
-- 17 --
-- 18 --
-- 19 --
-- 20 --
-- 21 --
-- 22 --
-- 23 --
-- 24 --
-- 9 --
-- 8--
-- 7 --
-- 6 --
SERIES
STAG
E
TIME IN 106 YEARS
[n]th ORDER COASTAL ONLAP CURVE, KEY SURFACES AND TRENDS
TRANSGRESSIVE REGRESSIVE
Tex “L” [4]
Upper Cris “L” [4]
Tex “W” [3]
Cib carst [3]
Amph “B” [3]
Gyro “6” [4]
Rob “L” [4]
Marg “A” [3]
[2]
[2]
Siph davisi [3]
Plan palmarae [4]
Lentic ‘jeff’ [3]
RB
LH
SD
MA
SB
HA
SH
DD
DK
DH
DIT
DL
MDE
Rob ‘chamb’ [4]
Rob ’54b’ [4]Epon ornat [4]
Cib Op [4]
Cib inflat [4] SS2
SS1
Lower Cris “W” \ Cib Op [3]
Rob “64” [3]
Disc Buc [4]Bol Cib [4]

7
Lenticulina jeffersonensis and Cibicides carstensi biozones marked the bases
of the 1st and the 2nd supersequences in the Miocene. Previous biostratigraphic
work defined the Lower Miocene section as being bracketed by the Lenticulina
jeffersonensis and Amphistegina “B” biozones ( Breard et al., 1993; 1994; 1996; &
Fillon & Lawless, 1999), the Middle Miocene by Cibicides carstensi biozone while
the top of the Upper Miocene is capped by Robulus “E” biozone (Figure 5).
Robulus E
Cibicides carstensi
Amphistegina B
Lenticulina jeffersonensis
M14
M15
M16
M17
M18
Lower Miocene
Middle Miocene
Upper Miocene
Siphonina davisi
M1
M2
M3
M4
M5
M6
M7
M8
M9M10
M11
M12
M13
Aquitanian
Figure 5: Schematic diagram showing spatial biozones of the Miocene packages, Vinton Dome. M = numbered sands as per company reports.
Biozone

8
1.2 PREVIOUS STUDY
1.2.1 General Stratigraphy
Previous regional and local studies done on the northern Gulf of Mexico (e.g.
Curtis, 1970, Edwards, 1994, Blood & Crastley, 1995, Galloway et al., 2000) are
typically based on thousands of well logs, 2D and 3D seismic data, biostratigraphy,
and in some cases, outcrops. The Lower Miocene framework study by Galloway
(1986) identified outcrops of gently dipping, coastward-thickening sections of
interbedded sandstones and mudstones in South Texas, northwest shelf, of the Gulf
of Mexico basin. The wave-dominated north Padre delta system in South Texas
included the extensive wave-reworked Matagorda barrier and strandplain complex
that extended to Louisiana.
The Early Miocene was a period during which the depocenter of the ancestral
Mississippi delta system was located onshore, near the present day coastline in
southwest Louisiana (Hunt & Burgess, 1995 & Galloway 2000). The LM1 and LM2
through to MM7 chronozones (Figures 6) recorded eastward onshore migration,
whereas only the outer fringes of deltaic and submarine fan facies are observed
offshore. In the northwest Gulf of Mexico, the Early Miocene was a period of onset
of deposition onto a thick column of the Anahuac shale revealing substantial
evolution in sediment dispersal.
The 3rd order sequences previously established in the Lower Miocene
supersequence are marked by the Lenticulina jeffersonensis, Siphonina davisi,
Marginulina ascensionensis (Marg “A”), Gyrodina “6”, Amphistegina “B”, and lower

9
Cristellaria “I” biozones (Haq et al., 1988; Fillon & Lawless, 2000; & Witrock et al.,
2003) (Figure 7). The basal Miocene is the Lenticulina jeffersonensis sequence
deposited during the Liebusella regression, a major regression that terminates the 2nd
order Late Oligocene Anahuac sequences reportedly consisting of on–shelf
retrogradational shallow coastal systems such as wave-dominated deltas and barriers.
The 2nd order early Miocene sequences, however, are on-shelf progradational shallow
coastal systems (Fillon & Lawless, 2000; Trevino et al., 2003).
The Anahuac Shale Formation in the Upper Oligocene sequence symbolizes
the maximum landward shift of shorelines during the Late Oligocene. It is
recognized below by Marginulina vaginata, in the middle by Heterostegina texana
and at the top by Discorbis gravelli. The Heterostegina texana biozone, however, is
a limestone unit in the middle of a marine shale facies, a period of carbonate build up
(reef) that occurred in the Late Oligocene as far west as the Houston salt basin
(Galloway et al., 2000). The period was characterized by a decrease in sediment
supply that provided conducive conditions such as clear and clean waters for
carbonate development. On the western Louisiana shelf, patch reefs developed on
the top of salt domes and in the southeast, carbonates build up as thick as 1300 ft
(400 m) (Krutack & Beron, 1990; Liu et al., 1997). The condition was terminated by
an increase in clastic sediment influx at the onset of the Early Miocene.
Depositional systems in the Early Miocene in the NW Gulf of Mexico are
identified as wave dominated thick sand-rich strand plain and barrier shore zone
systems. This was followed by progradation of the fluvial dominated Calcasieu delta

10
onto an initially highly unstable collapsing continental margin creating an extensive
sandy delta-fed apron and the principal LM1 & LM2 depocenter (Galloway, 1986).
Thereafter, accumulation rates became low and clastic deposition spread onto the NE
shelf (Figure 7). The west Gulf margin thereafter regressed to a narrow clastic shelf
and progradational slope apron (Galloway, 2000).
Figure 6: Chronostratigraphic subdivisions and biostratigraphic zones used for the Gulf of Mexico. (Modified from Seni et al., 1995)
QUATERNARY TERTIARY
Oligo-cene Miocene
Pleistocene Plio-cene
SYSTEM SERIES
ATLAS CHRONO. CHRONO-
ZONES BIOCHRONZONES
OL
LM4
LM-3
Oligocene Frio-Anahuac
MM-6
MM-1
MM4
MM-7MM7
MM-5
MM-8
LM2LM-2
LM1LM-1
LM-4
MM-3
MM-2
LM3
MM1
MM-4
MM9MM-9
UM-8UM-1
UM-2UM3
LPL
UM-3
LPLP
UPUP LPL-1 LPL-2
MPL
UPL
MPL-1
MPL-2
UPL-1
UPL-2
UPL-3
UPL-4
Boliviana perca
Lenticulina hanseni
Siphonina davisi
Marginulina ascensionensis
Discorbis b.
Gyroidina k
Cristellaria 54/E
ponides 14
Robulus 43
Am
phistegina B
Cibicides opim
a
Bigenerina hum
blei Textularia W
Cristellaria I
Bigenerina 2
Discorbis 12
Cristellaria K
Robulus E
/Bigenerina
A
Textularia X
Bulim
inella 1
Valvulina H
Lenticulina 1
Angulogerina B
2nd
Angulogerina B
1st
Hyalines B
/Trimosina B
Trimosina A
2nd
Trimosina A
1st
Sangam
on Fauna

11
Figure 7: Biostratigraphic chart of the Gulf of Mexico, Lower Miocene (Modified from Witrock et al., 2003).
MMS CHRONOZONE
Time (mya) (not to scale)
CHRONOSTRATIGRAPHY
SYSTEM SUBSYSTEM SERIES STAGE
BIOSTRATIGRAPHY
FORAMINIFERAL PLANKTIC AND BENTHIC REGIONAL AND LOCAL MARKERS
CALCAREOUS NANNOPLANKTIC REGIONAL AND LOCAL MARKERS
PROPOSED CURRENT
LOWEER MIOCENE
BURDIGALIAN
AQUITANIAN
MIOCENE
NEOGENE
TERTIARY
Camerian 1,Robulus 54B = Cristellaria 54 Saracenaria sp. / “D” Gyrodina “K”/9/4 Catapsydrax stainforthi Catapsydrax dissimils, Robulus chambersi, Discorbis bolivarensis/”B”, Cristellaria “A” Marginulina ascensionensis/”A” Globigerina binaensis Gyroidina 8
Siphotestularia fredsmithi
Siphonina davisiPlanulina palmerae Globigerinoides primordius Lenticulina hanseni Lenticulina jeffersonensis, Cristellaria “R”, Globorotalia kugleri,
Globigerina angulosuturalis
Robulus “A”
Discorbis gravelli
Sphenolithus belemnos Reticulofenestra gartneri Sphenolithus disbelemnos Orthorhabdus serratus
Triquetrorhabdulus carinatus, Triquetrorhabdulus challengeri Discoaster calculosus increase
Discoaster saundersi Sphenolithus dissimilis Cyclcargolithus abisectus Helicosphaera recta
MUL
MML
MLL
M
LM4
LM2
LM1
Sphenolithus delphix
23.80
20.52
16.40
Hetrostegina texana

12
1.2.2 Vinton Salt Dome
The Vinton salt dome contains a core of massive cap rock, rock salt, gypsum,
and anhydrite, in succession (Thompson & Eichelberger, 1928), with the cap rock
extending over the rock salt (Figure 8). Of particular interest to geologists are salt
domes in the deltaic, delta fringe, continental shelf and sandy upper slope areas of
the northern Gulf of Mexico because they tend to provide trapping mechanism for
hydrocarbons, and can also be economically beneficial because they sometimes
contain quality salt, dolomite, limestone, gypsum, and anhydrite.
Figure 8: A cross-section of Vinton dome showing the position of cap rock. Scale in feet. (after Thompson & Eichelberger, 1928)
E’ E
2
3
4.5
4
0
14760
1
(z) k
m
(z) f
t

13
1.3 STUDY AREA
The Vinton Dome area, also known as the Ged Field covers an area of
approximately 156 km2 in the Calcasieu Parish, Southwestern Louisiana (Figure 9).
Biostratigraphic picks in the Miocene section of Vinton Dome area are scanty
and are largely confined to a pilot study of the Aquitanian stage. In this study, the
top of the Aquitanian stage is placed at Siphonina davisi (Haq et al., 1988; & Styzen,
1996; & Witrock et al., 2003) (Figures 6 & 7) and the base is hinged on the
Discorbis gravelli pick. In general, the basal Miocene may be defined by Top
Oligocene fossils, Discorbis gravelli (Trevino et al., 2003) or Heterostegina texana
(Ye et al., 1995; Galloway, 2000). Based on well log analysis, the depositional
environments are broadly fluvial-deltaic, and my best attempt to determine these
VERMILION
LAFAY
FAULT
JEFF DAVIS
YOUNGE
IBERIA
M
50 MILES
ON
Figure 9:
Vinton Dome location, Northwest Gulf of Mexico, Southwest, Louisiana (modified from Edwards, 1994).

14
environments is based on the environmental preferences of foraminifera reported
from drilled wells, and the depositional patterns indicated by log curve shape. Paleo
markers, reported from 12 wells at the Vinton Dome are listed below, along with
their published environmental preferences (Vail & Wornardt, 1991; Breard et al.,
1993; 1994; 1996) (Figure 10). Based on the biostratigraphy, the Miocene strata of
the Vinton Dome area seem to consistently lie in a relatively shallow marine, inner
shelf environment.
Foraminiferal marker Environment water depth
Siphonina davisi Inner Neritic 0’ - 100’
Discorbis gravelli Deep Inner Neritic < 100’
Heterostegina texana Inner Neritic 0’ -100’
Marginulina vaginata Deep Inner Neritic < 100’
Figure 10: Paleobathymetric zonation (Vail & Wornardt, 1991; Breard et al., 1993).

15
There are very few published studies on Vinton Dome and on the Miocene
sections of the area. Regional studies done by Curtis (1970), Edwards (1994), and
Galloway (1996 & 2000) presented a general overview of the geology of the
northwest Gulf of Mexico area. Thompson & Eichelberger (1928), however, were
modest in details of the geology of the dome considering the few available wells,
lower quality data, and older geological concepts in the early 20th century. There are
few or no published articles on the Miocene depositional models in the Vinton Dome
area. Therefore, this study will provide an understanding of the Aquitanian
depositional systems and insight for future studies of the Miocene depositional
systems in the northern Gulf of Mexico.
The general study of the northwest Gulf of Mexico conducted by Galloway
et al., (2000) placed the Vinton dome area on the Miocene shelf, which was the
location of deltaic, shallow marine and shelfal sediments, as also indicated by the
biostratigraphy and paleogeography (Blood & Crastley, 1995 & Galloway et al.,
2000). The following figures reveal the evolution of the northwest Gulf of Mexico
through the Miocene including the approximate paleogeographic position of the
Vinton Dome area. During the Chattian, the dome was situated below the shelf,
while in the Aquitanian, the dome was located on the fluvial dominated system of the
Calcasieu Delta in the Red river dispersal axis (Figures 11-15 and Table 1).

16
Figure 11: Basin-margin structural features and principal (caps) and secondary (lower case) Cenozoic sediment dispersal axes of the Gulf of Mexico basin: no = Norias; RG = Rio Grande; cz = Carrizo; cr = Corsair; HN = Houston; RD = Red River; CM = Central Mississippi; EM = East Mississippi (Modified after Galloway et al., 2000). Vinton area was located on the Red River dispersal axis.

17
Figure 12: Paleogeography of the Late Frio/Vicksburg (OF-F, 28-25 Ma) depositional episode. See Table 1 for explanations of symbols and
abbreviations (Modified after Galloway et al., 2000).
95 90
--30o --
HOUSTON D

18
Figure 13: Paleogeography of the Miocene (LM1, 25-18 Ma) depositional episode. See Table 1 for explanations of symbols and abbreviations (Modified after Galloway et al.,
2000). Vinton area was situated on the eastern edge of the Calcasieu Delta.
Mississippi Delta Calcasieu
Delta
Planulina Collapsed Margin
95o 90o
30o

19
Figure 14: Paleogeography of the middle Miocene (MM-I, 15.6-12 Ma) depositional episode. See Table 1 for explanations of symbols and abbreviations (Modified after
Galloway et al., 2000). Vinton area was situated on the Mississippi delta system.
Mississippi Delta System
95o 90o
Megaslide
Mississippi Delta System
30o

20
Figure 15: Paleogeography of the late Miocene (UM-K, 12-6.4 Ma) depositional episode. See Table 1 for explanations of symbols and abbreviations (Modified after Galloway et al.,
2000). Vinton area was situated on the west of the Mississippi delta system.
95o 90o
Mississippi Delta System
Central
30o

21
Table 1: Explanation of symbols for paleogeographic maps (Figures 11-15). Maps show depositional systems, sediment dispersal axes, generalized depocenters, and selected
depositional and erosional features (Re-drafted after Galloway, 2000).
Shelf margin at maximum progradation
Relict shelf margin of underlying depisode
Depositional Features
Other relict shelf margin
Relict Cretaceous shelf margin
Pinch out or truncation
Outline of submarine canyons, megaslides, and embayments
Regional depoaxis
Regional depocenter
Sediment transport
Depositional Systems
Starved basin Basin Contourite driftMass transport complex Muddy fan Sandy fan Sandy – rich fan Sandy basin floor Basin floor apron
Carbonate ramp Bypass slope Retrogradational apronProgradational shelf-fed
Progradational delta-fed apron
Slope system
Carbonate shelf Siliciclastic shelf Shore zone Wave – dominated delta
Fluvial – dominated delta
Suspended – load dominated fluvialMixed – load dominated
Bed – load dominated fluvial
Fluvial undifferentiated
Non-deposition

22
CHAPTER TWO
METHOD OF STUDY
2.1 CHALLENGES
The Vinton Dome area is mainly characterized by salt intrusion and related
faulting. As a result, synthetic seismograms generated near the salt are of limited
benefit due to highly disturbed beds, high bed dips, severe faulting, and poor seismic
resolution. The synthetic seismogram generated at the periphery of the area, where
the salt impact is low, is of best quality. Since the main structural traps are against
the salt body, which is at the center of the dome, the well data are not uniformly
distributed across the area. The majority of the wells are close to the salt body and
the southwestern part of the survey does not have wells. Therefore, the apparent
distribution of well information, interpretation, and well to seismic ties, is biased by
the location of the 546 logged wells.
Due to the low seismic resolution and unavailability of core data and wellbore
images of the complex area, major challenges are the:
(1) prediction of sand body geometries as a result of the salt influence and severe
faulting; (2) stratigraphic sequencing of the Aquitanian due to the limited seismic
vertical resolution of 4th order sequences, amalgamation of shelfal and fluvial deposits
in the restricted accommodation on the shelf, and the resultant recognition of smeared
facies distribution within the 3rd order sequences; (3) presence of sporadic sandstone
bodies; (4) complex fault system; and (5) timing of the salt movement and prediction
of the subsequent sediment deformation by the salt.

23
2.2 DATA
The stratigraphy and structure of the Aquitanian were mapped using 60-65
Hz resolution 3-dimensional (3D) surface phase rotated seismic data, 546 well logs,
and the limited available biostratigraphic data, using a Geoframe 4.0.4. workstation
software. The workflow is shown in figure 16. The radial 3D seismic survey covers
an area of 156 square km and consists of 666 crosslines starting from line 1 in the
north -south direction and 655 inlines starting from line 1000 in the east-west
direction. The peak frequency of the seismic data is 40 Hz. Calculated lateral and
vertical resolution are 125 ft (38 m) and 44 ft (13.4 m) respectively at 7500 ft (23 m).
Imaging of subsurface bodies using conventional seismic amplitude is therefore
subjected to the tuning thickness based on the lateral and vertical data resolution.
The seismic data were processed with 3001 samples per trace at a 2 millisecond
sampling interval. The seismic data were rotated 90o from the original zero phase
and interpretation was performed directly on 90o phase rotated data. Pure 90o phase
rotation (Quadrature) data were needed for maximum amplitude extractions of
centers of beds of interest, which were otherwise on zero crossings when well to
seismic ties were carried out on zero phase data. The rotation then makes the
seismic response symmetrical to the beds rather than to the top or base of the beds,
giving seismic events a more geological definition.
The Vinton Dome area has a lot of wells. However, out of 546 wells, only
144 wells passed through the Aquitanian and only the basic logs (SP or GR, IES, DT
and density) were available. Some wells did not reach the Siphonina davisi surface

24
which is the shallowest flooding surface within the interval of interest. Other wells
in the database did not have adequate stratigraphic data because of shortcomings
such as, faulted out beds, washouts in logs, salt area, indefinable top or base of
interval of interest. Only vertical wells were selected for correlation.
A relatively small fraction (about 12 wells) of the stratigraphically useful
wells contained biostratigraphic data. GR logs were not common in the well data,
therefore SP logs were utilized. Density logs did not accompany sonic logs in the
log suites. Two checkshot surveys on the dome were used to approximate the
time/depth relationship. Conversion of depth to time indicates that one millisecond
is equivalent to approximately 3.72 feet (1.15 m).
Figure 16: Flow chart of interpretation methodology
Biostratigraphic Data Analysis
Well Log Correlation and Interpretation
Well to Seismic tie
Data Phase Identification and rotation
Identify horizons
Faults & Key horizon mapping
Horizon attribute generation & Stratal slices
Depositional Modeling
of Well Logs
Sequence Stratigraphy
Seismic Stratigraphy
Environment of Deposition Interpretation
+ +

25
2.3 WELL TO SEISMIC TIE
In order to calibrate seismic data with well data, synthetic seismograms are
normally generated using sonic and density logs. In the absence of density logs, we
may assume a simple empirical relationship between density and velocity to generate
synthetics (Rekoske & Hicks, 1992). Synthetic seismograms are a one-dimensional
model of acoustic energy traveling through the layers of the Earth and are used for
correlation and wavelet processing of seismic data. Statistical relations that exist
between velocity, density, and resistivity employ the use of Gardner’s equation that
relates density with velocity, or Faust’s equation that relates resistivity with velocity.
Faust’s equation usually needs extensive stretching and squeezing which may
introduce further errors to sonic curves; therefore, the use of Gardner’s equation is
preferred except when sonic logs are not available (White & Simm, 2003).
In the entire survey, only two well log suites contained sonic logs and these
are without the density logs. Therefore, I used Gardner’s equation and ran the
synthetic seismogram using a checkshot from a nearby well to calibrate the sonic
log. The accuracy of time relationships between horizons is the goal, and was
achieved, since time is based solely on velocity and depth. Although, reflector
amplitude which is based on impedance (density times velocity) would be imprecise,
it would not impinge on the validity of the synthetic, considering its relation with
time or depth (White & Simm, 2003).
The sonic logs were edited and conditioned for calibration using the WellEdit
module in the Geoframe software. This meant reformatting the logs where obvious
erroneous values of velocity are spotted, which could create artificial acoustic

26
impedance contrasts and could result in the creation of false reflections on the
synthetic seismogram. Salt bodies typically offer high velocity which could be very
influential on the overall result of synthetic seismogram. As a result, the sonic log at
the periphery of the salt dome was preferred to the one at the salt flank.
Generation of the synthetic seismogram was performed using the Geoframe
synthetic module. The synthetic module permits the tie of time data (seismic data) to
depth data (well data) by integrating the velocity profile. Impedance log and
reflection coefficient curves were generated from the velocity profile. The reflection
coefficient curve was convolved with a seismic wavelet to produce a synthetic
seismic trace. The synthetic seismogram was generated using a +90o - phase wavelet
because the seismic data are in +90o phase (Zeng & Hentz, 2004). This was then
compared with the actual seismic traces at the borehole to ensure it represented the
adjacent seismic section (Figure 17). No bulk time shift was required for the best fit
between the theoretically and field-derived waveforms (Figure 18).
Checkshot guided depth-to-time conversion enabled accuracy of other well to
seismic ties and the seismic interpretation. Through paleo and regional correlations,
interpretation and mapping were then carried out. Key seismic stratigraphic surfaces
delineating previously established 3rd order surfaces were interpolated between wells
and extrapolated beyond well control into the large 3D survey area by integrating the
seismic information. Local maximum flooding zones (MFZ) associated with the top
of the faunal marker, Siphonina davisi and Discorbis gravelli, Heterostegina texana
and Marginulina vaginata were identified on the well logs, and the interpretations of

27
the reflections were extrapolated across the 3D survey. Query checks were carried
out on all wells. The result was a successful tie with the well markers in all other
boreholes (within +/- 10 ms.). Velocity variations in the severely faulted salt dome
and pitfalls in biostratigraphic picks could be responsible for inconsistent marker-
horizon ties (discussed in the biostratigraphy section).
Figure 17: The synthetic seismogram view.
Figure 18: A good-tie obtained between the synthetic seismogram and the seismic data.
2.0 --
1.9 --
1.8 --
1.7 -- -- Tw
o way tim
e (s)

28
2.4 MAPPING TECHNIQUES
In order to establish the evolution of the Vinton Dome area during the Early
Miocene, I performed a detailed interpretation and mapping of the Upper Oligocene
and Lower Miocene horizons. First, I mapped faults that are associated with the Top
Oligocene to Lower Miocene interval to ensure proper correlation of the 3rd order
sequences (faults are discussed in chapter 3) and key horizons were manually picked
using a 1 x 1 grid of inlines and crosslines of the survey. A coarser grid such as 20 x
20 grid interpretation would have been ideal in higher resolution seismic data and in a
less structurally complex area. However, finer grids are necessary for achieving
detailed accuracy, to compensate for the low resolution of seismic data and in order to
avoid the use of the Geoframe Autopix module for the automatic pick of highly
faulted and salt impacted horizons. Autopix, a 3D autopicker, is usually employed
for computer-assisted picking of events in areas that are between manually-picked
control grids. It tracks events along bedding planes and is most useful in areas with
fairly good lateral continuity. Eradication of mis-ties through loop ties of the
horizons was also achieved by the 1 x 1 grid interpretation. These horizons were then
interpolated and snapped to the closest event.
Horizons were generated via the seismic interpretation of reflecting
sequences, which are characterized by distinct waveforms. These waveforms were
used for correlation, facilitated by seedpoints (previous picks in crosslines or inlines)
and were also used for correlation across faults, and verification that the reflections
were picked correctly. Changes in these waveforms can be correlated with changes
in thickness of intervals, in number and thickness of beds, and/or seismic reflection

29
doublets. Horizon slices generated from seismic and attribute volumes were used for
detailed interpretation of the area. Horizon amplitudes were generated and further
compared to other attribute-based slices. Horizon slices were analyzed in seismic
attribute volumes to create window-based attributes around the events. These
surface-derived attributes enable the stratigraphic evaluation of interpreted seismic
sections (Rijks & Jauffred, 1991).
Stratal slices were also generated by flattening attribute volumes on manually
-picked horizons, which enabled intermediate time slices of stratigraphic packages.
Such slices allowed further insights into sand body geometries and their changes
over short periods of time. Flattening volumes upon marker horizons approximately
restores the horizon to the time of deposition and largely removes the effect of
subsequent deformation of extensional tectonic events, assuming that the horizon had
a nearly horizontal depositional surface.
A series of isochores and interpretative maps for each stratigraphic package
were generated. These isochores helped to establish sand depocenters. I ran
GeoQuest horizon dip maps, and AGL time and horizon extractions of curvature on
each maximum flooding zones of the Siphonina davisi, Discorbis gravelli,
Heterostegina texana and Marginulina vaginata fossils of the previously established
3rd order sequences to examine any evidence of compaction over sand lobes and sand
filled channels. Extracted amplitude maps for the most sand rich intervals determined
sand body geometries, and enabled comparison with curvature attributes and coherent
energy gradients maps to assist in the identification of channels, sand bodies, faults,

30
and other geologic features. Coherence images generated from applications of
coherence cubes to 3D seismic data reveal unbiased interpretation of events and faults
in the system. The remarkable tie in the details of faults and highly distorted
stratigraphic features confirmed the results of the interpretation of time and attribute
based slices.
2.5 SEISMIC ATTRIBUTES
Seismic attributes quantify measures of seismic characteristics of interests.
They quantify amplitude and morphological features that are observed in seismic
data through a suite of deterministic calculations performed on a computer. They are
very useful in resolving smear that has been caused by the effect of seismic data
migration, and they increase the visibility of geometrical characteristics of seismic
data. Seismic attribute generation and analysis are used primarily to reveal patterns
associated with the depositional environments. The diversity of seismic attributes
can be overwhelming; therefore, attributes must be selected to relate to the objectives
of the study. Target oriented attributes such as time attributes provide information
on structure; amplitude attributes, on stratigraphy and reservoir; and waveform
similarity attributes, on faults and depositional features. These attributes provide
complimentary imaging that enables us to map subsurface geological features.
(Brown, 1996; Arenson et al., 1999; Welper, 2000; Rader & Medvin, 2002; Brown,
2005; Chopra & Marfurt, 2005; Barnes, 2006).

31
2.5.1 Attributes Sensitive to Structure
Attributes that are sensitive to structure include curvature, dip and azimuth,
which are a class of reflection attributes derived from horizons interpreted in 3-D
seismic volumes. Horizon attribute mapping help define depositional features and
are typically used for detailed fault interpretation – to locate subtle faults that are not
easily recognized on vertical sections in data volume. These subtle faults are
important because they may possibly compartmentalize conventional reservoirs, and
therefore would have significant effect on fluid movement in the subsurface.
Curvature: Curvature quantifies the degree to which the surface deviates from being
planar. Mathematically, it is the reciprocal of the radius of a circle that is tangent to
the given curve at a point. Curvatures are second order derivatives of the curve;
consequently, the more curvy the bend, the larger the curvature (Roberts, 2001;
Chopra & Marfurt, 2006) (Figure 19). Most positive curvature measures positive
bending of a surface and emphasizes anticlinal surfaces such as ridges. The most
negative curvature, however, measures negative bending of a surface and emphasizes
synclinal features such as faults, fractures, joints, and channel axes. Curvature
images provide detailed information in structural and stratigraphic interpretation and
are particularly useful in mapping faults that are otherwise smeared during seismic
data migration.

32
Figure 19: Sign convention for curvature attributes. The black arrows on curvilinear surface represent vectors, which are normal to the surface. Where these vectors are parallel on flat or planar dipping surfaces, the curvature is zero. Where the vectors diverge over anticlines, the curvature is defined as positive and where they converge over synclines, the curvature is defined as negative. (Modified after Roberts, 2001).
Seismic attributes - K negative and K positive long wavelength curvature
attributes developed at the University of Houston Allied Geophysical Laboratory are
better able to detect subtle faults and features when compared to images from
coherence slices. Seismic attributes images derived from K positive and negative
long wavelength curvature offer additional important fault details when applied to
horizon based seismic volumes.
Dip and Azimuth: Time dip is the magnitude of angles measured downwards from
the horizontal to the surface while the azimuth is the direction that the surface points,
ranging from 0 to 360o, and is measured perpendicular to the geologic strike, in the
direction of maximum downward dip. Therefore, dip azimuth is measured from the
Flat

33
North and combines dip and azimuth through a circular two dimensional color bar
whereby azimuth controls the hue and dip controls the intensity.
2.5.2 Amplitude Attributes
Amplitude attributes in 3-D seismic mapping are only achievable with a fully
interpreted horizon, interpolated and snapped to the event. They are used for
defining subsurface depositional bodies and may also delineate reservoirs. High
amplitude values may be indicative of hydrocarbons. Amplitude extractions co-
rendered with coherence attributes yield outstanding details of structural and
depositional features, lithological changes and may reveal definitive features such as
gas chimneys. Horizon amplitudes delineate reservoirs and features better than RMS
(root mean square) attributes (Brown, 2005).
2.5.3 Waveform Similarity Attributes
Coherence is a measure of waveform similarity that images discontinuities
(rather than reflections) as a result of lateral changes in geological subsurface
features in the 3-D seismic data (Figure 20). These changes may be caused by
faulting, fracturing, diagenesis, erosion, fluvial systems, or changes in rate of
sedimentation. This attribute is able to detect trends and subtle changes in a
waveform of a seismic trace when compared over the entire survey and therefore
provides the means of viewing faults and stratigraphic features in non-interpreted
seismic data without the influence of time or bias of interpretation. This process is

34
especially advantageous in the reconnaissance stage of a mapping project, by
providing indications of depositional environments and patterns that can be easily
seen aerially and may require further investigation. When horizon slices of
coherence cube volumes are combined with other attributes such as amplitudes, they
can reveal facies changes and detailed depositional environments. It also provides
better image for viewing channels and other depositional features that avoid
structural highs generated by salt domes, especially channels that change direction
across faults, radial faults associated with salt domes, complex and en-echelon faults
(Arenson et al., 1999).
Figure 20: Oval A shows continuous reflectors with stable waveforms indicating areas of high coherence. Oval B shows reflectors with varying waveforms indicating areas of low coherence (Arenson et al., 1999).
A
B
Rapidly changing waveform – variable coherence event – rapid sedimentation
Highly stable waveform – high coherence event – hiatus, onlap or slow deposition

35
High coherence areas are shown as white to light gray and may indicate slow
rates of deposition including shales, carbonates, and hemipelagic environments
whereas, low or non-coherence areas are shown as dark gray to black, enabling faults
to be easily recognizable. Areas of low coherence include faults, salt edges, reef
edges, channel edges, slumps, and high porosity areas resulting from rapid
sedimentation of sand deposition. Coherence maps have played a major role in the
recognition of depositional environments and can assist inter-related features to be
more distinctively recognized (Taner & Sheriff, 1977; Chopra & Marfurt, 2005). In
this study, coherence attributes were used to map out faults, channels, mudflow
gullies, and their associated muddy prodelta lobes, which were otherwise difficult to
decipher in time slices.

36
CHAPTER THREE
SALT TECTONICS AND STRUCTURAL DEVELOPMENT
3.1 PRINCIPLES AND APPLICATIONS
The Miocene in the Louisiana coast is one of the thickest wedges of
terrigenous clastic sediments fed by a complex river system in the northern Gulf of
Mexico. In the Early Miocene, active salt tectonics restricted deposition to the shelf
(Figure 21) with the salt reinforcing the prograding slope, thereby trapping sediments
on the shelf (Fillon & Lawless, 2000). High bulk accumulation of shelf sediments
onto the salt during the Early Miocene has led to salt detachments and basinward
migration of the autochthonous salt (Worall & Snelson, 1989; Watkins et al., 1996).
Continued progradation of shelf sediments onto Louann salt bodies eventually
created weak points and paved ways for deposition along fill and spill minibasins to
the deeper slopes and basin floors (Watkins et al., 1996; Galloway, 2001).
Salt
Figure 21: Cross-section showing southward squeezing of Louann Salt caused by loading and progradation of shelf sediments. (after Salvador, 1987)

37
The center of Vinton Dome is a salt plug that crops out at the surface with a
depression at the center, occupied by Gray Lake. Previous work by Watkins et al.
(1996) interpreted these salt types to be detached from the autochthonous Louann
salt bodies, which were deformed through progradation and loading of shelf
sediments onto the salt. The resulting detached salt lobes pushed upwards through
the overlying sediment packages to form salt domes.
However, recent studies on salt movement provide other possible
explanations by which salt could migrate. Hamiter et al. (1997) proposed that “the
migrating mechanism has been the movement of the salt wedge and that the
overlying sediments have been relatively passive riders, driven only by gravity. This
causes the continental margin, certainly the shallower half, to slip downslope with
salt as a prime mover or lubricant.” The growth faults and salt diapirism are
mutually reinforcing (Hamiter et al., 1997). Salt movement causes extension in
overlying sediments thereby increasing the possibility of salt rising to the surface.
Other explanations proposed by Rowan (2000) include passive diapirism, movement
triggered by contraction, and/or movement by strike-slip faulting. Mohriak et al.
(1995) suggested that the salt lobes could possibly be formed by a combination of
progradation and extension of overburden on salt.
The purpose of this study is to define the evolutionary stage of salt movement
in the Early Miocene, show evidence of salt creep across a counter regional or
antithetic fault and the consequence on the depositional history of the dome.

38
Consequently, the study may illuminate some of the models and the mechanisms that
have been attributed to salt movement.
Deposition on diapiric structures plays a major role in the associated fault
pattern. Consequently, fault patterns provide important clues to the history of the
salt movement, and also the depositional history of the associated strata. A
classification of fault types and diapiric structures (Fails, 1990) has been employed
to understand fault patterns on salt domes. Domes can be classified into three types:
Penetrant - which are shallow piercement salt domes that extrude or protrude to near
surface by piercing overlying strata, semi-penetrant – which are shallow, buried salt
domes that pierced to a shallow depth but have since remained inactive, and non-
penetrant - which are deep-seated, buried and inactive salt domes (Figure 22).
Figure 22: Salt dome classification (after Fails, 1990).

39
Fails (1990) further classified fault patterns associated with salt domes into
three types:
- single or multiple offset consisting of one or more semi-parallel faults, downthrown
in the same direction.
- compensated faults consisting of two or more semi-parallel faults, downthrown in
opposite directions, forming grabens or horsts, and
- crossed offset, consisting of two or more faults in crossed orientation.
Diapiric structures fall into one or more combination of these fault patterns and
orientations (Figure 23).
3.1.1 Observations and Discussion on Structure of Vinton Dome
The structure of Vinton Dome is characterized by a multi-style fault pattern –
a combination of single offset and offset radial fault pattern (Figure 24). The master
fault lies in a northeast-southwest, transverse direction, downthrown to the north,
indicating that it is a counter-regional fault. The southeast faults are parallel almost
in an en-echelon pattern while the northeast faults are divergent with their tips
converging toward the center of the dome. The west faults are relatively small and
are positioned closely to the northwest and west of the master fault.

40
Figure 23: Fault pattern classification for Coastal Salt Basin diapiric structures, including salt domes (after Fails, 1990).
Figure 24: Interpreted Vinton Dome faults in Aquitanian strata.

41
Stratal geometries related to salt diapir evolution have been addressed by
only a few researchers, such as Seni & Jackson (1983), Fails (1990), Pate & Dunbar
(2000), Vendeville et al. (2003) and Yin & Groshong (2003). The most common
model consists of three evolutionary stages of salt movement: pillow, diapir and post
diapir. The pillow stage is the first stage which often begins as low-amplitude dome-
like swells (Nettleton, 1934). The diapir stage is the second stage associated with
subsidence and thickening of the denser overburden near the rising salt. The third
and final stage is the post diapir stage in which the diapir continually rises while the
overburden thins directly above the diapir crest. Restoration of the sections
involving salt structures is complicated because it is often difficult to understand
fully the dynamics of the system (Lerche et al., 1996) that are attributable to
dynamical parameters which are rarely accurately known; therefore intrinsic
uncertainties are introduced in any model based on assumptions concerning the
dynamical behavior of salt and sediments.
Seni & Jackson (1983) described salt movement and diapirism as involving
flow of salt into a growing structure, creating a withdrawal basin which is generally
classified to include rim synclines, primary, secondary, and tertiary peripheral sinks
(Figure 25). Primary peripheral sinks form during the pillow growth, secondary
sinks or rim synclines form during the diapir growth, while the tertiary sinks form
during the post diapir stage.

42
Figure 25: Structural evolution of salt pillows, salt diapirs, their peripheral sinks, and turtle structure (after Seni & Jackson, 1983).

43
Figure 26: Schematic stages of dome growth and variations in associated strata above and around salt structures (after Seni & Jackson, 1983).

44
Geometry and facies classification of the three stages of growth (Figure 26)
(Seni & Jackson, 1983) are useful tools for studying the Aquitanian in the Vinton
Dome area. Evidence of turtle structure anticline and rim syncline near the salt in
the Late Oligocene to Early Miocene (Figure 27) showed that the Aquitanian strata
in the dome were formed in the post pillow stage. The close proximity of the strata
to the salt, thinning near the salt and thickening on the peripheries suggest that the
Aquitanian strata were formed in the diapir stage.
Figure 27 a & b: Basemap and crossline position of seismic profile showing flattened Marginulina vaginata horizon slice, evidence of rim syncline and turtle anticline
Structures in Late Oligocene to Early Miocene, Vinton Dome.
F F’ Siphonina davisi Discorbis gravelli
Heterostegina texana
Marginulina vaginata
Rim Syncline
Turtle structure anticline
Salt
Tw
o way tim
e (s)
F’
F
a)
b)

45
The Vinton dome area is characterized by intercalated layers of sandstones
and shale. The upward thrust of the salt plug affected both the stratigraphy and
structure of the area resulting in thinning of beds near the flanks of the salt and
thickening towards the edge of the dome. The thickening at the periphery of the
dome is attributed to slumping and syn-depositional thickening (Figure 28). Dip of
beds range from 85o near the margin of the salt to near horizontal at the periphery of
the study area.
Figure 28: Seismic profile showing high dip of beds due to impact of Vinton salt. Turquoise blue line represents the Lower Miocene.
G G’T
wo w
ay time (s)
G’G

46
3.2 STRUCTURAL EVALUATION
The top of salt was mapped in depth by Thomas & Eichelberger (1927) using
well logs (Figure 9). Over the years, the advent of 3-dimensional seismic data has
permitted better imaging of geometries, internal architecture of subsurface bodies,
and more accurate estimates of margins than can be achieved from well logs, subject
to vertical and lateral resolution of the seismic data. I performed a detailed
interpretation and mapping of the structure of Vinton salt in 3D seismic data (in
time) (Figure 29). Though the salt body was not imaged in the 3D seismic data,
nonetheless, boundaries of salt were derived from salt - sediment contacts.
3.2.1 Salt Shape
The Vinton salt boundaries are circular to ellipsoidal in plan view (Figure
29). The piercement point of the salt is circular while the diapir becomes more
ellipsoidal with depth to 3250 ms. The salt is not detached from the underlying salt
body and can be classified as a penetrant salt dome (Figure 28). The Lower Miocene
salt boundaries (red polygon) trend northeast – southwest with two elongate
boundaries in the northeast – west direction, and a circular boundary in the south
direction (Figure 29). The north – south direction has dimensions of 8850 ft (2697
m) and the northeast – southwest direction, 14,100 ft (4298 m). The Vinton strata
are asymmetrical on opposite sides of the salt, largely caused by salt tectonics and
displacement by a counter regional fault. The positions of the Aquitanian strata on

47
the sides of the diapir differ significantly in time between 125ms and 375 ms (Figure
28).
Figure 29: Time map of top of Vinton salt. Red line indicates Early Miocene salt boundary. Faults are overlaid on top of salt map.
m
.wells
faults

48
3.2.2 Faults
3.2.2.1 Major Faults
The master fault m, which is genetically antithetic to a regional growth fault,
is a normal fault and dips inland to the north, subdividing the dome into two
seemingly equal parts (Figures 29 and 30). The fault trends parallel to the ellipsoidal
direction of the salt and its length is almost the diagonal of the dome. It strikes N 75o
E, with dip of 45 o and throw of approximately 1400 ft (427 m). The fault continued
to grow and increase in length from the Late Oligocene to the Early Miocene.
Peripheral fault sets in the dome are normal and consist of divergent, en
echelon, and parallel fault patterns. The northeast faults splay in one of the direction
of the salt’s ellipsoidal axis. They strike between N 5o W and N 80o E, and dip
between 45o and 60o with throws ranging from 7 ft (2 m) to 175 ft (53 m). These
faults are generally shallower than the southeast faults.
The positions of maximum displacement of the southeastern faults are deeper
than those of the northeastern faults, suggesting that their origins may be deeper-
seated. Only some of the faults were active in the Early Miocene (Figures 30-34).
Active faults during the Early Miocene are northeast faults m, E, O, S, and i,
southeast faults G’ and K’, and west faults b, c, f, and g (Figure 30).
Variations in thickening and thinning of strata enable determination of fault
throws which in turn indicate the active faults. I tested the origin and timing of

49
Vinton Dome faulting by comparing throws and thickness variations across faults.
Thickening of strata adjacent to the southeast fault set shows that the active faults
strongly control sedimentation in the Aquitanian (Figures 30-34, cross-sections B-B’
& D-D’).
The southeast faults are arranged in an en echelon pattern, forming half
grabens. Faults dip between 30o and 45o to the west with the exception of fault K’,
which dips to the east creating a graben in conjunction with the opposite fault G’
(Figures 32 & 34). The graben was a major area of sediment ponding, forming the
thickest part of the study area. Faults strike N 5o W to N 40o W and throws range
from 65 ft (20 m) to 445 ft (136 m).
Faults in the west of the area are relatively short, parallel, and appear to be
complimentary to the master fault, m. They are situated to the west and northwest of
the master fault, in the western ellipsoidal direction of the salt (Figure 29). Some of
the west faults set (faults d, e, g and f) serve as boundaries of a major channel belt
that parallels the master fault (as will be shown in section 2.2.4). The faults strike N
85o E to N 90o E and dip 30o with throws between 100ft (30.5 m) to 380 ft (116 m).
Evolution of these faults strengthens during the Early Miocene (Figure 30) with
faults b, f, g, and i emerging in the Early Miocene, whereas, other faults had been in
place earlier than the Late Oligocene.

50
Picture 30: Early Miocene time-structure map showing fault development with depth and cross-sections A-A’, B-B’, C-C’ and D-D’ across fault sets. Change in fault color signifies different horizons. Navy Blue - Siphonina davisi (Topmost); Wine – Top Anahuac; Green – Heterostegina texana; Light Blue – Marginulina vaginata. Fault tips outside survey are extrapolated.
h
g e
a c
d f
i
m
j
k
l
A
G’ K’
J’ E’ F’
A’ D’
B’ C’
H’ I’
L’
M’
O’ N’
P’
Q’
C
E F
H D I
J
K
L
M N
O
PQ
R
G B
S
b
C-C’ D-D’
B-B’
A-A’
wells

51
L’M’ I’H’K’
J’F’
E
1.5 --
1.7 --
1.9 --
2.1 --
2.3 --
Figure 31: Seismic profile showing the A-A’ cross-section across the northeast divergent faults. Double headed arrows express strata thickness variations.
Figure 32: Seismic profile showing the B-B’cross-section across the southeast faults.
m E
F
O
N
L
J
R
S
Tw
o-w
ay tr
avel
tim
e (s
)
1.5 -
1.7 -
1.3 -
1.1 -
1.9 -
- faults
- faults
B B’
A A’
Tw
o-w
aytr
avel
time
(s)

52
Figure 33: Seismic profile showing the C-C’ cross-sections across the west faults.
Figure 34: Seismic profile showing the D-D’ cross-sections across the west faults.
2.0 -
2.2 -
1.8 -
1.6 -
2.4 -
d b
ck
C D C’
Tw
o-w
ay tr
avel
tim
e (s
)
2.0 -
1.8 -
2.2 -
2.4 -
1.6 -M’
L’I’
K’J’ G
D D’
Tw
o-w
aytr
avel
time
(s)
- faults
- faults
2.0 -

53
Figure 35: Time structure map of active faults during the Aquitanian, Vinton Dome.
Detailed evaluation of the time dip and azimuth maps of the Upper Oligocene
and Lower Miocene horizons indicates consistency in their structural pattern and tilt
(Figures 36 & 37). The strata dip away from the salt and had been domed by the
effect of upward movement of the salt.

54
Figure 36: Basemap profile showing time dip (s/ft) of faults in Lower Miocene to Upper Oligocene horizons. (a) Siphonina davisi; (b) Top Anahuac (Discorbis gravelli);
(c) Heterostegina texana (d) Marginulina vaginata. These are computed in a window of 20ms. Darker grays correspond to steeper dips.
Time Dip (s/ft)
a) b)
c) d)

55
Figure 37: Basemap profile showing dip azimuth (in degrees) of faults in Lower
Miocene and Upper Oligocene horizons. (a) Siphonina davisi; (b) Discorbis gravelli (Top Anahuac); (c) Heterostegina texana; and(d) Marginulina vaginata.
Azimuth (deg)
a) b)
c) d)

56
3.2.2.1 Polygonal “Mosaic” Fractures
In the Vinton Dome area, mosaic patterns are observed on all of the four
mapped horizons in the Miocene when curvature attributes are applied (Figures 38 &
39). These are multi-directional polygonal features which exist not only in the deep
marine sediments, but also on shelf and in the shore zones. They are consistent
through the entire survey from the Marginulina varginata section in the deepest
marine and throughout the entire Miocene section.
Careful observation of these polygonal features (average of 200 ft - ~ 60 m
in diameter) reveals that they show no overall preferred direction of either strike or
dip, revealing an isotropic nature of the fracture pattern. They are slightly variable,
and vary in shapes, sizes and positions. However, there is no observable alteration of
intensity of polygons around high dips of salt body when compared to the flanks, and
within more bent blocks of faults (such as in the blocks of faults L, J, N, and f).
They are also not observable in the conventional 3D seismic amplitude data or in
other attribute maps; nonetheless, they appear to be geologically related features.
Combination of the regularity of the survey and changes in the polygons suggest
their geological authenticity.
The mosaics of different horizons were overlaid on each other (Figure 40).
The Siphonina davisi and Discorbis gravelli horizons display no significant change
in polygonal faulting, perhaps due to their closeness in time (~ 50 ms), but reveal
change in major faults. These horizons differ considerably from the Heterostegina
texana and the Marginulina vaginata horizons, which are farther in time (A
difference of 100 ms and 250 ms respectively from Siphonina davisi). The

57
Heterostegina texana horizon displays more radial and linear faulting than the other
horizons while the other three horizons display more robust polygons. The
Siphonina davisi and Discorbis gravelli horizons are shale tops while and the
Marginulina vaginata horizon is sand top, whereas, the Heterostegina texana section
is a carbonate zone. The importance of a different lithology and sediment loading of
the area during the Heterostegina texana time may significantly contribute to
increased salt movement and consequent slumping of sediments that may be
responsible for its increased linear and radial pattern of polygonal faulting. As
expected, the polygons change significantly in position, size, and shape when
negative curvature of different horizons are compared with their respective positive
curvatures, but align more closely when negative curvatures of different horizons are
compared.
In the North Sea Basin, overpressured Early Cenozoic mud rock sequences
exhibit polygonal features which are unrecognizable in conventional 3D seismic and
amplitude time slices, but show up well in coherence slices (Figure 41). Haskell et
al. (1999) explained that polygonal features can be formed by episodic hydro-
fracturing of basin-wide over-pressured compartments. These features are
associated with slumps and dewatering structures which may indicate geologic
hazards. Consistent polygonal features from deep marine horizons to shallow shelf
horizons (750 ms – 2200 ms), and high dip of beds in the Vinton area strongly
suggest fracturing of strata as a result of the upward thrust of the salt plug (Figure
28).

58
Other means by which polygonal faults form include syneresis (Figure 42).
Dewhurst et al. (1999) defined syneresis as a process in which the pore fluid is
expelled from sedimentary gels through the spontaneous action of electrochemical
forces. This differs from mud compaction processes in which gravitational forces
drive expulsion of pore fluids; rather, it is a process of spontaneous volumetric
contraction and concomitant fluid expulsion. However, syneresis had been
associated with very fine sediments such as silty mudstones and claystones that are
found in slope or basin floor depositional environments (Lovell, 1990; Joy, 1993; &
Dewhurst et al., 1999). The continuous presence of the fracture sets throughout the
Upper Oligocene and Miocene sections is found in clastic progradational sequences
as well as marine sequences. A combination of many processes could also be
responsible for the formation of the Vinton Dome polygonal fractures.
The acquisition configuration used for Vinton 3D seismic was a circle and
spoke pattern (Figure 43). This may likely introduce some noise of equal pattern to
the seismic data. The noise may be interpreted as acquisition or processing
footprints. Ideally, the Vinton Dome polygonal features should be calibrated with
image logs, given that the patterns are partially variable even though there is strong
structural deformation.

59
Figure 38: a). Most negative curvature maps of Lower Miocene and Upper Oligocene horizons. (a) Siphonina davisi; (b) Top Anahuac (Discorbis gravelli); (c) Heterostegina texana; (d) Marginulina vaginata. Arrow lines on (a) refer to cross-sections across the
major faults (Figures 31 – 35 for cross-sectional views).
D-D’
B-B’
C-C’
Salt
Northeast faults West
faults
Northeast faults
Southeast faults
A-A’
0
+0.5
-0.5

60
Figure 39: a). Most positive curvature maps of Lower Miocene and Upper Oligocene
horizons. (a) Siphonina davisi; (b) Discorbis gravelli (Top Anahuac); (c) Heterostegina texana; (d) Marginulina vaginata. Arrow lines on (a) refer to cross-sections across the
major faults (Figures 31 – 35 for cross-sectional views).
0
+0.5
-0.5
A-A’
C-C’
B-B’
D-D’
a) Northeast faults
West faults
Southeast faults
Northeast faults
b)
c) d)

61
Figure 40: Positions and sizes of some fault polygons represented in the black square on the dome. Change in color represents different horizons. Siphonina davisi – Black, Top Anahuac – Red, Heterostegina texana – Yellow, Marginulina vaginata – pale blue.
a) b)
Figure 41: a) Time slice and b) coherency slice at 2800 ms showing polygonal faults caused
by dewatering of overpressured shales in the Lower Miocene, Valhall area, North Sea. Polygon size approximate 1-3 km (Haskell et al., 1999).
5 k m
Salt
5 k m
Salt

62
Figure 42: Horizon slice of Lower Miocene, North Sea Basin, showing polygonal faults caused by syneresis. Polygon sizes are 200 – 500m. Time contours 1.18 s (white), 1.29 s (Dark gray) (Dewhurst et al., 1999).
Figure 43: Acquisition pattern for the Vinton Dome survey. Radial lines represent receivers and roughly concentric circles represent shot points. Interstate Highway 10 runs along the
northwest of the survey (Constance et al., 1999).

63
3.2.3 Discussion on Faults
Intrinsic factors such as the shape of salt bodies and regional stress
significantly influence fault patterns during periods of doming (Parker & McDowell,
1955; Hughes, 1960; and Withjack & Scheiner, 1982). The experimental and
analytical models shown for circular and elliptical domes (Withjack & Scheiner,
1982) show that on elliptical domes, normal faults form on the crest which roughly
parallel the long axes, but splay outward toward the ends of the long axes near the
peripheries whereas, circular domes experience more radial faulting. These models
also show that regional extension is usually perpendicular to the direction of normal
faults. This pattern is observed on Vinton Dome with divergent faults on the
northeast toward the elliptical direction of the salt only, while the other parts of the
dome with associated circular salt direction do not have divergent faults. The
northeast faults splay in the direction of the salt’s ellipsoidal axis and were perhaps
caused by regional extension and differential loading of sediments during doming.
The en echelon fault set in the southeast part of the dome is relatively distal
and is perhaps linked to early formation of the dome. Regional peripheral Late
Jurassic to Miocene fault trends in some Mississippi Salt Basin areas demonstrate
that en echelon extensional faults and half grabens are closely associated with early
formation and salt flowage (Hughes, 1968; & Mancini et al., 2001). Halokinesis was
attributed to have formed this set of faults with associated gravity creep and active
differential subsidence. Hughes (1968) also explained that it is possible to have
varying rates of deposition over a salt structure rising differentially at a constant rate,

64
which may result in variations in the increase of fault throws with depth, and
different degrees of thinning and thickening of the stratigraphic units in closely
associated fault blocks.
I propose that the west faults set were formed by tensional stress due to the
formation of secondary peripheral synclines in the downthrown side of the master
fault that was driven by sediment loading and salt movement in the north of the
dome. Galloway (1986) attributed such faults (but in mega scale) in deltaic
environments to gravity induced deformation.
3.2.4 Impact on Sedimentation
The depositional patterns, structural patterns and salt tectonics are totally
inter-dependent. Generally, sediment input is expected from inland (north of the
dome) to the Gulf of Mexico basin (south of the dome). Due to low seismic
resolution, seismic facies of channels are merely displayed as bird’s eyes in
conventional 3D seismic vertical section and are not apparent on attribute maps.
However, detailed interpretation of the seismic data and tracing of these channel
facies reveals channel-flows from the northeastern part of the area indicating
sediment transport from the northeast to the west, southwest and southeast parts of
the dome (Figure 44).
Deposition in the northern area is structurally controlled by the master fault,
m (Figure 30). Sediments thicken at the hangingwall of the fault and thin at its
footwall indicating that the salt was seated at the hangingwall in the Anahuac.

65
Stratal thickness in the downthrown side (Late Oligocene section) is approximately
350 ft (107 m) while the upthrown side has only about 100 ft (30.5 m), suggesting
evidence of salt creep from the north of the dome to the upthrown side of the fault,
creating a graben in the north of the dome, perhaps represented by the rim syncline
(Figure 27).
More sediment input at the north of the dome results in more salt withdrawal
from the hangingwall to the footwall of the master fault. Consequently, more space
is created in the hangingwall of the master fault to accomodate even more sediments.
In the Aquitanian, the northeast faults set controlled the sandy feeder channel in the
area. The channels, often displayed as bird’s eyes (example in Figure 44), were
traced in the seismic data. Their obscurity by low seismic resolution has largely
contributed to their ambiguity in coherence maps (Chapter 4 for more details). The
channels in the northeastern fault blocks converged towards the master fault and
merely flowed parallel to the master fault’s strike to the west of the dome. Other
channels crossed the eastern part of the dome and deposited their contents to the
southeast where deposition was observed to be greatest. The graben (Figures 30 &
34) formed by the two compensated faults, K’ and G’ was an area of sediment
ponding which was directly fed by one of these channels. Thickening of strata
adjacent to the southeast fault set shows that the active faults strongly control
sedimentation during the Early Miocene. The southeast faults on the dome were
perhaps linked to salt flowage and early deformation in the area which may cause the
varying rates of deposition in the fault blocks (Hughes, 1968).

66
Figure 44 a: Map showing direction of some Early Miocene channels in Vinton Dome area as traced in well and seismic data, i.e. mapped on vertical sections (inlines and crosslines). The channels are not well imaged in coherence image (e.g. Figure 64). Red line indicates
crossline position displayed in seismic profile in figure 44 b.
Figure 44 b: Seismic profile of crossline position (Figure 44 a) showing position of some northern channels indicated by “bird’s eyes” seismic facies, flowing in westward direction.
Channels (through time) Aquitanian channel
--Discorbis gravelli
H’
H H’
Two w
ay time (s)
--Siphonina davisi
--Heterostegina texana --Marginulina vaginata
H
1.0 --
1.5 --

67
The development of the west faults (Figures 30 and 33) intensify in the Early
Miocene indicating increase in sedimentation especially in the northwest and west
part of the dome (Appendices A1a – A1d). The increase in intensity of the faults
over time from the Late Oligocene to the Early Miocene substantiates increase in
sediment loading and perhaps concurrent salt withdrawal in this locality,
corresponding to the previously established history of the Cenozoic era (Galloway,
2000). However, decreased thickness of fault heaves in the Top Anahuac section
indicates sediment starvation (Appendix A1b). Nonetheless, fault block P (Figure
30) continued to receive sediments from the northeastern area.
Peripheral fault sets reveal volume expansion and increased sedimentation
with decreased time. A loop cross-sectional view of the Aquitanian strata (Figures
45 and 46) suggests syndeposition of the Early Miocene strata around the dome. The
thicknesses of the strata are approximately equal and are well developed at the
peripheries of the dome.

68
Thickening and thinning of Early Miocene strata within peripheral fault sets
provide insights to depositional variations and the history of active faults. The
1.0 --
1.5 --
2.0 --
2.5 --
2 3 4 5 6 7 8 9 10 11 1
Two-w
ay travel time (s)
Figure 45: Structural map showing loop x-section around the dome.
Figure 46: Seismic profile showing loop structural vertical cross-section of SP logs (Figure 45); Siphonina davisi - top horizon, Top Anahuac - 2nd horizon, Heterostegina texana - 3rd horizon, & Marginulina vaginata – last horizon.
2 3
4
5
6
7 8
9
10
1
11
6
wells

69
northeast faults set (Figure 31) shows variations in the degree of sedimentation.
Downthrown fault blocks of m, E, O, S, and i indicate thickening of strata which
coincide with paths of channels in the locality (Figures 30, 31, and 44). Thickening
of strata observed on these downthrown blocks support evidence of active
sedimentation. However, shortening observed in fault blocks N and J suggests that
these blocks were previously horsts, whereas blocks N and S (Figures 30 & 31) were
later displaced as a graben.
Little or no change of stratal thickness in the southeast fault set of cross-
section B-B’ is an indication of by pass deposition, but the D-D’ cross-section
southwards show thickening in the graben of the G’ and K’ fault block, indicating a
major depositional center for the area (Figures 30, 32, and 34). Equal vertical
thickness of Discorbis gravelli to Siphonina davisi strata observed on the southeast
fault blocks in B-B’ cross-section may indicate equal rate of syndeposition or passive
faulting. Vertical thickness variations of Heterostegina texana to Discorbis gravelli
strata, however, are related to active sedimentation that may be associated with salt
movement, associated faulting and slumping.
The west faults (Figure 33) signify extensive thickening of the Late
Oligocene strata (Marginulina vaginata to Heterostegina texana) in the fault block c
and as compared to the other parts of the dome, which may indicate active salt
withdrawal from this locality. The absence of thickening in the Early Miocene
section in this locality, however, suggests a post withdrawal stage in the locality.

70
3.2.5 Appendices
Figure A1a: Time-structure map of Siphonina davisi horizon at Vinton Dome
wells

71
Figure A1b: Time-structure map of Top Anahuac horizon at Vinton Dome
wells

72
Figure A1c: Time-structure map of Heterostegina texana horizon at Vinton Dome
wells

73
Figure A1d: Time-structure map of Maginulina vaginata horizon at Vinton Dome
wells

74
CHAPTER FOUR
INTEGRATED INTERPRETATION
4.1 APPLIED BIOSTRATIGRAPHY
Biostratigraphic data for this project as presented by independent
biostratigraphers’ archives and operating companies were very limited in the Lower
Miocene in the Vinton Dome area. Only twelve wells have foraminiferal planktic
and benthic data that include the Marginulina vaginata, Bolivina perca,
Heterostegina texana, Discorbis gravelli and Siphonina davisi in the Oligocene and
Miocene sections of the Vinton Dome area. No calcareous nannoplanktic data were
available. The scarcity of biostratigraphic data could be due to the strategic
paleogeographic position of the Vinton Dome during the Early Miocene or because
data has been kept confidential. The Vinton Dome area in the Early Miocene lay in
the shallow water environments between the channel belt and the deltaic
environment of the ancient Calcasieu River (Galloway, 2000), which could have led
to a relatively low probability of preservation of marine fossils in the area and the
resultant few picks (Figures 11 - 15). High resolution marine biostratigraphy
therefore, may be unattainable in a highly dynamic setting, such as a channel belt on
the Miocene shelf.
There are no available records of spore and pollen data. A combination of
forams, spores and pollens could have been more diagnostic in the biostratigraphy of
the Early Miocene. Lack of spore and pollen data may be due to confidentiality, or
because the data were not obtained at the time the wells were drilled, perhaps also

75
because the resolution of such data were not considered useful and not needed for
age-dating the Cenozoic era. Resolution of such data is poor in the Cenozoic era,
during which there was high risk of redeposition, especially in the deltaic regions
with mud and salt diapirism (Breard, 1996).
Biostratigraphic study of data from Vinton Dome indicates that the
Aquitanian alone in the Lower Miocene has few marine fossil records, suggesting
that it is the only stage in the Lower Miocene that sustained marine fossil
preservation. The overlying Burdigalian and other upper stages in the Miocene
record periods of major progradation of fluvial deposits onto the area and have no
marine biostratigraphic record. Marine fossil records in the Vinton Dome area are
more profuse below the Miocene section.
Due to the absence of high resolution biostratigraphic data, data analysis
guided by the Minerals Management Service Biostratigraphic Chart (Witrock et al.,
2003) (Figure 7) could only enable the placement of the Aquitanian within the Lower
Miocene rock sequences in the previously established Gulf of Mexico 3rd order
sequence stratigraphic framework (Haq et al., 1988; Fillon et al., 1999; and Zeng &
Hentz, 2004). However, interpretation and correlation of logs have enabled
interpretation of depositional environments of the Aquitanian on the shelf in the
study area.

76
Figure 47a: Basemap showing crossline position of seismic profile of interpreted
horizons with integrated biostratigraphic data.
Figure 47b: Seismic section in N-S direction showing interpreted horizons and correlation between well log curves and markers. From upper to lower horizons are Siphonina davisi,
Discorbis gravelli, Heterostegina texana, and Marginulina vaginata.
Tw
o way tim
e (s)
500 ft.
1.5 --
2.0 --
2.1 --
1.6 --
1.7 --
1.8 --
1.9 --
K
2.3 -
2.4 --
2.5 --
2.2 --
a)
K
K’
b)
K’

77
The top of the Aquitanian in the Lower Miocene of the Vinton Dome area is
recognized by the Siphonina davisi zone (Haq et al., 1988; Styzen, 1996; Lawless et
al., 1997; & Witrock et al., 2003), and the base by the Discorbis gravelli zone, the
topmost Oligocene faunal pick that is closest to the base of Miocene (Figures 6 & 7).
Four horizons were mapped for the purpose of understanding the evolution of the
Aquitanian formation and they included the Marginulina vaginata, Heterostegina
texana, Discorbis gravelli, and Siphonina davisi zones (Figure 47).
Heterostegina texana and Discorbis gravelli are fossils that mark the Top
Oligocene in the Oligocene-Miocene transitional section and both have served as a
control for the base of the Aquitanian in the integration of seismic and well data. The
basal Miocene is not an obviously defined section; therefore, the Discorbis gravelli,
which is the closest fossil to the top of the long Anahuac shale column, has been used
to mark the base of the Miocene (Trevino et al., 2003; Witrock et al., 2003). The
Robulus “A” species, the topmost fossils in Upper Oligocene are not present in the
Vinton data and also have been identified as less stratigraphically useful taxa (Breard
et al., 1996) (Figure 7).
Heterostegina texana has also been recognized by some researchers as a Top
Anahuac shale fossil (Ye et al., 1995; Fillon & Lawless, 1999; 2000; Galloway,
2001). However, Discorbis gravelli marks the uppermost 3rd order sequence within
the Anahuac 2nd order sequence (Breard et al., 1993; Lawless et al., 1997; Witrock et
al., 2003). It is a period of transgression and maximum flooding surface and a
correlatable surface in my study area. It terminates away from the salt plug and

78
therefore, is not well represented in the Vinton dome area. Heterostegina texana
marks a maximum flooding sequence and a
period of carbonate buildup in the Late Oligocene. It is a highly correlatable surface
and well represented throughout the study area. Siphonina davisi marks a period of
transgression and a maximum flooding surface on the LM2 depositional episode
(Witrock et al., 2003) (Figure 7). It is a relatively correlatable surface of the Lower
Miocene 3rd order sequences.
Analysis of the biostratigraphic data and their environmental preferences,
guided by Breard et al. (1993) showed that the Early Miocene strata in the Vinton
Dome area were laid down in the inner neritic to middle neritic zones (Figures 6, 7&
10).
Understanding biostratigraphic limitations in dynamic areas such as the
Vinton Dome can be very useful in enabling correct spatial placement of rock
sequences that contributes to accurate geologic interpretations since stratigraphic
correlations depend enormously on biostratigraphic applications for local and
regional subdivisions of rock units. Limits in biostratigraphic applications can exist
in some wells and may be controlled if they are well understood. Where erroneous
reading, such as data mishandling, in fossil depth is suspected, log correlation via log
signatures may be employed to facilitate the inference of depositional surfaces and
bodies. Correlation between wells in seismic data based on biostratigraphic picks
may be challenging for reasons that include the following:

79
• Due to severe faulting and potential slumping of sediments, redeposition or
reworking of faunas from their original environment to deeper zones could
contribute a major factor to shifts in biostratigraphic information in well data.
• Picks are facies or environment dependent; however, paleoecologic study has shown
that due to migration or evolution, some fossils species show preference to shallower
or deeper depths than their counterparts and examples are Planulina and Siphonina
of the Late Eocene and Early Oligocene (Berggren and Miller, 1989; Breard et al.,
2003).
• Drilled sandstone cuttings are sampled every 30 to 60 ft meaning that depths are
averaged and may lower biostratigraphic data resolution.
• Drilling effects that result in caving up or downfalling of cuttings into boreholes
may result in erroneous reading of pick depths which will also lower
biostratigraphic data resolution.
• Methods of collecting and analyzing samples.

80
4.2 LOG INTERPRETATION
Twelve wells in my study section have biostratigraphic data and each faunal
pick is found in one or at most two wells. Considering the haphazard nature of the
faunal data, I correlated the well logs and established stratigraphic surfaces using log
signature characters, while simultaneously referencing the faunal picks for
appropriate intervals. Biostratigraphic data were integrated with the well data by
identifying depths of faunal picks on logs. Lithology and sedimentary character were
determined from electric logs and used to identify and correlate a series of previously
established maximum flooding surfaces (MFS) surfaces (Fillon et al., 1997; Lawless
et al., 1997), such as Marginulina vaginata, Heterostegina texana, Discorbis gravelli,
and Siphonina davisi. From these, parasequences and the stacking patterns of
parasequence sets were established and used to determine the depositional setting of
the Aquitanian strata.
First, I prepared a correlation type log for the Lower Miocene (Figure 48)
which has a complete stratigraphic section for the Lower Miocene strata in the
Vinton Dome area and integrated biostratigraphic data. It shows the most complete
unfaulted interval of sediments representative of the thickest and deepest
sedimentary section in the field.
The wells with biostratigraphic data, allowed stratigraphic units to be defined
and correlated among other wells, and were tied to the seismic data. Seismically
defined surfaces were also identified in the wells and correlation was established
with other wells. SP logs were correlated using the ‘Billard ball’ type correlation

81
(Tearpock & Bischke, 1991), providing a means of closed loop correlation whereby
the correlation begins and ends with the same well (Figures 49 & 50).
Shale sections, representing condensed sections, were used for electric log
correlation. Closely-spaced well correlations were evaluated to improve the
accuracy of the log interpretation, help differentiate between fault cuts and
stratigraphic variations, and improve the estimate of the size and depth of identified
fault cuts.
The SP logs give a distinctive spiky signature at the limey Heterostegina
texana (HET) zone that is useful in correlation. The Siphonina davisi zone is
typically a thick shale that overlies stacked sandstones strata underlain by the
Anahuac shale column. The Discorbis gravelli zone is recognized by the point of
change in stacking pattern between the Late Oligocene retrogradationally stacked
parasequences to the Early Miocene progradationally stacked parasequences. It is
interpreted as the uppermost MFS between the HET and the Lower Miocene stacked
sandstone units, which conforms to the previously established maximum flooding
surface (Fillon et al., 1997).
Below the Marginulina vaginata MFS zone, in the lower Upper Oligocene, is
approximately 1400 ft (426.72 m) interval of sandstones, with 50 ft to 300 ft (15.24
m to 91.44 m) thick individual coarsening upward parasequences that are
progradationally stacked and bounded by marine flooding surfaces. The lower
Upper Oligocene interval is interpreted as consisting of deltaic sandstones, and the
300 ft (91.44 m) sandstone bodies show clinoforms in the associated seismic data.

82
Variations of fining-upward facies exist within the same interval, in some
wells in the northeast parts of the dome, and are interpreted as fluvial facies that
suggest fluvial input from the northeast parts to the dome (Figure 49 – wells 4 & 5).
The topmost part of this interval is shown in the cross-sections; however, no detailed
correlation was attempted in this lower Upper Oligocene interval.
Above the Marginulina vaginata section, are approximately 500 ft (152.4 m)
of mudstones and siltstones identified by a “railroad track” SP log signature. The
outer to inner neritic fossils in well data within the interval suggests marine or shelf
deposits. These mudstones and siltstones are overlain by the limey Heterostegina
texana zone, a carbonate zone representing the maximum flooding section in the
middle Late Oligocene (Breard et al., 1994; Galloway et al., 2000). Approximately,
six parasequences were correlated around the dome in the Marginulina vaginata and
Heterostegina texana interval. Each parasequence averages 75 ft (22.86 m), except
in the northeast, where there is thinning of parasequences ranging between 25 ft
(7.62 m) and 50 ft (15.24 m). Parasequences show funnel-shaped SP log pattern and
are stacked as coarsening upward retrogradational parasequences, bounded by
marine flooding surfaces.
Above the Heterostegina texana zone, are approximately 300 ft (91.44 m) of
additional mudstones and siltstones indicated by “railroad track” SP log signature
that are terminated by much more coarser sediments in the Early Miocene, and
gradationally marked by the Aquitanian coarsening-upward shoreline sandstones
(Figures 49 & 50). Inner neritic fossils in well data within the interval suggest

83
marine, shelf, or prodelta mudstones and siltstones. Three parasequences are
correlated around the dome in the Heterostegina texana and Discorbis gravelli
interval. Each parasequence averages 100 ft (30.5 m) and also shows funnel-shaped
SP log patterns. They are coarsening upward and retrogradationally stacked
parasequences, bounded by marine flooding surfaces. The top of these
parasequences is tied to a maximum flooding surface, referred to as the Top Anahuac
Shale, and marked by the Discorbis gravelli zone.
The Aquitanian section exhibits 2 to 3 coarsening upward progradational
parasequences, each ranging between 50 ft (15.24 m) to 100 ft (30.48 m) and
bounded by marine flooding surfaces (Figure 49). The sandstones are separated
from each other by 20 to 40 ft (6.1 to 12.2 m) thick proximal shale. They
individually range from 20 to 150 ft (6.1 to 45.7 m) thick and are thickest in the
northwest and southeast corner of the dome (Figure 49). I labeled the sandstone
units that are below the shale as the Lower Aquitanian sandstones and the sandstone
units above the shale as the Upper Aquitanian sandstones. There are no
biostratigraphic data to help differentiate between the LM1 and LM2 depositional
episodes but the separating proximal shale suggests that the two episodes correspond
respectively to the Lower and Upper Aquitanian shoreline deposits.
The Upper and Lower Aquitanian sandstones consist of shoreline facies and
presence of stacked, upward-fining fluvial deposits in the northern edge of the dome
(Figures 49 & 50). Well 2 (Figure 50) depicts a 60 ft (18.3 m) channel deposit
sharply truncating another channel deposit, leaving a remnant of 40 ft (12.2 m) of the

84
older channel deposit, and both have incised the Aquitanian shoreline deposits
indicating that they are younger than the Aquitanian sandstones. I interpret these as
“incised” channels that were rejuvenated as a result of sudden increase in discharge,
a major avulsion, or sea level fall (Olariu & Bhattacharya, 2006). The base of the
stacked channels directly overlies the Early Miocene prodelta, shelfal, or marine
mudstones and siltstones. This sudden change in vertical facies succession suggests
a basinward shift in facies that was perhaps due to a forced regression (Figure 49).
A local unconformity is interpreted below a 150 ft (45.7 m) sharp-based
fining-upward fluvial package overlying distal marine mudstones that is associated
with the graben in the southeast part of the dome. The extent of the unconformity
can only be correlated to the south, southwest, west and northwest parts of the dome
where valley fills overlay, or incised the proximal shale that divides the Upper
Aquitanian from the Lower Aquitanian sandstones (Figure 49). However, the Upper
and Lower Aquitanian sandstones have both been incised in the south whereas the
Lower Aquitanian sandstones are preserved in the west and northwest, indicating
that the unconformity (Figure 49 - wells 7 to 11) is younger than the Lower and
Upper Aquitanian sandstones.
Thinning of the Upper Oligocene strata is associated with the salt body and
several units appear to onlap toward the center of the dome (Figure 50). Relatively,
constant stratal thickness is observed in the Aquitanian, except at the center of the
dome, where there is onlap of the strata against the salt body.

85
In the north - south longitudinal cross-section across the dome, well 8 shows
only 25 ft (7.62 m) of a top-eroded shoreline Lower Aquitanian sandstone that can be
correlated in nearby northern wells whereas, the proximal shale that separates the
Upper and Lower Aquitanian sandstones, and the Upper Aquitanian sandstone units
are not present and are presumed to have been eroded off. The absence of faults in
this section of the well, the presence of a nearby unconformity, and a thick fluvial
unit in the next southern well suggest a by-pass zone with deposition to the south or
a ravinement surface (Figure 50).
Approximately 50 ft (15.24 m) of Siphonina davisi shale drapes the
Aquitanian sandstones throughout the entire dome suggesting that the unconformity
was tectonically-influenced in the Early Miocene and may have resulted from
increased sediment supply and salt withdrawal processes (Figure 49 - wells 7, 8, 9,
10, and 11).
Lateral well facies variations around the dome show that the Aquitanian
consists of deltaic sandstones in the northwest, north and northeast parts of the dome
which have been eroded by younger fluvial or valley-fill facies in the north, east,
southeast, southwest and west parts of the dome (Figures 49 & 50).
Blocky, sharp-based channel-like log signatures above the Siphonina davisi
shale indicate predominantly fluvial deposits in the Burdigalian section.

86
Figure 48: A Type log of Upper Oligocene to Lower Miocene, Vinton Dome.
Interval PS = Parasequence; FS = Flood surface; Depth in feet.
MFS
Marginulina vaginata
Heterostegina texana
Siphonina davisi MFS
Discorbis gravelli
Lower Aquitanian Upper Aquitanian
MFS
Anahuac shale Chattian
PS = {
Aquitanian
MFS
FS
- 7500
Burdigalian
- 6500
- 7000

87
-- FS
1
1 2
3 4
5 6
7 8
9 10
11
-- FS
2
--FS
3S
ipho
nina
dav
isi
Mar
ginu
lina
vagi
nata
Dis
corb
is g
rave
lli
Fluv
ial -
val
ley
fille
d sa
ndst
ones
and
inte
rbed
ded
mud
ston
es
Floo
din g
sur
face
Unc
onfo
rmity
Foss
il de
pth
Het
eros
tegi
na te
xana
Cha
ttian
NW
N
E N
EE
SE
SW
W
N
NW
1 2
3 4
5
6
7 8
9
10
11
Aqu
itani
an
Figu
re 4
9: W
ell c
orre
latio
n of
SP
logs
in lo
op c
ross
-sec
tion,
V
into
n D
ome.
Unc
onfo
rmity

88
1 23
4 5 6
7 8 9
Foss
il de
pth
Fluv
ial -
val
ley
fille
d sa
ndst
ones
and
inte
rbed
ded
mud
ston
es
Floo
ding
sur
face
Unc
onfo
rmity
N
S 1
2 3
4 5
6 7
8 9
Cha
ttian
Dis
tribu
tary
cha
nnel
Sip
honi
na d
avis
i
Het
eros
tegi
na te
xana
Mar
ginu
lina
vagi
nata
Dis
corb
isgr
avel
li
Posi
tion
of s
alt
body
Aqu
itani
an
Poss
ible
ra
vine
men
t su
rfac
e
Figu
re 5
0: W
ell c
orre
latio
n of
SP
logs
in N
orth
– S
outh
long
itudi
nal c
ross
-sec
tion,
Vin
ton
Dom
e.

89
Fluvial facies dominate the northwest and the south of the dome and are mostly
overlying the Aquitanian deltaic facies whereas, the deltaic facies dominate only the
northern part of the dome. Using well data control, an incised valley is drawn
representing most of the northwest and the south of the dome (Figure 51).
Figure 51: Basemap showing the position of the Aquitanian incised valley based on well control.
Incised valley

90
4.3 SEQUENCE STRATIGRAPHY
Well data interpretation and integration with seismic data provided some
assistance in mapping the Aquitanian stage, which show two parallel reflections that
delineate its top and base. The Aquitanian stage consists of two previously
established 3rd order maximum flooding surfaces (MFS), marked by Lenticulina
jeffersonensis and Siphonina davisi. These are inner to outer neritic fossils, thereby
placing the Vinton Dome area on the Miocene shelf. Integration of biostratigraphic
and log data with the seismic data has allowed the delineation of the Siphonina
davisi surface, while the Lenticulina jeffersonensis surface is not identified
suggesting that it is merged or eroded in the seismic profile. The top of the
Discorbis gravelli MFS, however serves as the base of the Aquitanian.
Seismic facies of higher order sequences often have low vertical resolution
that may be due to low accommodation that is characteristic of shelf, where younger
tracts generally invade into older ones, thereby offering thin and tight-packages
(Zeng & Hentz, 2004). Higher order systems tracts then become irresolvable in
seismic profiles, and at best show as 3rd order composite seismic responses with
indistinct 4th order top, base, and internal reflections. Robust seismic facies such as
clinoforms, downlaps, onlaps, and toplaps that usually characterize slope
environments are absent in the Aquitanian section, except onlap of strata toward the
salt body. Moreover, seismic tools that offer additional information for analyzing
depositional systems such as reflection amplitude and coherence have limited
success in higher resolution sequence stratigraphy (Zeng & Hentz, 2004). In the

91
light of limitations presented by seismic resolution, well log cross- section provided
the highest resolution and the best tool in the sequence stratigraphic evaluation of the
area.
4.3.1 Sequence Stratigraphic Analysis by Well Logs
Analyses were executed by applying the following basic methods for log and
sequence stratigraphic evaluation. Sequence boundaries represent points on the SP
logs, within coarsening upward sequences, which separate the highstand systems
tracts from the lowstand systems tracts, and are identified in the neritic zones as
abrupt shallowing or abrupt basinward shift in facies, for example, the base of a
blocky sand log signature. Transgressive surfaces are represented by the first
significant flooding surface that separates parasequences. Maximum flooding
surfaces represent the major condensed sections that typically mark the top of the
transgressive systems units, and often include the distal highstand systems tract.
They are correlatable surfaces that separate fining upward transgressive systems
tracts from the coarsening upward highstand systems tracts. A maximum flooding
surface is identified as the shaliest point on the SP log where the fining upward
pattern changes to a coarsening upward pattern (Figures 49 & 50).
Stacking patterns of parasequences have been used to define parasequence
sets, which in turn define system tracts (Wagoner et al., 1990). Previously
established 3rd order maximum flooding surfaces (MFS) permits the recognition of
highstand systems tract below the Marginulina vaginata MFS, shown as clinoforms

92
(Figures 49, 50 & 52). Each of the clinoforms is 50 ft (15.24 m) to 300 ft (91.44 m)
thick, with an average of 80 ft (24.38 m) indicating that the Vinton Dome area had
been a deltaic environment. Thick deltaic and fluvial sandstones were observed in
logs throughout the area, but the progradational clinoforms are observed only in the
southwestern part of the dome.
Figure 52: a) Seismic profile and b) basemap showing clinoforms below the Marginulina
vaginata strata and evidence of progradation in the southwest area, Vinton Dome.
b)
LL
a)
clinoforms
L L’
Tim
e (ms)
0.300
0.00 Siphonina davisi
Heterostegina texana
Marginulina vaginata
Discorbis gravelli

93
Above the Marginulina vaginata MFS, there is a major unconformity,
recognized by onlap of reflections from beneath the Heterostegina texana strata to
Siphonina davisi strata, against an immediate older reflection in the south of the
dome (Figure 53).
a)
b)
Figure 53 a & b: a) Seismic profile and b) basemap; showing the unconformity and onlap of the Late Oligocene to Early Miocene strata. Red line indicates position of seismic profile.
M
M’
Rim syncline
Siphonina davisi
Heterostegina texana
Marginulina vaginata
Late Oligocene Prodelta mud lobes A B
Salt
M M’
A-A’
Unconformity
Tw
ow
aytim
e(s)

94
The unconformity does not satisfy the criteria for sequence boundary since it
can only be locally defined (Wagoner et al., 1990). This unconformity is perhaps
related to salt withdrawal processes and may have been tectonically impacted.
The transgressive systems tracts above the Marginulina vaginata MFS are
represented in my dataset, as retrogradational parasequence sets below the
transgressive parasequence sets of the Heterostegina texana to Discorbis gravelli
interval (Figures 49 & 50). However, aggradational and progradational
parasequence sets of shelf deposits may co-exist with the retrogradational
parasequence sets at the same depth as a result of erosion after sea level falls (Zeng
& Hentz, 2004). At the south of the dome, a 45 ms interval bearing buried prodelta
turbidites within the Heterostegina texana and Discorbis gravelli MFS surfaces may
represent a thin phase of a highstand or lowstand sequence above the Heterostegina
texana MFS zone.
The Early Miocene has been characterized as a period of substantial
evolution in sediment dispersal in the northern Gulf of Mexico (Edwards, 1994;
Fillon & Lawless, 1999; 2000; Galloway et al., 2000), and high sediment influx is
expected to the top of the Anahuac shale. The prograding parasequences of the
Aquitanian shoreline deposits, therefore, represents the highstand systems tract that
was deposited on top of the Discorbis gravelli MFS. An abrupt change and
basinward shift in facies is recognized locally in some wells between the Anahuac
shale and the Aquitanian sandstones indicating a relative sea level fall (Figure 49,
wells 1 & 5; Figure 50). Lack of evidence for subaerial exposure and erosional

95
truncation suggests that there are no incised valleys in the Oligocene - Miocene
interface. Rather, the abrupt seaward translated marine, shelfal, or prodelta facies in
the Oligocene to the Lower Miocene shoreline facies, suggests that there was a
eustatically-induced forced regression that may indicate a sequence boundary in the
Oligocene – Miocene interface (Posamentier et al., 1990; 1992; Posamentier &
Allen, 1999; & Soria et al., 2003). This is in accordance with the lowermost
Miocene sequence, previously reported as deposits of a second order eustatic sea
level fall (Fillon & Lawless, 2000) (Figure 3).
The Siphonina davisi sequence, however, has been reported as deposits
within the second order relative sea level rise in the Lower Miocene supersequence
(Figure 4). The prograding to aggrading shoreline deposits of the Upper Aquitanian
sandstones may have indicated imprints of the relative sea level rise and a resultant
normal regression pattern, as a result of high sediment influx to the basin. Above the
Upper Aquitanian sandstones, the presence of an unconformity in the south of the
dome, some evidence of sedimentary by-pass that are closely located and more
northern to the unconformity, and the draping of the Siphonina davisi shale suggest
that there was a combined eustatically-induced forced regression and a tectonically-
induced forced regression that may have been impacted by salt withdrawal-driven
subsidence and tectonic uplift of the adjacent area (Figure 54).

96
(a) Tectonically-impacted
(b) Eustastically-impacted
(c) Combined
Figure 54: Schematic illustration of settings before and after flattening a horizon below a
sequence boundary (a) tectonically-impacted scenario in salt dome environments, (b) eustatically-impacted scenario and (c) combination of both tectonically and eustatically-impacted scenario as seen in figure 49. Thick lines represent unconformity.
Salt
Doming of units, erosion and a resultant unconformity
Flattened below unconformity
Relatively flatly laid units
Relatively flatly laid units
Unflattened or flattened below unconformity
Relatively flatly laid units
Doming of units, erosion and a resultant unconformity
Flattened below unconformity

97
4.4 SEISMIC INTERPRETATION
The 60 Hz. resolution 3D surface seismic data applied to this study allowed
imaging of merged 3rd order sequences that represent the Aquitanian, but the higher
order sequences are limited by vertical resolution and their seismic responses are
therefore unresolved. Instead, log data interpretation aided the identification of the
3rd order sequences (Figures 47 & 49). Each of the two 3rd order sequences between
the Top Anahuac and Siphonina davisi range from 25 ft (7.6 m) near salt to 280 ft
(85 m) thick at the periphery of dome, and constitute the LM1 and LM2 chronozones
(Figure 7). These 3rd order sequences have composite seismic response of higher
order sequences (Figure 47).
The depositional pattern of the Aquitanian strata is dependent on the structural
pattern and salt tectonics. Isochore maps and phantom slices of amplitude maps of
the Marginulina vaginata to Heterostegina texana strata show evidence of equal
thickness with a ring pattern of deposition around the peripheries of the dome that
suggests syndeposition with the growth of the salt dome (Figures 55-58). Onlap of
strata towards the dome suggests a period of active salt movement (Figures 55 and
56). The uneven distribution of the strata makes distinct correlation of depositional
bodies exceedingly difficult. Thickening of the strata at the hangingwall of the
master fault and thinning at the footwall is evidence that the salt was seated at the
footwall of the fault in the Late Oligocene, which suggests salt creep from the
downthrown block to the upthrown block of the fault (Figures 59 and 60). In the
Early Miocene, thickening or thinning of strata in the hangingwall is masked by the

98
absence of the Top Anahuac strata at the salt flank. However, thinning observed at
the hangingwall may be due to the displacement of more salt bodies as more
sediments are deposited at the northern part of the dome.

99
Figure 55: Isochore map of Siphonina davisi to Discorbis gravelli.
Figure 56: Isochore map of Discorbis gravelli to Heterostegina texana.
Time Thickness (ms)
Time Thickness (ms)
Early Miocene depocenter - Increased thickness in graben
Late Oligocene depocenter

100
Figure 57: Isochore map of Siphonina davisi to Heterostegina texana.
Figure 58: Isochore map of Heterostegina texana to Marginulina vaginata.
Time Thickness (ms)
Time Thickness (ms)

101
Figure 59: Isochore map of Heterostegina texana to Marginulina vaginata, focusing on salt position. Linear feature is due to thinning as a result of turtle structure anticline.
Figure 60: Isochore map of Siphonina davisi to Heterostegina texana, focusing on salt position.
Time Thickness (ms)
Linear feature
Time Thickness (ms)

102
A linear feature that strikes parallel to the master fault at the north of the
dome reveals the thinning of the Late Oligocene strata near the salt body as a result
of the effect of the turtle structure anticline (Figures 27 & 58). There is no
observable fault in the vicinity of the linear feature on the seismic section and the
negative and positive curvatures did not image such a linear feature as a fault. The
syncline thus created by the adjacent anticline may have formed a collection area for
sediments downfalling as a result of the upward movement of the salt body. The
Late Oligocene Marginulina vaginata to Discorbis gravelli strata, as revealed by
well logs, are mainly mudstones and siltstones. Considering that the northern part of
the dome is a hangingwall of a major fault, relative movement of the fault block may
likely have caused deformation structures such as the curvy features present in the
axis of the rim syncline (Figures 61 & 62). The curvy features could easily be
misinterpreted as fluvial bodies, but abundant well data in the area show that these
are within thick prodelta to shelf mudstones and could not be fluvial features.
Coherence maps revealed shale deformation features in the southwest and
south of the dome (Figures 63 - 68). The outer neritic Heterostegina texana to
Discorbis gravelli section contains channel-like features and their associated lobe-
shaped features that were not intersected by many wells. They occur in an interval
of approximately 45 ms and some of the channel belts are up to 3500ft (1 km) wide
and 165 ft (50 m). Each of the lobes average 3 km wide, meaning they are above the
tuning thickness and are part of the siltstones and mudstones of the Upper Oligocene
section. They are coherent, stratigraphically confined between the Heterostegina

103
texana and Discorbis gravelli surfaces, uncorrelated to faults, and sinusoidal in shape
((Figures 66 & 67). They have been revealed by seismic data and coherence maps;
however, they are not observable in time slices. Since the closest well log to these
lobes has characterized the Late Oligocene strata as mudstones and siltstones (Figure
49 – well 8) and the fossils have classified the environment as an inner to outer
neritic zone, I interpret the features as prodelta subaqueous turbidites (Bhattacharya
& Walker, 1992; Pattison, 2005; Olariu & Bhattacharya, 2006). These features are
common in subaqueous prodelta environment as areas of instabilities. Instabilities
can be generated by storm events, river flooding, high rates of sedimentation,
earthquakes, or salt movement. Large quantities of mud or silt debris along well-
defined gullies may be constantly fed from a source area undergoing rotational
slumping and subsidence, which may be deposited in a composite depositional area.
The complexity of the arrangement of the Late Oligocene southwestern lobes may
indicate evidence of numerous slumping of debris, high area of sedimentation,
instability and excess pore fluid pressure (Coleman & Prior, 1982). Salt movement
in close proximity could have created slope gradient that may have launched these
features.
The Late Oligocene isochores (Figures 55 & 56) showed that deposition was
more focused to the western side of the dome, whereas, the southeast graben
received more sediments in the Early Miocene. The western and southeastern
depocenters may have been created as a result of salt evacuation and movement to
the center of the dome or away to a nearby salt body. In the Early Miocene, channel

104
facies that were traced around the dome also revealed stratigraphically confined
features at the north of the dome, in the path of the rim syncline. This was a channel
that flowed parallel to the strike direction of the master fault. This channel received
sediment supply from the feeder channels at the northeast of the dome (Figures 43 &
44) and transported it, perhaps in a confluence, westward and parallel to the master
fault. Evidence of this channel in the Early Miocene can be seen on seismic and well
data. The channel belt is positioned near the salt body and coherence map of the
Aquitanian suggests presence of crevasse splay in the hangingwall of the master
fault, which further suggest that the area was in a lower delta plain environment
(Figure 67) (Coleman & Prior, 1982). Further southward, toward the salt body, the
channel may have meandered or split into distributary channels. Subject to the limit
of the survey and the presence of the salt body, evidence of channels in the same
vicinity in the southwest part of the dome suggests distributaries of the northern
channel.
Evidence of a deltaic environment in the Early Miocene during the Discorbis
gravelli - Siphonina davisi time can only be inferred from the logs. Presence of
sandy, upward coarsening units indicates deltaic sands, and bell-shaped, fining-
upward log motifs indicate fluvial deposits in the north, northeast, southeast and
western parts. In the Aquitanian, the presence of numerous channels in the
southwest part and the unconformity in the southeastern part suggest evidence of by
pass deposition further seaward during lowstand of sea level (Figures 49, 50, 68 &
69). There are few wells in the south and southwest part of the survey with which to

105
confirm the information on logs. However, the closest well in the vicinity reveal 150
ft (45.72 m) of fluvial deposits, as a result of the unconformity in the Aquitanian
section (Figure 49- well 7). Therefore, I interpret the south and southwest
depositional area as a subaqueous delta front. Its accommodation may have been
provided by salt withdrawal, further away from the dome, in the southern part of the
dome. The channels associated with these depositional lobes did not appear to incise
the underlain Oligocene strata (Figures 49, 68, & 69). In the Early Miocene, during
the Discorbis gravelli - Siphonina davisi time, a channel crossed directly from the
northeast, over the salt, to the south where it deposited its load into the graben
formed by faults G and K (Figures 30 & 34). The graben is the thickest section of
the Aquitanian strata.

106
Figure 61: a). Uninterpreted and b). interpreted stratal slices of amplitude map of Heterostegina texana – Discorbis gravelli section at 80 ms below flattened
Siphonina davisi horizon.
Shale deformation structures {
b) 10000 ft.
a) 10000 ft.
pos
neg
0
Amplitude

107
Figure 62 a: Seismic profile showing one of the deformation features along the crossline direction between the Top Anahuac and the Heterostegina texana strata.
Figure 62 b: Basemap showing crossline profile. Deformation structures are in the rim syncline in the hangingwall of the master fault in the northern part of the dome. Red line indicates the position of the seismic profile.
2.0 --
1.5 --
Tw
o way tim
e (s)
pos neg
N N’
N
N’

108
Figure 63 a: Seismic expression of crossline showing the presence of Late Oligocene
sinuous subaqueous channels as bird’s eyes.
Figure 63 b: Coherence map showing crossline profile on sinuous subaqueous channels. Red line shows position of seismic profile.
Tw
o way tim
e (s)
Siphonina davisi Discorbis gravelli Heterostegina texana
Marginulina vaginata
Subaqueous sinuous channels
1.5 --
2.0 --
neg 0 pos

109
Figure 64: Schematic analog illustration showing subaqueous depositional environment and processes such as major types of submarine landslides, diapirs, and contemporary faults in the Mississippi River delta (Coleman & Prior, 1982).
Figure 65: Schematic analog of a three component shoreface to shelf depositional model –
Delta front, subaqueous channels and prodelta turbidites (Pattison, 2005).

110
Figure 66: A series of interpretative maps showing sinusoidal (cyan color) and lobe features in the Late Oligocene section, in the southwest and south of the dome. (a) and (b) are uninterpreted while (c) and (d) are interpreted coherence maps. Seismic section (e) displays cyan arrows pointing to the positions of the cyan-colored painted features within the same stratigraphic unit. Basemap (f) shows the overall result of the painted sinusoidal features at different times within the coherence cube, above the flattened Heterostegina texana surface.
a b
c d
e f

111
Figure 67: a) Un-interpreted and b) interpreted coherence maps of the Heterostegina texana – Discorbis gravelli section showing depositional lobes. I interpret these as subaqueous channels and prodelta turbidites. Seismic profiles of crosslines X-X’ and Y-Y’ and inline
Z-Z’ across lobes are shown in figures 68 a-c.
X Y
X’ Y’
C
D
B
A
E
FZ Z’
• wells
a)
b)

112
a)
b)
c)
Figures 68 a, b & c: Seismic profiles X-X’, Y-Y’ and Z-Z’ flattened on Siphonina davisi horizon reveal Late Oligocene subaqueous channels and associated lobes. Figure 68 b illustrates that lobe C appears to have been eroded by another channel. Lobe D is an amalgamation of older lobes. Lobe C is younger than lobe B.
Less confined channel for Lobe C
Confined channel for Lobe D
Amalgamation of lobes- represented as lobe D
B-B’
Confined channel for Lobe C
Lobe C Y Y’
Salt
C-C’
Confined Channel for lobe E Lobe C Lobe B
Salt
Z
A-A’
Siphonina davisi
Heterostegina texana
Marginulina vaginata
Siphonina davisi
Heterostegina texana
Marginulina vaginata
Discorbis gravelli
Tw
o way tim
e (s) T
wo w
ay time (s)
Tw
o way tim
e (s)
Siphonina davisi
Heterostegina texana
Marginulina vaginata
Prodelta lobes A B
Salt
X X’
Z’

113
Figure 69: a). Un-interpreted and b). interpreted coherence maps of the Aquitanian section showing evidence of channels.
Crevasse splays
Channels
a)
b)
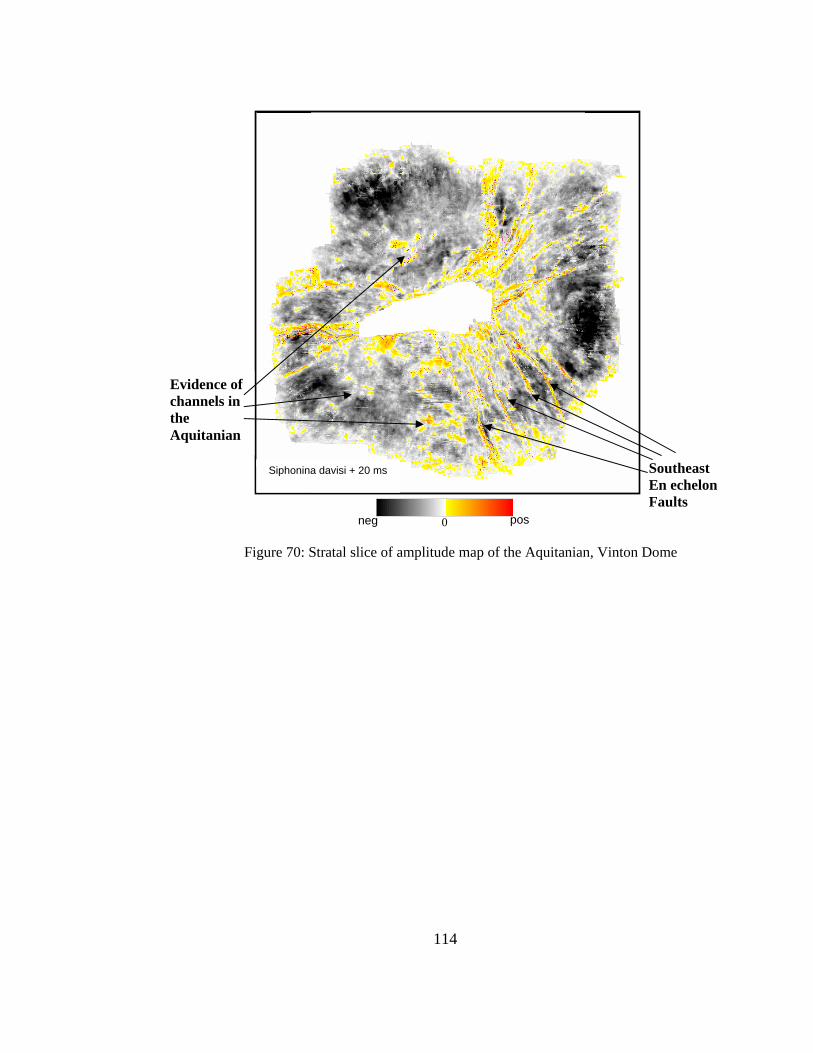
114
Figure 70: Stratal slice of amplitude map of the Aquitanian, Vinton Dome
Siphonina davisi + 20 ms
pos neg 0
Evidence of channels in the Aquitanian
Southeast En echelon Faults

115
CHAPTER FIVE
CONCLUSIONS
The stratigraphy and the depositional regime of the Aquitanian were
controlled by the structural pattern and salt tectonism. Accomodation in the northern
part of the dome was regulated by the inter-relationship of tectonic subsidence and
sediment dispersal. Evolution of the Aquitanian was better understood by its
comparison with the preceding Oligocene strata.
Salt shape largely controlled the structural pattern in the Late Oligocene to
Early Miocene. The dome contained complex fault systems that controlled the
depositional systems. The dome consists of a counter-regional fault, three peripheral
fault sets, and isotropic polygonal fault system in the entire dome. This is probably
the first documentation of fine scale polygonal faults in the Gulf of Mexico basin.
The North Sea basin, however, has numerous reports of larger scale polygonal faults.
Vinton polygonal faults are fracture sets and can be formed by dewatering processes,
syneresis, deformation by salt movement, and/or by episodic hydrofracturing of
basin-wide over-pressured compartments.
Aquitanian strata were deposited with the rising salt and the depocenter
distribution was controlled by unconformity, growth along the active faults, and
perhaps also by salt withdrawal processes. The Late Oligocene strata however, were
characterized by slumping.

116
Deltaic sandstones and younger fluvial deposits characterize the Aquitanian.
The Top Aquitanian fossils and their environmental preference suggest that the area
was on the inner neritic shelf. Presence of crevasse splays and numerous fluvial
deposits indicate that the Aquitanian environment was a lower delta plain. Fluvial
input from the northeastern part of the dome to the south and west parts may have
created overloading of sediments and a resultant unconformity, perhaps activated by
salt withdrawal processes. Thick fluvial deposits, perhaps more than 150 ft (46 m),
are present in the southeast depocenter, which has a gross thickness of about 280 ft
(85 m). The draping of the Siphonina davisi shale on the Aquitanian sandstones
indicates that the unconformity was partly tectonically impacted.
The Upper Oligocene Anahuac section contains mudstones and siltstones
with fossils that indicate inner to outer neritic shelf. Presence of deformation
structures along the rim syncline in the north, subaqueous channels and their
accompanying turbidites in the south suggests a prodelta environment. The major
depocenter in the Late Oligocene occurred in the west and the major shift to the
southeast in the Aquitanian was controlled by salt withdrawal processes. Presence of
clinoforms below the Marginulina vaginata section indicates that the area was
previously a delta front environment.
Highstand sedimentation of the Aquitanian on top of the transgressive
sedimentation of the Late Oligocene suggests a sea-level fall, which corresponds to
the previously established 2nd order sea level fall. Accomodation on shelf is
typically thin, that may make shelf tracts to co-exist at the same depth. However,

117
two unconformities have been identified; one in the Early Anahuac, above the
Marginulina vaginata MFS zone and the other in the Aquitanian, above the deltaic
sandstones.
New acquisition and interpretation technology have provided better imaging
of the complexly-faulted Vinton Dome strata and an opportunity to further decipher
its depositional systems. Seismic attributes further provided finer scale structural
architecture of the dome and salt tectonics has been better understood on the
Miocene shelf. The study highlighted some of the stratigraphic complexities of
delta systems and depositional bodies formed in shallow water under conditions of
limited accommodation and salt influence.

118
REFERENCES
Arenson J. D., Medvin,E. A., & Maione, S. J., 1999, Interpretation of Coherence Cube Processing in the 3-D Workspace: American Association of Petroleum Geologists: vol. 49, p. 74-81.
Barnes, A., 2006, Too many seismic attributes?: CSEG Recorder: p. 40-45.
Berggren, W. A. & Miller, K. G., 1989, Cenozoic bathyal and abyssal calcareous benthic foraminiferal zonation: Micropaleontology: vol. 35, p. 308-320.
Bhattacharya, J. P. & Walker, R. G., 1992, Deltas. In Walker, R. G., and James, N. P. (eds), Facies Models: Response to Sea-level Change: Geological Association of Canada, p. 157-177.
Blood, T. E. & Crastley, 1995, Evidence for additional type 1 sequences in the lower Miocene of the Gulf of Mexico: Annual Meeting Abstracts - American Association of Petroleum Geologists: vol. 4, p.10.
Breard, S.Q., Callender, D. A., & Nault, M. J., 1993, Paleoecologic and Biostratigraphic Models for Pleistocene through Miocene Foraminiferal Assemblages of the Gulf Coast Basin: Gulf Coast Association of Geological Societies Transactions: vol. 43, pp. 493-502.
Breard, S.Q., Nault, M. J., & Callender, A. D., 1994, Biostratigraphy and Paleoecologic Tolerances of Oligocene through Paleocene Foraminiferal Assemblages of the Gulf Coast Basin: Gulf Coast Association of Geological Societies Transactions: vol. 44, p. 111-116.
Breard, S.Q., Callender, D. A., & Nault, M. J., 1996, Local Foraminiferal Faunas: The Key to Enhanced Stratigraphic Resolution of Expanded Cenozoic Sections in the Gulf Coast Basin: Gulf Coast Association of Geological Societies Transactions: vol. 46, p. 55-62.
Brown, A. R., 1996, Seismic attributes and their classification: The Leading Edge: vol. 15, p. 1090.

119
Brown, A. R., 2005, Pitfalls in 3-D Seismic Interpretation: Search and Discovery Article: #40145.
Chopra, S. & Marfurt, K., 2005, Seismic Attributes – a historical perspective: Geophysics: vol. 79, p 3SO- 28SO.
Chopra, S. & Marfurt, K., 2006, Seismic Attributes – a promising aid for geologic prediction: CSEG: 2006 Special Edition: p. 110-121.
Coleman, J. M. & Prior, D. B., 1982, Deltaic Environment of Deposition: American Association of Petroleum Geologists: vol. M31: Sandstone Depositional Environments, p. 139-178.
Combellas-Bigott, R. I., & Galloway, W. E., 2002, Depositional history and genetic sequence stratigraphic framework of the middle Miocene depositional episode, south Louisiana: Gulf Coast Association of Geological Societies Transactions, vol. 52, p. 139-150.
Constance, P. E., Holland, M. B., Roche, S. L., Bicquart, P., Bryans, B., Gelinsky, S., Ralph, J. G., & Bloor, R. I., 1999, Simultaneous acquisition of 3D surface seismic data and 3C, 3D VSP data: 69th Ann. International Meeting, SEG, Expanded Abstracts, 104-107.
Curtis, D. M., 1970, Miocene deltaic sedimentation, Louisiana Gulf Coast: in, Morgan, J. P., edition, Deltaic sedimentation, modern and ancient: SEPM Special Publication: 15, p. 293-308.
Dewhurst, D. N., Cartwright, J. A., & Lonergan, L., 1999, The development of polygonal fault systems by syneresis of colloidal sediments: Marine and Petroleum Geology: vol. 16, p. 793-810.
Edwards, M. B., 1994, Enhancing sandstone reservoir prediction by mapping erosion surfaces, Lower Miocene Deltas. Southwest Louisiana, Gulf Coast Basin: Gulf Coast Association of Geological Societies Transactions: vol. 44, pp. 205-215.

120
Fails, T. G., 1990, Variation in Salt Dome Faulting, Coastal Salt Basin: Gulf Coast Association of Geological Societies Transactions, vol. 40, p. 181-193.
Fillon, R. H. & Lawless, P. N., 1999, Miocene Deposition and Petroleum Geology, Northern Gulf of Mexico: Petroleum Technology Transfer Council, Eastern Gulf Region- Technology Workshop, Jackson, Mississippi, November 10, 1999.
Fillon, R. H. & Lawless, P. N., 1999, Paleocene – Lower Miocene Sequences in the Northern Gulf: Progradational Slope Salt-Basin Deposition and Diminishing Slope-Bypass Deposition in the Deep Basin: Gulf Coast Association of Geological Societies Transactions: vol. 49, p. 224-241.
Fillon, R. H. & Lawless, P. N., 2000, Lower Miocene – Early Pliocene Deposystems in the Gulf of Mexico; Regional Sequence Relationships: Gulf Coast Association of Geological Societies and Gulf Coast Section SEPM, 47th annual meeting: vol. 50, pp.411-428.
Galloway, W. E., 2001, Cenozoic evolution of sediment accumulation in deltaic and shore-zone depositional systems, Northern Gulf of Mexico Basin: Marine and Petroleum Geology: vol. 18, p. 1031-1040.
Galloway, W. E., Ganey-Curry, P., Li, X., & Buffler, R. T., 2000, Cenozoic depositional evolution of the Gulf of Mexico Basin: American Association of Petroleum Geologists: vol. 84, p. 1743-1774.
Galloway, W. E., Jirik, L. A. Morton, R. A., & Dubar, J. R., 1986, Lower Miocene (Fleming) depositional episode of the Texas coastal plain and continental shelf: structural framework, facies, and hydrocarbon resources: University of Texas at Austin, Bureau of Economic Geology Report of Investigations: vol.150, 50 p.
Galloway, W. E., 1986, Growth faults and Fault – Related Structures of Prograding Terrigenous Clastic Continental Margins: Gulf Coast Association of Geological Societies Transactions: vol. 36, p. 121-128.
Hamiter, R., Lowrie, A., MacKenzie, M., & Guderian, E., 1997, Origin of Salt-Withdrawal Mini-Basins, Proven Producers Aling Present and Paleo-Louisiana

121
Slope: Gulf Coast Association of Geological Societies Transactions: vol. 47, p. 185-191.
Haq, B. U., Hardenbol, J., & Vail, P. R., 1988, Mesozoic and Cenozoic Chronostratigraphy and Eustatic Cycles: SEPM Special Publication, 42, Tulsa, 71-108.
Haskell, N., Nissen, S., & Hughes, M., 1999, Delineation of geologic drilling hazards using 3-D seismic attributes: The Leading Edge: vol. 18, no. 3, p. 373-382.
Hentz, T. F. & Zeng, H., 2003, High-Frequency Miocene sequence stratigraphy, offshore Louisiana: Cycle framework and influence on production distribution in a mature shelf province: American Association of Petroleum Geologists: vol. 87, no. 2, p. 197-230.
Hughes, D. J., 1960, Faulting Associated with Deep-Seated Salt Domes in the Northeast Portion of the Mississippi Salt Basin: Gulf Coast Association of Geological Societies Transactions: vol. 10, p. 155-173.
Hughes, D. J., 1968, ERRATA Salt Tectonics as Related to Several Smackover Fields Along the Northeast Rim of the Gulf of Mexico Basin: Gulf Coast Association of Geological Societies Transactions: vol. 18, p. 320-330.
Hunt, J. L. & Burgess, G., 1995, Depositional Styles from Miocene Through Pleistocene in the North-Central Gulf of Mexico: An Historical Reconstruction: Gulf Coast Association of Geological Societies Transactions: vol. 45, p. 275-284.
Joy, A. M., 1993, Comments on the pattern of post-rift subsidence in the central and northern North Sea Basin, in Williams G. D., & Dobb, A., Tectonics and seismic sequence stratigraphy: Geological Society Special Publications: vol. 71, p. 123-140.
Krutack, P. R. & Beron, P., 1990, Heterostegina zone – a shallow Anahuac (Late Oligocene – Early Miocene) oil frontier in southern Louisiana and Mississippi: Transactions GCAGS: vol. 40, p. 397-409.

122
Lawless, P. N., Fillon, R. H., & Lytton, III, R. G., 1997, Gulf of Mexico Cenozoic Biostratigraphic, Lithostratigraphic, and Sequence Stratigraphic Event Chronology: Gulf Coast Association of Geological Societies Transactions: vol. 47, p. 271-282.
Lerche, I., Malloy, S., Petersen K., & Lowrie A., 1996, Lateral Variations of Sub-salt Overpressure Build-up in the Gulf of Mexico: Gulf Coast Association of Geological Societies Transactions, vol. 46, p. 271-280.
Liu Q., Buffler R. T., & Galloway, W. E., 1997, Seismic Expression and Depositional Environments of a Late Oligocene/Earliest Miocene Carbonate Unit, Offshore Mississippi and Alabama: Gulf Coast Association of Geological Societies Transactions: vol. 47, p. 291-297.
Lovell, J. P. B., 1990, Cenozoic, in Glennie, K. W., An introduction to the petroleum geology of the North Sea, Oxford: Blackwell Scientific Publications: p. 273-293.
Mancini, E. A., Puckett, T. M., Parcell, W. C., & Llinas, J. C., 2001, Smackover Petroleum System (Source, Reservoir, Seal and Trap) And Underdeveloped Smackover Reservoirs in the Mississippi Interior Salt Basin: Topical Reports: vol. 5-8.
Marfurt, K. J., 2005, Robust Estimates of 3-D Reflector Dip and Azimuth: submitted to Geophysics.
Martin P. A. Jackson & William E. Galloway, 1984, Fault Patterns Around Salt Domes: American Association of Petroleum Geologists: Special Volumes: Vol. A159, p. 95 – 101.
Marton, G. & Buffler, R.T., 1993, Application of simple-shear model to the evolution of passive continental margins of the Gulf of Mexico Basin: Geology: vol. 21, p. 495-498.
McBride, B.C., Weimer P., & Rowan M.G., 1998, The evolution of allochthonous salt along a megaregional profile across the Northern Gulf of Mexico: American Association of Petroleum Geologists: vol. 82, no. 5B, p. 1037-1054.

123
Mohriak, W.U., Macedo, J.M., Castellani, R.T., Rangel, H.D., Barros, A.Z.N., Latg, M.A.L., Mizusaki, A.M.P., Szatmari, P., Demercian, L.S., Rizzo, J.G., & Aires, J.A., 1995, Salt tectonics and structural styles in the deepwater province of the Cabo Frio region, Rio de Janeiro, Brazil: American Association of Petroleum Geologists Memoir: vol. 65, p. 273-304.
Nettleton, L. L., 1934, Fluid Mechanics of Salt Domes: American Association of Petroleum Geologists Bulletin, vol. 27, p. 51-63.
Olariu, C., & Bhattacharya, J. P., 2006, Terminal Distributary Channels and Delta Front Architecture of River-Dominated Delta Systems: Journal of Sedimentary Research: vol. 76, no. 2, p. 21-233.
Parker, T. J. & McDowell, A. N., 1955, Model Studies of Salt Dome Tectonics: American Association of Petroleum Geologists Bulletin: vol. 39, no. 12, p. 2384 – 2470.
Pate, K. A., & Dunbar, J., 2000, Evolution of faulting Styles around Salt Domes: American Association of Petroleum Geologists Bulletin, vol. 2000, p. 112.
Pattison, S. A. J., 2005, Storm Influenced Prodelta Turbidite Complex in the Lower Kenilworth Member at Hatch Mesa, Book Cliffs, Utah, U.S.A.: Implications for Shallow Marine Facies Models: Journal of Sedimentary Research: vol. 75, no. 3, p. 420 - 439.
Pirson, S. J., 1977, Geologic Well Log Analysis: Book: 2nd Edition, Gulf Publishing Company.
Posamentier, H. W., James, D. P., & Allen, G. P., 1990, Aspects of sequence stratigraphy: recent and ancient examples of forced regressions: American Association of Petroleum Geologists Bulletin: vol. 74, p. 742.
Posamentier, H. W., Allen, G. P., James, D. P., & Tesson, M., 1992, Forced Regressions in a Sequence Stratigraphic Framework: Concepts, Examples, and Exploration Significance (1): American Association of Petroleum Geologists Bulletin: vol. 76, p. 1687-1709.

124
Posamentier, H. W. & Allen, G. P., 1999, Siliciclastic Sequence Stratigraphy – Concepts and Applications: SEPM Concepts in Sedimentology and Paleontology #7.
Rader, B., & Medvin, E., 2002, Shallow hazard detection in the near-surface, a coherence cube processing application: The Leading Edge: vol. 21, p. 672-674.
Rekoske, K., & Hicks, D., 1992, Synthetic Seismograms: Part 7. Geophysical Methods: American Association of Petroleum Geologists: Special Volumes: vol. AO95, p. 390-391.
Rijks, E. J. H. & Jauffred, J. C. E. M., 1991, Attribute extraction: An important application in any detailed 3D interpretation study: The Leading Edge: vol. 10, p. 11-19.
Roberts, A., 2001, Curvature attributes and their application to 3D interpreted horizons, First Break, 19, 85-100.
Rowan, M., 2000, Modern Salt Tectonics: Workshop sponsored by Petroleum Technology Transfer Council’s Eastern Gulf Region on July 26, 2000, Jackson, Mississippi.
Salvador, A., 1987, Late Triassic-Jurassic paleogeography and origin of Gulf of Mexico basin: American Association of Petroleum Geologists: vol. 71, no. 4, p. 419-451.
Seni S. J. & Jackson M.P., 1983, Evolution of Salt Structures, East Texas Diapir Province, Part 1: Sedimentary Record of Halokinesis: American Association of Petroleum Geologists: vol. 67, no. 8, p. 1219-1244.
SONRIS Database Access, 2006, Louisiana Department of Natural Resources: sonris.com
Soria, J. M., Fernandez, J., Garcia, F., & Viseras C., 2003, Correlative Lowstand
Deltaic and Shelf Systems in the Guadix Basin (Late Miocene, Betic Cordillera, Spain): The Stratigraphic Record of Forced and Normal Regressions: Journal of Sedimentary Research: vol. 73, no. 6, p. 912-925.

125
Styzen, M. J., 1996, Late Cenozoic Chronostratigraphy of the Gulf of Mexico: Chart (In progress), Shell Offshore Inc.
Taner, M. T. & Sheriff, R. E., 1977, Seismic Stratigraphy - Applications to Hydrocarbon Exploration: Memoir 26: A165, p. 301-327.
Tearpock, D. J. & Bischke, R. E., 1991, Applied subsurface geological mapping: Prentice-Hall, N.J., 648 p.
Thompson, S. A. & Eichelberger, O. H., 1928, Vinton Salt Dome, Calcasieu Parish, Louisiana: American Association of Petroleum Geologists: vol. 12, no. 4, p. 385-394.
Trevino, R. H., Loucks, R. G., Brown, F. L. & Remington, R. L., 2003, General Geology of the Mid-Tertiary Block 889 Field Area, Offshore Mustang Island, Texas: Gulf Coast Association of Geological Societies Transactions: vol. 53, p. 808-819.
Trusheim, F., 1960, Mechanism of Salt Migration in northern Germany: American Association of Petroleum Geologists Bulletin, vol. 44, p. 1519-1540.
Vendeville, B. C., 2002, A New Interpretation of Trusheim’s Classic Model of Salt-Diapir Growth: Gulf Coast Association of Geological Societies Transactions, vol. 52, p. 943-952.
Vendeville, B. C., Fouad, K., & Knox, P. R., 2003, Radial faulting above salt-diapir overhangs; natural example, and physical and kinematic models: Gulf Coast Association of Geological Societies Transactions: vol. 53, p. 828-835.
Wagoner, J. C., Mitchum, R. M., Campion, K. M., & Rahmanian, V. D., 1990, Siliciclastic Sequence Stratigraphy in Well Logs, Cores, and Outcrops: American Association of Petroleum Geologists Methods in Exploration Series: no 7.
Watkins, J. S., Bradshaw, B. E., Huh, S., Li, R., & Zhang, J., 1996, Structure and Distribution of Growth Faults in the Northern Gulf of Mexico: OCS: vol. 46, p. 63-77.

126
Watkins, J. S., Bryant, W. R., Buffler, R. T., staff and students of the Gulf of Mexico Structural and Stratigraphic Synthesis Project, Department of Geology, Texas A&M, 1996, Structural Framework Map of the Northern Gulf of Mexico: Gulf Coast Association of Geological Societies: vol. 46, p. 95-98.
Welper O. J., 2000, The Use of Coherence Cube Visualization in Picking Seismic Processing Parameters and Post Processing Hybrid Visualization Products: American Association of Petroleum Geologists, vol 50, p. 485-494.
White, R., & Simm, R., 2003, Tutorial: Good practice in well ties: First Break: vol. 21, p. 75-83.
Withjack, M. O. & Scheiner C., 1982, Fault Patterns Associated with Domes – An
Experimental and Analytical Study: American Association of Petroleum Geologists Bulletin: vol. 66 no. 3, p. 302-316.
Witrock, R. B., A. R. Friedmann, J. J. Galluzzo, L. D. Nixon, P. J. Post, and K. M. Ross, 2003, Biostratigraphic chart of the Gulf of Mexico offshore region, Jurassic to Quaternary, U. S. Department of the Interior, Minerals Management Service, New Orleans.
Worall, D.M. & Snelson, S., 1989, Evolution of the northern Gulf of Mexico, with emphasis on Cenozoic growth faulting: The Geology of North America: vol. A, pg. 97-136.
Vail, P. R., & Wornardt, W. Jr., 1991, An Integrated Approach to Exploration and
Development in the 90s: Well Log-Seismic Sequence Stratigraphy Analysis: Transactions GCAGS/GCSSEPM: vol. 61, p. 630-650.
Yin, H. & Groshong, R. H., Jr., 2003, Geometric Properties of Active Piercement
Structures: Geologic Insights from 3-D Kinematic Models: Transactions GCAGS/GCSSEPM, vol. 53, p. 888-900.
Zeng, H., & Hentz, T. F., 2004, High-Frequency sequence stratigraphy from seismic sedimentology: Applied to Miocene, Vermilion Block 50, Tiger Shoal area, offshore Louisiana: American Association of Petroleum Geologists: vol. 88, no. 2, p. 153-174.