a test of pre-emptiveness in speech...
TRANSCRIPT

Bregman, Williams, Walker & Ahad Page 1 of 64
A test of pre-emptiveness in speech perception
Albert S. Bregman, Sheila M. Williams
Bruce N. Walker, and Pierre Ahad
McGill University
Short title: Pre-emptiveness in speech perception
Contact author:
Albert S. Bregman
Dept. of Psychology
McGill University
1205 Doctor Penfield Avenue
Montreal, Quebec
Canada H3A 1B1
E-mail: [email protected]
Phone #1: +1 (514) 398-6103
Phone #2: +1 (514) 484-2592
Facsimile: +1 (514) 398-4896
1

Bregman, Williams, Walker & Ahad Page 2 of 64
Acknowledgements.
The authors acknowledge support from the Natural Sciences and Engineering Research
Council of Canada.
Authors Note
BNW carried out Experiment 1 as an undergraduate thesis in 1993, and is now at the
School of Psychology and College of Computing, Georgia Institute of Technology,
Atlanta Georgia. SMW carried Experiments 2 and 3 as a postdoctoral fellow in 1997, and
now resides in Doncaster, UK. PA was technical supervisor, and is now at Digivox in
Montreal, Quebec, Canada. ASB did the overall design, supervised the research, and
wrote the present paper.
2

Bregman, Williams, Walker & Ahad Page 3 of 64
Abstract
The “pre-emptiveness” hypothesis claims that perceiving a cluster of acoustic
components (a complex) as a word is carried out by a specialized “speech module”,
which suppresses the perception of the components as independent sounds. This
hypothesis was explored using single words of sine-wave speech (SWS) as the
complexes. Separate groups of adults were trained to identify these stimuli as either
words (Speech group), the cartoon sound of an event in a virtual reality video game
(Event group), or as individual acoustic components to be counted (Analytic group).
Then their ability to detect one of the sine-wave components of the signal was evaluated
immediately after they identified the cluster according to their training (on the same trial).
The pre-emptiveness hypothesis implies that the Speech group (whose speech module
would have pre-empted some stimulus energy in perceiving the words) would be less
able than the Event group to hear out the sine-wave components. However, their actual
mean performances were almost identical. The Analytic group performed slightly (non-
significantly) better. A control experiment ruled out the possibility that the lack of a
deficit for the Speech group resulted from their not actually hearing the complexes as
speech. No support for pre-emptiveness was found.
3
Bregman, Williams, Walker & Ahad Page 4 of 64
Liberman and others have argued that there are at least two different auditory systems,
one that deals with the phonetic identities of speech sounds, and another that builds a
general-purpose representation of the locations and properties of the distinct non-speech
sounds present in the input (Liberman, 1982; Liberman, Isenberg, & Rakerd, 1981;
Liberman & Mattingly, 1985; Mattingly & Liberman, 1988; Whalen & Liberman, 1987,
1996). Their views are as follows: These two auditory systems are considered to be
separate brain modules. Liberman & Mattingly (1989) drew a distinction between
special purpose “closed modules” and general purpose “open modules”. They argued
that phonetic perception was provided by a closed module, specialising in the
representation of speech, whereas the process that computes the pitch or timbre of a
sound is an open module which is capable of representing any type of sound. Because
open and closed modules receive the same input, if there were no priority system,
listeners would always hear the outcome of both types of analysis. As well as hearing a
phonetic signal they would hear the separate hisses, buzzes and so on, upon which it was
based. To prevent this, the phonetic module is considered to have priority. It “pre-
empts” the information that it uses, taking what it needs, and making it unavailable to
non-speech analyses (Whalen & Liberman, 1987,1996; also Mattingly & Liberman,
1988). This process is called the “pre-emptiveness” of the phonetic module. The portion
of the sensory information left over after phonetic analysis is passed to the non-speech
system(s). However, this happens only when the intensities of some components are in
excess of what is required for the speech percept. This makes it possible for speech and
concurrent non-speech sounds to be heard at the same time when they are truly present
together.
4
Bregman, Williams, Walker & Ahad Page 5 of 64
Whalen and Liberman (1987) illustrated this pre-emptiveness. They synthesised CV
syllables as clusters of time-varying formants, and succeeded in creating tokens of /ga/
and /da/ that were different only in the initial transition of the third formant. Then they
replaced this formant transition, in each syllable, with a sinusoidal tone glide, a “cartoon”
of the original formant transition. The intensity of this glide was varied, over a series of
stimuli, in both the /da/ and /ga/ syllables. At lower intensities, the correct syllable (/da/
or /ga/) was heard, demonstrating that the tonal glide was being used by the phonetic
module. However, above an intensity referred to as the “duplexity threshold”, both the
correct syllable and an additional non-speech chirp (derived from the tonal glide) were
heard. The researchers argued that at these higher intensities, the phonetic module had
more than the amount of energy that it needed from the glide to construct the phonetic
percept and the excess was passed on to the non-speech system, where it was interpreted
as a chirp. This was viewed as a direct demonstration of the pre-emptiveness of the
phonetic module. However, Bailey and Herrmann (1993) failed to find any range of
intensities of the tonal glide in which the syllable percepts were reliably distinguished but
the transition component could not be identified. They concluded that the findings of
Whalen and Liberman (1987) provided no real evidence that a “speech module” took
precedence over other auditory perceptual processes.
The purpose of the research reported here was to test the pre-emptiveness hypothesis by
comparing the ability of listeners to hear out the components of speech vs. non-speech
sounds. In comparing the processing of speech and non-speech signals, the choice of
stimuli is crucial. If these signals differ acoustically, this acoustic difference, rather than
the speech vs. non-speech status of the stimuli, may be responsible for the results.
5

Bregman, Williams, Walker & Ahad Page 6 of 64
Therefore the speech and non-speech signals must be identical. This goal can be
achieved by employing, as a stimulus, a cartoon of speech that the listeners may or may
not interpret as speech, depending on their biases. We chose what has been called “sine-
wave-analogue speech”, or simply “sine wave speech” (SWS) (Bailey, Dorman, &
Summerfield, 1977; Remez, Rubin, Pisoni, & Carrell, 1981; Remez, Rubin, Berns, Pardo,
& Lang, 1994). We manipulated the listeners’ bias as to whether they heard the signal as
speech or non-speech.
It is known that it is possible to bias listeners toward hearing the SWS signal as speech
by telling them that it is a form of speech. For example, Liebenthal, Binder, Piorkowski,
& Remez (2003) required participants to ‘hear out” one of the tonal components of a
SWS stimulus either when they were still naïve to the fact that it could be interpreted as
speech or after they were given instruction and practice in hearing it as speech. They
reported that this training interfered with the ability to hear out one of its tonal
components. This seemed to support the idea that the speech module is “pre-emptive’.
However, while the use of the same participants in the two conditions permitted more
powerful statistical tests to be used in this experiment, it confounded the bias of the
participants with the order of conditions, since the speech-biased condition always
followed the naïve condition. Furthermore, the interference was found in only the first
of two blocks of trials that the participants received after their training in hearing the
tonal complexes as speech. In the second block, the participants were able to perform as
well as they had before the speech-biasing training, and they performed as well or better
when the stimuli were SWS words as when they were tone-glide clusters that were
impossible to interpret as words (presumably the hypothesised phonetic module would be
6

Bregman, Williams, Walker & Ahad Page 7 of 64
evoked in the former stimuli but not the latter). So except for the noted difference, the
results expected by a pre-emptiveness theory were not found. It is possible – even likely
– that the results that Liebenthal et al (2003), found in the first block after speech
training, were not caused by an obligatory activity of a phonetic module in which it ‘used
up” some of the information, but was due to a distraction of the participants by their
attempts to take “peeks” at the phonetic identity of the stimulus while concurrently trying
to hear out an embedded component. In this manner, the training may have turned the
task into two concurrent ones for the participants, but by the second block of trials they
were able to overcome this distraction.
Also relevant to the pre-emptiveness hypothesis are the results of Experiment 2, Task 2,
of a paper by Remez, Pardo, Piorkowski, and Rubin (2001). In one of their conditions,
the participants first heard a tone that was (or was not) identical to the second formant
(F2) of a SWS word, and then heard a cluster of concurrent tonal glides (referred to as a
complex) that formed the full SWS word They were asked (a) whether the tone was a
component of the complex, and at the same time, (b) had to decide whether the complex
was the same word as a printed word. The participants were told that neither task was
considered primary and they could make the two responses in any order. This last
instruction would have permitted the participants to switch between one of Liberman’s
proposed modes and the other (phonetic versus general-purpose auditory) to make the
two judgements required by the task. Even if pre-emptiveness held true in natural
listening situations, in the highly structured repetitive task of an experiment, the
participants ― in order to satisfy the demands of the task ― might be able to first orient
themselves to the signal as a cluster of tonal glides, judge the presence of the target glide,
7

Bregman, Williams, Walker & Ahad Page 8 of 64
then switch modes for the more automatic task of perceiving it as a speech sound, using
the decaying echoic image of the sound to make the decision about the SWS word’s
identity. This strategy would allow them to escape the effects of pre-emptiveness (if they
existed). If this sort of switching between task orientations is possible, the experiment by
Remez, Pardo, Piorkowski, and Rubin (2001) cannot be taken as a decisive test of pre-
emptiveness.
Also, in their experiment, some participants started off by not hearing the complexes as
words. Later they were encouraged to hear them as words. The aspect of the results that
concerns us here is that the participants who heard the complex as a word could tell
whether the F2 tone was present in the complex slightly better than those who did not
hear it as a word, contrary to what would be predicted by the “pre-emptiveness” theory,
and also contrary to the conclusions of Liebenthal et al. (2003). However, the
researchers never tested statistically whether performance was different in these two
conditions. They only established that each was significantly different from zero. They
concluded that the results indicated the separate nature of “early phonetic and auditory
organization,” despite the fact that there was nothing in the results to indicate that they
were due to “early” organization.
Like the experiments of Remez et al. (2001) and Liebenthal et al. (2003), the present
experiments presented an SWS stimulus and asked participants to hear out one of its tonal
components. However, we took a different approach to the comparison of speech and
non-speech biases toward the stimulus. Following a method first used by Bregman and
Walker (1995), we divided the participants into three separate groups. All groups
received training in how to interpret the SWS stimuli, but each received a different type
8
Bregman, Williams, Walker & Ahad Page 9 of 64
of training. One group was trained to hear them as words (Word group). a second group
(Event group), as sounds made by events in a virtual-reality game, each of which
abstractly represented a particular type of real event (such as “spaceship door closing”).
This type of training caused participants to interpret the SWS tone-complex holistically,
i.e., as a unit, just as the Word group did, but a unit that was not verbal. A third group
was trained to hear the stimuli as clusters of tones by presenting the component tones
sequentially and requiring the listeners to count them (Analytic group). So in all cases,
the participants received training. In the Event and Analytic groups, we were able to
successfully train listeners not to hear the SWS signal as speech – despite repeated
presentations – by training them to hear it as something else.
In all three groups, participants were asked to make a judgement that tested their
awareness of the sinusoidal components of the stimuli. If the pre-emptiveness
hypothesis is correct, and if phoneme perception is a closed module, those who are biased
to hear the signal as speech should be less able to judge the properties of its individual
components.
The present study differed from that of Remez, Pardo, Piorkowski, and Rubin (2001) in
another important respect: we took some care to discourage the strategy of switching
between task orientations (or “modes”) during the trial (Experiment 1 and 2) and even to
make it virtually impossible (Experiment 3).
Outline of the three experiments. The stimuli were nine sine-wave words. In
Experiment 1, using a between-groups design, we presented these signals to listeners in
the Word group, the Event group, and the Analytic group. Our test for pre-emptiveness
required two tasks to be carried out on each trial: (1) to first identify the tone complex
9

Bregman, Williams, Walker & Ahad Page 10 of 64
according to the condition on which they had been trained (“identification task”), and (2)
to compare one of the sinusoidal components of the sound to a standard, and judge
whether it was the same or different (“component-matching task”). Apart from requiring
a fixed order of report, this task was similar to that employed by Remez et al (2001). The
goal was to determine the effects, if any, on the component-matching task, of listening
either in (a) a holistic speech orientation, (b) a holistic non-speech orientation, or (c) an
analytic non-speech orientation.
Although it turned out that, in Experiment 1, there were no significant differences in the
ability of the three training groups to identify one of the sinusoidal components of the
tone complex, it might be argued that the training had been ineffective. Specifically, one
might argue that the speech versus non-speech training in the first experiment actually
produced the learning of simple rote associations between the sounds and the names
assigned to them, so that the Word training did not really evoke the hypothesised
phonetic module. In Experiment 2, to show that the training actually caused the
participants to interpret the properties of the signals as appropriate for a particular word
or a non-speech event, we trained them to learn either inappropriate associations between
sounds and labels (e.g., the label “shook” to the SWS derived from the word “coop”) or
appropriate ones (e.g., the label “shook” to the SWS derived from the same word) and
found inappropriate labels to be much harder to learn than appropriate ones. This
experiment also showed that the speech training yielded positive transfer to hearing new
signals as speech .
Our final experiment had two goals: (a) It tried to minimise mode-switching (if any)
within a single dual-task trial; (b) It also investigated pre-emptiveness by varying the
10

Bregman, Williams, Walker & Ahad Page 11 of 64
levels of intensity of the to-be-matched component, in order to find some level at which
the energy left behind, after the phonetic module took what it needed, would be
sufficiently low that there would be a detectable level of interference with the
component-matching task.
Experiment 1
Three conditions of training. In this experiment we used a dual task: identification of the
sound as a whole and identification of one of the sinusoidal components of the complex
tone.. First we trained listeners to hear the ambiguous sine-wave speech sounds (which
we will call “complexes”) in three different ways: (1) The Word group was told that the
complexes were computer-synthesised words. They might sound strange, but, if the
participants listened closely, it would be possible to hear the words. (2) The Event group
was told that the complexes were really computer-generated versions of real-world
sounds that were to be used in a virtual-reality game. They might sound strange, and
indeed the participants might never have heard some of the sounds in reality, but if they
listened carefully, they would be able to hear the events that the sounds represented. (3)
The Analytic group was asked to count the components present in each sound.
The test for pre-emptiveness was a component-matching task; the participants decided
whether the second lowest sinusoidal component of the complex (“ the “target
component”) was exactly the same as a comparison sound. When it was not, it was the
second lowest component from one of the other complexes in the set.
Derivation of the virtual-reality event labels. Most naive listeners just hear the
complexes as groups of sounds. However, after practice, the stimuli can be heard as
events such as water dripping into a sink, or a spaceship door opening. The non-speech
11

Bregman, Williams, Walker & Ahad Page 12 of 64
descriptions for the complexes were derived, in pilot testing, by presenting them to
listeners naive to SWS. They were asked to say what they heard, regardless of how
abstract it seemed. A number of these descriptions were then presented to other listeners
to select the best ones. In this way, descriptive labels for all of the complexes were
chosen (see Table 1). What was essential to our purpose was not realism (i.e. that the
participant hear the exact sound that the description portrayed), but rather that the
participant could be biased to hear the sound as some united whole other than a speech
sound. Later, it was clear from debriefing of the participants after the experiment that
this manipulation was successful.
(Table 1 about here) Stimuli. The stimuli were a set of nine monosyllabic SWS words created by Robert
Remez and Philip Rubin who kindly supplied the parameters for them to be resynthesized
in our laboratory. These were the same sounds used by Remez et al. (2001).
Prediction. Assume that there is, indeed, a special speech module, such as that proposed
by Mattingly and Liberman (1988) that both (a) unites the component sounds of a speech
signal into a higher-order entity, and (b) pre-empts the signal and passes along, to the
general-purpose, auditory scene-analysis (ASA) system, only the acoustic information
that remains after speech-relevant information is removed. If this assumption is correct,
then when participants are biased to hear the sine-wave complex as words, their ASA
systems should be left with less information than the ASA systems of listeners who are
biased to hear them as non-words or as clusters of tones. Therefore the word-biased
listeners should have greater difficulty matching an embedded component to a standard
tone.
12

Bregman, Williams, Walker & Ahad Page 13 of 64
Method
Participants. Fifty-two paid participants (20 male, 32 female) with a mean age of 21.9
years and a range of 18 to 41 years, were recruited. All read and signed a Consent Form,
authorized by McGill University ethics procedures, which indicated the nature of the
experiment; they were told they could quit the experiment at any time (this ethics
procedure was carried out for all experiments reported in this paper). No participant
reported any hearing impediment. All indicated English as their best language. Results
from two were excluded due to procedural errors.
Stimuli. In each of the tasks, the sounds that the participants heard were identical for all
participants. They consisted of nine tonal complexes, which were the SWS versions of
nine words: beak, sill, wed, pass, lark, rust, jaw, shook, and coop. Each consisted of
three or four gliding sinusoidal tones, each replicating the frequency trajectory of one of
the lower numbered formants of the corresponding word. There were two kinds of
stimulus sounds: (a) clusters of tonal glides (called “tone complexes”), each consisting of
the three or four components constituting a SWS word, and (b) a single sinusoidal
component (a varying tone), to be used as a standard, consisting of the second “formant”
of one of the SWS words.
There were also nine visual stimuli, used in Block 2 of trials (described below), simple
shapes made up from asterisk characters, and presented on a computer video display.
All stimuli are described in Table 1. Each column pertains to one of the SWS complexes.
Working from top to bottom, each column shows: (a) the identification number of the
tonal complex, (b) the visual shape linked to that complex in Block 2, (c) the
interpretation of the complex as a word, (d) its identity as a game event, (e) the number of
13

Bregman, Williams, Walker & Ahad Page 14 of 64
components in it. Words in adjacent columns contain vowels that are only one step away
from one another in a similarity measure defined by Remez, Pardo, and Rubin (1992).
The vowels in words that are two columns apart are less similar, and so on. Columns 1 to
9 are to be read as a circular sequence, with Columns 9 and 1 considered to be adjacent.
Procedure. The experiment was divided into five blocks, each consisting of a different
training procedure or test (details given below). For the first two blocks the three groups
were not yet differentiated by training, and the same tasks were given to all participants.
They included a component-matching test alone and then the same task concurrently
with a visual task (see details below). The concurrent visual and component-matching
task of Block 2 was designed to assess individual differences among participants in their
ability to carry out two recognition tasks concurrently. The scores from this task were
used as covariates to increase the power of the statistical tests so that they approached the
efficiency of a within-subjects design.. Block 3 introduced the main independent
variable, a training procedure to bias the participant to interpret the complex in one of the
three ways described earlier. Block 4 verified that the training was successful, and
topped it up if necessary. Finally, Block 5 was the criterion task. It was designed to do
two things: (a) to induce the listening bias that the individual listeners had been trained
on, and (b) to concurrently test their ability to perceptually isolate the target component
of the tone-complex (the “component-matching task”).
Any test blocks that involved component-matching proceeded as follows: On each trial,
the participant saw a message and then heard two sounds, first a single component (the
Tone) then a full sine-wave speech sound (the complex). This was followed by the
14
Bregman, Williams, Walker & Ahad Page 15 of 64
question(s) to be answered. One question was whether the Tone was one of the
components of the complex.
The Tone was always the second-lowest component of one of the complexes. On half the
trials, where the correct answer was Yes, the Tone was from the complex presented right
after it. On the other half of the trials, where the correct answer was No, the Tone was
selected from a different complex, namely the one in the immediately adjacent column of
Table 1. For half the participants, this was the column one step to the right, and for the
other half, the column one step to the left (recall that the table is considered to be
circular).
Prior to Block 3, all of the participants had heard the same stimuli, and had performed the
same tasks. They had not yet been biased to hear the complexes as speech, or as anything
other than a collection of strange sounds. The participants had been randomly assigned
to one of the three different bias conditions (Speech, Event or Analytic), which were
implemented in Blocks 3 and 4. These blocks were the training session and verification
of training that were used for setting the listening mode desired in the final block.
Procedural details.
Block 1. Tone-segregation task alone. The purpose of this task was to provide a baseline
for performance and to familiarise the participants with the task. The only response
requested was whether the Tone was present in the complex. This block of trials
consisted of 4 presentations of each of 18 conditions: 9 complexes and 2 relationships of
Tone to Complex (Match or No-Match), giving 72 trials in all, in sequences randomised
independently for each participant and each task block. The timing was as follows:
15

Bregman, Williams, Walker & Ahad Page 16 of 64
Visual warning (message), 2000 ms delay, play Tone, wait 1000 ms, play Complex, wait
500 ms, ask question and get response, wait 700 ms before next trial.
Block 2. Tone-Segregation concurrent with visual recognition. On each trial, one visual
stimulus, selected from the set of 9 shown in Table 1, was presented on the screen. Then
a Tone, followed by a Complex was presented. Then, after 1500 ms, a second shape
selected from Table 1 appeared, and the participant had to answer two questions. The
first asked whether the second shape matched the first; the second asked whether the
Tone was present in the Complex. This second question was the same as in Block 1. The
timing was as follows: Display visual shape, wait 2000 ms, play Tone, wait 1000 ms,
play Complex, blank the display, wait 1500 ms, display the second shape, ask two
questions and collect the responses during a period of 3000 ms, wait 500 ms before next
trial. There were 108 trials in this task block.
Block 3. Practice in one of three biasing conditions (Speech, Event, or Analytic). For the
training block, a participant in the Speech condition, for example, would see the phrase,
“The word BEAK”, on the screen and then hear Complex 1 (the sine-wave sound derived
from the word “beak”) twice. Similarly, a participant in the Event condition would see
“The sound of a Volkswagen Horn” and then hear Complex 1 twice. Participants in the
Analytic condition would see the phrase, “A complex with 3 components”. Then they
would hear each of the components of the sine-wave complex played individually, in
ascending order, and then the whole complex twice. In this way, the whole set of 9
sounds was presented three times in different random orders for each participant.
The timing was: description of the complex on the screen (e.g., a word such as “beak”, or
a phrase such as “fireman sliding down a pole”), wait 2000 ms, play complex, wait 1500
16

Bregman, Williams, Walker & Ahad Page 17 of 64
ms, play complex again, wait 1000 ms. For the Analytic (component-counting)
condition, the timing was: describe, on the screen, the number of components, wait 1500
ms, play component 1, wait 500 ms, play component 2 ... (etc. for 3 or 4 components),
wait 1000 ms, play Complex, wait 1250 ms, play Complex again, wait 1500 ms before
next trial.
Block 4. Verification of effects of training. This block was included both to verify the
effects of the training and to top it up, if necessary. On each trial, the participants would
see one of the labels used in the training and then hear either the matching sound or the
one from the column preceding or following it in Table 1. The participants were then
asked whether the printed word or description matched the sound. Feedback was given
about the correctness of the answer. If the response was incorrect, feedback included the
correct information about the sound heard. An incorrect response inserted an additional
trial for that particular sound, in a random position in the sequence of trials. The session
continued until the participant had 3 trials in a row correct for each of the sounds.
Timing: Description (possibly false) of the Complex on the screen, wait 2000 ms, play
Complex, wait 500 ms, question, response and feedback, wait 2000 ms before next trial.
Block 5. Tone-Segregation concurrent with Identification of Complex. The final block
was the dual-task test of pre-emptiveness. This time, the participants saw one of the
labels used in the training, as in Block 4, and then heard a Tone followed by a Complex.
Then they were asked two questions: (a) The first (intended to set the listening mode)
asked whether the printed label matched the sound. (b) After collecting the response, this
was followed by a question concerning whether the Tone was present in the complex.
Timing: Description (possibly false) of Complex on screen, wait 2000 ms, play Tone,
17

Bregman, Williams, Walker & Ahad Page 18 of 64
wait 1000 ms, play Complex, wait 2000 ms, and two questions asked and responses
collected (2000 ms), wait 500 ms before next trial.
There were 108 trials in this block: The variables were (a) True and False pairings
between the description and each sound, (b) Match and No-Match conditions between the
Tone and the complex. Thus there were 9*2*2 conditions, each repeated 3 times.
Post-experimental debriefing. During debriefing, the participants were all asked
specifically what they had heard. This was to ensure that none of the participants except
those in the Speech group had heard the complexes as words. This was planned as a
criterion for participant data rejection, but no data had to be excluded by this criterion. In
addition, the participants were asked if any of the sounds (words) were more difficult to
match to the descriptions given.
Apparatus. The sounds, were digitally synthesised and presented via 16-bit D/A
converters. An output sampling rate of 20 kHz was used for all signals. The sounds were
presented diotically over headphones in a single-wall test chamber. Sound pressure
levels were measured at a fast A weighting using a flat-plate coupler. The individual
components of the complex ranged from 55 to 67 dBA, with the full complexes ranging
from 68 to 72 dBA. Visual material (messages and pictures) were presented via the
computer screen, and participant responses were registered by entering numbers via the
keyboard.
Results
Summary statistics for the five tasks, collapsed over the three bias groups, are given in
Table 2. Relative to the unaccompanied Tone-Matching task of Block 1, there was no
18

Bregman, Williams, Walker & Ahad Page 19 of 64
effect of the concurrent visual task of Block 2, but an apparently detrimental effect of the
concurrent auditory Complex-identification task of Block 5 (compare underlined
numbers in boldface). Note that chance performance is 50 percent.
(Table 2 about here)
Manova Tests
Non-concurrent vs. concurrent with visual. A within-subjects MANOVA showed that
the slight improvement in mean performance on the Tone-Matching task of Block 2
(concurrent with the visual task), relative to the same task performed alone in Block 1,
81% vs. 79%, was not significant, F (1,38) = 3.40, p = 0.069. If real, the improvement
was probably due to practice, partially cancelled, perhaps, by a small amount of
interference from the concurrent visual task. It is evident from Table 2, that the visual
task itself was extremely easy, performance reaching almost 100 per cent. It is not
surprising that the concurrent Tone-Matching task did not show any adverse effects.
Concurrent with visual vs. concurrent with complex recognition. There was a significant
drop in performance from the Tone-Matching Task of Block 2 (concurrent with the
Visual task) to the Tone-Matching task of Block 5 (concurrent with the task of
recognising the complex): 81% vs. 76%, F (1,38) = 22.4, p < .001). This is evidence that
the participants were unable to simply ignore the concurrent auditory complex-
recognition task when carrying out the Tone-matching.
Results from the tone-matching tasks. Percentage correct responses from the tone-
matching tasks and from the concurrent identification tasks of Blocks 2 (pre-bias) and 5
19
Bregman, Williams, Walker & Ahad Page 20 of 64
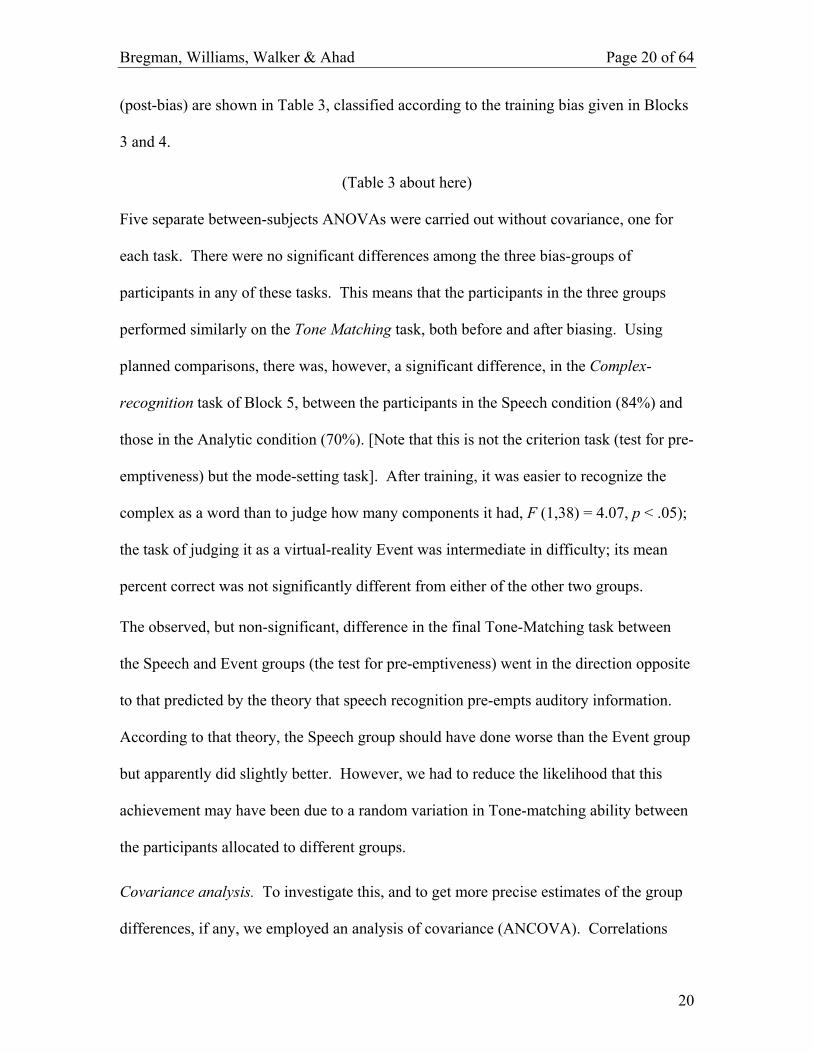
(post-bias) are shown in Table 3, classified according to the training bias given in Blocks
3 and 4.
(Table 3 about here) Five separate between-subjects ANOVAs were carried out without covariance, one for
each task. There were no significant differences among the three bias-groups of
participants in any of these tasks. This means that the participants in the three groups
performed similarly on the Tone Matching task, both before and after biasing. Using
planned comparisons, there was, however, a significant difference, in the Complex-
recognition task of Block 5, between the participants in the Speech condition (84%) and
those in the Analytic condition (70%). [Note that this is not the criterion task (test for pre-
emptiveness) but the mode-setting task]. After training, it was easier to recognize the
complex as a word than to judge how many components it had, F (1,38) = 4.07, p < .05);
the task of judging it as a virtual-reality Event was intermediate in difficulty; its mean
percent correct was not significantly different from either of the other two groups.
The observed, but non-significant, difference in the final Tone-Matching task between
the Speech and Event groups (the test for pre-emptiveness) went in the direction opposite
to that predicted by the theory that speech recognition pre-empts auditory information.
According to that theory, the Speech group should have done worse than the Event group
but apparently did slightly better. However, we had to reduce the likelihood that this
achievement may have been due to a random variation in Tone-matching ability between
the participants allocated to different groups.
Covariance analysis. To investigate this, and to get more precise estimates of the group
differences, if any, we employed an analysis of covariance (ANCOVA). Correlations
20

Bregman, Williams, Walker & Ahad Page 21 of 64
among all five tasks were computed, indicating, that as expected, all three Tone-
Matching tasks were highly correlated. The Tone-Matching task concurrent with the
Visual Identification task (Block 2) had the highest correlation to the Tone-Matching
concurrent with the Complex-Identification task of Block 5 (the pre-emptiveness test),
r = .63. Accordingly we used the Tone-Matching of Block 2 as the covariate for further
analysing the Tone-Matching of Block 5.
The ANCOVA showed no significant effect of Bias condition, F (2,46) = 0.38, p =.68.
The values of the percent-correct means, adjusted by ANCOVA, are even closer together
than before adjustment (Speech = 75, Event = 75, Analytic = 77). The adjusted Speech
and Event group means differ only in the 4th significant digit. The standard errors of
these adjusted means were very small (about 1.7). If we estimate the confidence interval
for the difference between the means at the 5 per cent level, it is 4.7. We also performed
a planned comparison between the Analytic group and the combined means of the two
“holistic-recognition” groups. There was no significant difference, F (1, 47) = 0.81,
p=.37).
Differences based on acoustic properties of the signals. While the biasing of participants
had a very weak or non-existent effect on the Tone-Matching task, the variation in
acoustic properties of the signals had a much larger one. Table 4 shows the mean rounded
percent correct scores for each complex (identified by its “word” label) for the three bias
groups in the three Tone-Matching tasks. The mean scores, shown in the last column,
range from 70 to 96 per cent, averaged across all three Tone-Matching tasks. This is
much larger than the range of 74 to 77 for the three bias groups (uncorrected by
covariance) in the final Tone-Matching task. Clearly some stimuli were much more
21

Bregman, Williams, Walker & Ahad Page 22 of 64
distinctive than others.
(Table 4 about here)
Discussion of Experiment 1
All three groups of participants performed significantly better on the Tone-Matching task
when it was concurrent with a simple Visual Matching task (block 2), than when
concurrent with the identification of the complex (block 5) even though the later task had
the advantage over the earlier in providing more practice. Clearly the identification of
the complex does use up some resources, but this does not appear to reflect a pre-emption
of acoustic information due to speech processing, as all the groups were affected
similarly. Both groups of participants who were encouraged to hear the complex as a
composite whole were affected to the same extent, although only one group (the Speech
group) heard the sounds as speech. The slight advantage in the criterion task for the
third group (Analytic bias) was not significant and was probably due to the fact that they
were the only group to be exposed to a decomposition of the complex (they heard each
component separately as well as hearing the complexes) during training.
Despite the significant detrimental effect of the concurrent task, it is of course possible
that we somehow failed to bias our participants, the interference being simply due to the
cognitive overhead of the concurrent task. It has been proposed by a critic that the
biasing task merely constituted a paired-associate learning task in which participants
learned an association between a sound and a label rather than actually perceiving the
sound as a word or a VR event. A second potential criticism involves the possibility
that, at the presentation intensities used in this experiment, the speech module needed a
very small proportion of the signal, leaving a more than adequate residue for auditory
22
Bregman, Williams, Walker & Ahad Page 23 of 64
processing in the Tone-Matching task. We address both these possibilities and others in
Experiments 2 and 3.
Experiment 2
Test for paired-associate learning. In Experiment 1, in order to equate the training
methods between the three bias groups as closely as possible, the same procedure had
been applied to all of them. This involved presenting a message on the computer screen,
together with a presentation of the sound. It is conceivable that this technique allowed
participants to learn the sounds, for all three conditions, using paired-associate learning.
If this were the case, then the lack of differences in pattern-matching might be
attributable to the application of the same (paired-associate) listening mode.
In Experiment 2, we tested this hypothesis in two ways: (a) by comparing the same
training with control training, which involved mapping the same words or descriptions to
the same set of sounds, but in an “inappropriate” way, breaking the meaningful link
between the sound and its label, and (b) by testing the transferability of the training onto
a new set of stimuli. Since paired-associate learning affects only the members of the
individual pairs that have been learned, and ones closely resembling them, any
performance on a new task involving different sounds would involve the ability to learn
new associations rather than to generalise the previously learned associations to new
sounds and labels without further training. So, under the hypothesis of paired-associate
learning, there should be no difference between the participants in the different “bias”
groups on their identification of new speech-like sounds on a later task, when no
reference was made by the experimenter to any connection with the earlier training.
23
Bregman, Williams, Walker & Ahad Page 24 of 64
For this experiment we replicated the training method of Experiment 1, extending the
minimum number of trials in the verification task to 54 in order to more accurately
evaluate the relative ease of learning between the different conditions.
Transferability. We introduced a new set of nine “vowel” sounds, each formed of three
steady-state frequency components, that required “holistic” interpretation before they
could be identified (Only the composite three-tone sounds were unique. Any individual
pure-tone component was the same as a component in at least one other of the sounds).
These sounds had component relationships similar to vowel formants although not
necessarily the same as in any of the SWS complexes used in the training.
Method
Participants. There were 114 paid participants, mostly young adults, recruited from a
university population. Data from 16 participants were rejected due to English not being
their first language or as a result of technical problems,. As a result, 98 participants, 34
males and 64 females, provided data for analysis.
(Table 5 about here) Stimuli. The sine-wave signals used for the training and the training verification phases
of label learning were the ones used in the previous experiment (9 complexes and a set of
isolated second-formant tonal glides, the latter to be used as the standards in the
component-matching task). Nine new sounds were created to measure transferability of
learning (see Table 5). Each was the sine-wave analogue for a single vowel, and was
composed of 3 steady-state pure tones whose frequencies were based on the formant
frequencies for the steady states of pure vowels (Peterson & Barney, 1952). A set of
24

Bregman, Williams, Walker & Ahad Page 25 of 64
single-tone “formants” to be used in a tone-matching task with the “vowel” stimuli was
also synthesised. The actual frequency values for the formants of the “vowel” stimuli
were adjusted so that we could work with a limited set of frequencies, in order to ensure
that no component in any complex would be unique. The complexes fell within the range
62-68 dBA. The three-tone complexes were each generated with the same simple
amplitude envelope, having a duration of 200 ms, including 50 ms onset and offset
ramps, and were 64-65 dBA in intensity.
Procedure. The procedure for training and testing each participant was controlled by a
computer and all instructions were presented to the participants via the computer screen.
The experimental session was divided into five blocks. Following some blocks, the
experimenter asked questions and the responses were recorded on the participant data
sheet. After verification of training initial learning of labels for the SWS complexes, all
participants then received another 3 tasks based on the vowel-sound set. These tasks
were the same for every participant, although the order of the two final tasks was
reversed for half of them. There was no pre-test.
The initial training and verification formed an inherent part of the experiment. No
practice examples or demonstrations of the sounds were given prior to the formal
training. Training varied according to condition (Speech, Event or Analytic) and
subcondition (the Appropriate vs. Inappropriate mapping between sounds and labels).
The experiment took around 50 minutes per participant, and was completed in a single
session.
Block 1. Practice in one of three (Speech/ Event/ Analytic) biasing conditions. Each
participant underwent only one of 9 forms of training. The main conditions, were the 3
25

Bregman, Williams, Walker & Ahad Page 26 of 64
different types of training (Speech/Event/Analytic) used in the previous experiment. The
subconditions for each type of training were 3 alternative mappings of labels to sounds.
The Appropriate subcondition used the mapping employed in Experiment 1. There were
two Inappropriate subconditions (Inappropriate-1 and Inappropriate-2), involving two
alternative mappings, which presented each sound together with the label of the sound
that (a) either preceded it by 2 columns in Table 1 or (b) that followed it by 2 columns.
For training, a label (either a word, a description of an event, or a number of components
in the sound, according to condition) was displayed on the screen while a sound was
played (twice), as in Experiment 1. Trials on the nine sounds were repeated three times
in random order. In the component-counting training, the individual components were
played as well as the composite sound.
The complexes were those of Experiment 1 and were about 300 ms in duration. The
steps in the Speech and Event trials were: Display description of complex (word label or
description such as “fireman sliding down a pole”), play auditory complex (twice), all
separated by short silences . For the Analytic (Component-counting)trials: Display
sentence describing number of components, wait 1500 ms, play Component 1, wait 500
ms, play Component 2 ... etc. for 3 or 4 components, play the complex twice, all
separated by short silences
Block 2. Verification of effects of training. During verification, each sound was presented
either with the label given during training or another label from the same set. As in
Experiment 1, we used two possibilities for the false choices, to reduce potential bias
from any one particularly distinctive alternative. For half the participants, the false
26
Bregman, Williams, Walker & Ahad Page 27 of 64
alternative labels were from the previous column of Table 1, and for the other
participants from the following column of the table.
Verification trials consisted of a message and a sound. The participant indicated whether
the displayed message matched the sound, on each trial. Feedback was given and extra
trials were added for conditions that gave rise to errors. The trials continued to a criterion
at least 3 trials in a row correct of Yes responses and 3 in a row correct of No responses
for each sound, to a maximum of 80 trials (minimum 54 trials). Trial events were:
Display description (possibly false) of the complex, play complex, ask question, record
response and give feedback, all separated by short silences.
Block 3. Tone matching within vowel complexes. For all participants, Block 3 was a
Tone-matching single task performed on the new set of three-tone “vowel” sounds. On
each trial, a warning was displayed, then the participant heard a single tone followed by a
three-tone complex and the only response requested was whether the Tone was present in
the complex. The single tone was either the centre tone from the three-tone complex or a
tone at the nearest frequency level below that, that had been used in a different complex.
The block of trials consisted of 3 presentations of each of 18 conditions (9 complexes and
2 relationships of Tone to complex – Match or No-Match). The individual components
(i.e. the target Tone or complex), regardless of individual length, were each in digital
sound files of 200 ms in duration. Trial events were Display warning message, play tone,
play complex, question and response, all separated by short silences.
Blocks 4 & 5. Vowel-identity matching and Component-counting tasks. All participants
did both a Vowel-identity matching task and a Component-counting task. Each of these
were single tasks, requiring only one response after hearing each sound. However half
27

Bregman, Williams, Walker & Ahad Page 28 of 64
the participants did Vowel-identity matching before Component-counting and half
afterwards.
On each trial of the Vowel-identity matching task, participants heard a single three-tone
complex and were asked to select by number, from a list of nine words, the word whose
vowel sound most closely matched the sound heard. The words used, in order, were:
beet, bit, bet, bat, bob, bought, book, boot, and but (see Table 5). Trial events were:
Present warning message, play complex, question and response, all separated by short
silences..
On each trial of the Component-counting task, participants heard a single sound and were
asked to indicate, using a number from one to seven, how many components they heard.
Each sound was, in fact, either one of the three-tone complexes used in the tone-matching
of block 3 and the vowel-matching task or a single (centre) component from one of these
complexes. Trial events were: Display warning, play complex, question and response, all
separated by short silences.
Design. We used two different mappings of inappropriate interpretations to complexes
so as to reduce the potential bias arising if any one pairing was especially distinctive. We
tested only half as many participants in these two groups as in the appropriate-pairing
groups, as the former were to be combined in the statistical analysis. The variables were
3 Conditions (Speech, Event, and Analytic (component counting), 3 subconditions
(appropriate pairing and two types of inappropriate pairing), 2 choices for false
alternatives (A or B) and 2 categories for Sex (M or F). Thus our design had 3*3*2*2 =
36 cells and involved 9 independent groups of participants.
All the sounds presented to each participant were the same as for any other participant
28

Bregman, Williams, Walker & Ahad Page 29 of 64
with only two exceptions. The first is that participants in condition 3, the Analytic
Training Condition, all heard the individual components of the sounds in ascending order,
preceding the presentation of each composite sound. This happened in the practice task
only. All other tasks, including the verification task, involved only the same complete
complexes as were presented to other participants. The second exception is that, within
the verification task (as in the previous experiment), participants continued until a
criterion was reached or to a maximum of 80 trials. This means that participants giving
incorrect responses had extra trials and therefore heard the sounds more times during this
task. However this was necessary in order to bring all participants to the same level or
performance. All other tasks had a predefined fixed number of trials.
Apparatus. This was the same as in Experiment 1 except that sound pressure levels were
measured at a fast B (rather than fast A) weighting. Levels are given under the Stimuli
heading.
Results
Mean percentage correct responses from each of the tasks, listed according to the training
bias given in Blocks 1-2, are given in Table 6. The conditions Speech-1, Virtual-Reality
Event-1, and Analytic-1 involve Appropriate pairings of labels with sounds.
(Table 6 about here)
A MANOVA was performed for the variables Bias (the training category) and
Appropriateness (appropriate vs. inappropriate mappings between labels and sounds) for
the four tasks shown in the columns of Table 6. The significance was evaluated using
Wilk’s Lambda (W-λ), and reported here in the form “W-λ(df,df) = <value>, p <value>”.
29

Bregman, Williams, Walker & Ahad Page 30 of 64
The effects of Bias were highly significant, W-λ(8,172) = 0.484, p < .0001, as were the
effects of Appropriateness, W-λ(8,172) = 0.469, p < .0001. There was also a significant
interaction between the two variables, W-λ(16,263) = 0.742, p = .0498. The Universal
Test for dependent variables showed that this interaction was solely due to the Label
Verification Task where F(4,89) = 3.892, p = .006; for all other tasks, F (4,89) < 1.24, p
>.30.
Planned comparisons were performed, using a general MANOVA, on the data from all 4
tasks, to test the effects of appropriate versus inappropriate mapping of training sounds to
labels within each of the training conditions (speech / virtual reality event / component-
counting). For each task, this involved a single comparison of 1 appropriate against 2
inappropriate mappings, within each bias condition. The results of these tests are given
in Table 7.
(Table 7 about here)
Table 7 shows that the verification scores (for correct association of labels with sounds)
for participants given the Appropriate mappings were significantly better than for those
given Inappropriate mappings (the percent-correct means are shown in Table 6). This
held for each of the three training conditions, shown in different rows of the table
(p < .0001, in every case), leading to rejection of the hypothesis that training simply
produced paired-associate learning of labels to sounds.
For the vowel-matching task performed by the participants who had received Speech
training (Table 7, top row), the score for the group given the appropriate mappings was
also significantly better, at the 5% level, than that for participants given inappropriate
mappings, providing further evidence that participants with appropriate mappings had
30

Bregman, Williams, Walker & Ahad Page 31 of 64
learned to hear the complexes as words, and showing that this continued to have an
effect throughout the experiment, not just for the stimuli on which this difference in
training had been given.
The tone-matching task was given in order to further investigate the transferability of the
learning effects and these results confirmed the distinction found between the synthetic
(word/event) and analytic (component-counting) training that had been found in
Experiment 1.
(Table 8 about here)
Table 8 shows the results of planned comparisons testing the effects of the nature of the
training (Speech, Event, or Component Counting) on the various tasks, looking only at
the groups that had appropriate training (Groups 1, 4, and 7 of Table 6). For each task,
this involved three comparisons: Speech vs. Event; Speech vs. Component-counting; and
Event vs. Component-counting; therefore a Bonferroni adjustment was made on
probability values. As in Experiment 1, we see that the Speech and Event groups differed
in how well they performed in matching labels to the stimuli (Speech labelling was
easier). Furthermore they differed in how well they could match the vowel-derived
complexes to vowels (the Speech-trained group did better than the Event-trained group).
However, their earlier training had no effect on either matching a tonal component or
counting components in the vowel-derived complex, as would be expected if speech
recognition did not remove energy from ASA processes.
The vowel-matching task showed a significant advantage of the earlier Speech training
over the other two forms of training, demonstrating, again, that the learning acquired
during the biasing training of Block 1 (to hear the sounds as speech) transferred to the
31

Bregman, Williams, Walker & Ahad Page 32 of 64
vowel task. This, again argues against a purely paired-associate interpretation of the
effects of our training procedure.
Referring back to Table 7, the tone-matching task showed an almost significant effect of
Appropriate vs. Inappropriate training in the Component-counting group (p = .068). A
complementary result is shown in Table 8, in which we look only at the conditions in
which Appropriate training (Speech-1, Event-1, and Analytic-1). We observe that the
Tone-matching task was performed better by participants trained in Component-counting
than those trained in either Speech or Event interpretations, though the latter comparison
was non-significant (by a hair) after Bonferroni correction. We also observe that in
Table 6, when we consider only Appropriate training (boldfaced values), the pattern of
Verification scores in the three training groups (percent correct scores of 96.99 for
Speech training, 86.93 for Event training, and 68.75 for Analytic training) replicated the
results of Experiment 1. These differences were all statistically significant (Table 8).
Words appear to be easier to attribute to the sounds than are virtual-reality events, and the
latter easier to attribute than the number of components.
Discussion of Experiment 2
We found that the natural mappings of the sounds to words or other descriptions
contributed both to ease of learning and to the transferability of that learning to later
tasks. Also, labels for the sounds were easier to learn when they were appropriate (the
actual words from which the sine-tone complexes had been derived, or the Event labels
spontaneously given in the pilot testing, or the actual number of tones in the complex)
than when inappropriate. We also found that within the speech group, only the subgroup
32

Bregman, Williams, Walker & Ahad Page 33 of 64
that had been asked to associate the appropriate words with their sine-wave formant
analogues during training demonstrated an advantage in recognising a new set of sine-
wave vowels later. In the case of component counting, participants who were given
appropriate labels (component counts) for the complexes learned them more easily than
participants given inappropriate labels, and this difference in training also may have
affected tone-matching in new materials (the vowels), a task that (like the training)
required the participants to “hear out” a tone in a complex (although the results were not
statistically significant). However, appropriate training in component counting did not
confer an advantage in judging the number of components in new materials.
We conclude that our training method induced different perceptual biases, facilitating
phonetic/phonemic perception for the Speech group only. The results also suggested
some difference between synthetic listening (holistic) and analytic listening i.e., between
training on speech or virtual-reality events and training on component counting: as
before, only the synthetic vs. analytic distinction appeared to have an effect on the tone-
matching task.
The hypothesis that paired-association was the principle mechanism for learning the
labels for the sounds was contradicted by the relative ease of learning appropriate
mappings vs. inappropriate ones, and the relative advantages they gave to the participants
in interpreting groups of steady components as vowels.
Experiment 3
Mode switching. In Experiment 1. the Speech group did not perform significantly worse
than the Event group on component-matching when this task was concurrent with the
33
Bregman, Williams, Walker & Ahad Page 34 of 64
identification of the complex. In Experiment 3, one of our goals was to rule our mode-
switching as an explanation. It is conceivable that the speech mode does indeed exist and
is pre-emptive of the signal, but that our subjects were able to escape its effects by mode-
switching. Even though a question about the identity of the whole had to be answered
before the question about the component, the participants might have carried out the
following strategy: first they performed the harder task of component-matching (in the
ASA mode), then switched to the Speech mode and using the decaying echoic memory of
the complex to perform the much easier task of matching a label to the complex as a
whole. Hence they were not yet in the speech mode when they did the component-
matching task.
The possibility of rapid mode-switching may seem incompatible with some of the
evidence for pre-emptiveness. In testing the pre-emptiveness hypothesis, Whalen and
Liberman (1987) concluded that it required more energy for a sine wave component –
substituted for a formant, in a synthetic syllable – to be heard as a separate entity than
was required to identify the syllable itself, and that this was due to interference from a
speech specific mode or phonetic module. This happened even though no speech
interpretation was demanded concurrently from the participant. Had subjects been able
to switch modes at will, this interference would not have been obtained.
However, it might be argued by proponents of the pre-emptiveness hypothesis that the
mode-switching problem could have arisen in the present research and not in that of
Whalen and Liberman (1987). Our participants, because of their over-training on both
tasks, might have found it possible to perform one of them, and then rapidly switch
modes in order to perform the other. If some strategy permitted the component matching
34

Bregman, Williams, Walker & Ahad Page 35 of 64
task to be performed first, before entering the speech mode, the pre-emptiveness could be
avoided. This argument suggests that there might be pre-emptiveness whenever listeners
are actually in the speech mode, but that one can learn strategies for avoiding the speech
mode. We refer to this as the hypothesis of “momentary pre-emptiveness.”
Note that this criticism makes the pre-emptiveness of the speech mode a rather transitory
phenomenon. If one can switch in and out of the speech mode at will, the pre-
emptiveness of this mode would not preclude other analyses of the signal, except at those
instants in which one was actually in the mode. The hypothesis of momentary pre-
emptiveness has an implication for another claim: Liberman and Mattingly (1989) argued
that phonetic perception is a distinct module in auditory perception. However, if the
speech mode is not compulsory whenever a speech signal (or a signal that has recently
been interpreted as speech) is present, then it lacks one of the properties of a module as
specified by Fodor (1983), namely obligatory operation. So if momentary pre-
emptiveness exists, either phonetic perception is a module, but of a type different from
those specified by Fodor, or else phonetic perception is not a module at all. It was our
goal, in Experiment 3, regardless of its implications for theory, to prevent mode-
switching to the extent possible.
The duplexity threshold. Another explanation that a critic might offer for the lack of
difference between the Speech and Event groups in the component-matching task of
Experiment 1 is related to the intensity of the sounds. The stimuli may always have far
exceeded the minimum amplitude level for recognising the words, so that even if
phonetic recognition pre-empted some of the energy of the components that defined the
35

Bregman, Williams, Walker & Ahad Page 36 of 64
word, there was always plenty left for the component-matching task. To address this
criticism, in Experiment 3 we varied the amplitude levels of the tone complexes
Component-matching by a holistic strategy. It was possible that, in Experiment1, an
isolated component (used as the “target” in the Component-Matching Task) bore some
similarity to the global properties of the natural word from which it was drawn and was
therefore identified as “in the complex” . The complex might not have to be analysed into
its components at all. If so, pre-emptiveness would not show itself. To address this
problem, we did two things: (1) we chose, as the "false" alternative, the temporal reversal
of the component contained in the complex with which it was being compared. This
ensured that both correct and false alternatives were in the same frequency range and had
the same frequency and amplitude changes (although not in the same temporal order).
(2) To eliminate the use of “naturalness” as a cue for rejecting the false alternative, we
also included, as complexes, versions of the original SWS complexes in which the
second components were reversed. These altered complexes did not sound as close to the
natural-speech words on which the SWS complexes were based as did the original SWS
complexes. However, their only function on any given trial was to elicit the (presumed)
speech mode, and they did not sound so distorted as to make them unacceptable as
versions of speech. For such complexes, the “false” choice of component (the one not in
the complex presented on that trial), was actually taken from the original unaltered SWS
complex. The inclusion of these complexes ensured that an accurate component match
had to be based on the component itself and not its similarity to the natural word from
which it was abstracted.
36
Bregman, Williams, Walker & Ahad Page 37 of 64
In order to encourage participants to make their judgements about the identity of the
whole complex (by putting themselves in the speech mode) before they heard the isolated
component, they were told they would first see a label [a word, an event description or a
number of components, according to condition] then would hear two sounds [the
complex followed by a proposed component]. They were told that they were first to
answer, as quickly as possible, whether the label was the right one for that complex, and
that this response would be timed. Then they would be asked whether the final sound
had appeared in the just-heard complex. We hoped to prevent the participant from
performing the component-matching task before entering the trained recognition mode.
Presenting the proposed component after the complex made the component-matching
task much harder, but most participants still managed to perform at above-chance levels.
Amplitude levels. For the reasons described earlier, we varied the amplitude level of the
to-be-matched component to see whether the lack of difference in component-matching
ability between Speech and Event participants would persist at lower amplitude levels. It
was not practical for us to present the second component of the complexes above and
below a specific duplexity threshold for each SWS word for each participant. With nine
different sounds, and 48 subjects, it would have taken a prohibitive number of repetitions
to find the presumed 432 duplexity thresholds. Furthermore we could not merely choose
amplitudes below the duplexity thresholds calculated from research on duplex perception
(e.g., Whalen and Liberman, 1987, 1996; Bailey and Herrmann, 1993) for three reasons:
(1) There is a disagreement in the threshold results of these two groups of experimenters;
(2) Our stimuli involved discrimination of the second-formant component whereas the
former experiments required discrimination of the third formant; (3) We were using full
37

Bregman, Williams, Walker & Ahad Page 38 of 64
SWS words, not the single syllables used in the cited experiments. Accordingly, we
compared the component-matching success of the Speech and Event groups at three
different amplitude levels, +2dB, -2dB and -6dB relative to the amplitude level of the
other components. It is not necessary to look for an all-or-nothing effect such that
sinusoidal components below the duplexity threshold are totally inaudible, and those
above it are totally audible. Pre-emptiveness, if it exists, should simply use up energy,
making it progressively harder to detect the properties of individual components, and this
interference should become more serious as the energy of the to-be-matched component
becomes lower.
To improve the power of our analyses, we used, as a covariate, the level at which
participants could do component-matching while performing a concurrent identification
task that was visual, rather than auditory; the component was presented after the
complex, as in our main task. The sounds we used for the covariate task, and also for
training were not the nine SWS complexes but were simplified complexes (see
description under the Stimuli heading).
Training. We repeated the Speech and Event training of the first and second experiments
on two new groups of participants. The Analytic group was omitted in this experiment.
The testing was administered in two sessions.
Method
Participants. We tested 48 new participants, young adults recruited from a university
population. None reported any hearing impairment and all reported that their first
language was English. Data from 8 were discarded due to not meeting our criteria or to
38
Bregman, Williams, Walker & Ahad Page 39 of 64
technical problems, and were replaced until 40 acceptable data sets had been obtained (14
males and 26 females).
Apparatus and Stimuli. The apparatus was the same as that used in Experiment 1. The
training and testing of each participant was controlled by computer.
The sine-wave-speech complexes used for training (Speech or Event) were the same as
those used in Experiments 1 & 2. A set of new sine-wave-speech complexes were
created, which had the second formant component in either the forward or reverse
direction and at four different amplitude levels with respect to the other components of
the same complex. There were also two sets of simplified complexes, used for the first
two tasks. In these, the highest and lowest tones (first and third “formants” of the SWS
complexes) were replaced by steady-state tones. The frequency of each was at the
average between start and stop frequency of the SWS component that it replaced. The
second component of each SWS complex was replaced by a simple glide from the start
frequency to the stop frequency of the “formant” that it replaced. These components
matched the durations of the components they replaced. The corresponding isolated F2
components in both forward and reverse directions were also created.
Procedure. The training and testing of each participant was controlled by computer.
After the last block in the second session, the experimenter asked several questions and
the responses were recorded on the participant’s data sheet.
Session #1 (Blocks 1-5)
Block 1: Training on component matching. Training (block of 36 trials) was given in
39

Bregman, Williams, Walker & Ahad Page 40 of 64
stages, beginning with component-matching on the simplified complexes described
above. If less than 25 correct matches occurred on the first attempt, the block was
repeated a second time.. Each trial consisted of a warning, the complex, then a single
component, then the question, all separated by silences.
Block 2: Pre-test. A dual visual identification and an auditory component-matching task
was given (72 trials). It was used both as a covariate for the statistical analysis and as a
pre-test, qualifying the participant to go further in the experiment. It also acted as
training for the later dual tasks. It consisted of the same visual pattern-matching task
used in Experiment 1, concurrent with the component-matching task already learned in
Block 1. The participant was encouraged to respond to the visual task without waiting
for the sounds to be completed, and was told that the visual task would be timed. Each
trial consisted of a warning, the complex, then a single component, then a question about
identity of the visual stimulus, then a question about the auditory component, all
separated by silences. Scores of less than 60 out of a maximum of 72 for visual-pattern
identification or less than 40 out of 72 for component-matching were employed to screen
out participants. Of the 8 who had to be discarded in this experiment, 4 were discarded
on this criterion.
Block 3: Identification Training. The training for identification of the complexes (Speech
or Event), and verification of the participant’s performance on this identification. On the
training trials, a message (a printed word or a description of a virtual-reality event,
depending on the condition) was displayed on the screen while the corresponding
complex was played twice. There were 3 blocks of trials, each containing all 9
40

Bregman, Williams, Walker & Ahad Page 41 of 64
complexes in a random order.
Block 4: Verification and Feedback. Verification trials presented a complex and a
proposed label for it on the screen. The participant indicated whether the description
matched the sound. Feedback was given and extra trials were added for conditions
giving rise to errors. The trials continued until at least 2-in-a-row correct matches and 2-
in-a-row correct non-matches were obtained for each sound, for a minimum of 36 and a
maximum of 80 trials.
Block 5: Practice for Criterion Task (test for pre-emptiveness). One block of the dual
task, consisting of sound identification and component-matching, was given. To make it
easier, the to-be-matched component was always 6dB above the level of the other
components. Each trial began with a proposed label for the complex, a 1500-ms delay
before the message was cleared and a further 500-ms delay before the complex was
presented. This is followed by a 1000-ms silence and then the isolated component. After
a 100-ms wait the participants were asked to confirm the identity of the first sound (a
response which they believed to be timed). Immediately after the response, a second
question – whether the component had been in the complex) was displayed and the
participant responded.
Session #2 (Blocks 6-9)
Block 6: Verification and Feedback. At the start of the second session, the verification
task of Block 4 was repeated as a reminder of the complexes to be identified and to top
up the learning of any that had been forgotten.
41

Bregman, Williams, Walker & Ahad Page 42 of 64
Blocks 7-9: Criterion Task (test for pre-emptiveness). These blocks consisted of the dual
task in which both complex identification and component matching were performed on
each trial, with the “target” component at +2dB, -2dB or -6dB relative to the level of the
other components. Intensities were randomised within blocks. The timing was the same
as Block 5 in Session #1.
Results
The single component-matching and training verification tasks were used for practice
only and were not analysed. Other data are reported below.
(Table 9 about here)
The results for identification of the complexes as holistic words or events are shown in
Table 9. Mean scores (out of 8) are shown for each stimulus, amplitude and training
condition, for each of the dual tasks. “ID#” indicates the stimulus number as shown in
Table 1. The left-hand half of Table 9 gives the results for the Speech group. The column
labelled Visual (Cov.) gives the identification scores for the visual stimuli used in the
“covariate” task. The next 4 columns show the results for the holistic identification in the
training condition (where the second component was 6dB more intense than the others)
and in the test conditions, labelled according to the amplitude level of the target
component that occurred in the concurrent task. The next column shows the mean of the
previous 4 columns. The right-hand half of the table shows the same results for the Event
group.
Table 10 shows the component-matching scores (test of pre-emptiveness) for the same set
of conditions as in Table 9,
42

Bregman, Williams, Walker & Ahad Page 43 of 64
(Table 10 about here)
Statistical Analysis: MANOVA and ANCOVA
A preliminary view of the effects was given by a 5-way analysis using the general
MANOVA model: Training (Speech vs. Event), Sex (M vs. F), Tasks (Identification of
the whole vs. Component-matching), Complexes (1-9), and Attenuation levels (1-4),.
This analysis excludes the results for the visual stimuli.
By far the greatest effect was the one distinguishing the two concurrent Tasks.
Identification of the whole was much better than Component-matching. as can be easily
seen by comparing the data in Tables 9 and 10. The grand mean for the Component-
identification task of Blocks 7-9, was 7.54 for the Identification task but only 4.78 for
the Component-matching task (maximum possible score of 8.00 in both cases). These
were significantly different, F(1,36) = 894, p < .001. There was no significant effect of
Sex, F(1,36) = .001, p = 0.92; so this variable was dropped from subsequent analyses.
Other results from the 5-way ANOVA were shown equally clearly in subsequent 3-way
analyses; so no further use was made of the 5-way results. Since pre-emptiveness was
expected to influence the Component-matching task, but not the Identification of the
complex as a whole, further analyses were performed on the data for each task
independently.
A 3-way analysis using MANOVA, applied to the Identification responses (Table 9)
indicated significant contributions of training, F(1,38) = 9.25, p = 0.004, with the Speech
group finding it somewhat easier to remember the labels than the Event group did. Again
there was very highly significant effect of complexes, F(8,304) = 5.21, p << 0.001, some
complexes being easier to label than others. There was also a significant interaction
43

Bregman, Williams, Walker & Ahad Page 44 of 64
between training condition (Speech vs. Event) and Complexes, F(8,304) = 4.25, p <
0.001, reflecting the observation that the superiority of the Speech group to the Event
group was greater for some complexes than for others.
A 3-way analysis using MANOVA, applied to the Component-Matching responses
(Table 10) indicated a very highly significant effect for Complexes, F(8,304) = 29.9, p
<< 0.001, which reflected the fact that the complexes differed considerably in how easy it
was to hear out the target component. There was also a just-significant interaction
between Complexes and Attenuation, F(16,608) = 1.67, p = 0.047; attenuation made it
harder to hear out the component of some complexes more than others. The difference
between the Speech and Event groups, 4.83 versus 4.78 (the result that tested the pre-
emptiveness hypothesis) did not approach significance, F(1,38) = 0.88, p = .357.
Correlation between covariate and criterion tasks. In order to reduce the chance that our
failure to find the difference between the Speech group and the Event group was not due
to unaccounted-for variance in the data, we used an analysis of covariance (ANCOVA) to
account for additional variance. Correlations were computed between the scores of the
component matching tasks of Block 2 (the covariate task: component-matching
concurrent with visual identification) and of Blocks 7-9 (the criterion task: component-
matching concurrent with Word or Event labelling). these were computed separately for
each level of the second component relative to the others: for +2dB, r =.58 (p < .001), for
-2dB, r =.61 (p < .001), and for -6dB, r =.51 (p ≅ .001). These levels of correlation were
deemed to be high enough to justify an analysis of covariance.
44

Bregman, Williams, Walker & Ahad Page 45 of 64
The unadjusted Speech and Event means are shown in the first two columns of Table 11.
They are not significantly different. For the +2 dB component, F(1,38) = 0.54, p = .47;
for the -2dB component, F(1,38) = 0.32, p = .58; for the -6dB component, F(1,38 = 1.60,
p = .21.
(Table 11 about here) The Speech and Event means, adjusted by covariance, are shown in the last two columns
of Table 11. The ANCOVA, like the MANOVA, showed no significant differences
between the Speech and Event conditions at any amplitude level of the target component:
For the +2dB components, F(1,37) = 1.34, p = .25, for the -2dB components, F(1,37) =
0.99, p = .33, and for the -6dB components, F(1,37) = 2.91, p = .09. Furthermore, the
unadjusted and covariance-adjusted means in Table 11 show that, contrary to the pre-
emptiveness hypothesis, which predicts that it would be easier to identify components in
the Event condition, it was actually slightly easier in the Speech condition (though not
significantly so).
Discussion of Experiment 3
We found no evidence to suggest that participants in the Speech group were
disadvantaged, relative to the Event group, in being able to identify components of the
sine-wave complex at any relative amplitude of the target component. While listeners
who heard the complexes as speech identified them better than those who heard them as
virtual-reality events, the performance of the two groups on the component-recognition
task was not significantly different. It is very likely that our range of relative amplitudes
bracketed the presumed duplexity threshold. The only relative amplitude at which the
Speech group did worse than the Event group was in the initial training with the target
45
Bregman, Williams, Walker & Ahad Page 46 of 64
component at +6dB (4.88 vs. 4.91 in last row of Table 10). This is surely well above any
presumed duplexity threshold. Thus there was no evidence to support the hypothesis that
listening to the sounds as speech invokes pre-emptive auditory processes any more than
listening to the sounds as other auditory events (both conditions in the current experiment
were synthetic, rather than analytic, listening tasks). The slight advantage for the Speech
group, if real, might have been due to the lower attention required for the identification
task, perhaps due to a lifetime of experience in phonetic discriminations or to memories
for the words in their natural form.
Liebenthal, Binder, Piorkowski, Remez (2003) found that experience in attending to the
phonetic properties of the sinusoids interfered with their component-matching task (but
only in early trials) and was accompanied by a decreased auditory cortex activation for
SWS replicas of words but not for acoustically matched non-phonetic items. They
argued that this favoured a pre-emptiveness interpretation, but their finding is not
replicated in our Experiments 1 and 3. If anything, the listeners who interpreted the
sounds as speech did a tiny bit better in our study. The difference in the two studies may
be a question of the nature of the condition to which the “speech” condition was
compared. In the Liebenthal et al study, the control condition (“naïve”) did not receive
any sort of training, while the “speech” condition (the same subjects, later in the
experiment) did. The training may have focussed the attention of the participants on
recognition, stealing attentional resources from mental representation of the components;
the authors themselves mention this possibility. In the present study, the main control
group, the Event group, received training on the recognition of the stimulus as a whole,
and was therefore better matched to the Speech group. In fact the non-speech
46
Bregman, Williams, Walker & Ahad Page 47 of 64
participants in the Liebenthal et al study were more like our Analytic group in
Experiment 1 (component-counting), which did slightly, though not significantly, better
than our other two groups.
However, even if this difference between our Analytic and the Speech groups had been
significant, it would have been inappropriate to evoke the concept of a module to explain
the results. If the inferiority of the Speech group to the Component-counting group were
taken to represent the pre-emptive effects of a speech module, then the inferiority of the
Event group to the Component-counting group would also have be taken as due to the
pre-emptive effects of a brain module – in this case, a hypothetical module that handles
the identification of all natural events except speech. It is much more plausible to believe
that the training in listening for individual components given to this group might simply
have given them a very slight advantage in isolating the individual tonal glides in the
complexes.
General discussion
Remez, Rubin, Berns, Pardo & Lang (1994) have argued that SWS could never be
integrated by presently-known principles of auditory scene analysis (ASA). The
components are not harmonically related and their frequencies and amplitudes do not
necessarily change in parallel. How then are they ever integrated? The only other
option, as they see it, is a speech module. However, we can identify three factors
contributing to integration: (1) Even in sine-wave speech, there are ASA cues that bind
the components together perceptually, namely synchrony of onset and offset of
components and co-variations in amplitude, when amplitude is allowed to vary (Barker &
47

Bregman, Williams, Walker & Ahad Page 48 of 64
Cooke, 1999). (2) Integration may be increased by top-down recognition. For example,
the native speakers of a click language integrate the clicks into the speech stream as
consonants, whereas a foreign listener hears the clicks as standing out from the speech
stream. (3) Integration may be the default and only after information builds up over time
does the auditory system partition the evidence into concurrent streams (Bregman 1990,
pp. 332-334). Therefore it is segregation, rather than integration, that requires
explanation.
This cannot be the whole story about SWS, because the components can still be heard out
by a listener even though they may be integrated for purposes of phonetic interpretation,.
We believe that this dual-level perception will be found in audition whenever the bottom-
up evidence is not overwhelming for either integration or segregation (Bregman, 1991b).
In such cases the non-decisive groupings of components will permit the schema-driven
top-down recognition processes to yield a holistic interpretation. This happens in SWS,
where both a speech interpretation and lower-level components can be heard. It also
happens in visual displays: If a large drawing of a triangle is built out of tiny circles,
both the circles and the triangle are perceived. In visual art, faces in which the features
are actually different sorts of vegetables or other objects have been painted, for example
by the Milanese artist Giuseppe Arcimboldo in the late sixteenth century (Bompiani,
1987; Bregman, 1990, p. 471). We see the individual vegetables, and the whole face.
The present experiments provide evidence that when we exploit the ambiguous nature of
sine-wave-speech by inducing speech and non-speech biases for the same signals, these
biases have no effect on the hearing out of acoustic components. We have to consider,
then, the possibility that giving any sort of holistic interpretation to a complex suppresses
48

Bregman, Williams, Walker & Ahad Page 49 of 64
the perception of its acoustic components. This explanation is not implied by the results
of Experiment 1. While the Event group did hear out the components less well than the
Analytic group (74% vs. 77%), this difference was not significant.
In discussing Experiment 1, we presented the criticism that our dual tasks may not have
forced our listeners to perform the component-matching while still in speech-perception
mode. However, in our final experiment we adjusted the task to make it very difficult to
avoid being in the speech mode before judging a individual component. This was a much
stricter level of control than in the experiment by Whalen & Liberman (1987), where the
difficulty in hearing a weak sine-wave component continued to occur – due to a
hypothesized pre-emption of energy by the speech module – even when the phonetic and
auditory tasks were presented in separate blocks. Therefore, it seems unlikely that rapid
mode-switching under the control of the listener would block this pre-emption just in our
particular case, especially given the design of Experiment 3, where the holistic
interpretation was emphasised and the target component was not given until after the
whole complex.
Our conclusion is that hearing SWS complexes as speech does not pre-empt the
information about auditory characteristics in any way different from hearing the same
sounds as other environmental events (if at all). In this conclusion we agree with that of
Remez, Pardo, Piorkowski, and Rubin (2001) that the same signal can be interpreted as
speech or as clusters of components. However, we do not agree that these two kinds of
percepts necessarily imply the existence of separate “modules”. For example, we would
not want to say that when a person sees, at the same time, both an array of tiny circles
and the large triangle whose outline they form, this duality of perception (or what Alvin
49

Bregman, Williams, Walker & Ahad Page 50 of 64
Liberman called “triplex perception”) implies the existence of two distinct modules. Two
distinct (and perhaps parallel) recognition processes, yes; but not two separate
“modules”.
If the phonetic module, proposed by Liberman and his colleagues, really is a module in
the sense defined by Fodor (1983), its operation should be “mandatory” and “cognitively
impenetrable” (i.e., not able to be influenced by the cognitive processes, schemas, or
biases of the listener). Contrary to these requirements, not all listeners spontaneously hear
SWS as speech; so speech perception is not always mandatory. Furthermore, it is possible
to train listeners either to hear or not hear a signal as speech; so speech perception is not
cognitively impenetrable. We conclude that phonetic perception is not a module in
Fodor’s sense. The apparent obligatory perception of the normal speech waveform as
speech probably comes from the endless training provided by our experience from
earliest infancy. It is just as obligatory for literate people to recognize a canonical
version of a character from their writing system, or a picture of their country’s flag.
Other unpublished results from our laboratory argue against cognitive impenetrability of
speech perception. In a series of steps, we gradually morphed SWS into normal-
sounding speech. We did so by passing normal speech through a temporally varying set
of filters, each of which tracked one of the first four formants. With very narrow
bandwidths, the signal closely resembled SWS. With wider bandwidths it came to
resemble the original speech signal. If we created a series of steps with gradually
increasing bandwidth, listeners who heard the whole series, beginning with SWS,
required a higher bandwidth to correctly interpret the speech than listeners who started
later in the series of widening bandwidths. It appears that early incorrect hypotheses
50

Bregman, Williams, Walker & Ahad Page 51 of 64
interfered with the interpretation of the signal. This effect of hypotheses shows that
Fodor’s requirement that modules be cognitively impenetrable is not always found in
speech perception. Our guess is that impenetrability is found when the signal over-
determines the phonetic interpretation. This is an instance of a more general rule. When
any causal factor pushes any behavioural or mental response to its maximum value, a
second factor will appear to have no effect. To see the effect of a second cause (e.g., , a
top-down factor), one has to weaken the effect of the first one (e.g., the bottom-up
influence on the interpretation). This can be done with sine-wave speech or other
degraded depictions of familiar objects, such as very simplified drawings.
51

Bregman, Williams, Walker & Ahad Page 52 of 64
References
Bailey, P.J., Dorman, M.F., Summerfield, A.Q. (1977). Identification of sine-wave
analogs of CV syllables in speech and non-speech modes. Journal of the Acoustical
Society of America, 61, S(A).
Bailey, P. J., & Herrmann, P., (1993). A re-examination of duplex perception evoked by
intensity differences, Perception & Psychophysics, 54(1), 20-32.
Barker, J., & Cooke, M. (1999). Is the sine-wave cocktail party worth attending? Speech
communication, 27, 159-174.
Bompiani (Publisher). (1987) Effeto Arcimboldo. Milan: Bompiani.
Bregman, A.S. (1990). Auditory scene analysis: the perceptual organization of sound.
Cambridge, Mass.: The MIT Press, (Paperback 1994).
Bregman, A.S. (1991). The compositional process in perception and cognition with
applications to speech perception. In I.G. Mattingly & M. Studdert-Kennedy (Eds.),
Modularity and the motor theory of speech perception. Hillsdale, N.J.: Erlbaum.
Bregman, A.S., and Walker, B.N. (1995). Does the "speech mode" pre-empt acoustic
components? Unpublished manuscript, Dept. of Psychology, McGill University.
Fodor, J.A. (1983). The modularity of mind. Cambridge, Mass.: The MIT Press.
Liberman, A. M. (1982). On finding that speech is special. American Psychologist, 37(2),
148-167. (Reprinted In: Handbook of Cognitive Neuroscience, Ed. by Michael S.
Gazzaniga. (1984) Plenum Press: New York, 169-197.)
52
Bregman, Williams, Walker & Ahad Page 53 of 64
Liberman, A. M., Isenberg, D., & Rakerd, B. (1981). Duplex perception of cues for stop
consonants, Perception & Psychophysics, 30, 133-143.
Liberman, A. M., & Mattingly, I. G. (1985). The motor theory of speech perception
revisited, Cognition, 21, 1-36.
Liberman, A.M., & Mattingly, I.G. (1989). A specialization for speech perception.
Science, 243, 489-494.
Liebenthal, E., Binder, J.R, Piorkowski, R.L., & Remez, R.E. (2003). Short-term
reorganization of auditory analysis induced by phonetic experience. Journal of
Cognitive Neuroscience. 15(4), 549-558.
Mattingly, I. G. & Liberman, A. M. (1988). Specialized perceiving systems for speech
and other biologically significant sounds. In G. M. Edelman, W. E. Gall, and W. M.
Cowan (Eds.). Functions of the Auditory System. (pp. 775-793). New York: Wiley.
Peterson, G. E., & Barney, H. L., 1952, Controls used in the study of the vowels, Journal
of the Acoustical society of America, 24 (2), 175-184.
Remez, R.E., Pardo, J.S., Piorkowski, R.L.. & Rubin, P.E. (2001). On the bistability of
sine wave analogues of speech. Psychological Science. 12(1), 24-29.
Remez, R.E., Pardo, J.S., & Rubin, P.E.(1992). Making the auditory scene with speech.
Unpublished Manuscript, New York, Barnard College.
Remez, R. E., Rubin, P. E., Berns, S. M., Pardo, J. S. & Lang, J. M. (1994). On the
Perceptual Organization of Speech, Perception & Psychophysics, 101(1), 129-156.
53
Bregman, Williams, Walker & Ahad Page 54 of 64
Remez, R. E., Rubin, P. E., Pisoni, D. B., & Carrell, T. D. (1981). Speech perception
without traditional speech cues, Science, 212, 947-950.
Whalen, D. H., & Liberman, A. M. (1987). Speech perception takes precedence over
nonspeech perception, Science, 237, 169-171.
Whalen, D. H., & Liberman, A. M. (1996). Limits on phonetic integration in duplex
perception, Perception & Psychophysics, 58(6), 857-870.
54

Bregman, Williams, Walker & Ahad Page 55 of 64
Tables
Table 1. Sequential ordering, visual shapes, words, virtual-reality events and number of components associated with each tonal complex.
ID of complex
1 2 3 4 5 6 7 8 9
Visual Stimuli
* * *
* * * * * *
* * * *
* *
* * * * * ** ** * * *
* * *
* * ** *
*
* * * * * * * * * *
* * * * *
* * * * *
* * * * * * * * *
** **
*** ** *** ** **
** * *
* ** *
**
SWS words
beak sill wed pass lark rust jaw shook coop
Virtual-reality event
Volks-wagen horn
slide space-ship door
opening
baby seal
fire-man
sliding down pole
sound system’s feedback
squee-gee
wiping glass
dripping faucet
stone falling
into water
Number of tonal compo-nents
3 4 3 4 3 4 3 3 3
55

Bregman, Williams, Walker & Ahad Page 56 of 64
Table 2. Overall mean performance (percent correct) on the five tasks,. Block numbers are shown in parenthesis. Tasks in the same block are concurrent.
Task (Block number) N Min. Max. MEAN Std. Err. Std. Dev.
Tone-matching Task (1) 50 61 89 80 0.9 6.6
Visual Task (2) 50 88 100 98 0.4 2.7
Tone-matching Task (2) 50 56 92 81 1.1 7.4
Complex-Identification Task (5)
50 43 99 76 2.5 18.0
Tone-matching Task (5) 50 51 89 76 1.3 9.1
56

Bregman, Williams, Walker & Ahad Page 57 of 64
Table 3. Results. Mean percent correct performance on five tasks (unadjusted by covariance). The block numbers are in parenthesis. Tasks within the same block are concurrent. Note that chance performance is 50 percent.
Bias Group
N Tone Matching (1)
Visual Matching (2)
Tone Matching (2)
Complex Identifica-
tion (5)
Tone Matching (5)
Speech 18 77 98 81 84 75
Virtual Reality
17 80 98 80 73 74
Analytic 15 79 99 81 70 77
57
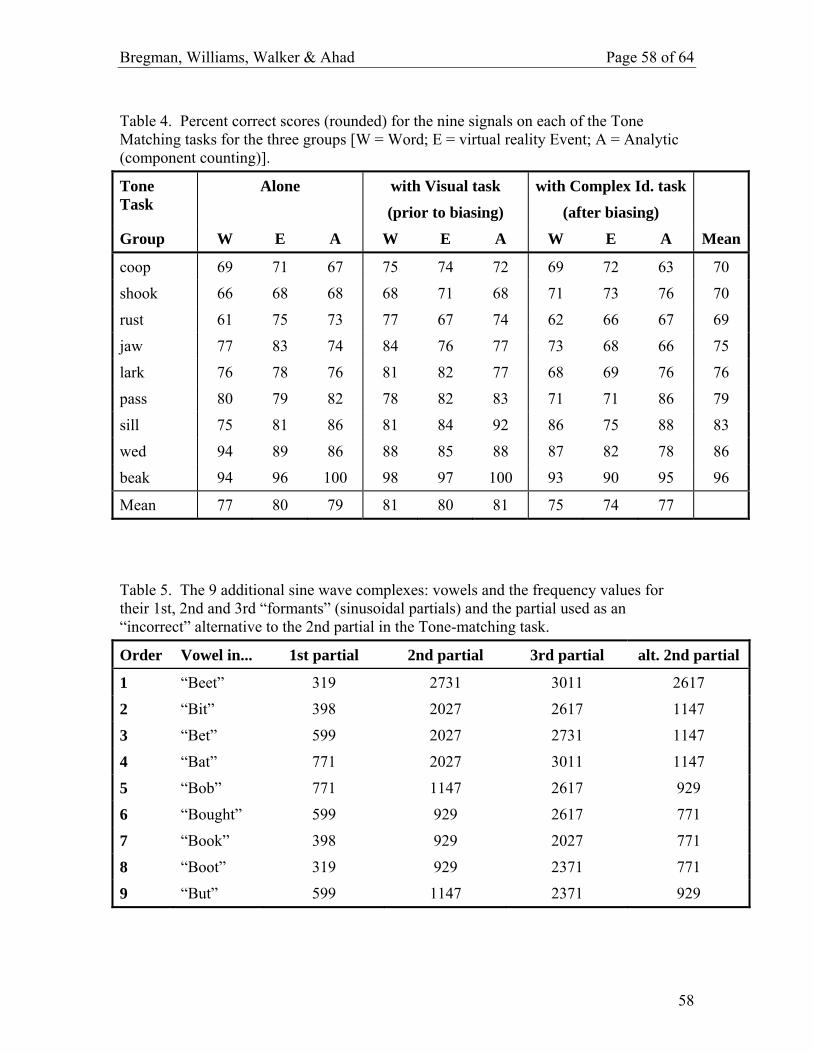
Bregman, Williams, Walker & Ahad Page 58 of 64
Table 4. Percent correct scores (rounded) for the nine signals on each of the Tone Matching tasks for the three groups [W = Word; E = virtual reality Event; A = Analytic (component counting)].
Tone Task
Alone with Visual task
(prior to biasing)
with Complex Id. task
(after biasing)
Group W E A W E A W E A Mean
coop 69 71 67 75 74 72 69 72 63 70
shook 66 68 68 68 71 68 71 73 76 70
rust 61 75 73 77 67 74 62 66 67 69
jaw 77 83 74 84 76 77 73 68 66 75
lark 76 78 76 81 82 77 68 69 76 76
pass 80 79 82 78 82 83 71 71 86 79
sill 75 81 86 81 84 92 86 75 88 83
wed 94 89 86 88 85 88 87 82 78 86
beak 94 96 100 98 97 100 93 90 95 96
Mean 77 80 79 81 80 81 75 74 77
Table 5. The 9 additional sine wave complexes: vowels and the frequency values for their 1st, 2nd and 3rd “formants” (sinusoidal partials) and the partial used as an “incorrect” alternative to the 2nd partial in the Tone-matching task.
Order Vowel in... 1st partial 2nd partial 3rd partial alt. 2nd partial
1 “Beet” 319 2731 3011 2617
2 “Bit” 398 2027 2617 1147
3 “Bet” 599 2027 2731 1147
4 “Bat” 771 2027 3011 1147
5 “Bob” 771 1147 2617 929
6 “Bought” 599 929 2617 771
7 “Book” 398 929 2027 771
8 “Boot” 319 929 2371 771
9 “But” 599 1147 2371 929
58

Bregman, Williams, Walker & Ahad Page 59 of 64
Table 6. Percent correct performance on four tasks. The block numbers are in parentheses. Note that chance performance is 1:2 (50 percent) for blocks 2 and 3, 1:9 (11.11 percent) for Vowel identification and 1:7 (14.28 percent) for Component-counting.
Group #
Group Name
N Label Verification
(2)
Matching components in
vowels (3)
Vowel identity
matching (4 or 5)
Component-counting (4 or 5)
1 Speech-1 16 96.99 64.12 34.72 61.23 2 Speech-2 8 69.21 67.13 29.63 66.67
3 Speech-3 8 71.76 61.57 25.23 65.97
4 Event-1 17 86.93 66.01 22.88 66.88 5 Event-2 8 75.23 68.75 24.07 64.35
6 Event-3 8 69.44 59.95 24.31 60.42
7 Analytic-1 16 68.75 74.88 26.62 64.47 8 Analytic-2 8 62.96 71.76 27.31 66.90
9 Analytic-3 9 51.03 61.32 25.72 61.32
59
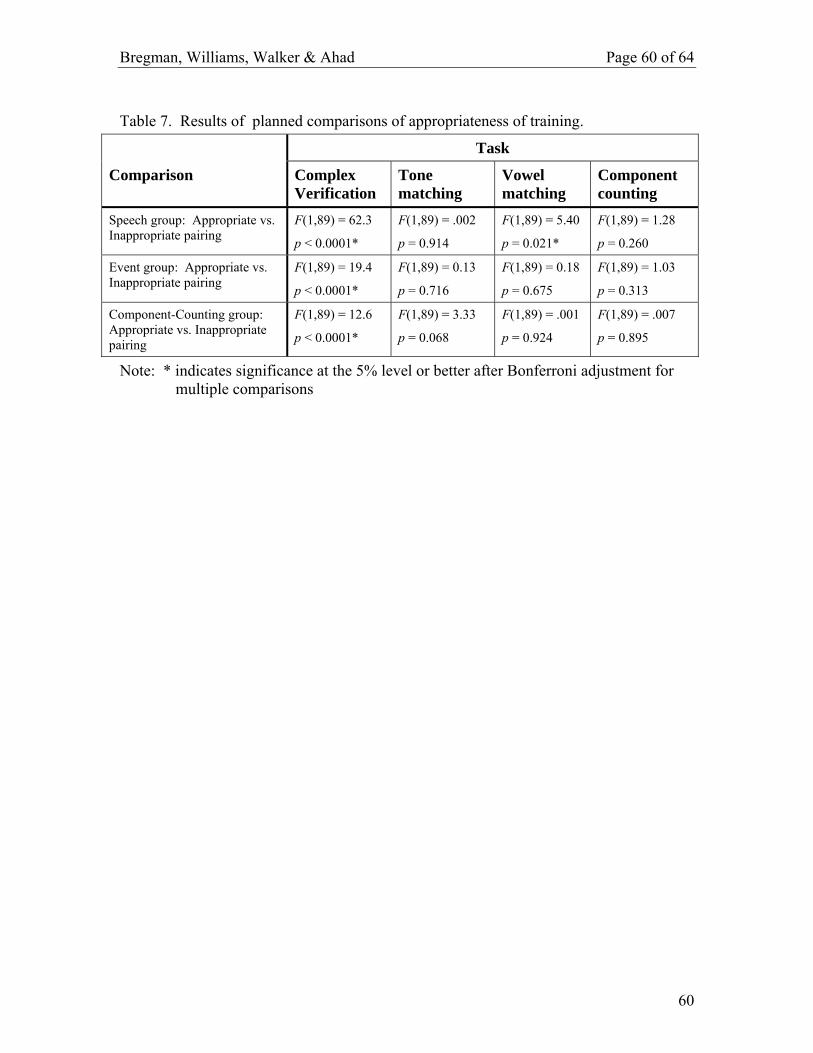
Bregman, Williams, Walker & Ahad Page 60 of 64
Table 7. Results of planned comparisons of appropriateness of training.
Task
Comparison Complex Verification
Tone matching
Vowel matching
Component counting
Speech group: Appropriate vs. Inappropriate pairing
F(1,89) = 62.3
p < 0.0001*
F(1,89) = .002
p = 0.914
F(1,89) = 5.40
p = 0.021*
F(1,89) = 1.28
p = 0.260
Event group: Appropriate vs. Inappropriate pairing
F(1,89) = 19.4
p < 0.0001*
F(1,89) = 0.13
p = 0.716
F(1,89) = 0.18
p = 0.675
F(1,89) = 1.03
p = 0.313
Component-Counting group: Appropriate vs. Inappropriate pairing
F(1,89) = 12.6
p < 0.0001*
F(1,89) = 3.33
p = 0.068
F(1,89) = .001
p = 0.924
F(1,89) = .007
p = 0.895
Note: * indicates significance at the 5% level or better after Bonferroni adjustment for multiple comparisons
60

Bregman, Williams, Walker & Ahad Page 61 of 64
Table 8. Chance probability values for differences among the three groups (Speech / Virtual-Reality Event / Component Counting) on four tasks, for the groups that had Appropriate training. Degrees of freedom are 1 and 89 for all tests.
Task
Comparison Verifi-cation
Tone-matching
Vowel-matching
Component counting
Speech vs. Event F = 9.25
p = 0.003*
F = 0.17
p = 0.682
F = 14.7
p < 0.001*
F = 1.63
p = 0.202 Speech vs. Component Counting F = 70.7
p < 0.0001*
F = 5.38
p = 0.021
F = 6.66
p = 0.011*
F = 0.52
p = 0.480 Event vs. Component Counting F = 30.2
p < 0.0001*
F = 3.77
p = 0.052
F = 1.47
p = 0.227*
F = 0.30
p = 0.594
Note: * indicates significance at the 5% level, after Bonferroni adjustment for multiple comparisons
61

Bregman, Williams, Walker & Ahad Page 62 of 64
Table 9. Identification Scores (out of 8). Experiment 3.
Identification ScoresSpeech Group Event Group
ID # Visual A0 A1 A2 A3 Mean Visual A0 A1 A2 A3 Mean Mean audio(Cov.) +6dB +2dB -2dB -6dB Audio (Cov.) +6dB +2dB -2dB -6dB Audio for 2 groups
1 7.95 8.00 7.80 7.90 7.85 7.89 7.85 7.75 7.90 7.85 8.00 7.88 7.882 7.80 7.25 7.45 7.60 7.55 7.46 7.75 6.65 7.10 7.30 7.20 7.06 7.263 7.85 8.00 7.90 7.75 7.90 7.89 7.85 7.60 7.70 7.70 7.75 7.69 7.794 7.90 7.75 7.90 7.85 7.75 7.81 7.80 7.45 7.45 7.30 7.30 7.38 7.595 7.75 7.95 7.95 7.90 7.95 7.94 7.80 6.80 7.05 7.50 7.35 7.18 7.566 7.90 7.70 7.95 7.90 7.85 7.85 7.80 6.75 7.40 7.30 7.50 7.24 7.547 7.90 7.90 8.00 7.95 7.95 7.95 7.80 7.60 7.70 7.80 7.70 7.70 7.838 7.90 7.20 7.90 7.70 7.70 7.63 7.85 5.80 6.35 6.30 6.25 6.18 6.909 7.90 7.50 7.35 7.45 7.50 7.45 7.85 7.55 7.80 7.35 7.60 7.58 7.51
Mean 7.87 7.69 7.80 7.78 7.78 7.76 7.82 7.11 7.38 7.38 7.41 7.32 7.54
62
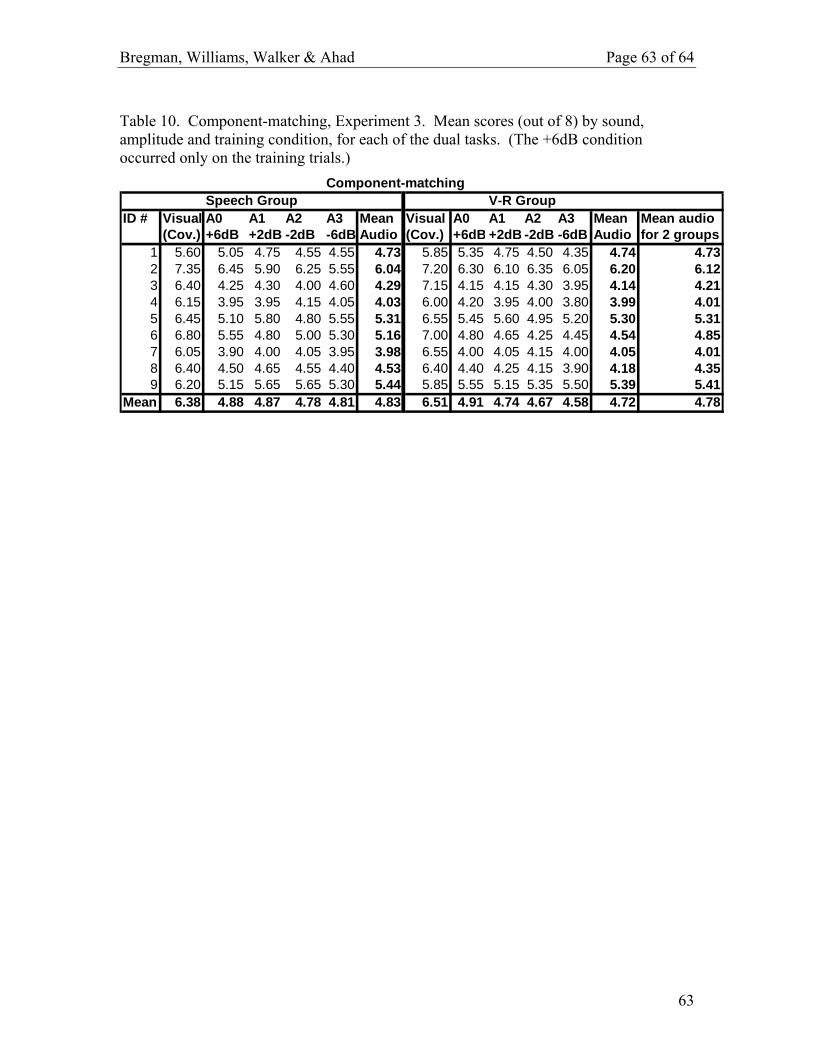
Bregman, Williams, Walker & Ahad Page 63 of 64
Table 10. Component-matching, Experiment 3. Mean scores (out of 8) by sound, amplitude and training condition, for each of the dual tasks. (The +6dB condition occurred only on the training trials.)
Component-matchingSpeech Group V-R Group
ID # Visual A0 A1 A2 A3 Mean Visual A0 A1 A2 A3 Mean Mean audio(Cov.) +6dB +2dB -2dB -6dB Audio (Cov.) +6dB +2dB -2dB -6dB Audio for 2 groups
1 5.60 5.05 4.75 4.55 4.55 4.73 5.85 5.35 4.75 4.50 4.35 4.74 4.732 7.35 6.45 5.90 6.25 5.55 6.04 7.20 6.30 6.10 6.35 6.05 6.20 6.123 6.40 4.25 4.30 4.00 4.60 4.29 7.15 4.15 4.15 4.30 3.95 4.14 4.214 6.15 3.95 3.95 4.15 4.05 4.03 6.00 4.20 3.95 4.00 3.80 3.99 4.015 6.45 5.10 5.80 4.80 5.55 5.31 6.55 5.45 5.60 4.95 5.20 5.30 5.316 6.80 5.55 4.80 5.00 5.30 5.16 7.00 4.80 4.65 4.25 4.45 4.54 4.857 6.05 3.90 4.00 4.05 3.95 3.98 6.55 4.00 4.05 4.15 4.00 4.05 4.018 6.40 4.50 4.65 4.55 4.40 4.53 6.40 4.40 4.25 4.15 3.90 4.18 4.359 6.20 5.15 5.65 5.65 5.30 5.44 5.85 5.55 5.15 5.35 5.50 5.39 5.41
Mean 6.38 4.88 4.87 4.78 4.81 4.83 6.51 4.91 4.74 4.67 4.58 4.72 4.78
63

Bregman, Williams, Walker & Ahad Page 64 of 64
Table 11. Mean component matching for Speech and Event groups.
Level of F2 component
Unadjusted Mean in
Speech group
Unadjusted Mean in
Event group
Covariance-Adjusted Mean in Speech group
Covariance-Adjusted Mean in Event group
+2dB 43.8 42.7 44.0 42.5
-2DB 43.0 42.0 43.2 41.8
-6dB 43.3 41.2 43.4 41.0
64