a. tatarko, a. mironova & s.chuvashov the influence of ethnic diversity on social capital in...
TRANSCRIPT
A. Tatarko, A. Mironova & S.Chuvashov
The Influence of Ethnic Diversity on Social Capital in
Russia
National research university ‘Higher school of economics’
Introduction
Putnam (1993) defined social capital as “those features of social organisation, such as trust, norms and networks that can improve the efficiency of society by facilitating coordinated actions”.

IntroductionSocial capital depends on many contextual factors (Yamagishi et. al, 1998 Fukuyama, 2001;
Alesina and La Ferrara, 2002), such as:
confidence in the fairness of justice system (positive factor), the possibility of getting higher education (positive factor), protection of property rights and public safety (positive factor), religious freedom (except religious sects) (positive factor), excessive state control (negative factor), the high ethnic diversity of the society (unclear factor).
According to Putnam (2009, p. 3), ethnic diversity destroys social capital, in particular, by reducing social trust and volunteer activity of citizens.
However, empirical research and a deeper understanding of this issue show that not in all countries, the relationship between ethnic diversity and social capital fit into the framework of the Putnam’s hypothesis (Gesthuizen, 2009; Hooghe et al. 2006).
The purpose of this study is to test the effects of ethnic diversity on social capital in the Russian context.
We carried out a survey during the summer of 2012.The Russian Federation was consisted of 8 Federal
districts at that time. These districts included 83 federal administrative units.
We conducted our research in 2 of 8 Districts and in 25 of 83 administrative units.
We organized our survey in two regions of Russia with the highest level of ethnic diversity.

2012 survey area (CFD)
2012 survey area (NCFD)
Bridging & Bonding social capital
Bridging social capital implies social linkages that cut across diverse groups;
Bonding social capital refers to solidarity within close groups such as family and close friends (Jang & Dworkin, 2014).
In our case, as the Bridging social capital we considered generalized trust (Svendsen & Svendsen, 2010) and social norms (Campbell & Putnam, 2011). We will consider ethnic tolerance as an indicator of social norms in our study in multicultural society
As a Bonding social capital we considered informal networks (participation in activities in various organizations) and formal networks (number of friends) (Zhang, et. al. 2011, Eklinder-Frick, Eriksson & Hallén, 2011; Murayama, et. al. 2013).
Ethnic diversity and bridging social capital (trust)
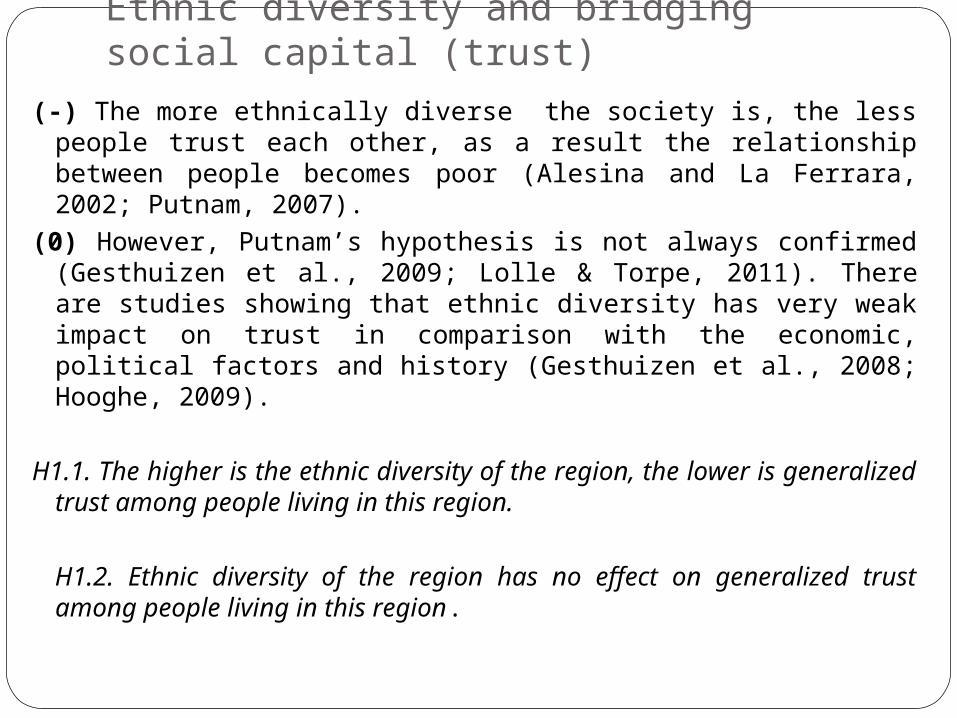
(-) The more ethnically diverse the society is, the less people trust each other, as a result the relationship between people becomes poor (Alesina and La Ferrara, 2002; Putnam, 2007).
(0) However, Putnam’s hypothesis is not always confirmed (Gesthuizen et al., 2009; Lolle & Torpe, 2011). There are studies showing that ethnic diversity has very weak impact on trust in comparison with the economic, political factors and history (Gesthuizen et al., 2008; Hooghe, 2009).
Н1.1. The higher is the ethnic diversity of the region, the lower is generalized trust among people living in this region.
Н1.2. Ethnic diversity of the region has no effect on generalized trust among people living in this region.
Ethnic diversity and bridging social capital (tolerance)
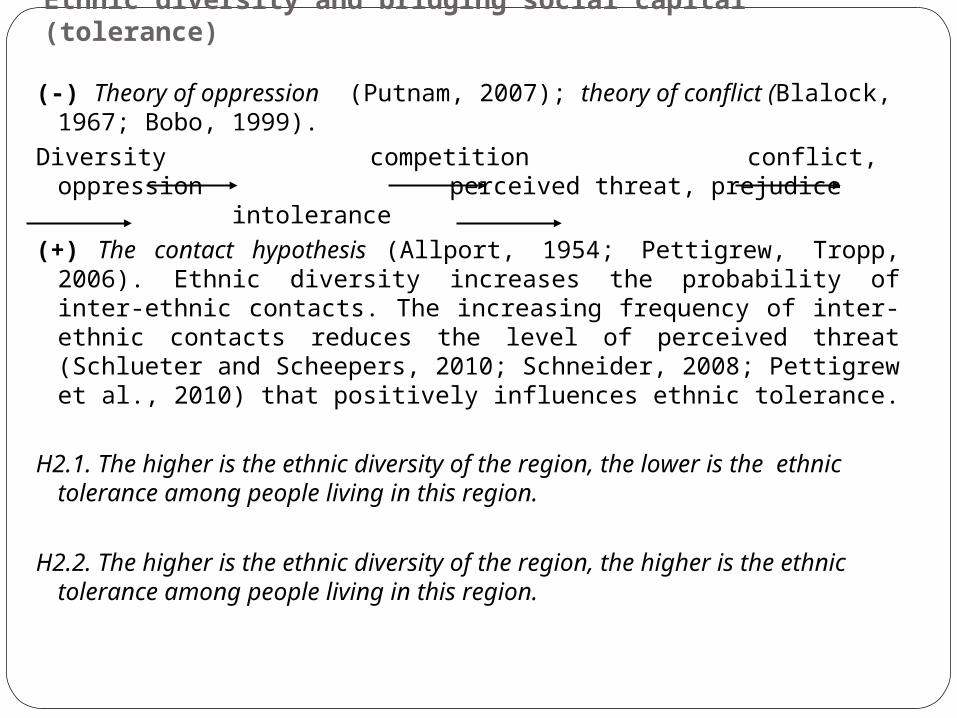
(-) Theory of oppression (Putnam, 2007); theory of conflict (Blalock, 1967; Bobo, 1999).
Diversity competition conflict, oppression perceived threat, prejudice intolerance
(+) The contact hypothesis (Allport, 1954; Pettigrew, Tropp, 2006). Ethnic diversity increases the probability of inter-ethnic contacts. The increasing frequency of inter-ethnic contacts reduces the level of perceived threat (Schlueter and Scheepers, 2010; Schneider, 2008; Pettigrew et al., 2010) that positively influences ethnic tolerance.
Н2.1. The higher is the ethnic diversity of the region, the lower is the ethnic tolerance among people living in this region.
Н2.2. The higher is the ethnic diversity of the region, the higher is the ethnic tolerance among people living in this region.
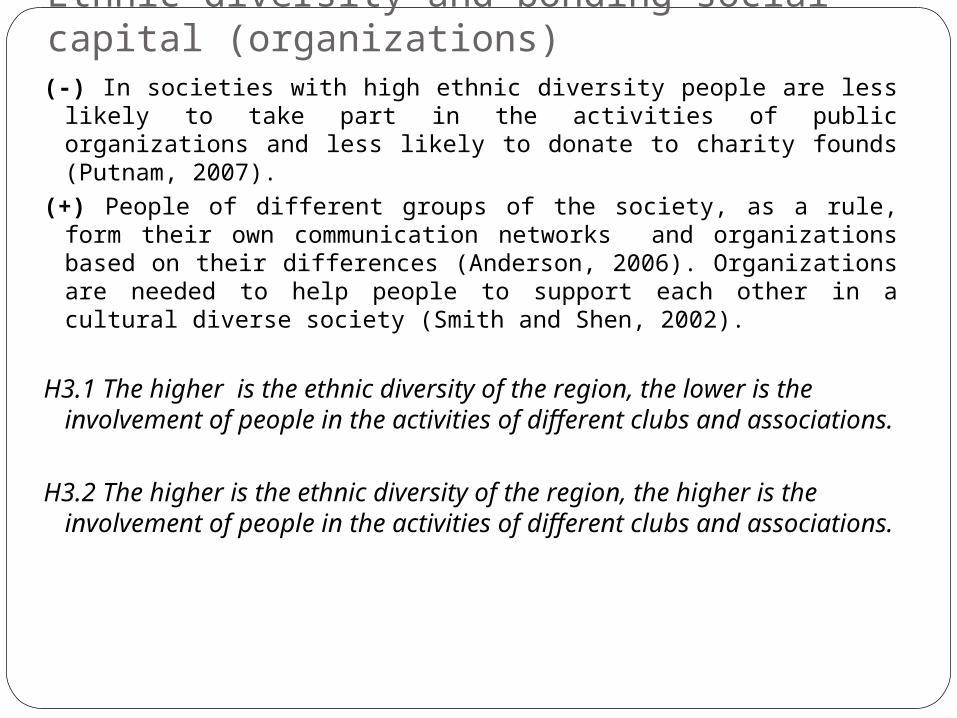
Ethnic diversity and bonding social capital (organizations)(-) In societies with high ethnic diversity people are less likely to take
part in the activities of public organizations and less likely to donate to charity founds (Putnam, 2007).
(+) People of different groups of the society, as a rule, form their own communication networks and organizations based on their differences (Anderson, 2006). Organizations are needed to help people to support each other in a cultural diverse society (Smith and Shen, 2002).
Н3.1 The higher is the ethnic diversity of the region, the lower is the involvement of people in the activities of different clubs and associations.
Н3.2 The higher is the ethnic diversity of the region, the higher is the involvement of people in the activities of different clubs and associations.

Ethnic diversity and bonding social capital (friends)
(-) People have fewer friends in societies with a large ethnic diversity, because cultural diversity reduces the number of shared norms, increases the degree of uncertainty (Putnam, 2007).
(+) However, positive relationship between the level of informal social capital (frequency of contact with friends, informal support) and ethnic diversity was found in a number of empirical studies in Europe (Gesthuizen, Maurice, 2009; Savelkoul et. al, 2011).
Н4.1 The higher is the ethnic diversity of the region, the less close friends its residents have.
Н4.2 Ethnic diversity of the region does not affect the number of close friends its residents have.

Sample
The total sample included 2,061 respondents. We interviewed representative samples of 1,024 respondents from the Central Federal District of Russia (CFD), including Moscow, and 1,034 respondents from the North Caucasian Federal District (NCFD).
The sample was representative for these two regions. The median age of the respondents was 39 years old, on average 38.8 years, the standard deviation was 12.6 years.
MeasuresBridging social capital Bridging social capital
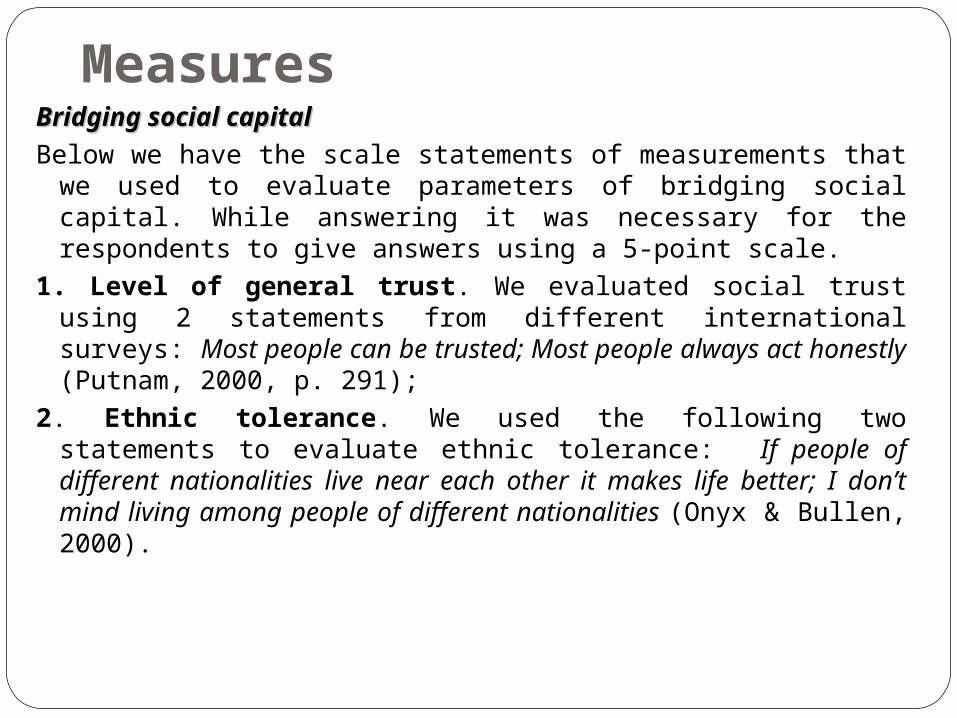
Below we have the scale statements of measurements that we used to evaluate parameters of bridging social capital. While answering it was necessary for the respondents to give answers using a 5-point scale.
1. Level of general trust. We evaluated social trust using 2 statements from different international surveys: Most people can be trusted; Most people always act honestly (Putnam, 2000, p. 291);
2. Ethnic tolerance. We used the following two statements to evaluate ethnic tolerance: If people of different nationalities live near each other it makes life better; I don’t mind living among people of different nationalities (Onyx & Bullen, 2000).

MeasuresBonding social capitalBonding social capital..
1. The size of formal networks: membership in organizations (Yang, 2007; Beilmann & Realo, 2012; Häuberer, 2011). We measured the formal network of organizational membership of the respondent by asking about the number of memberships in political parties, trade unions, professional association, church, religious organizations, sport or interest organizations, civic associations, non-government public organizations (cf. Häuberer, 2011).
2. The size of informal networks: friends (Häuberer, 2011; Gaag, 2005; Verhaeghe & Tampubolon, 2012). We measured the informal network of the respondent’s friends by asking about his or her number of friends in the workplace, in the neighborhood and other friends.

Ethnic Diversity Index
Based on the last population census (2010), we calculated the Ethnic Diversity Index - EDI (Riazantsev et. al., 2013).
Index value may range from 0 (no diversity, ethnically homogenous region) to 100 (complete diversity, ethnically diverse region). The value ‘0’ means that only one ethnic group is presented in the region, whereas the index point ‘100’ can be interpreted as if two individuals, chosen at random, have zero probability to be of the same ethnicity.

Regional level:Between
Methodology: the study design
Respondent level:Within
Regional level:Between
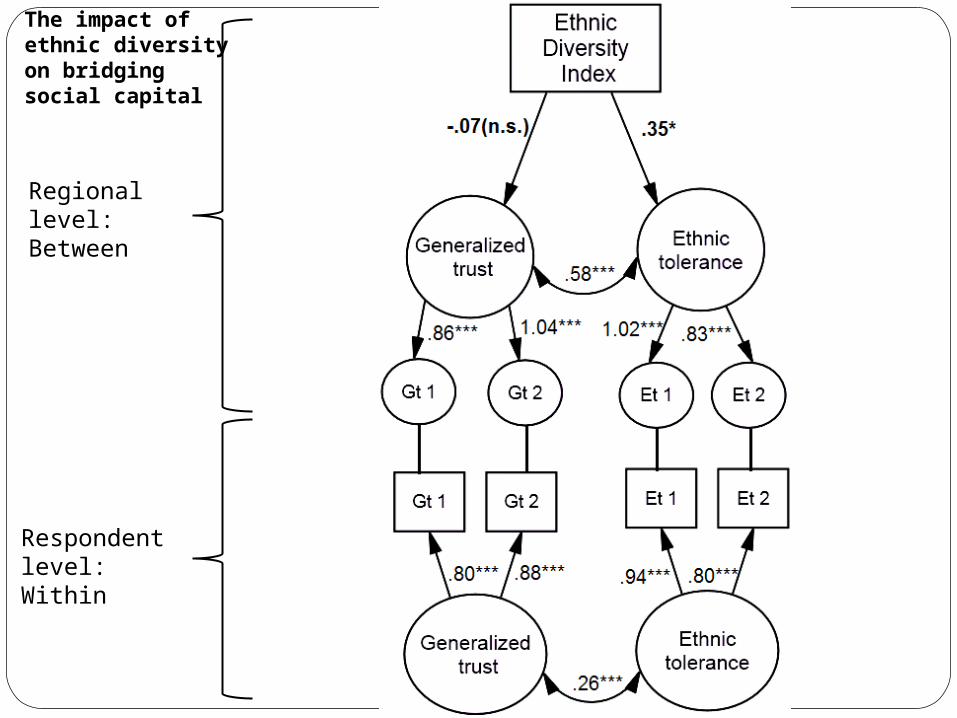
The impact of ethnic diversity on bridging social capital
Respondent level:Within

Regional level:Between
The impact of ethnic diversity on bonding social capital
Respondent level:Within

Conclusion
1) Ethnic diversity of the Russia’s regions is either a neutral or positive factor relating to social capital of these regions. This result is true both for bridging social capital and bonding social capital.
2) Bridging social capital Bridging social capital of the considered regions of Russia does not suffer from their ethnic diversity, although the negative effects of ethnic diversity on social capital are predicted in the previous studies. We found that ethnic diversity does not have a statistically significant effect on generalized trust and have a positive effect on ethnic tolerance.
Conclusion
3) The influence of ethnic diversity on various components of bonding social capital bonding social capital is different. We found a negative, but weak and statistically insignificant effect of ethnic diversity on the involvement of citizen's formal network. However, we found a strong positive effect of ethnic diversity on the number of friends (informal networks).
4) The above mentioned Putnam’s hypothesis, explain well the relationship between ethnic diversity and social capital in conditions where historical and cultural ties between people are weak. Ethnic diversity will not reduce social capital in the situation when ethnic groups living on the same territory, have the same opportunities, common history, cultural interexchange and the boundaries between these cultures are not an obstacle for interethnic relationships.

Thanks for your attention!www.scr.hse.ru


Ethnic toleranceAs we consider social capital in multicultural society, one of the
most important norms of interaction between people will be the norm of ethnic tolerance (Harell, 2010; Son, 2007), which is also considered in a number of studies as an indicator of social capital (Onyx & Bullen, 2000; Edwards & Onyx, 2007; Onyx et. al., 2007).
Therefore, we will consider ethnic tolerance as an indicator of social norms in our study in multicultural society.

Ethnic Diversity IndexBased on the last population census (2010), we calculated the Ethnic Diversity Index -
EDI (Riazantsev et. al., 2013). This index was calculated by several stages using special formula
where
where j is the region of Russia, i is the ethnic group in that region, m is the number of regions (25 regions), n is the number of ethnic groups registered in the region, Popi,j is the population size of the ith ethnic group in the jth region, and is is the population size of the ith ethnic group in Russia.
Index value may range from 0 (no diversity, ethnically homogenous region) to 100 (complete diversity, ethnically diverse region). The value ‘0’ means that only one ethnic group is presented in the region, whereas the index point ‘100’ can be interpreted as if two individuals, chosen at random, have zero probability to be of the same ethnicity.
№ Federal Administrative Unit
Dist-rict EDI
№ Federal Administrative Unit
Dist-rict EDI
1 Republic of Dagestan NCFD 83,7 14 Voronezh region CFD 16,72 Republic of Karachaevo-
CherkessiyaNCFD
71,415
Belgorod regionCFD
15,73 Republic of Kabardino-
BalkariyaNCFD
60,716
Kursk RegionCFD
15,04 Repubic of North
Osetiya-AlaniyaNCFD
53,817
Yaroslavl RegionCFD
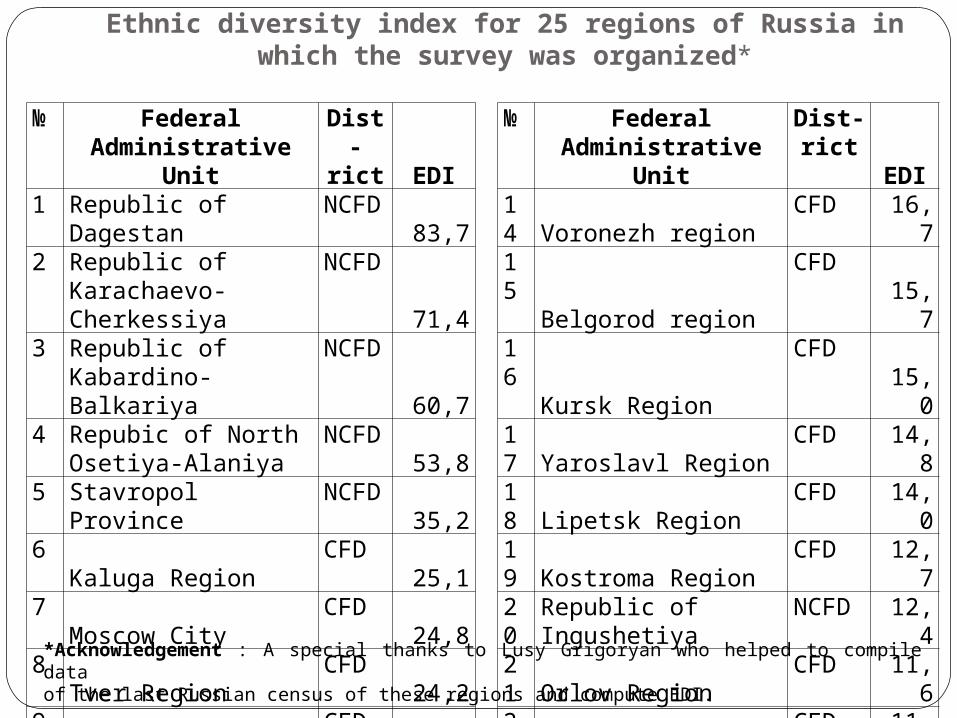
14,85 Stavropol Province NCFD 35,2 18 Lipetsk Region CFD 14,06 Kaluga Region CFD 25,1 19 Kostroma Region CFD 12,77 Moscow City CFD 24,8 20 Republic of Ingushetiya NCFD 12,48 Tver Region CFD 24,2 21 Orlov Region CFD 11,69 Moscow region CFD 22,8 22 Tula Region CFD 11,310 Ryazan Region CFD 20,2 23 Bryansk Region CFD 10,311 Vladimir Region CFD 19,5 24 Tambov Region CFD 9,712 Smolensk Region CFD 17,4 25 The Chechen Republic NCFD 9,513 Ivanovo Region CFD 17,3
Ethnic diversity index for 25 regions of Russia in which the survey was organized*
*Acknowledgement : A special thanks to Lusy Grigoryan who helped to compile data of the last Russian census of these regions and compute EDI.

The results of a multi-level SEM demonstrating the impact of ethnic diversity on bridging social capital
Model 1 (two-level CFA including EDI index)
AIC 19138.63 BIC 19273.74Sample size adjusted BIC 19197.49SRMR within 0.001SRMR between 0.115CFA 1.0TLI 1.0RMSEA 0.001
Factor loadings of generalized trust (standardized)Factor loadings of generalized trust (standardized) Within Level Between LevelGt1 “Most people can be trusted” 0.798*** 0.857***Gt 2 “Most people always act honestly” 0.876*** 1.038***Factor loadingsFactor loadings of of ethnicethnic tolerance tolerance (standardized)(standardized)Et1 “If people of different nationalities live near each other it makes life better”
0.935*** 1.015***
Et2 “I don’t mind living among people of different nationalities” 0.795*** 0.827***Correlation of trust & Correlation of trust & ethnicethnic tolerance tolerance 0.260*** 0.577***
Regression (standardized)Regression (standardized)EDI is the Predictor of generalized trust (betw.) -0.07 (n.s.)EDI is the Predictor of ethnic tolerance (betw.) 0.345*
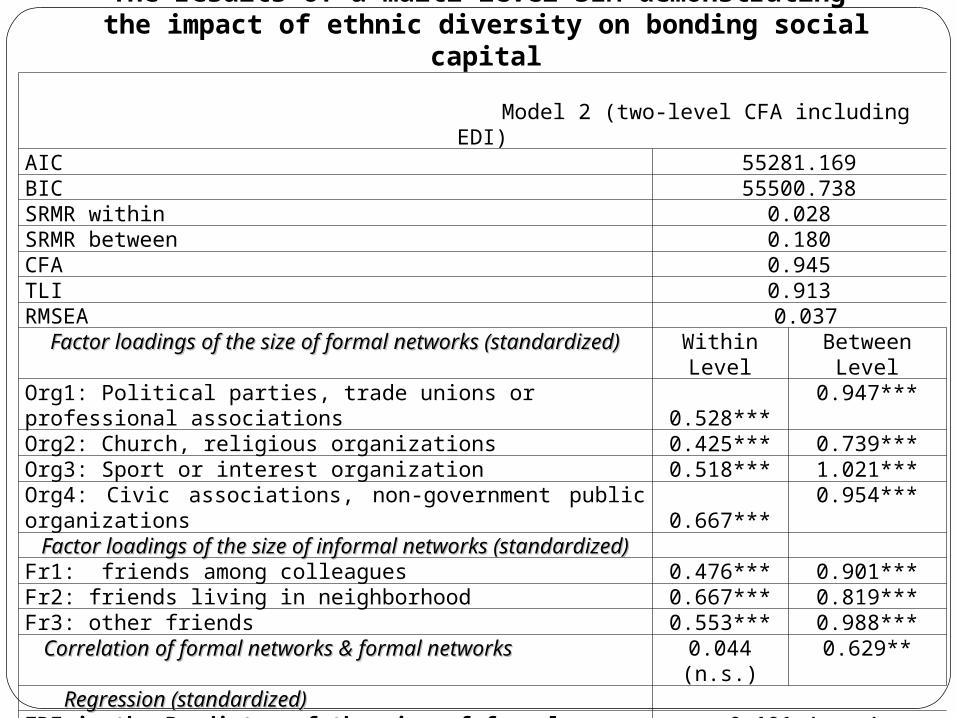
The results of a multi-level SEM demonstrating the impact of ethnic diversity on bonding social capital
Model 2 (two-level CFA including EDI)
AIC 55281.169BIC 55500.738SRMR within 0.028SRMR between 0.180CFA 0.945TLI 0.913RMSEA 0.037
Factor loadings of the size of formal networks (standardized)Factor loadings of the size of formal networks (standardized) Within Level Between Level
Org1: Political parties, trade unions or professional associations 0.528*** 0.947***
Org2: Church, religious organizations 0.425*** 0.739***Org3: Sport or interest organization 0.518*** 1.021***Org4: Civic associations, non-government public organizations 0.667*** 0.954***
Factor loadings of the size of informal networks (standardized)Factor loadings of the size of informal networks (standardized)Fr1: friends among colleagues 0.476*** 0.901***Fr2: friends living in neighborhood 0.667*** 0.819***Fr3: other friends 0.553*** 0.988***
Correlation of formal networks & formal networks Correlation of formal networks & formal networks 0.044 (n.s.) 0.629**
Regression (standardized)Regression (standardized)EDI is the Predictor of the size of formal networks (organizations) (betw.)
-0.101 (n.s.)
EDI is the Predictor of the size of formal networks (friends) (betw.) 0.777 ***

Discussion
The impact of cultural diversity on social capital depends on historical, cultural and social factors.
1) History and period of cohabitation. The long history of living together forms experience of coexistence and tolerance towards ethnic diversity naturally. It is one of the mechanisms of mutual adaptation and mutual acceptance. That is why a negative impact of ethnic diversity on generalized trust was not found, but a positive impact of diversity on ethnic tolerance was found in Russia.
2) Cultural characteristics of people living in multicultural regions. Russia's ethnic diversity is represented mainly by representatives of collectivistic and more or less traditional ethnic groups (representatives of people from the North Caucasus, Middle Asia, Tatars, and Bashkirs). Representatives of such ethnic groups tend to have a lot of friends.
Discussion
3) The sources of ethnic diversity. Almost all researches, devoted to the study of impact of ethnic diversity on social capital, were conducted in the countries in which cultural diversity is the result of external migration (the USA, European countries, Australia). Russia’s ethnic diversity has other sources - it has developed historically throughout centuries and all cultures, inhabiting the territory of Russia, were preserved and developed. More over, even external migrants come from countries of the former USSR the Russian culture is not completely alien for them. In addition to that, they are not perceived as absolutely “strangers“ by the host population. Therefore the point of view of Hooghe (2006) is most likely correct and cultural diversity in itself can not reduce social capital but the influx of a large number of migrants having different mentality can.

Why it is important to know how is ethnic diversity influence social capital in multicultural society?
First, it is important to understand the prospects for the development of societies with high levels of ethnic diversity, because social capital is an important non-economic factor of progress.
Second, the study of the interrelation of social capital and ethnic diversity in different countries and contexts, will show how the nature of this interrelation can be universal. It will allow the scientists to come to a conclusion about how the results received in some countries, may have prognostic value to other countries.
Third, the results of this study is very important for political discourse in the society, because they allow members of multicultural societies to answer questions about cultural diversity influences on society's social climate.